
2024-09-27
Informational purposes only. The content in this report, including allocations, analysis, and commentary, is provided solely for informational and educational purposes. It does not constitute financial advice, investment advice, trading advice, or any other type of advice. Past performance does not guarantee future results. Always conduct your own research and consult a qualified financial professional before making investment decisions.
Weekly Allocation
| Ticker | Category | Weight | Role |
|---|---|---|---|
| FBTC | 50% | Overlay | |
| GLD | Precious Metals | 10% | Top-2 (10%) |
| XLU | Utilities & Infrastructure | 10% | Top-2 (10%) |
| COPX | Industrial Metals | 5% | Tier-2 (5%) |
| XAR | Defense & Aerospace | 5% | Tier-2 (5%) |
| IGV | Technology | 5% | Tier-2 (5%) |
| NLR | Nuclear Energy | 5% | Tier-2 (5%) |
| IEMG | Emerging Markets | 5% | Tier-2 (5%) |
| AIQ | AI | 5% | Tier-2 (5%) |
Trade Instructions — Monday Open
Sell the tranche from 2024-08-30 (completing its 4-week hold). Buy the new tranche. Instructions show net portfolio changes — same-asset positions cancel, weight changes show the delta.
| Action | Ticker | Instruction |
|---|---|---|
| SELL | PAVE | Sell entire PAVE position (2.50% of portfolio) |
| SELL | CIBR | Sell entire CIBR position (1.25% of portfolio) |
| SELL | SMH | Sell entire SMH position (1.25% of portfolio) |
| SELL | URA | Sell entire URA position (1.25% of portfolio) |
| SELL | INDA | Sell 50% of INDA position (reduce 2.50% → 1.25%) |
| SELL | XLE | Sell 50% of XLE position (reduce 2.50% → 1.25%) |
| BUY | XLU | Buy XLU — 28.57% of freed cash (adds 2.50% to portfolio) |
| BUY | IGV | Buy IGV — 14.29% of freed cash (adds 1.25% to portfolio) |
| BUY | AIQ | Buy AIQ — 14.29% of freed cash (adds 1.25% to portfolio) |
| BUY | IEMG | Buy IEMG — 14.29% of freed cash (adds 1.25% to portfolio) |
| BUY | NLR | Buy NLR — 14.29% of freed cash (adds 1.25% to portfolio) |
| BUY | COPX | Buy COPX — 14.29% of freed cash (adds 1.25% to portfolio) |
Current Portfolio After Trade
Combined holdings across all 4 active tranches. Each tranche is 25% of the portfolio.
| Ticker | % of Portfolio | Weight Bar |
|---|---|---|
| FBTC | 50.00% | |
| GLD | 10.00% | |
| XLU | 10.00% | |
| IGV | 5.00% | |
| NLR | 5.00% | |
| AIQ | 3.75% | |
| XAR | 2.50% | |
| IEMG | 2.50% | |
| ITA | 2.50% | |
| COPX | 2.50% | |
| INDA | 1.25% | |
| XLE | 1.25% | |
| MOO | 1.25% | |
| WEAT | 1.25% | |
| BOTZ | 1.25% |
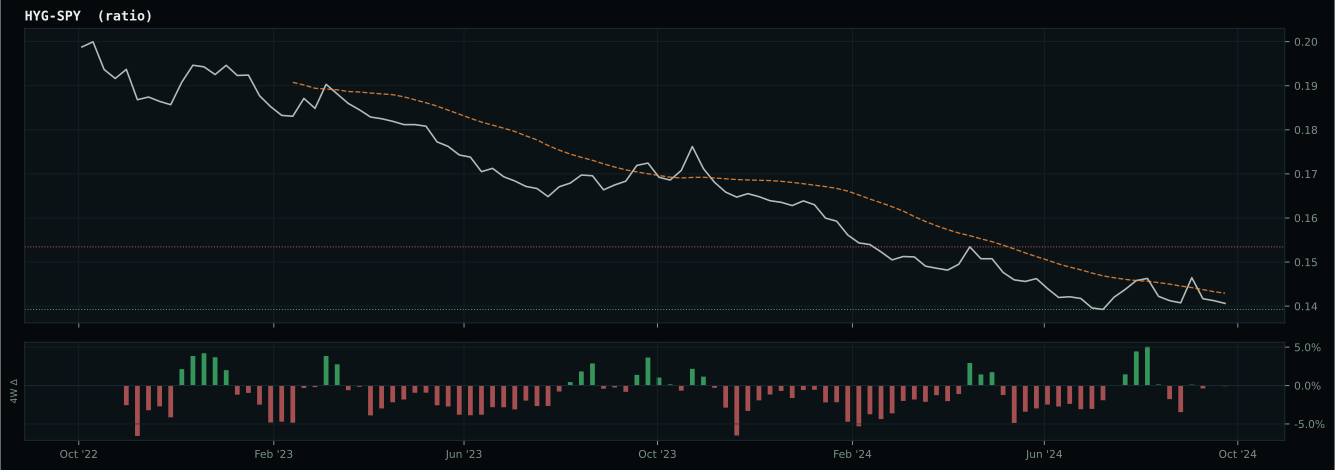
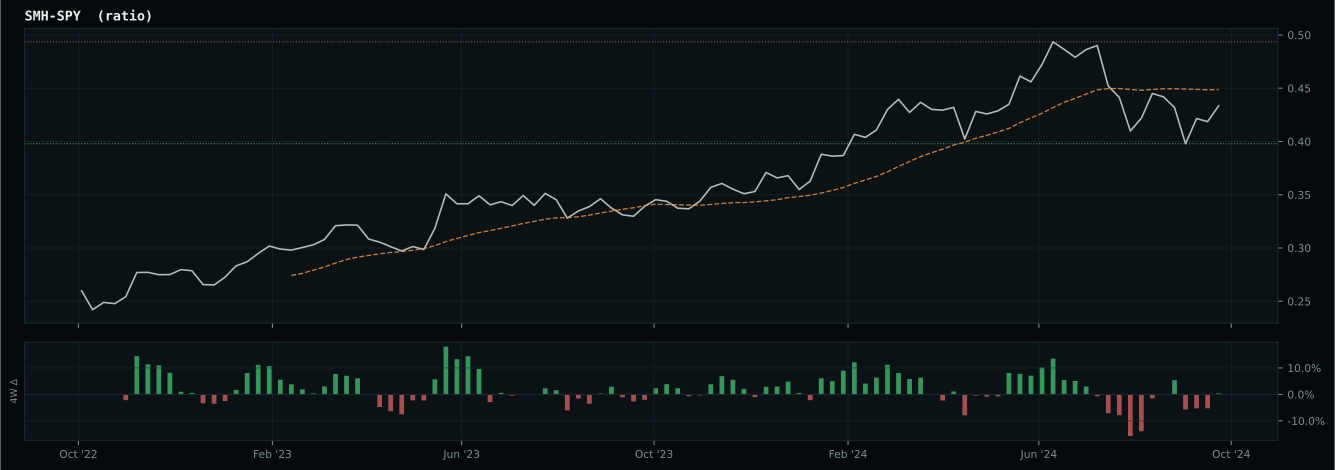
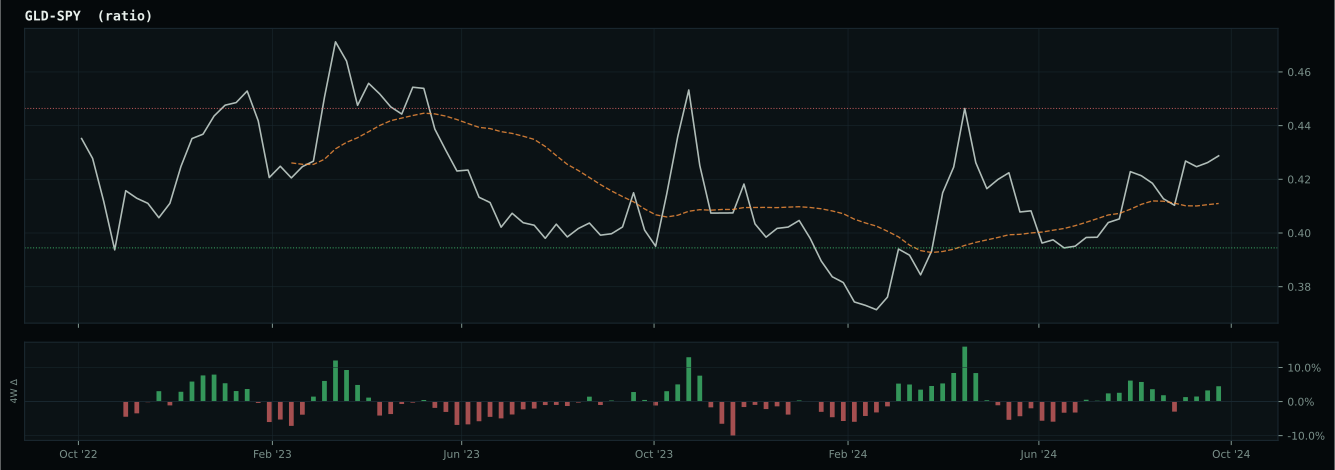
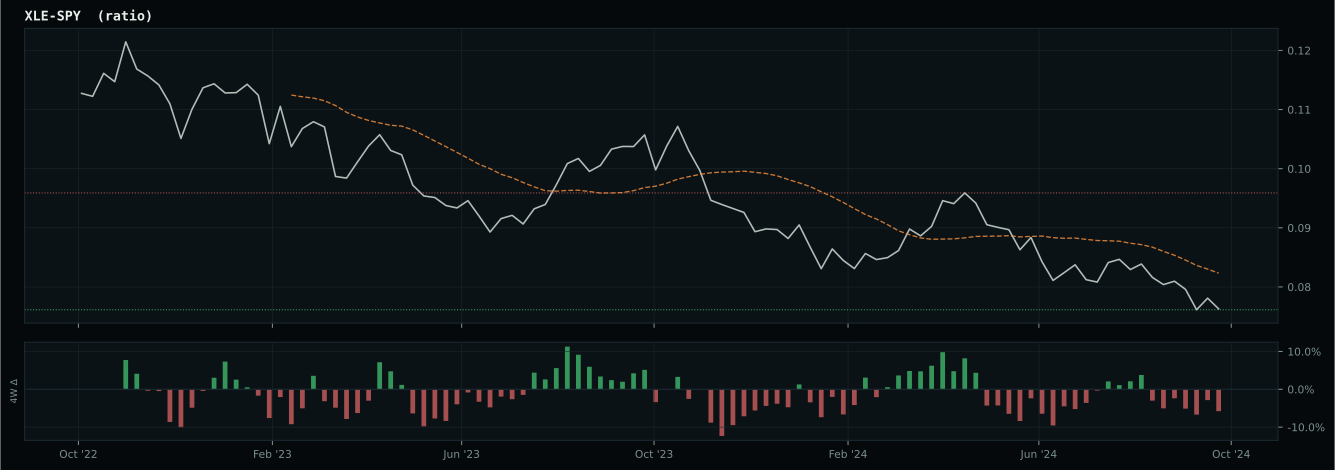
Macro Regime — Disinflation
growth data is not confirming the weak market-implied risk appetite signal
Macro Evidence Charts
Market-implied signals behind the macro regime scores. Each ratio compares two assets; the direction and slope of the ratio is what the macro engine reads.
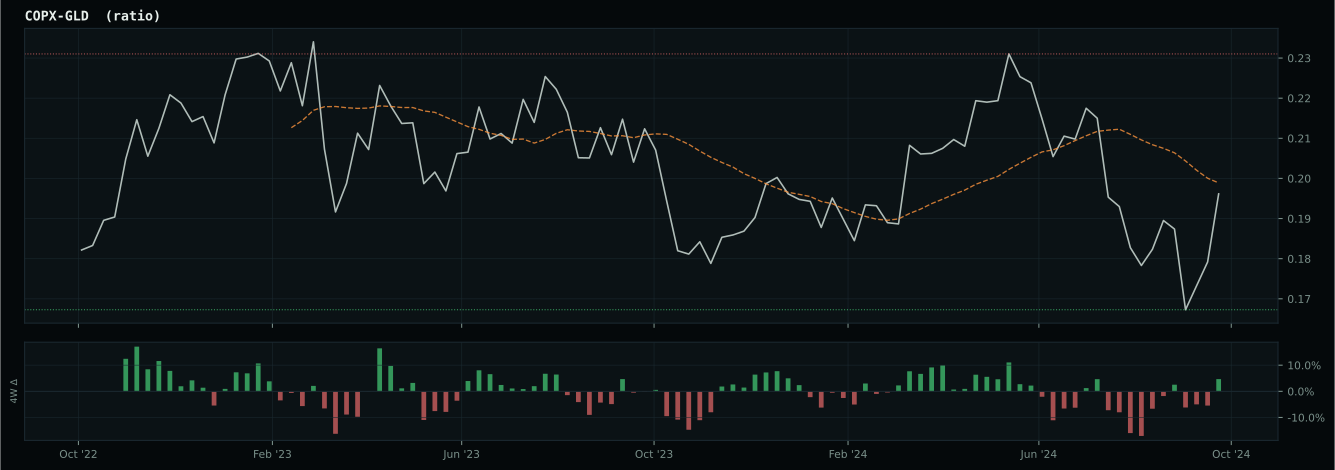
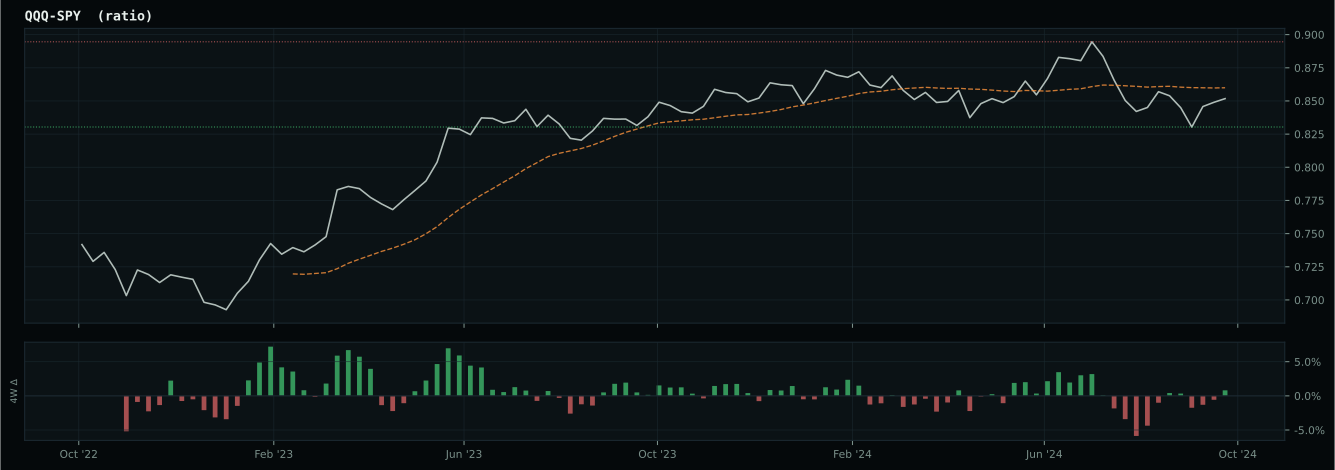
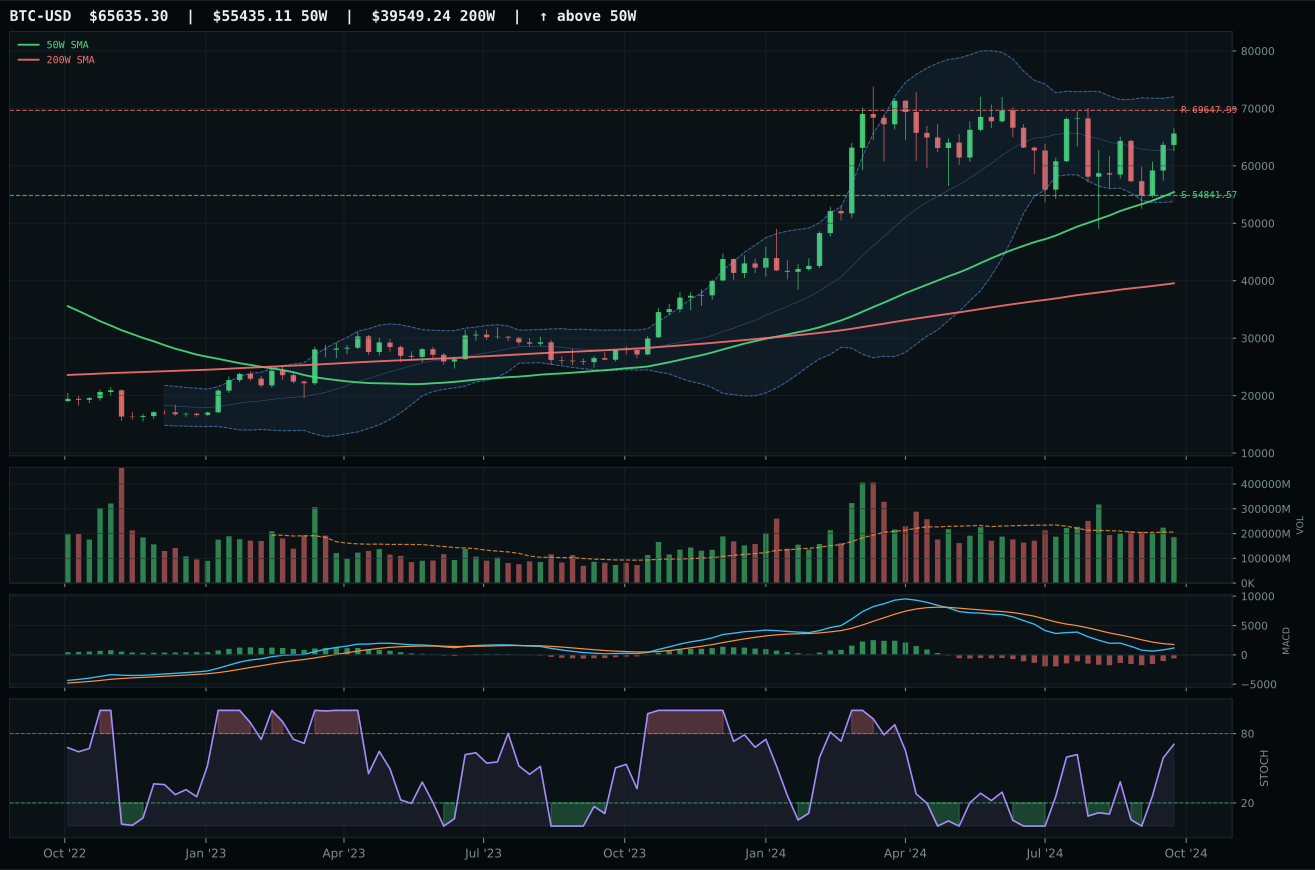
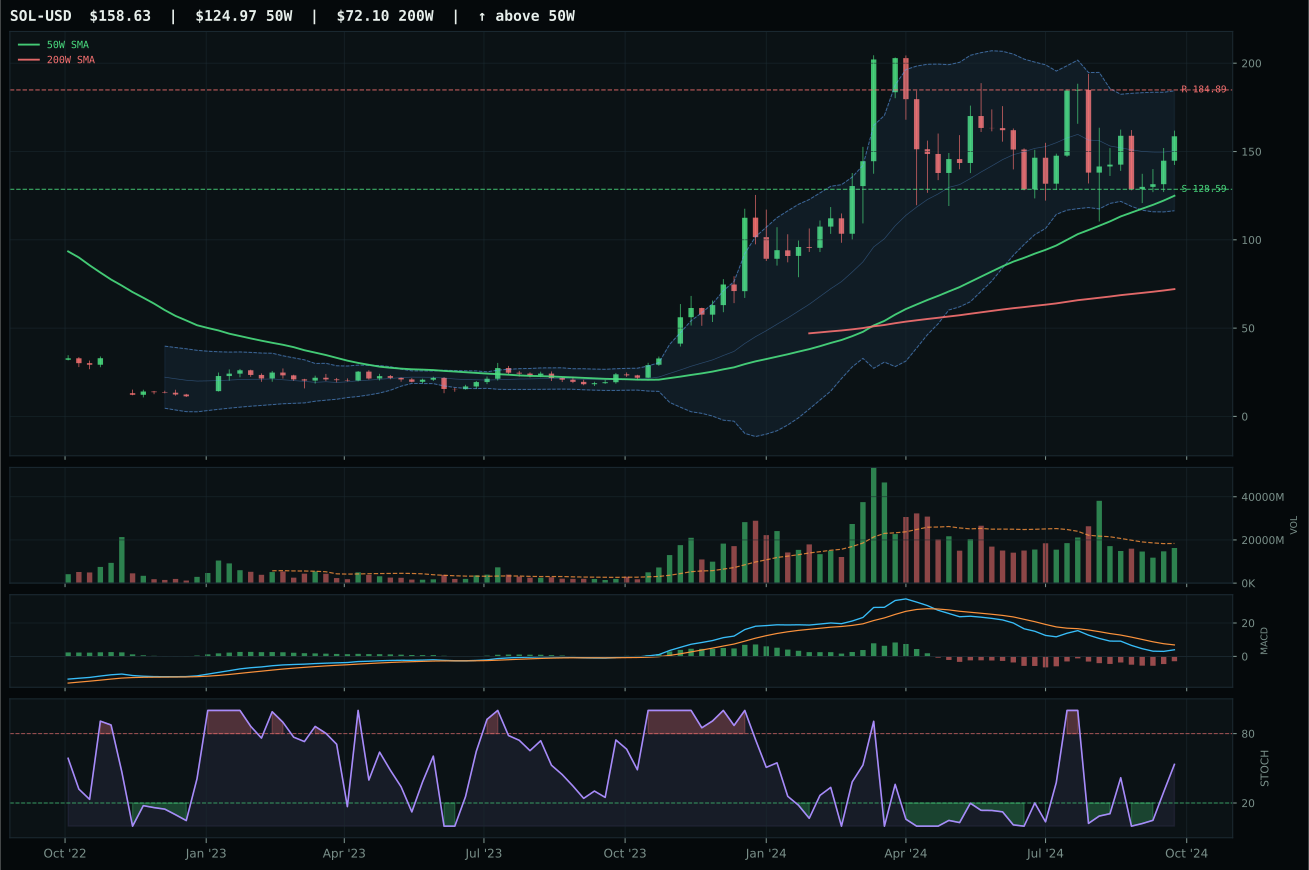
Crypto Regime — TrendBTC
ValueBTC not armed: BTC has not made the first post-breakdown touch of the 200W buy zone after losing the 50W
TrendBTC confirmed: 2 consecutive closes above rising/flat 50W SMA
one or more available conditions failed
Category Rankings
| Rank | Category | Winner | Score | Alloc | 4W Ret | Peers (4W) |
|---|---|---|---|---|---|---|
| 1 | Precious Metals | GLD | 85.9 | 20% | +3.71% | SLV +7.7% · GDX +3.1% |
| 2 | Utilities & Infrastructure | XLU | 82.1 | 20% | +0.29% | IGF -0.2% · PAVE +1.6% |
| 3 | Industrial Metals | COPX | 65.2 | 10% | -5.63% | PICK -6.2% · REMX +2.7% |
| 4 | Defense & Aerospace | XAR | 64.9 | 10% | +2.05% | ITA +0.8% · ROKT +1.8% |
| 5 | Technology | IGV | 53.7 | 10% | +4.41% | CIBR +4.0% · XLK +3.5% |
| 6 | Nuclear Energy | NLR | 52.8 | 10% | +9.22% | URA +7.9% · URNM +4.8% |
| 7 | Emerging Markets | IEMG | 50.1 | 10% | -2.69% | INDA -6.1% · ILF -3.7% |
| 8 | AI | AIQ | 31.4 | 10% | +1.64% | BOTZ +0.3% · SMH +3.5% |
| 9 | Agriculture & Livestock | MOO | 29.8 | 0% | -4.50% | VEGI -1.1% · WEAT -1.7% |
| 10 | Traditional Energy | XLE | — | 0% | +0.95% | FCG -0.2% · XOP +0.1% |
Precious Metals — GLD
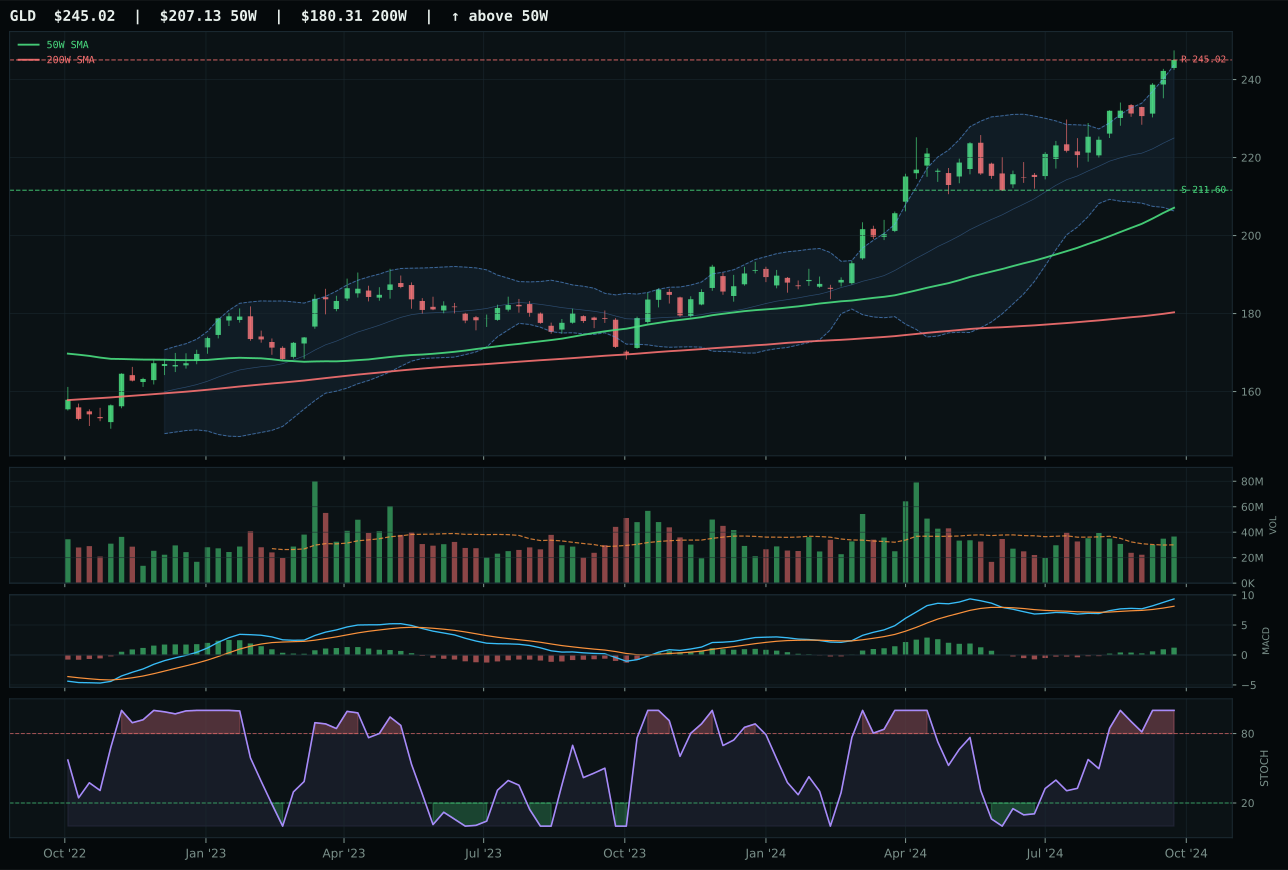
GLD has a vertical extension profile with 9.0% 13-week relative strength versus SPY.
A failed hold above support would weaken the setup.
Actionable but governed by invalidation levels.
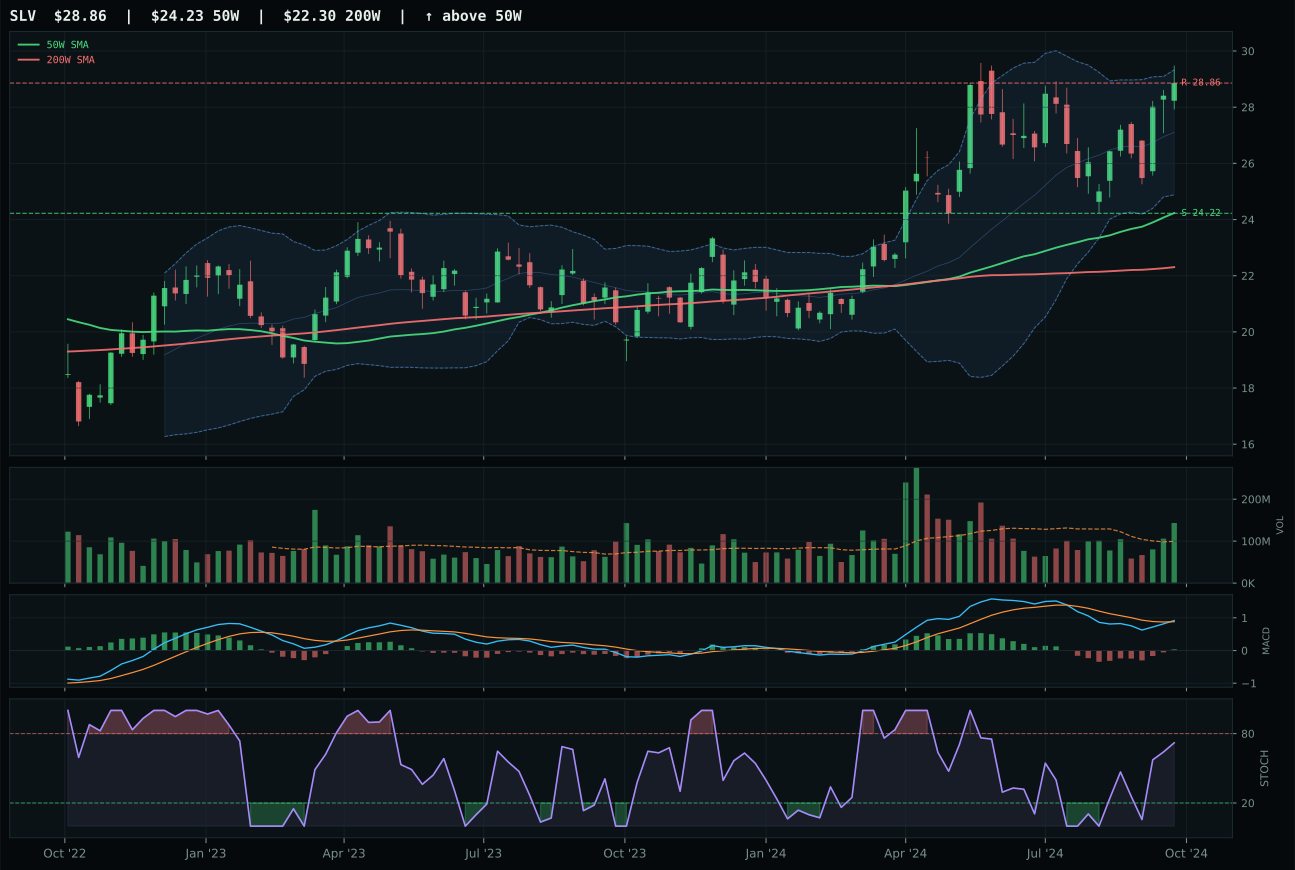
SLV has a vertical extension profile with 3.6% 13-week relative strength versus SPY.
A failed hold above support would weaken the setup.
Actionable but governed by invalidation levels.
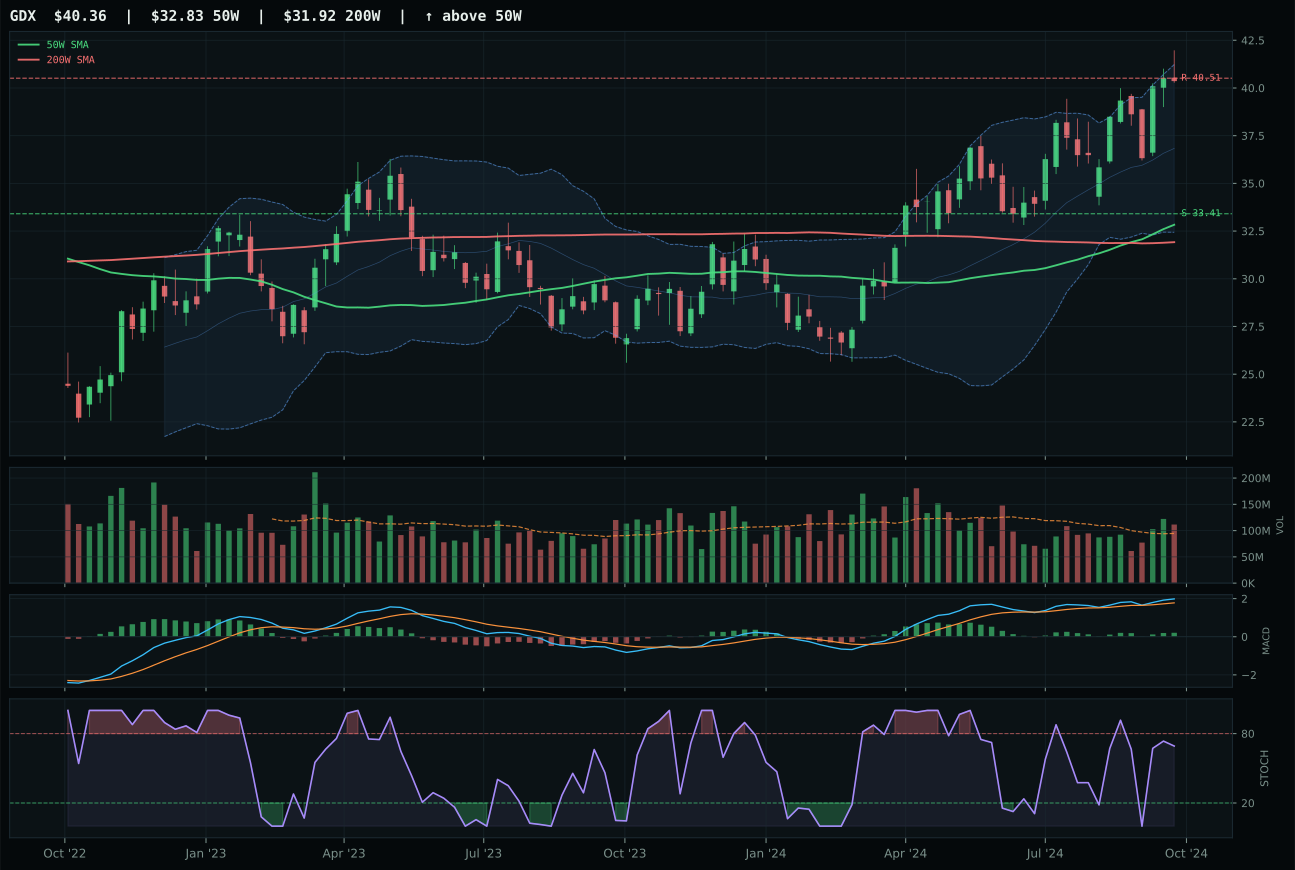
GDX has a vertical extension profile with 13.9% 13-week relative strength versus SPY.
A failed hold above support would weaken the setup.
Actionable but governed by invalidation levels.
GLD captured top-2 status with perfect trend reading and flawless momentum confirmation that positioned it as the strongest technical setup in its category. Price is 18.3% above the 50-week moving average with an upslope of 0.6%, supported by MACD that is bullish and improving and stochastic RSI at overbought momentum (1.00). The momentum confirmation score of 100.0/100 is earned through a 13-week return of 14.0%, SPY-relative strength of 9.0%, and above-average volume at 1.22x its 20-week average—meaning institutional buyers are actively bidding for gold despite the vertical extension. GLD's advantage over SLV (the runner-up with a 2.0-point gap) lay in cleaner structure (78.3 vs 72.4), better risk-reward (46.1 vs 44.5), and category-relative strength of 0.0% versus SLV's -5.3%, indicating that among gold and silver, buyers are choosing the pure monetary hedge (gold) over the industrial-hybrid story (silver). The timing score of 37.0 for GLD reflects legitimate extension risk at 18.3% above the 50W, but this timing penalty is completely overwhelmed by the trend score of 100.0 and the macro tailwind of 78.0 macro fit.
Precious Metals earned a top-2 overweight allocation of 10%, driven by the highest category macro fit of 85.0/100 and a final category score of 85.9 that placed it among the portfolio's two strongest opportunities. The monetary hedge bid is active at +14, the single strongest descriptor tilt in the entire portfolio this week, supported by defensive rotation (+7), disinflation pressure (+6), and the macro state of Disinflation itself (+8). This convergence of four major positive macro signals creates a regime where gold and precious metals are being bid by both technical traders and macro hedgers. GLD's technical evidence of 85.9/100 and macro fit of 78.0/100 combine in the category reasoner to produce the second-highest category score after only Utilities & Infrastructure. The allocation of 10% reflects the portfolio's assessment that precious metals offer the best macro-adjusted return per unit of drawdown risk in the current environment. The key tension is that GLD itself is extended 18.3% above its 50W, so near-term entry risk is real—but the allocation is scaled appropriately to acknowledge that extension while committing meaningful capital to the macro thesis. If the monetary hedge bid descriptor flips dormant or if credit stress eases materially, the allocation would be vulnerable to being halved.
Utilities & Infrastructure — XLU
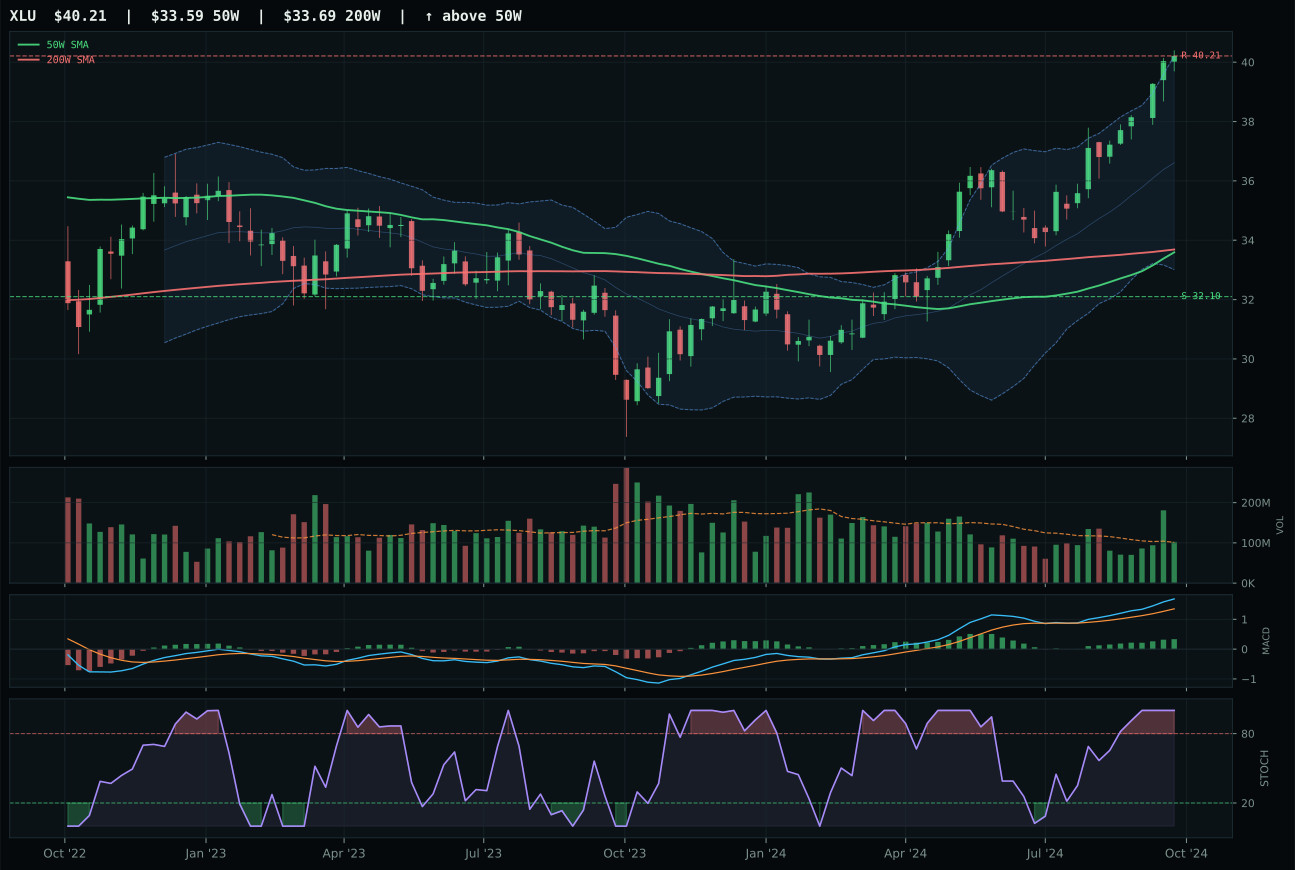
XLU has a vertical extension profile with 13.0% 13-week relative strength versus SPY.
A failed hold above support would weaken the setup.
Actionable but governed by invalidation levels.
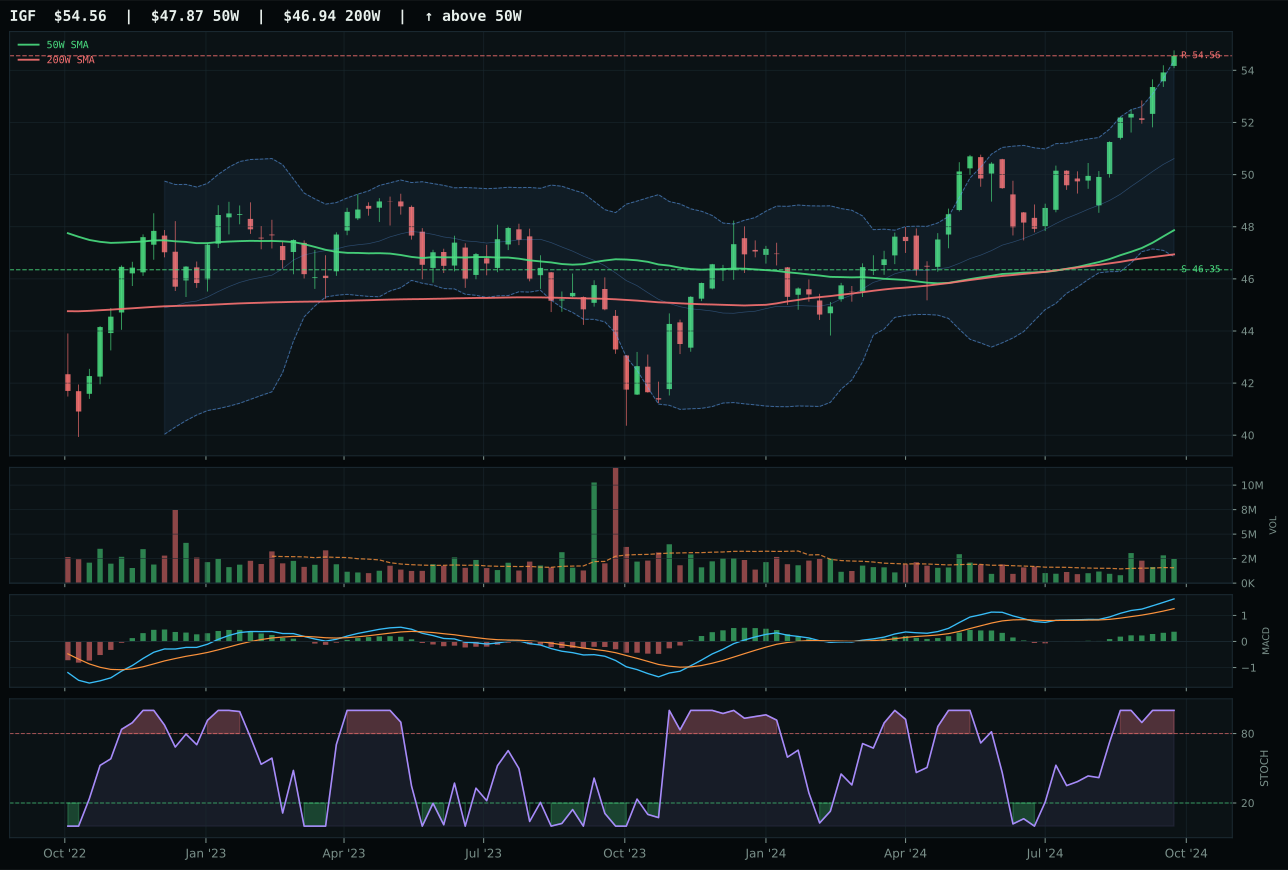
IGF has a neutral structure profile with 8.8% 13-week relative strength versus SPY.
A failed hold above support would weaken the setup.
Actionable but governed by invalidation levels.
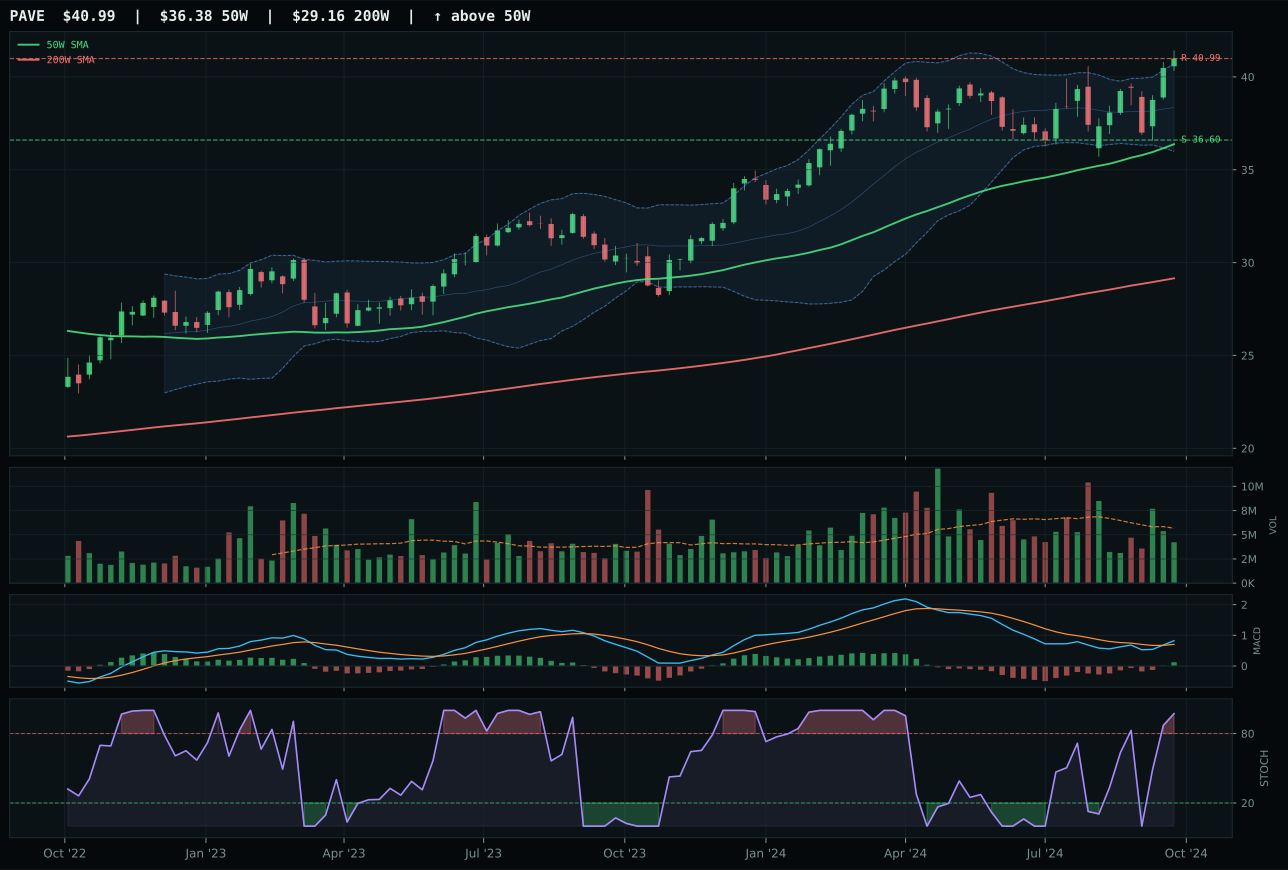
PAVE has a neutral structure profile with 5.7% 13-week relative strength versus SPY.
A failed hold above support would weaken the setup.
Actionable but governed by invalidation levels.
XLU claimed the second top-2 allocation slot despite a significant technical disadvantage to its competitor IGF, powered entirely by superior category-relative strength and the portfolio's macro assessment. XLU's trend reads a perfect 100.0/100 with price 19.7% above the 50W and an upslope of 0.6%, supported by momentum confirmation of 100.0/100 from 13-week return of 18.0% and SPY-relative strength of 13.0%—the second-strongest SPY-relative performance in the entire portfolio after only Precious Metals. However, IGF's technical evidence is genuinely superior at 98.8/100 versus XLU's 76.3, with IGF showing better timing (59 vs. 52), accumulation-level volume (1.53x vs. neutral), and risk-reward (50 vs. 36). IGF also scores higher on structure (neutral vs. vertical extension) and cleanliness. The -12.8-point gap in reasoned ETF scores seems insurmountable, yet XLU wins the category representative slot because its category-relative strength of 4.2% is stronger than IGF's 0.0%, and because XLU's 13.0% SPY-relative strength is the portfolio's strongest signal that institutional capital is actively rebalancing into regulated utility defense.
Utilities & Infrastructure earned the final top-2 allocation slot at 10%, driven by the portfolio's second-highest macro fit of 80.0/100 and a final category score of 82.1 that placed it at near-parity with Precious Metals (85.9). Defensive rotation is the dominant macro signal at +12, reinforced by disinflation pressure (+6), broad market bear (+4), and the general macro state of Disinflation (+7). This convergence creates a regime where regulated, dividend-yielding utility stocks and infrastructure assets are being bid by both macro hedgers and momentum followers. XLU's 19.7% extension above the 50W is a legitimate entry risk, and the timing score of 52.0 reflects this constraint, but the category-level macro tailwind is sufficiently powerful to justify the 10% allocation despite this technical stretch. The allocation decision reveals a portfolio dynamic: Precious Metals at 10% represent pure macro protection via the monetary hedge narrative, while Utilities & Infrastructure at 10% represent macro protection via the defensive rotation narrative. For either category to lose its top-2 slot, the other would need to deteriorate materially or for a tier-2 category (such as Defense & Aerospace or Industrial Metals) to post a higher final category score, which would require both a macro regime shift and strong technical improvement.
Industrial Metals — COPX
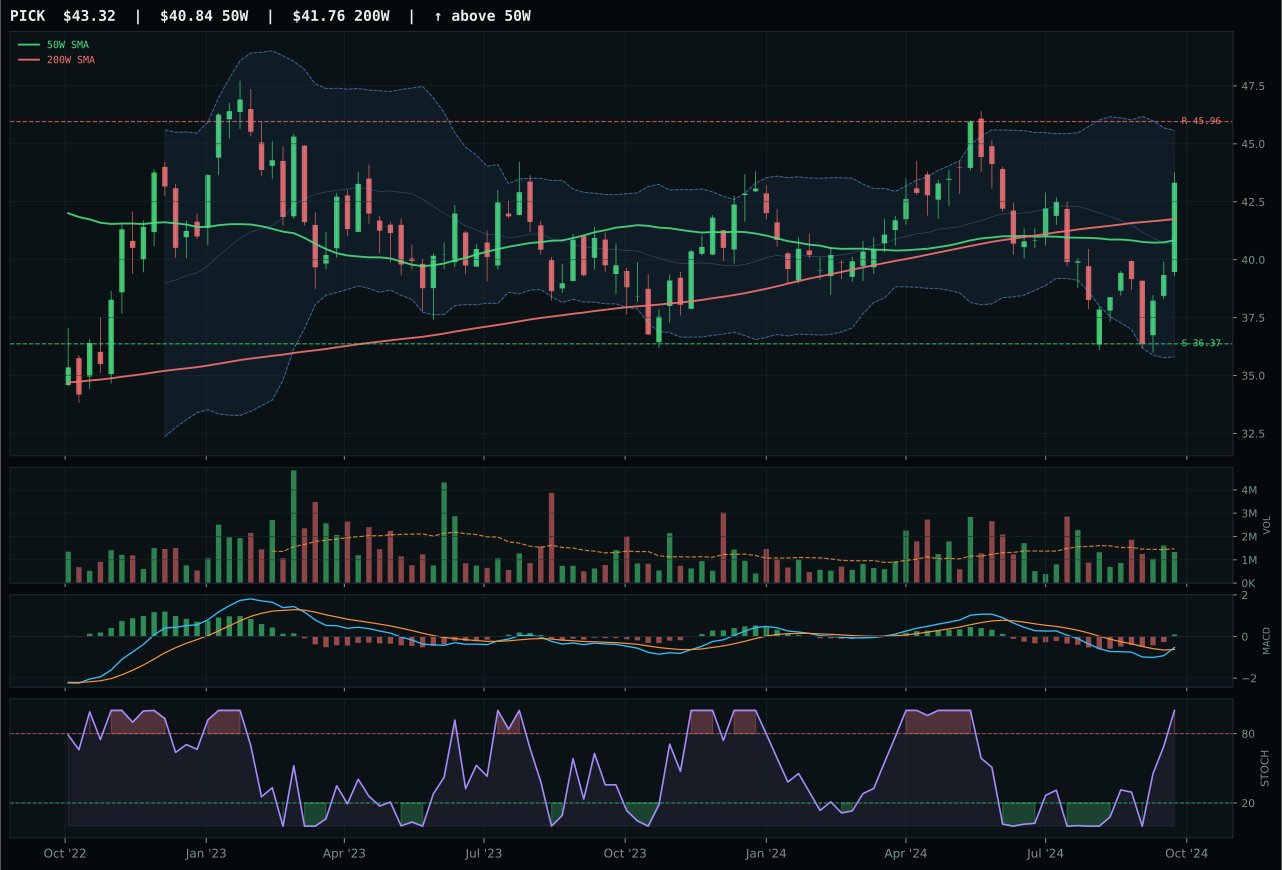
PICK has a neutral structure profile with 1.1% 13-week relative strength versus SPY.
A failed hold above support would weaken the setup.
Actionable but governed by invalidation levels.
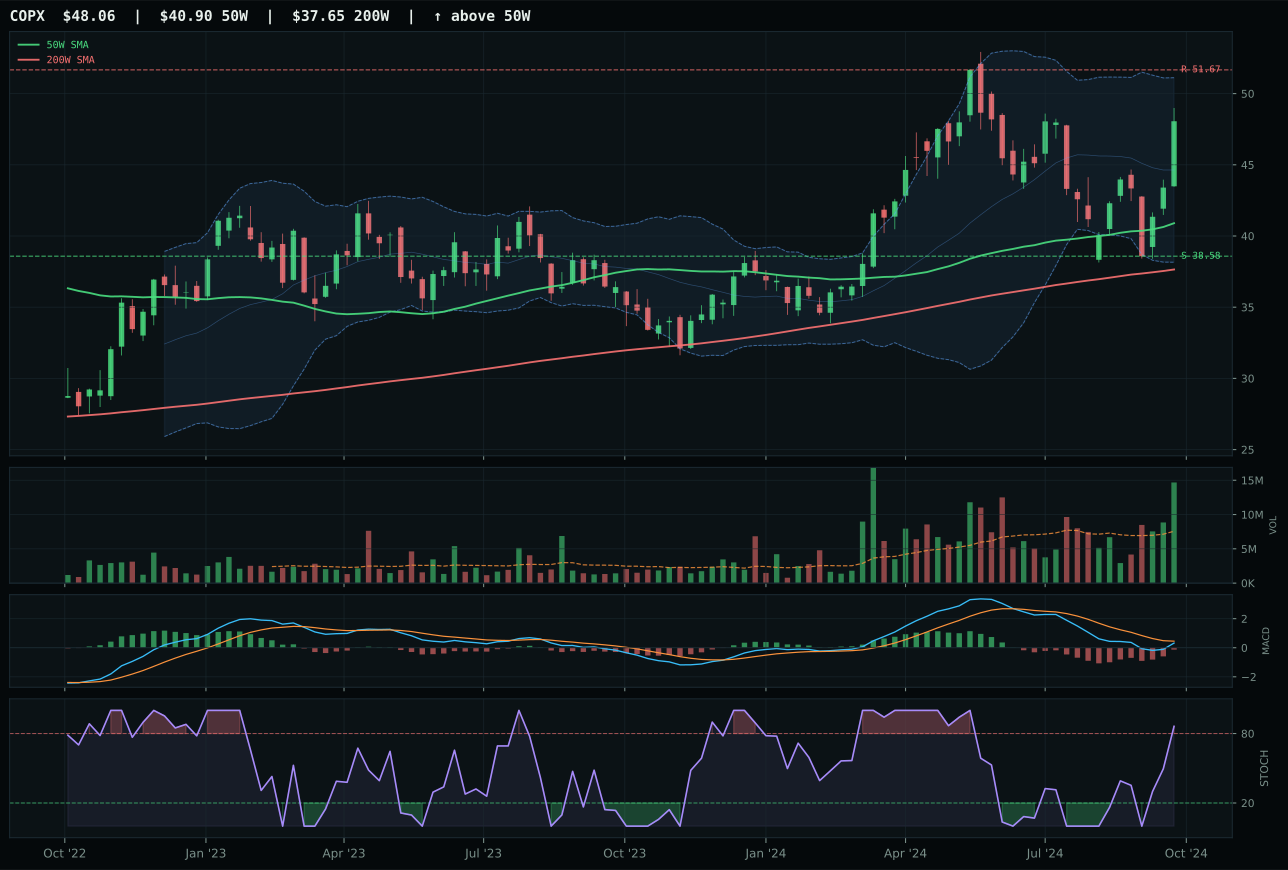
COPX has a vertical extension profile with 1.5% 13-week relative strength versus SPY.
A failed hold above support would weaken the setup.
Actionable but governed by invalidation levels.
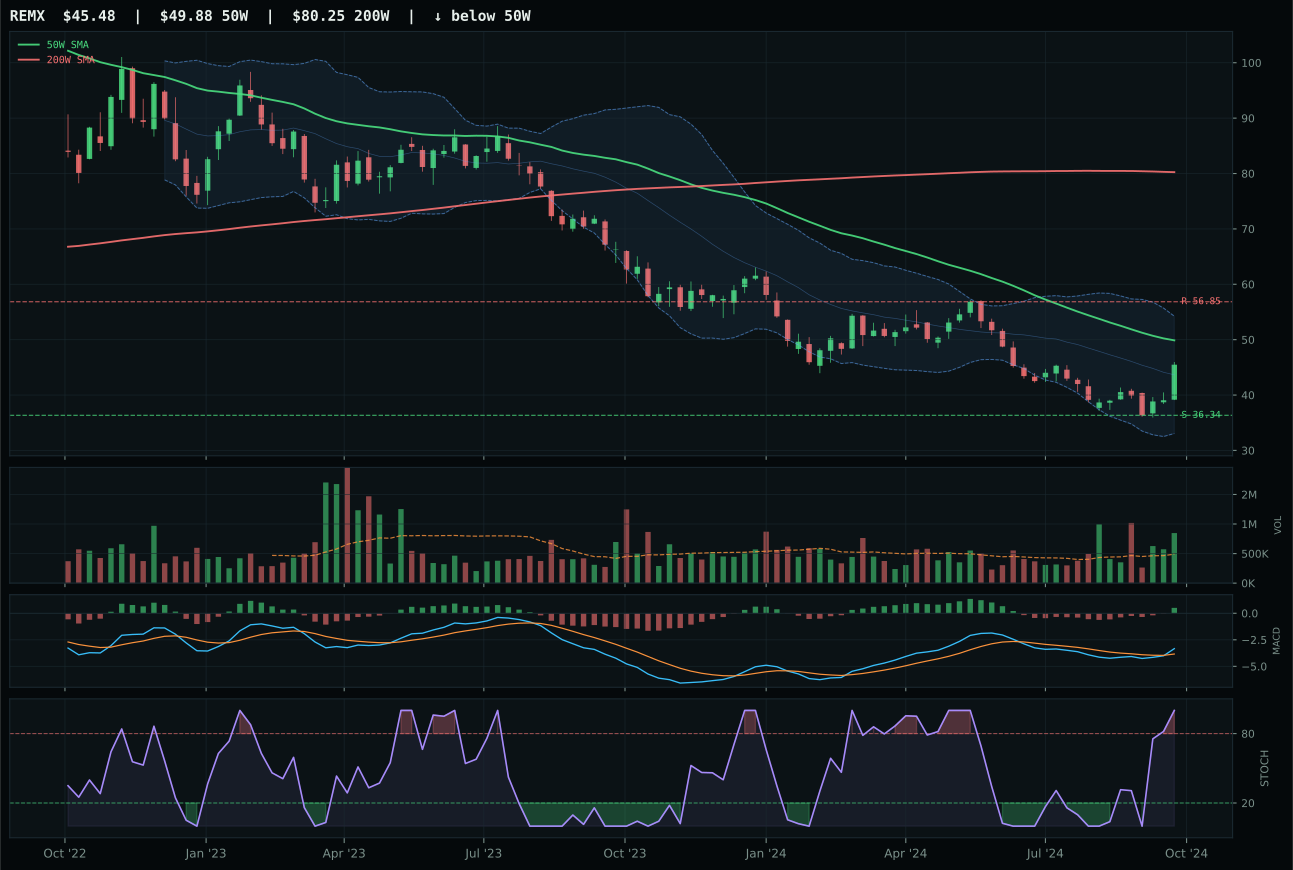
REMX has a neutral structure profile with 2.0% 13-week relative strength versus SPY.
Extension and support failure are the main tactical risks.
Tracked, but not top-2 eligible because: structurally broken.
COPX edged out PICK with superior volume confirmation and better overall risk-reward despite PICK's more favorable timing setup. COPX shows trend strength at 95.3/100 with price 17.5% above the 50W and an upslope of 0.7%, supported by momentum confirmation of 88.1/100 from a 4-week return of 10.9% and accumulation-level volume at 1.94x its 20-week average. PICK posted a higher timing score of 75 versus COPX's 45, reflecting its superior stochastic RSI status and cleaner chart structure (neutral vs. vertical extension), but PICK's volume was only neutral and its risk-reward was weaker at 50.4 versus 55.1. The 12.9-point category gap widens because COPX's accumulation-level volume (1.94x) represents active institutional buying of copper, whereas PICK's neutral volume means mining breadth is not yet attracting the same level of commitment. COPX's MACD is bearish but improving, which might seem weaker than PICK's bullish and improving, but in a metal scarcity regime, the recovery from bearish status with above-average volume is often more powerful confirmation than a MACD that is already fully bullish.
Industrial Metals earned a tier-2 allocation of 5%, supported by one of the portfolio's strongest macro fit readings at 65.0/100. Metals scarcity is the dominant active descriptor at +14, reinforced by commodity breadth positive (+10) and real asset sponsorship (+6), with offsetting headwinds from liquidity stress (-8) and credit stress (-7). This macro environment creates a regime where metal supply concerns override traditional credit-sensitive demand fears, allowing COPX's accumulation-level volume and PICK's neutral-but-improving technical picture to both remain viable. The final category score of 65.2 places Industrial Metals above tier-2 candidates like Technology (53.7) and Nuclear Energy (52.8), making the 5% allocation a tight decision. For Industrial Metals to advance to 5% allocation, the category would need to produce either a confirmed breakout in PICK with volume acceleration, or for COPX to clear its resistance at 51.67 with the same accumulation-level sponsorship currently in place. The metals scarcity macro thesis is compelling, but it is insufficient to override the technical extension risk (both COPX and PICK are overbought by stochastic measures) and the still-active credit stress that could rapid-fire reverse if broader credit conditions deteriorate.
Defense & Aerospace — XAR
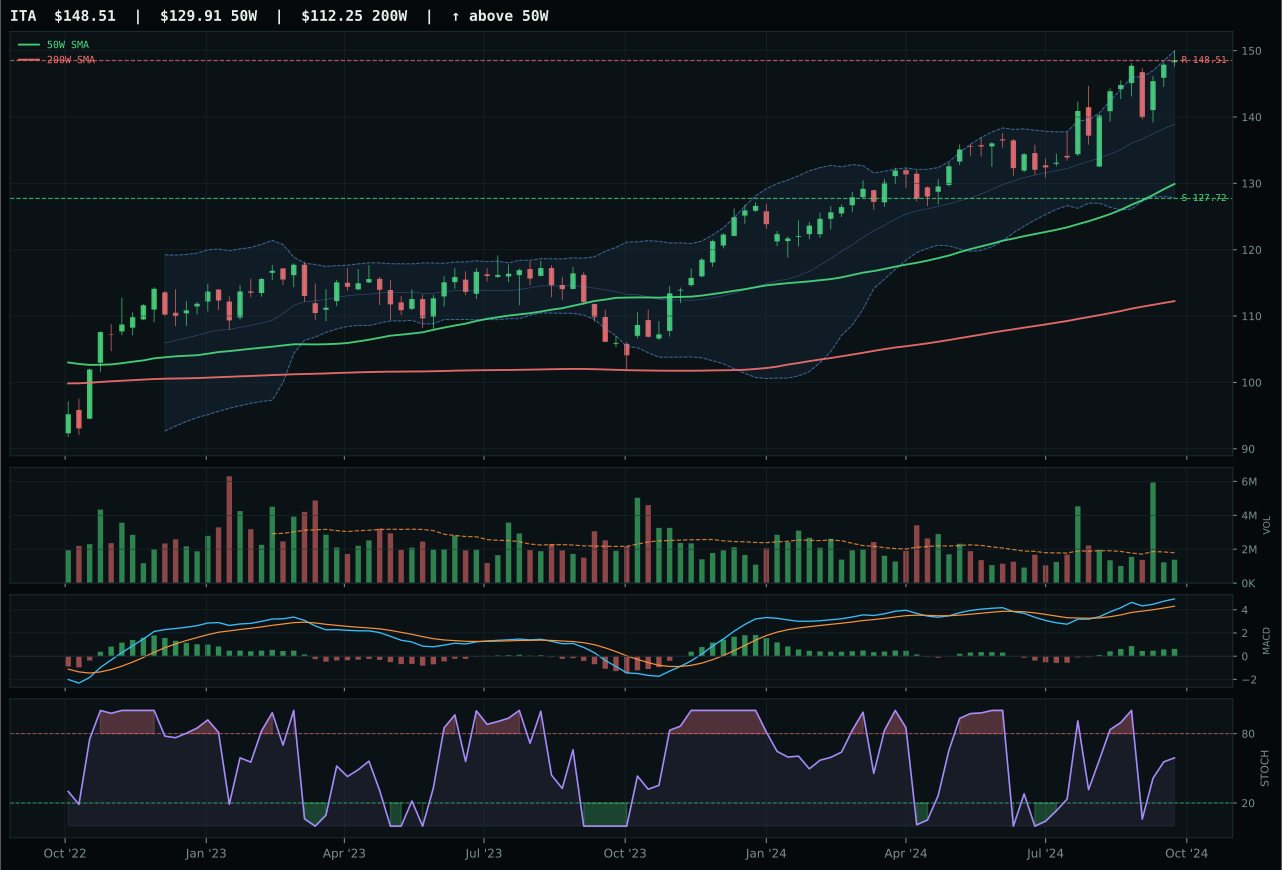
ITA has a neutral structure profile with 7.5% 13-week relative strength versus SPY.
A failed hold above support would weaken the setup.
Actionable but governed by invalidation levels.
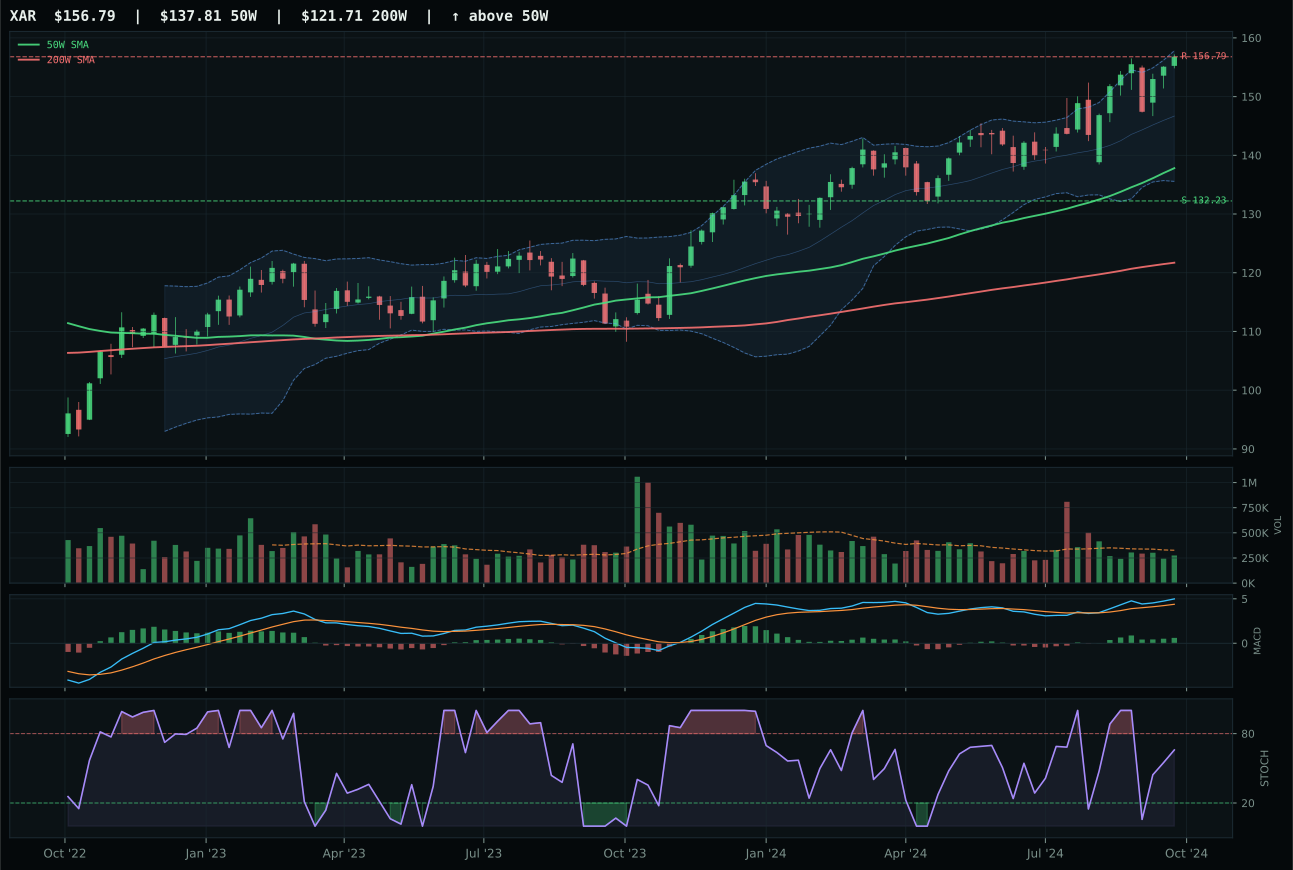
XAR has a neutral structure profile with 7.0% 13-week relative strength versus SPY.
A failed hold above support would weaken the setup.
Actionable but governed by invalidation levels.
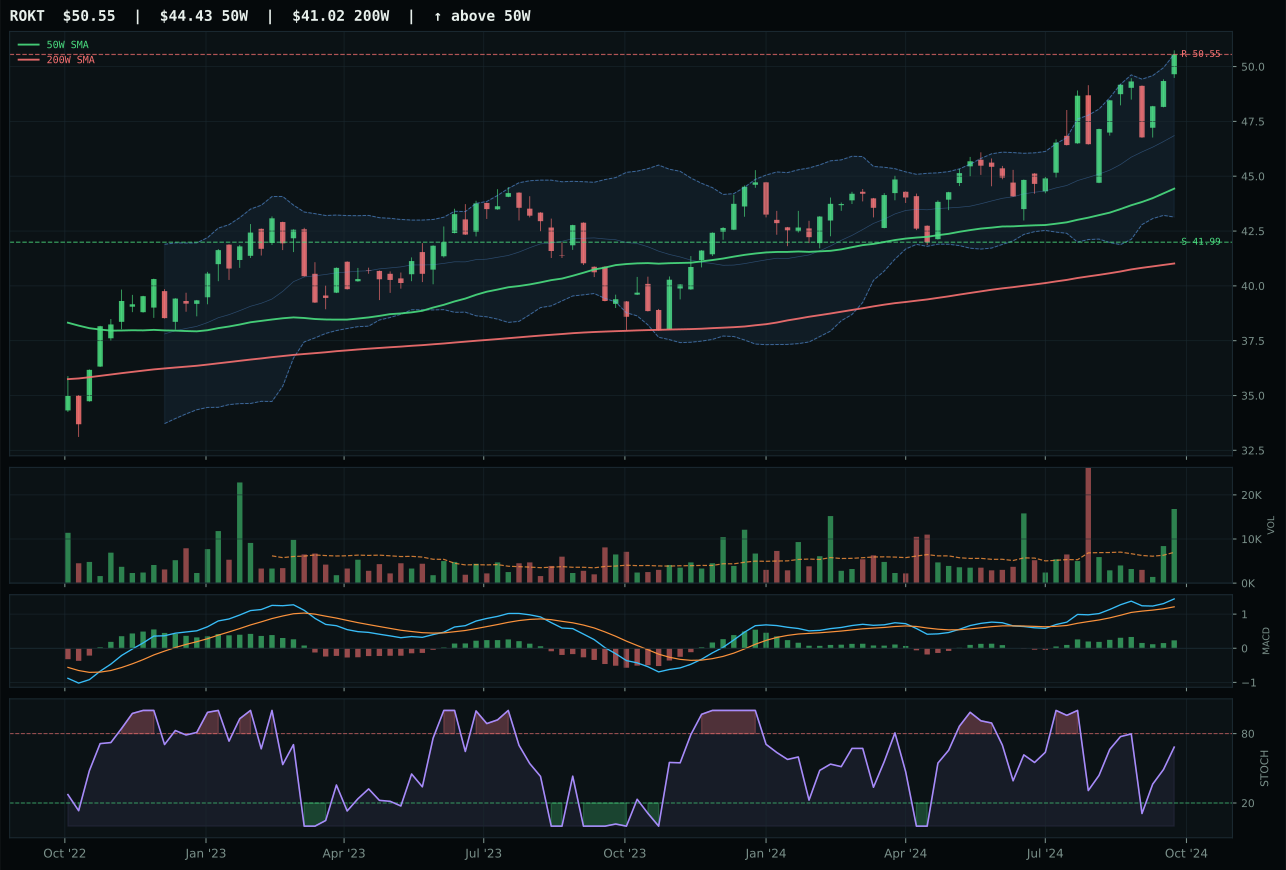
ROKT has a neutral structure profile with 8.2% 13-week relative strength versus SPY.
A failed hold above support would weaken the setup.
Tracked, but not top-2 eligible because: .
XAR edged out ITA with a slightly superior risk-reward profile and perfect trend reading despite both ETFs showing virtually identical setups. Trend scores are both at or near 100/100, both have neutral structure, both have bullish-but-flattening MACD, and both are sitting in the upper retracement zone near their 52-week highs. The deciding factors were granular: XAR's risk-reward of 44.8 versus ITA's 46 initially looks like ITA's advantage, but XAR's volume profile at 0.84x (neutral) combined with its 13-week return of 12.0% and SPY-relative strength of 7.0% gave it a fractionally better overall technical evidence score of 77.6 versus 78.5. However, ITA actually carries superior macro fit at 60.0 versus XAR's 50.0, reflecting active defensive rotation (+7) and broad market bear (+6) tailwinds that favor the defense-prime durability angle. The -0.8-point deficit for XAR as the category winner thus reveals a technical win over a macro winner—XAR's trend and volume sponsorship slightly outweigh ITA's macro positioning in the current reasoned ETF proof order.
Defense & Aerospace earned a tier-2 allocation of 5%, benefiting from an exceptionally strong macro environment even though its technical category score of 64.9 placed it outside the top two by points. Defensive rotation is active (+8), broad market bear conditions are live (+6), and these two descriptors anchor a macro fit of 63.0/100—one of the highest in the portfolio this week. The category-level macro tailwind is so powerful that it keeps Defense & Aerospace in the allocation despite technical evidence that is solid (77.6/100 for XAR) but not elite. To move into top-2 allocation, Defense & Aerospace would need either to improve its technical category score through cleaner volume sponsorship or resistance breakouts, or to see the macro regime shift so that technical leadership becomes the tiebreaker rather than macro fit. For now, the 5% allocation reflects respect for the sector's macro shield while acknowledging that other categories (Precious Metals and Utilities & Infrastructure) have demonstrated stronger technical momentum and slightly higher category scores. If the broad market bear deepens or credit stress accelerates, Defense & Aerospace has room to be scaled into a 10% position.
Technology — IGV
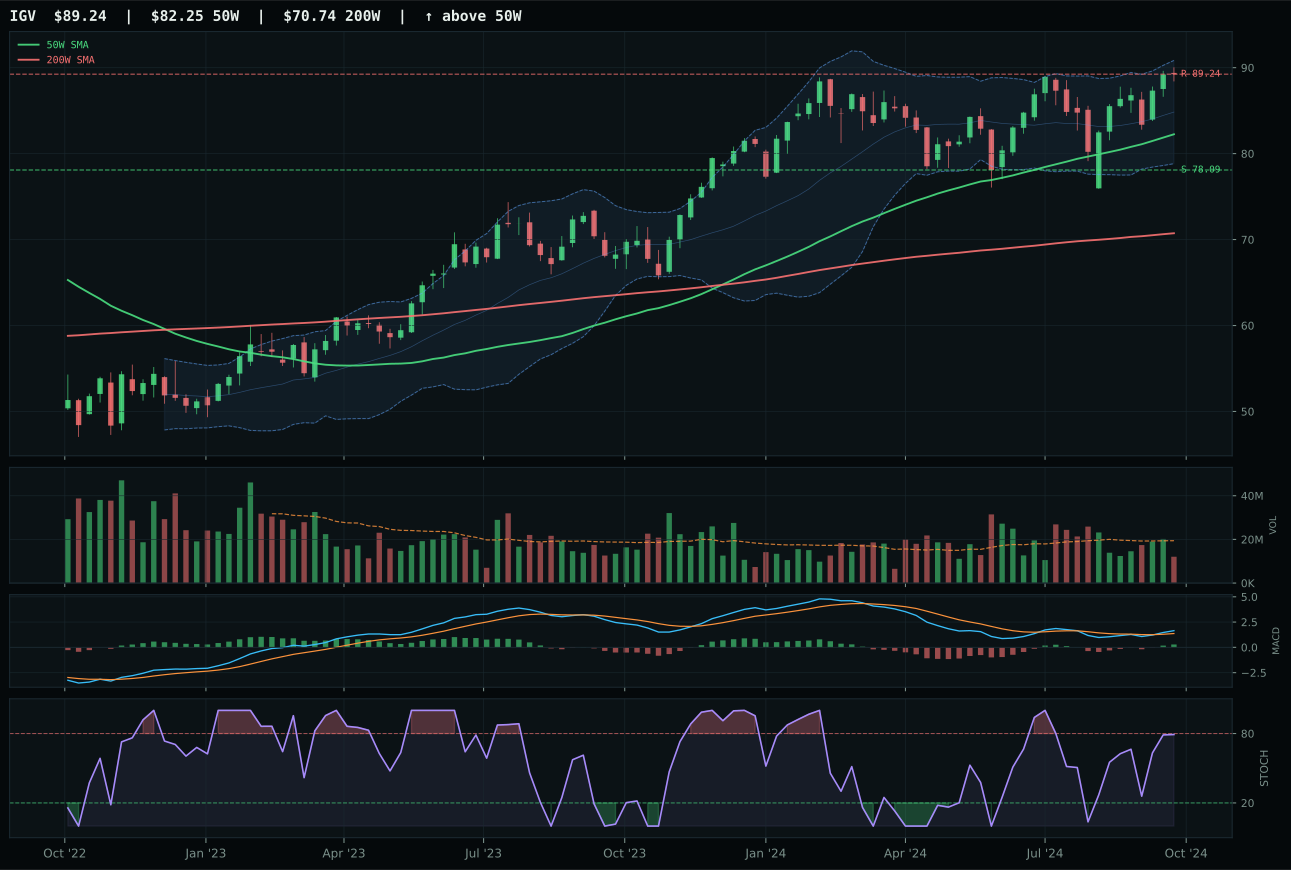
IGV has a neutral structure profile with -2.3% 13-week relative strength versus SPY.
A failed hold above support would weaken the setup.
Actionable but governed by invalidation levels.
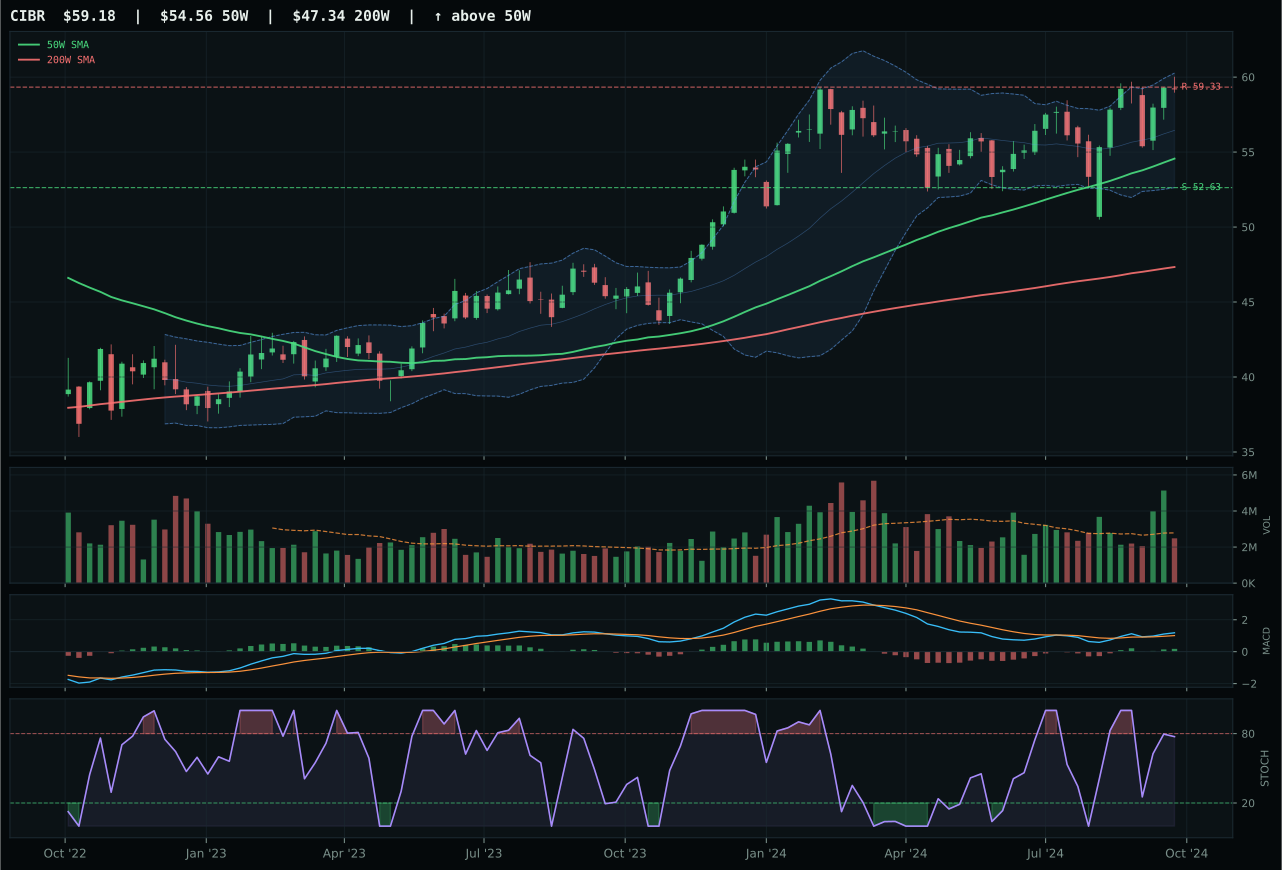
CIBR has a neutral structure profile with -0.1% 13-week relative strength versus SPY.
A failed hold above support would weaken the setup.
Actionable but governed by invalidation levels.
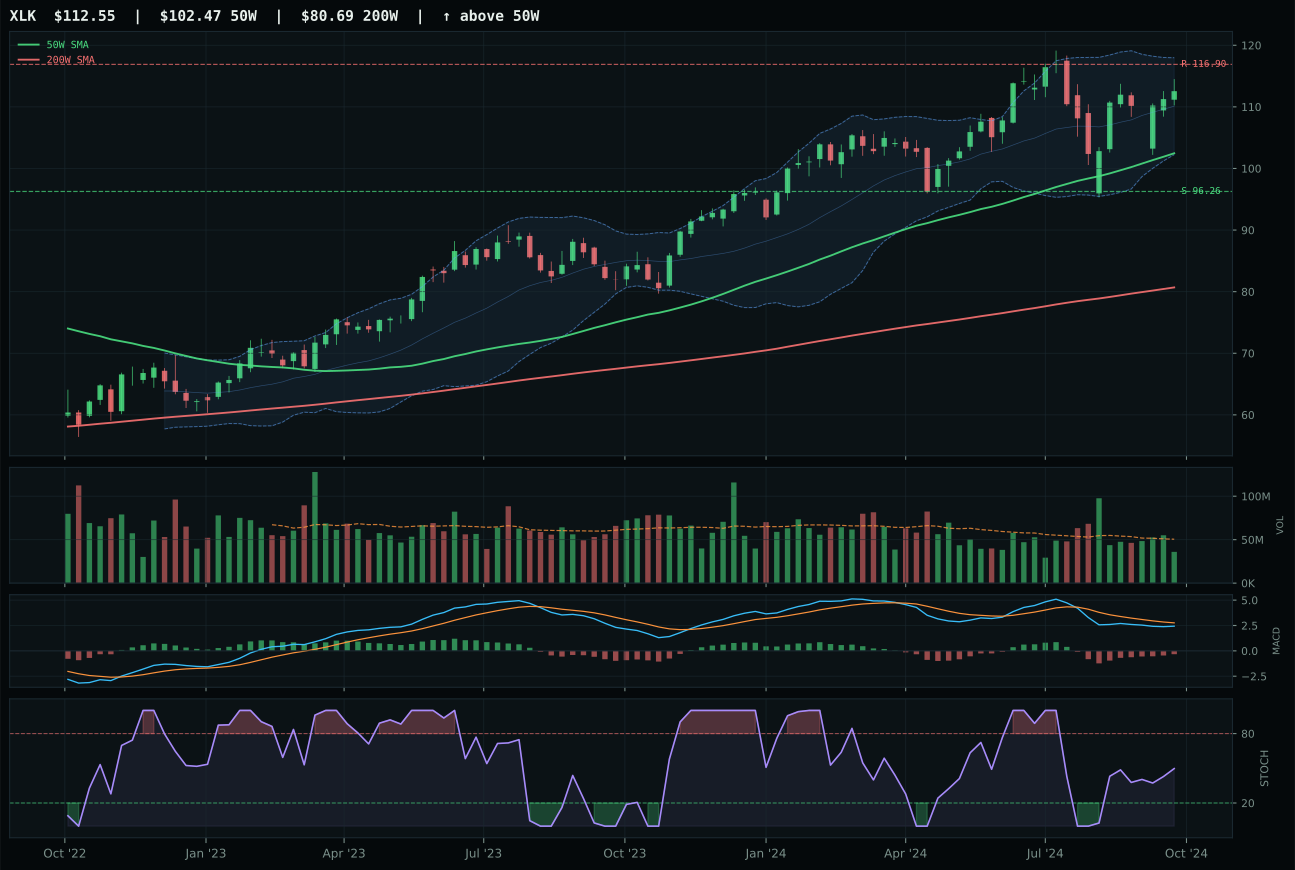
XLK has a neutral structure profile with -5.5% 13-week relative strength versus SPY.
A failed hold above support would weaken the setup.
Actionable but governed by invalidation levels.
IGV captured the category lead with a clean trend setup and superior relative strength positioning within its basket. Price sits 8.5% above the 50-week moving average with a non-deteriorating slope of 0.5%, supported by MACD that is bullish and improving and a stochastic RSI rising through mid-zone at 0.79. The key technical edge over CIBR was timing: IGV's distance to the 50W at 8.5% combined with improving momentum confirmation gave it a 5-point advantage in the timing score (83 vs 78), while risk-reward of 47.1 versus 37.4 meant IGV offered better downside cushion at support. CIBR's MACD, while bullish, was already flattening—a subtle but meaningful deterioration in confirmation—and its category-relative strength was flat at 0.0% versus IGV's neutral-to-positive stance. The volume picture for both was thin participation at 0.62x and neutral respectively, meaning neither had institutional accumulation driving the move, which is why the score gap of only 1.6 points reflects a genuinely competitive decision.
Technology earned a tier-2 allocation of 5% this week, ranked below two higher-scoring categories but still eligible for capital. The category's fundamental headwind is the active liquidity stress (-10) and credit stress (-7) descriptors, which penalize duration-sensitive growth exposure in a disinflation regime where borrowing costs and credit spreads matter. Counterbalancing that are the macro tailwinds from disinflation helping growth valuations (+7) and disinflation pressure itself (+5), but the net macro fit of 45.0/100 is below average. What keeps Technology in the 5% slot rather than in zero allocation is strong technical sponsorship: the 3/2/1 weighted ETF basket score of 63.4 is solid, and IGV's trend reading of 96.5/100 and momentum confirmation of 60.5/100 show prices are being actively accumulated despite thin volume. For Technology to move into top-2 tier, two things would need to occur: either the liquidity stress descriptor would need to flip from active to dormant (reducing the macro drag substantially), or the category would need to produce a cleaner accumulation picture with volume above 1.0x its 20-week average to validate the upside structure.
Nuclear Energy — NLR
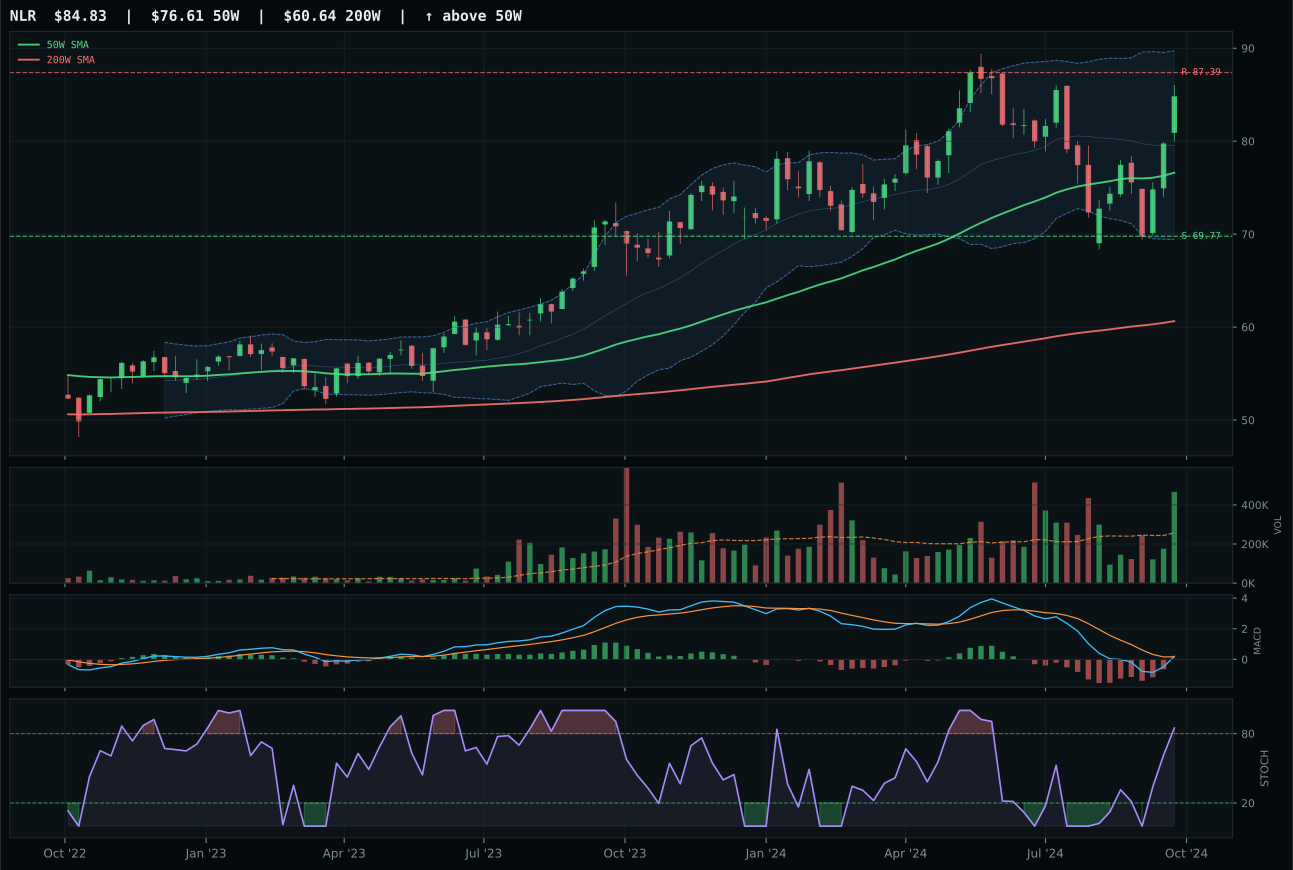
NLR has a neutral structure profile with 1.1% 13-week relative strength versus SPY.
A failed hold above support would weaken the setup.
Actionable but governed by invalidation levels.
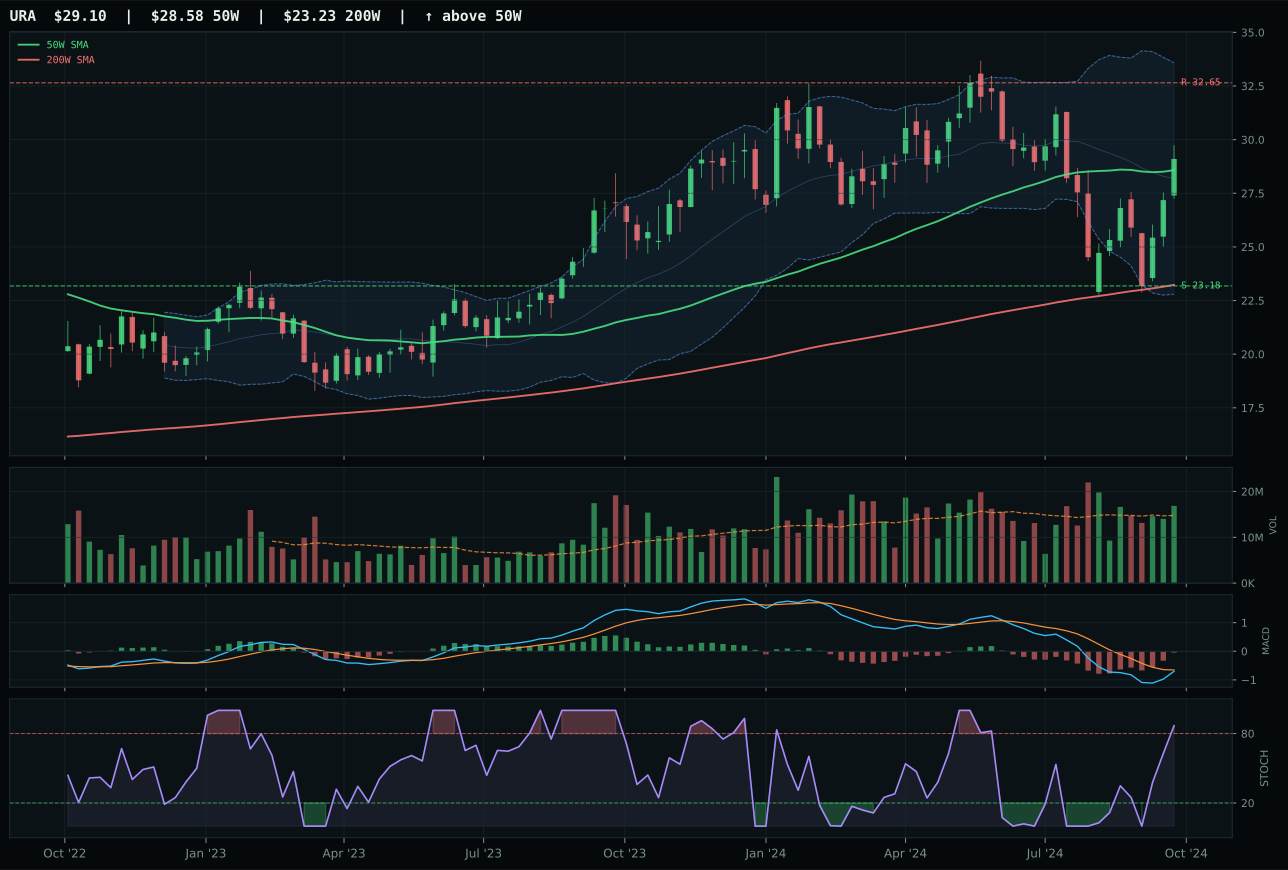
URA has a compression near 50W profile with -4.5% 13-week relative strength versus SPY.
A failed hold above support would weaken the setup.
Actionable but governed by invalidation levels.
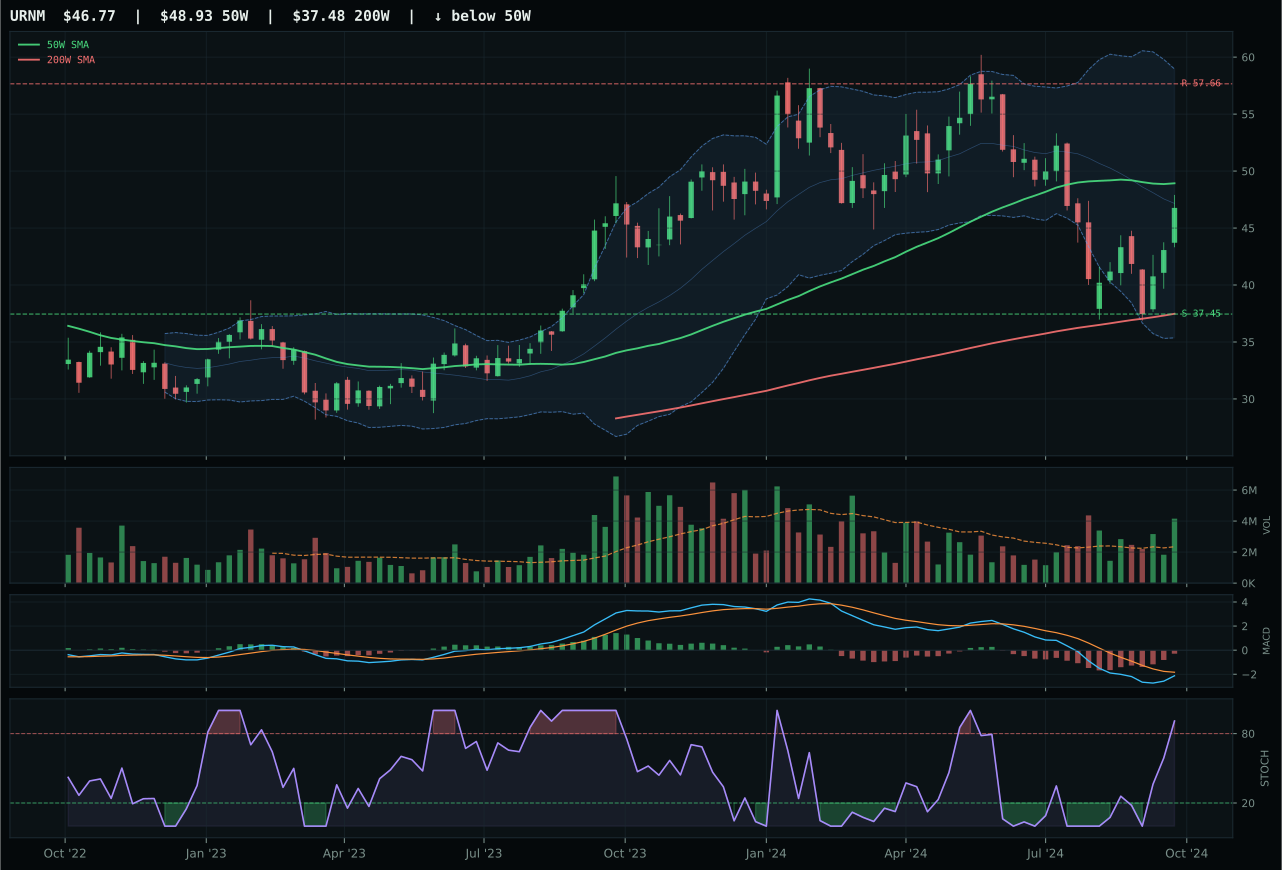
URNM has a neutral structure profile with -10.0% 13-week relative strength versus SPY.
A failed hold above support would weaken the setup.
Actionable but governed by invalidation levels.
NLR won with perfect trend reading and superior volume confirmation that set it apart from a tightly contested category field. Trend scores 100.0/100 with price 10.7% above the 50W and a 0.4% upslope, supported by momentum confirmation of 100.0/100 from 4-week return of 12.3%, 13-week return of 6.1%, and category-relative strength of 5.6%—the strongest RS in the category. Volume at 1.81x is accumulation/confirmation level, meaning institutional buyers are actively bidding for nuclear utilities despite the 0.4% upslope being modest. URA, the runner-up just 1.4 points behind, carries a superior timing score of 100.0/100 (compression setup near the 50W is tighter than NLR's 10.7% distance), but URA's MACD is bearish but improving versus NLR's bullish and improving, and URA's volume is only above-average participation (1.53x) versus accumulation confirmation. URA's 4-week return is flat at 0.5% and category-relative strength is 0.0%, meaning the technical reset structure is clean but lacks momentum confirmation. The 1.4-point gap is narrow enough to suggest that if URA's MACD turns bullish while maintaining its tight structure, it could supplant NLR next week.
Nuclear Energy earned a tier-2 allocation of 5%, benefiting from real asset sponsorship (+7) and a defensive rotation bid (+6) that offset headwinds from liquidity stress (-7) and credit stress (-5). The category-level macro fit of 41.0/100 is middle-of-the-road, placing Nuclear Energy in the tier-2 group alongside Technology, Defense & Aerospace, Industrial Metals, and Emerging Markets. NLR's technical evidence is exceptional at 100.0/100, the highest individual ETF technical score in the entire portfolio, driven by perfect trend, perfect momentum confirmation, and accumulation-level volume. However, Nuclear Energy as a category is not receiving top-2 allocation because two other categories (Precious Metals at 85.9 and Utilities & Infrastructure at 82.1) scored higher on the final reasoned category score. The 5% slot reflects the portfolio's decision to hold a small position in the best technical setup in a defensive, real-asset-conscious category, but to weight defensive capital toward the cleaner macro narratives (monetary hedge for gold, broad regulatory deflationary protection for utilities). For Nuclear Energy to move into 5% allocation, either the category would need to post a higher final score than Precious Metals or Utilities & Infrastructure, or one of those two categories would need to deteriorate technically or macro-wise.
Emerging Markets — IEMG
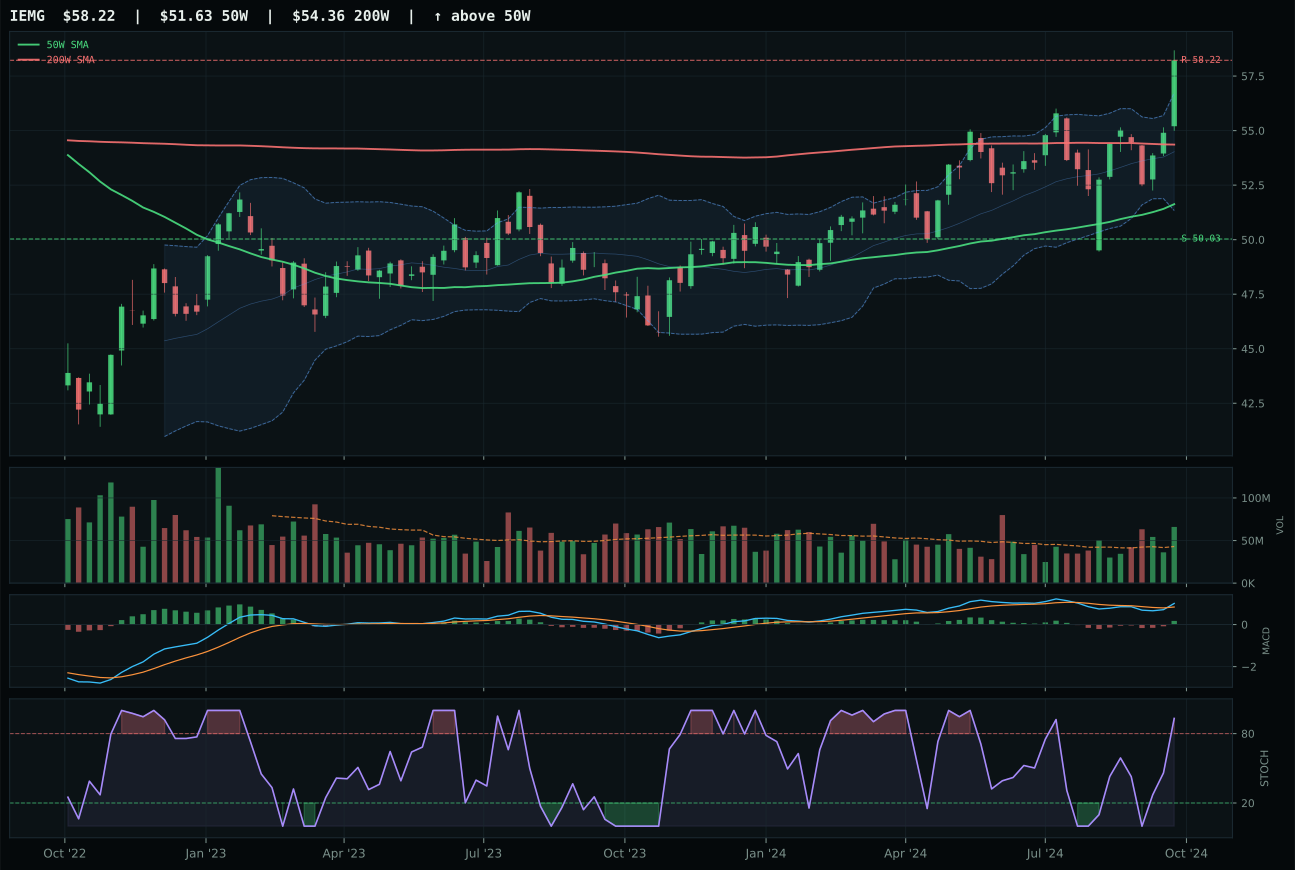
IEMG has a neutral structure profile with 3.8% 13-week relative strength versus SPY.
A failed hold above support would weaken the setup.
Actionable but governed by invalidation levels.
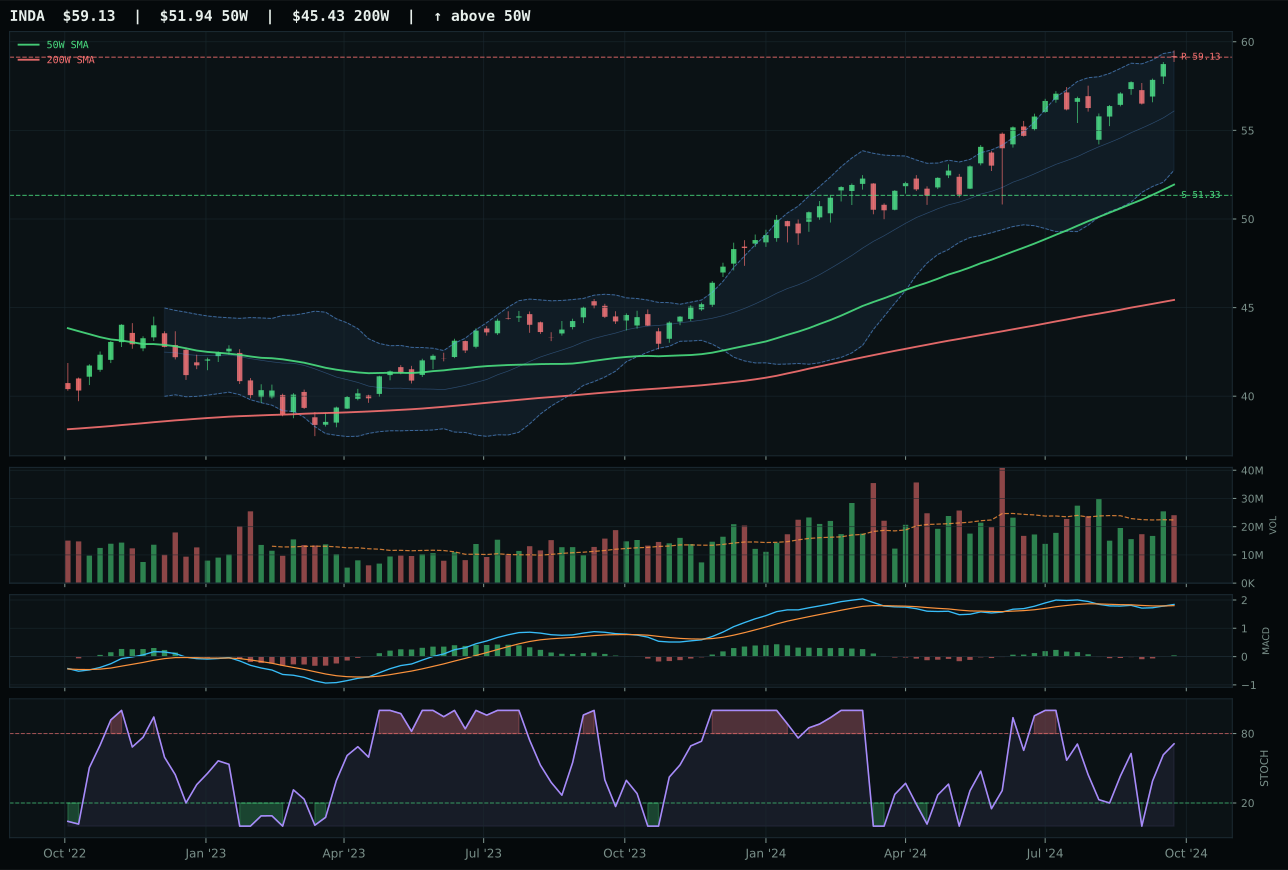
INDA has a neutral structure profile with 1.0% 13-week relative strength versus SPY.
A failed hold above support would weaken the setup.
Actionable but governed by invalidation levels.
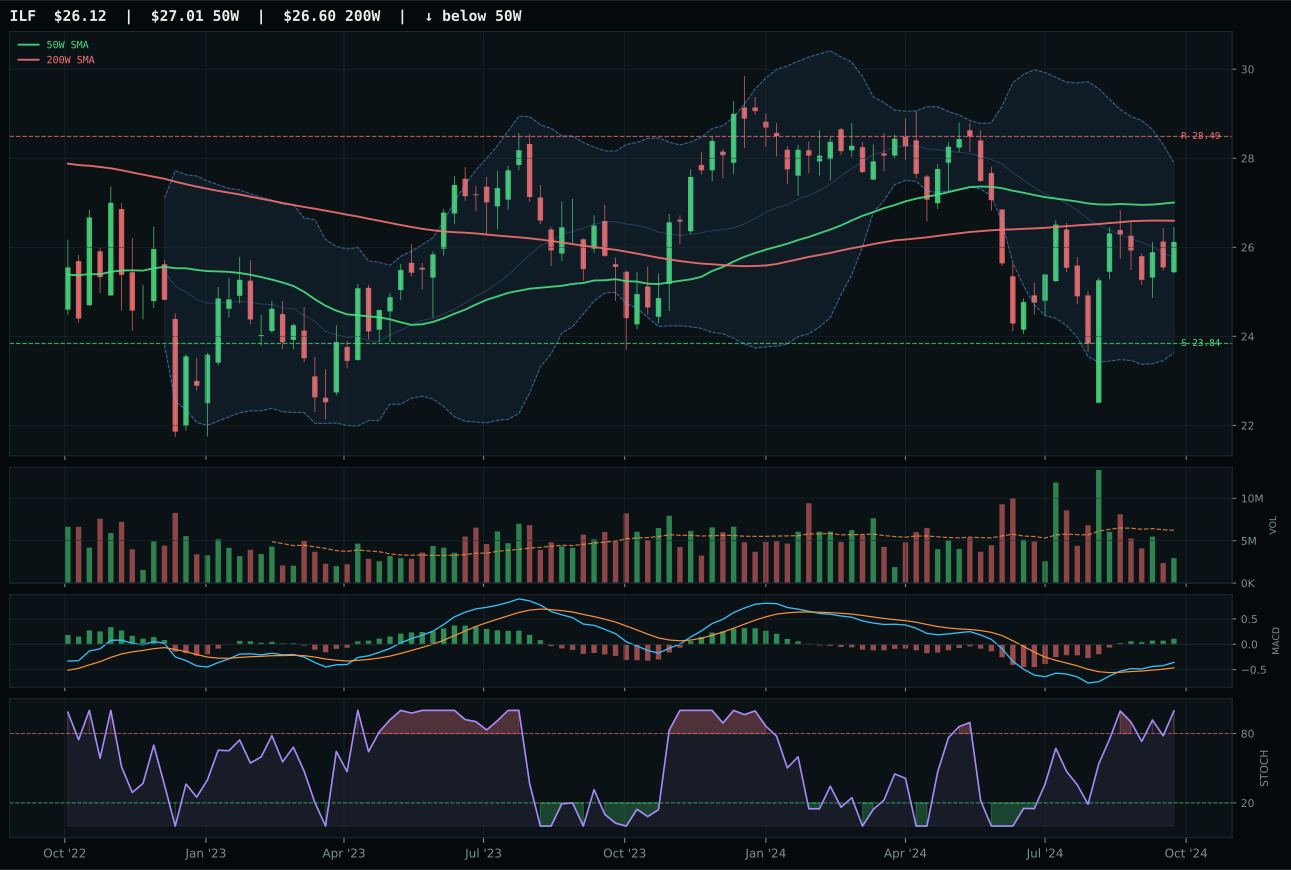
ILF has a neutral structure profile with 0.5% 13-week relative strength versus SPY.
A failed hold above support would weaken the setup.
Actionable but governed by invalidation levels.
IEMG won with superior volume confirmation and slightly better category-relative strength despite an extremely tight matchup against INDA. Both ETFs show strong trend readings (IEMG at 95.6, INDA at 100.0), both sit in neutral structure near their 52-week highs, and both have bullish-and-improving MACD. The deciding factors are surgical: IEMG's volume at 1.53x is accumulation/confirmation level versus INDA's neutral (1.0x), and IEMG's category-relative strength of 2.8% narrowly edges INDA's 0.0%. IEMG's risk-reward is also fractionally better at 50.8 versus 46.5, and structure is cleaner at 81.4 versus 78.8. INDA's only technical advantage is its higher trend score at 100.0 versus IEMG's 95.6 and a faster 13-week return of 6.0% versus IEMG's 8.8%, but the momentum confirmation scores are both strong (100.0 for IEMG, 74 for INDA). The 0.8-point gap reflects a technical victory for broad emerging-market beta (IEMG) over India-specific quality growth (INDA), driven by volume sponsorship.
Emerging Markets earned a tier-2 allocation of 5%, supported by strong technical evidence (99.4/100 for IEMG) but undercut by one of the portfolio's most severely negative macro fits at 21.0/100. Credit stress is active (-10), liquidity stress is active (-10), and broad market bear conditions are present (-9), creating a macro regime that penalizes EM exposure as investors rotate toward dollar safety and away from emerging-market currency and credit risk. IEMG's strong technical picture—trend at 95.6, momentum confirmation at 100.0, accumulation-level volume—is genuine and earns the allocation slot on technical merit alone. However, the category score of 50.1 is significantly lower than both top-2 categories and most tier-2 peers, placing it in the allocation more as a technical opportunity than as a macro conviction. The 5% allocation reflects the portfolio's view that while macro conditions are adverse for EM, IEMG's accumulation profile and positive category-relative strength suggest sophisticated buyers are building positions ahead of a potential macro reset. For Emerging Markets to move into top-2 allocation, either credit stress and liquidity stress would both need to flip dormant (indicating a major shift toward risk appetite), or the category would need to demonstrate even stronger technical confirmation with broader accumulation across the three-ETF basket.
AI — AIQ
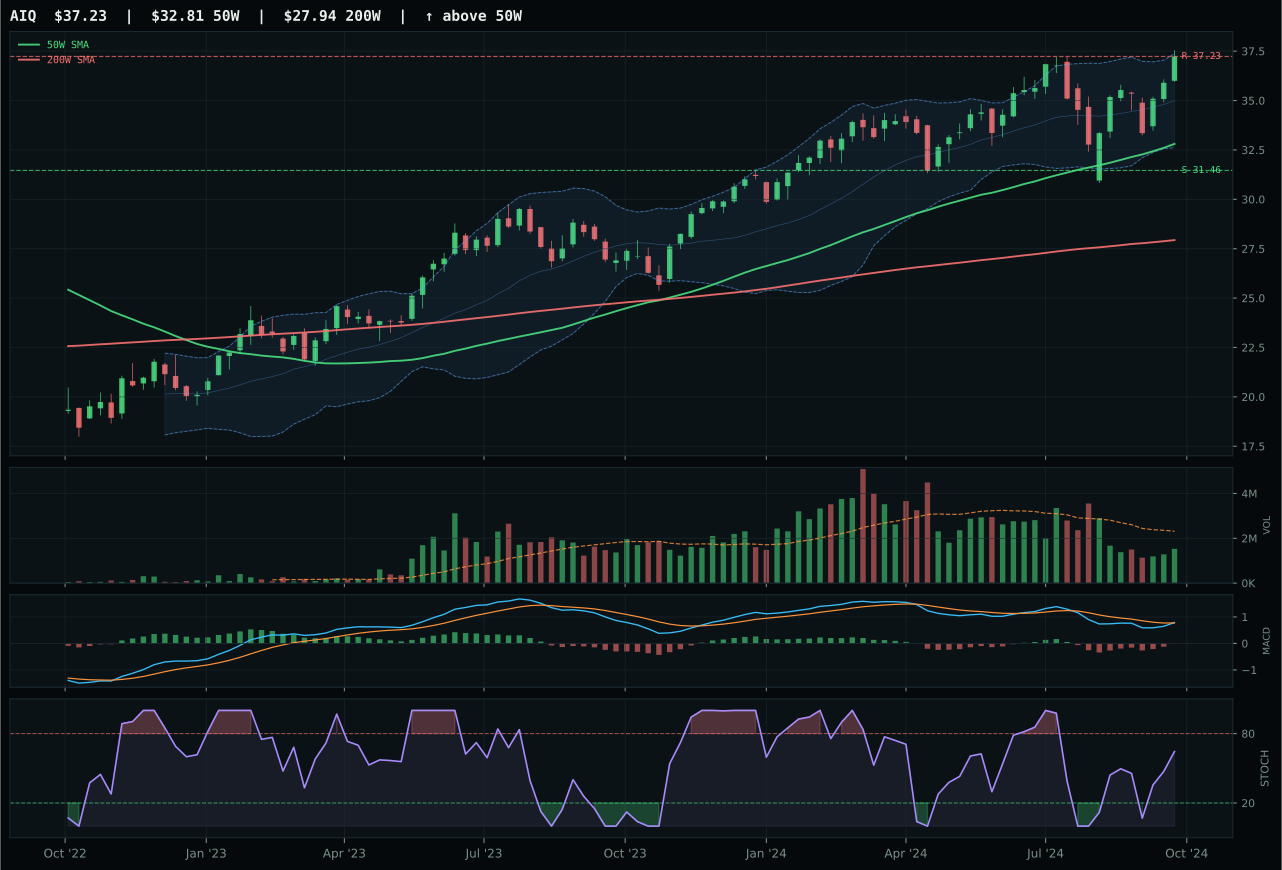
AIQ has a neutral structure profile with -0.5% 13-week relative strength versus SPY.
A failed hold above support would weaken the setup.
Actionable but governed by invalidation levels.
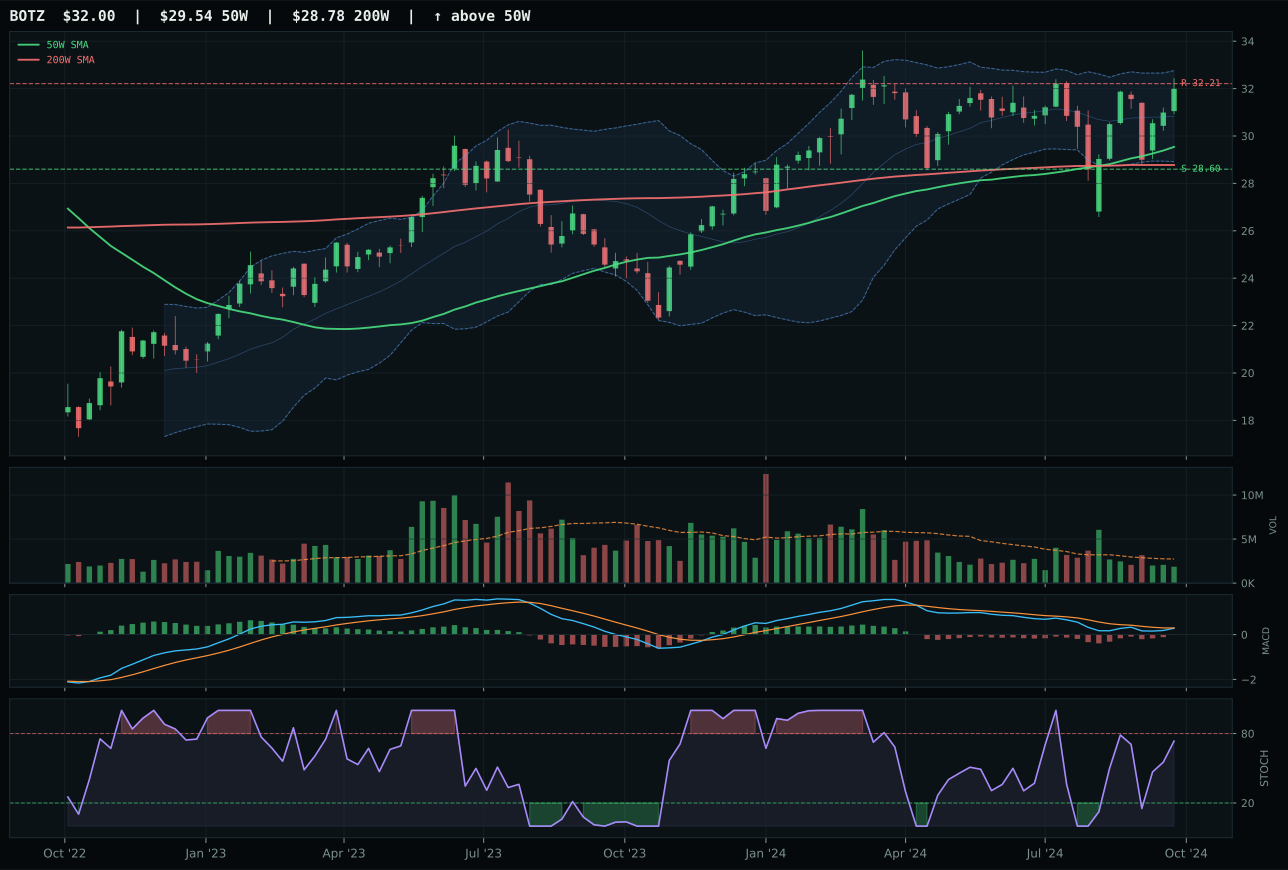
BOTZ has a neutral structure profile with -1.3% 13-week relative strength versus SPY.
A failed hold above support would weaken the setup.
Actionable but governed by invalidation levels.
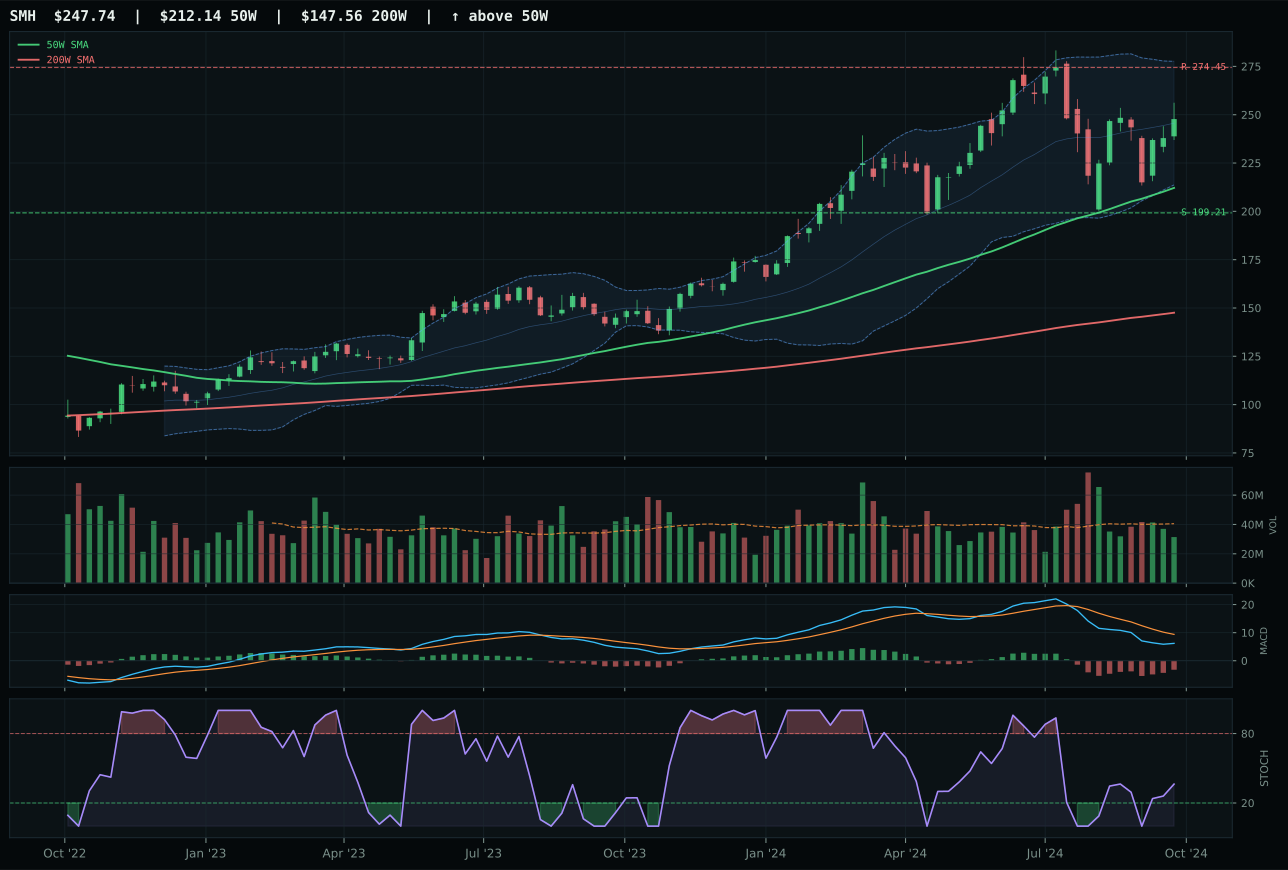
SMH has a vertical extension profile with -10.0% 13-week relative strength versus SPY.
A failed hold above support would weaken the setup.
Actionable but governed by invalidation levels.
AIQ won with superior trend confirmation and the only bullish-and-improving MACD signal in the category's top two candidates. Price sits 13.5% above the 50-week average with a 0.6% slope, and momentum confirmation scores 70.9/100 thanks to a 4-week return of 5.3% combined with 13-week return of 4.5% and category-relative strength of 0.8%—the only positive RS in the contest. BOTZ, the runner-up, showed trend strength at 81/100 but carried three technical disadvantages: its MACD was bearish but improving (versus bullish and improving), its category-relative strength lagged at 0.0%, and its overall technical evidence was 64.5 versus AIQ's 71.7. The 7.1-point category gap might seem wide, but it reflects the difference between a setup that is accumulating (AIQ with improving MACD and positive category RS) and one that is still repairing (BOTZ's bearish MACD despite improving technical conditions). Stochastic RSI in both cases is rising mid-zone, so timing was not the differentiator—momentum phase was.
AI received a tier-2 allocation of 5% despite a final category score of only 31.4, which ranks it well outside the top tier. The macro headwind is severe: liquidity stress is active (-12) and credit stress is active (-8), and broad market bear conditions are present (-8). These three factors combine to deliver a category-level macro fit of just 27.0/100, which substantially drags down the category score even though AIQ's technical evidence reaches 71.7/100. Disinflation does provide a small tailwind (+5), but it is overwhelmed by the defensive pressures. The allocation of 5% reflects the portfolio's decision to hold a small, technically sound position in AI despite the macro regime working against growth and leverage-dependent narratives. For AI to graduate to a 10% top-2 slot, either the credit stress or liquidity stress descriptors would need to become dormant (materially reducing the macro penalty), or the category's technical evidence would need to accelerate notably—perhaps through BOTZ or AIQ clearing meaningful resistance with volume confirmation. Currently, the technical strength is real but too fragile to justify more capital when macro conditions are this constrained.
Agriculture & Livestock — MOO
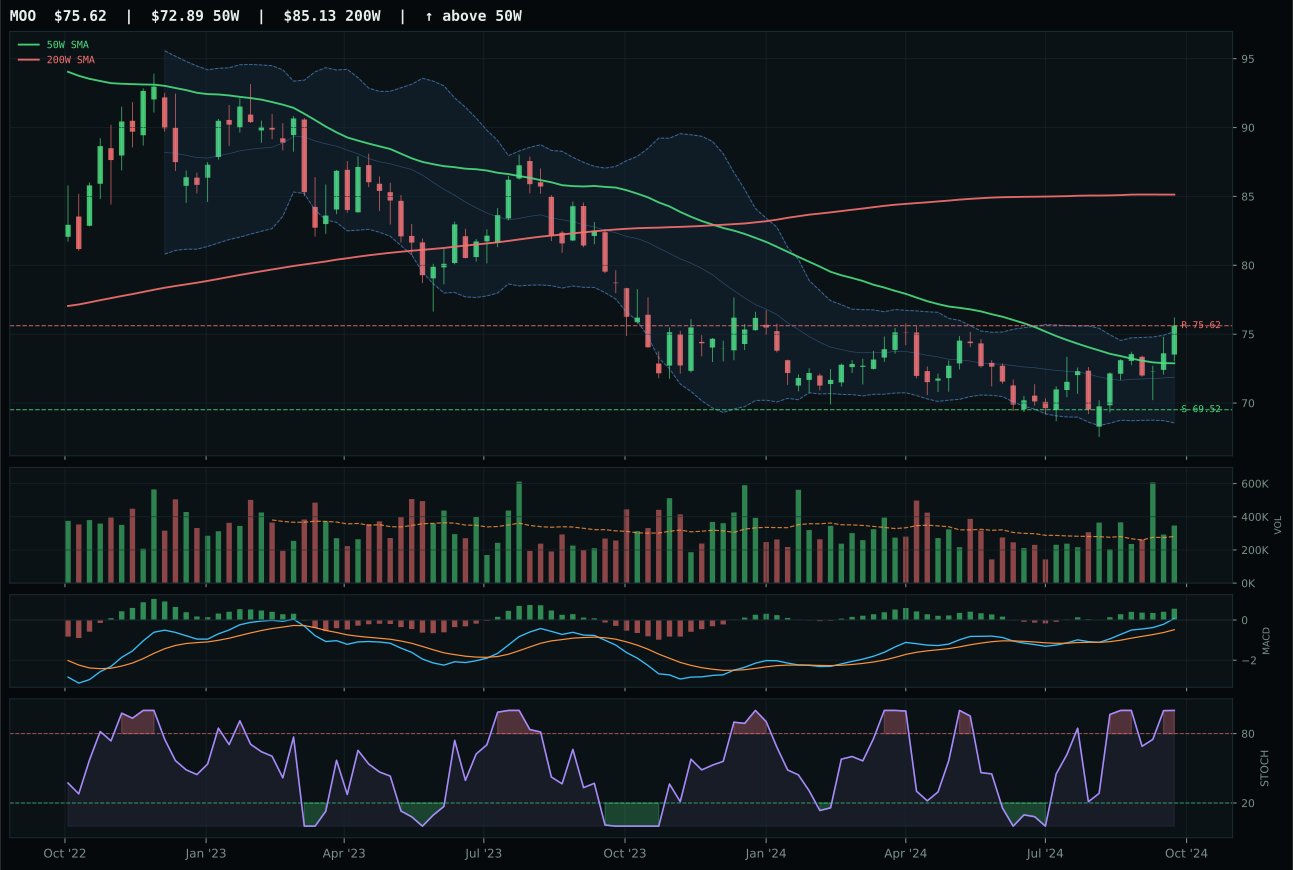
MOO has a neutral structure profile with 2.8% 13-week relative strength versus SPY.
A failed hold above support would weaken the setup.
Actionable but governed by invalidation levels.
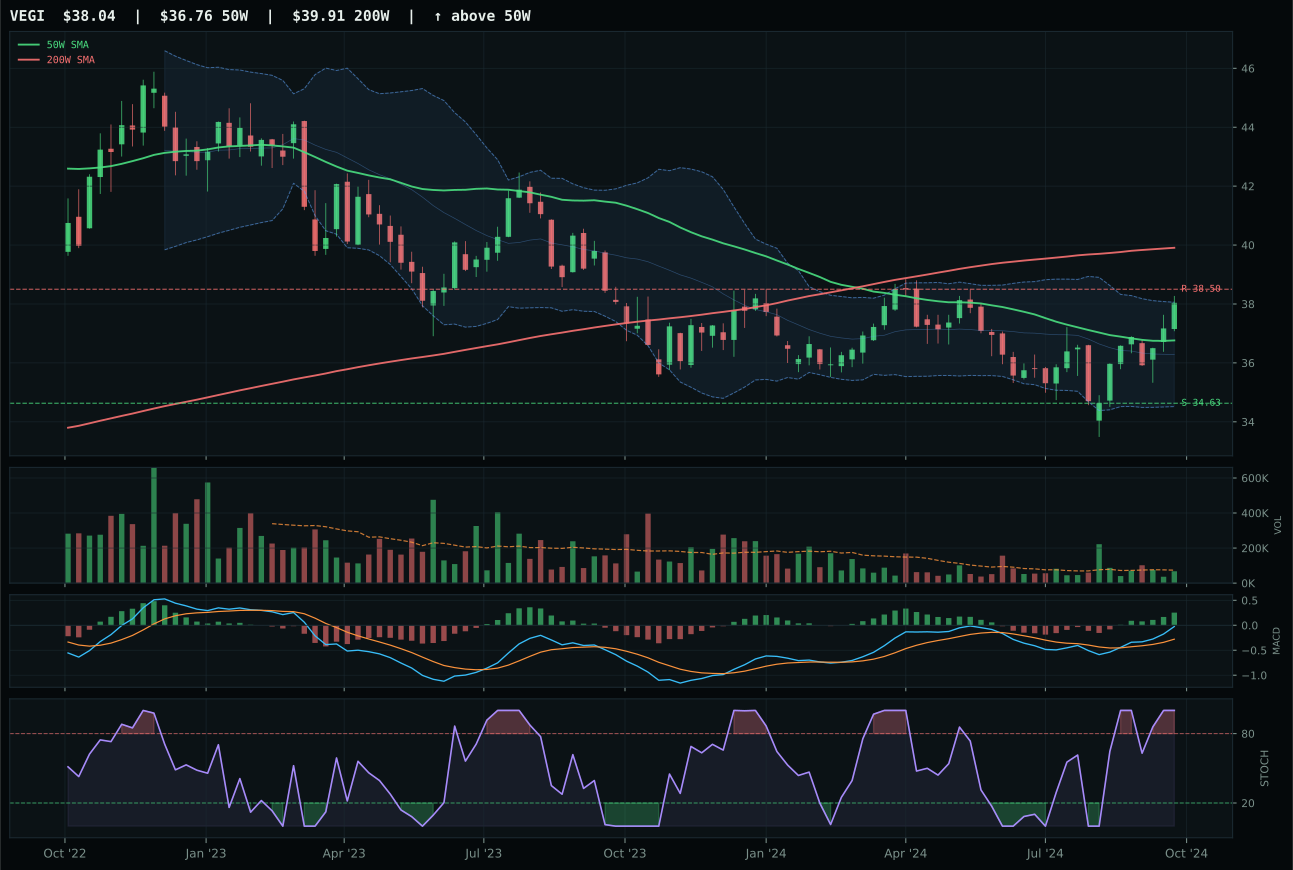
VEGI has a neutral structure profile with 1.3% 13-week relative strength versus SPY.
A failed hold above support would weaken the setup.
Tracked, but not top-2 eligible because: .
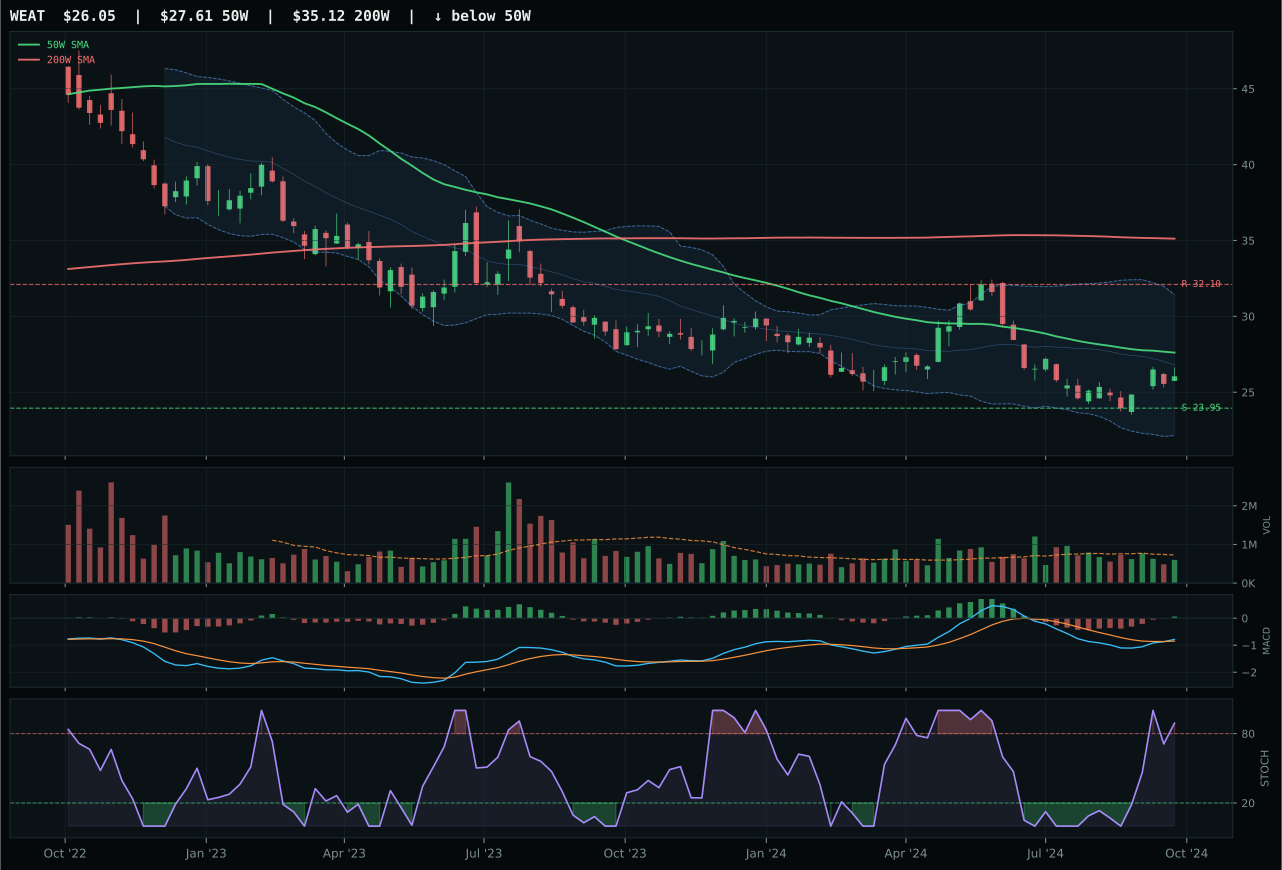
WEAT has a neutral structure profile with -6.9% 13-week relative strength versus SPY.
Extension and support failure are the main tactical risks.
Tracked, but not top-2 eligible because: structurally broken.
MOO won the category with strong momentum confirmation and above-average volume participation that VEGI could not match. Price sits just 3.7% above the 50-week moving average, meaning the risk-reward structure is well-defined with 8.8% downside to support and 0.0% upside to resistance. The timing score of 90.0/100 reflects price proximity to the 50W and the presence of overbought stochastic RSI at 1.00, signaling momentum exhaustion territory. MOO's technical evidence of 80.8/100 is driven by strong momentum confirmation (85.3/100) from a 13-week return of 7.8% and category-relative strength of 1.6% paired with above-average volume at 1.23x its 20-week average. VEGI could not compete on volume (neutral), risk-reward (47.2 vs 61.4), or cleanliness of structure (80.2 vs 85.5), despite posting a superior 13-week return of 6.3%. The category spread of 18.9 points is decisive: MOO's combination of tight structure, above-average participation, and positive category RS outweighs VEGI's longer-term price action.
Agriculture & Livestock earned zero allocation this week, ranked outside the eligible tier despite MOO's technical competence. The category score of 29.8 reflects a fundamental disconnect between positive technical conditions and overwhelmingly negative macro fit of 45.0/100. Disinflation pressure is active and working against the category (-8), and this descriptor combines with liquidity stress (-4) to create an unfavorable regime for commodity-linked exposure. Real asset sponsorship is active (+8) and commodity breadth positive (+5), but these tailwinds are structurally weaker than the disinflation headwind in a regime where falling prices are the macro story. MOO's momentum score of 85.3/100 and timing of 90.0/100 are genuinely strong—the ETF is signaling near-term exhaustion with stochastic RSI at overbought—but technical strength alone cannot justify allocation when the macro regime is actively working against the entire basket. For Agriculture to earn a 5% or higher allocation slot, either the disinflation pressure descriptor would need to become dormant (indicating a regime shift to inflation concerns), or the category's technical leadership would need to produce a confirmed breakout with multi-week accumulation rather than the near-term momentum exhaustion currently in place.
Traditional Energy — XLE
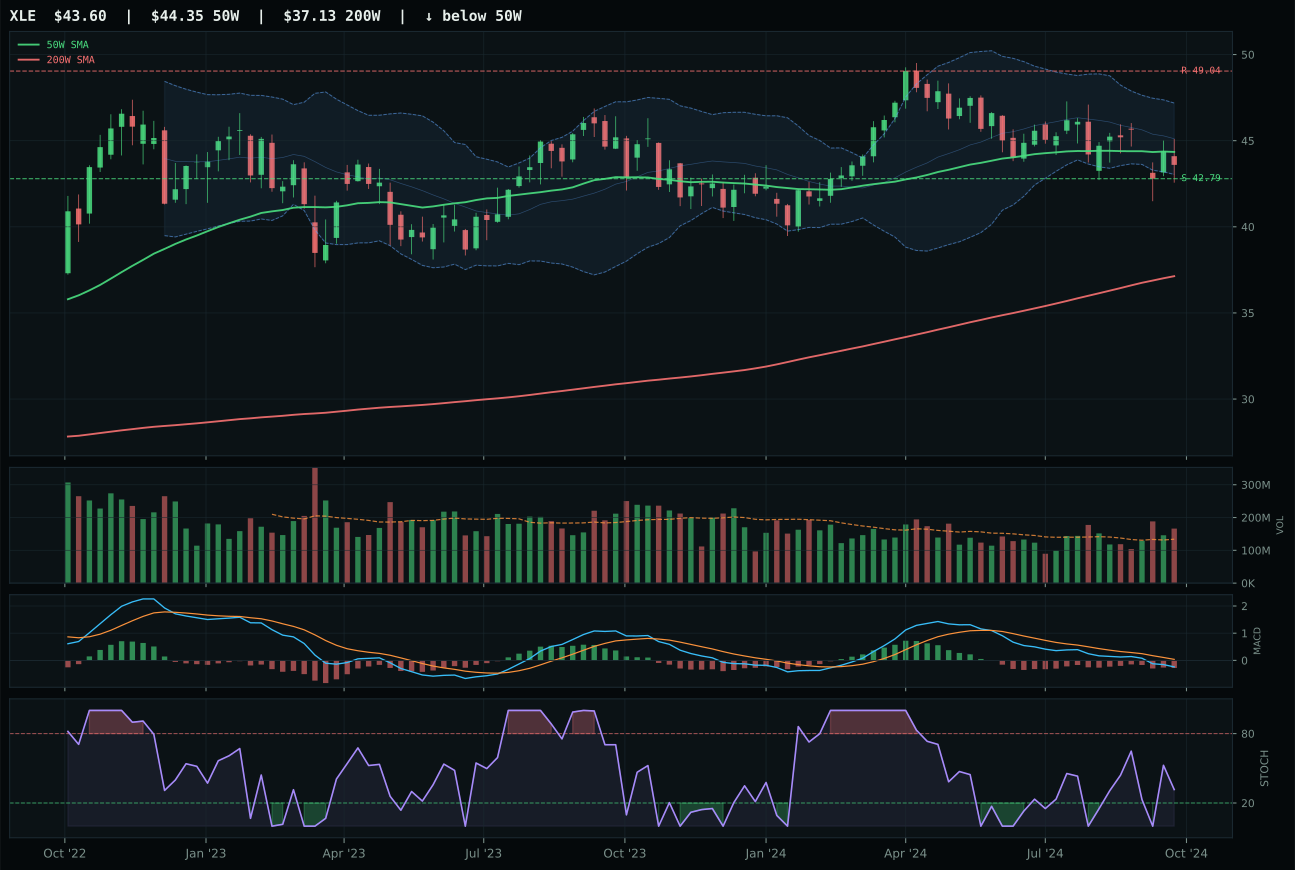
XLE has a pullback into support profile with -9.4% 13-week relative strength versus SPY.
A failed hold above support would weaken the setup.
Actionable but governed by invalidation levels.
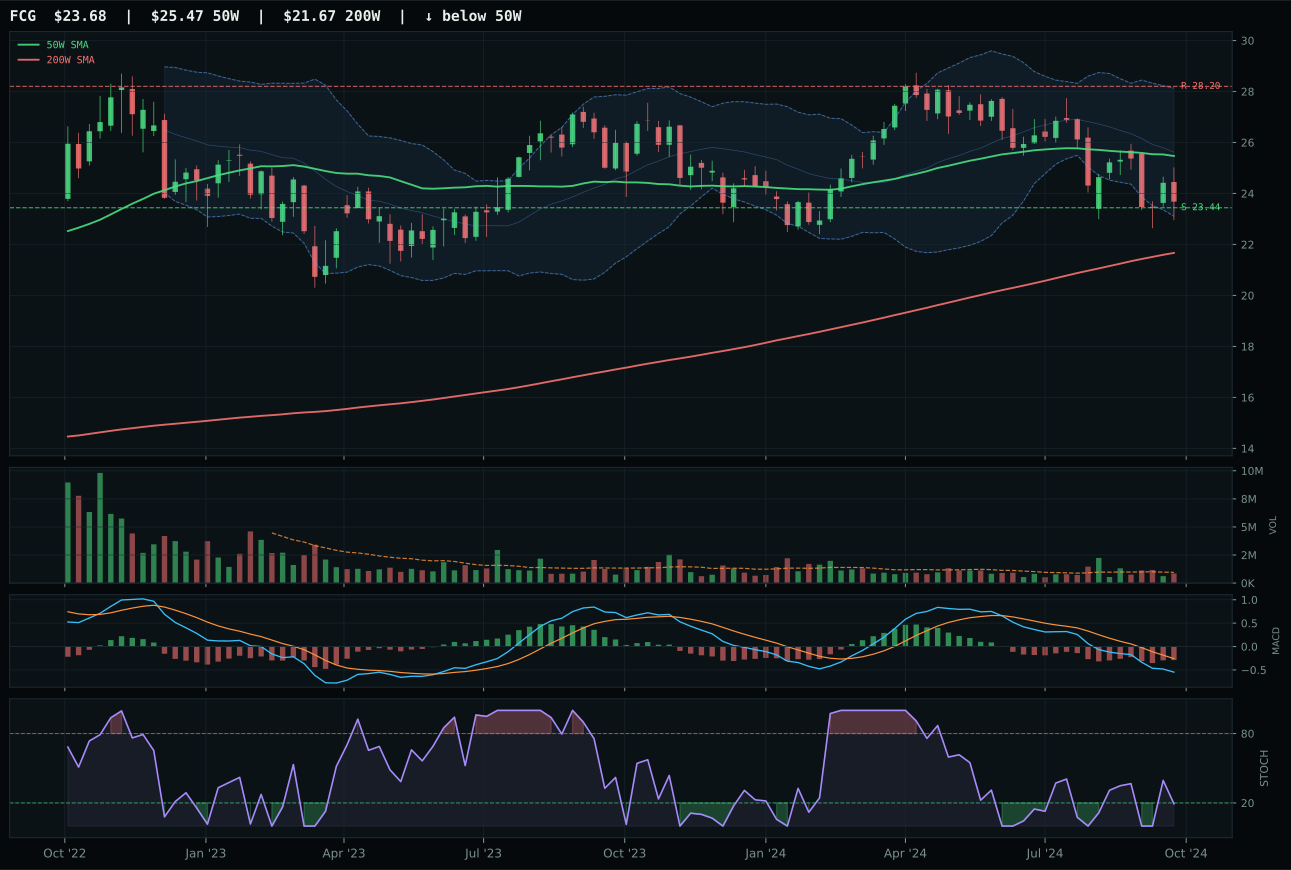
FCG has a pullback into support profile with -14.9% 13-week relative strength versus SPY.
A failed hold above support would weaken the setup.
Actionable but governed by invalidation levels.
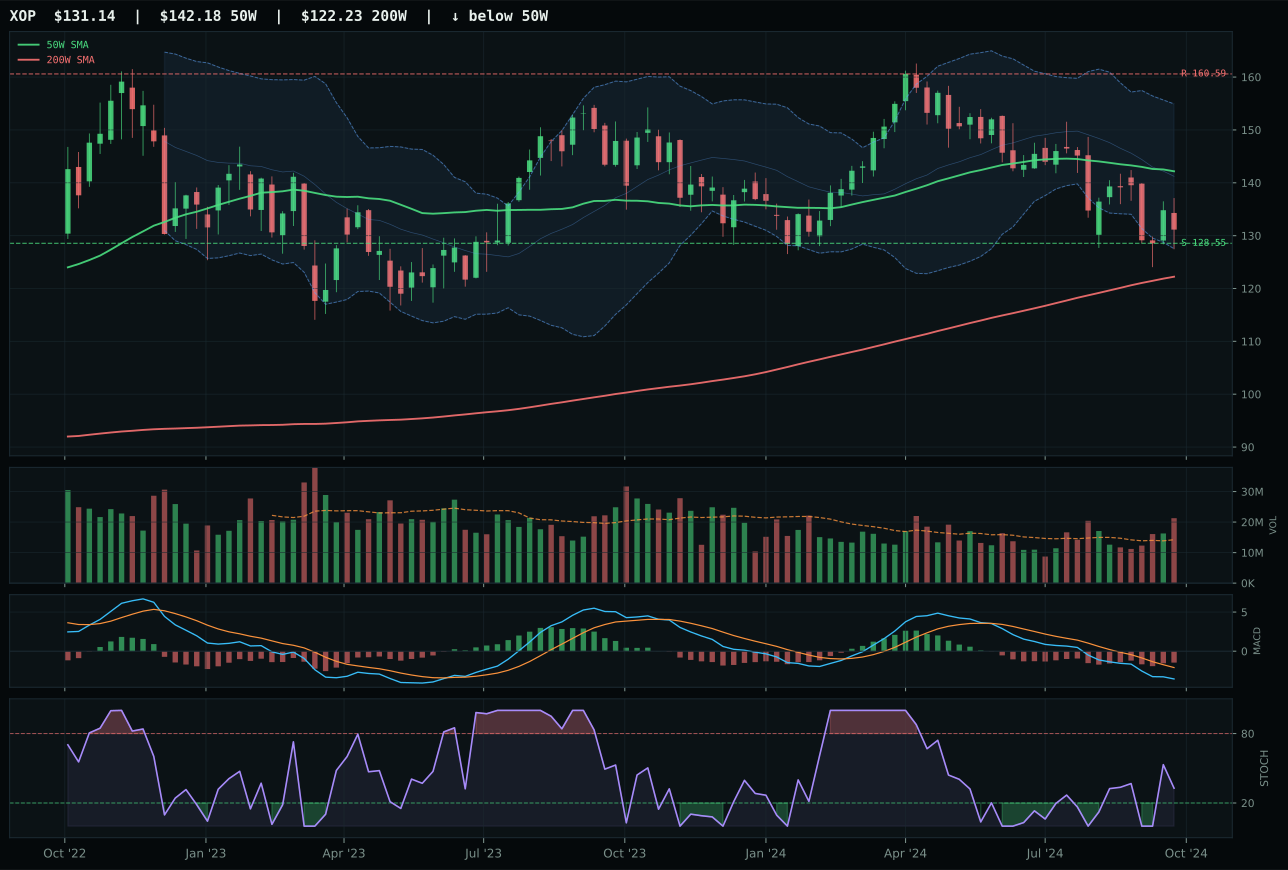
XOP has a pullback into support profile with -14.9% 13-week relative strength versus SPY.
A failed hold above support would weaken the setup.
Actionable but governed by invalidation levels.
XLE won the category but earned zero portfolio allocation, a result of catastrophic macro headwinds that override even the most favorable timing setup in the entire 10-category universe. XLE's timing score of 100.0/100 is the highest timing signal across all categories—price is just 1.6% below the 50W with stochastic RSI rising mid-zone from oversold and Fibonacci structure at near 52-week low, meaning the technical setup is textbook mean-reversion. However, XLE's trend score is a dire 43.0/100 because the 13-week return is -4.3%, the 26-week return is -7.6%, and SPY-relative strength is -9.4%, indicating that energy has been in absolute freefall despite the technical reset signal. The volume at 1.24x is above-average participation, but this is buyers testing support, not confirmation of accumulation into a new uptrend. Over PICK's competitor FCG, XLE's 14.4-point advantage came solely from better stochastic positioning (rising mid-zone vs. oversold turn-up) and marginally better category-relative strength (5.5% vs. 0.0%), but both energy ETFs share the same catastrophic momentum picture.
Traditional Energy received zero allocation this week, ranked outside the eligible portfolio (9th or 10th among categories), despite its perfect timing score because the macro regime is actively destroying the category. Disinflation pressure is active and cutting sharply against energy (-10), reinforced by general disinflation macro state (-10) and credit stress (-7). These three macro headwinds combine to deliver a category-level macro fit of just 23.0/100, the lowest reading in the entire portfolio, overwhelmingly worse than even Agriculture & Livestock (45.0) or AI (27.0). The real asset sponsorship descriptor is active (+7), but it is entirely insufficient to counter the disinflation narrative in which falling commodity prices are structurally advantageous for consumers and margin-positive for refiners but devastating for producers and explorers. XLE's technical evidence of 30.0/100 is weak, and even if it were stronger, a 0% allocation reflects the portfolio's view that no amount of technical support-bounce potential justifies capital commitment when the macro regime is this adversarial. For Traditional Energy to earn even a 5% slot, the disinflation pressure descriptor would need to flip dormant and credit stress would need to ease, signaling a shift to inflation or stagflation concerns—neither of which is currently active in the regime assessment.