
2024-09-20
Informational purposes only. The content in this report, including allocations, analysis, and commentary, is provided solely for informational and educational purposes. It does not constitute financial advice, investment advice, trading advice, or any other type of advice. Past performance does not guarantee future results. Always conduct your own research and consult a qualified financial professional before making investment decisions.
Weekly Allocation
| Ticker | Category | Weight | Role |
|---|---|---|---|
| FBTC | 50% | Overlay | |
| XLU | Utilities & Infrastructure | 10% | Top-2 (10%) |
| GLD | Precious Metals | 10% | Top-2 (10%) |
| ITA | Defense & Aerospace | 5% | Tier-2 (5%) |
| IGV | Technology | 5% | Tier-2 (5%) |
| COPX | Industrial Metals | 5% | Tier-2 (5%) |
| NLR | Nuclear Energy | 5% | Tier-2 (5%) |
| AIQ | AI | 5% | Tier-2 (5%) |
| INDA | Emerging Markets | 5% | Tier-2 (5%) |
Trade Instructions — Monday Open
Sell the tranche from 2024-08-23 (completing its 4-week hold). Buy the new tranche. Instructions show net portfolio changes — same-asset positions cancel, weight changes show the delta.
| Action | Ticker | Instruction |
|---|---|---|
| SELL | XAR | Sell 33% of XAR position (reduce 3.75% → 2.50%) |
| SELL | CIBR | Sell 50% of CIBR position (reduce 2.50% → 1.25%) |
| SELL | MOO | Sell 50% of MOO position (reduce 2.50% → 1.25%) |
| SELL | XLE | Sell 33% of XLE position (reduce 3.75% → 2.50%) |
| SELL | BOTZ | Sell 50% of BOTZ position (reduce 2.50% → 1.25%) |
| BUY | INDA | Buy INDA — 20.00% of freed cash (adds 1.25% to portfolio) |
| BUY | IGV | Buy IGV — 20.00% of freed cash (adds 1.25% to portfolio) |
| BUY | AIQ | Buy AIQ — 20.00% of freed cash (adds 1.25% to portfolio) |
| BUY | ITA | Buy ITA — 20.00% of freed cash (adds 1.25% to portfolio) |
| BUY | COPX | Buy COPX — 20.00% of freed cash (adds 1.25% to portfolio) |
Current Portfolio After Trade
Combined holdings across all 4 active tranches. Each tranche is 25% of the portfolio.
| Ticker | % of Portfolio | Weight Bar |
|---|---|---|
| FBTC | 50.00% | |
| GLD | 10.00% | |
| XLU | 7.50% | |
| NLR | 3.75% | |
| IGV | 3.75% | |
| XAR | 2.50% | |
| XLE | 2.50% | |
| PAVE | 2.50% | |
| INDA | 2.50% | |
| AIQ | 2.50% | |
| ITA | 2.50% | |
| CIBR | 1.25% | |
| MOO | 1.25% | |
| BOTZ | 1.25% | |
| SMH | 1.25% | |
| URA | 1.25% | |
| IEMG | 1.25% | |
| WEAT | 1.25% | |
| COPX | 1.25% |
Macro Regime — Disinflation
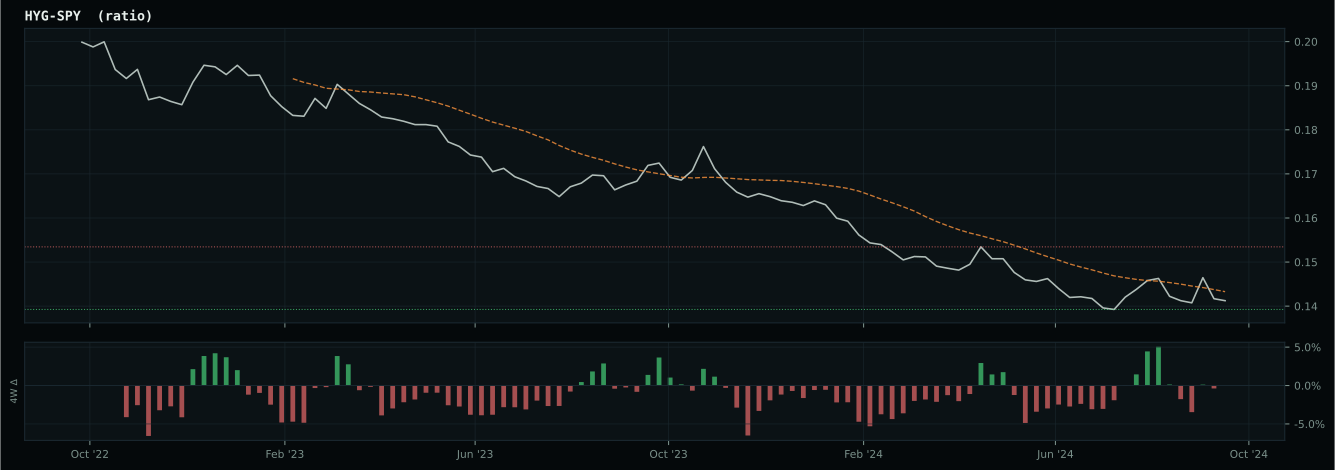
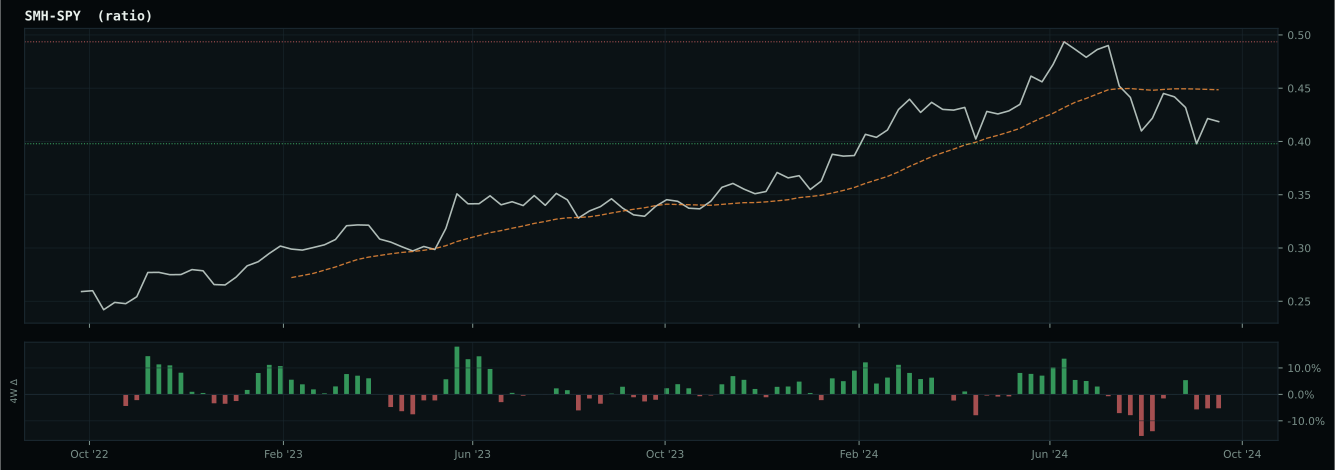
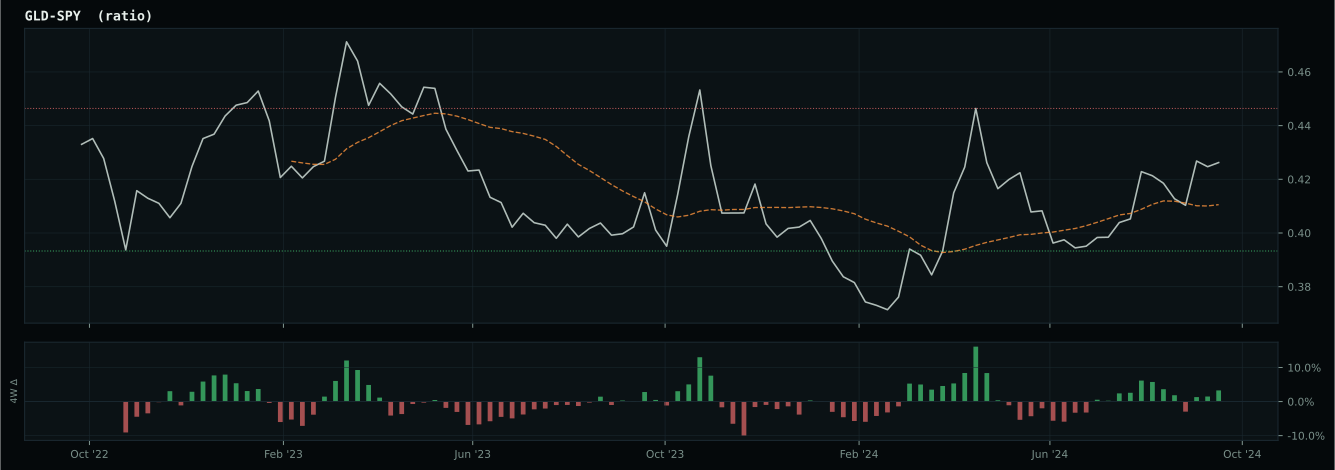
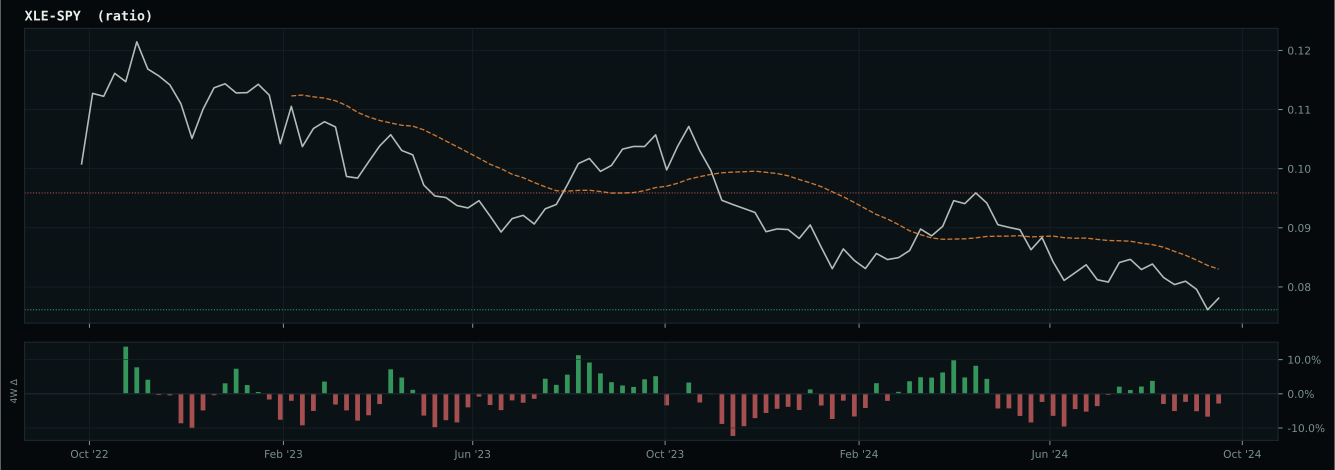
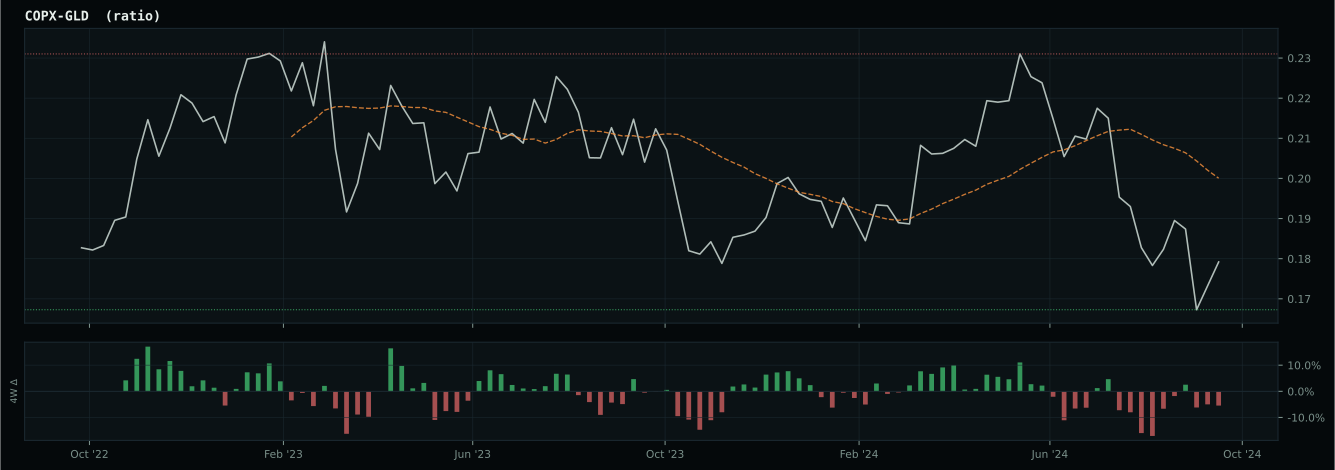
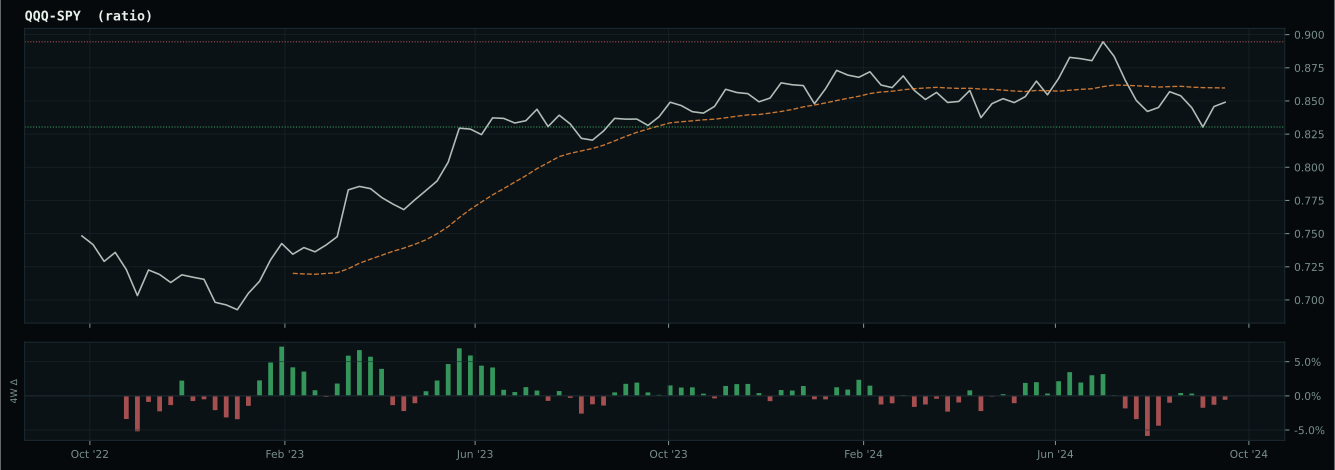
growth data is not confirming the weak market-implied risk appetite signal
Macro Evidence Charts
Market-implied signals behind the macro regime scores. Each ratio compares two assets; the direction and slope of the ratio is what the macro engine reads.
Crypto Regime — TrendBTC
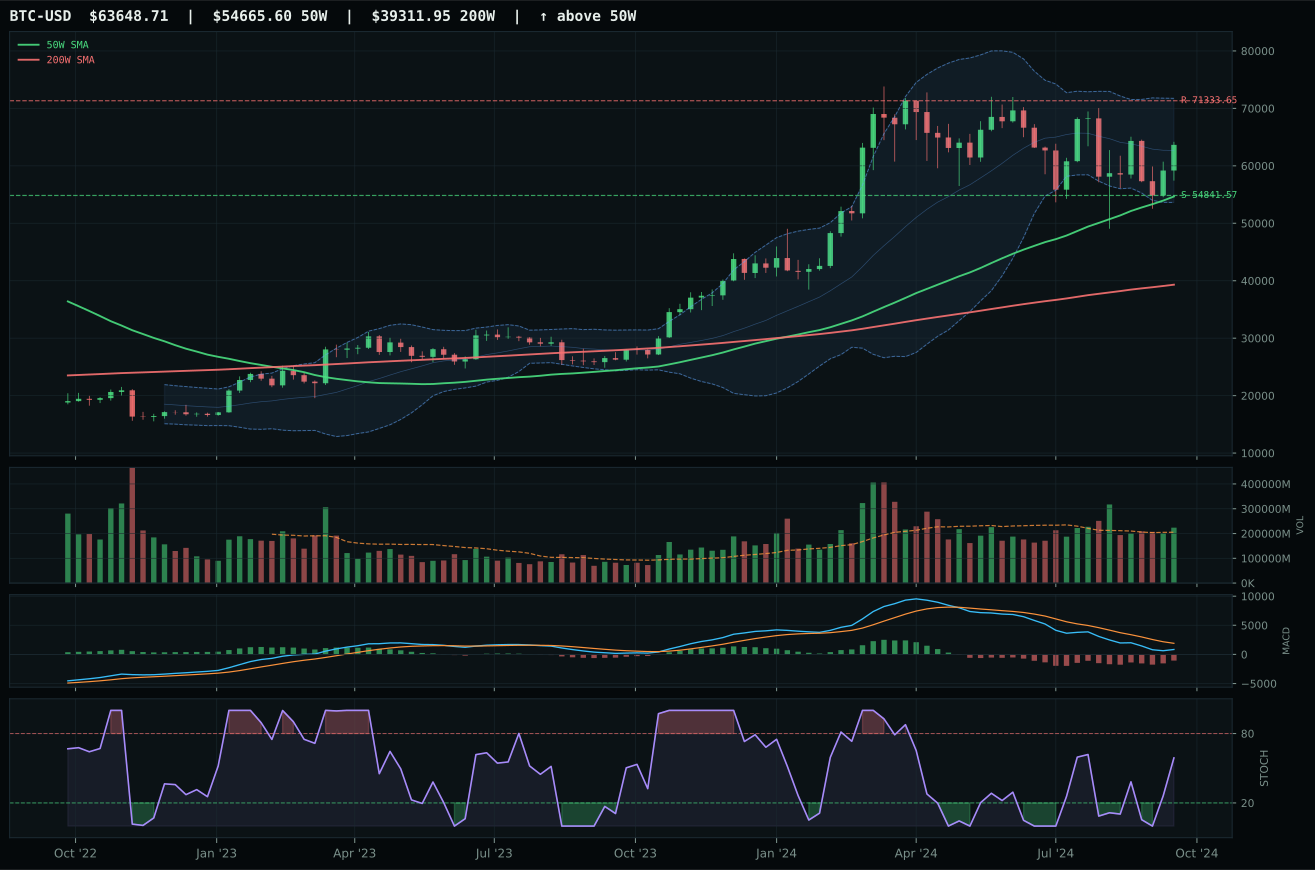
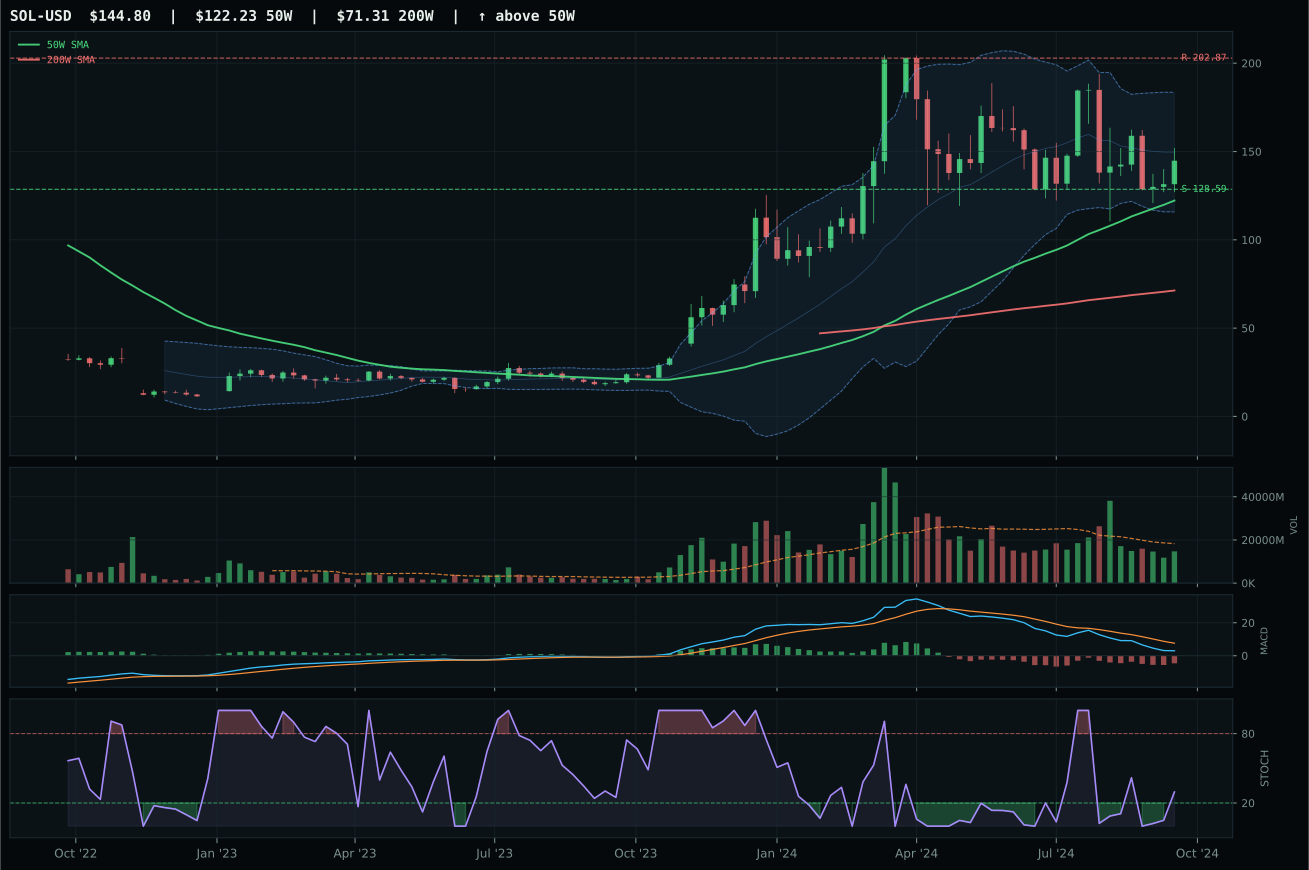
ValueBTC not armed: BTC has not made the first post-breakdown touch of the 200W buy zone after losing the 50W
TrendBTC confirmed: 2 consecutive closes above rising/flat 50W SMA
one or more available conditions failed
Category Rankings
| Rank | Category | Winner | Score | Alloc | 4W Ret | Peers (4W) |
|---|---|---|---|---|---|---|
| 1 | Utilities & Infrastructure | XLU | 85.1 | 20% | +2.64% | IGF +1.7% · PAVE +4.7% |
| 2 | Precious Metals | GLD | 81.3 | 20% | +4.02% | GDX +7.9% · SLV +10.3% |
| 3 | Defense & Aerospace | ITA | 61.9 | 10% | +4.98% | XAR +5.6% · ROKT +4.6% |
| 4 | Technology | IGV | 57.1 | 10% | +2.61% | CIBR +4.6% · XLK +3.5% |
| 5 | Industrial Metals | COPX | 35.0 | 10% | +6.05% | PICK +4.8% · REMX +18.4% |
| 6 | Nuclear Energy | NLR | 32.8 | 10% | +20.52% | URA +23.8% · URNM +22.1% |
| 7 | AI | AIQ | 25.9 | 10% | +4.56% | BOTZ +3.1% · SMH +5.1% |
| 8 | Emerging Markets | INDA | 22.9 | 10% | -5.19% | ILF -1.0% · IEMG +2.9% |
| 9 | Agriculture & Livestock | MOO | 20.0 | 0% | -0.88% | VEGI +0.6% · WEAT -0.4% |
| 10 | Traditional Energy | XLE | 2.0 | 0% | +3.11% | XOP +1.5% · FCG -0.5% |
Utilities & Infrastructure — XLU
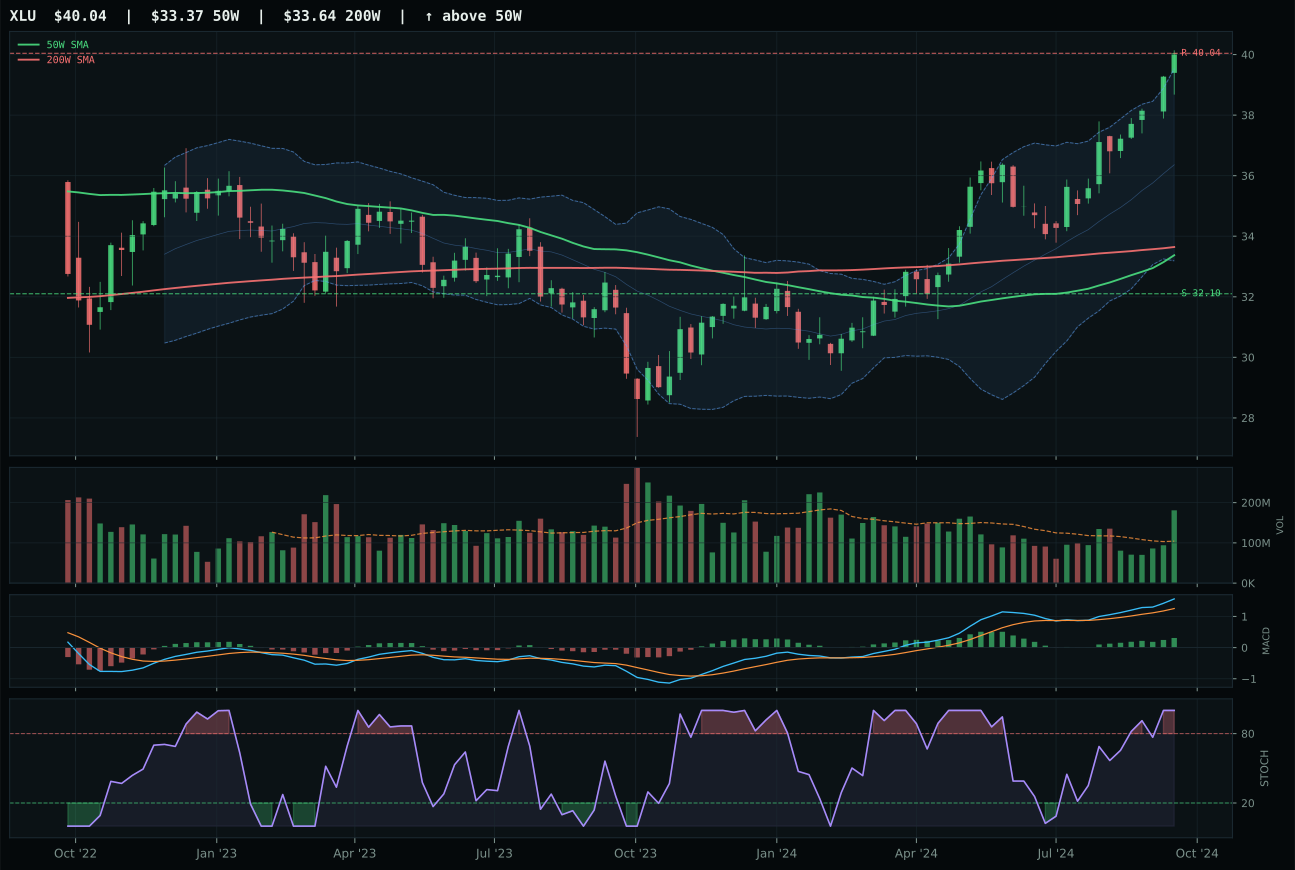
XLU has a vertical extension profile with 11.0% 13-week relative strength versus SPY.
A failed hold above support would weaken the setup.
Actionable but governed by invalidation levels.
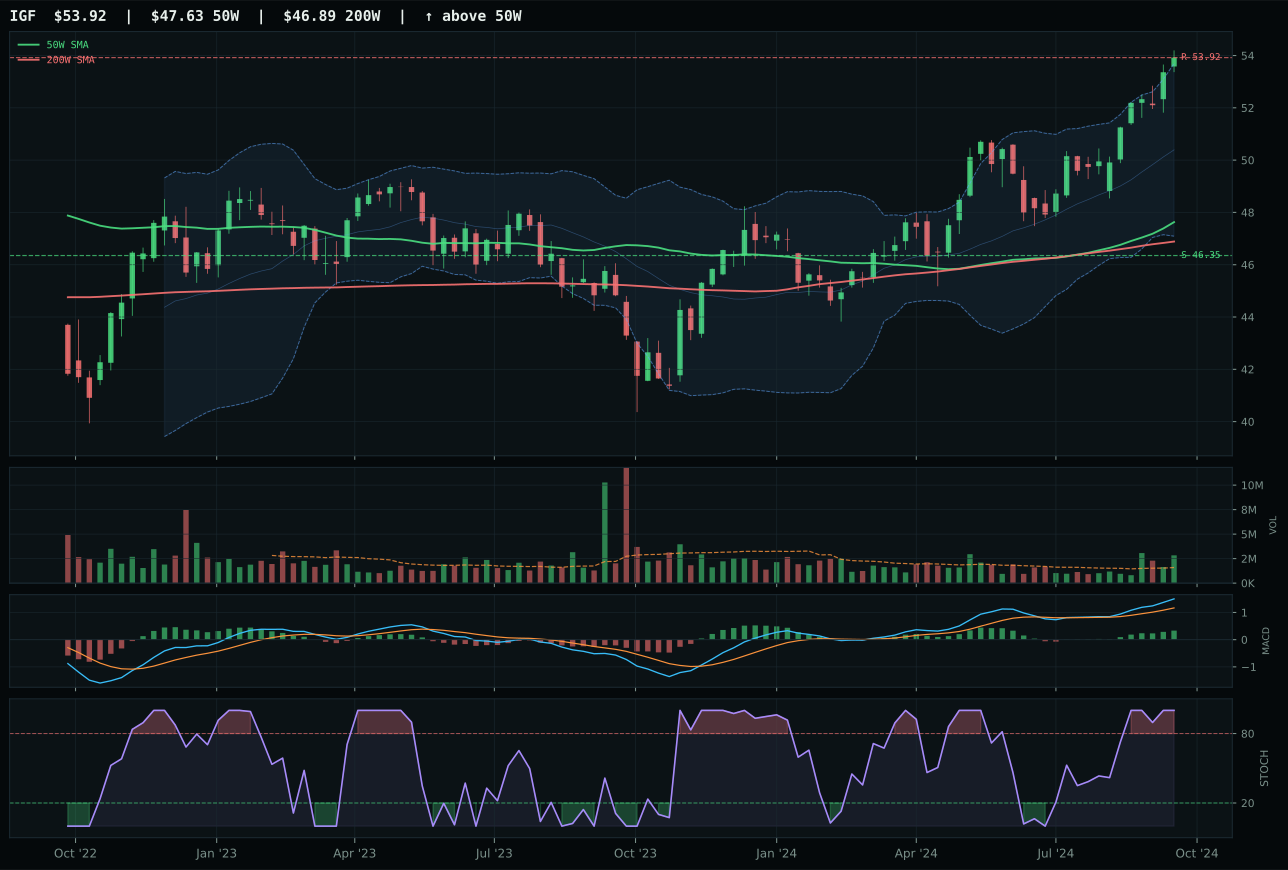
IGF has a neutral structure profile with 7.6% 13-week relative strength versus SPY.
A failed hold above support would weaken the setup.
Actionable but governed by invalidation levels.
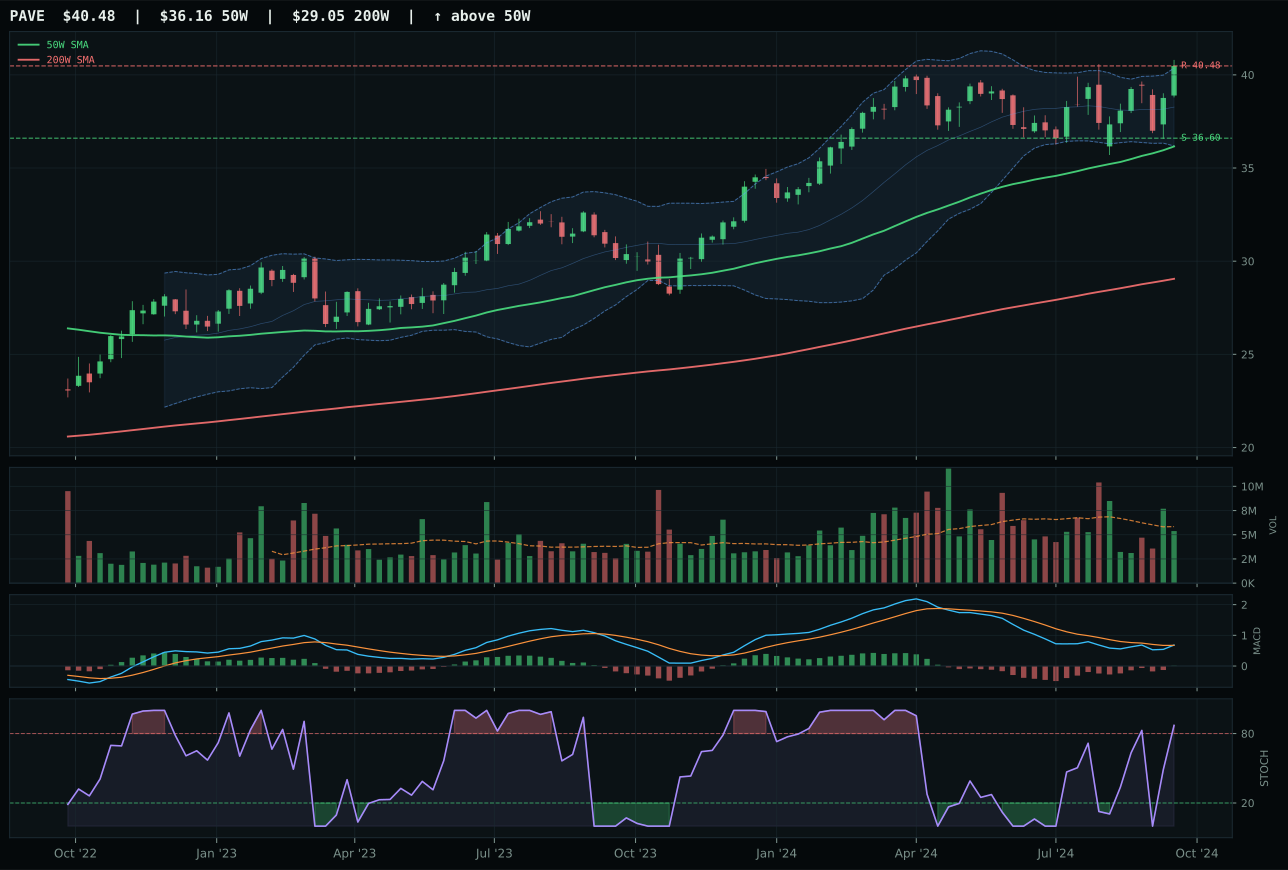
PAVE has a neutral structure profile with 3.8% 13-week relative strength versus SPY.
A failed hold above support would weaken the setup.
Actionable but governed by invalidation levels.
XLU takes the category by capturing the most powerful momentum confirmation in the entire portfolio at 100.0, driven by 15.4% 13-week return and 11.0% SPY outperformance. Both XLU and runner-up IGF show identical perfect trend (100.0) and overbought momentum (100.0), yet XLU's 3.4% category-relative strength versus IGF's 0.0% determines the leader. The critical divergence: XLU's vertical extension setup with 1.73x accumulation/confirmation volume validates that the 20.0% move above the 50-week is being sustained by institutional buyers, not front-runners covering shorts. IGF's neutral structure and lower volume (though still accumulating) offer less conviction in timing. MACD is bullish and improving for both; the 1.73x volume for XLU versus undefined for IGF tips the decision. This is the cleanest momentum case in the portfolio right now.
Utilities & Infrastructure earns 10% top-2 overweight allocation, justified by the highest combined category and macro fit scores: 85.1 category score plus 80.0 macro fit, driven by defensive rotation (+12), disinflation pressure (+6), and broad market bear support (+4). XLU's 100.0 momentum confirmation and 88.2% volume-price confirmation create a rare confluence of technical sponsorship. The 20.0% extension above the 50-week and 52.0 timing score reflect the entry cost, yet 1.73x volume accumulation at overbought momentum levels signals institutional conviction that the setup is sustainable. Regulated utility income and dividend stability are perfectly aligned with the current macro regime—risk appetite is damaged, credit is stressed, and real rates remain elevated. The deep Fibonacci zone near 0.786 (value retracement) paradoxically supports valuation despite the extension, because dividend yields remain attractive. Maintain the 10% weight; only reduce if volume collapses below 1.2x the 20-week average or if MACD rolls over from overbought.
Precious Metals — GLD
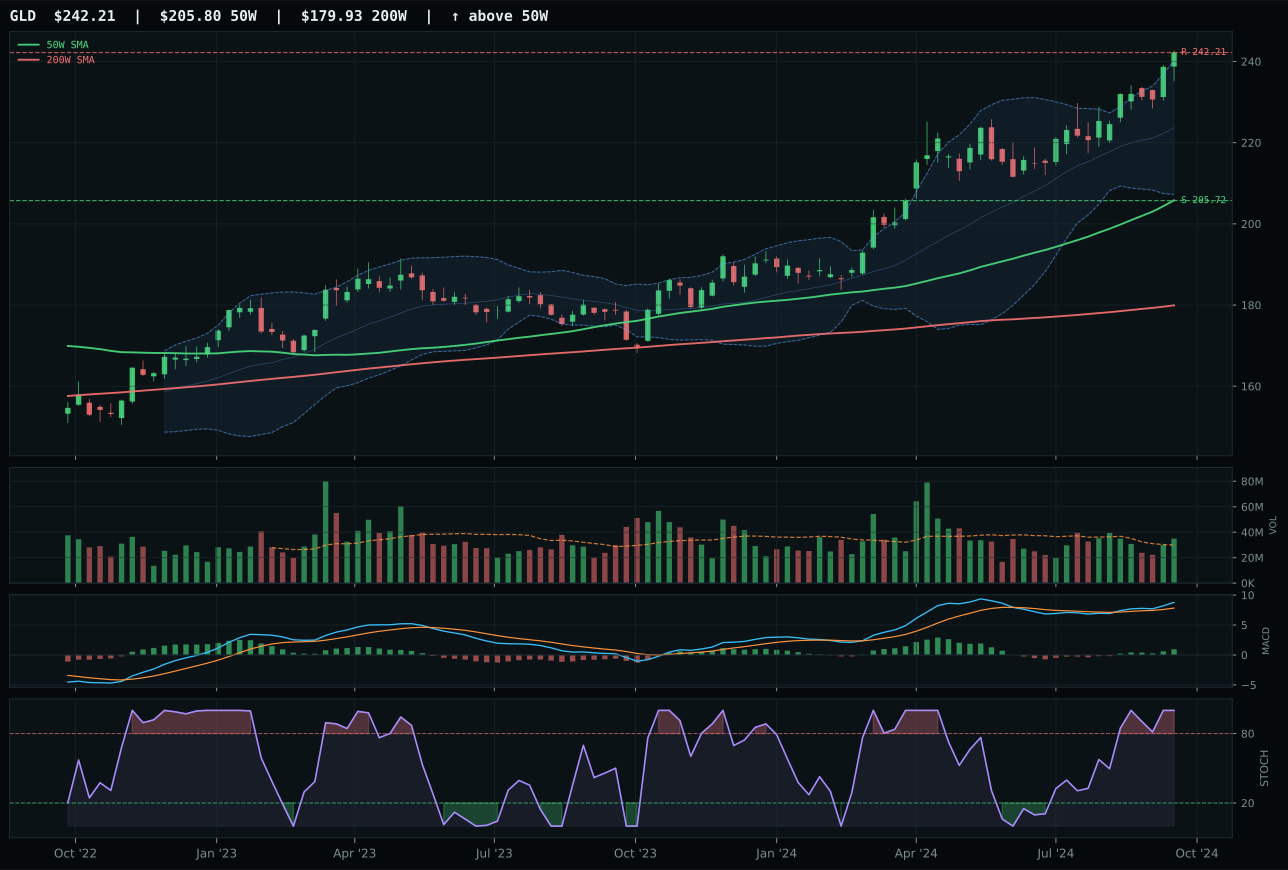
GLD has a vertical extension profile with 8.4% 13-week relative strength versus SPY.
A failed hold above support would weaken the setup.
Actionable but governed by invalidation levels.
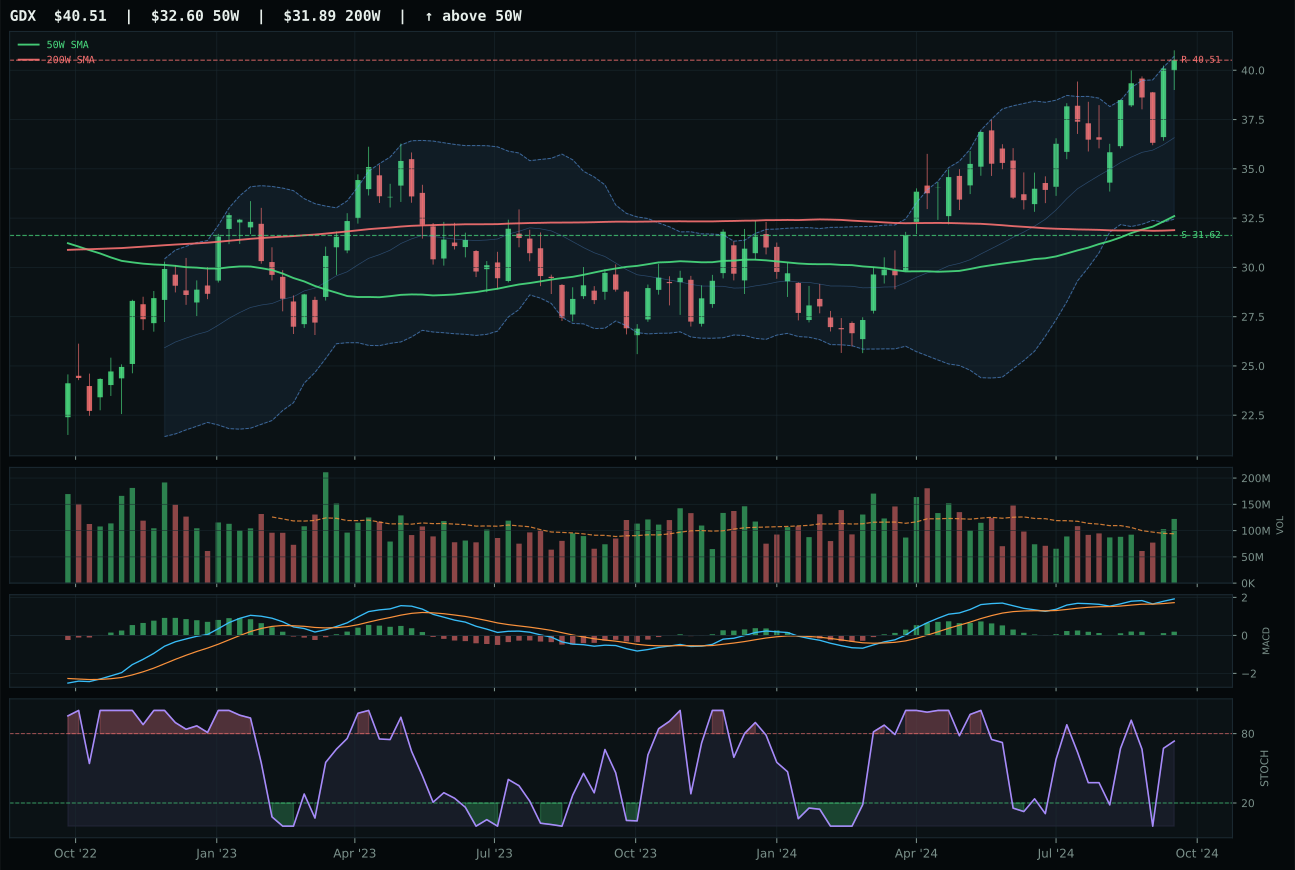
GDX has a vertical extension profile with 14.8% 13-week relative strength versus SPY.
A failed hold above support would weaken the setup.
Actionable but governed by invalidation levels.
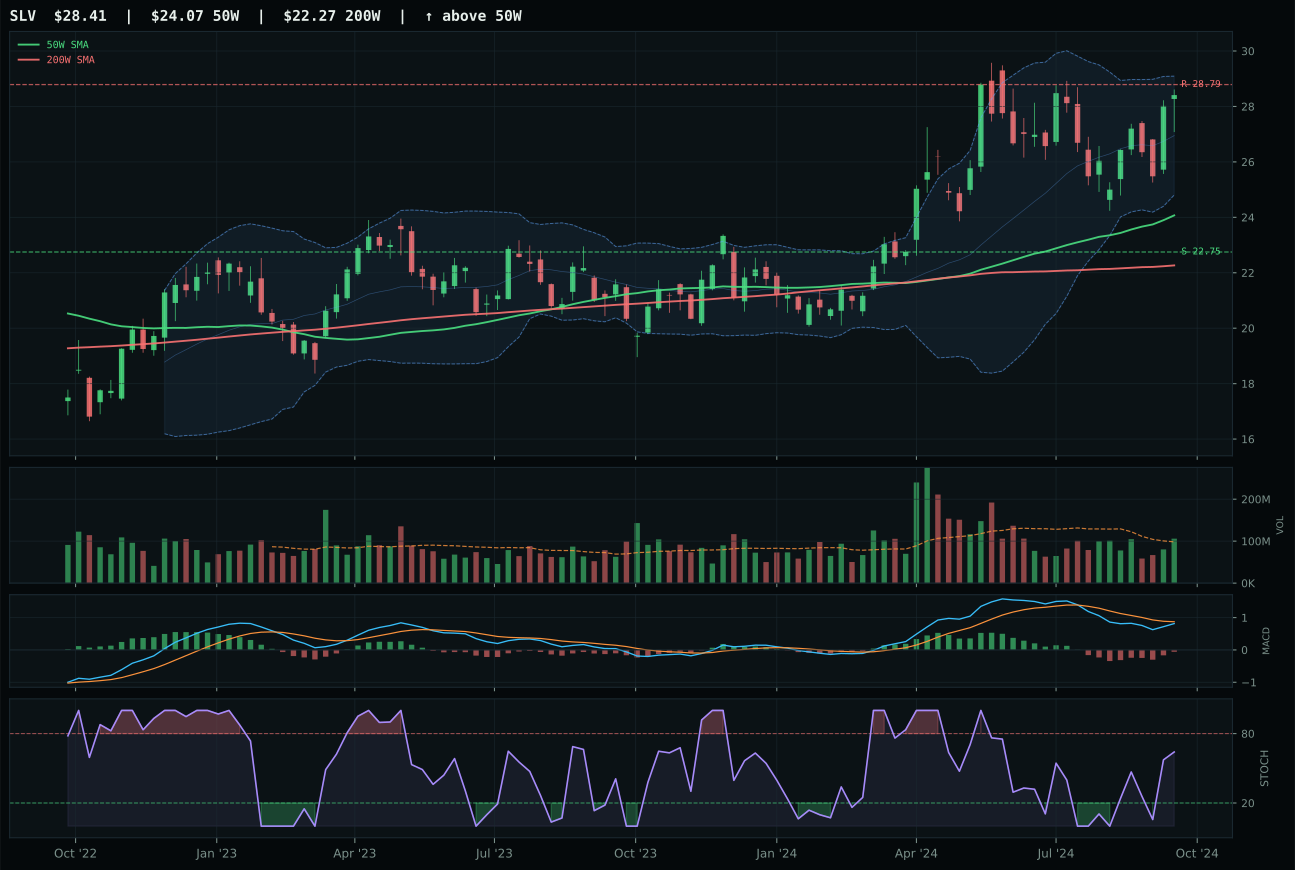
SLV has a vertical extension profile with 0.9% 13-week relative strength versus SPY.
A failed hold above support would weaken the setup.
Actionable but governed by invalidation levels.
GLD captures the category leadership with perfect trend (100.0) and monster momentum confirmation (99.7) driven by 12.8% 13-week return and 8.4% SPY outperformance, all reinforced by above-average volume accumulation at 1.17x the 20-week average. The 17.7% extension above the 50-week is the price of entry into the strongest monetary hedge in the portfolio, but MACD remains bullish and improving, and volume sponsorship confirms that institutional capital is still rotating into this name. GDX suffers from MACD flattening (vs improving for GLD) and a deeper 24.3% extension above the 50-week that stretches risk further, making GLD the safer relative choice despite both approaching resistance. The micro gap of 0.7 points between GLD and GDX reflects GLD's timing superiority and cleaner structure; this is as close as a top-2 decision gets.
Precious Metals earns 10% top-2 overweight allocation, justified by an 81.3 category score supported by three converging forces: perfect trend across all three basket members, a +14 monetary hedge bid that dominates the macro checklist, and 74.1% volume-price confirmation that validates institutional accumulation. Disinflation (+8) and defensive rotation (+6) compound the tailwind. GLD's 37.0 timing score reflects the 17.7% extension risk—this is an expensive entry—yet the momentum confirmation at 99.7 and 1.17x volume participation signal that the move is still being bought, not distributed. The category's 85.0 macro fit versus technology's 45.0 explains the allocation gap. Entry risk is real; traders should await a pullback toward 205.72 support or a MACD cross above zero before adding, but the existing 10% weight should hold because monetary hedge sponsorship outweighs entry cost in a disinflation regime with credit stress active.
Defense & Aerospace — ITA
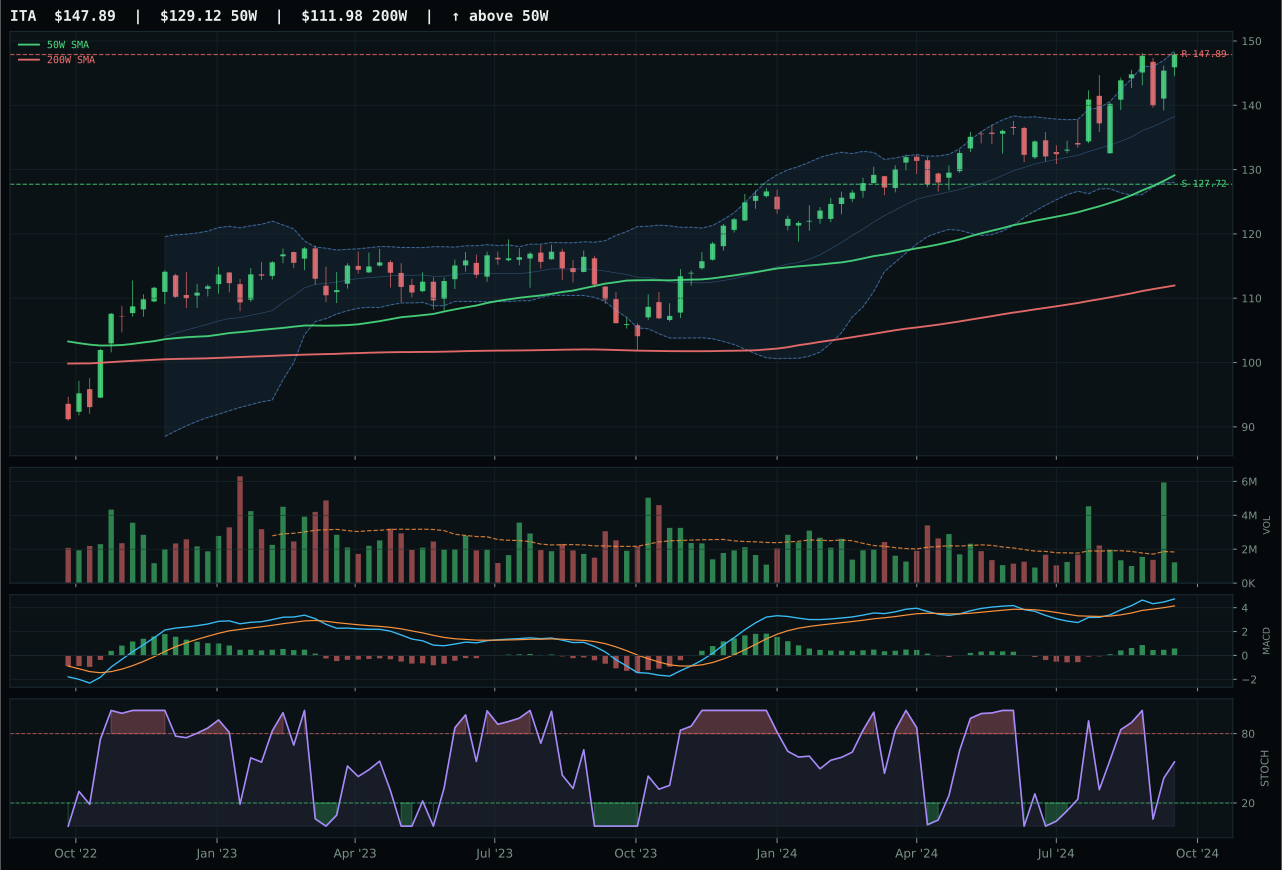
ITA has a neutral structure profile with 5.7% 13-week relative strength versus SPY.
A failed hold above support would weaken the setup.
Actionable but governed by invalidation levels.
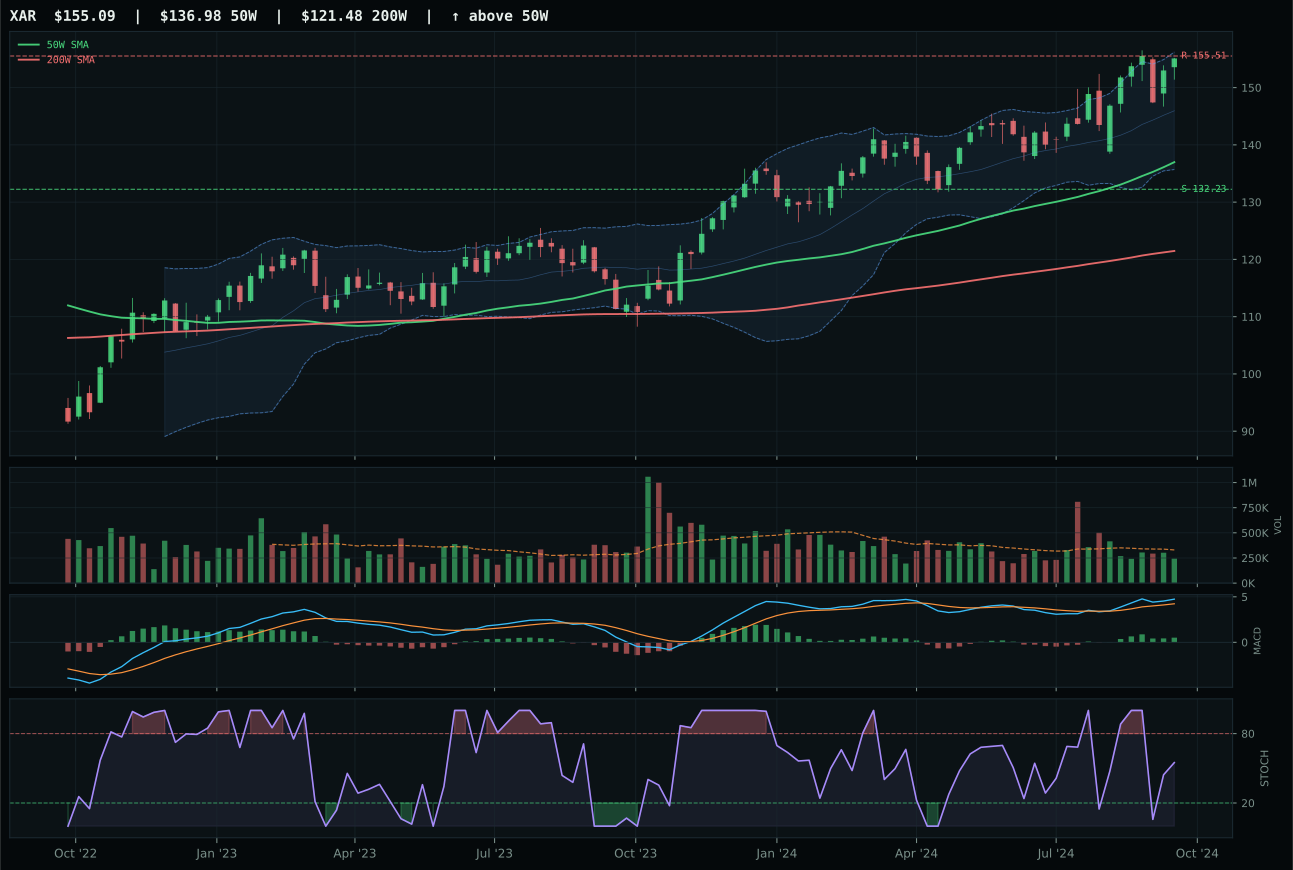
XAR has a neutral structure profile with 4.8% 13-week relative strength versus SPY.
A failed hold above support would weaken the setup.
Actionable but governed by invalidation levels.
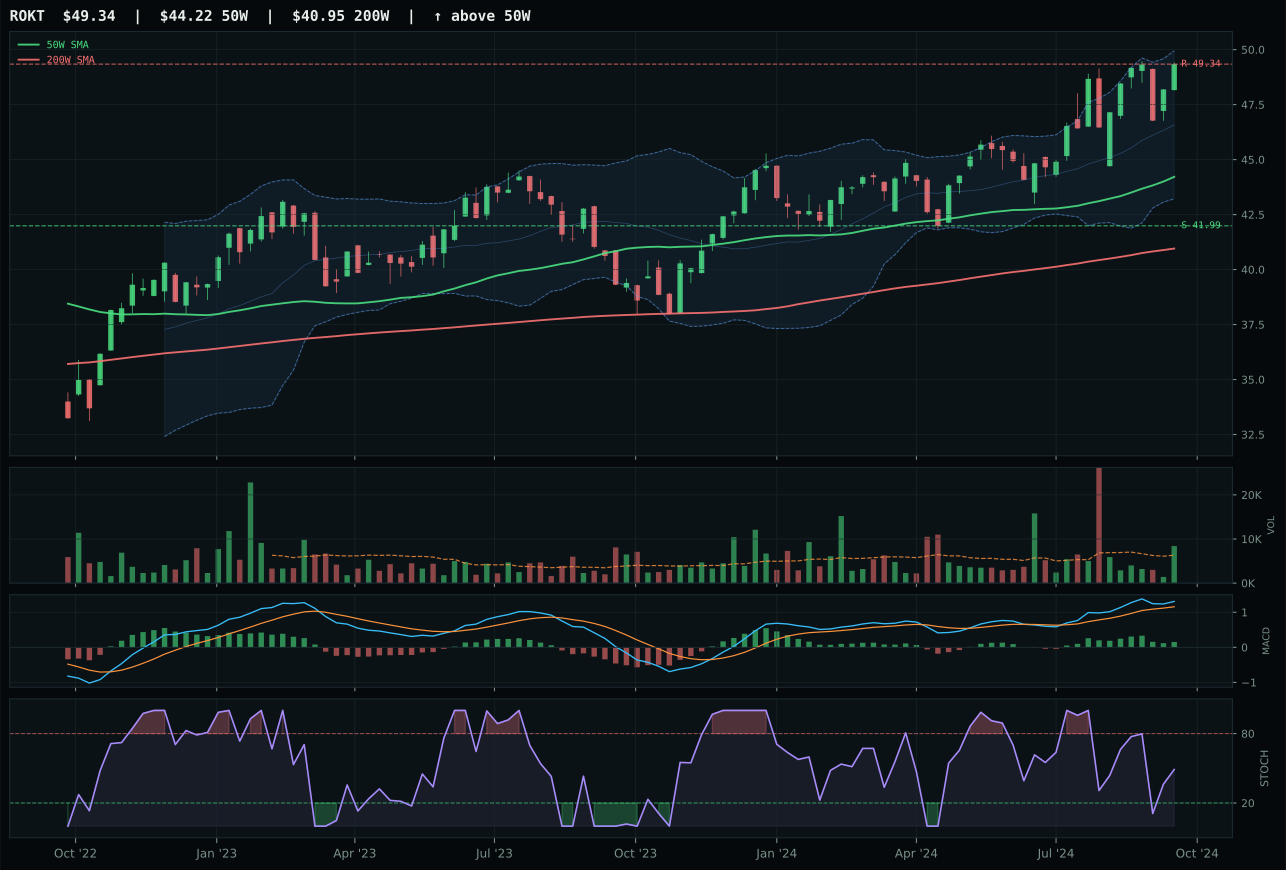
ROKT has a neutral structure profile with 5.7% 13-week relative strength versus SPY.
A failed hold above support would weaken the setup.
Tracked, but not top-2 eligible because: .
ITA claims the category edge with superior structure cleanliness (83.3 vs 77.6 for XAR) and better risk/reward (46.1 vs 37.3), both critical when the setup is mature and defensive rotation is priced in. Both charts display identical MACD (bullish but flattening) and stochastic RSI (falling/neutral), but ITA's cleaner compression bands and tighter support/resistance (127.72–147.89 vs 132.23–155.51) offer better technical discipline. The 10.1% 13-week return and 5.7% SPY outperformance are legitimate, yet ITA's thin participation (0.67x volume) and 14.5% extension above the 50-week flag a crowded trade. XAR stumbles on weaker momentum confirmation and an extra 0.9% lag in category-relative strength, pushing it into second place despite matching ITA's upside potential to resistance.
Defense & Aerospace earns 5% allocation as a tier-2 category with a solid 61.9 score, reflecting defensive rotation (+8) and broad market bear sponsorship (+6) that support the macro thesis. Liquidity stress (-4) presents only minor headwinds in a disinflation regime. ITA's 100.0 trend score on price above both moving averages and 5.7% SPY outperformance provide legitimate technical grounding, yet the 62.0 timing score warns of late-stage entry risk with stochastic RSI falling and MACD flattening. The category holds its allocation slot because defensive themes remain durable through policy uncertainty, but the vertical extension and thin volume suggest that fresh capital should await a pullback to the 50-week (127.72) before adding exposure. Persistence would need to improve from 69.3 to justify moving this above tier-2.
Technology — IGV
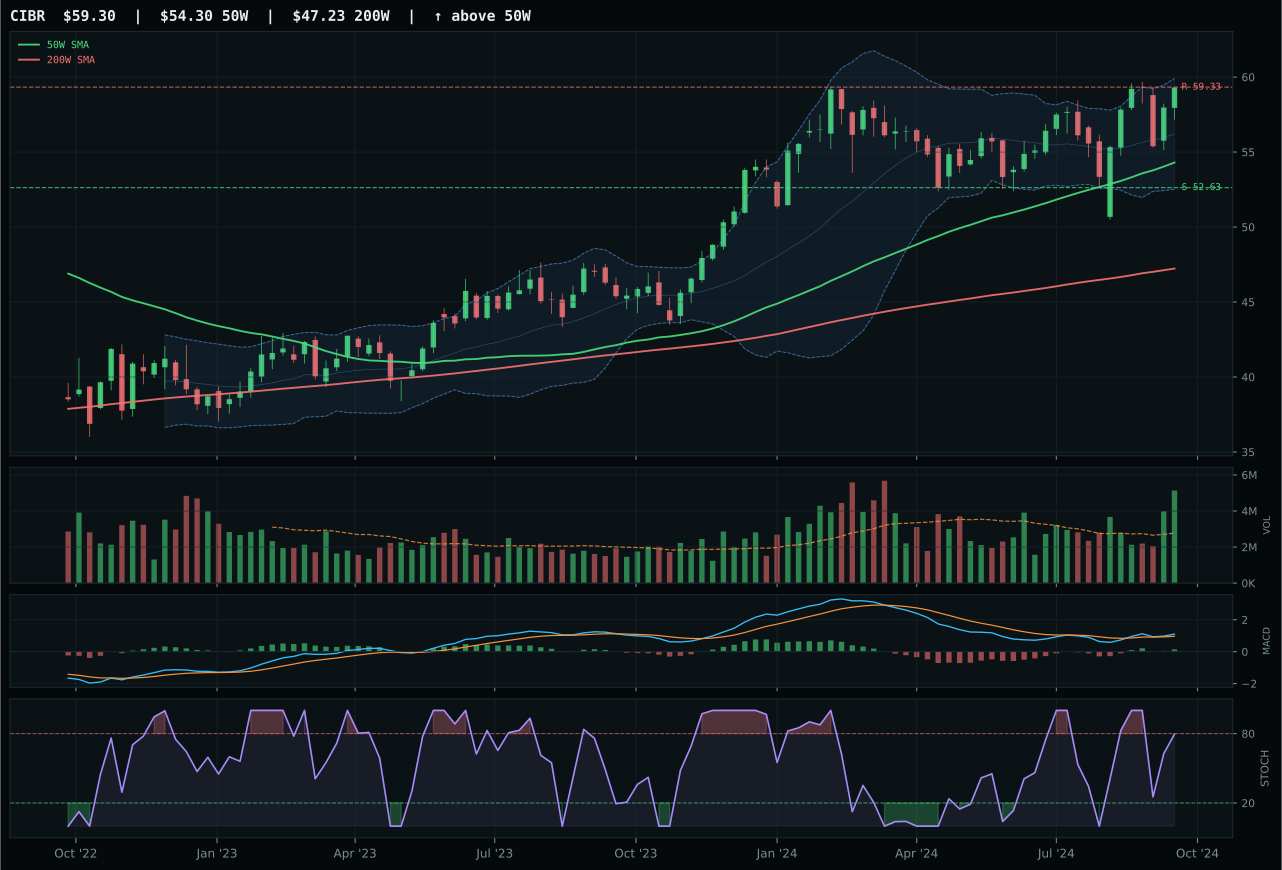
CIBR has a neutral structure profile with 3.2% 13-week relative strength versus SPY.
A failed hold above support would weaken the setup.
Actionable but governed by invalidation levels.
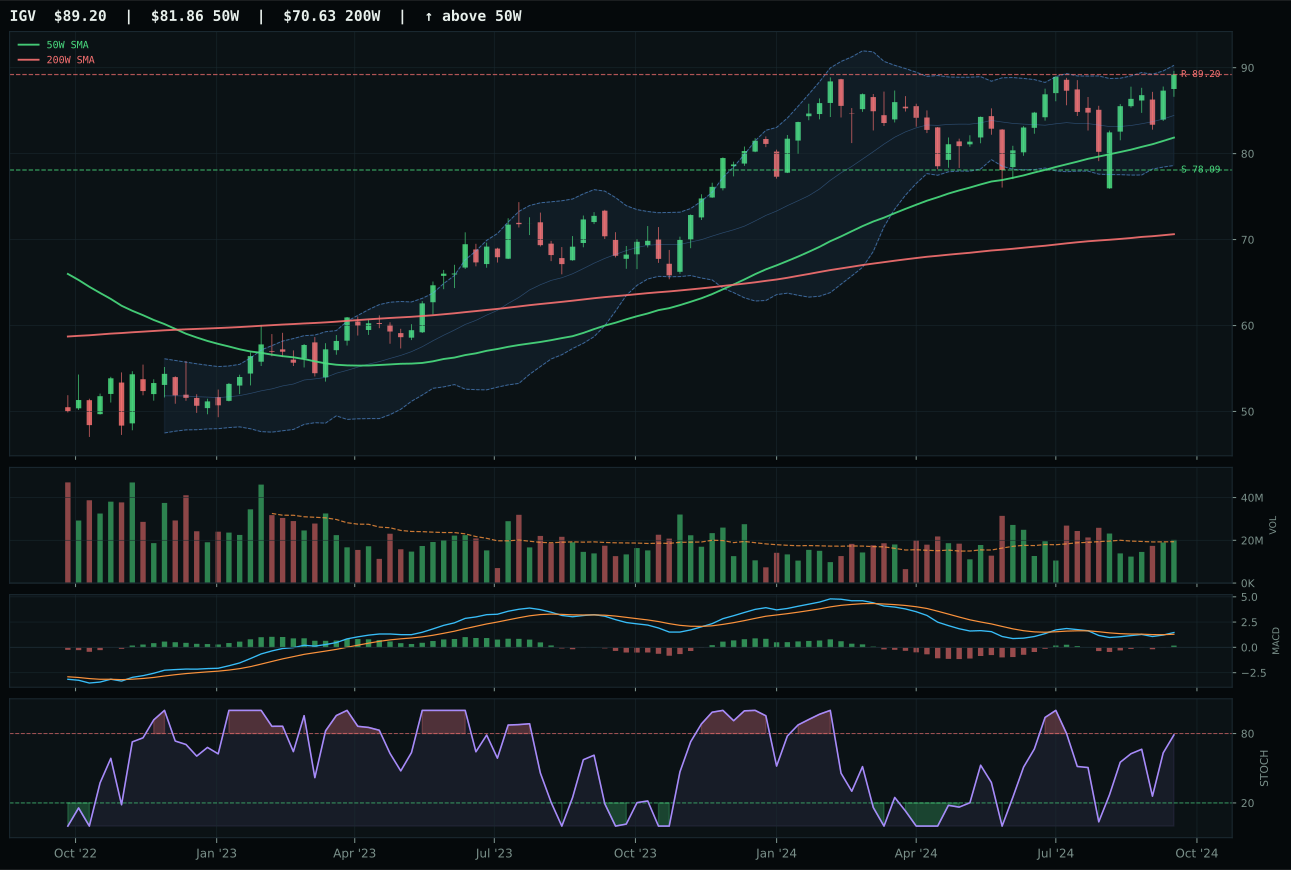
IGV has a neutral structure profile with 0.9% 13-week relative strength versus SPY.
A failed hold above support would weaken the setup.
Actionable but governed by invalidation levels.
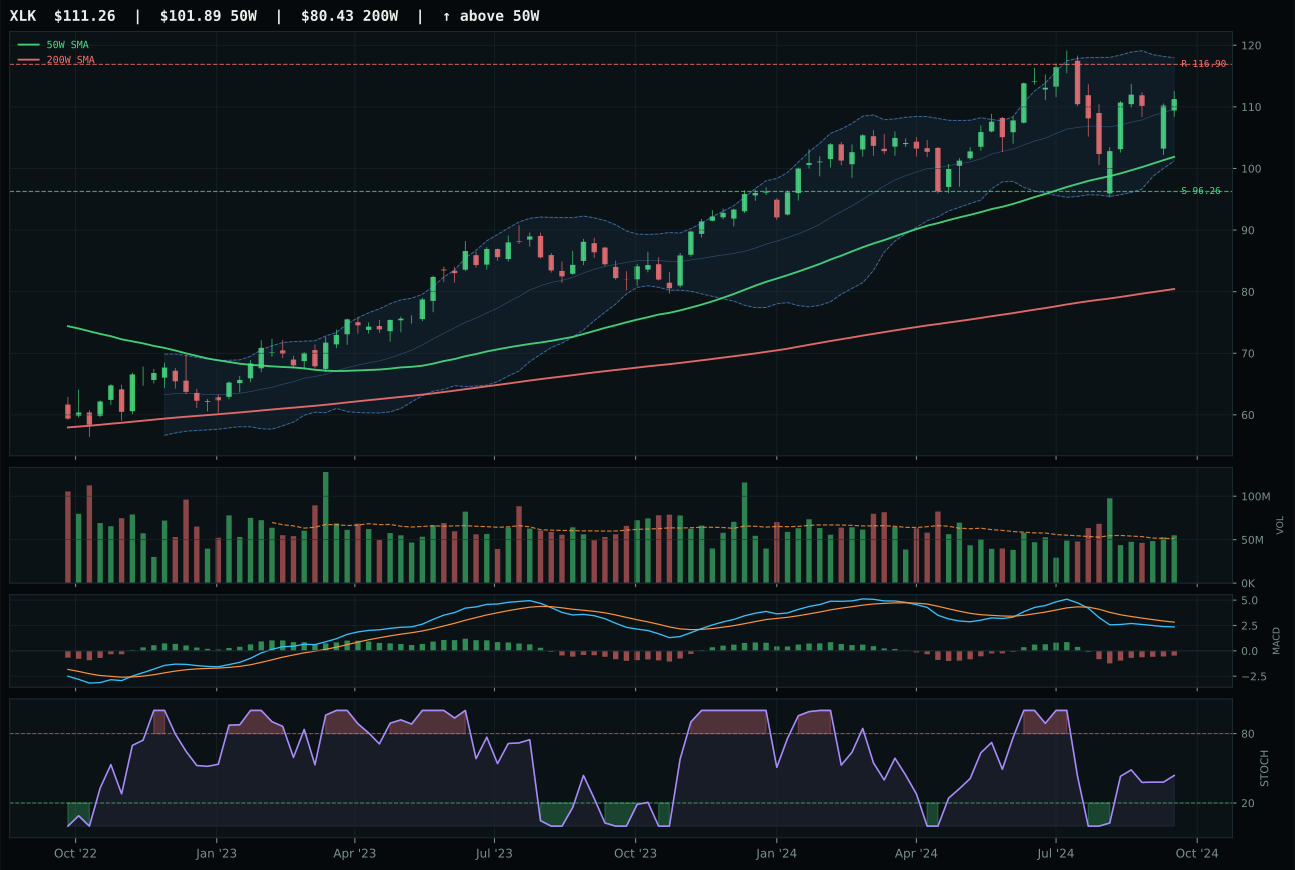
XLK has a neutral structure profile with -6.9% 13-week relative strength versus SPY.
A failed hold above support would weaken the setup.
Actionable but governed by invalidation levels.
IGV wins the category by capturing better timing mechanics than CIBR despite trailing in absolute momentum. Price sits 9.0% above the 50-week moving average with a rising stochastic RSI at 0.79 mid-zone, while CIBR's stochastic has begun rolling over from overbought, signaling earlier exhaustion. IGV's MACD is bullish and improving while CIBR's has plateaued; that divergence matters when both charts are extended near the 52-week high. The 5.2% 13-week return trails CIBR's 7.6%, but IGV's superior risk/reward ratio (47.1 vs 42.1) and cleaner structure give it the edge—institutional buyers are validating this setup at a more defensible entry point. Enterprise software exposure carries better timing than pure cybersecurity when both lack upside to resistance.
Technology receives 5% allocation as a tier-2 category, ranked outside the top two despite a 57.1 final score. Disinflation as the macro regime provides tailwind for duration-sensitive growth, yet three active headwinds—liquidity stress at -10, credit stress at -7, and the category's weak 45.0 macro fit score—offset the technical case. IGV's neutral structure and rising stochastic RSI suggest room for expansion if support at 78.09 holds, but the category cannot justify higher weight while Precious Metals and Utilities & Infrastructure score 81.3 and 85.1 respectively on combined technical strength and macro sponsorship. A meaningful retest of the 50-week with institutional accumulation confirmation would be required to push Technology into top-2 consideration.
Industrial Metals — COPX
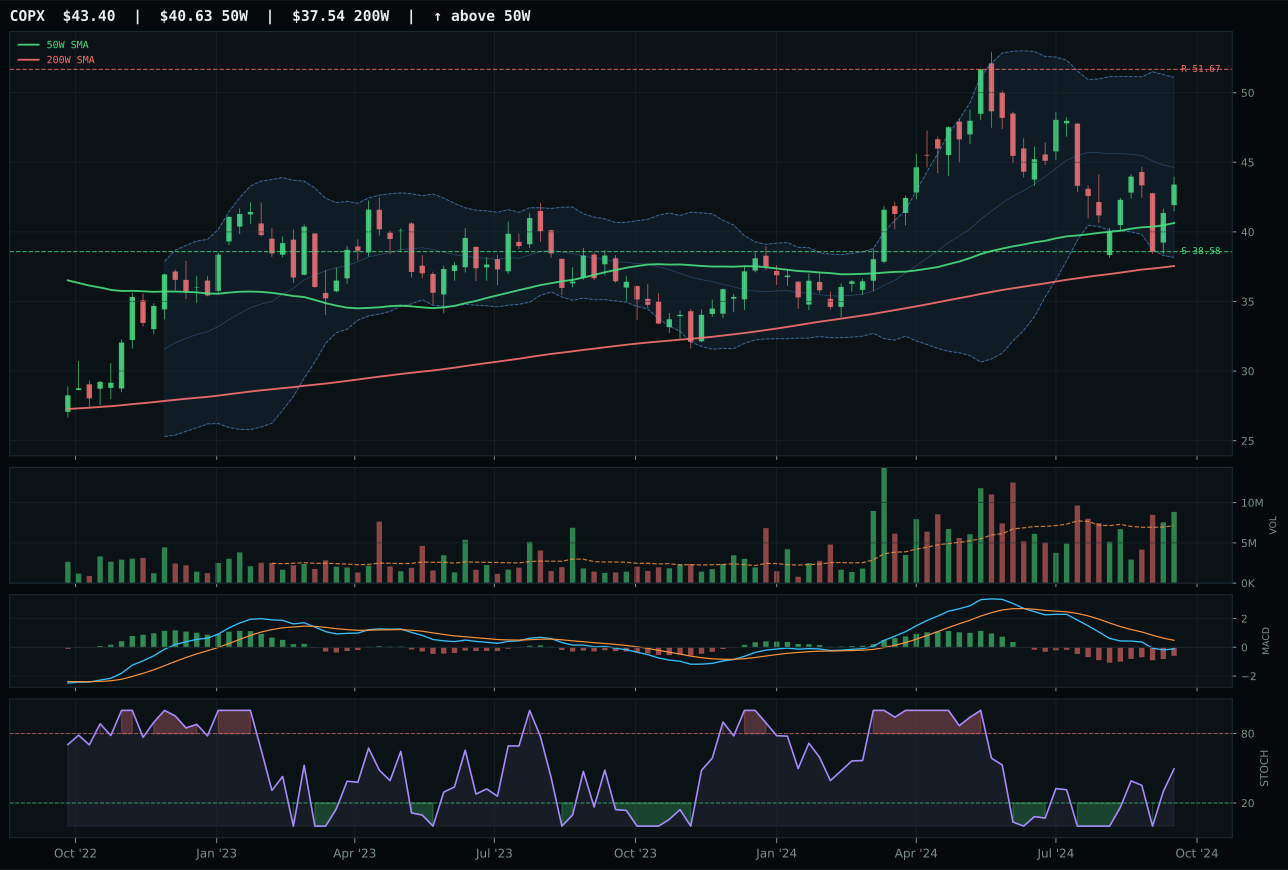
COPX has a neutral structure profile with -8.4% 13-week relative strength versus SPY.
A failed hold above support would weaken the setup.
Actionable but governed by invalidation levels.
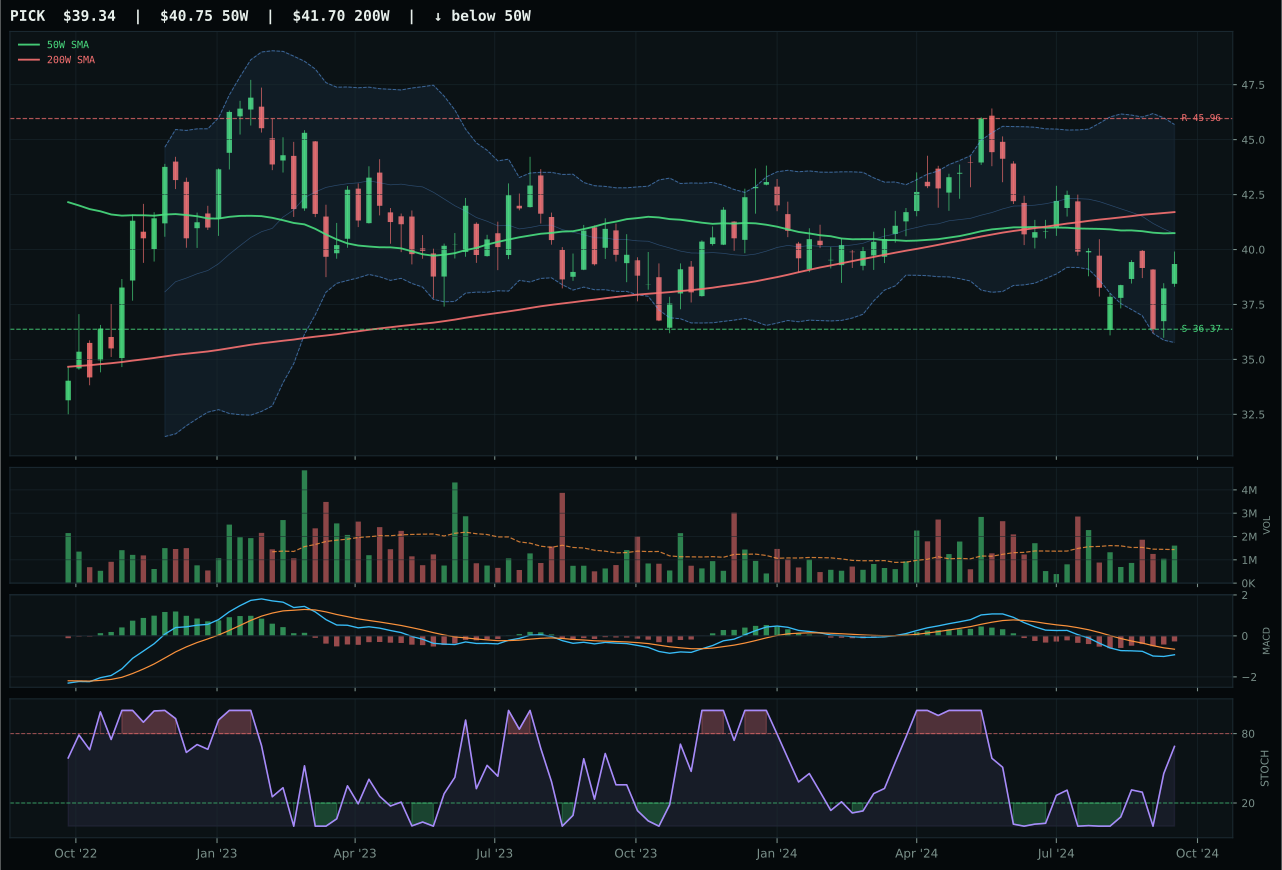
PICK has a neutral structure profile with -7.9% 13-week relative strength versus SPY.
Extension and support failure are the main tactical risks.
Tracked, but not top-2 eligible because: structurally broken.
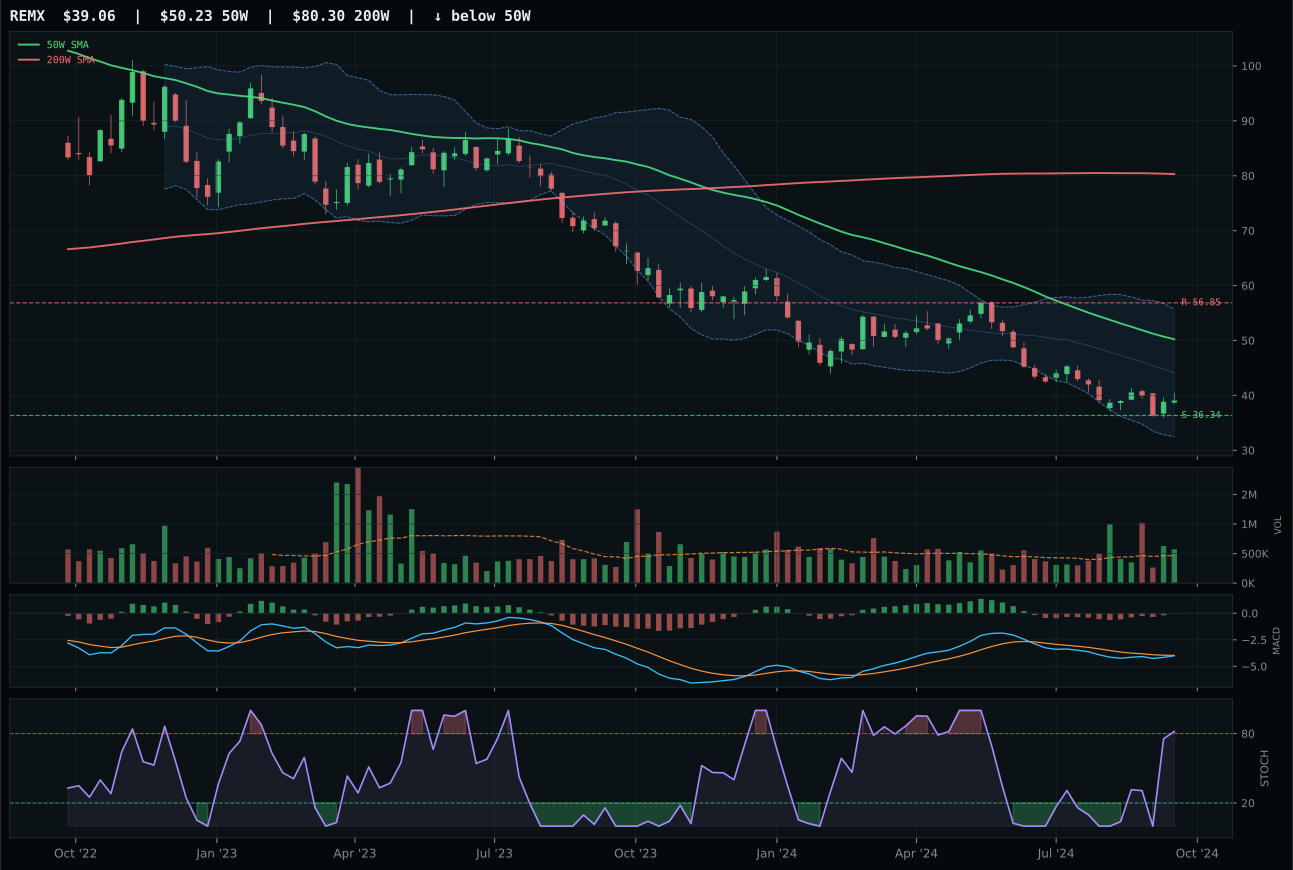
REMX has a neutral structure profile with -14.4% 13-week relative strength versus SPY.
Extension and support failure are the main tactical risks.
Tracked, but not top-2 eligible because: structurally broken.
COPX bests PICK by a decisive 37-point score margin, anchored on COPX's superior structure (69.0 vs 46.3) and risk/reward (76.1 vs 85 for PICK, but COPX's upside to resistance at -16.0% is defensible where PICK fails cleanly). Both carry bearish-but-improving MACD and rising stochastic RSI at the 0.50 midpoint, but COPX's neutral structure with defined support/resistance bands provides a legitimate repair setup, while PICK's structure has deteriorated below workable levels. COPX's -4.0% 13-week return is negative, yet it leads the category due to above-average participation (1.24x volume) where PICK shows accumulation/confirmation. The -8.4% SPY relative weakness across both names reflects copper's industrial cyclicality under disinflation pressure, but COPX's timing score of 90.0—close distance to 50-week and Fibonacci midpoint—offers a setup worth waiting on rather than a broken chart.
Industrial Metals receives 5% allocation despite a weak 35.0 category score, held in tier-2 by metals scarcity (+14) and commodity breadth positive (+10) macro tailwinds that offset credit stress (-7) and liquidity stress (-8). COPX's 62.4 technical evidence and 62.0 macro fit provide dual support. The setup is not attractive yet—momentum is stuck at 35.8 due to the -4.0% 13-week return, and SPY relative strength is deeply negative at -8.4%—but the 90.0 timing score signals that this is a compression zone with defined support at 38.58 and defined resistance at 51.67. The category holds its 5% because metals scarcity is a structural macro theme, not a cyclical trade. Wait for price to hold support and MACD to cross above zero with volume expansion before increasing weight; current allocation reflects metals conviction while acknowledging that copper's near-term cyclical backdrop is unambiguously negative.
Nuclear Energy — NLR
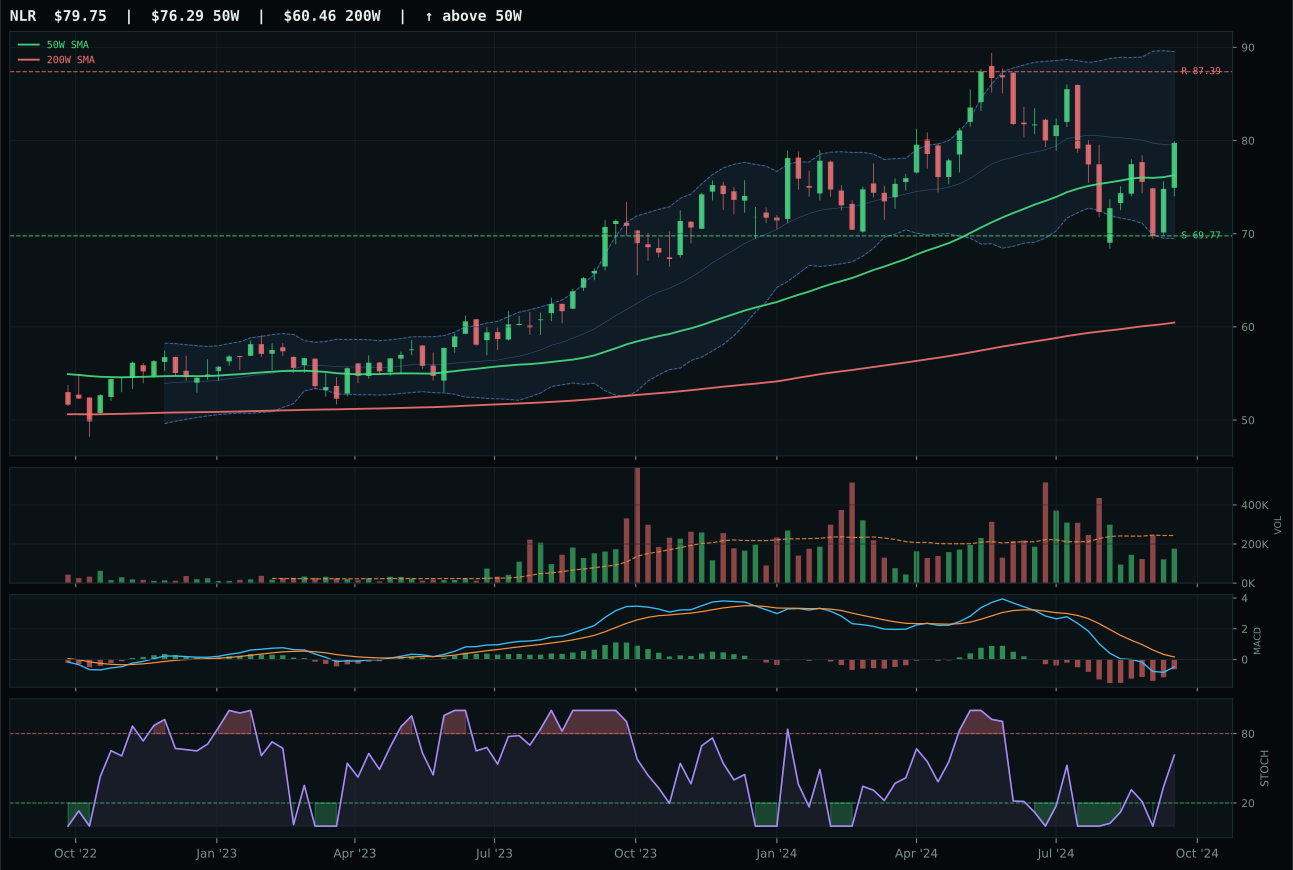
NLR has a neutral structure profile with -6.8% 13-week relative strength versus SPY.
A failed hold above support would weaken the setup.
Actionable but governed by invalidation levels.
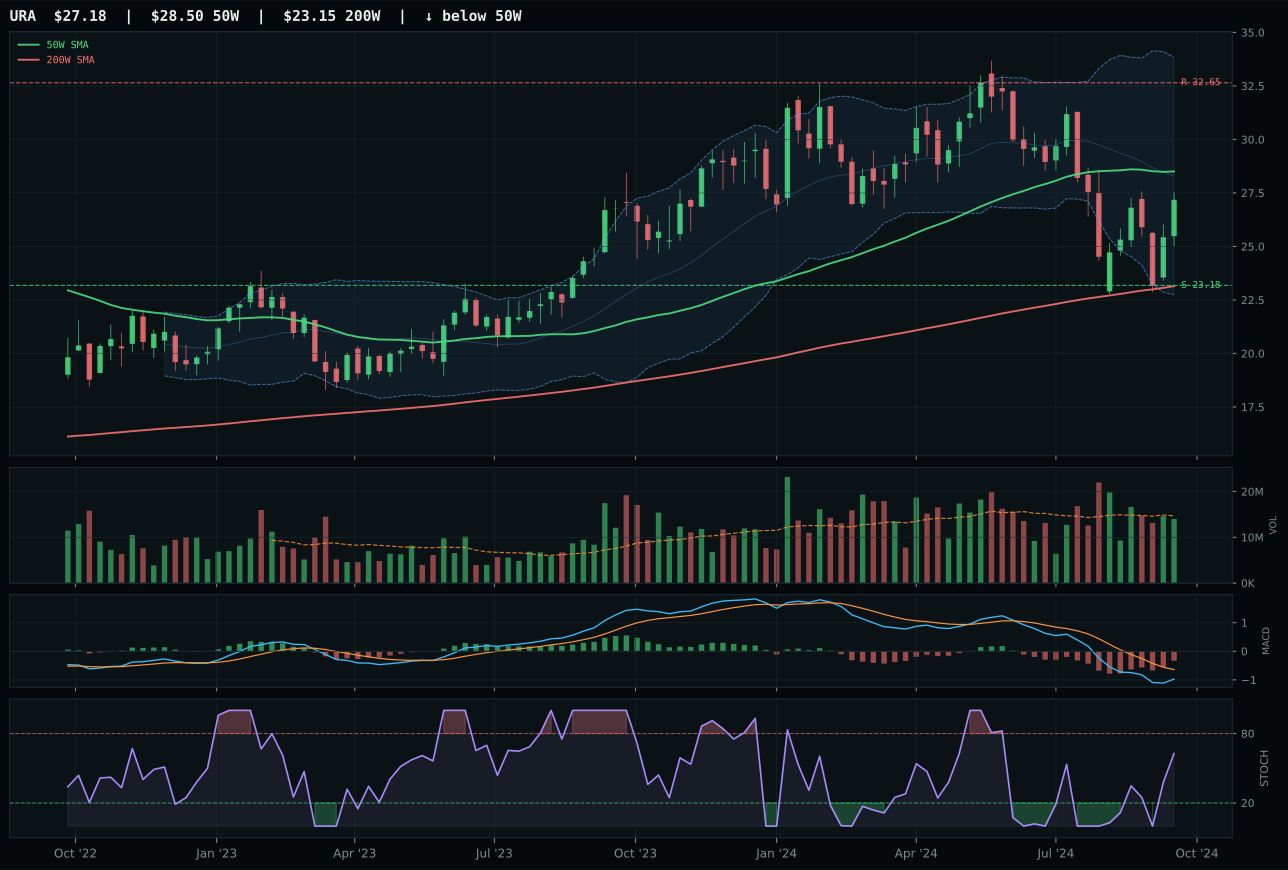
URA has a neutral structure profile with -12.6% 13-week relative strength versus SPY.
A failed hold above support would weaken the setup.
Actionable but governed by invalidation levels.
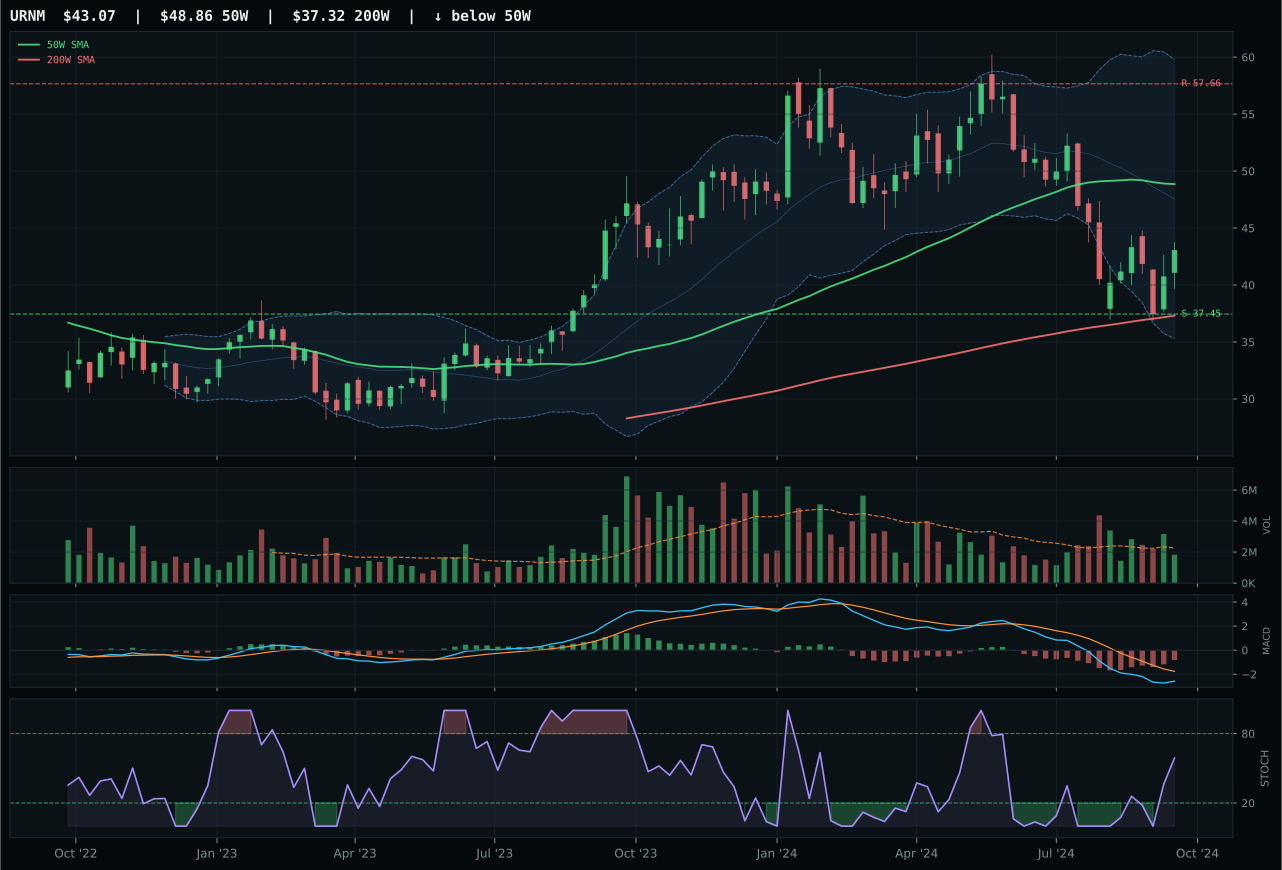
URNM has a neutral structure profile with -20.0% 13-week relative strength versus SPY.
A failed hold above support would weaken the setup.
Actionable but governed by invalidation levels.
NLR edges URA on a perfect timing score (100.0 vs 100.0 tied, but NLR's 4.5% distance to the 50-week is optimal Fibonacci placement at 0.382 retracement), superior structure (70.2 vs 69.2), and better risk/reward (64.0 vs 55.5). Both carry bearish-but-improving MACD and rising stochastic RSI in mid-zone, but NLR's superior category-relative strength (5.9% vs 0.0%) proves that capital is rotating into this name within the nuclear cohort while URA sits flat. NLR's -2.4% 13-week return is negative, yet the 4.5% daily distance from the 50-week and the Fibonacci placement in the decision zone create a clean coil setup. Thin volume participation (0.72x) is a caution, but above-average momentum confirmation (47.4) on a 3.0% four-week return shows initiation. URA's -8.3% 13-week performance and -12.6% SPY underperformance confirm that nuclear miners are underperforming nuclear utilities during this cycle.
Nuclear Energy receives 5% allocation as tier-2, held above zero by real asset sponsorship (+7) that benefits defensive and inflation-hedge attributes, yet constrained by liquidity stress (-7) and credit stress (-5) that penalize the entire equity allocation. The 32.8 category score reflects a 41.0 macro fit that is neutral-to-negative in the current disinflation regime. NLR's 100.0 timing score is exceptional—the chart sits at an ideal Fibonacci midpoint with both the 50-week slope and stochastic RSI signaling the formation of a coil setup—yet momentum is only 47.4 and 13-week return is negative, indicating the coil has not yet resolved. The thin 0.72x volume participation suggests light institutional accumulation but no breakout confirmation yet. NLR holds its 5% slot because nuclear energy has emerged as a structural secular theme, but the category requires a break above 87.39 resistance on expanding volume to justify promotion to tier-1.
AI — AIQ
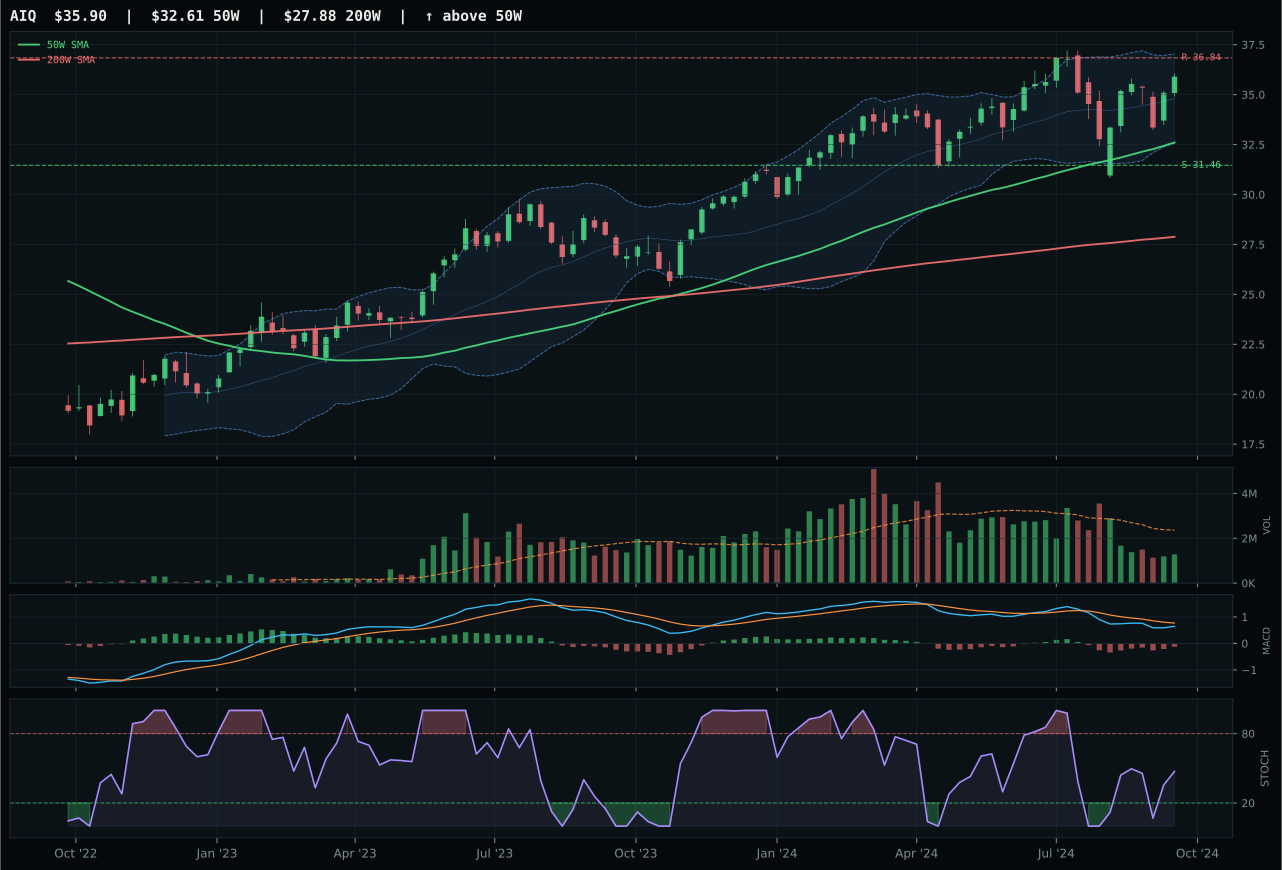
AIQ has a neutral structure profile with -3.3% 13-week relative strength versus SPY.
A failed hold above support would weaken the setup.
Actionable but governed by invalidation levels.
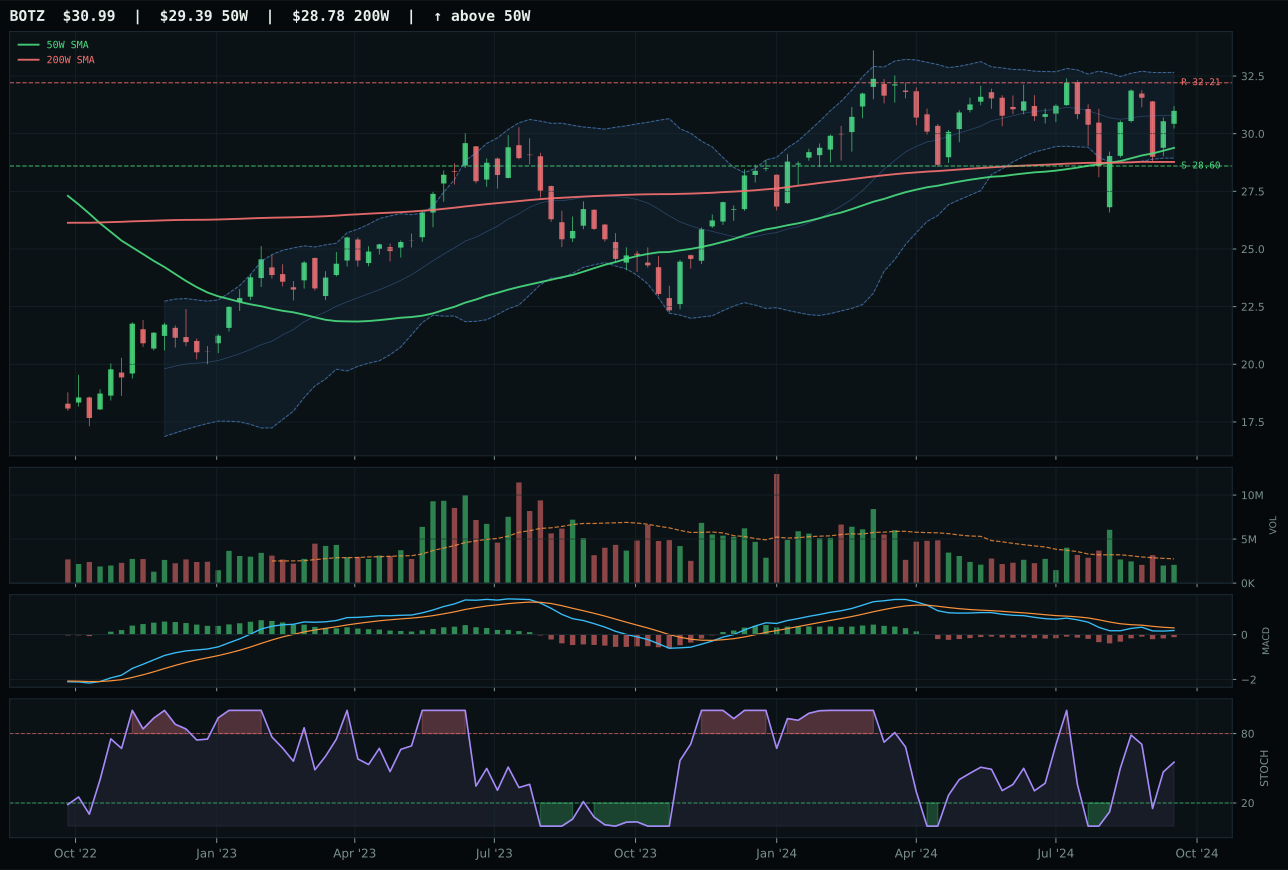
BOTZ has a neutral structure profile with -3.6% 13-week relative strength versus SPY.
A failed hold above support would weaken the setup.
Actionable but governed by invalidation levels.
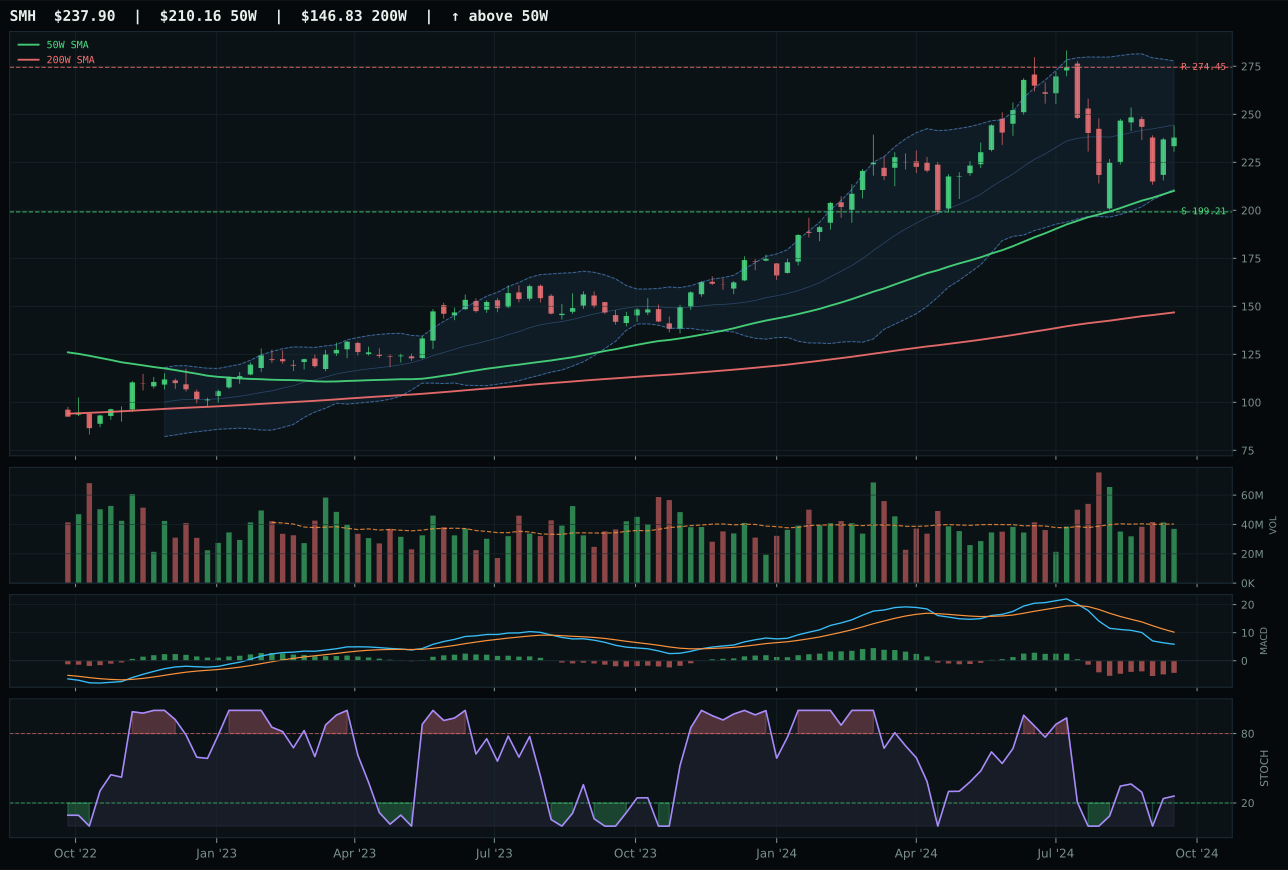
SMH has a neutral structure profile with -14.5% 13-week relative strength versus SPY.
A failed hold above support would weaken the setup.
Actionable but governed by invalidation levels.
AIQ edges BOTZ on a narrower but sharper timing signal: AIQ's stochastic RSI sits rising at 0.47 mid-zone while BOTZ's has fallen into neutral territory, meaning AIQ still commands upside momentum confirmation that BOTZ has lost. Both carry thin volume participation and bearish-but-improving MACD, placing both setups in repair mode, yet AIQ's superior timing score (83.0 vs 75.0) reflects its earlier and cleaner inflection. The 1.0% 13-week return is weak across the board—neither ETF has generated conviction—but AIQ maintains marginal category-relative strength at 0.3% while BOTZ sits flat. This is a forced choice between two struggling exposures; AIQ wins by moving first off support.
AI receives 5% allocation despite a depressed 25.9 category score, ranking far below top contenders. The category macro fit stands at 27.0/100, dragged lower by active liquidity stress (-12), credit stress (-8), and broad market bear pressure (-8) that overwhelm the modest disinflation tailwind (+5). AIQ's 64.7 technical evidence score provides the only lifeline; without it, this category would face full exclusion. The thin volume at 0.54x the 20-week average and negative SPY relative strength at -3.3% confirm that capital is not rotating into AI during this regime. AIQ merits 5% only as a placeholder position; meaningful improvement would require MACD to stabilize above the zero line and stochastic RSI to sustain above 0.50 with volume returning to at least the 20-week average.
Emerging Markets — INDA
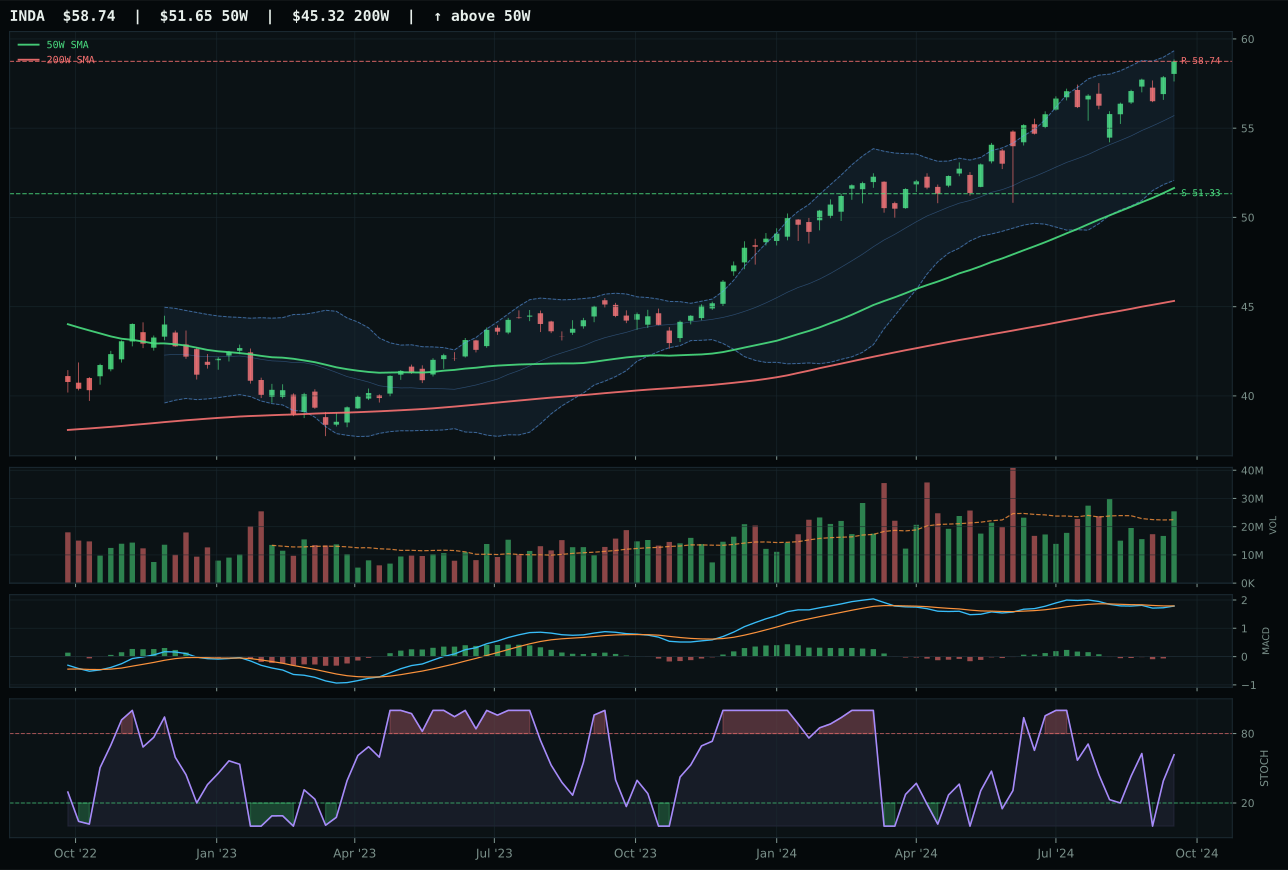
INDA has a neutral structure profile with 3.0% 13-week relative strength versus SPY.
A failed hold above support would weaken the setup.
Actionable but governed by invalidation levels.
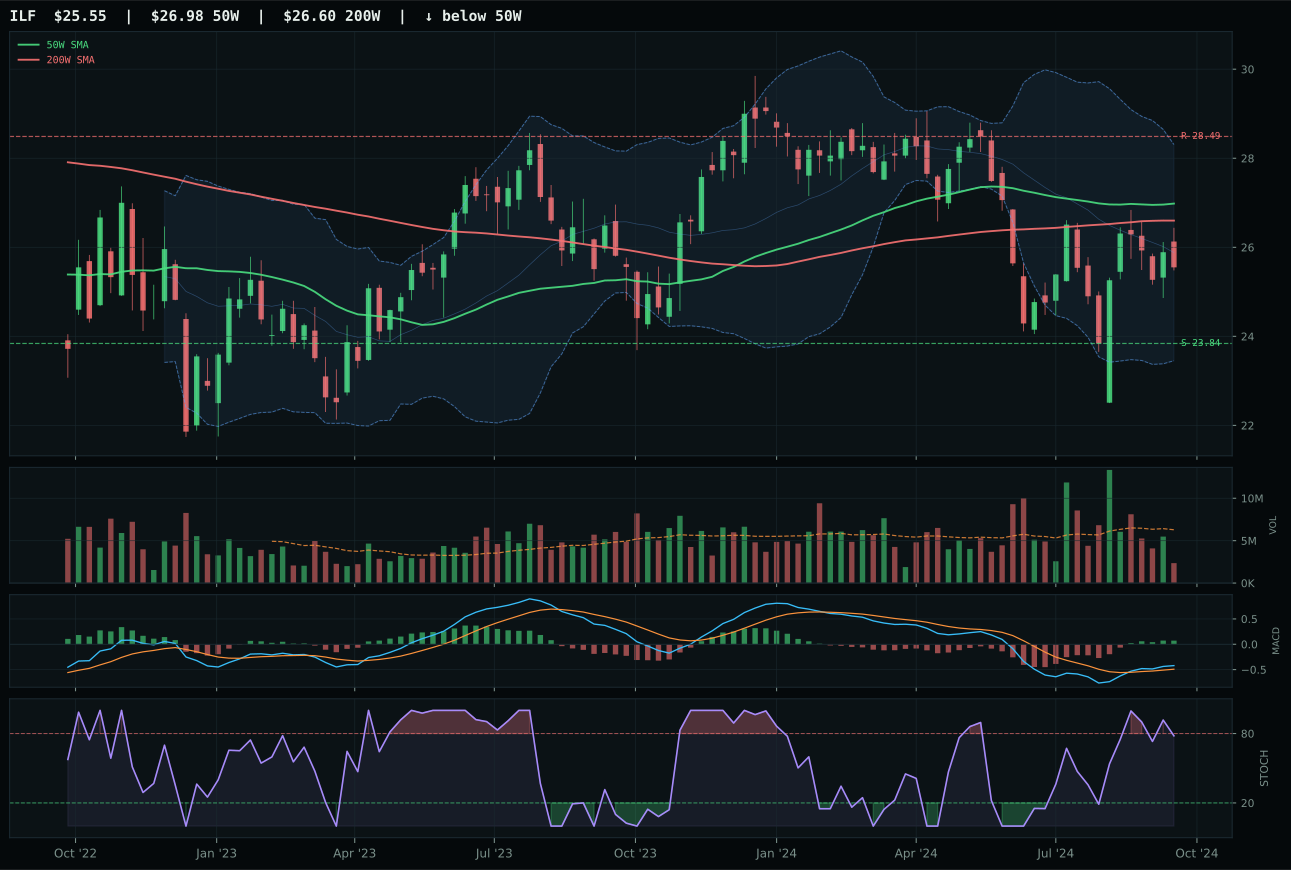
ILF has a neutral structure profile with -1.2% 13-week relative strength versus SPY.
A failed hold above support would weaken the setup.
Actionable but governed by invalidation levels.
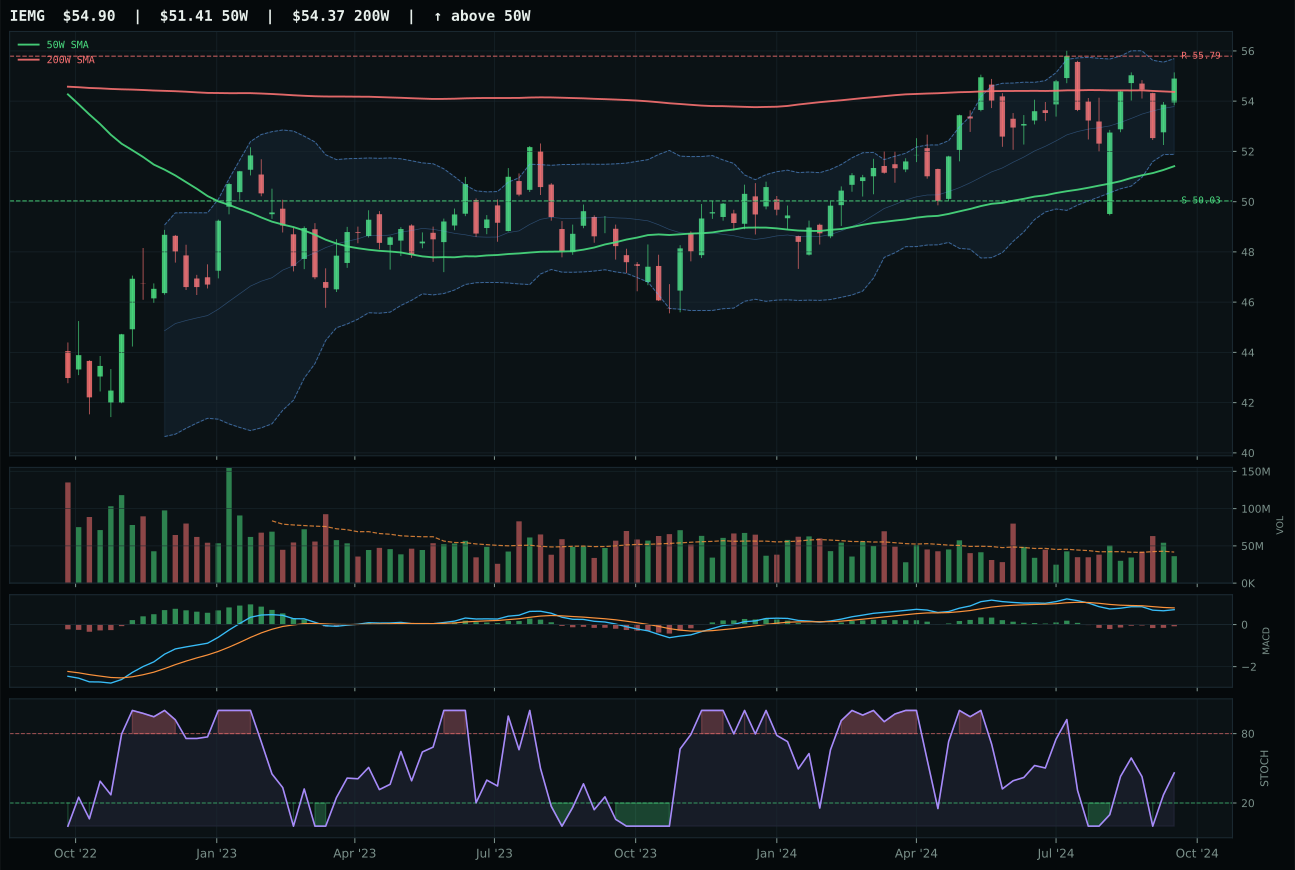
IEMG has a neutral structure profile with -1.9% 13-week relative strength versus SPY.
A failed hold above support would weaken the setup.
Actionable but governed by invalidation levels.
INDA defeats ILF with superior structure cleanliness (81.5 vs 66.7) and volume sponsorship (above-average at 1.13x vs thin participation), both critical differentiators when both charts are extended near the 52-week high. INDA's 97.6 trend score reflects price well above both moving averages with a 0.6% 50-week slope, while ILF's 53.0 trend lags meaningfully. The 7.4% 13-week return and 3.0% SPY outperformance validate INDA's momentum, and category-relative strength of 4.3% confirms that India quality-growth is the preferred emerging market expression. Both MACD signatures are bearish-but-improving, and both stochastic RSI are falling/neutral, yet INDA's above-average volume accumulation suggests that the decline is attracting buyers while ILF's thin participation signals hesitation. The 13.7% extension above the 50-week is notable for entry timing risk, but INDA's 79.5 momentum confirmation outweighs the caution.
Emerging Markets receives 5% allocation as a tier-2 category despite a low 22.9 score, held above zero by INDA's superior technical setup but weighted down by macro headwinds that score only 21.0. Credit stress (-10) and liquidity stress (-10) alongside broad market bear pressure (-9) create a three-headed macro dragon that overwhelms disinflation tailwinds. INDA's 77.7 technical evidence and above-average volume provide the only structural case; without it, the category would face zero allocation. The extended price (13.7% above the 50-week) and falling stochastic RSI warn that the momentum setup is maturing, yet the 4.3% category-relative strength signals that Indian quality exposure is working within the EM cohort. Hold the 5% as a position in a quality emerging market with structural growth tailwinds, but do not add until either the macro regime shifts toward risk-on or INDA pulls back to the 50-week near 51.33 with above-average volume accumulation. A break below support would trigger a reassessment.
Agriculture & Livestock — MOO
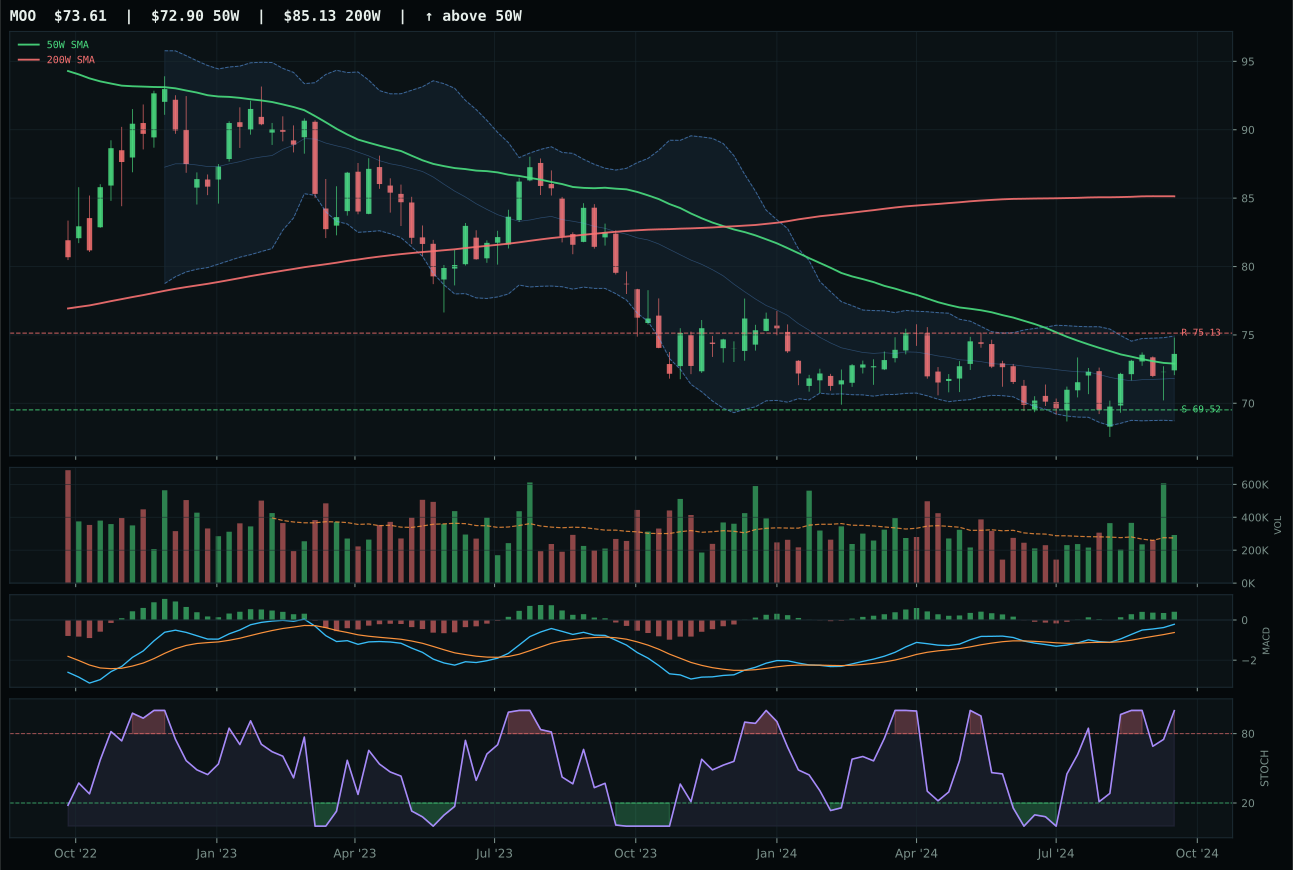
MOO has a compression near 50W profile with 0.5% 13-week relative strength versus SPY.
A failed hold above support would weaken the setup.
Actionable but governed by invalidation levels.
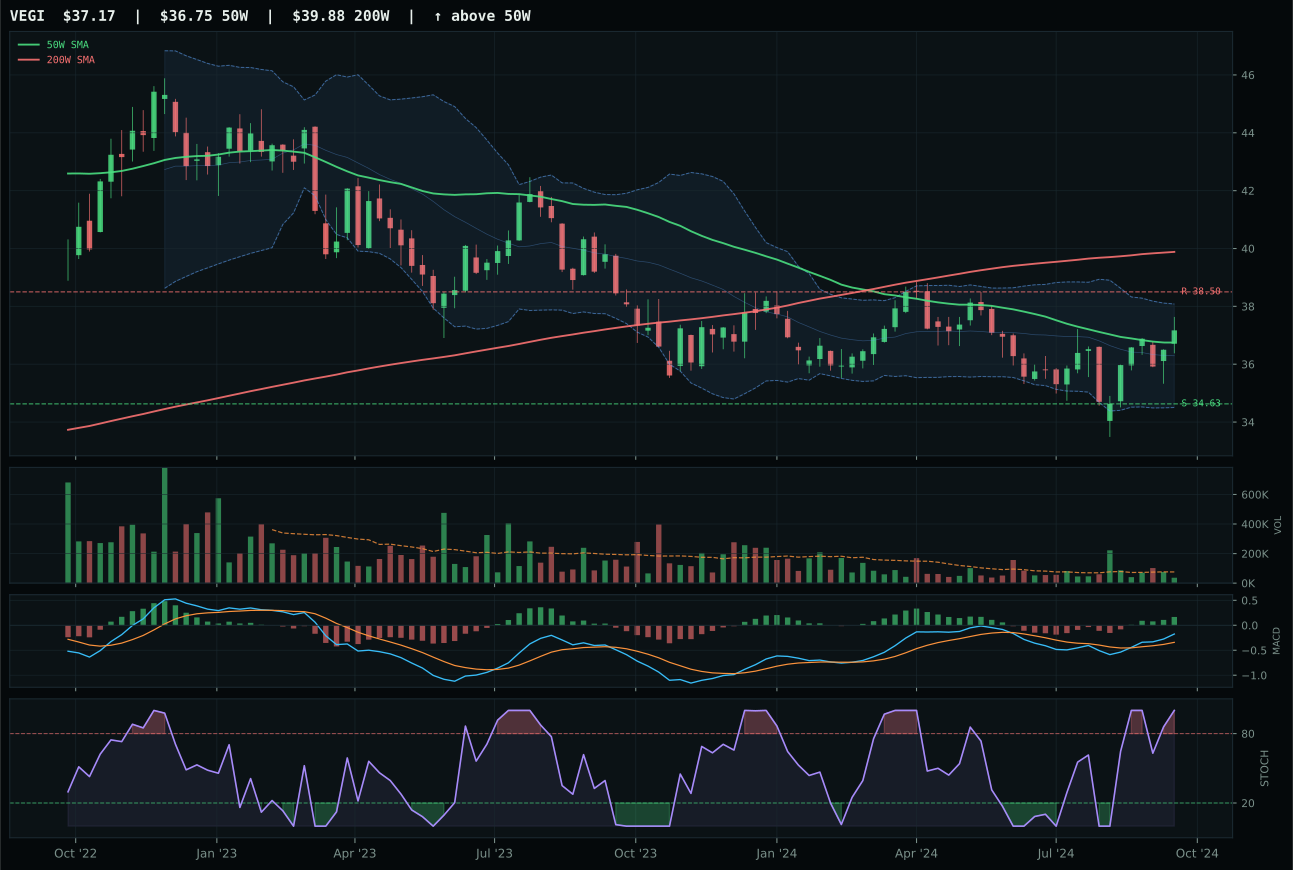
VEGI has a compression near 50W profile with -0.4% 13-week relative strength versus SPY.
A failed hold above support would weaken the setup.
Tracked, but not top-2 eligible because: .
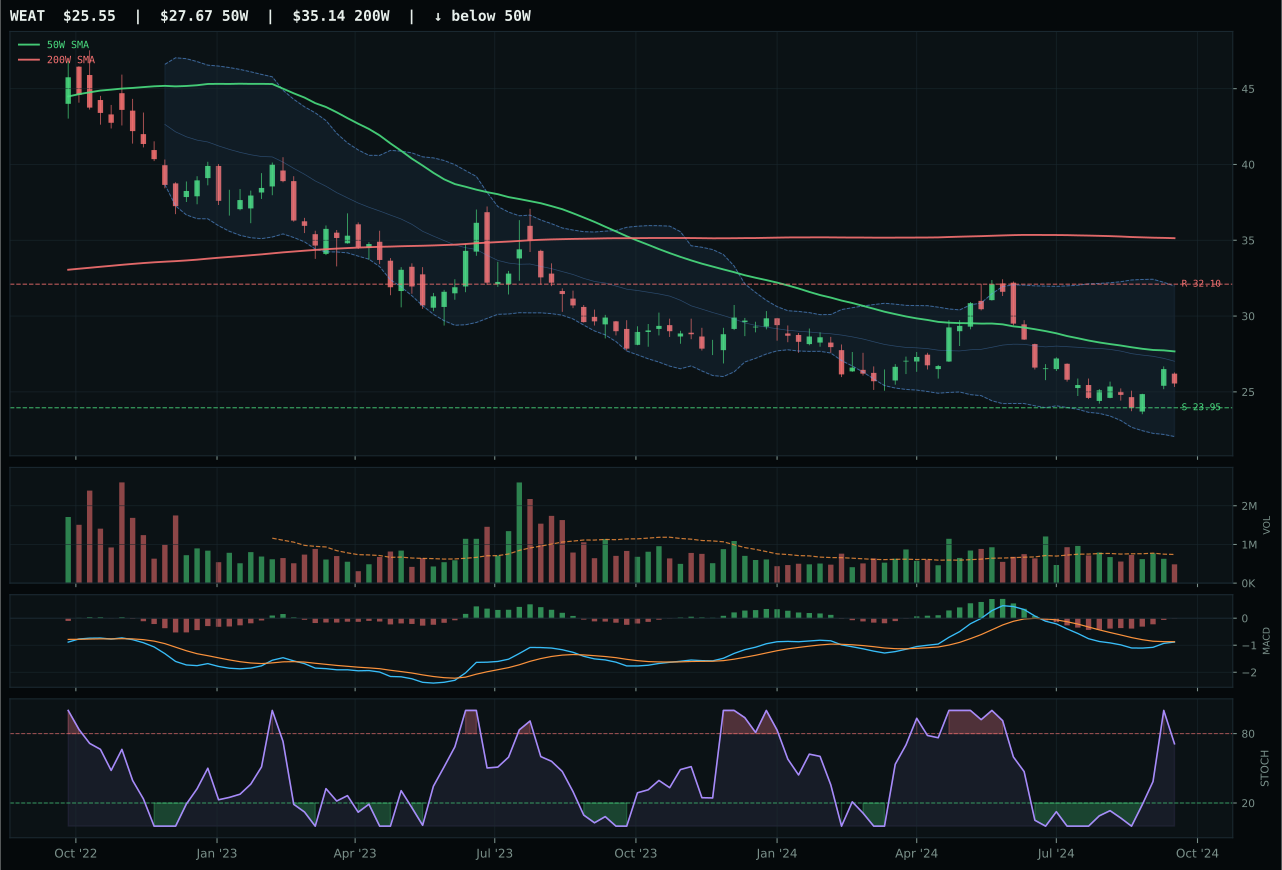
WEAT has a neutral structure profile with -8.3% 13-week relative strength versus SPY.
Extension and support failure are the main tactical risks.
Tracked, but not top-2 eligible because: structurally broken.
MOO defeats VEGI despite a weak absolute setup, winning on structure and breadth rather than momentum. Both charts compress near the 50-week with MACD bullish and improving, but MOO delivers cleaner compression (86.0 vs 76.0) and superior risk/reward (59.2 vs 53.5) thanks to better-defined support at 69.52 versus 34.63. MOO's neutral volume at 1.07x the 20-week average contrasts with VEGI's thin participation, a meaningful divergence when the stochastic RSI is rolling over from overbought in both cases—MOO is being accumulated by routine buyers while VEGI is thinning out. The 4.9% 13-week return is unimpressive, yet MOO's 0.9% category-relative strength edges VEGI's flat performance. This category is structurally broken, and MOO merely loses less.
Agriculture & Livestock receives 0% allocation and is excluded entirely this week, ranking as the ninth or tenth category. The 20.0 final score reflects a macro regime fundamentally misaligned with commodity and real asset exposure: disinflation pressure applies a -8 headwind that outweighs commodity breadth positive (+5) and real asset sponsorship (+8). Liquidity stress at -4 adds friction. MOO's compression near the 50-week offers tactical staging ground for future entry, yet the stochastic RSI at 1.00 rolled over and the overbought momentum has exhausted without confirming a breakout. Until price breaks above 75.13 resistance with sustained above-average volume, and until the macro regime shifts toward inflation sponsorship or risk-on sentiment, this category remains off the board. Meaningful improvement would require either a macro regime change or an actual breakout with fresh volume confirmation.
Traditional Energy — XLE
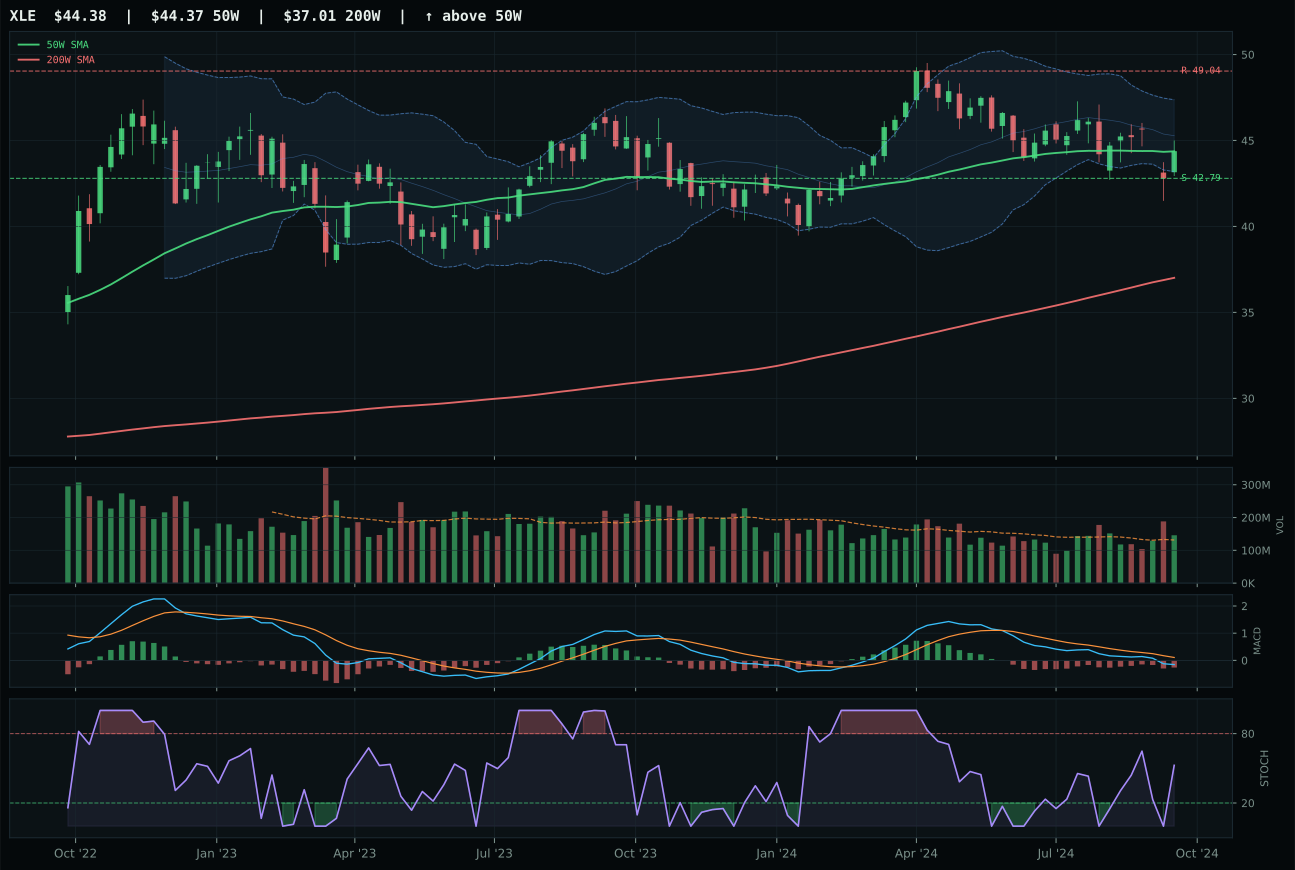
XLE has a pullback into support profile with -5.5% 13-week relative strength versus SPY.
A failed hold above support would weaken the setup.
Actionable but governed by invalidation levels.
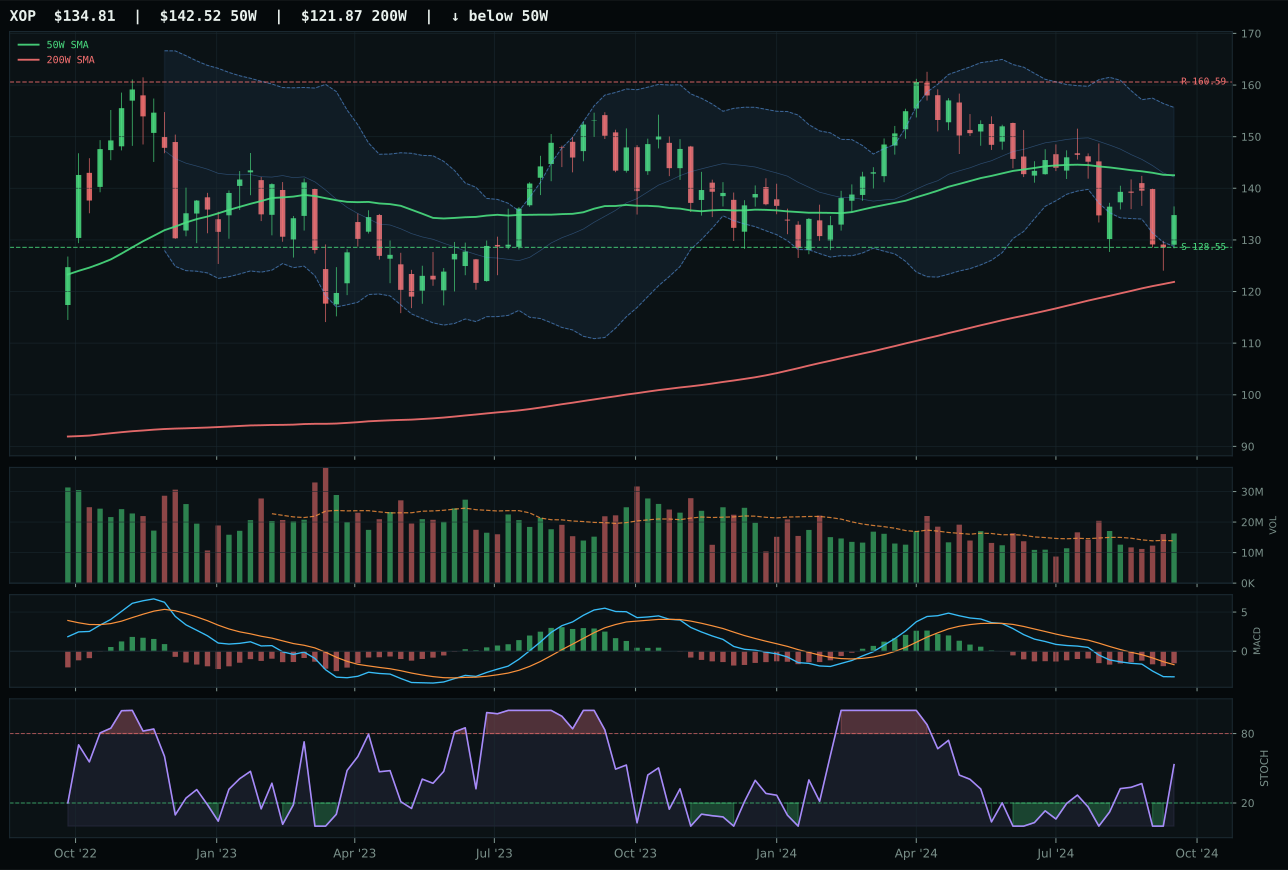
XOP has a pullback into support profile with -10.3% 13-week relative strength versus SPY.
A failed hold above support would weaken the setup.
Actionable but governed by invalidation levels.
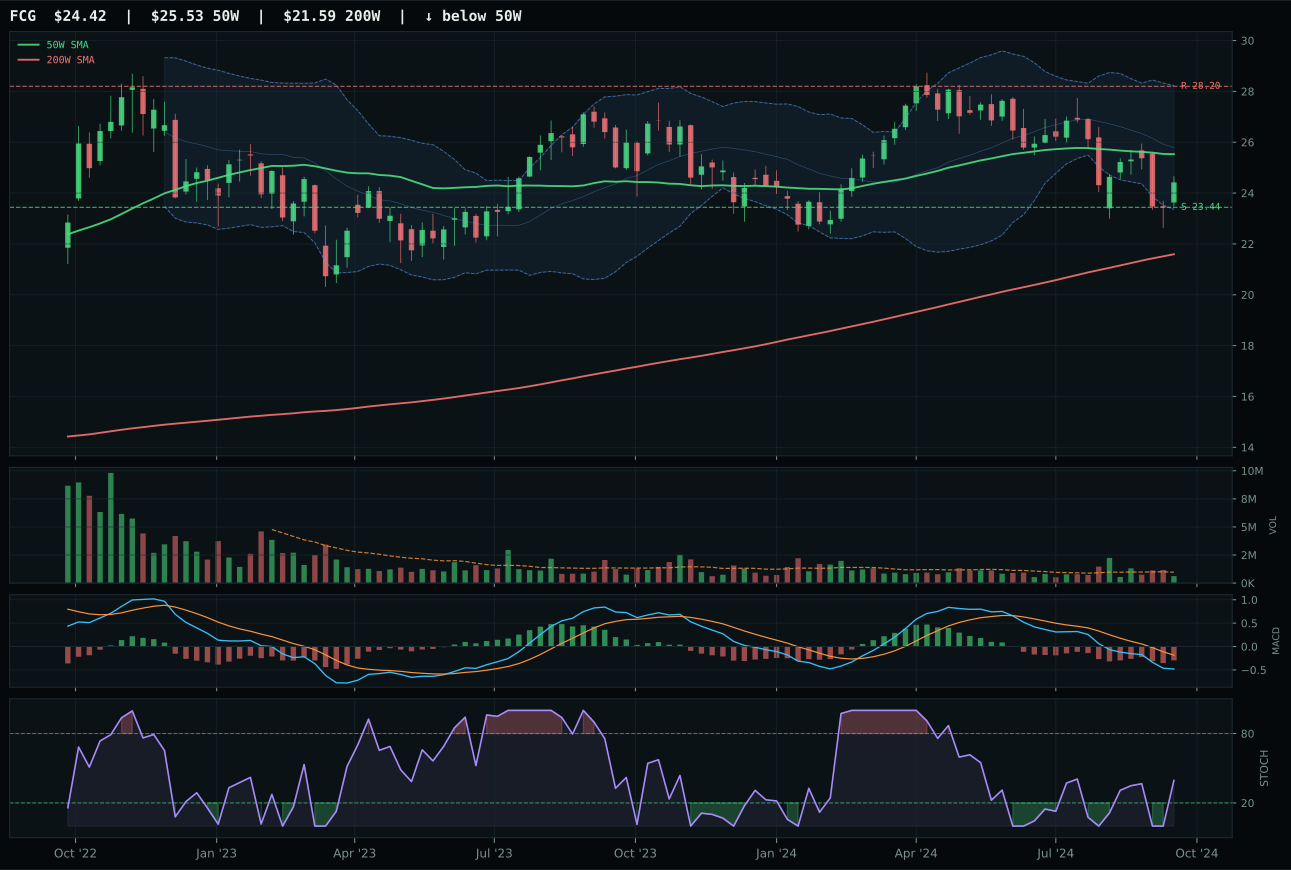
FCG has a pullback into support profile with -10.2% 13-week relative strength versus SPY.
A failed hold above support would weaken the setup.
Actionable but governed by invalidation levels.
XLE wins by default, delivering a pullback-into-support setup at the 50-week with defined invalidation at 42.79, the bare minimum required to justify a category leader's claim. XOP trails decisively on category-relative strength (4.8% for XLE vs -0.1% for XOP), a 5-point gap that matters when both charts are bearish/weakening in MACD and falling/neutral in stochastic RSI. XLE's timing score of 95.0 reflects its proximity to the 50-week (0.1% distance) where reversal patterns form, even if that reversal has not yet begun. Both names carry negative 13-week momentum (-1.1% for XLE, -6.0% for XOP), and FCG is structurally deteriorating, making this a category where the best choice still looks broken. XLE's above-average participation (1.11x volume) suggests at least routine accumulation at support, a differentiator in a category with no real strength.
Traditional Energy receives 0% allocation and is ranked out of the portfolio entirely this week, reflecting a 2.0 final category score that represents categorical rejection. Disinflation pressure applies a -10 headwind that dominates this sector, and credit stress (-7) plus liquidity stress (-7) provide no counterbalance. Real asset sponsorship (+7) fails to overcome the macro headwinds. XLE's bearish/weakening MACD and falling stochastic RSI, combined with -5.5% SPY underperformance and 0.1% distance from the 50-week, suggest a potential staging ground for a reversal, yet the broader energy complex is in repair mode with no conviction. Price action below 42.79 would break the setup entirely. The category merits zero allocation until either crude oil prices find a genuine floor with volume confirmation, or until the macro regime shifts away from disinflation toward risk-on sentiment. Current conditions favor continued energy weakness.