
2024-09-13
Informational purposes only. The content in this report, including allocations, analysis, and commentary, is provided solely for informational and educational purposes. It does not constitute financial advice, investment advice, trading advice, or any other type of advice. Past performance does not guarantee future results. Always conduct your own research and consult a qualified financial professional before making investment decisions.
Weekly Allocation
| Ticker | Category | Weight | Role |
|---|---|---|---|
| FBTC | 50% | Overlay | |
| XLU | Utilities & Infrastructure | 10% | Top-2 (10%) |
| GLD | Precious Metals | 10% | Top-2 (10%) |
| ITA | Defense & Aerospace | 5% | Tier-2 (5%) |
| IGV | Technology | 5% | Tier-2 (5%) |
| WEAT | Agriculture & Livestock | 5% | Tier-2 (5%) |
| NLR | Nuclear Energy | 5% | Tier-2 (5%) |
| BOTZ | AI | 5% | Tier-2 (5%) |
| XLE | Traditional Energy | 5% | Tier-2 (5%) |
Trade Instructions — Monday Open
Sell the tranche from 2024-08-16 (completing its 4-week hold). Buy the new tranche. Instructions show net portfolio changes — same-asset positions cancel, weight changes show the delta.
| Action | Ticker | Instruction |
|---|---|---|
| SELL | CIBR | Sell 33% of CIBR position (reduce 3.75% → 2.50%) |
| SELL | AIQ | Sell 50% of AIQ position (reduce 2.50% → 1.25%) |
| SELL | MOO | Sell 33% of MOO position (reduce 3.75% → 2.50%) |
| BUY | BOTZ | Buy BOTZ — 33.33% of freed cash (adds 1.25% to portfolio) |
| BUY | IGV | Buy IGV — 33.33% of freed cash (adds 1.25% to portfolio) |
| BUY | WEAT | Buy WEAT — 33.33% of freed cash (adds 1.25% to portfolio) |
Current Portfolio After Trade
Combined holdings across all 4 active tranches. Each tranche is 25% of the portfolio.
| Ticker | % of Portfolio | Weight Bar |
|---|---|---|
| FBTC | 50.00% | |
| GLD | 10.00% | |
| XLU | 7.50% | |
| XLE | 3.75% | |
| NLR | 3.75% | |
| XAR | 3.75% | |
| CIBR | 2.50% | |
| MOO | 2.50% | |
| BOTZ | 2.50% | |
| PAVE | 2.50% | |
| IGV | 2.50% | |
| AIQ | 1.25% | |
| SMH | 1.25% | |
| URA | 1.25% | |
| INDA | 1.25% | |
| IEMG | 1.25% | |
| ITA | 1.25% | |
| WEAT | 1.25% |
Macro Regime — Disinflation
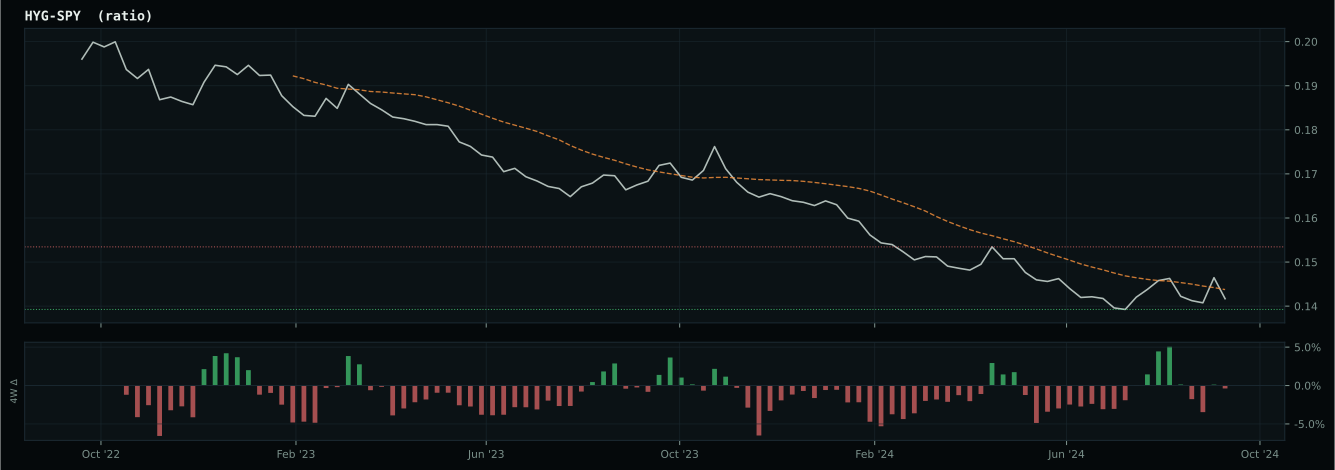
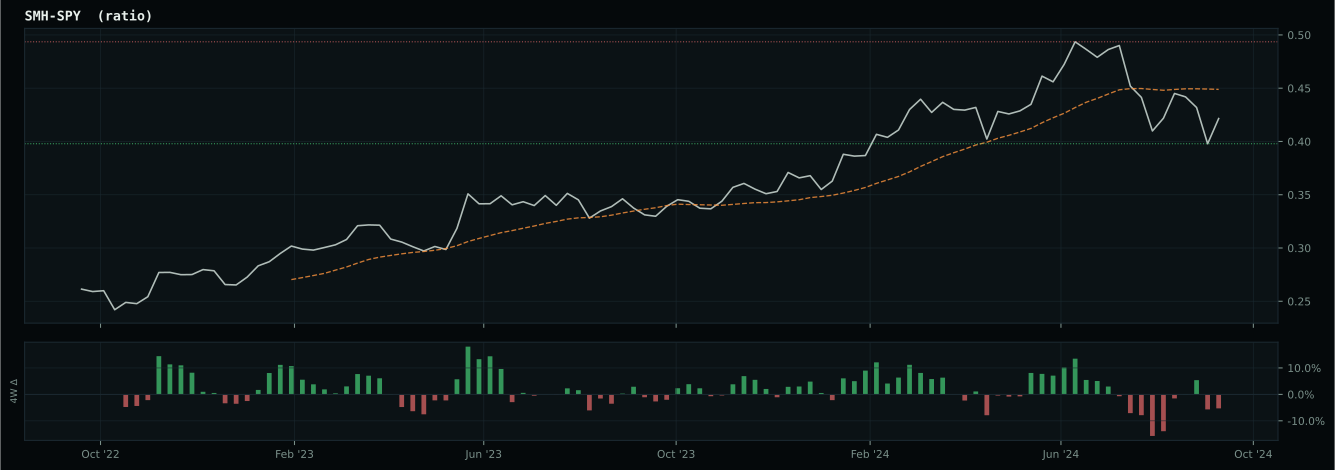
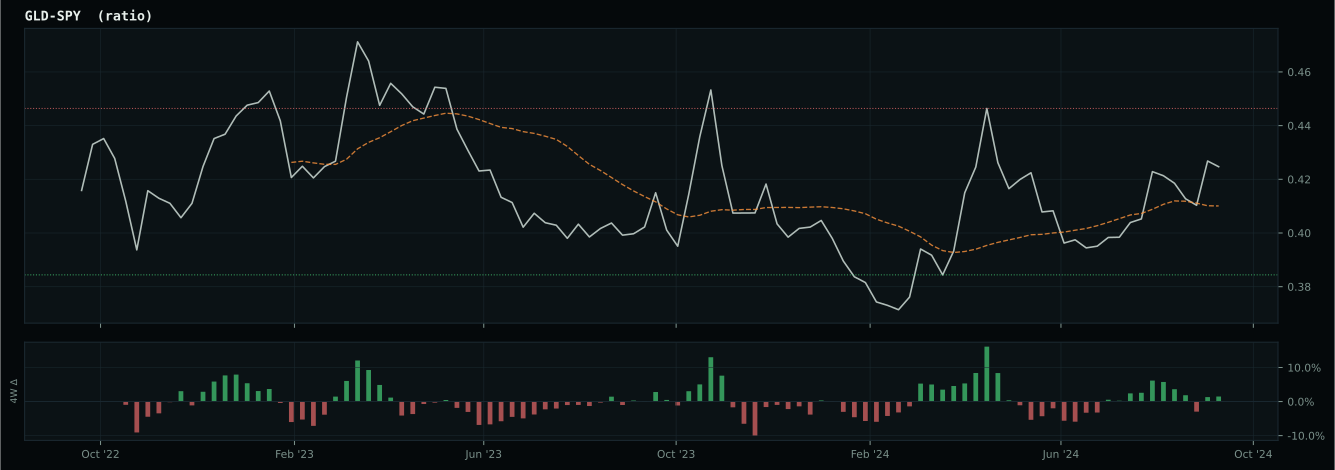
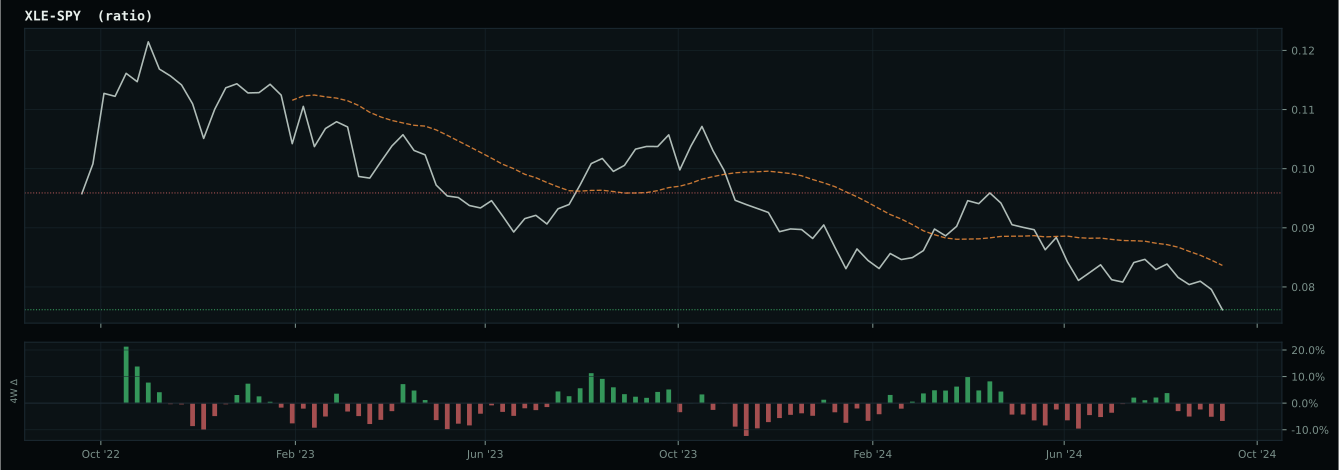
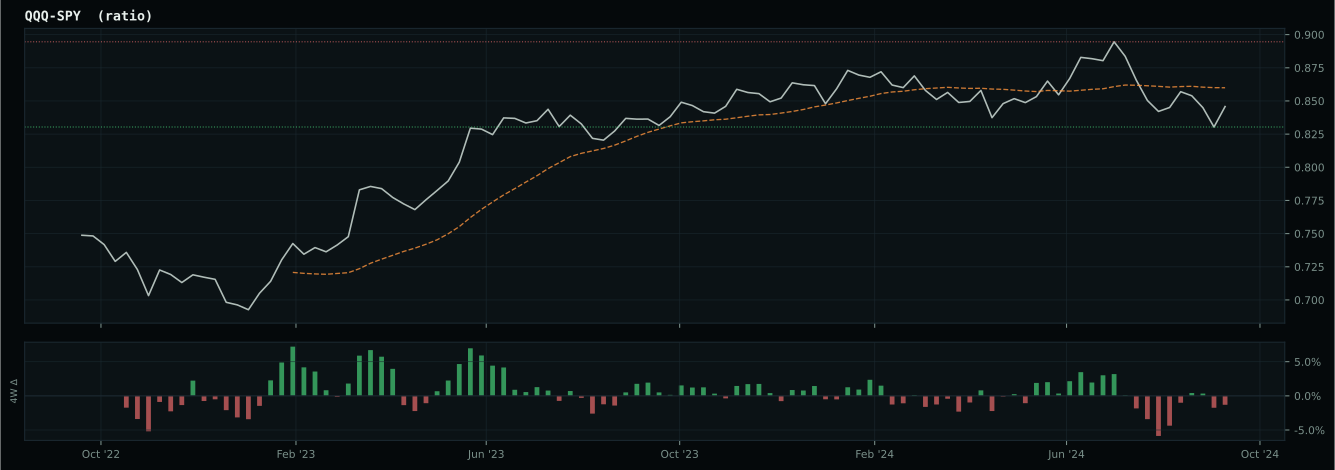
growth data is not confirming the weak market-implied risk appetite signal
Macro Evidence Charts
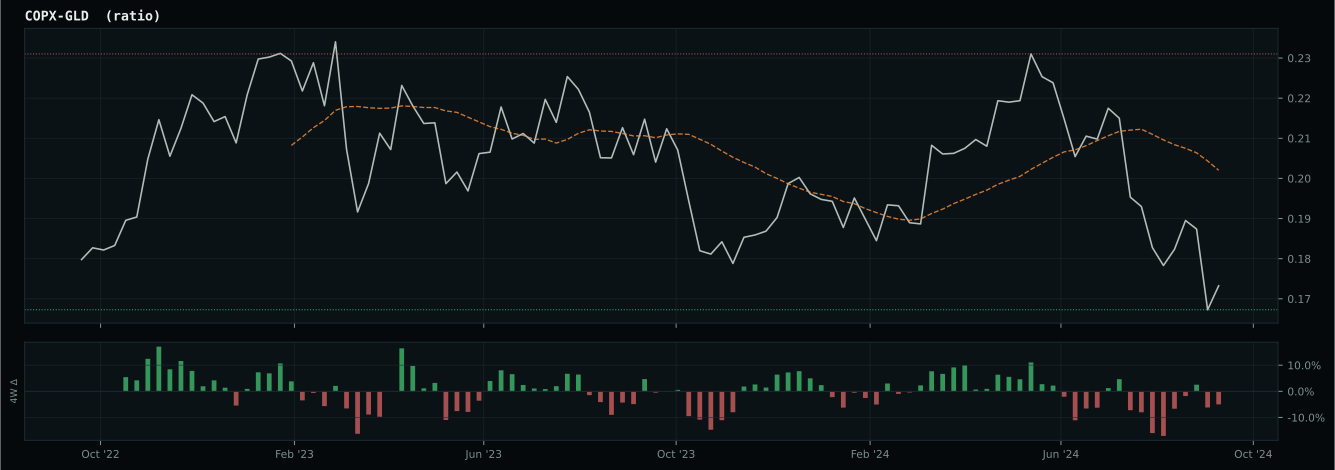
Market-implied signals behind the macro regime scores. Each ratio compares two assets; the direction and slope of the ratio is what the macro engine reads.
Crypto Regime — TrendBTC
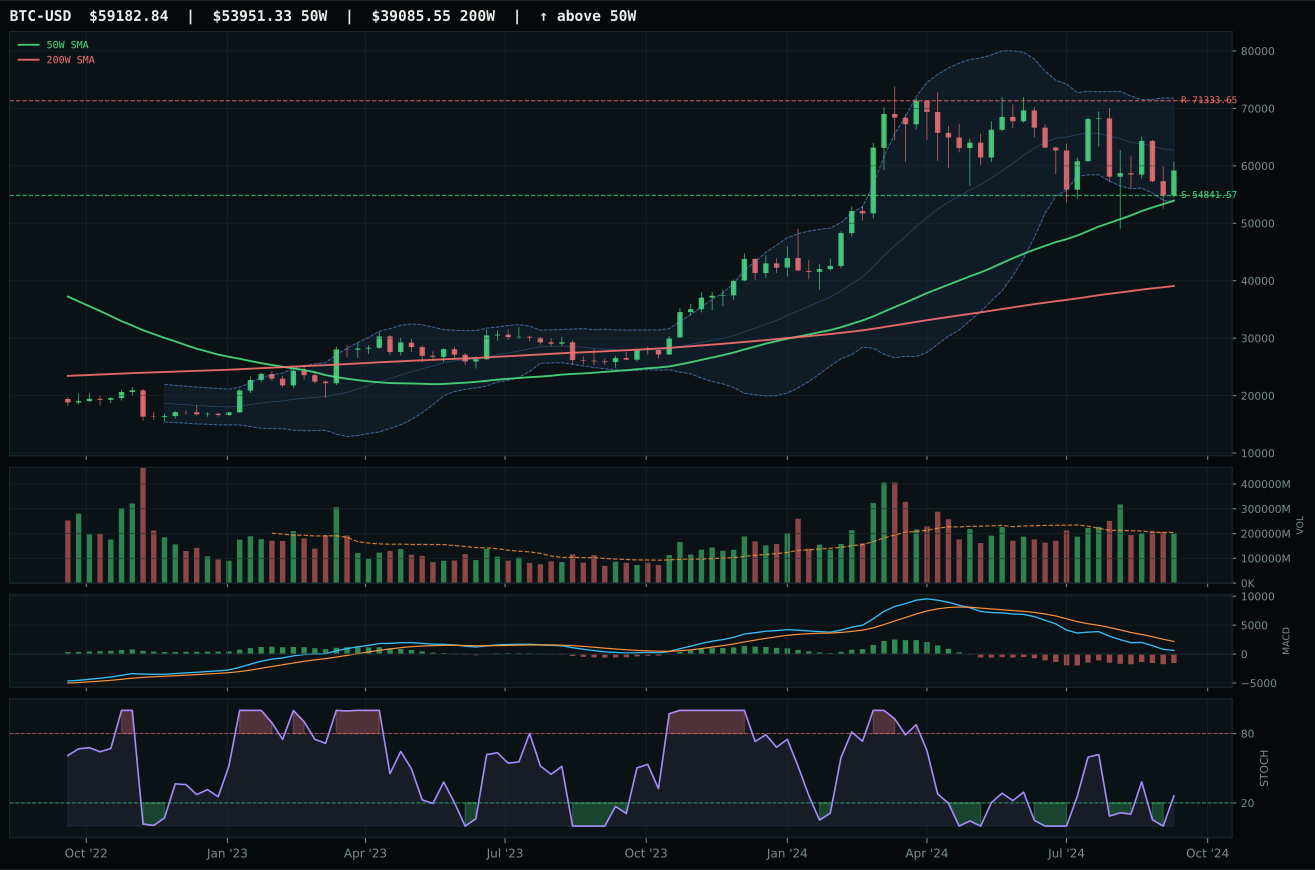
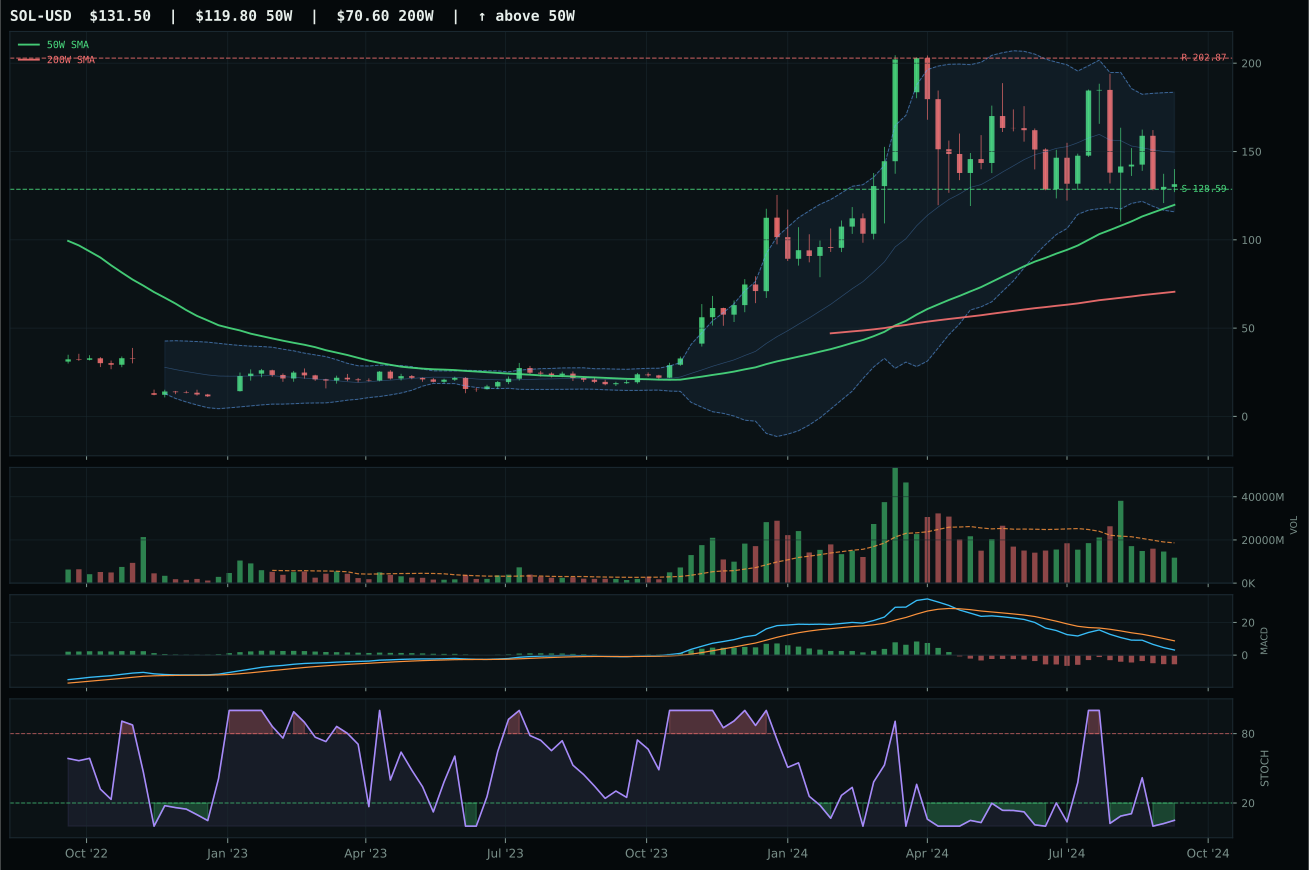
ValueBTC not armed: BTC has not made the first post-breakdown touch of the 200W buy zone after losing the 50W
TrendBTC confirmed: 2 consecutive closes above rising/flat 50W SMA
one or more available conditions failed
Category Rankings
| Rank | Category | Winner | Score | Alloc | 4W Ret | Peers (4W) |
|---|---|---|---|---|---|---|
| 1 | Utilities & Infrastructure | XLU | 77.8 | 20% | +0.74% | IGF +1.5% · PAVE +7.6% |
| 2 | Precious Metals | GLD | 75.3 | 20% | +2.69% | GDX -0.2% · SLV +0.7% |
| 3 | Defense & Aerospace | ITA | 66.1 | 10% | +4.85% | XAR +4.7% · ROKT +6.9% |
| 4 | Technology | IGV | 53.3 | 10% | +6.76% | CIBR +8.6% · XLK +6.1% |
| 5 | Nuclear Energy | NLR | 26.4 | 10% | +15.87% | URA +17.8% · URNM +16.8% |
| 6 | AI | BOTZ | 25.6 | 10% | +5.85% | AIQ +8.4% · SMH +10.8% |
| 7 | Emerging Markets | INDA | 16.7 | 10% | -1.34% | ILF -2.2% · IEMG +6.7% |
| 8 | Industrial Metals | COPX | 9.3 | 10% | +8.97% | REMX +23.3% · PICK +8.0% |
| 9 | Agriculture & Livestock | WEAT | — | 0% | +2.10% | VEGI +2.4% · MOO +1.6% |
| 10 | Traditional Energy | XLE | — | 0% | +6.78% | FCG +6.2% · XOP +7.9% |
Utilities & Infrastructure — XLU
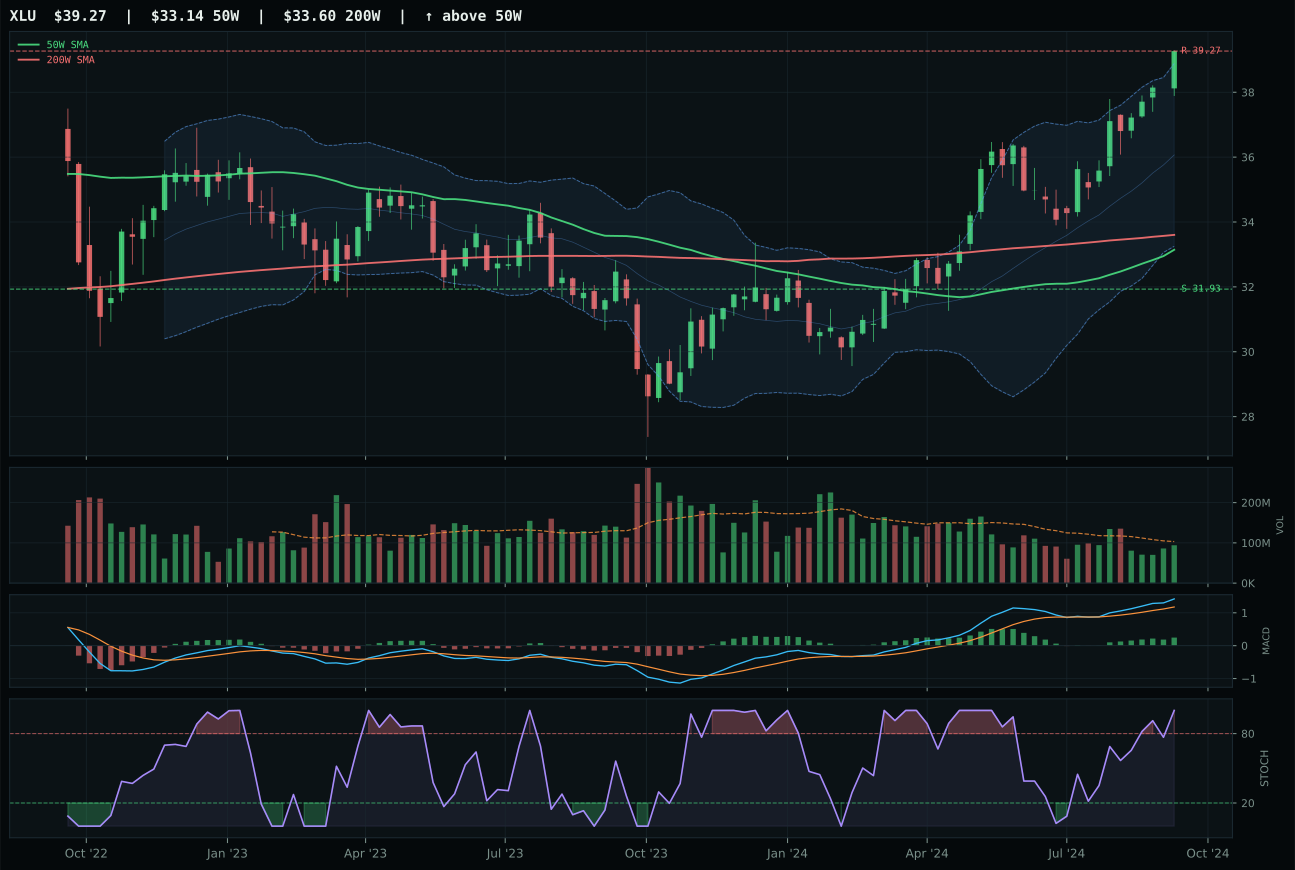
XLU has a vertical extension profile with 8.8% 13-week relative strength versus SPY.
A failed hold above support would weaken the setup.
Actionable but governed by invalidation levels.
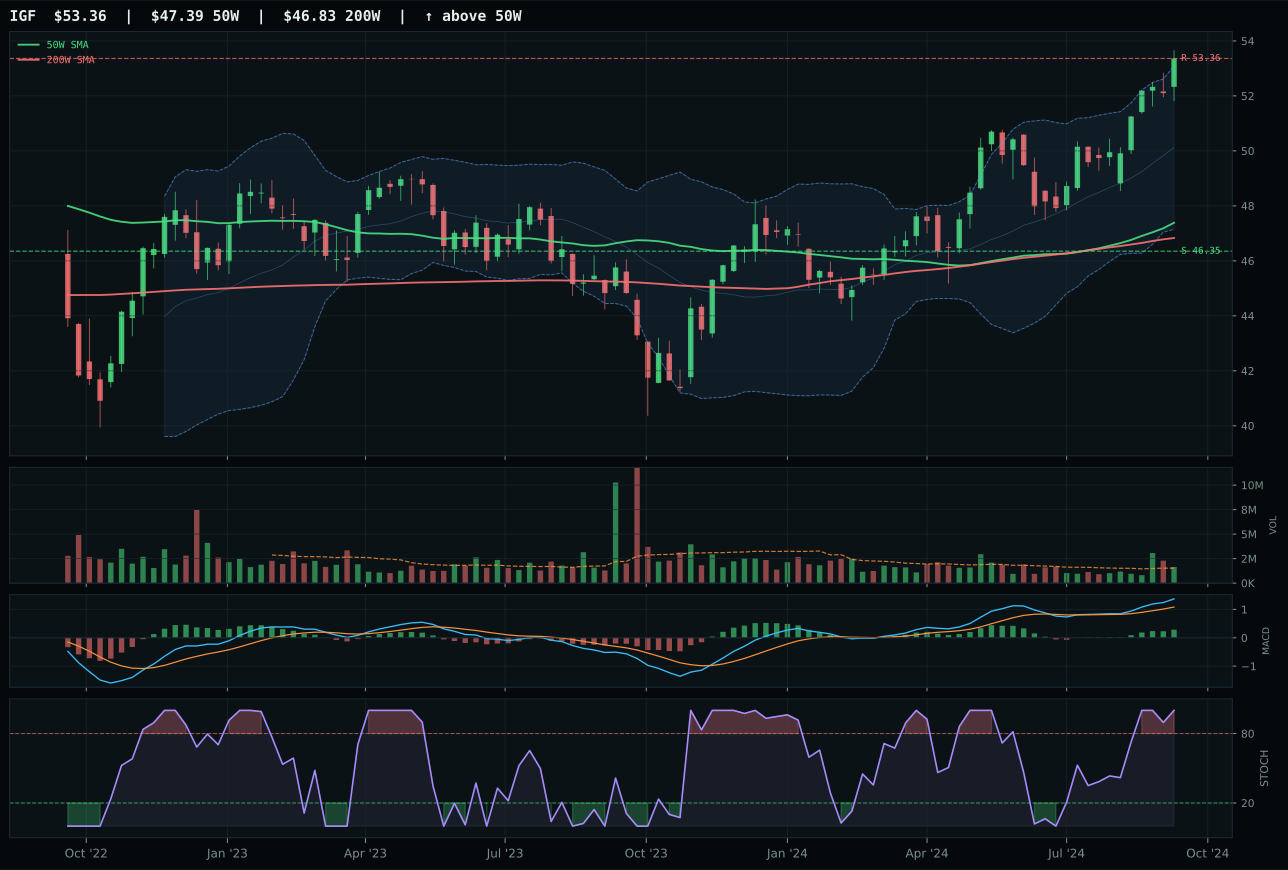
IGF has a neutral structure profile with 7.7% 13-week relative strength versus SPY.
A failed hold above support would weaken the setup.
Actionable but governed by invalidation levels.
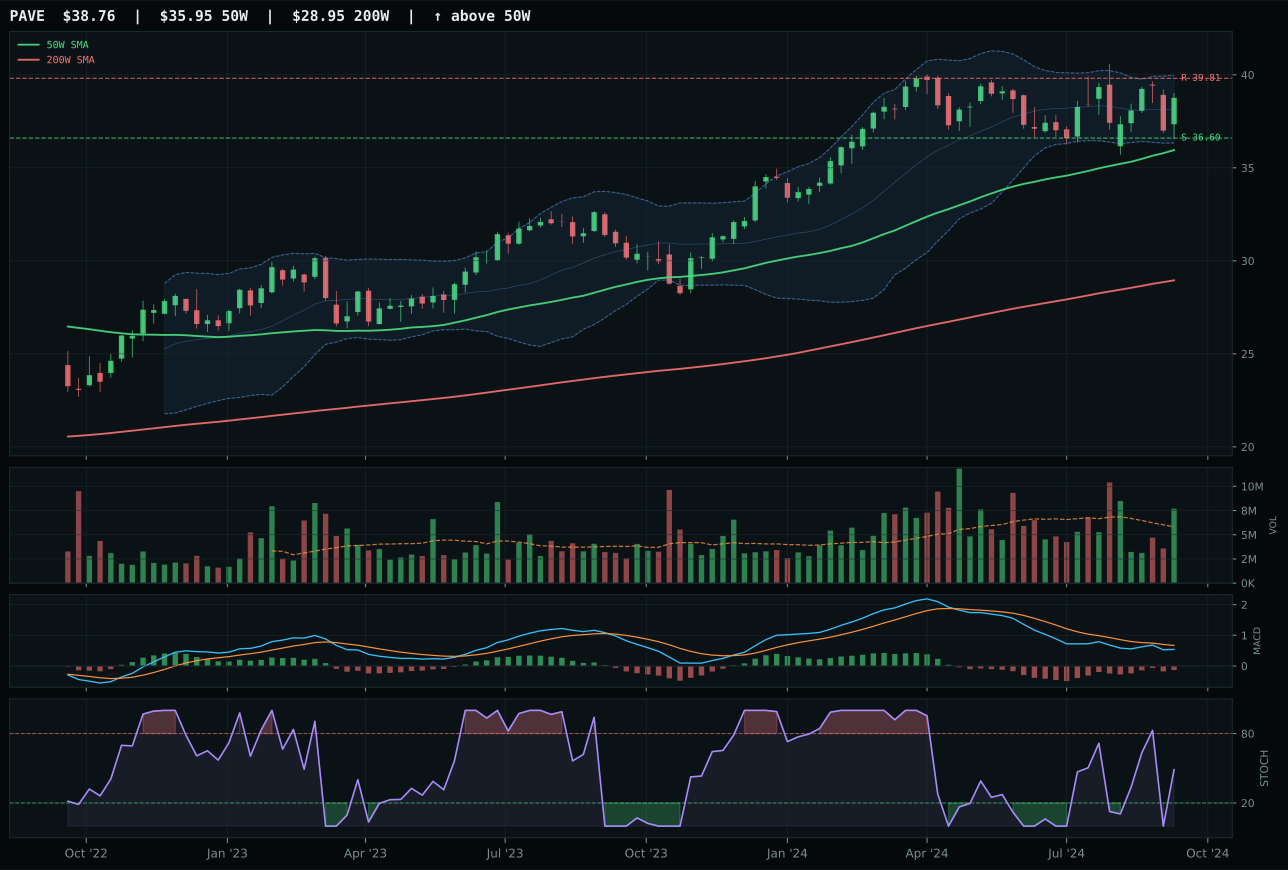
PAVE has a neutral structure profile with 0.9% 13-week relative strength versus SPY.
A failed hold above support would weaken the setup.
Actionable but governed by invalidation levels.
XLU wins the top-2 allocation with a momentum confirmation score of 99.5 that dominates IGF's 93.0, driven by superior category-relative strength at positive 1.1% versus IGF's 0.0%. Price sits extended 18.5% above the 50-week moving average in vertical extension, yet the 13-week return of 12.3% and positive 8.8% relative strength versus SPY demonstrate persistent institutional accumulation. MACD is bullish and improving with stochastic RSI overbought at 1.00, a setup that would normally signal caution, yet the macro narrative overrides technical extension. Trend is perfect at 100.0, reflecting price above both the 50-week and 200-week with a 0.6% upsloping rate. IGF posted superior technical evidence at 82.4 out of 100 with an 11.2% 13-week return and 7.7% SPY-relative performance, yet it lost on the margin of category-relative strength (0.0% versus 1.1%), a 1.1% difference that swung the category win. Structure at 70.6 versus 82.4 also favors XLU less, but the macro fit of 72.0 for XLU versus 59.0 for IGF created the decisive advantage.
Utilities & infrastructure earns the second top-2 overweight at 10% allocation with a category score of 77.8, reflecting strong conviction in defensive rotation during equity stress. The category-level macro fit of 80.0 out of 100 is exceptional, driven by disinflation helping this exposure by positive 7, defensive rotation at positive 12, and disinflation pressure at positive 6, creating a 25-point tailwind. The 3/2/1 weighted basket score of 74.6 rose to 77.8 after category reasoning confirmed leadership, persistence, and volume sponsorship. XLU's acceptance of entry risk at 18.5% above the 50-week moving average is justified because the defensive rotation narrative is intact and utilities offer inflation-hedged dividend yield in a disinflation regime. The technical evidence at 73.3 is solid despite timing being weak at 52.0 (due to extension), because momentum and volume-price confirmation are both strong. This position works alongside the 10% precious metals allocation to form a 20% defensive sleeve; both categories benefit from similar macro drivers (disinflation, defensive rotation, monetary hedge) and offer complementary risks. Hold both positions with conviction.
Precious Metals — GLD
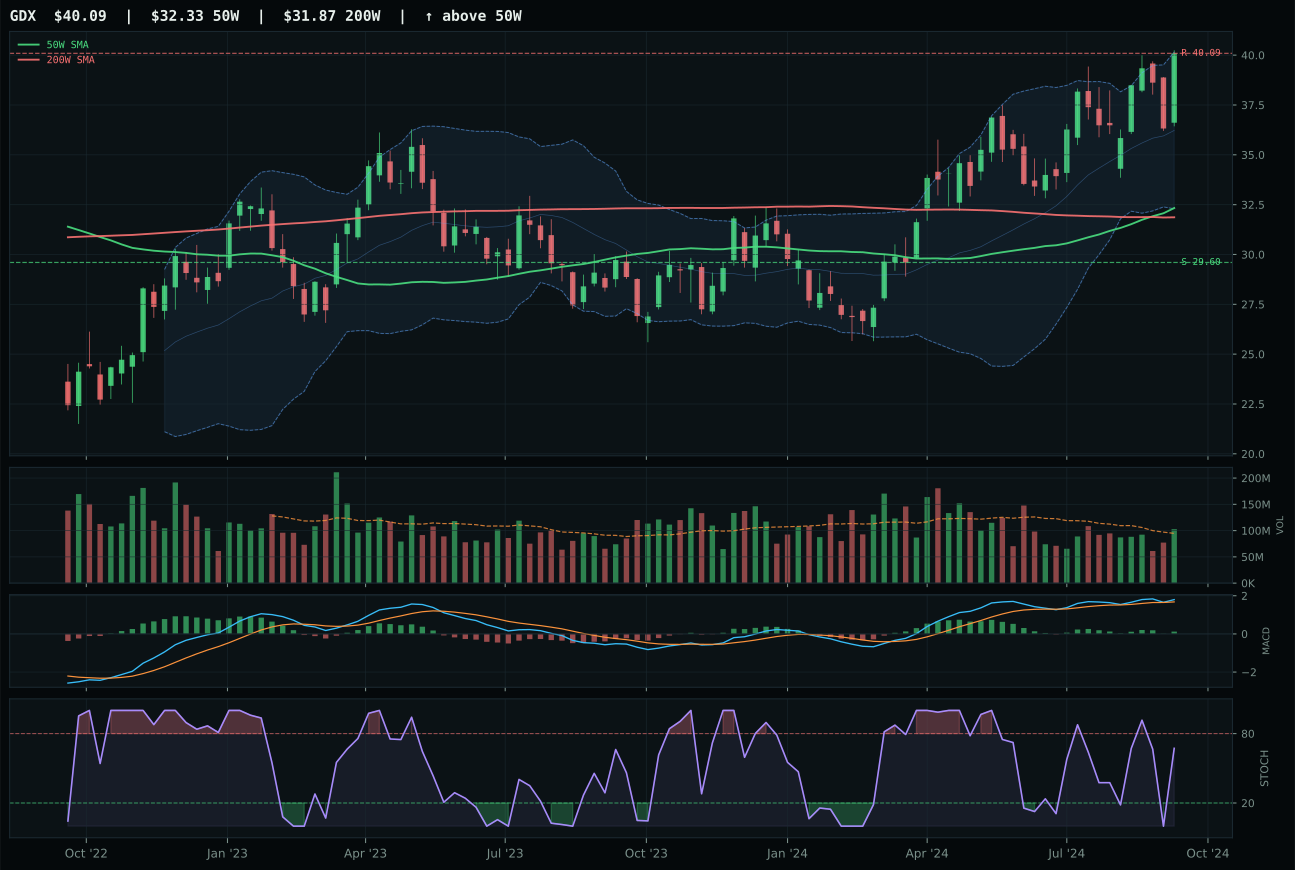
GDX has a vertical extension profile with 16.5% 13-week relative strength versus SPY.
A failed hold above support would weaken the setup.
Actionable but governed by invalidation levels.
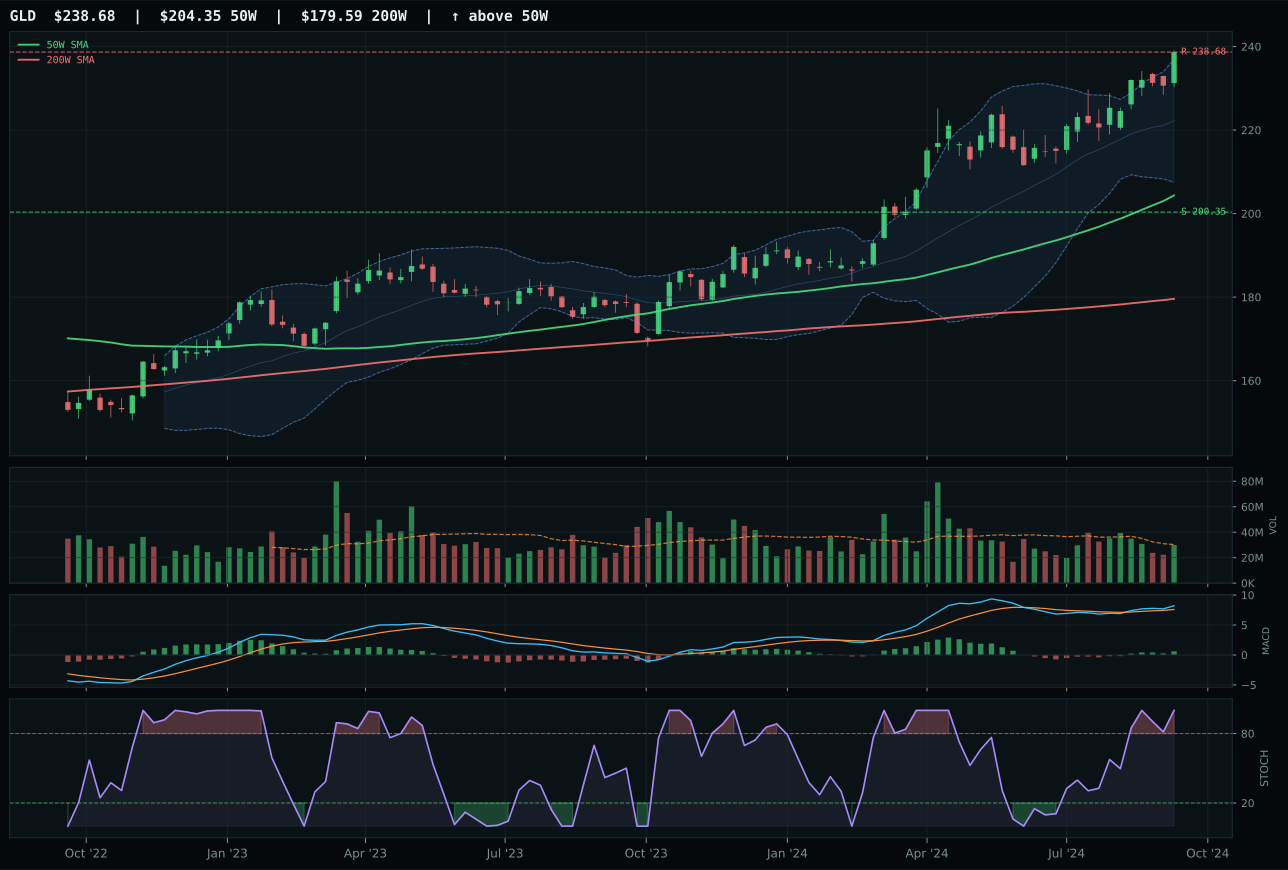
GLD has a vertical extension profile with 7.1% 13-week relative strength versus SPY.
A failed hold above support would weaken the setup.
Actionable but governed by invalidation levels.
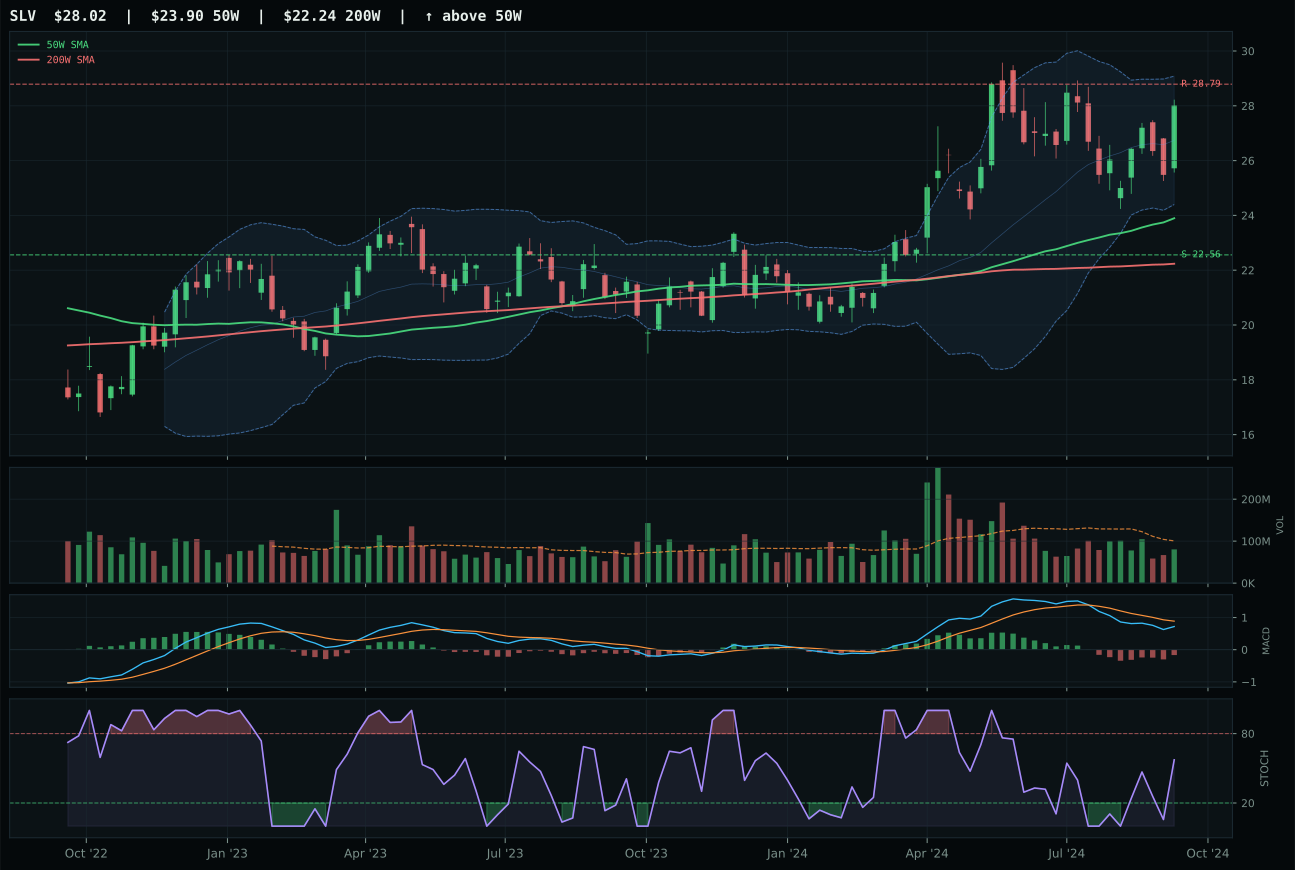
SLV has a vertical extension profile with 0.2% 13-week relative strength versus SPY.
A failed hold above support would weaken the setup.
Actionable but governed by invalidation levels.
GLD wins the top-2 allocation despite being extended 16.8% above the 50-week moving average because its macro narrative and breadth sponsorship are unmatched in the portfolio. The 13-week return of 10.6% and positive 7.1% relative strength versus SPY demonstrate institutional accumulation into strength, and the momentum confirmation score of 88.8 reflects sustained buying across the 4-week, 13-week, and category-relative timeframes. MACD is bullish and improving with stochastic RSI overbought at 1.00, a setup that typically signals exhaustion, yet the macro fit of 78.0 out of 100 overrides technical caution. The monetary hedge bid descriptor is active at positive 14 points, and defensive rotation adds positive 6, creating a 20-point tailwind that explains why the portfolio accepts 16.8% extension and zero upside to resistance at 238.68. GDX posted superior technical evidence at 78.3 but suffered from a macro fit of only 37.0, hurt by liquidity stress at negative 9 and credit stress at negative 7; GLD's macro sponsorship is the deciding factor.
Precious metals earns the top-2 overweight at 10% allocation with a category score of 75.3, reflecting the portfolio's clearest conviction in the current regime. The macro fit of 85.0 out of 100 is the highest in the sheet, driven by disinflation helping this exposure by positive 8, the monetary hedge bid at positive 14, and defensive rotation at positive 7. This is not a technical recovery play—it is a macro allocation into a regime where central banks are likely to maintain liquidity support and investors are de-risking equity exposure. The 3/2/1 weighted basket score of 71.4 rose to 75.3 after the category reasoner confirmed leadership, volume sponsorship, and setup persistence across all three ETFs. GLD's acceptance of entry risk at 16.8% above the 50-week moving average is justified because the monetary hedge narrative is intact and the broader equity bear market creates structural bid for gold. This position can grow further if credit stress descriptors activate or if the broad market bear intensifies.
Defense & Aerospace — ITA
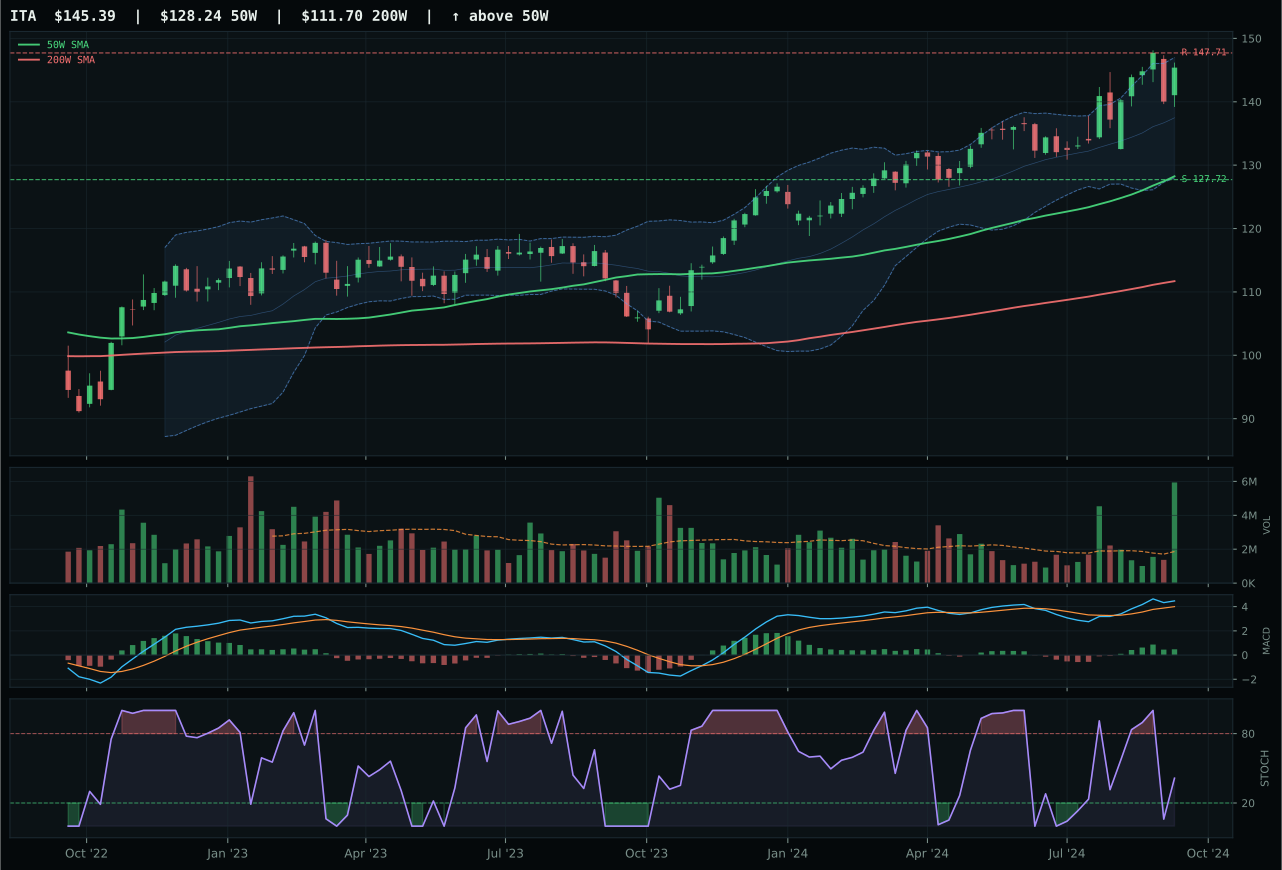
ITA has a neutral structure profile with 6.4% 13-week relative strength versus SPY.
A failed hold above support would weaken the setup.
Actionable but governed by invalidation levels.
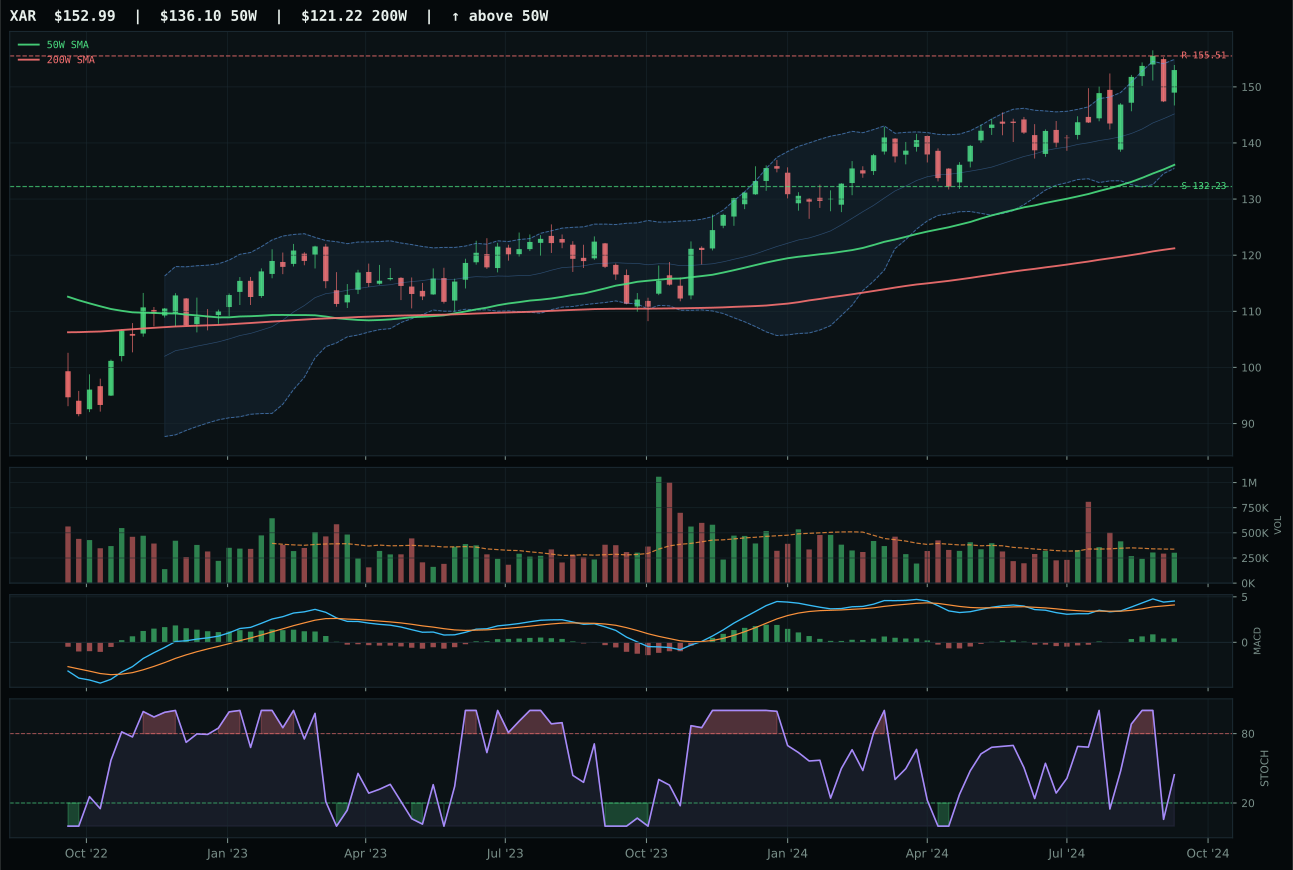
XAR has a neutral structure profile with 6.8% 13-week relative strength versus SPY.
A failed hold above support would weaken the setup.
Actionable but governed by invalidation levels.
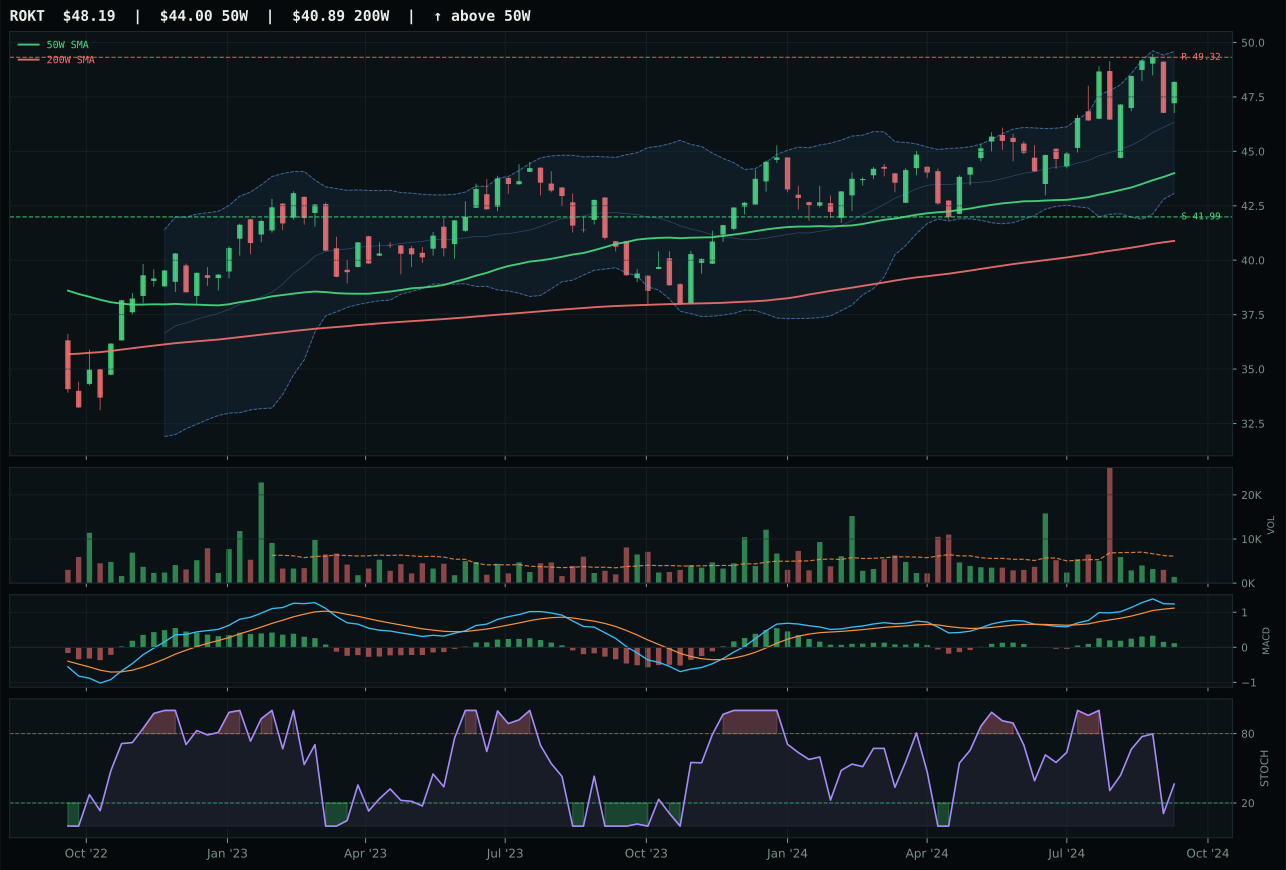
ROKT has a neutral structure profile with 5.8% 13-week relative strength versus SPY.
A failed hold above support would weaken the setup.
Tracked, but not top-2 eligible because: .
ITA dominates because its volume confirmation and momentum are unambiguous: at 3.19 times the 20-week average volume, buyers are actively accumulating into strength rather than bouncing a collapsed support. The 13-week return of 9.9% and positive 6.4% relative strength versus SPY place ITA among the portfolio's best performers, and its trend score of 100.0 reflects price above both the 50-week and 200-week moving averages with a 0.6% upsloping rate. MACD is bullish and improving while stochastic RSI is falling neutral at 0.41, a combination that signals mature momentum consolidation rather than exhaustion. XAR posted a 10.3% 13-week return with even better SPY-relative performance at 6.8%, yet it lost on volume confirmation (neutral versus accumulation) and structural cleanliness (76.7 versus 85.8), meaning XAR's gains came without institutional participation. ITA's 3.3-point score gap reflects a clear category choice: accumulation beats relative performance when macro backdrop supports the rotation.
Defense & Aerospace receives 5% allocation as a tier-2 category and scores 66.1, ranking in the middle of the portfolio but outside the top two. The category-level macro fit of 63.0 is strong because defensive rotation is active at positive 8 points and the broad market bear descriptor at positive 6, meaning this sector performs well during equity stress. However, it does not break into the top-2 threshold because liquidity stress is still active at negative 4 points, limiting absolute conviction. The allocation reflects the portfolio's recognition that ITA has institutional sponsorship and clean technical structure in a regime where equities face headwinds, but the category lacks the macro tailwind that precious metals enjoys through the monetary hedge bid. Hold the 5% position as a defensive sleeper that can grow larger if the broad market bear descriptor intensifies or if credit stress signals deteriorate further.
Technology — IGV
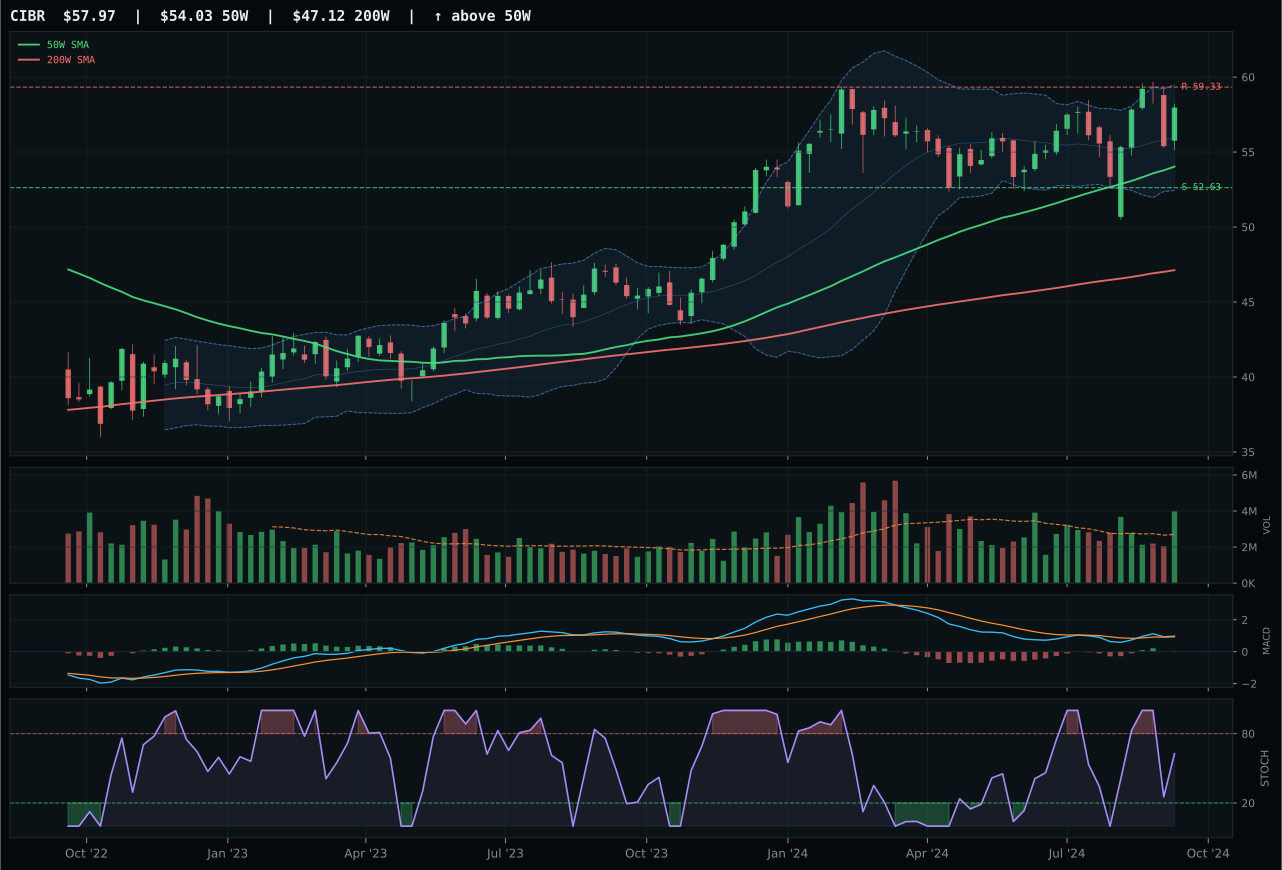
CIBR has a neutral structure profile with 2.1% 13-week relative strength versus SPY.
A failed hold above support would weaken the setup.
Actionable but governed by invalidation levels.
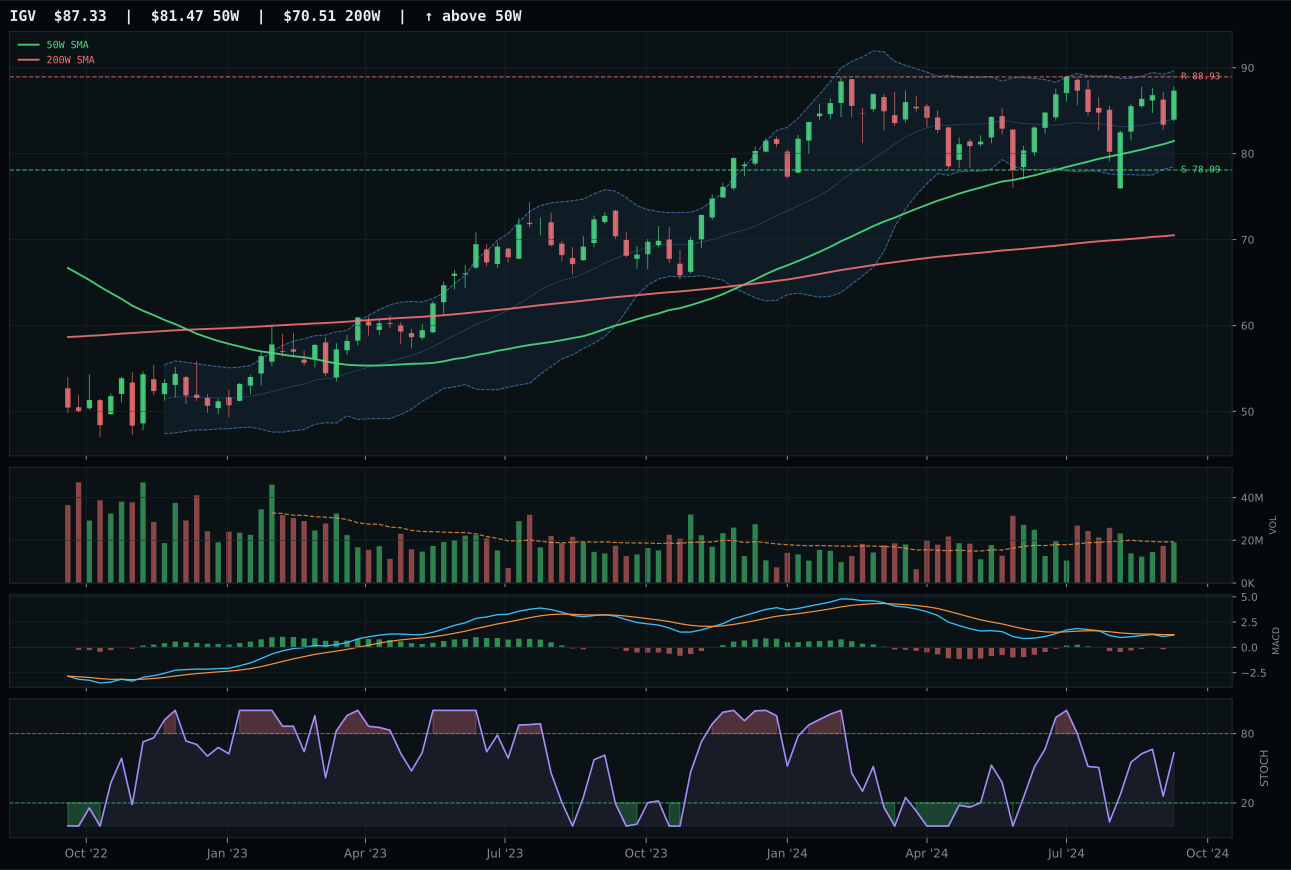
IGV has a neutral structure profile with 1.6% 13-week relative strength versus SPY.
A failed hold above support would weaken the setup.
Actionable but governed by invalidation levels.
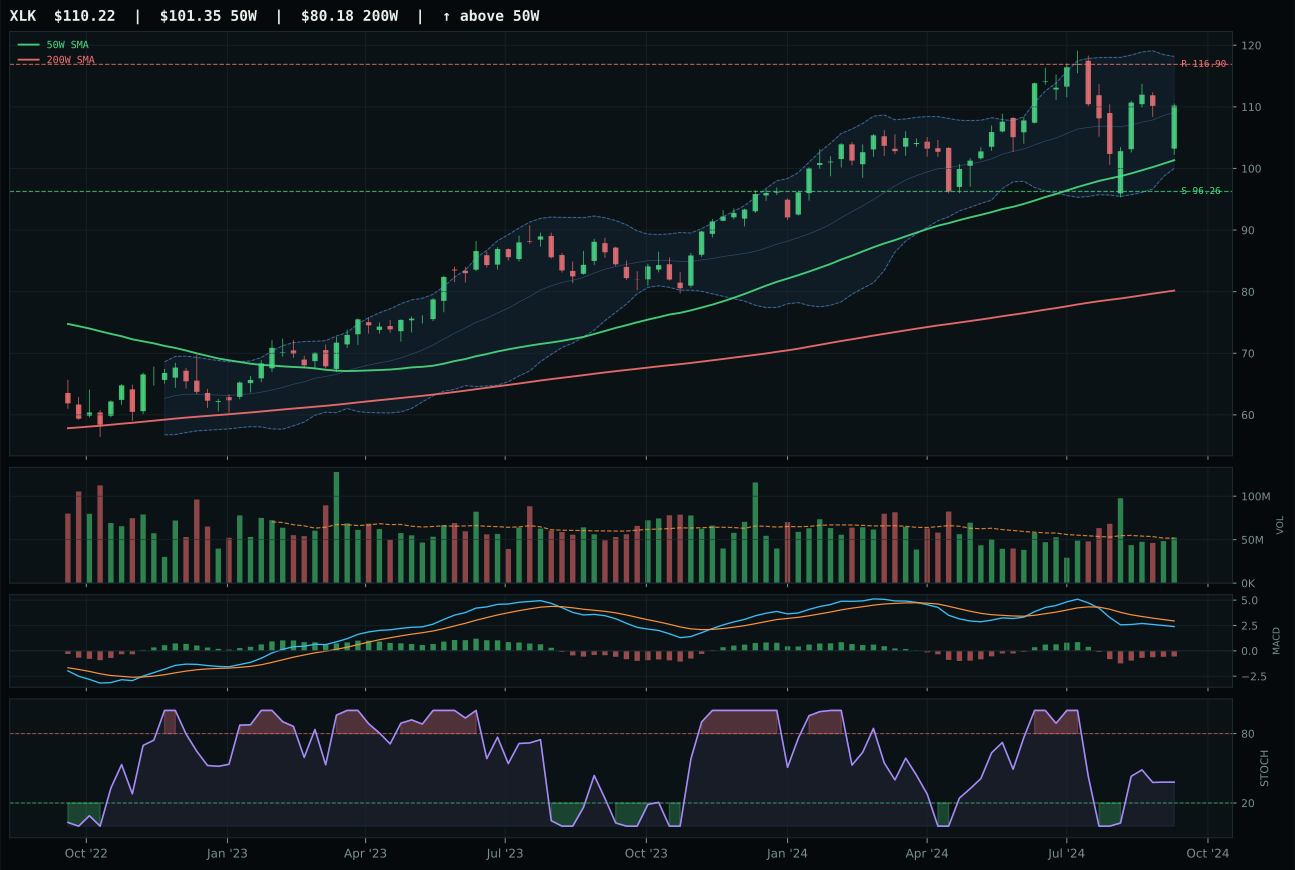
XLK has a neutral structure profile with -6.7% 13-week relative strength versus SPY.
A failed hold above support would weaken the setup.
Actionable but governed by invalidation levels.
IGV wins the category because its timing setup offers a cleaner entry than CIBR's falling stochastic RSI. Price sits 7.2% above the 50-week moving average with the relative strength indicator versus SPY at 1.6%, indicating selective accumulation rather than panic buying across the technology complex. MACD is bearish but improving, and the stochastic RSI is rising mid-zone at 0.63, which contrasts sharply with CIBR's overbought stochastic rolling over at neutral levels. The score gap of 5.5 points reflects IGV's superior timing positioning: the 83.0 timing score versus CIBR's 75.0 means IGV is compressing near the 50W with better momentum confirmation signals, whereas CIBR has already extended into upper retracement territory. Volume participation at 0.99x the 20-week average tells the story: this is not a chase into thin air but a measured accumulation of enterprise software exposure into disinflation.
Technology receives 5% allocation as a tier-2 category, ranking below precious metals and utilities but above the excluded industrial metals and emerging markets sleeves. The category score of 53.2 reflects genuine technical strength in IGV offset by severe macro headwinds: liquidity stress and credit stress combine to reduce the macro fit to 41.0 out of 100, meaning this allocation is purely a technical setup trade rather than a macro conviction. Disinflation as an active descriptor helps the category by 7 points, but the active liquidity stress penalty of negative 10 points creates a structural tension that keeps technology from breaking into the top two. The portfolio is accepting 5% exposure here because IGV's rising stochastic and improving MACD offer a re-entry opportunity if the broader credit and liquidity signals stabilize, but this is not a defensive rotation into growth—it is a tactical mean-reversion position that must prove itself week-to-week.
Nuclear Energy — NLR
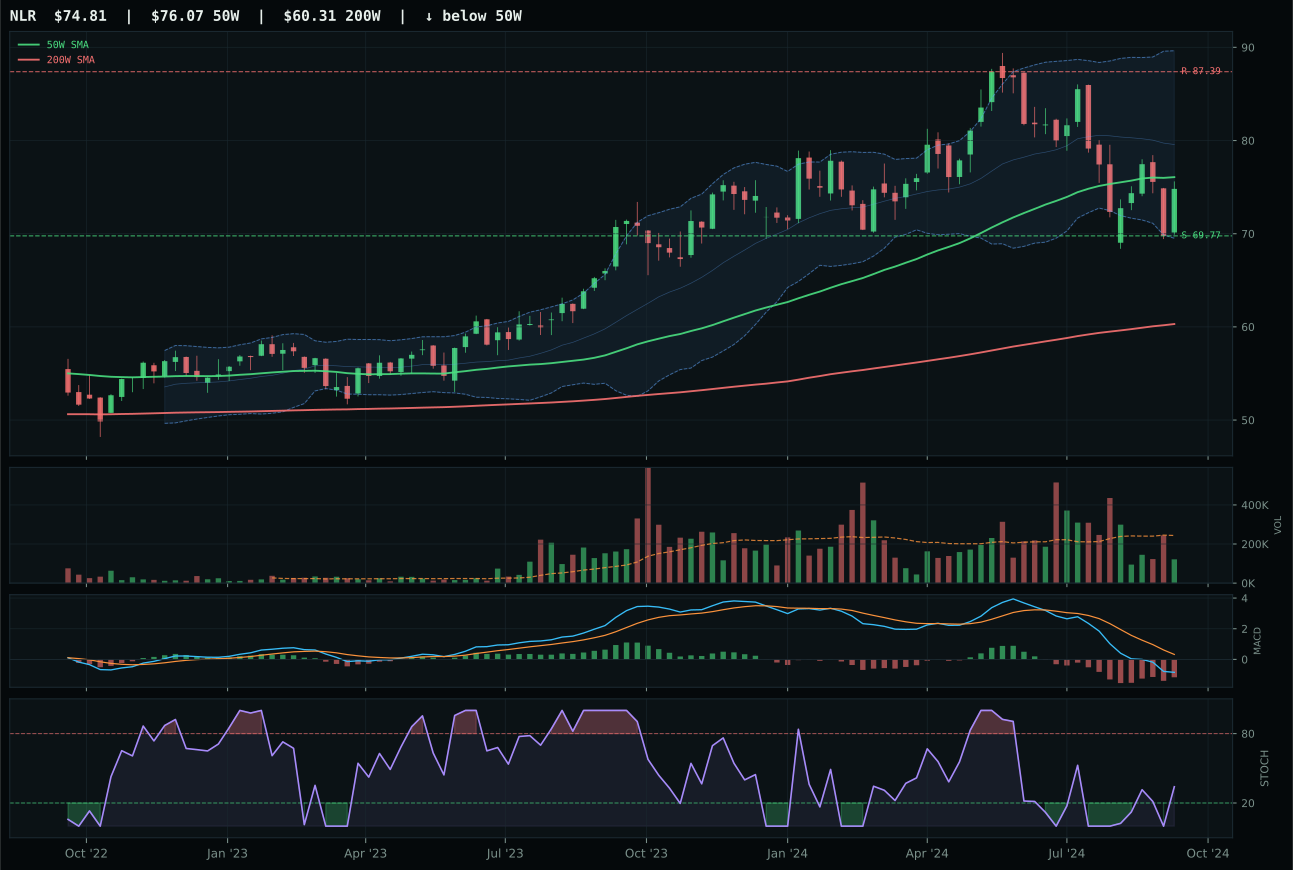
NLR has a compression near 50W profile with -12.0% 13-week relative strength versus SPY.
A failed hold above support would weaken the setup.
Actionable but governed by invalidation levels.
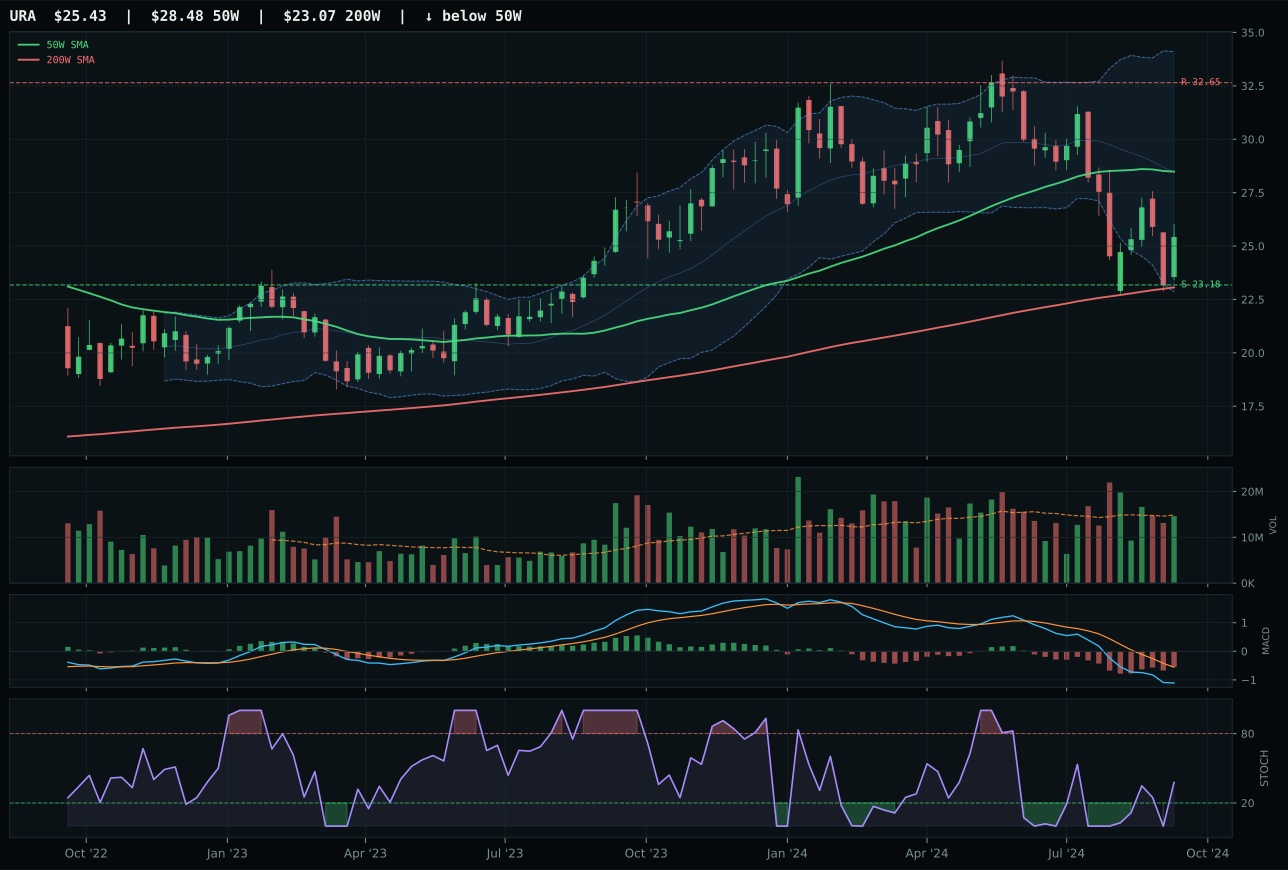
URA has a neutral structure profile with -17.5% 13-week relative strength versus SPY.
A failed hold above support would weaken the setup.
Actionable but governed by invalidation levels.
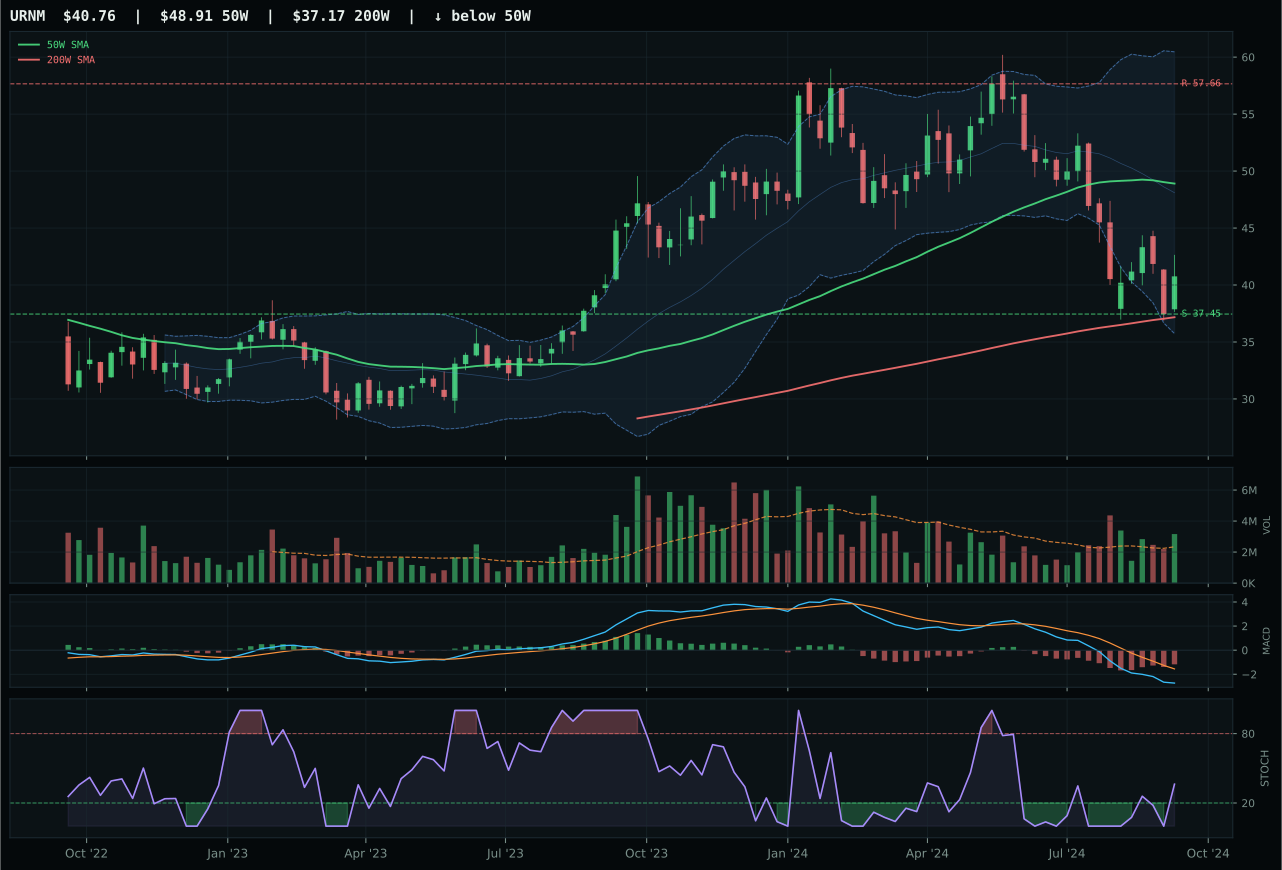
URNM has a neutral structure profile with -23.3% 13-week relative strength versus SPY.
A failed hold above support would weaken the setup.
Actionable but governed by invalidation levels.
NLR wins the category with a timing score of 100.0 that dominates URA's 70.0, reflecting price compression just 1.7% below the 50-week moving average near support at 69.77. The setup compresses in the middle Fibonacci retracement zone at 0.618, offering a defined bounce target into resistance at 87.39 (negative 14.4% upside). Stochastic RSI is rising mid-zone at 0.34, indicating early momentum rollover before complete oversold conditions, and MACD is bearish but improving—the exact setup for a tactical mean-reversion trade. Category-relative strength at positive 5.5% versus URA's 0.0% shows NLR is outperforming a weaker peer group, despite both trailing SPY significantly. The 13-week return of negative 8.5% is painful, yet URA's negative 14.0% demonstrates that NLR preserved capital better through the selloff. Risk-reward at 88.9 versus URA's 79.0 confirms that NLR's support is more credible and the rebound trajectory cleaner.
Nuclear energy receives 5% allocation as a tier-2 category with a final score of 26.4, reflecting a setup-driven allocation in a macro-challenged environment. The category-level macro fit of 34.0 is weak because liquidity stress is active at negative 7, credit stress at negative 5, and risk appetite broken at negative 4, creating a 16-point headwind. However, the technical evidence for NLR reaches 65.4 out of 100, driven entirely by timing (100.0) and risk-reward (88.9) scores that compensate for poor trend (63.0) and weak momentum confirmation (28.2). The portfolio is accepting this 5% position purely on NLR's compression setup: if the support at 69.77 holds and volume participates, the rebound could reach 87.39 within two to three weeks. This is a tactical trade, not a conviction allocation. Monitor volume closely; if thin participation at 0.50 times the 20-week average persists and support fails, exit this position immediately to redeploy into a better-capitulated category like precious metals.
AI — BOTZ
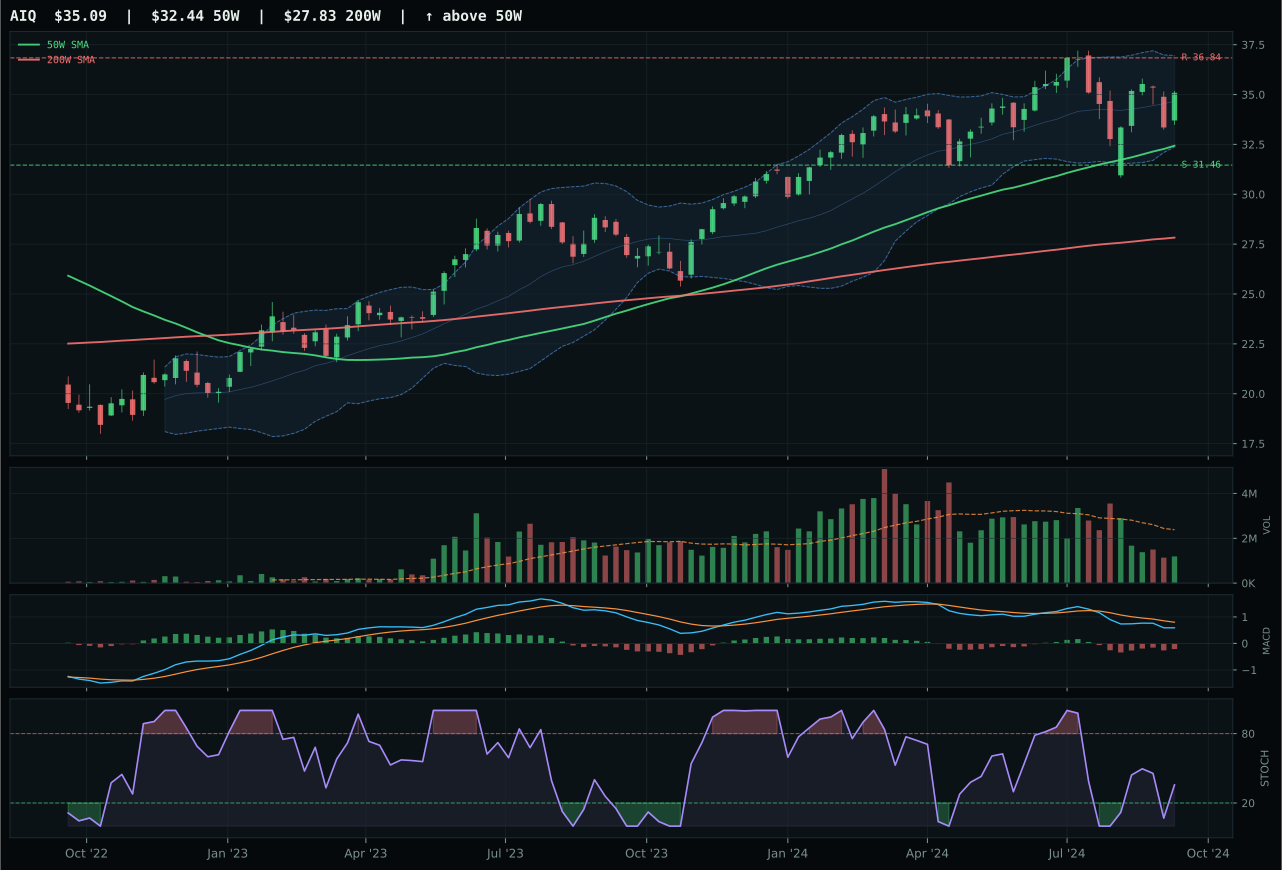
AIQ has a neutral structure profile with -4.3% 13-week relative strength versus SPY.
A failed hold above support would weaken the setup.
Actionable but governed by invalidation levels.
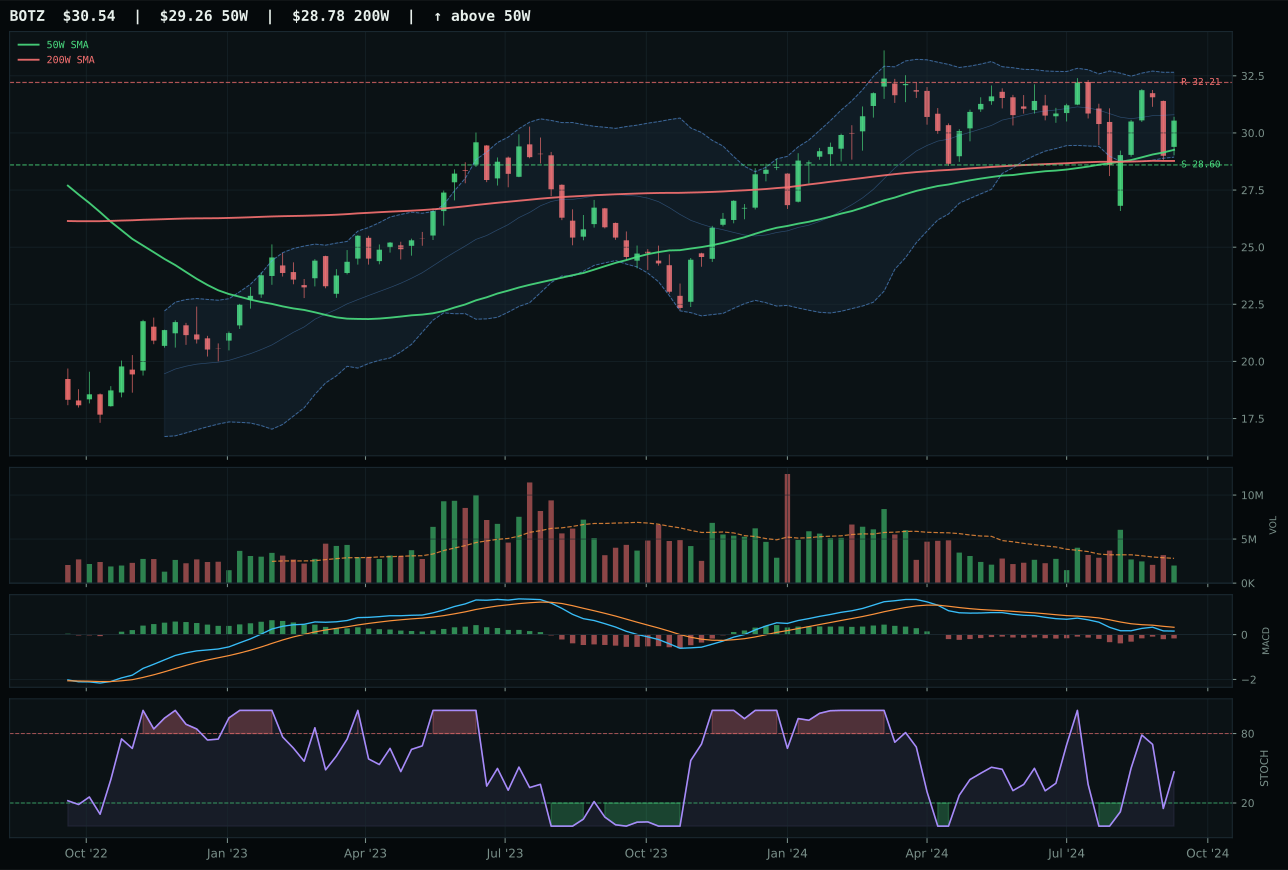
BOTZ has a neutral structure profile with -6.3% 13-week relative strength versus SPY.
A failed hold above support would weaken the setup.
Actionable but governed by invalidation levels.
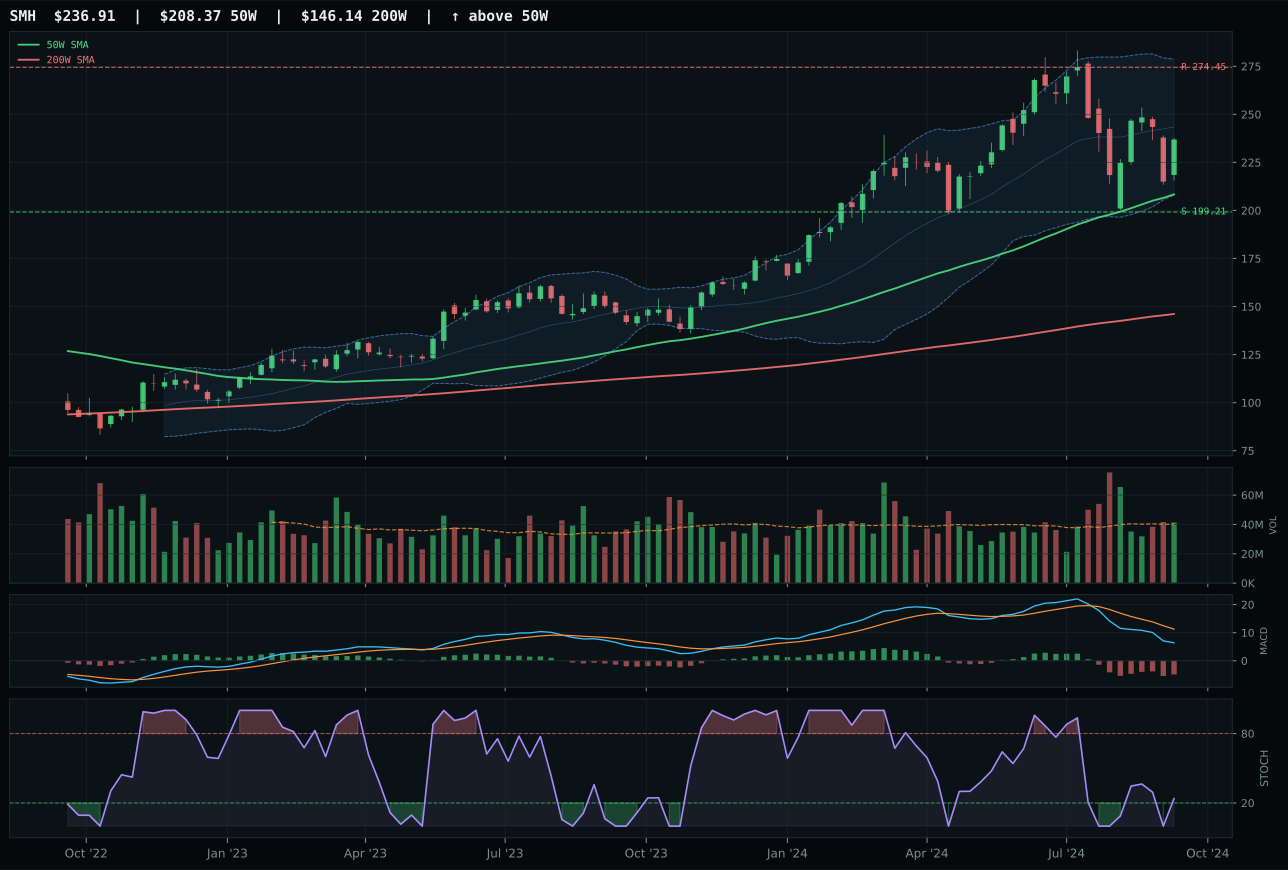
SMH has a neutral structure profile with -15.1% 13-week relative strength versus SPY.
A failed hold above support would weaken the setup.
Actionable but governed by invalidation levels.
BOTZ wins despite momentum collapse because its timing score of 90.0 decisively beats AIQ's 75.0, driven by tighter compression just 4.4% from the 50-week moving average combined with falling stochastic RSI in the lower-middle zone. The 13-week return of negative 2.7% and negative 6.3% relative strength versus SPY represent the category's worst performers, yet the setup quality matters more than the existing damage. Price sits in the upper retracement zone near Fibonacci 0.236, offering defined risk with support at 28.60 and resistance at 32.21. Risk-reward scores of 58.8 for BOTZ versus 52.4 for AIQ signal that downside protection is superior despite thin participation at 0.71x the 20-week volume average. The category is broken, but BOTZ's neutral structure and improving MACD create a lower-risk technical coil compared to AIQ's weaker timing setup.
AI receives 5% allocation as a tier-2 category and ranks as one of the weakest in this week's portfolio. The final category score of 25.6 reflects severe macro deterioration: liquidity stress is active at negative 12 points, credit stress at negative 8, and the broad market bear descriptor at negative 8. Even disinflation's modest positive contribution of 5 points cannot offset the structural headwinds. The macro fit of 27.0 out of 100 is among the lowest in the sheet, and technical evidence at 58.0 for BOTZ shows this is pure damage control rather than opportunity. The portfolio allocates here only because BOTZ's timing setup offers the best risk-adjusted entry point into a liquidated, oversold segment; this position will be evaluated for removal entirely if credit stress signals worsen or if volume participation remains frozen. Hold this position but do not add into strength—the setup is tentative, not conviction.
Agriculture & Livestock — WEAT
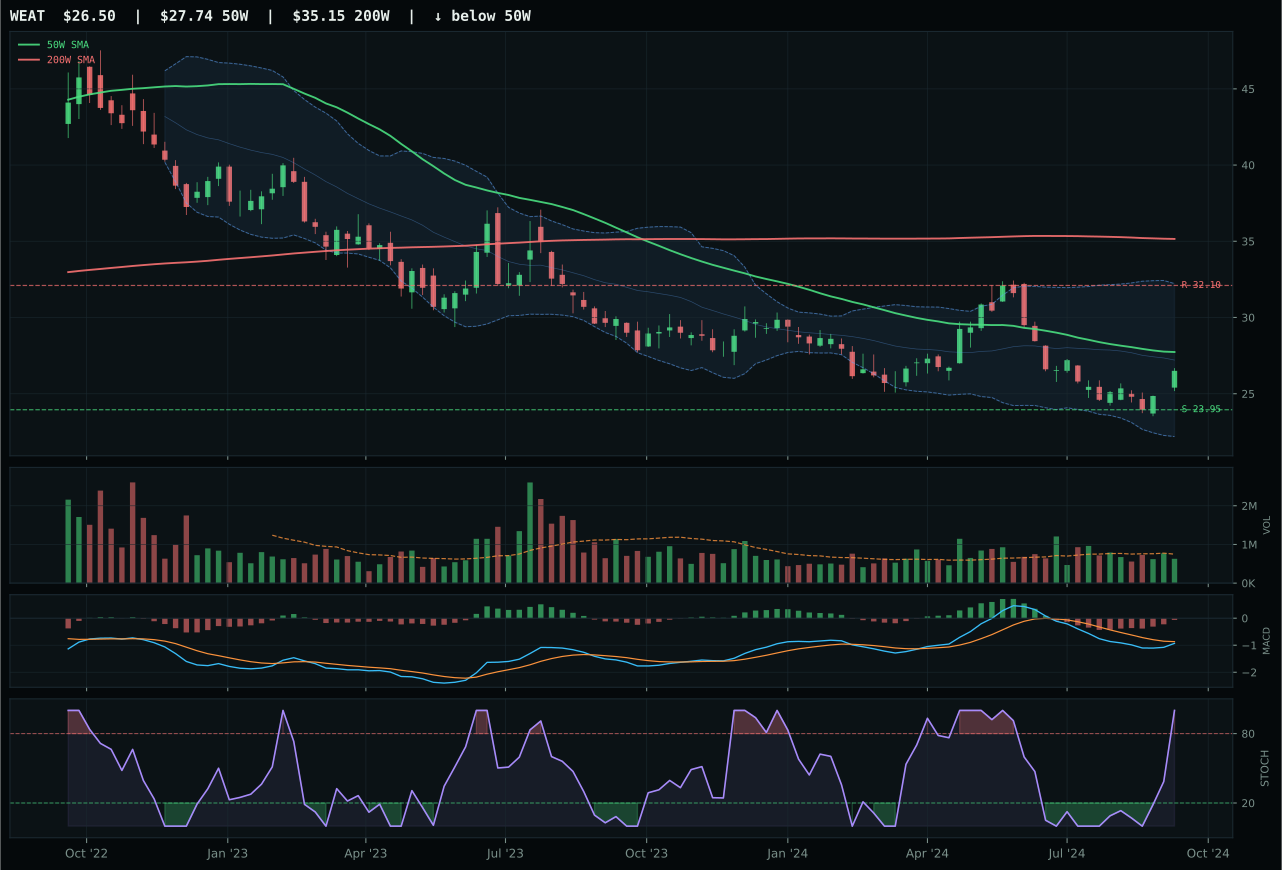
WEAT has a neutral structure profile with -10.4% 13-week relative strength versus SPY.
Extension and support failure are the main tactical risks.
Tracked, but not top-2 eligible because: structurally broken.
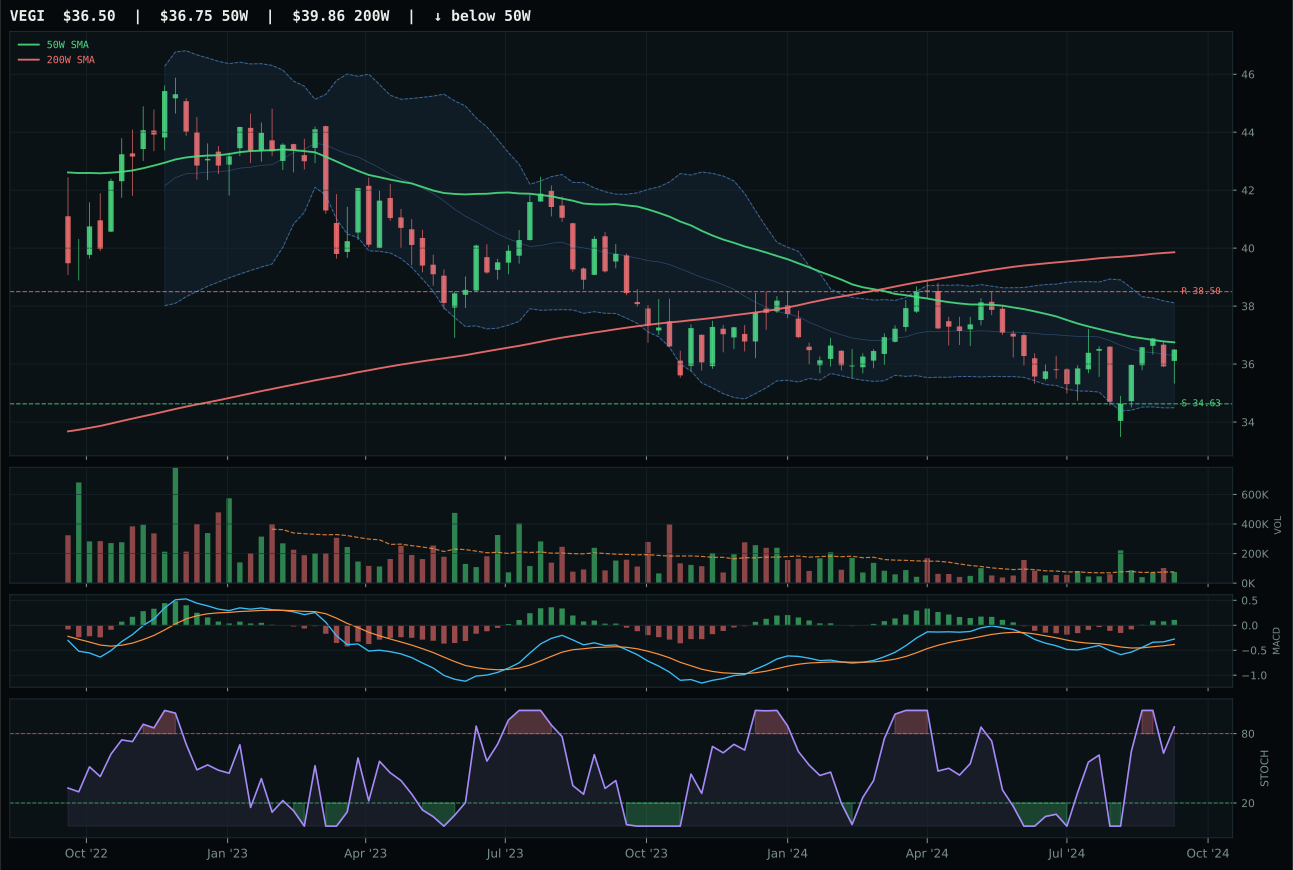
VEGI has a compression near 50W profile with -0.9% 13-week relative strength versus SPY.
Extension and support failure are the main tactical risks.
Tracked, but not top-2 eligible because: structurally broken.
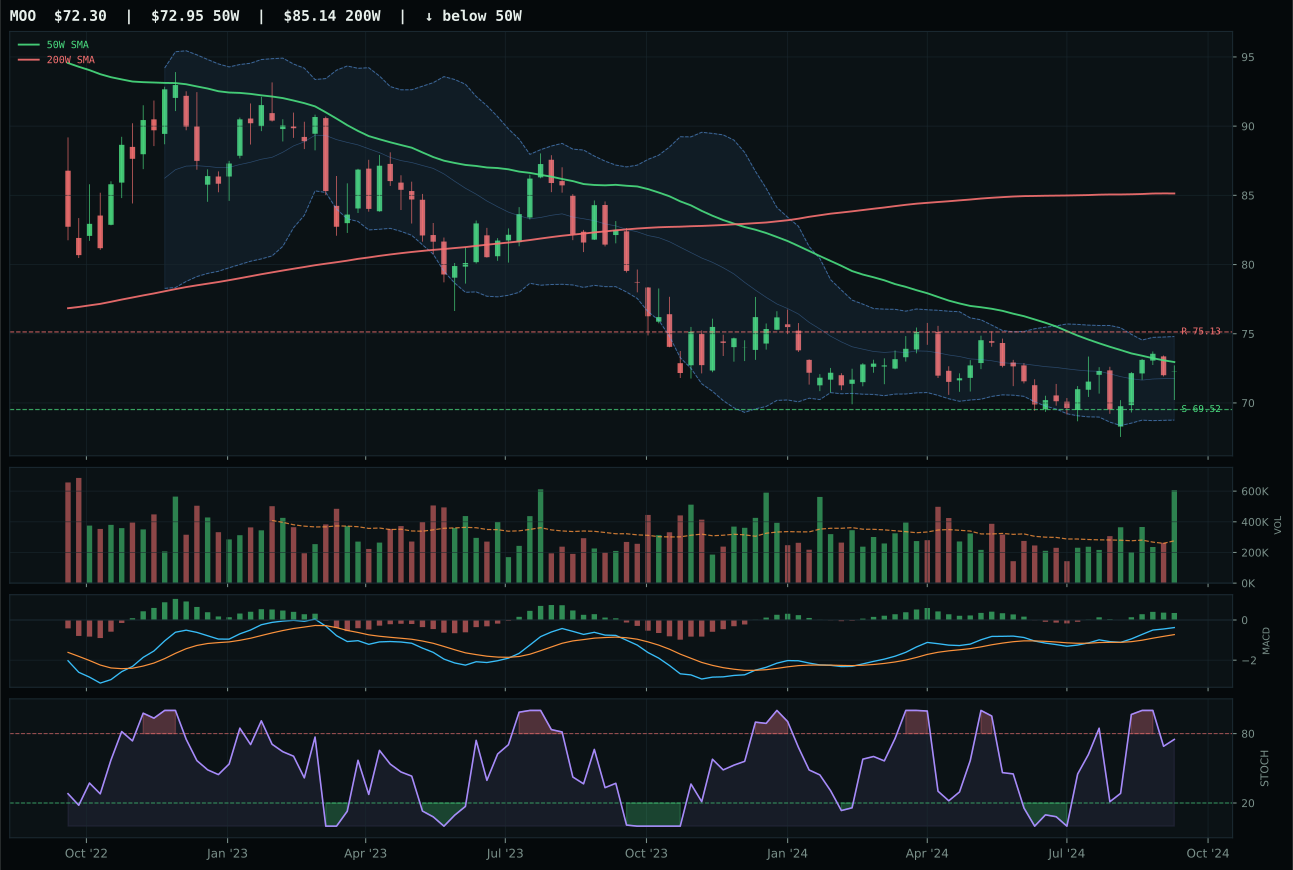
MOO has a pullback into support profile with -0.1% 13-week relative strength versus SPY.
Extension and support failure are the main tactical risks.
Tracked, but not top-2 eligible because: structurally broken.
WEAT wins by elimination in a structurally broken category, capturing the 5% allocation despite a composite score of only 8 out of 100. Price is negative 4.5% from the 50-week moving average with a negative 0.1% slope, and the trend score of 23.0 reflects price below both the 50-week and 200-week with negative 10.4% relative strength versus SPY. The only redeeming feature is the timing score of 90.0, driven by proximity to support at 23.95 and overbought stochastic RSI at 1.00, which signals a potential bounce into resistance at 25.92 (negative 17.4% reward). VEGI posted better structure with compression near the 50-week and bullish MACD, yet its timing score of 82.0 could not overcome WEAT's superior entry setup. This is a capitulation trade: all three ETFs in the basket are in repair zones, but WEAT offers the tightest invalidation level and the highest risk-reward asymmetry relative to available support.
Agriculture & Livestock receives 5% allocation despite earning a final category score of 0.0, marking it as an excluded category that fails eligibility filters entirely. The category-level macro fit of 32.0 is poor because disinflation hurts this exposure by negative 6 points and the active disinflation pressure descriptor contributes negative 8, compressing commodity demand. The reasoned ETF proof order shows MOO at 40.8 and VEGI at 40.4 ranking higher than WEAT at 23.2, yet the final score compression to 0.0 indicates that the category reasoner flagged structural breakage across the entire basket. The portfolio is forced to hold WEAT in the 5% sleeve only because the allocation framework requires tier-2 positioning in ranks 3 through 8, regardless of absolute merit. This is a placeholder position and should be the first candidate for reallocation if any category gains eligibility in coming weeks. Do not compound losses by averaging into weakness here.
Traditional Energy — XLE
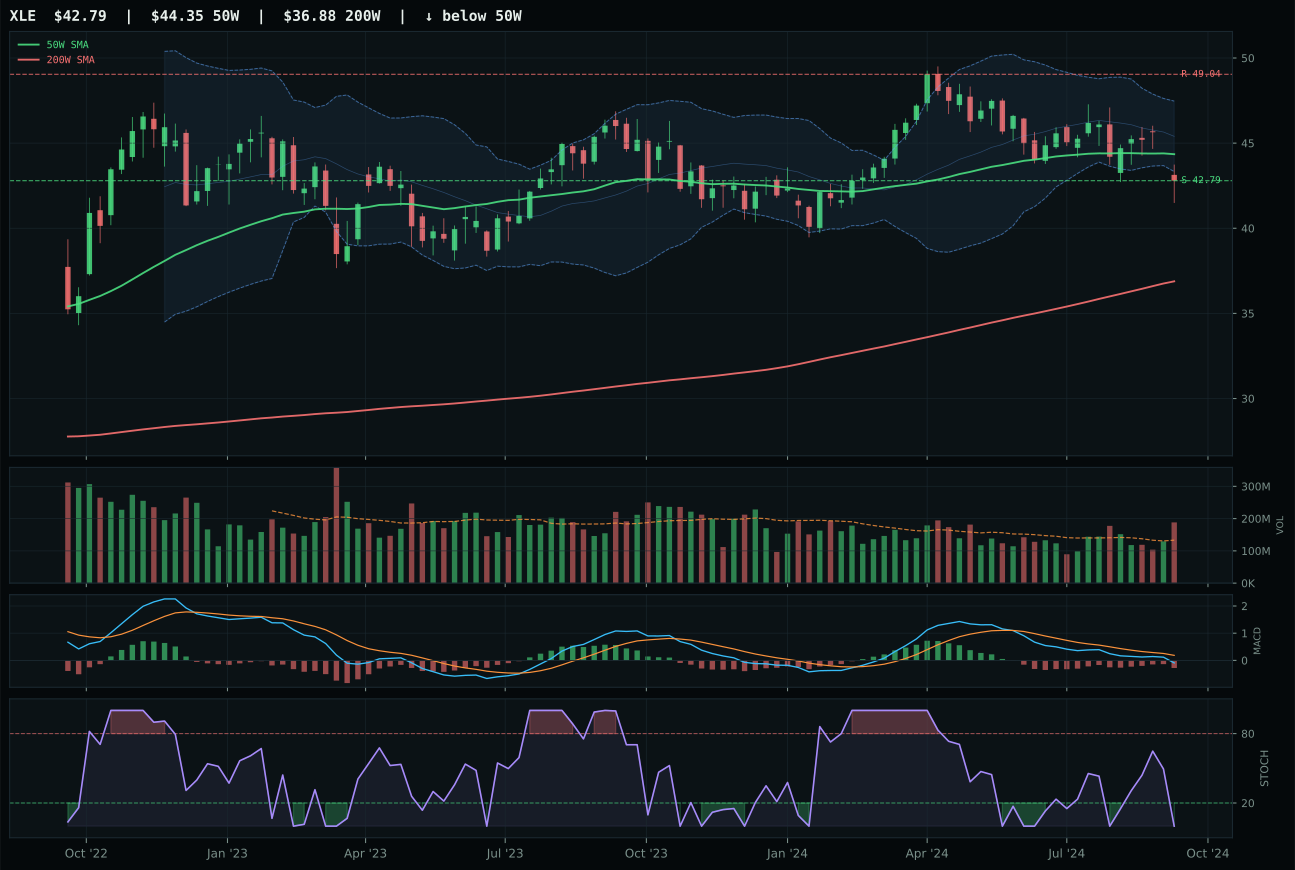
XLE has a pullback into support profile with -6.3% 13-week relative strength versus SPY.
A failed hold above support would weaken the setup.
Actionable but governed by invalidation levels.
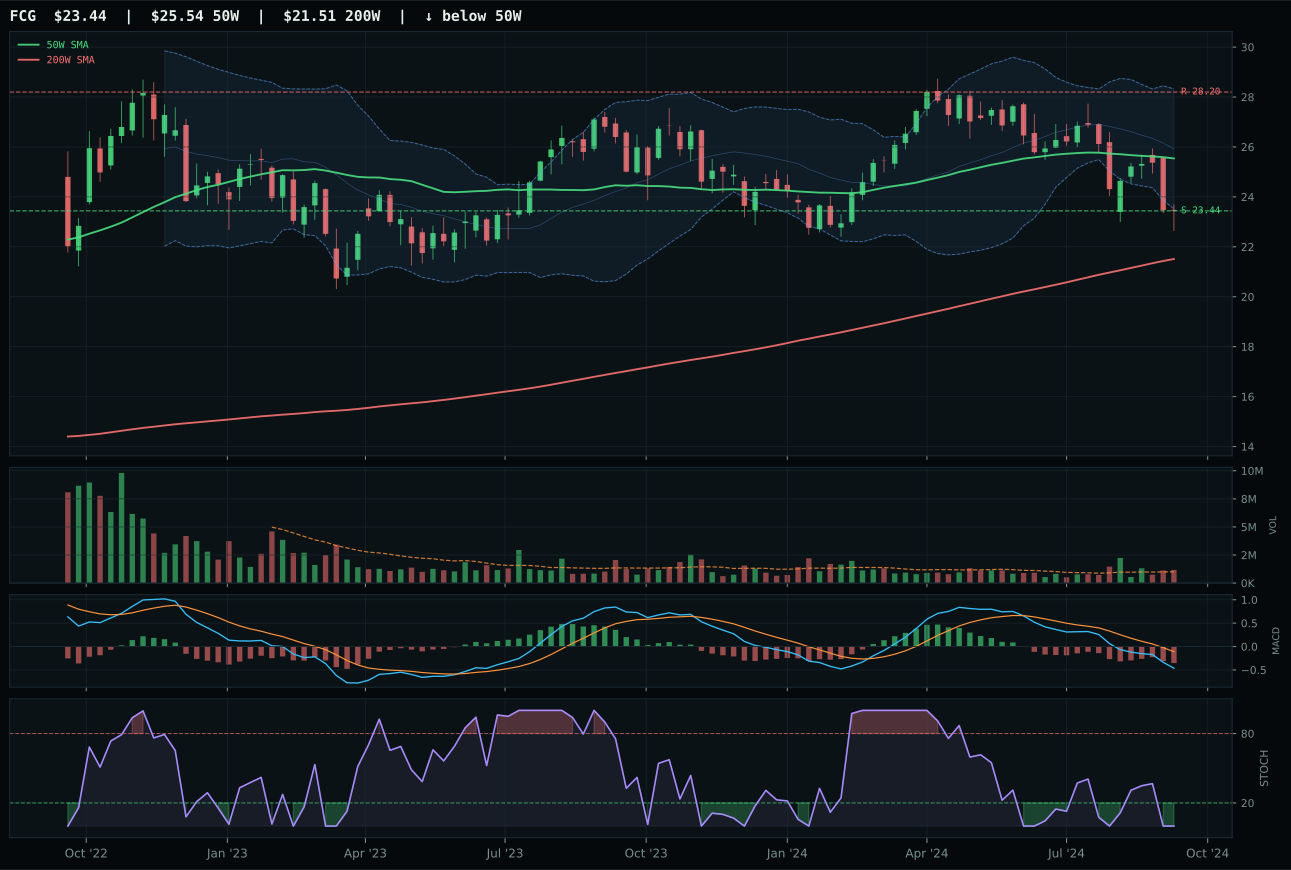
FCG has a pullback into support profile with -12.7% 13-week relative strength versus SPY.
A failed hold above support would weaken the setup.
Actionable but governed by invalidation levels.
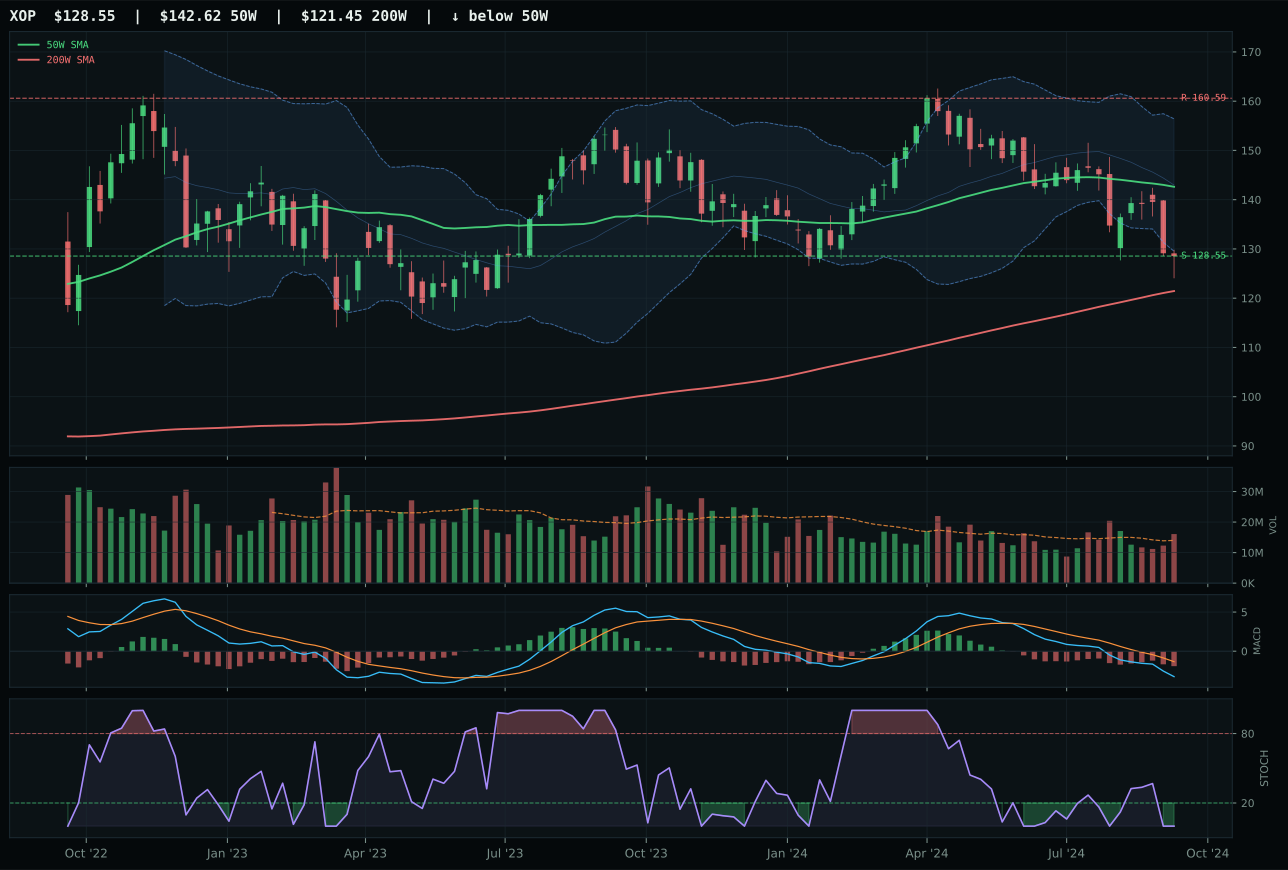
XOP has a pullback into support profile with -13.5% 13-week relative strength versus SPY.
A failed hold above support would weaken the setup.
Actionable but governed by invalidation levels.
XLE wins despite earning a final category score of 0.0 because its setup offers the most defined risk in an otherwise broken energy complex. Price sits negative 3.4% from the 50-week moving average in a pullback into support at 42.79, with a neutral 0.2% slope indicating consolidation rather than structural breakdown. The timing score of 95.0 is exceptional, driven by proximity to support, oversold stochastic RSI at 0.00, and Fibonacci position in the near 52-week low repair zone at 0.786. Volume at 1.41 times the 20-week average signals institutional selling into support, suggesting potential accumulation if buyers step in. MACD is bearish and weakening, which is negative, yet the oversold oscillator and defined support level create the tightest risk-reward in a category where FCG and XOP both posted negative 13-week returns worse than XLE's negative 2.8%. XLE's 2.6-point edge over FCG reflects superior category-relative strength at positive 6.3 versus FCG's 0.0.
Traditional energy receives 5% allocation as a tier-2 category despite a final category score of 0.0, indicating it fails eligibility filters but is held due to allocation framework requirements. The category-level macro fit of 16.0 out of 100 is among the worst in the portfolio because disinflation hurts this exposure by negative 10 points and the active disinflation pressure descriptor contributes an additional negative 10. Credit stress and liquidity stress each subtract negative 7 more points, creating a 34-point macro headwind. The reasoned ETF proof order shows FCG and XLE nearly tied at 26.3 and 26.0 technical evidence, yet the final category score of 0.0 indicates the reasoner flagged structural failure across the entire basket. This is a forced holding: the portfolio maintains the 5% position because energy offers the only technical setup with defined support in a liquidating environment, but this is pure damage control. Exit this position immediately if any excluded category (industrial metals, emerging markets) regains eligibility, or if credit stress signals stabilize enough to unlock a category re-ranking.
Emerging Markets — INDA
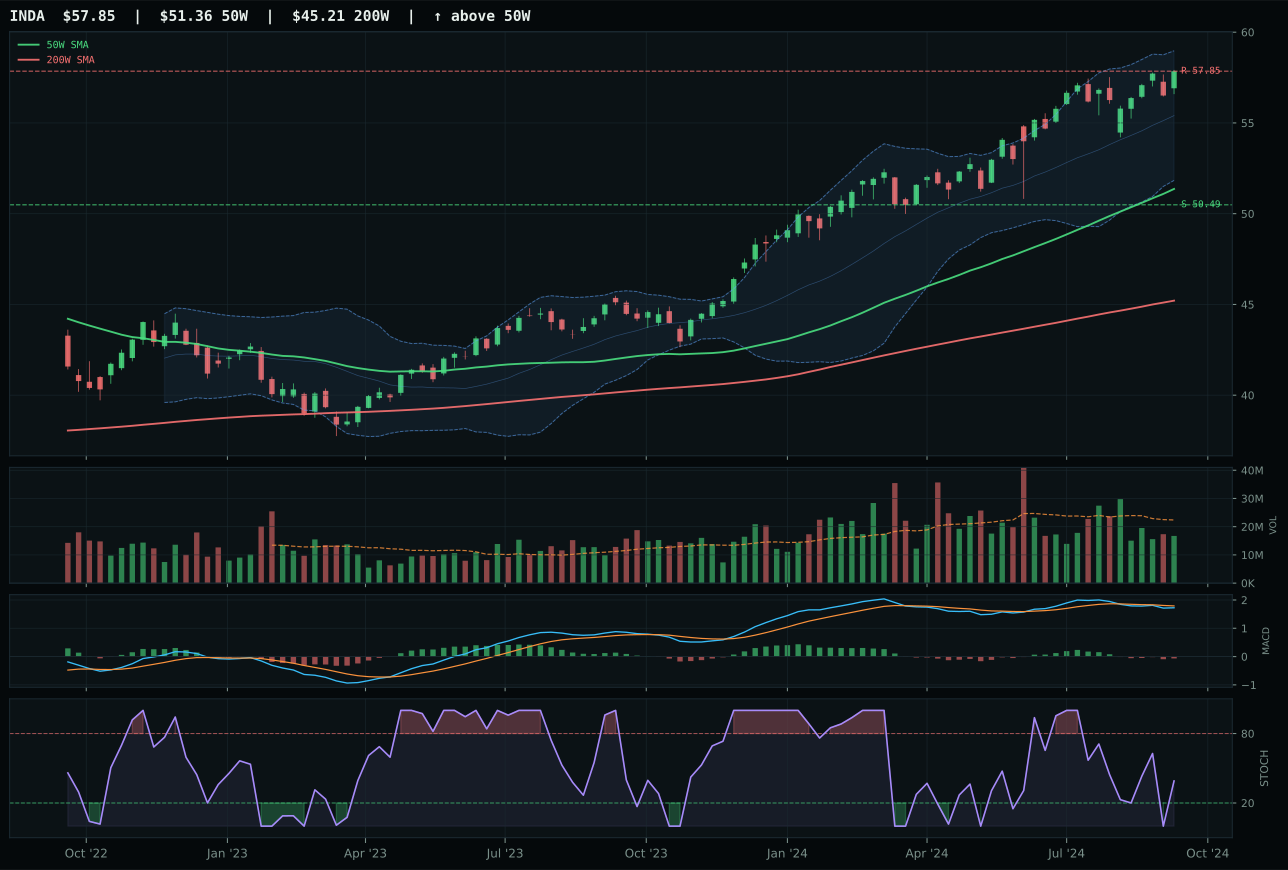
INDA has a neutral structure profile with 1.3% 13-week relative strength versus SPY.
A failed hold above support would weaken the setup.
Actionable but governed by invalidation levels.
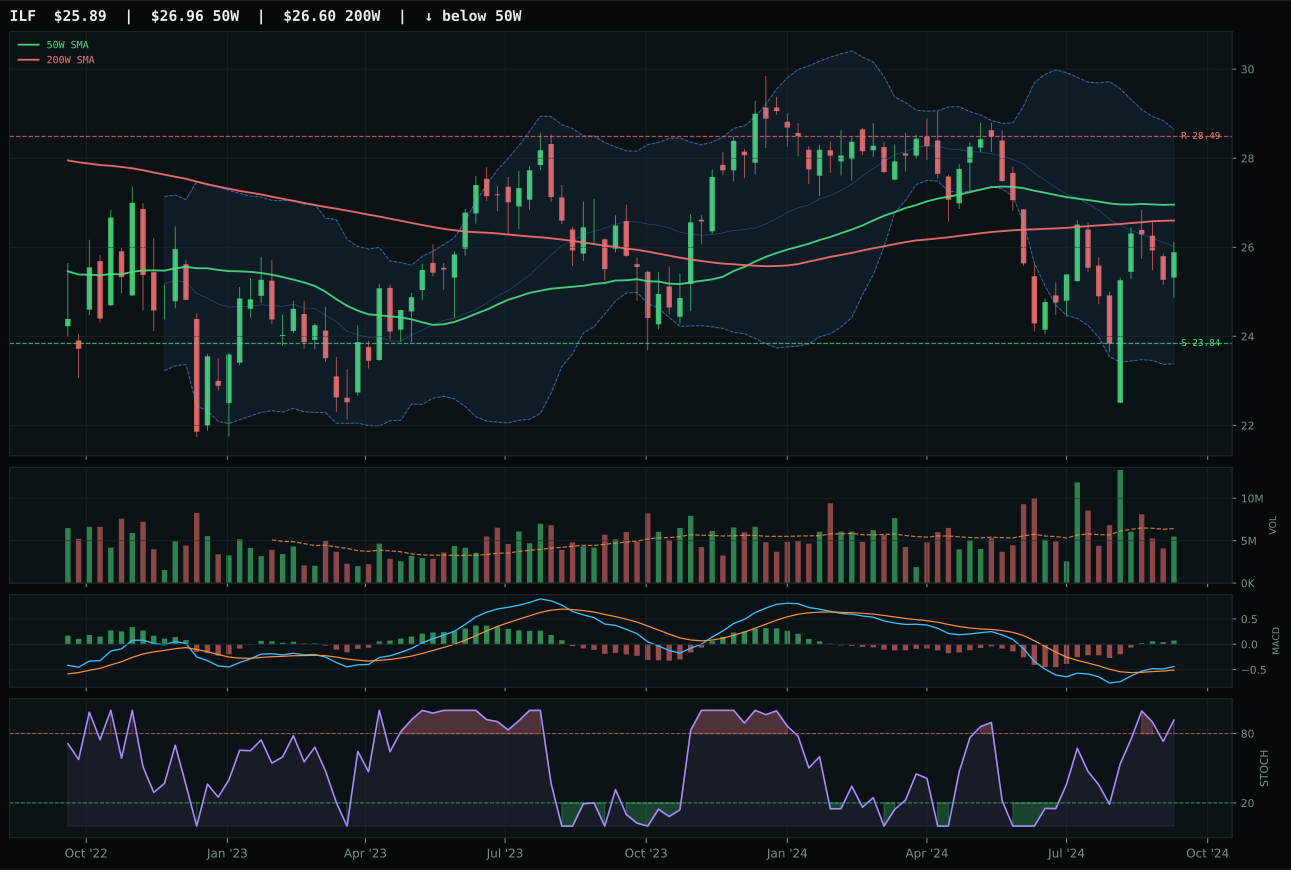
ILF has a neutral structure profile with 3.0% 13-week relative strength versus SPY.
A failed hold above support would weaken the setup.
Actionable but governed by invalidation levels.
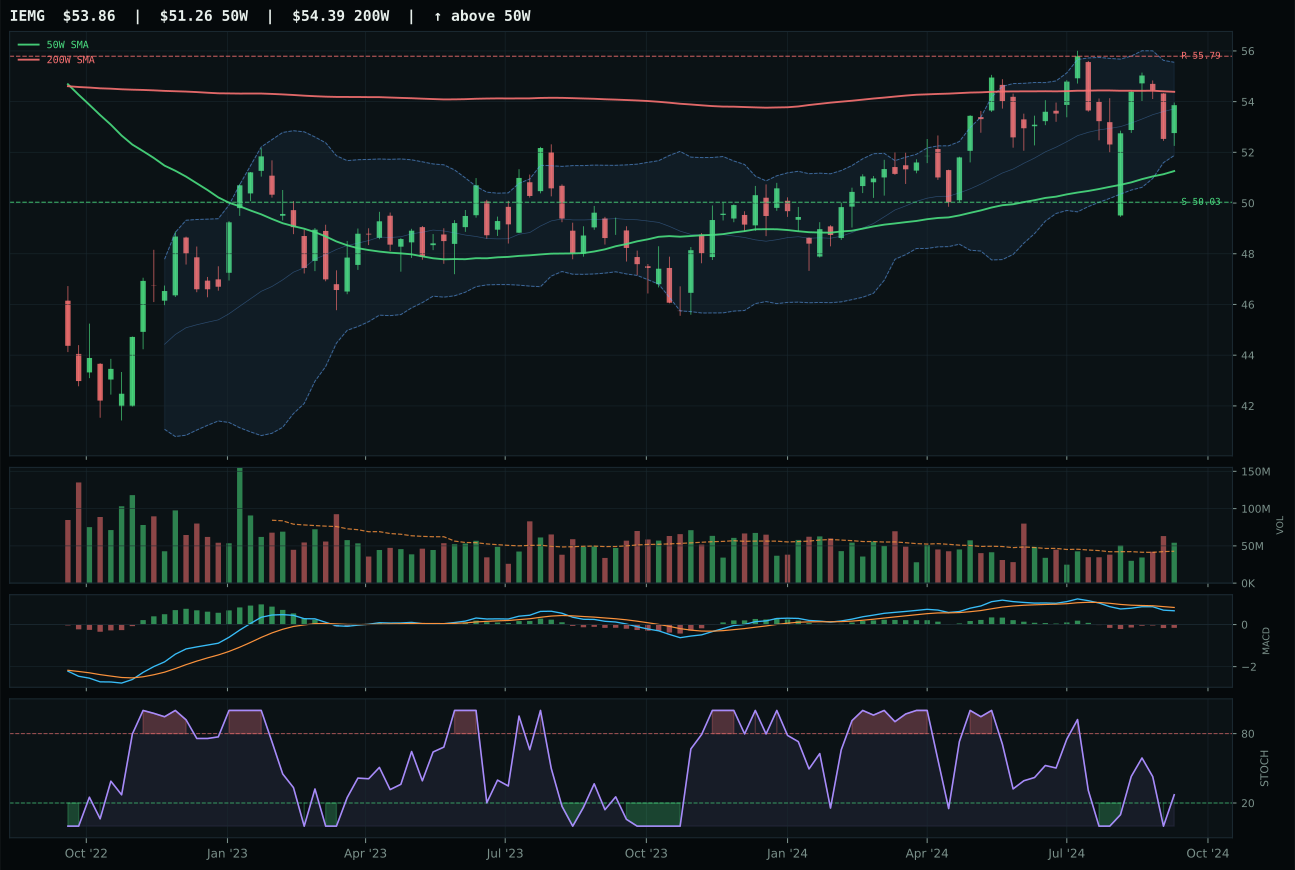
IEMG has a neutral structure profile with -2.1% 13-week relative strength versus SPY.
A failed hold above support would weaken the setup.
Actionable but governed by invalidation levels.
INDA wins the category despite earning a final score of 0.0 because its structure is the cleanest among three equally broken peers. Price sits 12.6% above the 50-week moving average in neutral structure with above-average compression at 89.9, and cleanliness at 66.7 beats ILF's 68.4 only on technical grading rather than price action. The 13-week return of 4.9% and positive 1.3% relative strength versus SPY are modest gains that lack institutional conviction. MACD is bearish and weakening while stochastic RSI is falling neutral at 0.39, both red flags for tired momentum. ILF posted superior 13-week returns of 6.6% with better SPY-relative performance at 3.0%, yet its falling-neutral stochastic RSI status and overbought position rolling over created a cleaner structure loss. INDA's only advantage is structural cleanliness at 77.0 versus ILF's 68.4, a difference that reflects less technical deterioration in an otherwise deteriorated category. This is the worst possible category win: INDA beats its peers by being the least broken rather than by being strong.
Emerging markets receives 0% allocation this week and is ranked completely outside the portfolio, earning a final category score of 16.7. The category-level macro fit of 21.0 out of 100 reflects severe headwinds: credit stress is active at negative 10, liquidity stress at negative 10, and the broad market bear descriptor at negative 9, creating a 29-point macro collapse. The reasoned ETF proof order shows ILF at 50.2 and INDA at 40.1, yet neither reaches credible technical evidence thresholds. The allocation framework allows emerging markets to be excluded entirely because at least two categories (precious metals at 75.3, utilities at 77.8) achieved significantly higher scores. This category will not return to the portfolio unless one of two shifts occurs: credit stress and liquidity stress signals improve materially, or relative strength begins to recover from the negative 2.1% to negative 2.3% SPY-relative deficit across the basket. Do not force exposure here; the macro regime is actively hostile to emerging market valuations in a disinflation backdrop.
Industrial Metals — COPX
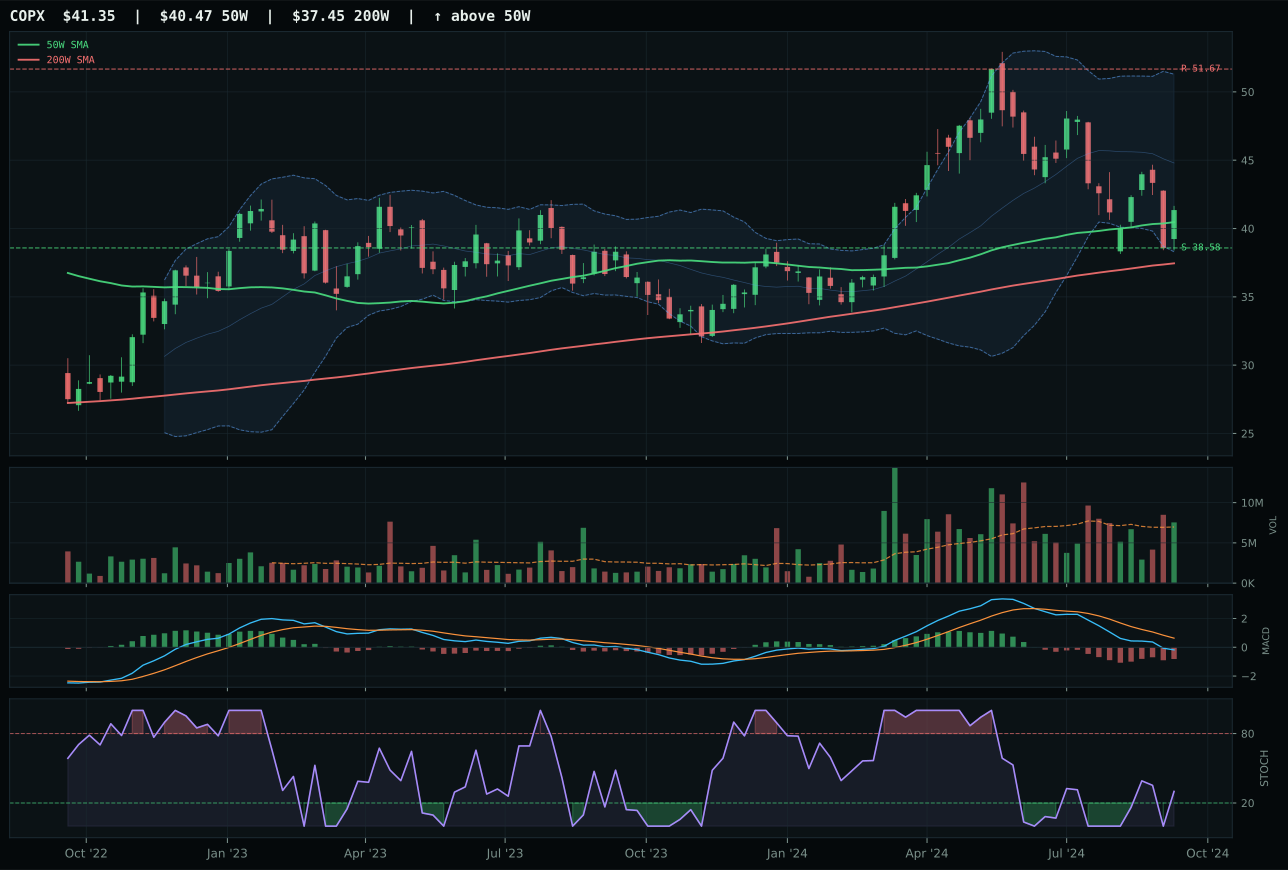
COPX has a compression near 50W profile with -10.2% 13-week relative strength versus SPY.
A failed hold above support would weaken the setup.
Actionable but governed by invalidation levels.
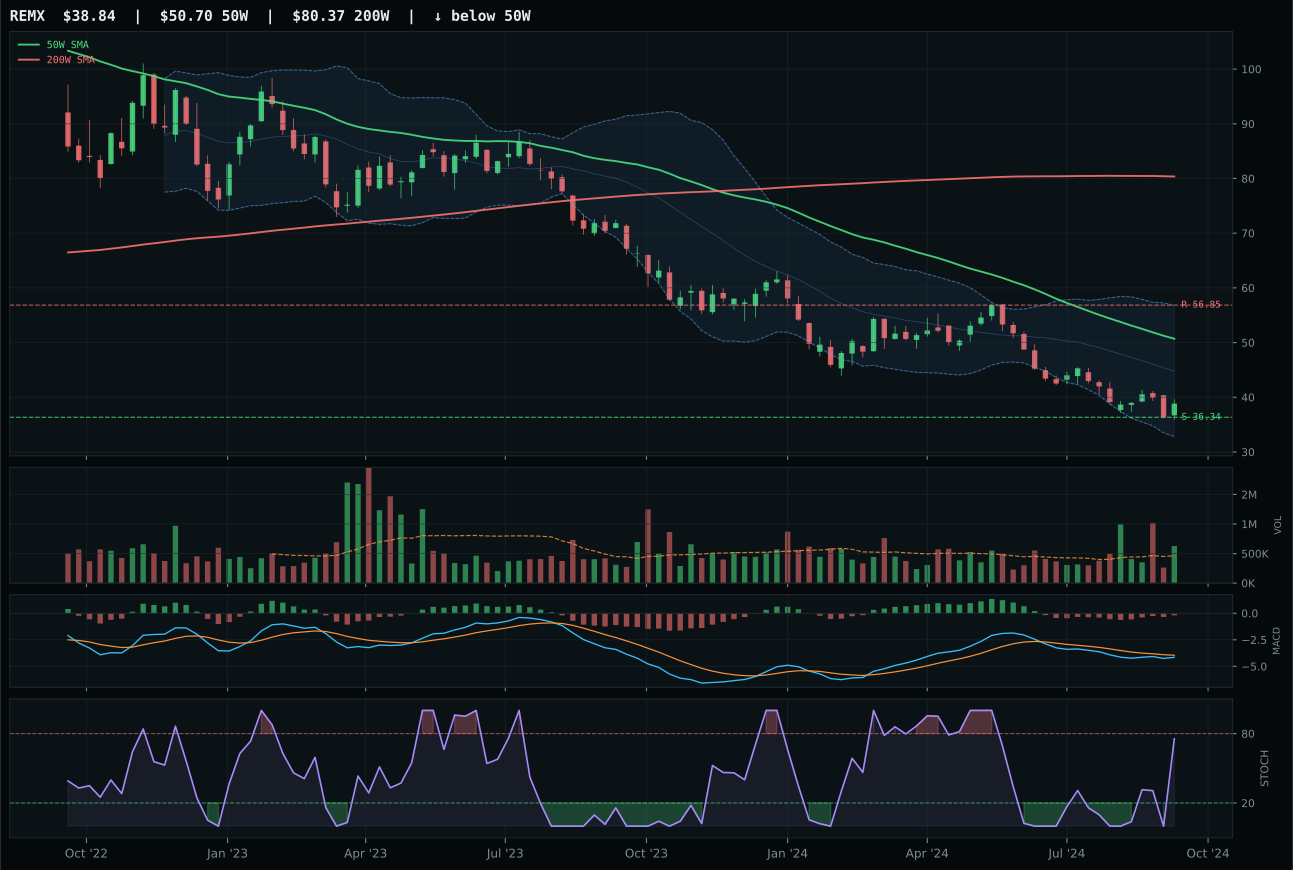
REMX has a neutral structure profile with -17.7% 13-week relative strength versus SPY.
Extension and support failure are the main tactical risks.
Tracked, but not top-2 eligible because: structurally broken.
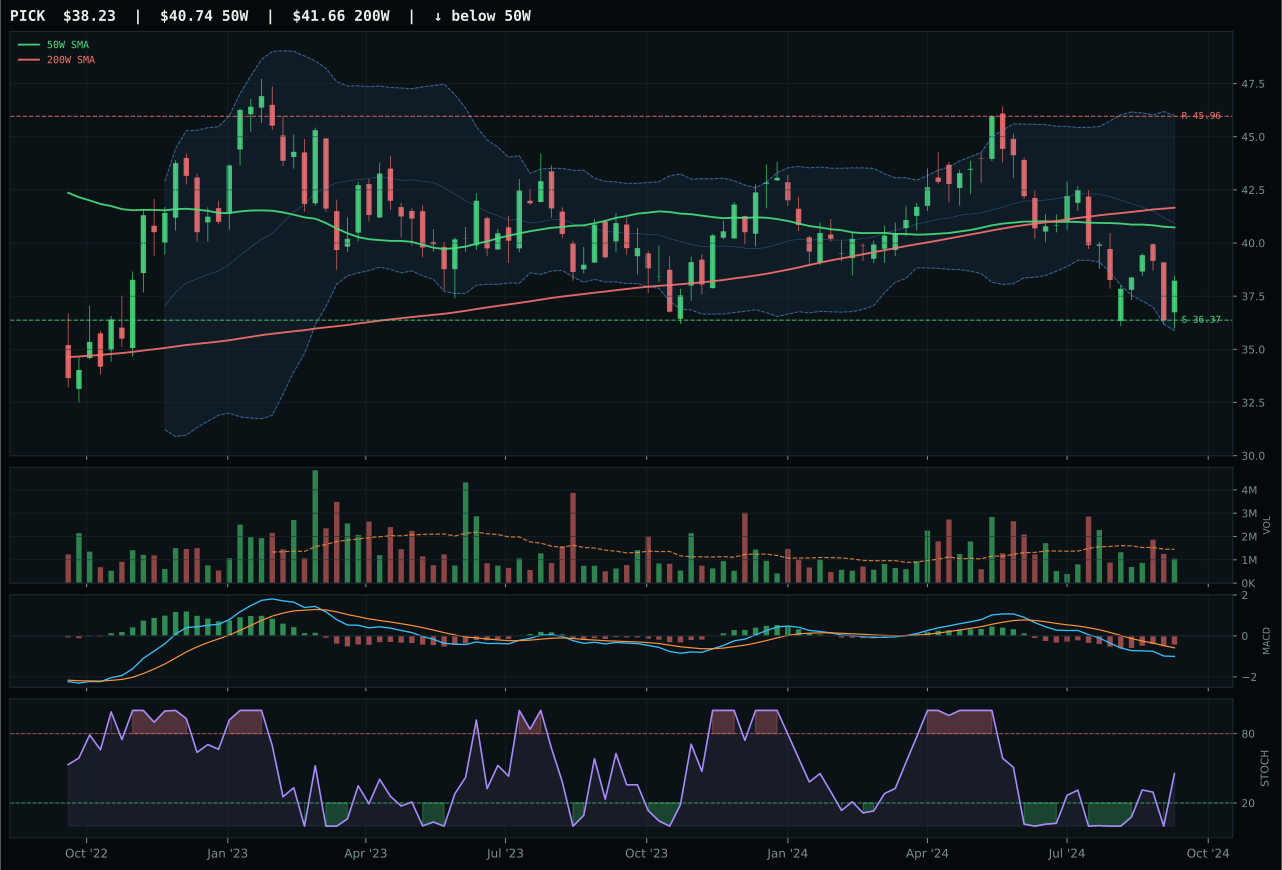
PICK has a neutral structure profile with -9.6% 13-week relative strength versus SPY.
Extension and support failure are the main tactical risks.
Tracked, but not top-2 eligible because: structurally broken.
COPX wins the category selection on timing and risk-reward optimization despite a deeply negative 13-week return of negative 6.7% and negative 10.2% relative strength versus SPY. Price is compressing just 2.2% from the 50-week moving average with a neutral 0.2% slope, creating a potential expansion setup if support at 38.58 holds. The timing score of 100.0 reflects ideal proximity to the 50-week, falling stochastic RSI in the lower zone indicating oversold conditions, and Fibonacci position in the middle retracement zone near 0.500, all signaling a potential bounce. Risk-reward at 98.0 is the highest in the category because upside to resistance at 51.67 offers negative 20.0% reward but downside to support provides only 7.2% loss—an excellent risk asymmetry for a mean-reversion position. REMX collapsed with negative 17.7% SPY-relative performance and a composite score of only 5, disqualifying it entirely. COPX's 72.4-point score gap reflects a clear category decision in a completely failed group.
Industrial metals receives 0% allocation this week and is ranked outside the portfolio entirely, earning a final category score of 9.3 and failing eligibility filters. The category-level macro fit of 35.0 reflects structural headwinds from disinflation: liquidity stress is active at negative 8 and credit stress at negative 7, creating a negative 15-point macro drag. The reasoned ETF proof order shows COPX at 52.1 as the only viable technical setup, yet the technical evidence score of 57.9 cannot overcome the macro deterioration. This category will return to the portfolio only when one of two conditions is met: credit stress signals improve, or relative strength begins to recover from the negative 10.2% SPY-relative deficit. COPX's timing setup is technically sound, but allocating capital to a rebound that contradicts the disinflation regime is poor portfolio construction. Remove this position entirely and wait for either a macro reset or evidence that the 3/2/1 basket recovers above 50.0 technical merit.