
2024-09-06
Informational purposes only. The content in this report, including allocations, analysis, and commentary, is provided solely for informational and educational purposes. It does not constitute financial advice, investment advice, trading advice, or any other type of advice. Past performance does not guarantee future results. Always conduct your own research and consult a qualified financial professional before making investment decisions.
Weekly Allocation
| Ticker | Category | Weight | Role |
|---|---|---|---|
| FBTC | 50% | Overlay | |
| GLD | Precious Metals | 10% | Top-2 (10%) |
| XLU | Utilities & Infrastructure | 10% | Top-2 (10%) |
| IGV | Technology | 5% | Tier-2 (5%) |
| XAR | Defense & Aerospace | 5% | Tier-2 (5%) |
| AIQ | AI | 5% | Tier-2 (5%) |
| MOO | Agriculture & Livestock | 5% | Tier-2 (5%) |
| IEMG | Emerging Markets | 5% | Tier-2 (5%) |
| NLR | Nuclear Energy | 5% | Tier-2 (5%) |
Trade Instructions — Monday Open
Sell the tranche from 2024-08-09 (completing its 4-week hold). Buy the new tranche. Instructions show net portfolio changes — same-asset positions cancel, weight changes show the delta.
| Action | Ticker | Instruction |
|---|---|---|
| SELL | ITA | Sell 67% of ITA position (reduce 3.75% → 1.25%) |
| SELL | CIBR | Sell 25% of CIBR position (reduce 5.00% → 3.75%) |
| SELL | XLE | Sell 25% of XLE position (reduce 5.00% → 3.75%) |
| BUY | GLD | Buy GLD — 25.00% of freed cash (adds 1.25% to portfolio) |
| BUY | XAR | Buy XAR — 25.00% of freed cash (adds 1.25% to portfolio) |
| BUY | IGV | Buy IGV — 25.00% of freed cash (adds 1.25% to portfolio) |
| BUY | IEMG | Buy IEMG — 25.00% of freed cash (adds 1.25% to portfolio) |
Current Portfolio After Trade
Combined holdings across all 4 active tranches. Each tranche is 25% of the portfolio.
| Ticker | % of Portfolio | Weight Bar |
|---|---|---|
| FBTC | 50.00% | |
| GLD | 10.00% | |
| XLU | 7.50% | |
| CIBR | 3.75% | |
| XLE | 3.75% | |
| MOO | 3.75% | |
| NLR | 3.75% | |
| XAR | 3.75% | |
| AIQ | 2.50% | |
| PAVE | 2.50% | |
| ITA | 1.25% | |
| BOTZ | 1.25% | |
| SMH | 1.25% | |
| URA | 1.25% | |
| INDA | 1.25% | |
| IGV | 1.25% | |
| IEMG | 1.25% |
Macro Regime — Disinflation
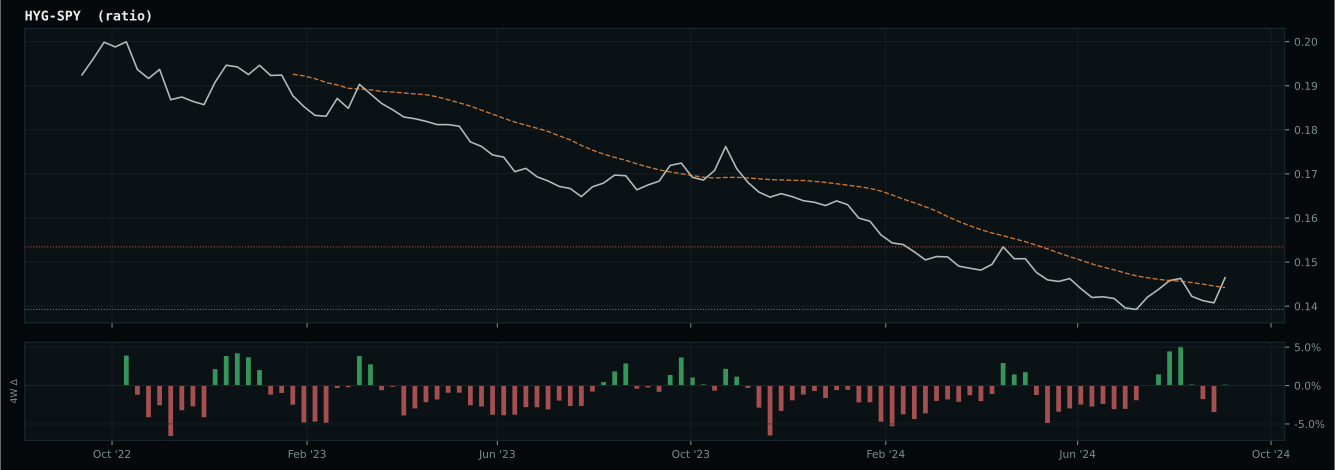
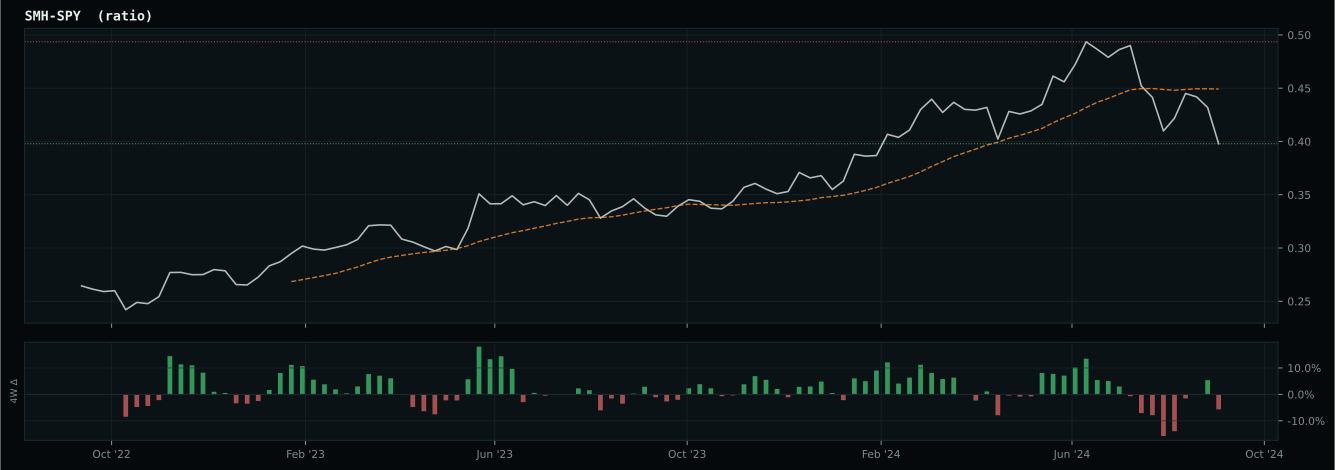
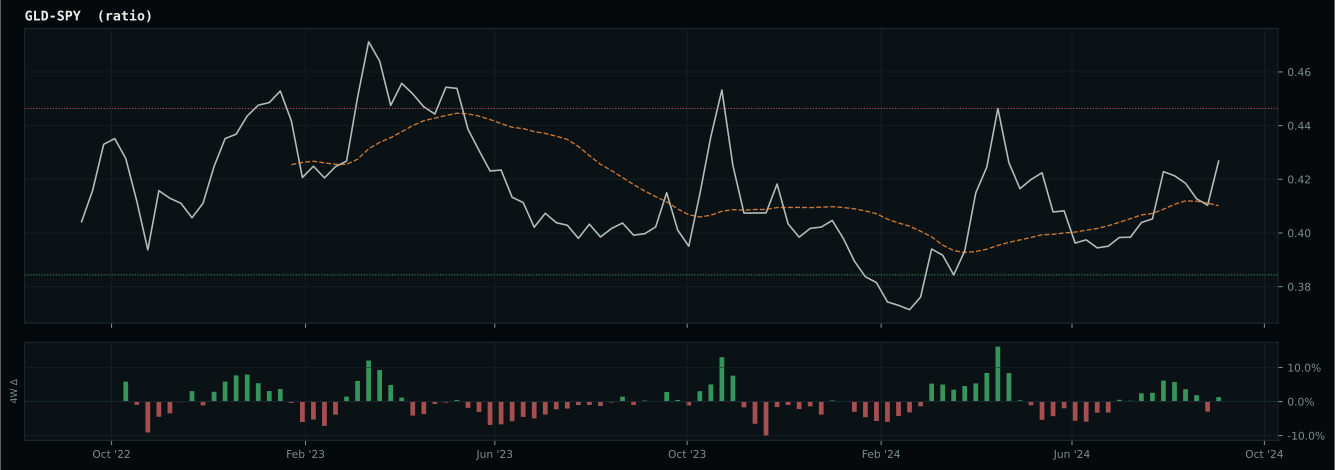
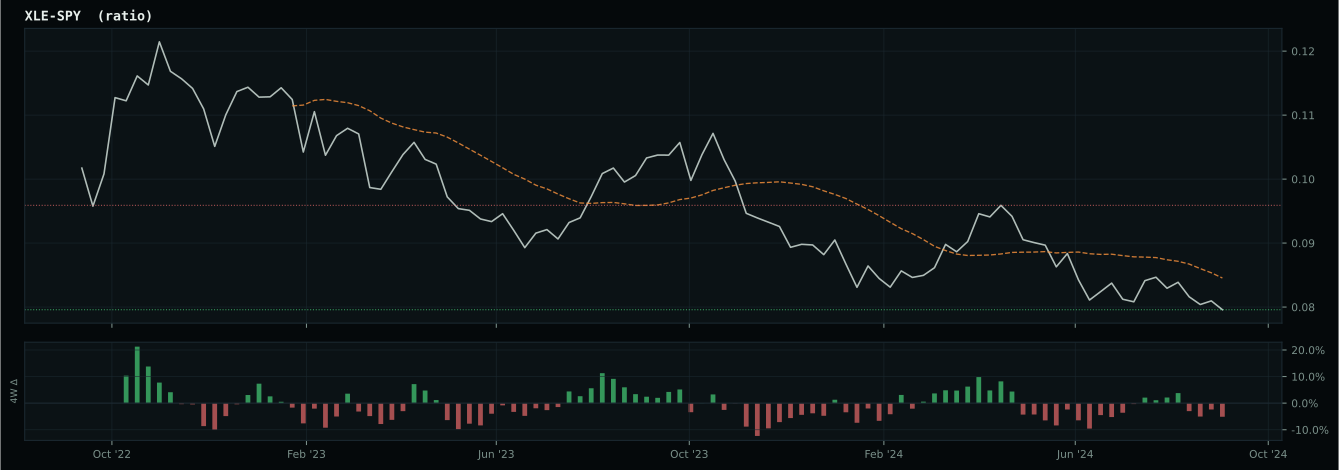
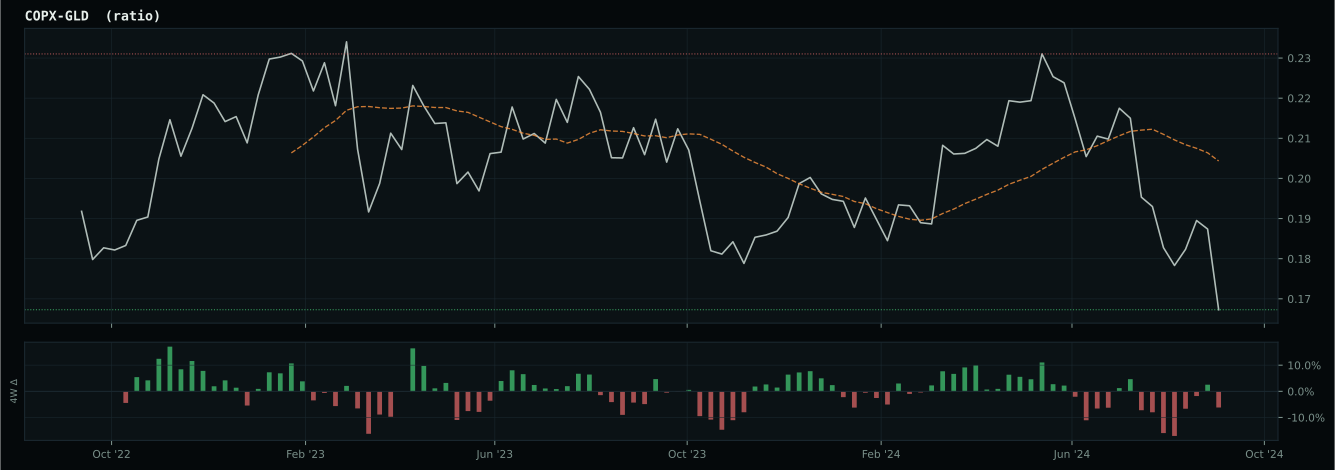
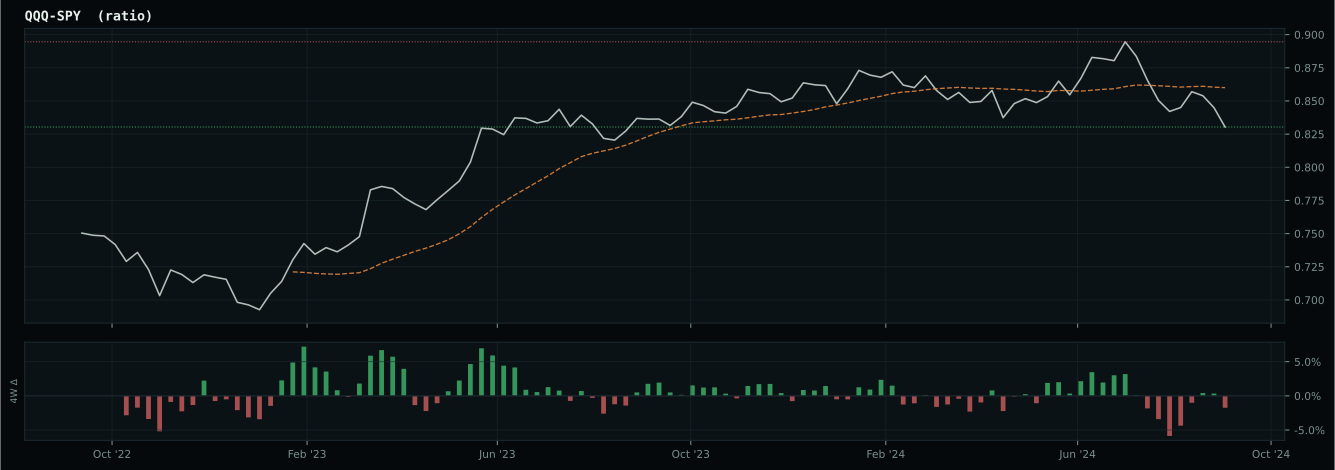
growth data is not confirming the weak market-implied risk appetite signal
Macro Evidence Charts
Market-implied signals behind the macro regime scores. Each ratio compares two assets; the direction and slope of the ratio is what the macro engine reads.
Crypto Regime — TrendBTC
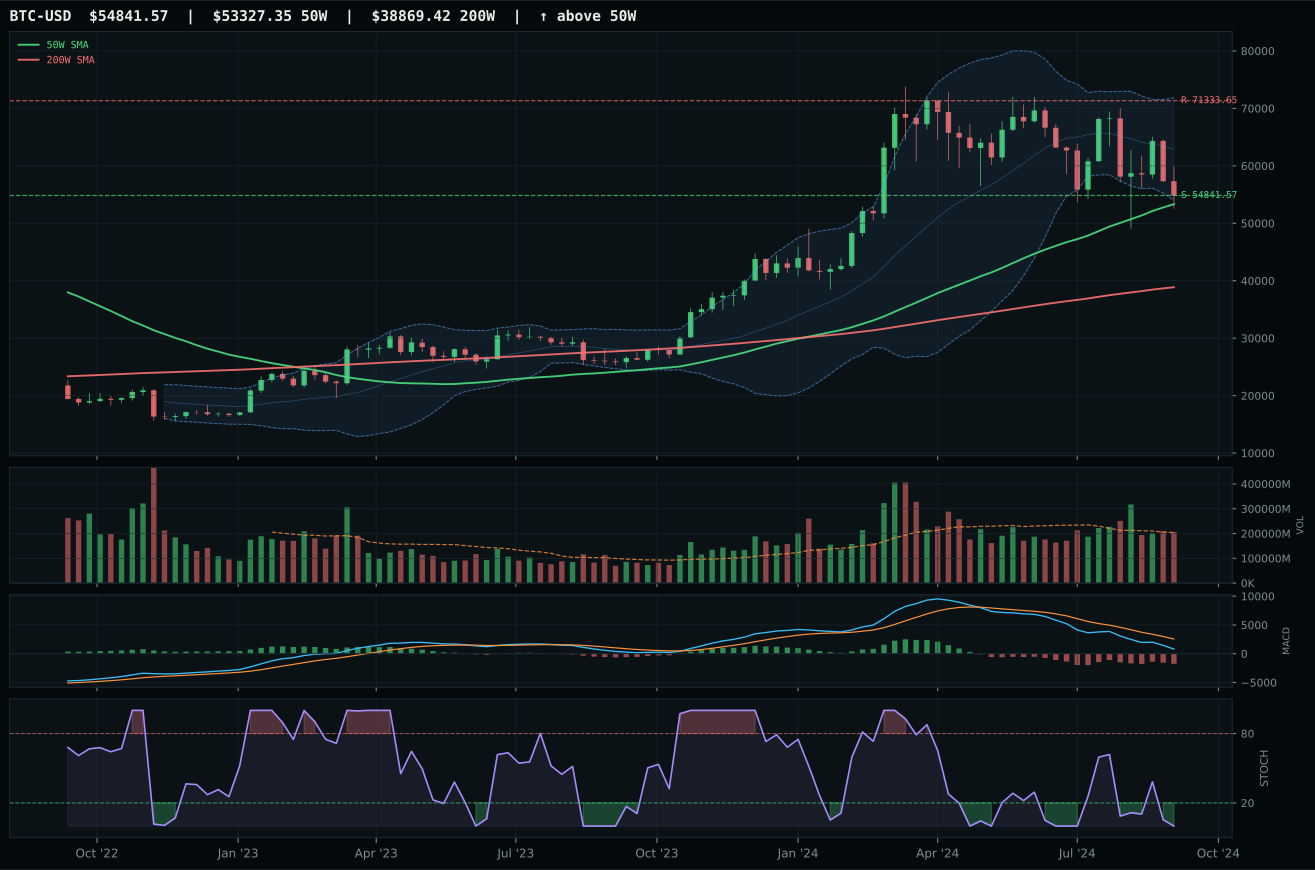
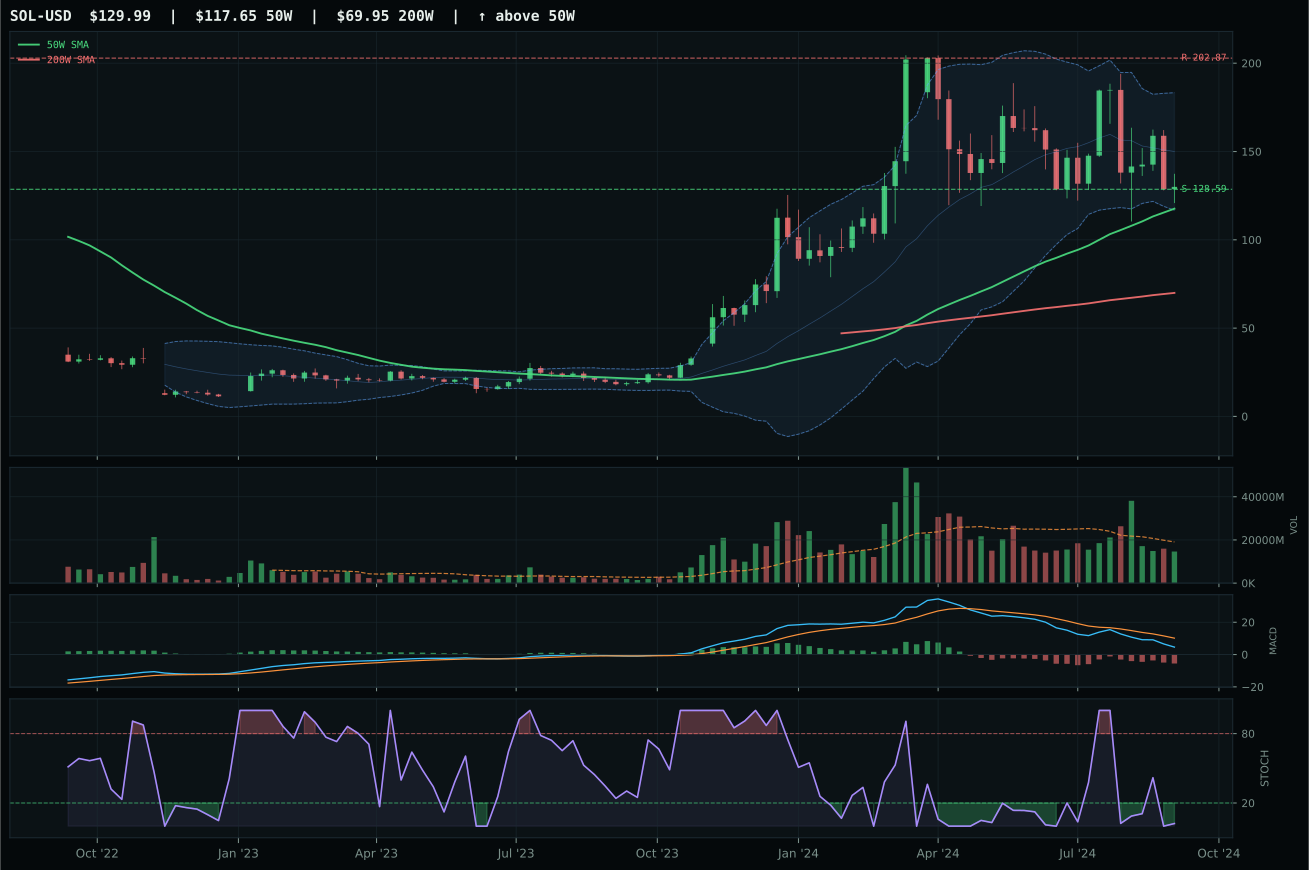
ValueBTC not armed: BTC has not made the first post-breakdown touch of the 200W buy zone after losing the 50W
TrendBTC confirmed: 2 consecutive closes above rising/flat 50W SMA
one or more available conditions failed
Category Rankings
| Rank | Category | Winner | Score | Alloc | 4W Ret | Peers (4W) |
|---|---|---|---|---|---|---|
| 1 | Precious Metals | GLD | 71.9 | 20% | +5.76% | GDX +7.3% · SLV +12.8% |
| 2 | Utilities & Infrastructure | XLU | 62.1 | 20% | +6.30% | IGF +4.6% · PAVE +9.3% |
| 3 | Technology | IGV | 57.1 | 10% | +6.66% | CIBR +6.9% · XLK +8.6% |
| 4 | Defense & Aerospace | XAR | 55.7 | 10% | +7.03% | ITA +7.6% · ROKT +7.8% |
| 5 | AI | AIQ | 43.2 | 10% | +11.34% | BOTZ +8.4% · SMH +12.8% |
| 6 | Emerging Markets | IEMG | 27.9 | 10% | +11.60% | INDA -0.6% · ILF +2.5% |
| 7 | Nuclear Energy | NLR | 24.0 | 10% | +26.74% | URA +28.7% · URNM +28.1% |
| 8 | Industrial Metals | COPX | 8.7 | 10% | +22.28% | PICK +17.3% · REMX +32.4% |
| 9 | Traditional Energy | FCG | 3.3 | 0% | +8.73% | XLE +8.4% · XOP +9.4% |
| 10 | Agriculture & Livestock | MOO | — | 0% | +3.74% | VEGI +5.0% · WEAT +4.5% |
Precious Metals — GLD
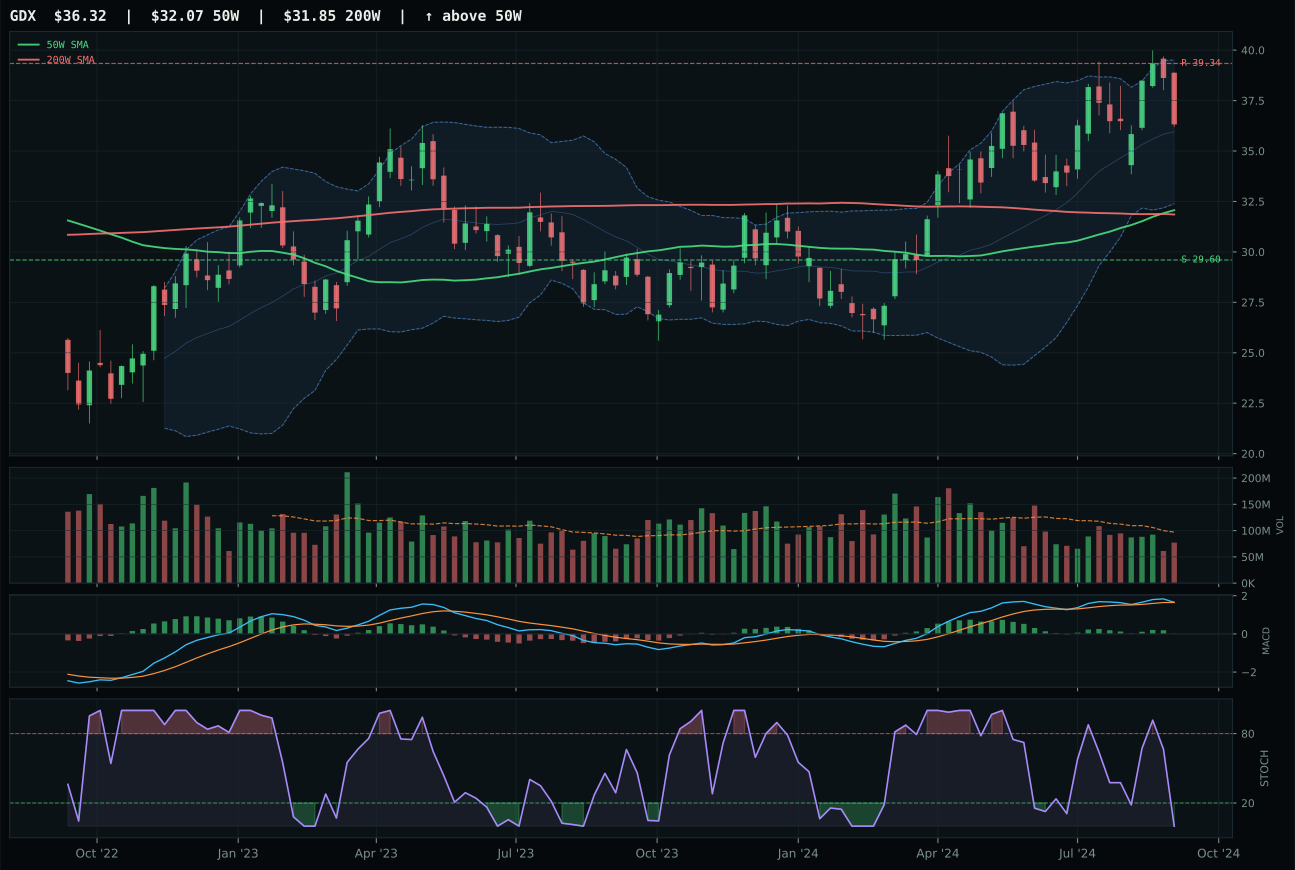
GDX has a neutral structure profile with 7.1% 13-week relative strength versus SPY.
A failed hold above support would weaken the setup.
Actionable but governed by invalidation levels.
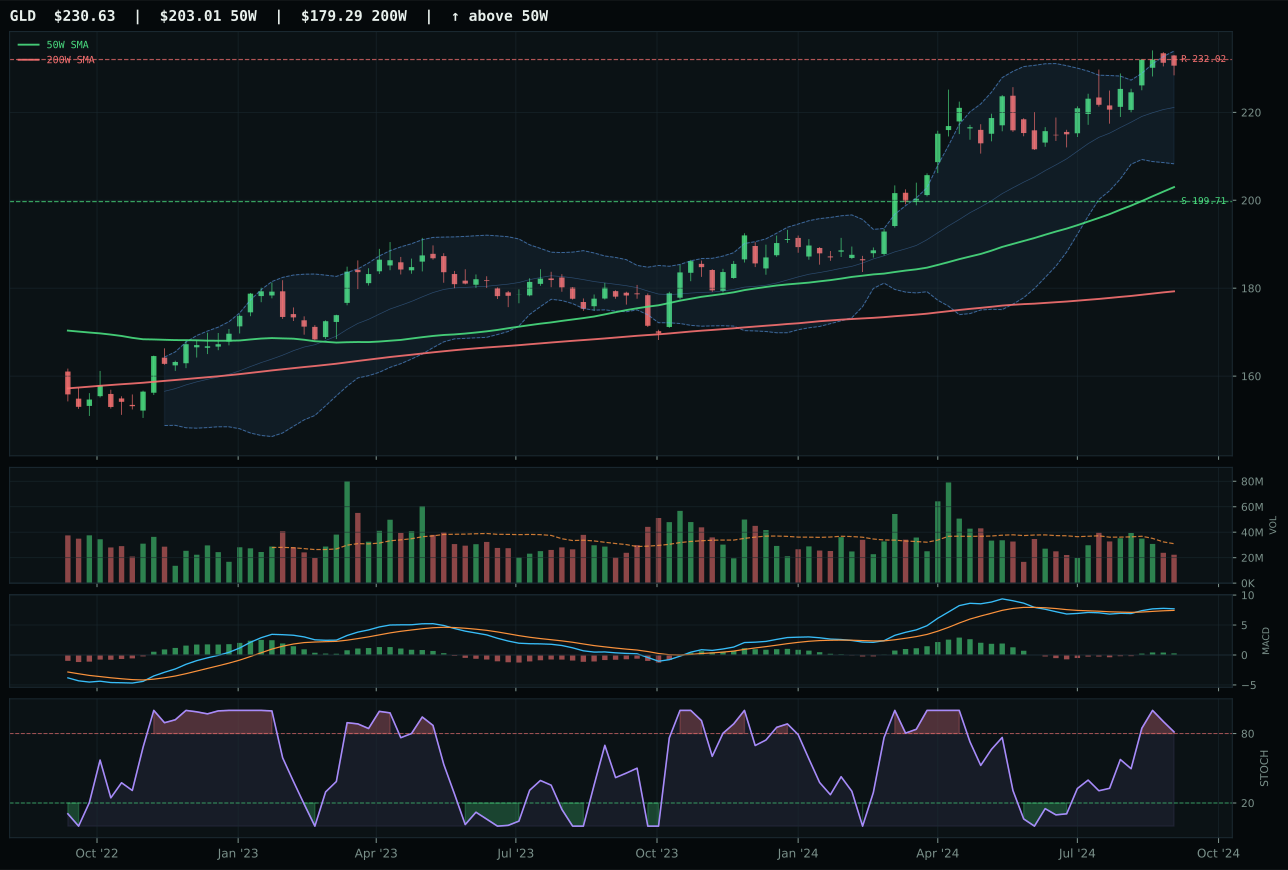
GLD has a neutral structure profile with 7.8% 13-week relative strength versus SPY.
A failed hold above support would weaken the setup.
Actionable but governed by invalidation levels.
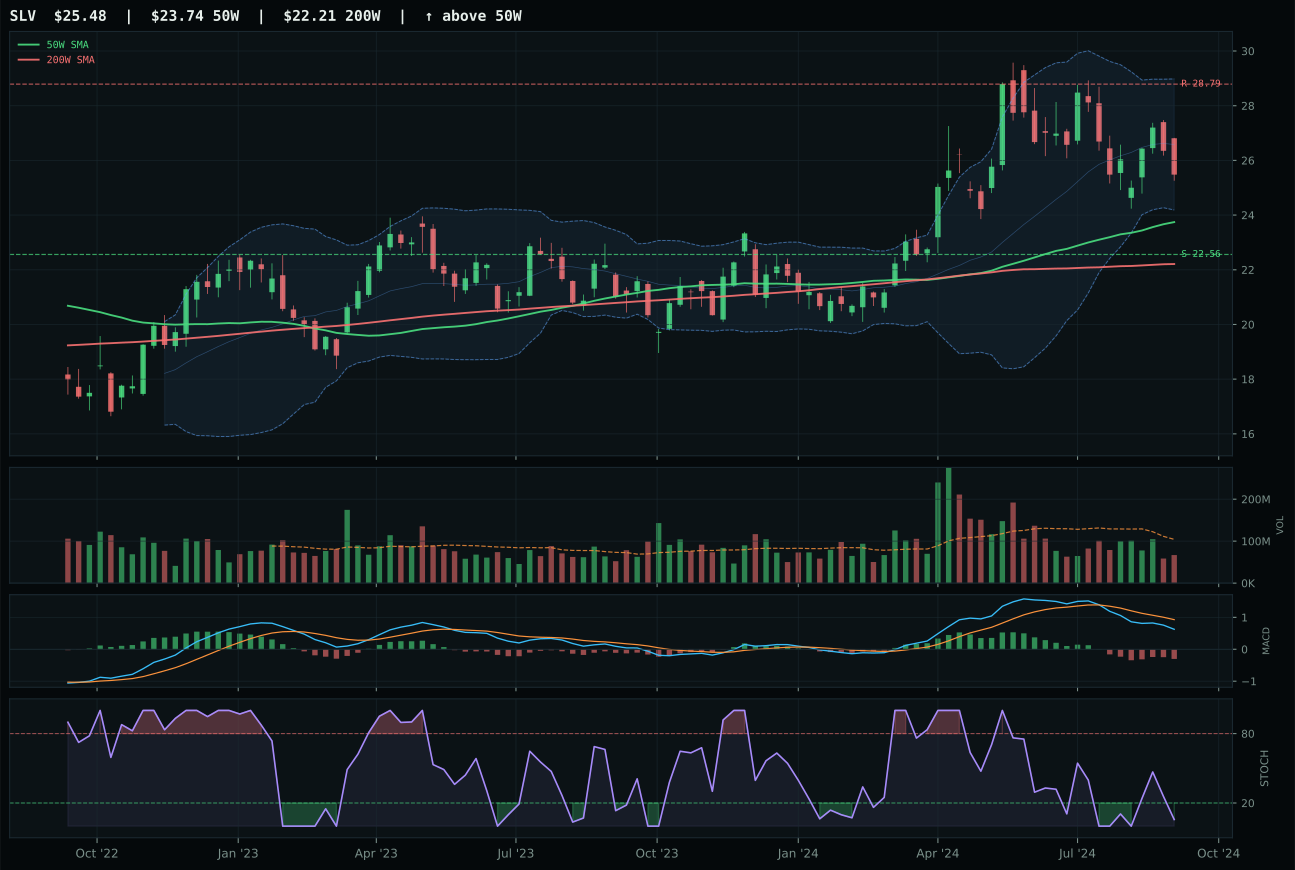
SLV has a neutral structure profile with -5.7% 13-week relative strength versus SPY.
A failed hold above support would weaken the setup.
Actionable but governed by invalidation levels.
GLD won Precious Metals decisively and qualified for top-2 overweight status on the strength of a 78.0/100 macro/narrative fit score—the highest category-level fit in the portfolio this week. The 7.8% SPY outperformance over 13 weeks is genuine accumulation, confirmed by MACD bullish and improving and stochastic RSI overbought rolling over at 0.81, signaling momentum is shifting from explosive to sustainable. Price sits 13.6% above the 50W, which normally represents entry risk, but GLD's 100.0/100 trend score (price above both 50W and 200W with 0.5% positive slope) and 76.3/100 momentum confirmation justify the extended position. The 37.7/100 risk/reward reflects that upside to resistance is only 0.6% away, meaning this is purely a momentum trade, not a value setup. GDX's stronger technical composite at 76 versus GLD's 75 is overridden by GDX's weaker category-relative strength at 0.0% and deteriorating MACD (bullish but flattening)—a signal that the move is aging.
Precious Metals received 10% as a top-2 overweight category with a 71.9 final score that reflects the perfect storm of positive macro alignment in a disinflation regime. Monetary hedge bid is active at +14 points, the strongest single macro descriptor in the entire system this week. Defensive rotation is active at +7, disinflation pressure at +6, and disinflation helps at +8. This combination produces an 85.0/100 category-level macro fit, which combined with solid 65.7/100 technical evidence pushes Precious Metals into the top-2 tier despite GLD's extended entry price. The 10% allocation reflects conviction that central bank put and disinflation dynamics will continue supporting safe-haven flows. The tension is real: entry at 13.6% above the 50W creates execution risk, and thin volume at 0.72x average means liquidity could evaporate in stress scenarios. But the macro case is too strong to underweight.
Utilities & Infrastructure — XLU
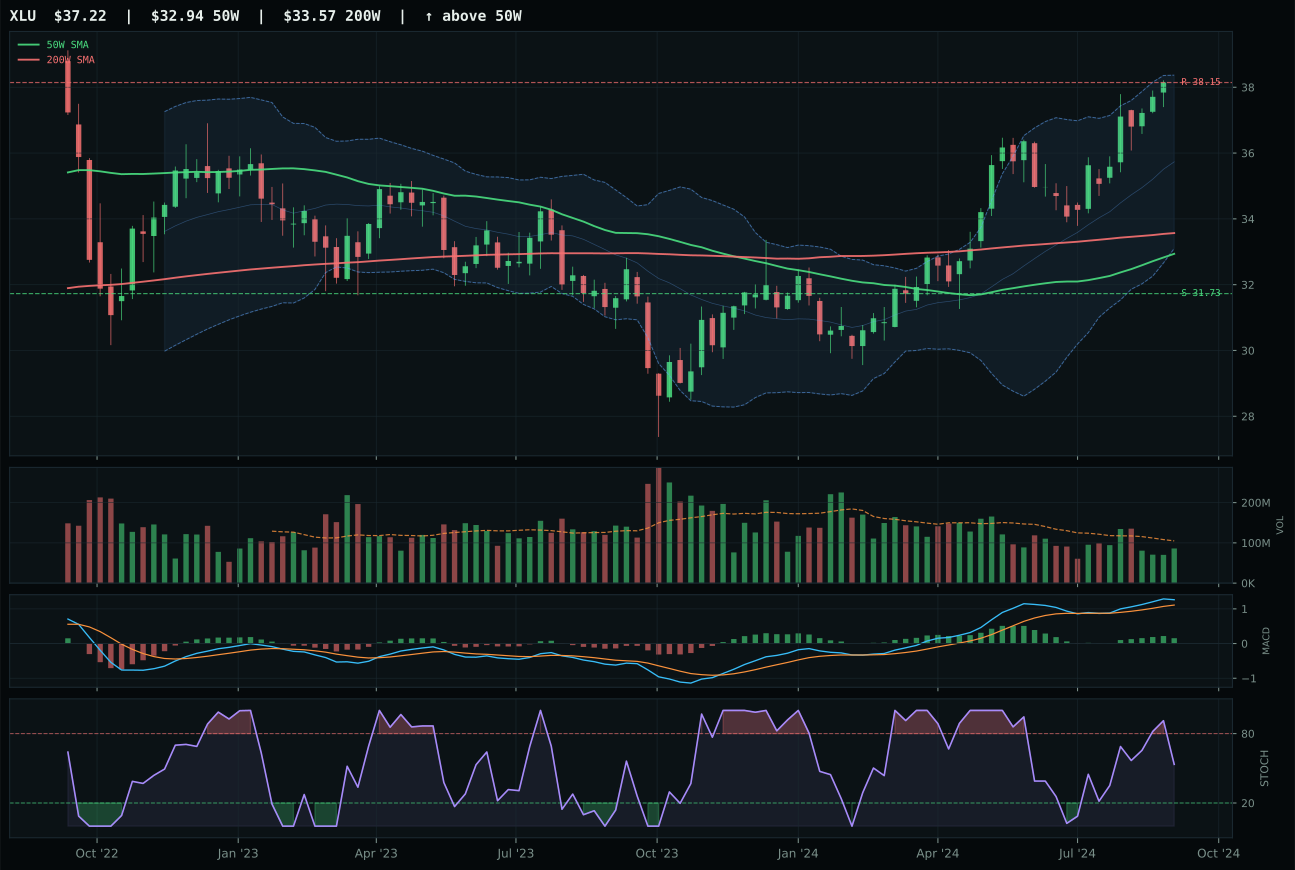
XLU has a vertical extension profile with 7.3% 13-week relative strength versus SPY.
A failed hold above support would weaken the setup.
Actionable but governed by invalidation levels.
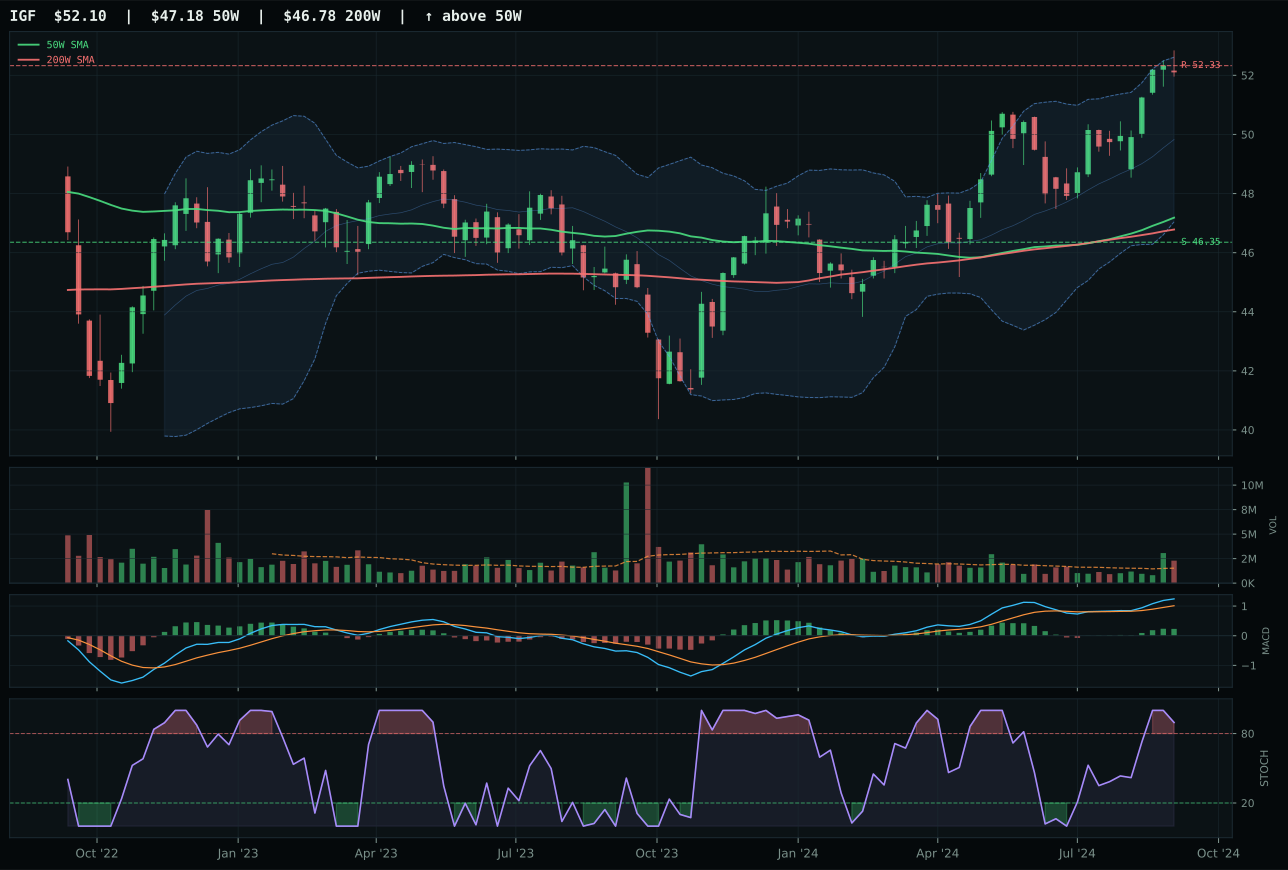
IGF has a neutral structure profile with 4.1% 13-week relative strength versus SPY.
A failed hold above support would weaken the setup.
Actionable but governed by invalidation levels.
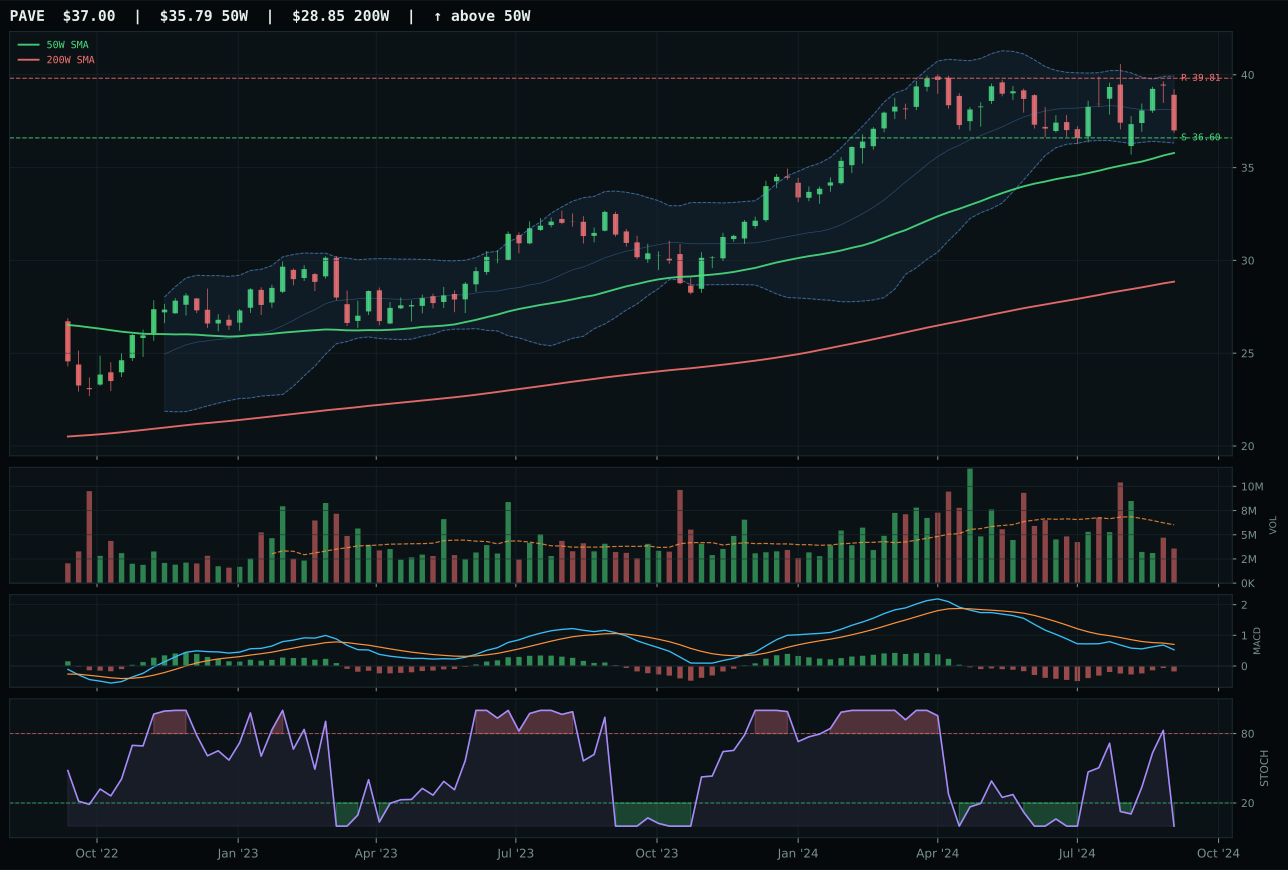
PAVE has a pullback into support profile with -2.0% 13-week relative strength versus SPY.
A failed hold above support would weaken the setup.
Actionable but governed by invalidation levels.
XLU won Utilities & Infrastructure decisively and qualified for top-2 overweight status with a 71.5 reasoned score that crushed PAVE's 65.1, driven by superior category-relative strength (3.2% versus 0.0%) and cleaner technical sponsorship. XLU sits 15.2% above the 50W in a vertical extension setup with 100.0/100 trend confirmation (price above both 50W and 200W with 0.4% positive slope) and dominant 92.7/100 momentum confirmation. The 8.5% 13W return and 7.3% SPY outperformance show genuine buying pressure over a multi-week period. Stochastic RSI is overbought at 0.90, a signal that the move is mature but not yet exhausted; MACD is bullish and improving, confirming that the uptrend is sustained rather than failing. The 45.0/100 timing score reflects the entry risk (15.2% above the 50W) offset by improving MACD and sustained volume participation. The 30.5/100 risk/reward is tight—upside to resistance 0.5%, downside 19.6%—but this is priced-in as the cost of riding an extended trend.
Utilities & Infrastructure earned 10% as a top-2 overweight category with a 62.1 final score that reflects the strongest macro alignment outside Precious Metals. Defensive rotation is active at +12 points, disinflation pressure at +6, and disinflation helps the category at +7. This produces a 76.0/100 category-level macro fit, second only to Precious Metals among all 10 categories. The 71.0/100 technical evidence combines clean trend, strong relative strength, and excellent persistence, creating a portfolio setup where defensive income and regulated cash flows attract capital flows in a disinflation environment. The entry risk is real: XLU is extended at 15.2% above the 50W with minimal upside to resistance. However, the macro tailwinds and the 8.5% 13W absolute return with 7.3% SPY outperformance justify the 10% allocation as a core defensive position. This competes with Precious Metals at the top of the capital allocation tier because both categories have earned their macro drivers through technical sponsorship, not theoretical overlay.
Technology — IGV
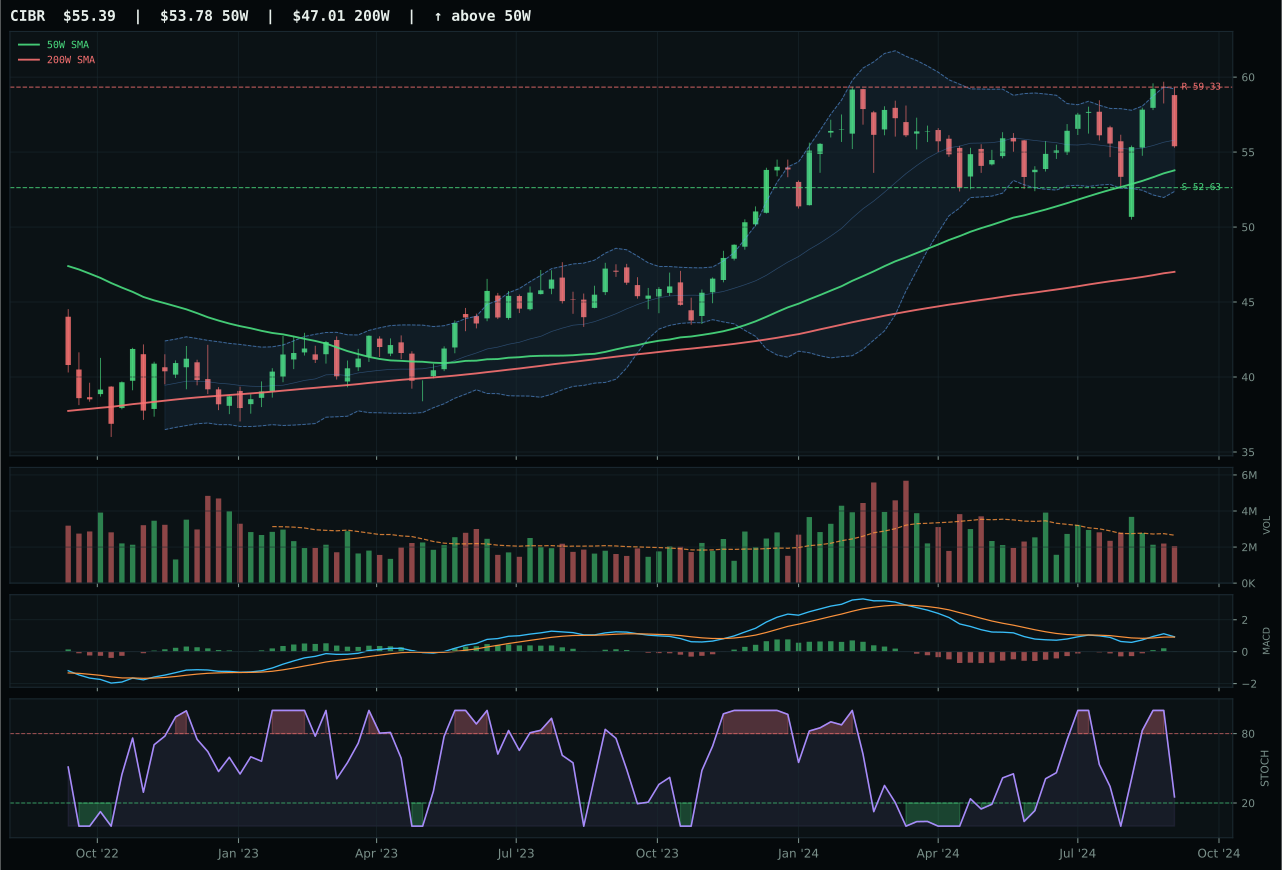
CIBR has a compression near 50W profile with 1.7% 13-week relative strength versus SPY.
A failed hold above support would weaken the setup.
Actionable but governed by invalidation levels.
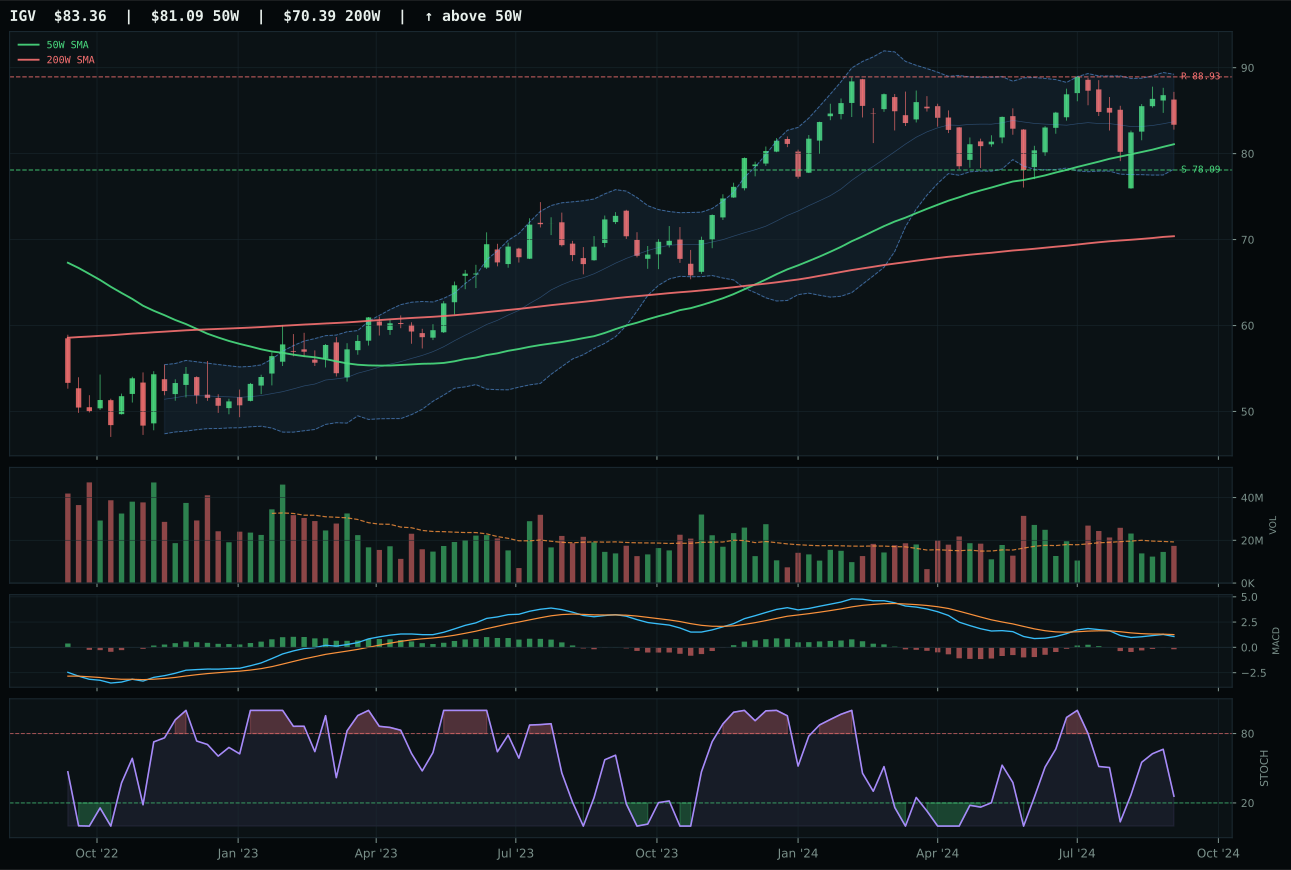
IGV has a compression near 50W profile with 2.5% 13-week relative strength versus SPY.
A failed hold above support would weaken the setup.
Actionable but governed by invalidation levels.
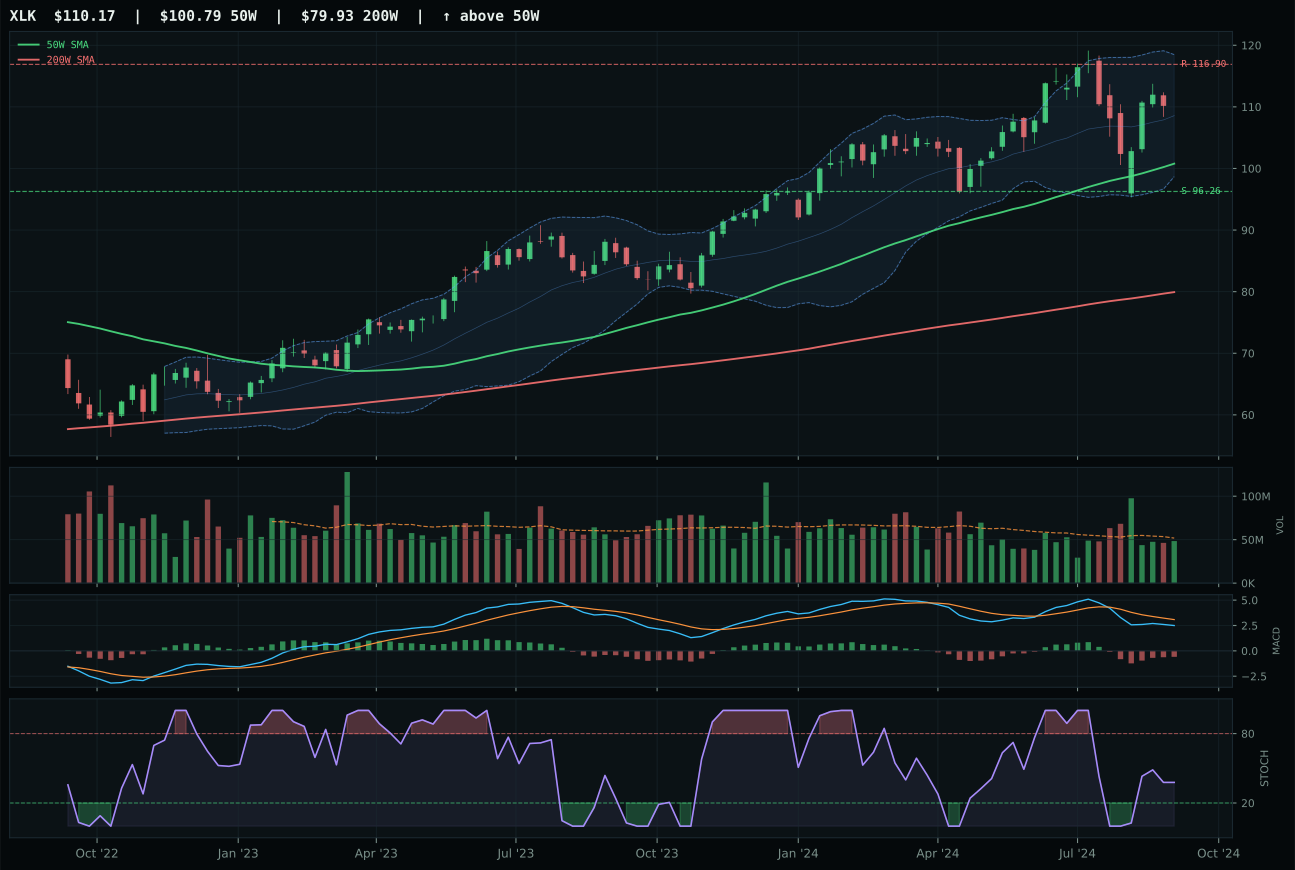
XLK has a compression near 50W profile with -6.6% 13-week relative strength versus SPY.
A failed hold above support would weaken the setup.
Actionable but governed by invalidation levels.
IGV won the Technology category on the strength of relative breadth inside its three-ETF basket rather than absolute momentum. The 0.8% category-relative strength advantage over CIBR proved decisive, even though CIBR posted a technically superior 80.0/100 composite score versus IGV's 85.0. IGV's 2.5% outperformance versus SPY confirms accumulation is happening at the margin, and the price sits 2.8% from the 50W moving average in a compression setup—a zone where small volume participation at 0.90x average can sustain a move if buyers defend support at 78.09. MACD is bearish but improving and stochastic RSI is falling, which means the setup is resetting rather than failing; timing registers perfectly at 100.0/100. The risk/reward at 61.7/100 reflects the tight entry zone—upside to resistance is only 6.3% away, which explains why a 3.7% 13W return with thin sponsorship still qualifies as the category representative.
Technology earned 5% allocation as a tier-2 category, sitting below two higher-ranked peers but above the 0% cutoff. The disinflation macro regime helps software and SaaS multiples in theory, but liquidity stress active at -10 points heavily penalizes the category at the macro layer, dragging the 52.0/100 category-level fit down. The 57.1 final score reflects a technical setup that works mechanically—price above both moving averages, relative strength positive, MACD improving—but the real tension is that duration-sensitive growth trades have no safe entry above the 50W in a disinflation-plus-liquidity environment. This is a hold-the-line allocation: enough technical evidence to justify 5%, not enough macro tailwind to merit more.
Defense & Aerospace — XAR
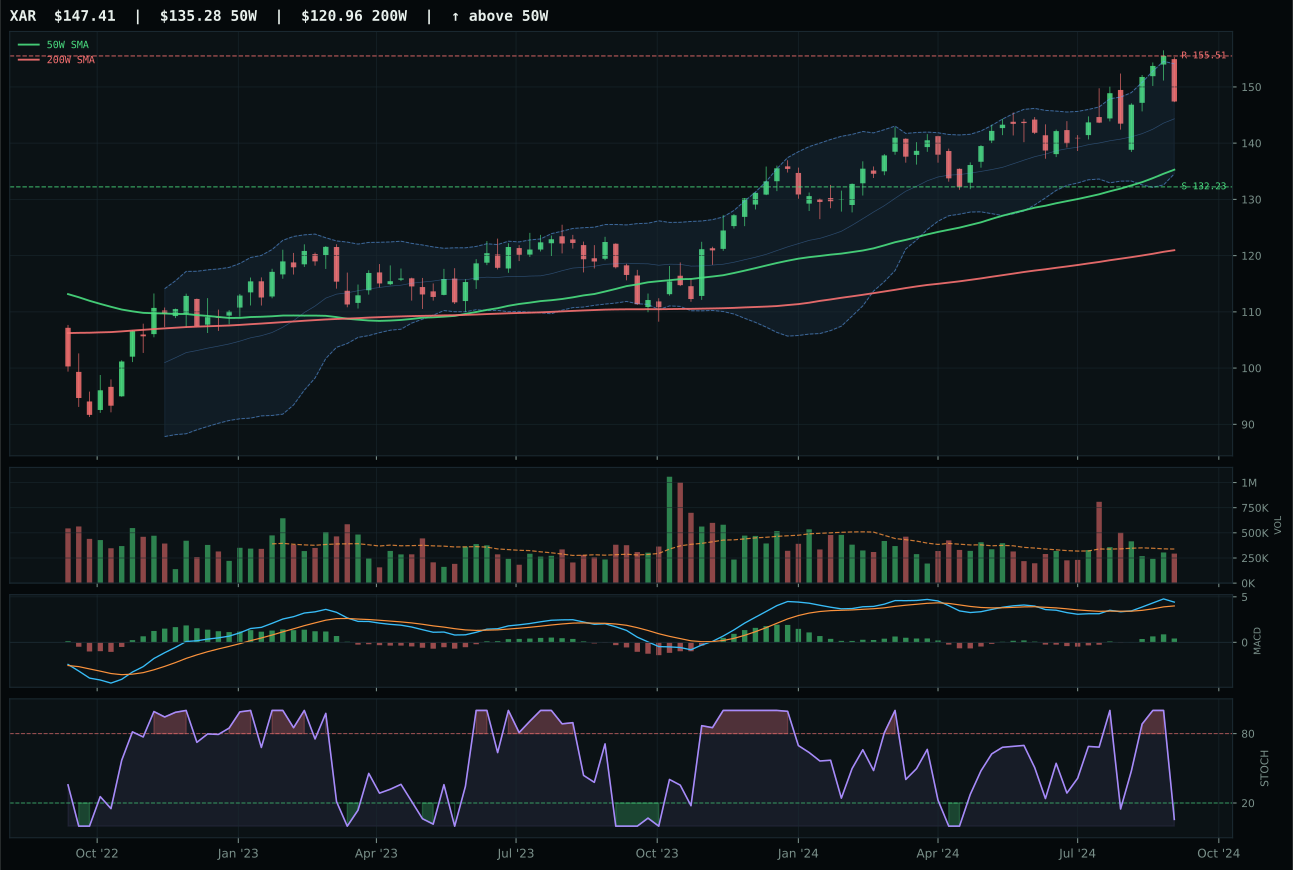
XAR has a neutral structure profile with 2.7% 13-week relative strength versus SPY.
A failed hold above support would weaken the setup.
Actionable but governed by invalidation levels.
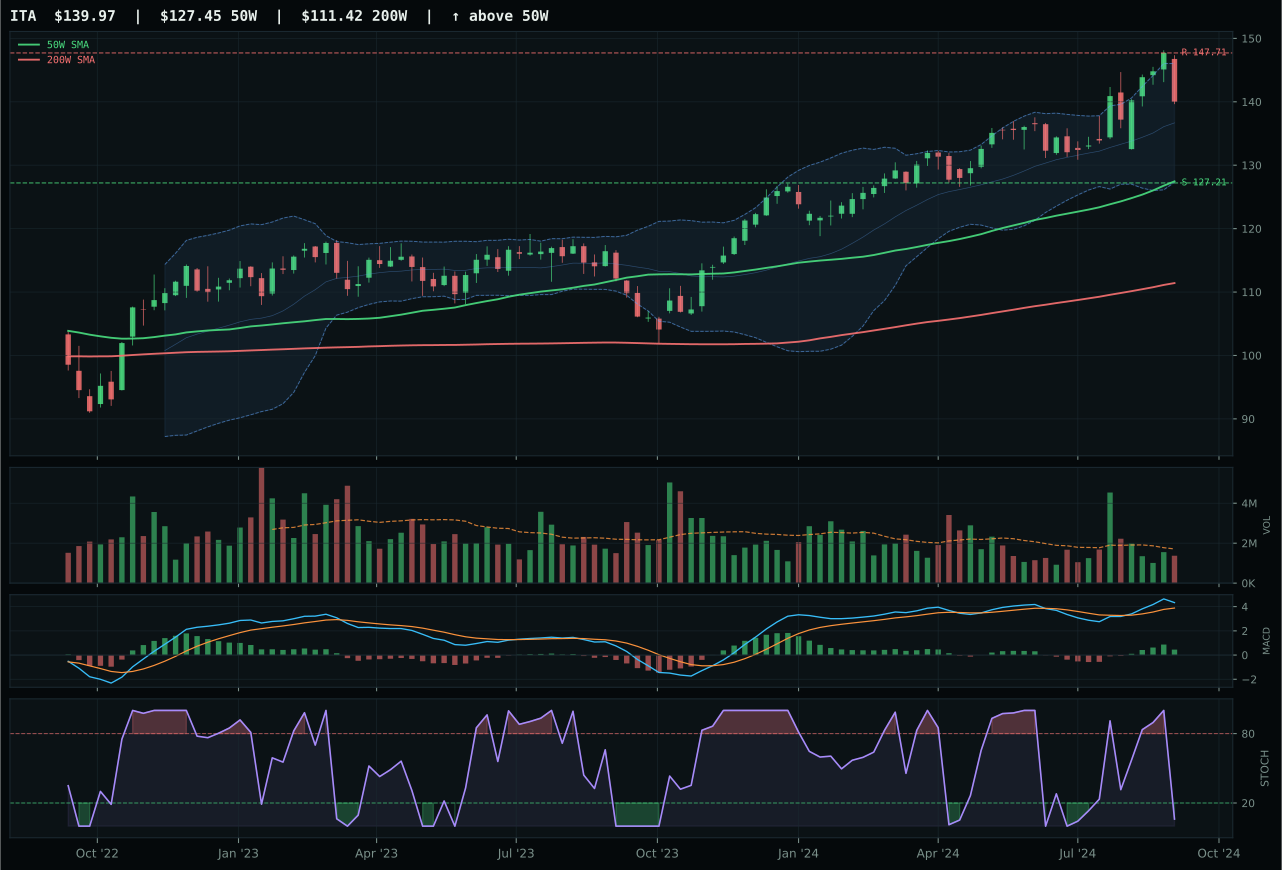
ITA has a neutral structure profile with 1.4% 13-week relative strength versus SPY.
A failed hold above support would weaken the setup.
Actionable but governed by invalidation levels.
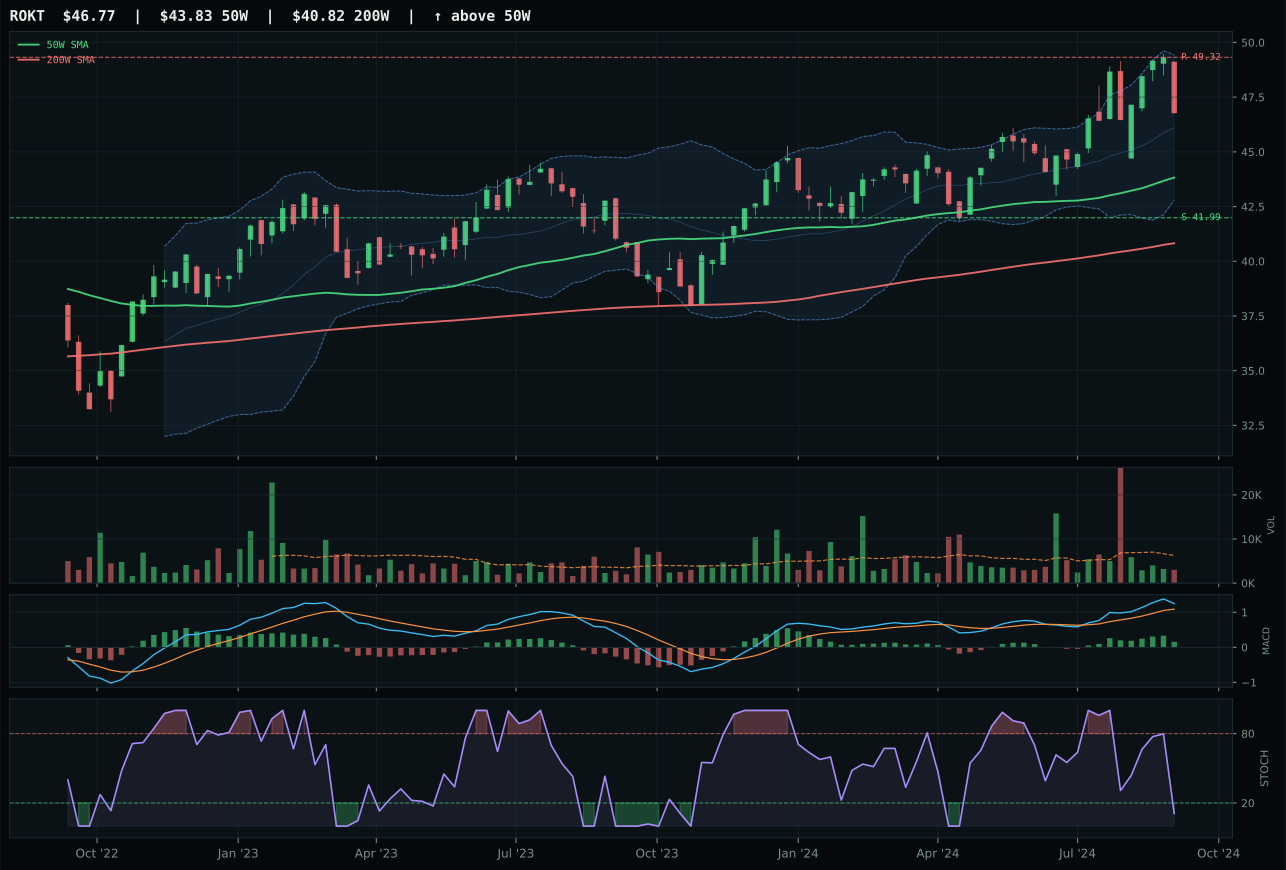
ROKT has a neutral structure profile with 2.9% 13-week relative strength versus SPY.
A failed hold above support would weaken the setup.
Tracked, but not top-2 eligible because: .
XAR won Defense & Aerospace by a razor-thin 0.9-point margin over ITA, both sitting at exactly 100.0/100 trend scores and occupying nearly identical risk/reward profiles (53.2 vs 54.0). The separation came from category-relative strength: XAR posted 0.0% while ITA posted -1.4%, a seeming paradox that reveals how the system penalizes negative category-relative performance. XAR sits 9.0% above the 50W with MACD bullish and improving and stochastic RSI deeply oversold at 0.06, creating the classic value-timing setup where oversold technicals paired with extended price suggests accumulation at higher levels. The neutral structure (not compression, not extension) places all weight on macro narrative and relative sponsorship; the 2.7% SPY outperformance over 13 weeks indicates defense names are being accumulated regardless of macro regime. ITA's 1.4% SPY return cannot overcome the category-relative penalty, despite its superior 54.0/100 macro fit score.
Defense & Aerospace received 5% as a tier-2 category with a 55.7 final score that reflects modest technical quality combined with strong macro alignment. The defensive rotation descriptor is active at +8 points, and disinflation at +6 points supports the business model of regulated, stable industrial names. However, liquidity stress (-4) and risk appetite broken (-2) create persistent headwinds that prevent the category from reaching top-2 status despite the clean bullish setup across all three ETFs. The 55.0/100 category-level macro fit is above-neutral but below conviction threshold; this is a category working well when the macro regime supports it but fragile at the first sign of reacceleration. The 5% allocation represents a hedge play within the defensive sleeve—meaningful enough to participate in rotation but small enough that rotation failure wouldn't crater portfolio returns.
AI — AIQ
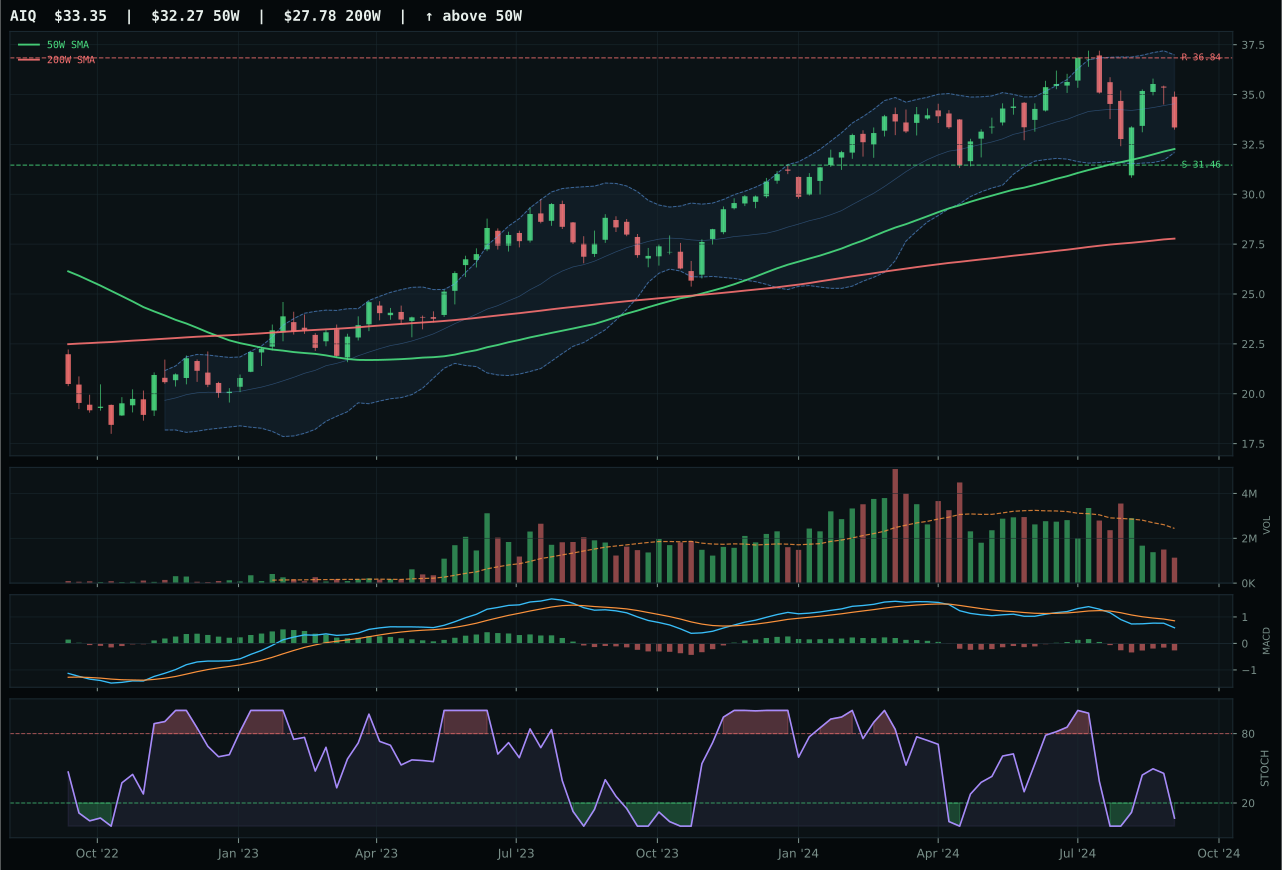
AIQ has a neutral structure profile with -3.9% 13-week relative strength versus SPY.
A failed hold above support would weaken the setup.
Actionable but governed by invalidation levels.
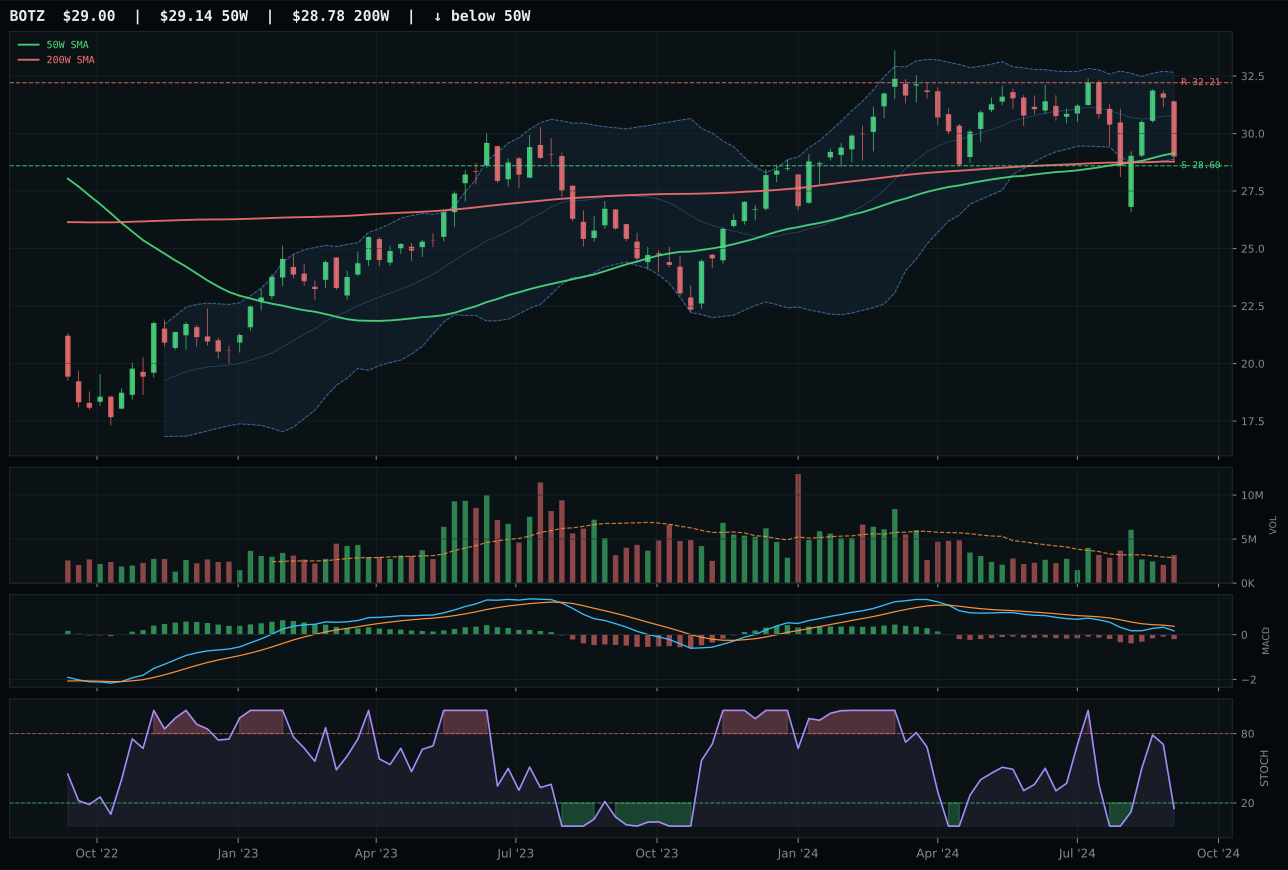
BOTZ has a pullback into support profile with -7.8% 13-week relative strength versus SPY.
A failed hold above support would weaken the setup.
Actionable but governed by invalidation levels.
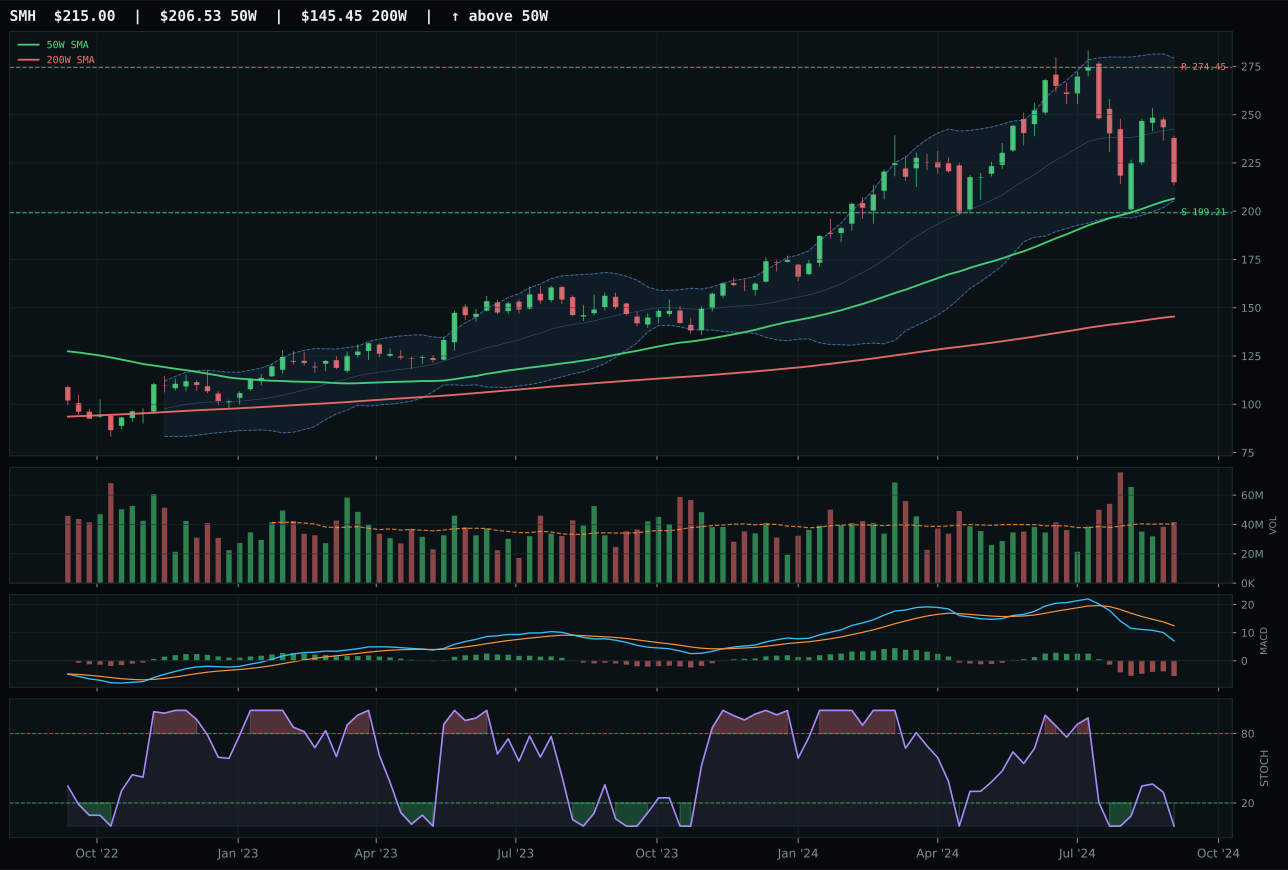
SMH has a neutral structure profile with -15.9% 13-week relative strength versus SPY.
A failed hold above support would weaken the setup.
Actionable but governed by invalidation levels.
AIQ won AI by posting a 3.9% category-relative strength advantage over BOTZ, which tied on absolute technical quality (both 74 composites) but lagged meaningfully on breadth inside the basket. AIQ sits 3.3% above its 50W and occupies a neutral structure setup—no compression, no vertical extension—which forces the scoring system to rely entirely on trend, relative strength, and timing confirmation to justify the position. The 87.2/100 trend score is genuine: price is above both the 50W and 200W with a 0.4% positive slope. Stochastic RSI is deeply oversold at 0.07, which aligns with the 90.0/100 timing score; however, the 43.8/100 momentum confirmation reflects the flat 4W return and thin 0.46x volume participation. BOTZ's stronger risk/reward at 98.0/100 versus AIQ's 73.4/100 is a trap here—BOTZ's superior asymmetry masks the fact that it posted zero category-relative strength and deteriorating SPY-relative momentum at -7.8% 13W return.
AI received 5% as a tier-2 category despite holding a 43.2 final score well below the top-2 threshold. The -12 liquidity stress macro penalty cuts deeply into an already fragile technical setup: a category-level macro fit of only 43.0/100 means this is a structural underweight week for artificial intelligence. The narrow win over BOTZ (0.0 point gap) signals coin-flip territory; neither ETF has real conviction behind it. What matters is that 62% of the scoring weight is technical and 38% macro, so a -3.9% SPY-relative return combined with thin volume cannot overcome the macro headwinds alone. This is a slot-filler allocation: AI stays on the board at 5% to maintain category diversity, but any deterioration in the technical setup or confirmation of risk appetite breakdown would warrant removal entirely.
Emerging Markets — IEMG
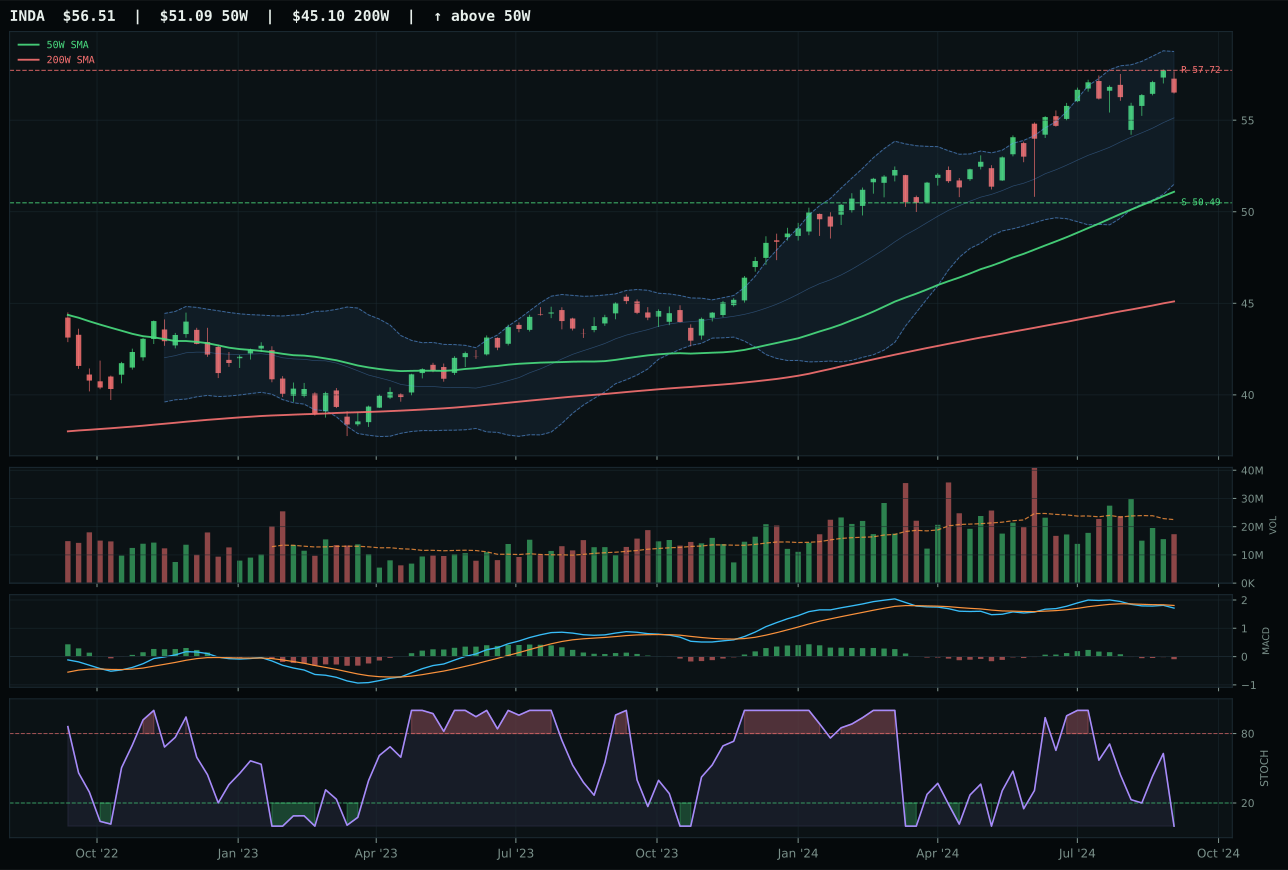
INDA has a neutral structure profile with 3.5% 13-week relative strength versus SPY.
A failed hold above support would weaken the setup.
Actionable but governed by invalidation levels.
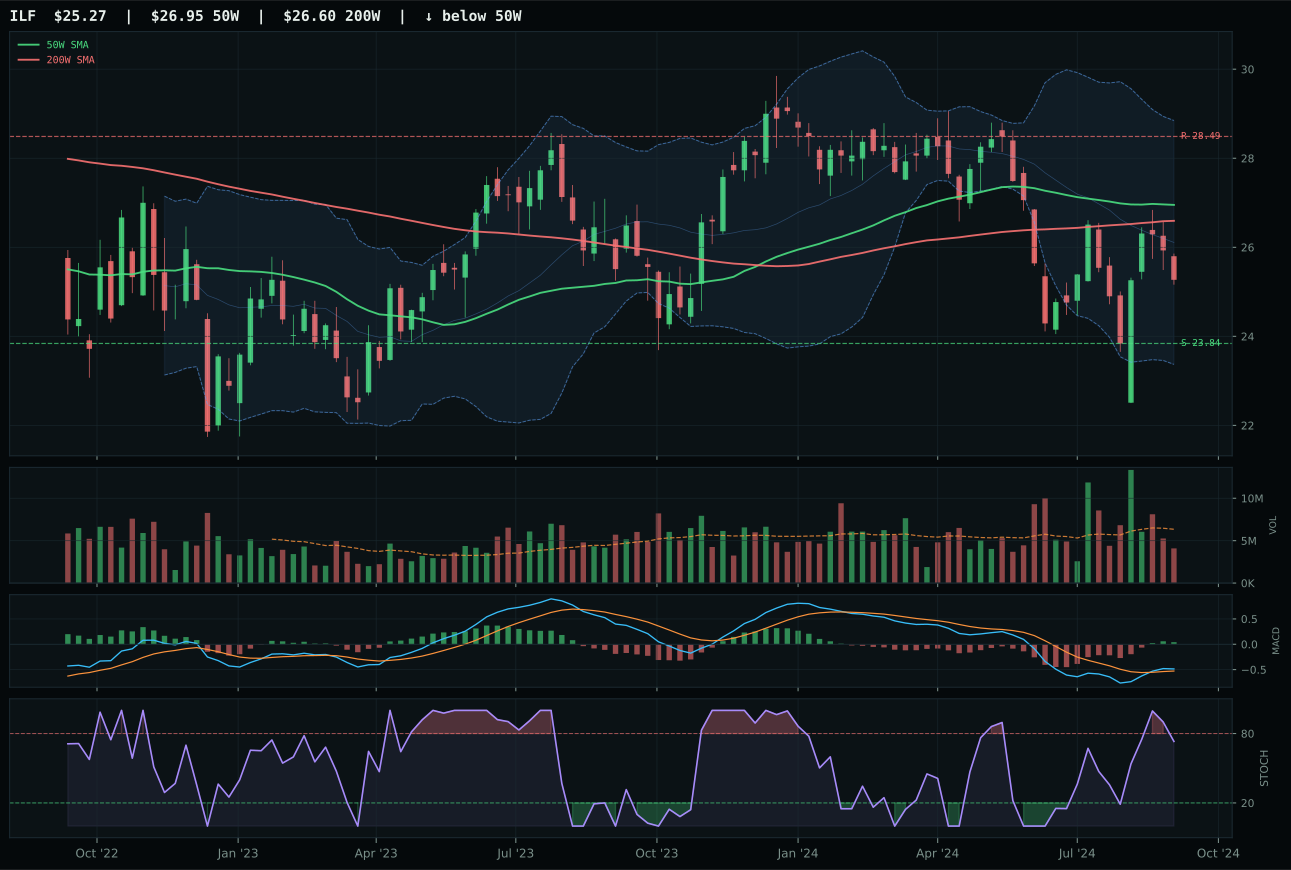
ILF has a neutral structure profile with -2.6% 13-week relative strength versus SPY.
A failed hold above support would weaken the setup.
Actionable but governed by invalidation levels.
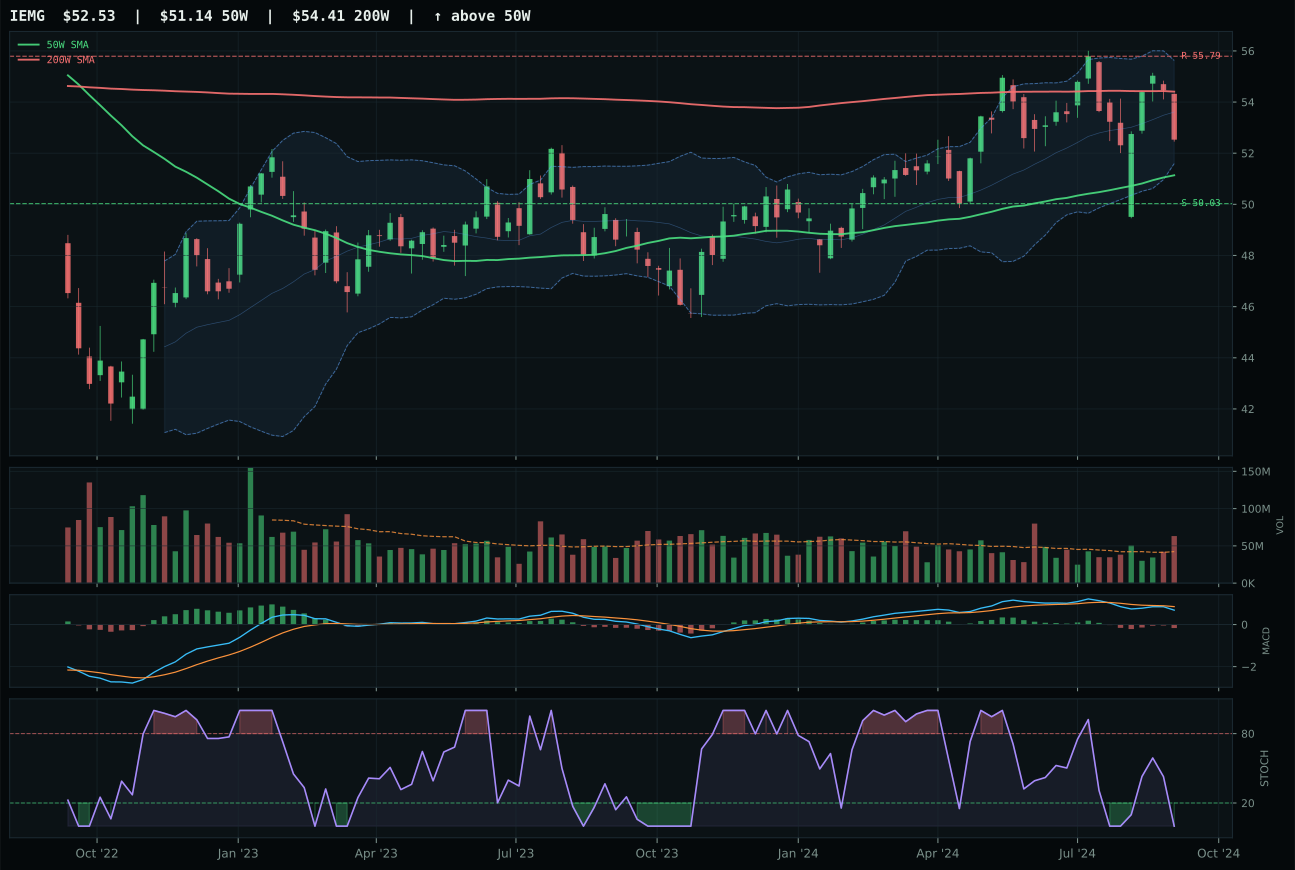
IEMG has a pullback into support profile with -2.0% 13-week relative strength versus SPY.
A failed hold above support would weaken the setup.
Actionable but governed by invalidation levels.
IEMG won Emerging Markets with a 59.0 reasoned score over INDA's 48.0, driven by superior timing (100.0 versus 62.0), better risk/reward (66.0 versus 40.2), and category-relative strength parity (0.0%). IEMG sits 2.7% above the 50W in a pullback-into-support structure with above-average volume participation at 1.49x, which is rare and signals accumulation at the entry level. MACD is bearish but improving, stochastic RSI is oversold at 0.00, and the timing score of 100.0/100 reflects the ideal combination of distance to the moving average and Fib zone placement in the upper retracement/momentum zone. The -0.8% 13W return and -2.0% SPY performance show no momentum, but the above-average volume creates a subtle confirmation that buyers are stepping in at support. INDA's -23.8% SPY return is disqualifying despite its positive 4.7% 13W return, which reveals a category divergence (India outperforming, broader markets underperforming) that lacks portfolio synchronization.
Emerging Markets received 5% as a tier-2 category with a 27.9 final score reflecting macro headwinds that prevent top-2 status. Liquidity stress is active at -10 points at the category level, a direct penalty for broad emerging-market beta exposure. The 40.0/100 category-level macro fit is below-neutral. However, IEMG's above-average volume participation creates a subtle technical signal that accumulation is starting at support, which justifies holding the 5% position rather than dropping to 0%. This is a category trading at a discount to intrinsic value on macro pessimism, not technical failure. The 100.0/100 timing score on IEMG indicates the setup is coiled: if liquidity stress diminishes or risk appetite stabilizes, this category could re-rate higher with minimal technical deterioration. For now, 5% is a position-sizing statement: acknowledge the emerging-market discount, don't fight the liquidity headwind.
Nuclear Energy — NLR
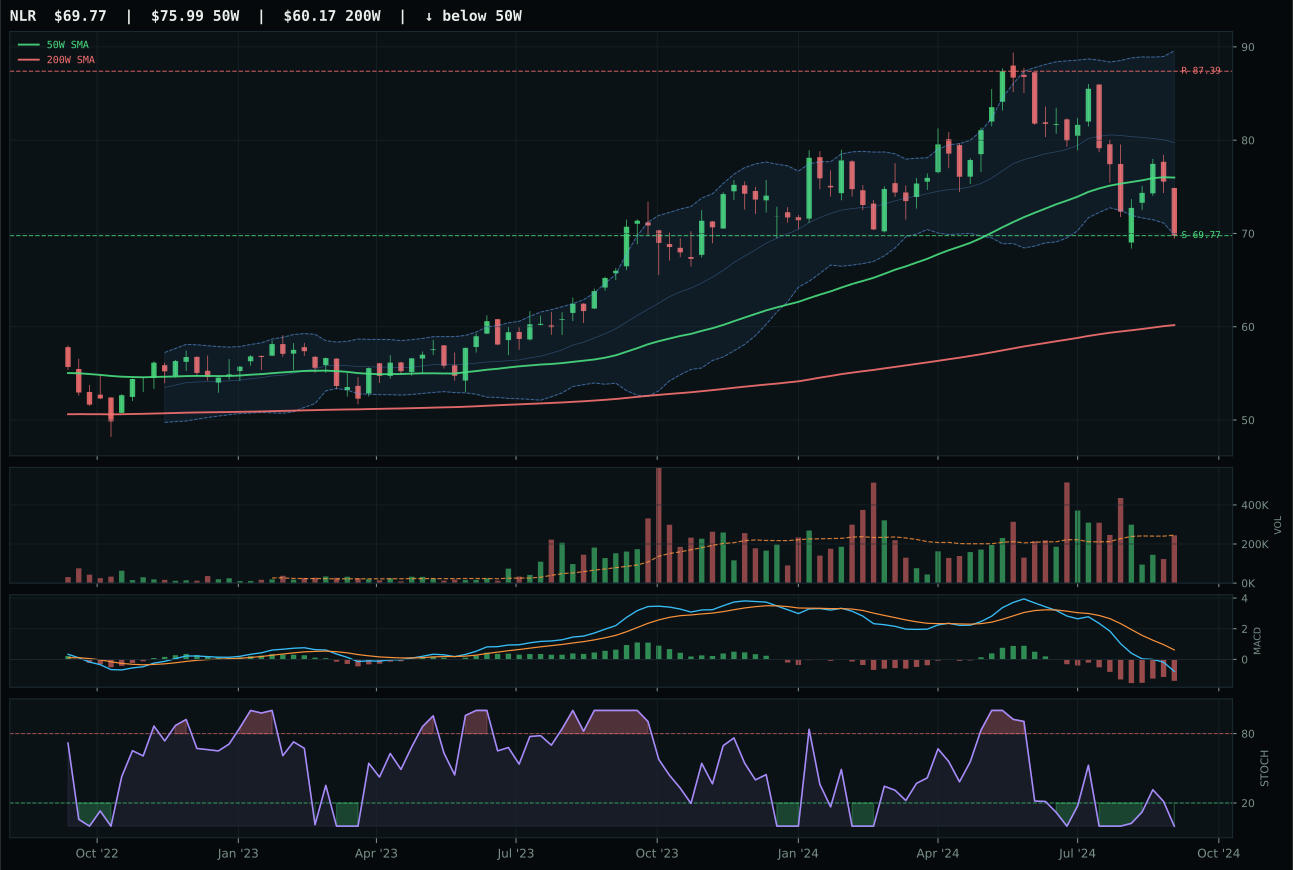
NLR has a pullback into support profile with -15.9% 13-week relative strength versus SPY.
A failed hold above support would weaken the setup.
Actionable but governed by invalidation levels.
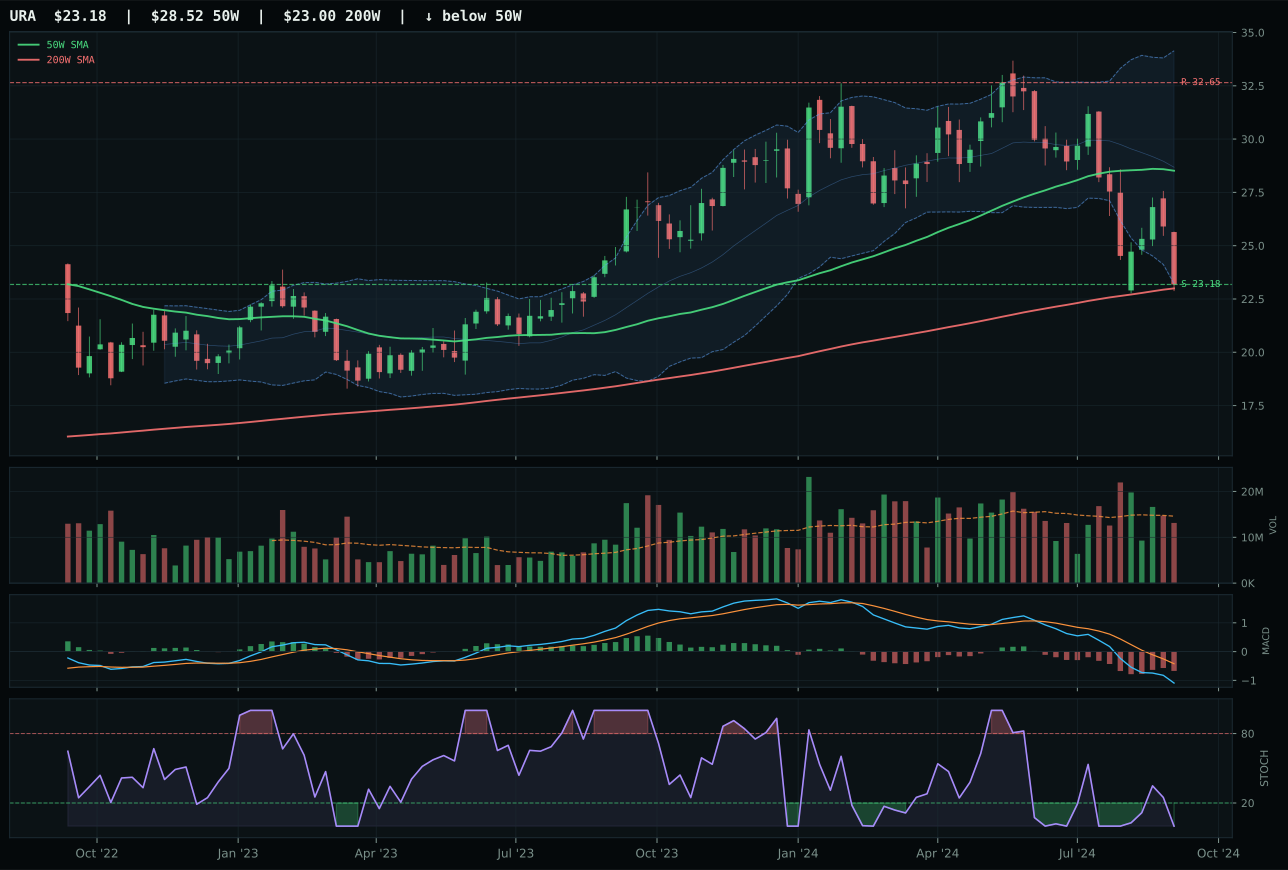
URA has a pullback into support profile with -23.8% 13-week relative strength versus SPY.
A failed hold above support would weaken the setup.
Actionable but governed by invalidation levels.
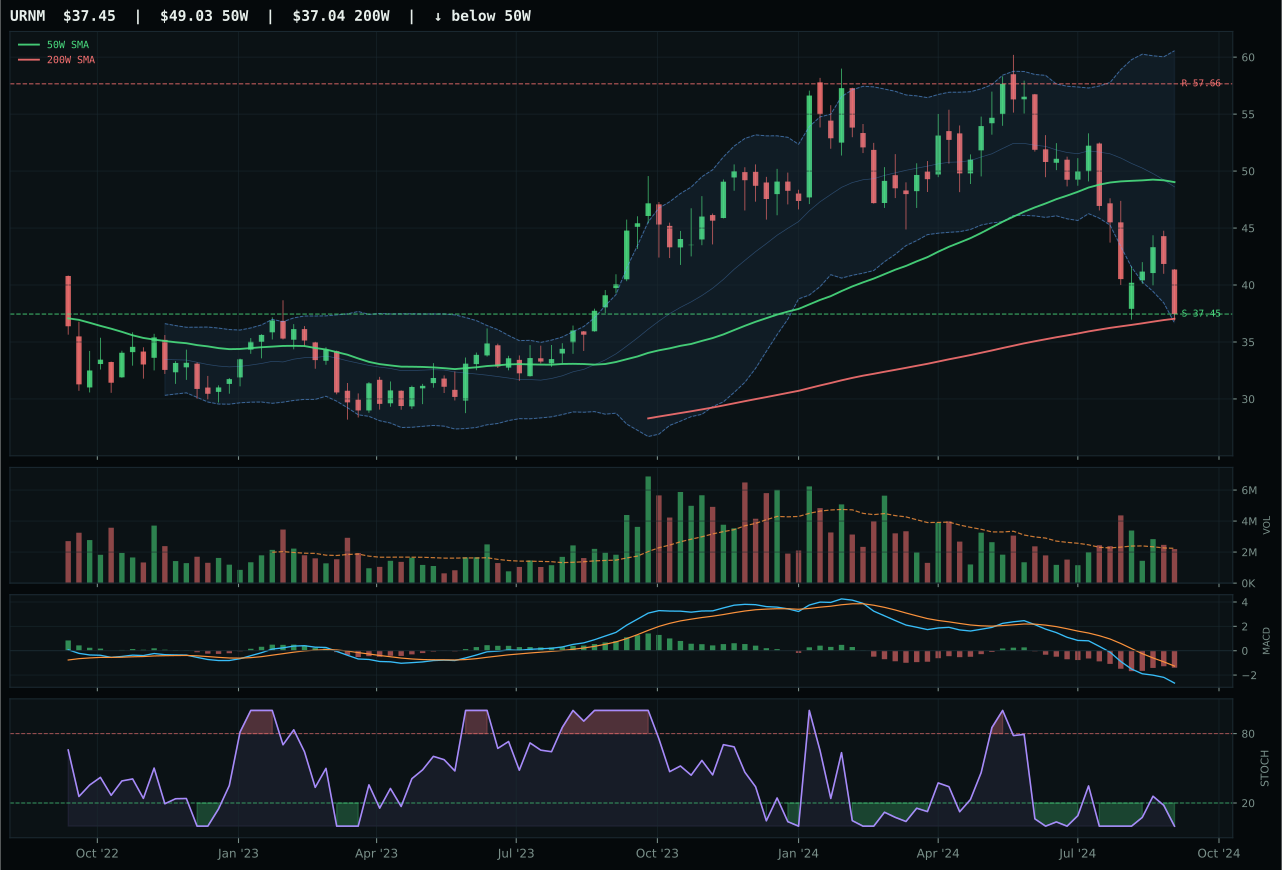
URNM has a pullback into support profile with -29.0% 13-week relative strength versus SPY.
A failed hold above support would weaken the setup.
Actionable but governed by invalidation levels.
NLR won Nuclear Energy with a 49.0 reasoned score versus URA's 38.2, driven entirely by category-relative strength superiority (7.9% versus 0.0%) and marginally better timing and risk/reward scores. NLR sits 8.2% below the 50W in pullback-into-support setup with MACD bearish but improving and stochastic RSI deeply oversold at 0.00. The 85.0/100 timing score reflects perfect distance to the moving average combined with deep Fib zone placement at 0.786. Risk/reward is excellent at 90.0/100: upside to resistance is 20.2% away, downside is 0.0%. However, the 16.4/100 momentum confirmation—driven by -14.7% 13W return and -15.9% SPY-relative performance—reveals this is another capitulation setup, not conviction buying. URA's -23.8% SPY return over 13 weeks makes NLR look strong by comparison, but that's a relative strength story, not absolute strength.
Nuclear Energy received 5% as a tier-2 category with a 24.0 final score, holding a position despite weak technical sponsorship because defensive rotation is active at +6 points. The category macro fit of 39.0/100 reflects two headwinds: liquidity stress (-7) and risk appetite broken (-4), offset partially by the defensive rotation tailwind. This is a category that makes sense as a defensive hedge in a risk-off regime but trades at a steep discount to true quality. The -15.9% SPY-relative return and 0% change 4W return indicate no accumulation; buyers are absent. The 5% allocation is justified only by its role as a tail-risk hedge and defensive rotation participant. Any deterioration in the technical setup—support breaking below 69.77—would warrant immediate exit. This is conviction capital deployment in a macro shift toward caution, not a standalone technical setup.
Agriculture & Livestock — MOO
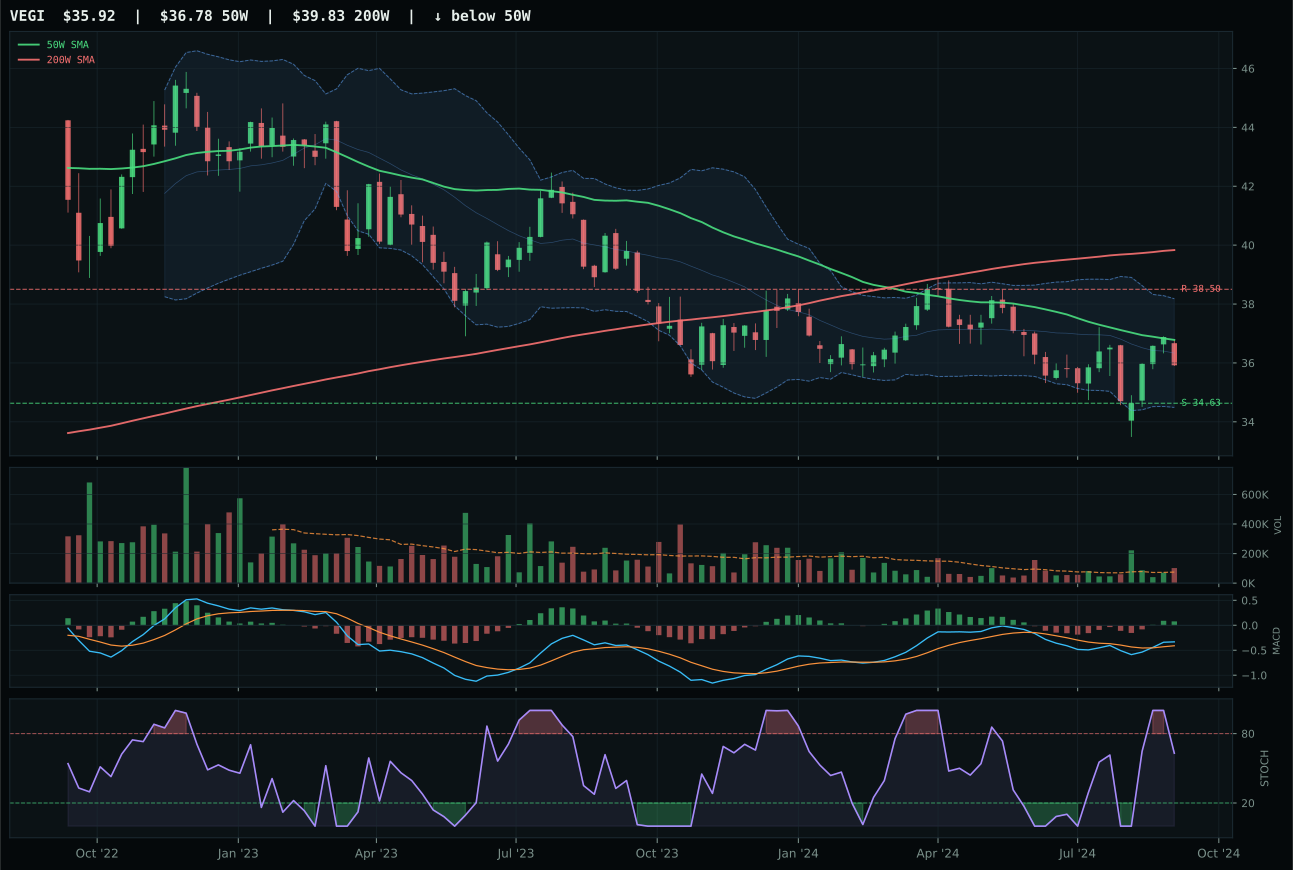
VEGI has a pullback into support profile with -2.2% 13-week relative strength versus SPY.
Extension and support failure are the main tactical risks.
Tracked, but not top-2 eligible because: structurally broken.
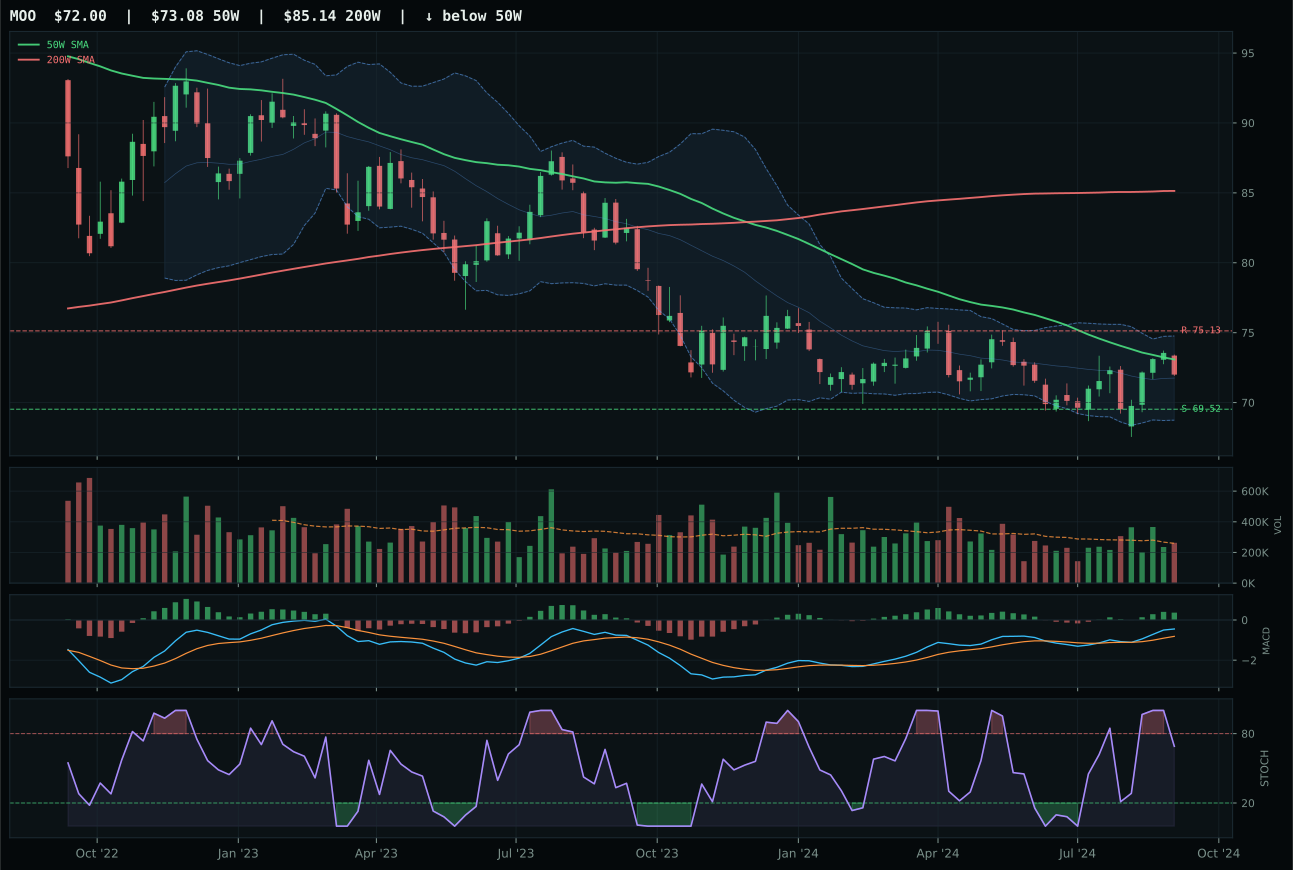
MOO has a pullback into support profile with -0.6% 13-week relative strength versus SPY.
Extension and support failure are the main tactical risks.
Tracked, but not top-2 eligible because: structurally broken.
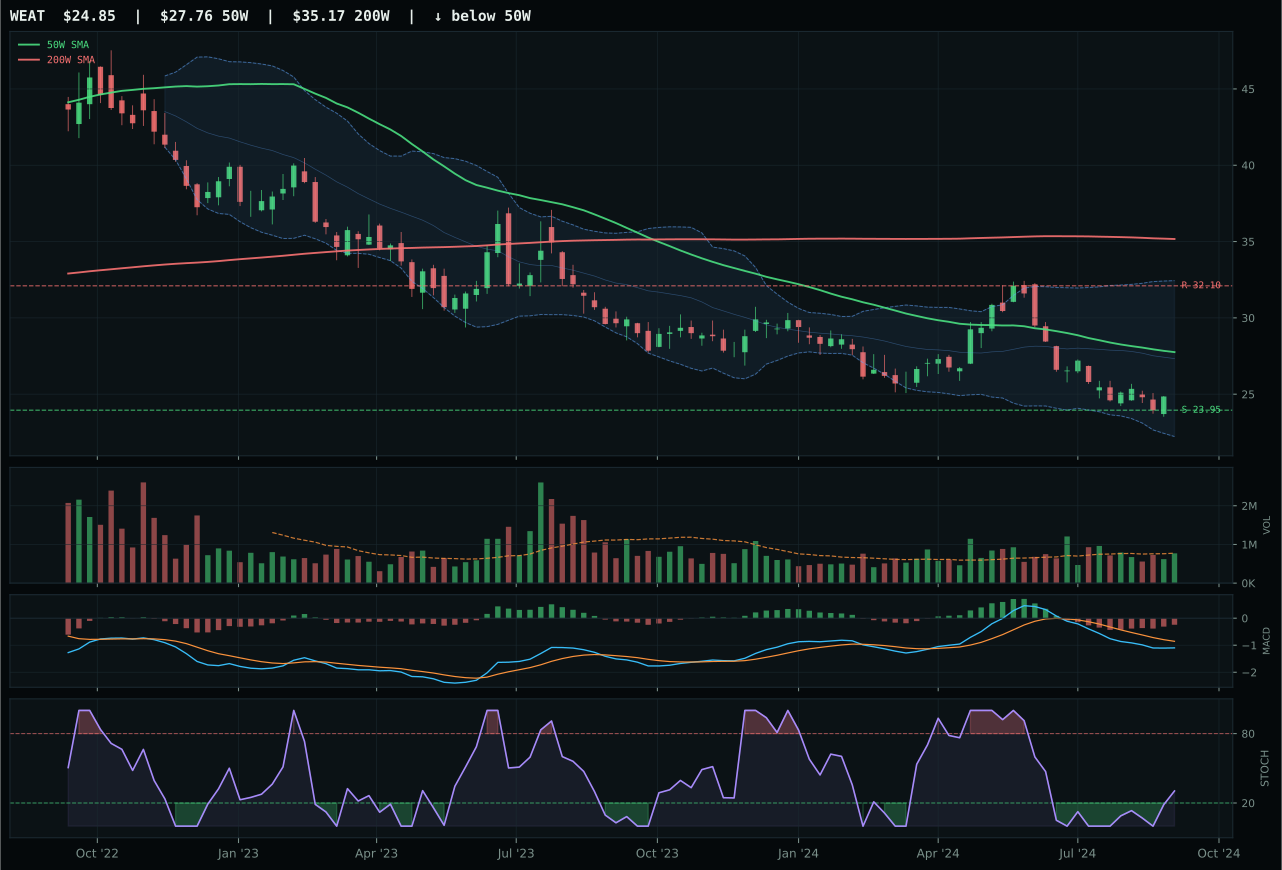
WEAT has a neutral structure profile with -15.1% 13-week relative strength versus SPY.
Extension and support failure are the main tactical risks.
Tracked, but not top-2 eligible because: structurally broken.
MOO won Agriculture & Livestock but the category itself received 5% allocation due to eligibility failure driven by macro regime misalignment, not technical weakness. MOO's 1.6% category-relative strength over VEGI determined the winner, though both traded near technical parity at 40.8 versus 40.4 in the reasoned ETF proof order. The winning setup is pullback-into-support with MACD bullish and improving, stochastic RSI falling/neutral at 0.69, and price sitting 1.5% above the 50W with -0.6% SPY-relative return. The 100.0/100 timing score reflects perfect distance to the 50W combined with deep Fib zone placement at 0.786 near 70.90. Volume is neutral at 1.01x average, providing neither confirmation nor rejection. MOO's -0.6% SPY return over 13 weeks represents true weakness, but the category structure gives it the title by relative merit within its three-stock universe.
Agriculture & Livestock earned 5% allocation despite MOO's technical legitimacy as category winner, because the category-level final score collapsed to 0.0 on eligibility filters that tested the 3/2/1 weighted basket against leadership, sponsorship, and persistence metrics. The disinflation macro regime penalizes agricultural commodity exposure by -6 points at the category level, and disinflation pressure is explicitly active at -8 points. Liquidity stress adds another -4 point headwind. The 32.0/100 category-level macro fit is catastrophic; the 62/38 technical-to-macro weighting cannot overcome such poor macro alignment. This category needs either a rotation into inflation expectations or a fresh technical breakout with broad sponsorship to earn a position. For now, the +0.6% 13W return and neutral-to-negative relative strength provide no margin of safety to justify competing for allocation space against categories with positive macro tailwinds.
Industrial Metals — COPX
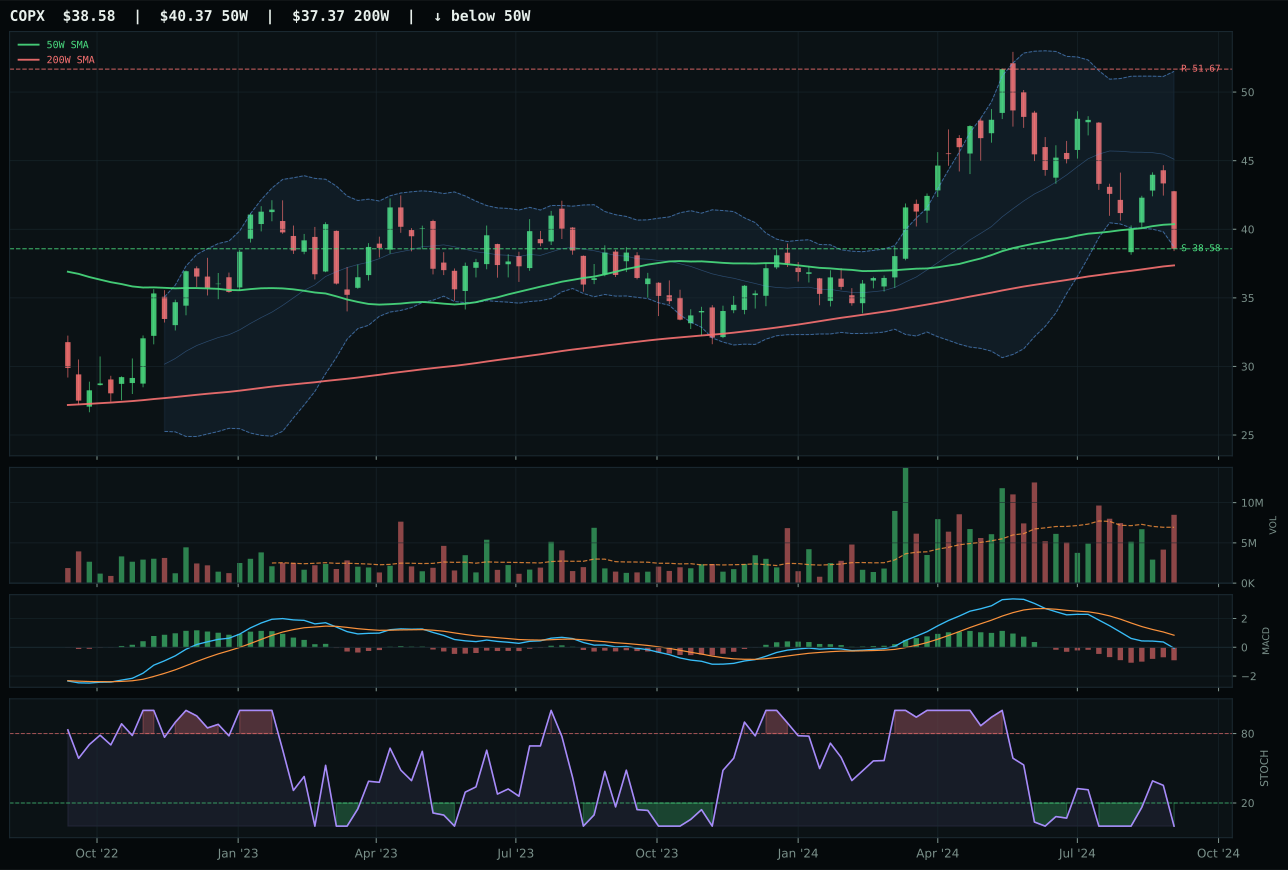
COPX has a pullback into support profile with -16.3% 13-week relative strength versus SPY.
A failed hold above support would weaken the setup.
Actionable but governed by invalidation levels.
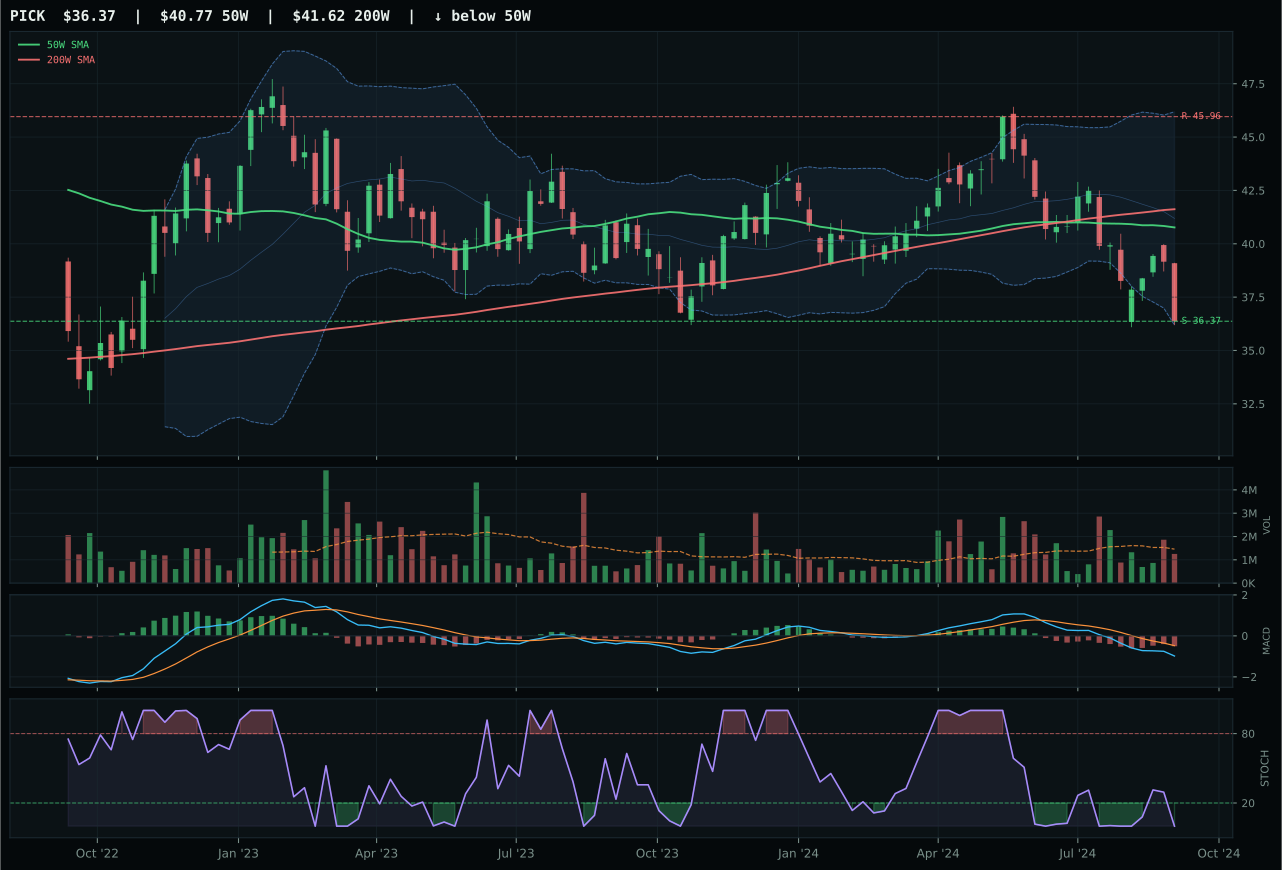
PICK has a pullback into support profile with -15.0% 13-week relative strength versus SPY.
Extension and support failure are the main tactical risks.
Tracked, but not top-2 eligible because: structurally broken.
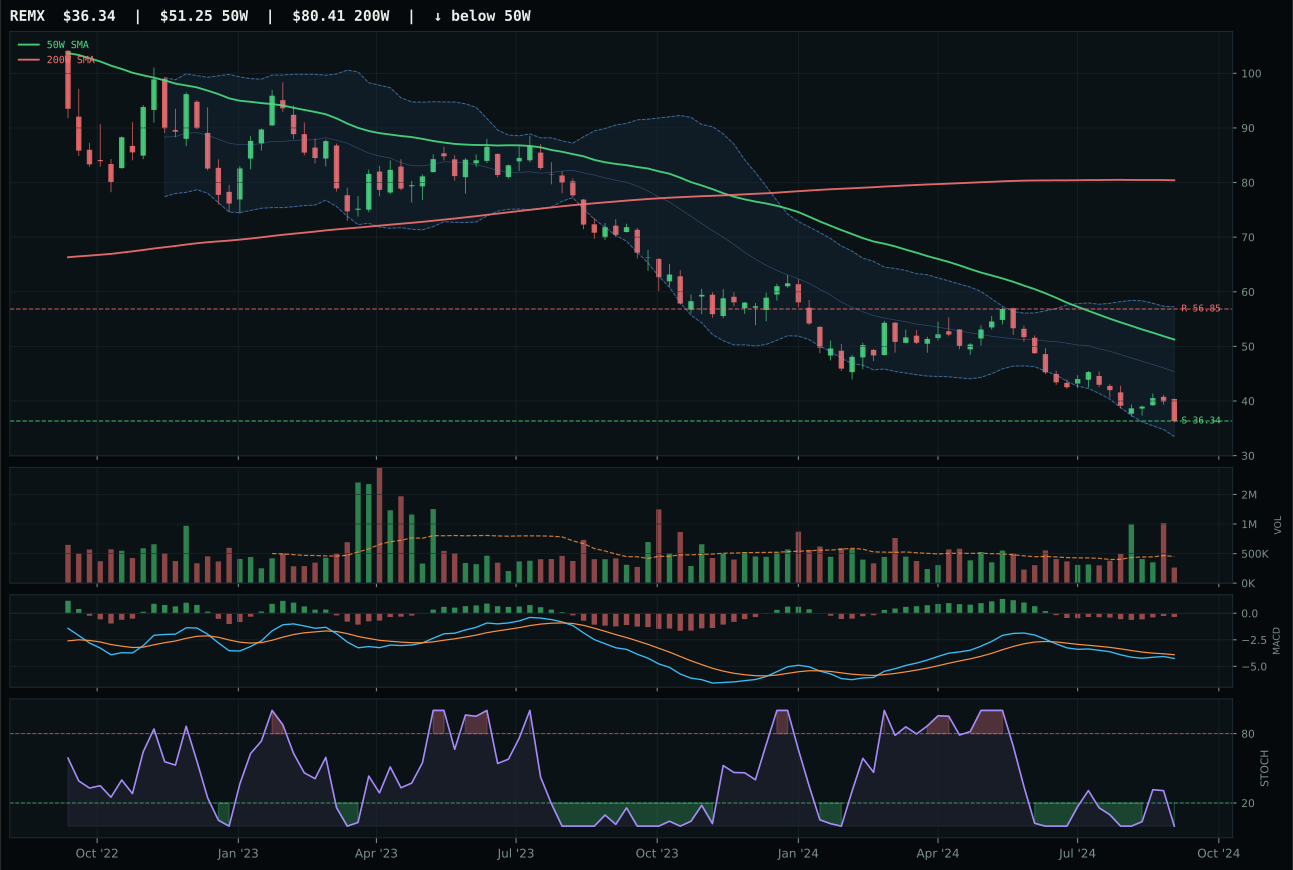
REMX has a pullback into support profile with -26.6% 13-week relative strength versus SPY.
Extension and support failure are the main tactical risks.
Tracked, but not top-2 eligible because: structurally broken.
COPX won Industrial Metals with a 45.1 reasoned score but the category failed eligibility filters and received 0% allocation. COPX posts a pullback-into-support setup with perfect 100.0/100 timing (distance to 50W of 4.4% matched with oversold stochastic RSI and bearish-but-improving MACD) and exceptional 98.0/100 risk/reward that reflects the deep drawdown: upside to resistance is 25.3% while downside to support sits at 0.0%. However, the 8.1/100 momentum confirmation is devastating—the -15.1% 13W return and -16.3% SPY-relative performance show genuine capitulation, not accumulation. Volume at 1.22x average participation confirms selling, not buying. PICK's 42.8-point deficit versus COPX owes entirely to worse technical scores across timing, risk/reward, and structure cleanliness, but PICK's structural break status also disqualified it from consideration.
Industrial Metals earned 0% allocation because the 8.7 final category score reflects a deep macro mismatch combined with broken technical sponsorship. Liquidity stress is active at -8 points, a direct headwind for cyclical commodity exposure. The -16.3% SPY-relative return and -15.1% 13W return are alarm signals: even though the risk/reward setup is theoretically attractive (25% upside, 0% downside), the absence of buying pressure means the support level is likely to break. A 46.2/100 technical evidence score paired with 43.0/100 macro fit produces a 8.7 category score that ranks 9th or 10th depending on week. This category needs either a genuine macro pivot toward growth acceleration or a multi-month bottom-formation period to qualify for inclusion. For now, it remains outside the allocation entirely.
Traditional Energy — FCG
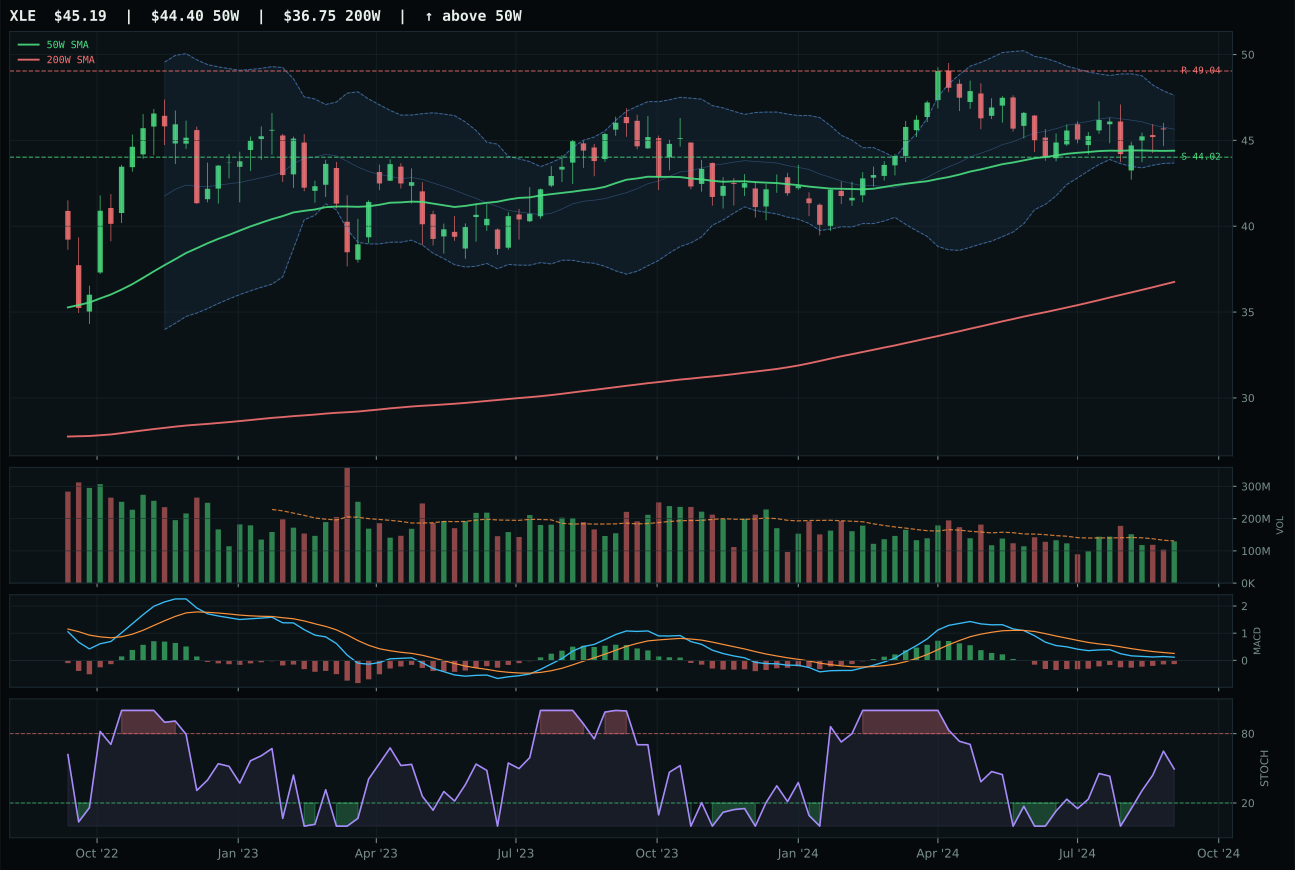
XLE has a pullback into support profile with -5.6% 13-week relative strength versus SPY.
A failed hold above support would weaken the setup.
Actionable but governed by invalidation levels.
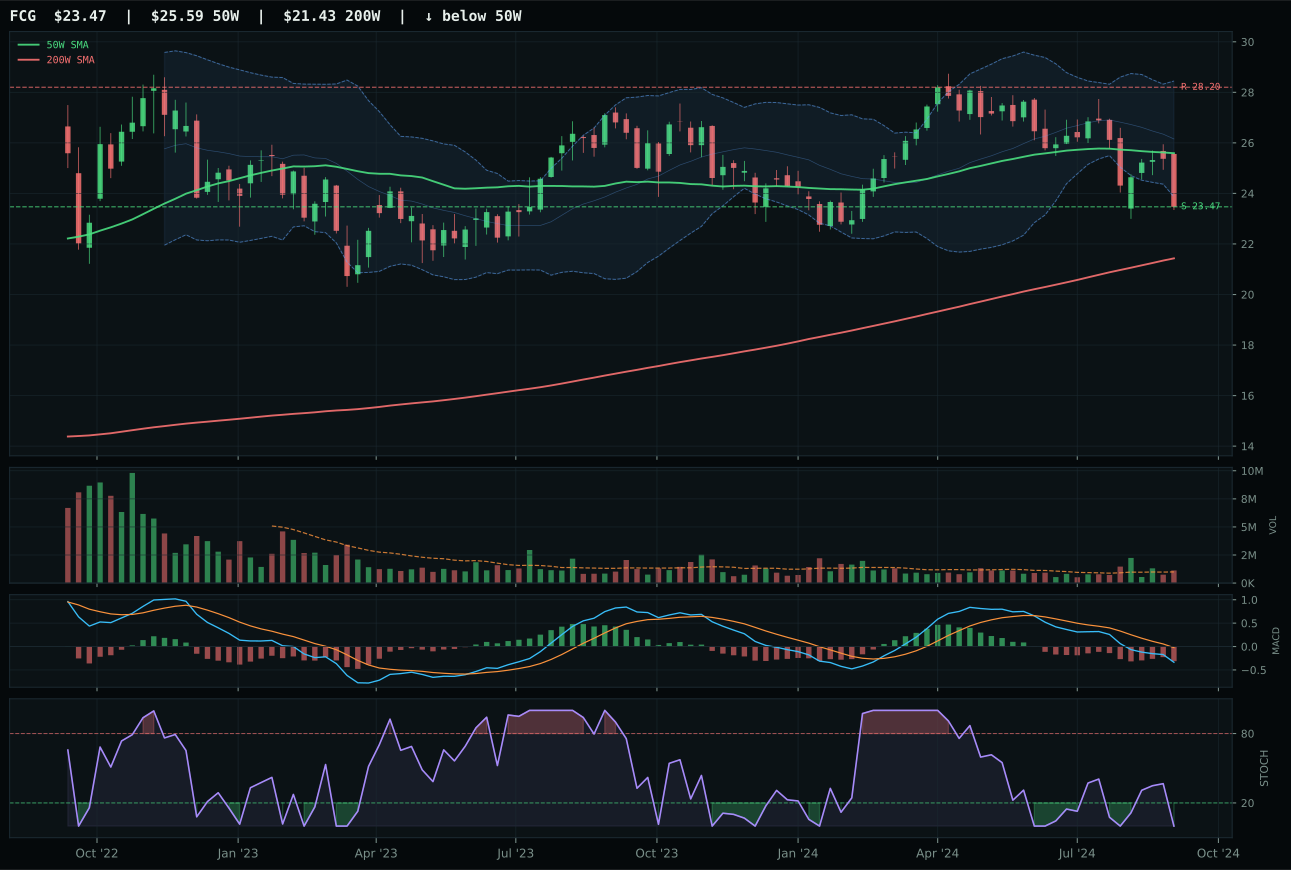
FCG has a pullback into support profile with -12.5% 13-week relative strength versus SPY.
A failed hold above support would weaken the setup.
Actionable but governed by invalidation levels.
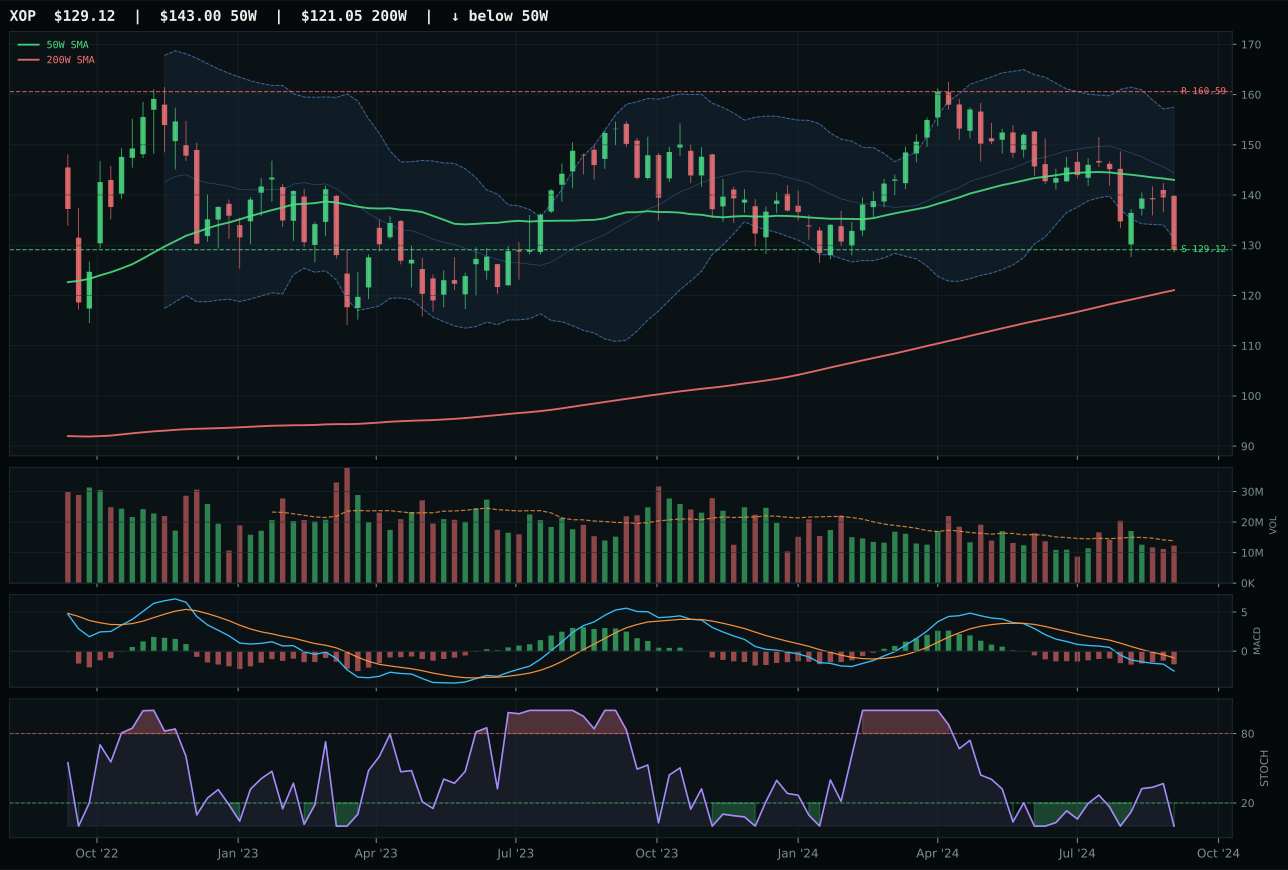
XOP has a pullback into support profile with -12.6% 13-week relative strength versus SPY.
A failed hold above support would weaken the setup.
Actionable but governed by invalidation levels.
FCG won Traditional Energy despite posting a weak composite score of 62, beating XLE's 48 through superior timing, risk/reward, and structure quality. FCG sits 8.3% below its 50W moving average in a pullback-into-support pattern with MACD bearish but improving and stochastic RSI at 0.00—textbook oversold timing that scores perfectly at 85.0/100. The risk/reward is 82.7/100: upside to resistance is 16.8% away, downside to support sits at 0.0%. However, the -11.3% 13W return and -12.5% SPY-relative performance reveal this is a capitulation bottom, not an accumulation setup. Volume at 1.13x average participation indicates sellers are present, not buyers stepping in at support. XLE's fundamental 39-point technical composite is undermined by MACD bearish/weakening (deteriorating momentum) and worse risk/reward at 57.7/100.
Traditional Energy received 0% allocation with a 3.2 final category score, ranking it near or at the bottom of the portfolio. Disinflation hurts energy at -10 points and disinflation pressure is active at -10 points—a paired macro penalty that reflects the structural shift away from commodity demand in a disinflationary environment. Liquidity stress adds -7 more points. The combined -27 point macro headwind produces a 23.0/100 category-level fit, the weakest in the system this week. Even FCG's perfect timing score cannot overcome the regime headwind. This is not a tactical bounce play; this is a category that trades against the macro momentum. A reflationary surprise or growth reacceleration would be required to bring Traditional Energy back onto the allocation grid. Until then, capital is better deployed in defensive and monetary-hedge themes.