
2024-08-30
Informational purposes only. The content in this report, including allocations, analysis, and commentary, is provided solely for informational and educational purposes. It does not constitute financial advice, investment advice, trading advice, or any other type of advice. Past performance does not guarantee future results. Always conduct your own research and consult a qualified financial professional before making investment decisions.
Weekly Allocation
| Ticker | Category | Weight | Role |
|---|---|---|---|
| FBTC | 50% | Overlay | |
| PAVE | Utilities & Infrastructure | 10% | Top-2 (10%) |
| GLD | Precious Metals | 10% | Top-2 (10%) |
| CIBR | Technology | 5% | Tier-2 (5%) |
| XAR | Defense & Aerospace | 5% | Tier-2 (5%) |
| SMH | AI | 5% | Tier-2 (5%) |
| URA | Nuclear Energy | 5% | Tier-2 (5%) |
| INDA | Emerging Markets | 5% | Tier-2 (5%) |
| XLE | Traditional Energy | 5% | Tier-2 (5%) |
Trade Instructions — Monday Open
Sell the tranche from 2024-08-02 (completing its 4-week hold). Buy the new tranche. Instructions show net portfolio changes — same-asset positions cancel, weight changes show the delta.
| Action | Ticker | Instruction |
|---|---|---|
| SELL | XLU | Sell 25% of XLU position (reduce 10.00% → 7.50%) |
| SELL | ITA | Sell 25% of ITA position (reduce 5.00% → 3.75%) |
| SELL | MOO | Sell 25% of MOO position (reduce 5.00% → 3.75%) |
| SELL | NLR | Sell 25% of NLR position (reduce 5.00% → 3.75%) |
| BUY | XAR | Buy XAR — 20.00% of freed cash (adds 1.25% to portfolio) |
| BUY | PAVE | Buy PAVE — 40.00% of freed cash (adds 2.50% to portfolio) |
| BUY | SMH | Buy SMH — 20.00% of freed cash (adds 1.25% to portfolio) |
| BUY | URA | Buy URA — 20.00% of freed cash (adds 1.25% to portfolio) |
Current Portfolio After Trade
Combined holdings across all 4 active tranches. Each tranche is 25% of the portfolio.
| Ticker | % of Portfolio | Weight Bar |
|---|---|---|
| FBTC | 50.00% | |
| GLD | 8.75% | |
| XLU | 7.50% | |
| CIBR | 5.00% | |
| XLE | 5.00% | |
| ITA | 3.75% | |
| MOO | 3.75% | |
| NLR | 3.75% | |
| AIQ | 2.50% | |
| XAR | 2.50% | |
| PAVE | 2.50% | |
| BOTZ | 1.25% | |
| SMH | 1.25% | |
| URA | 1.25% | |
| INDA | 1.25% |
Macro Regime — Disinflation
Macro Evidence Charts
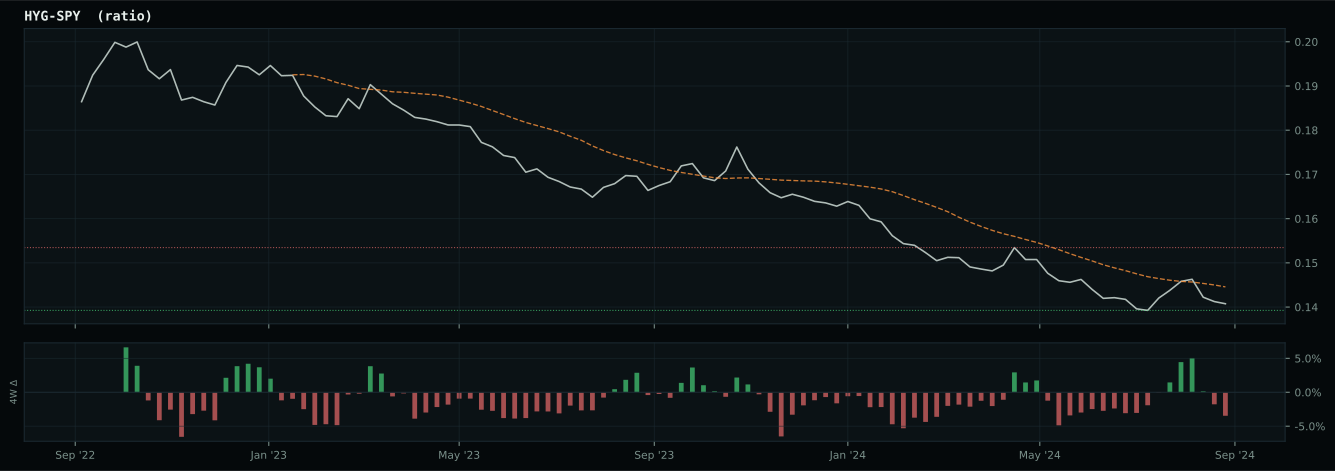
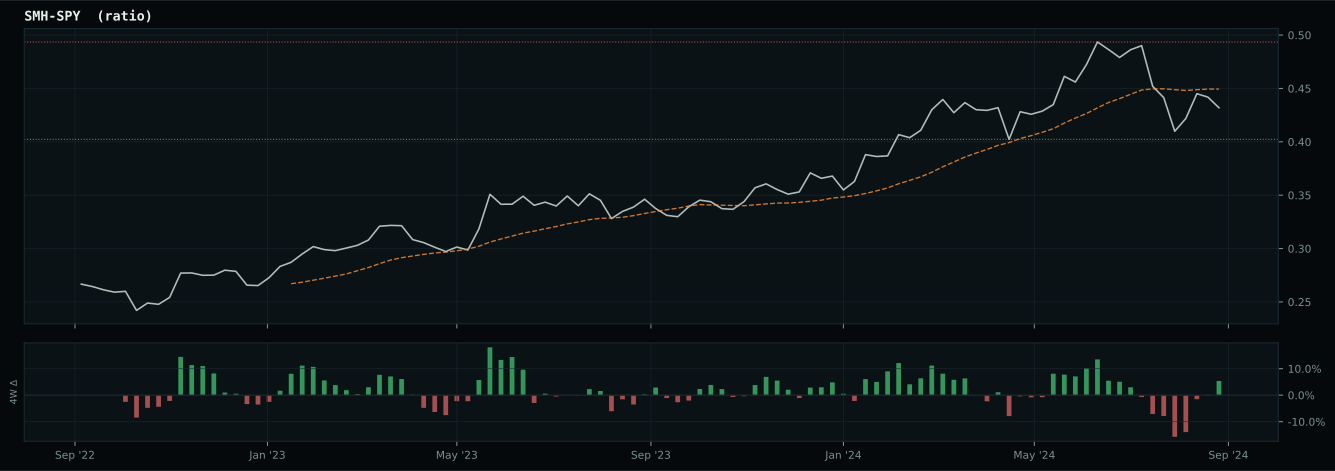
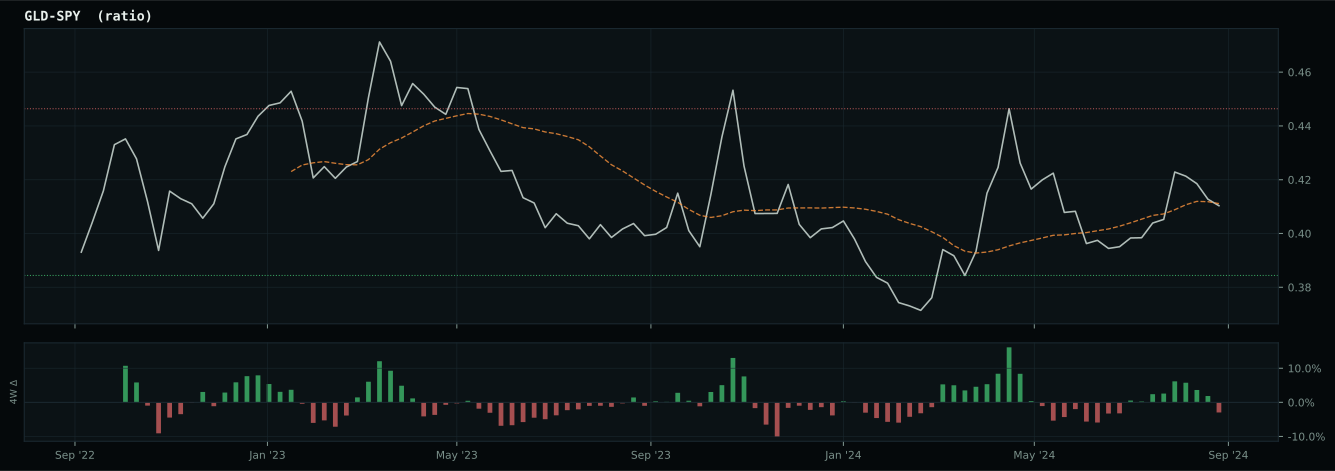
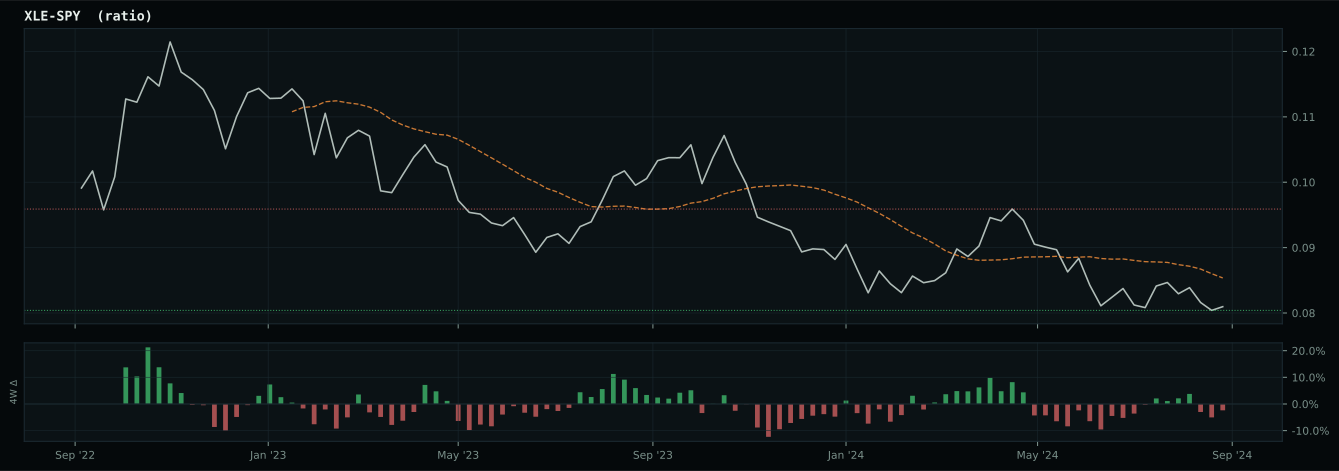
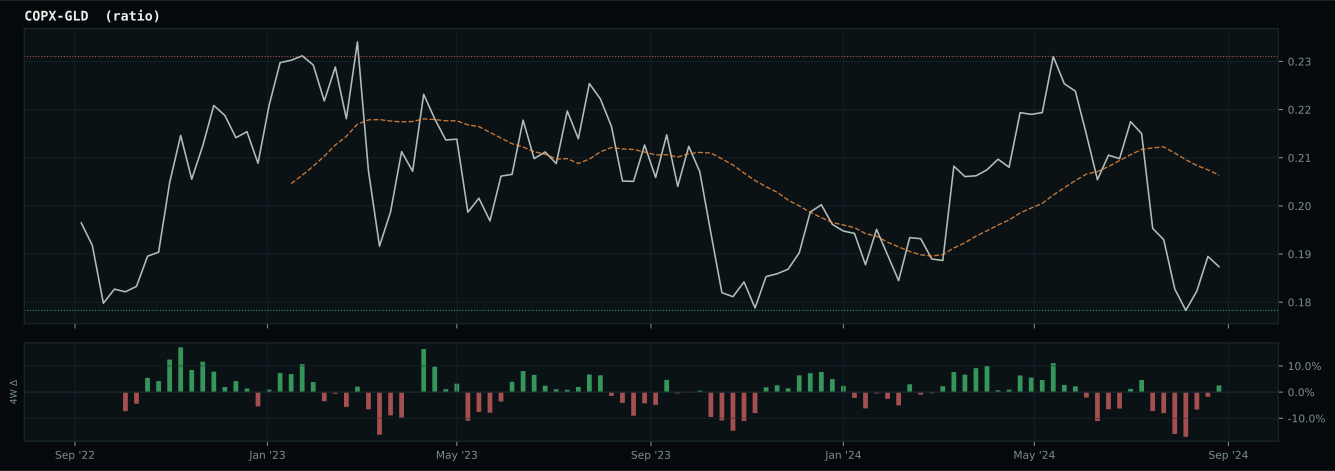
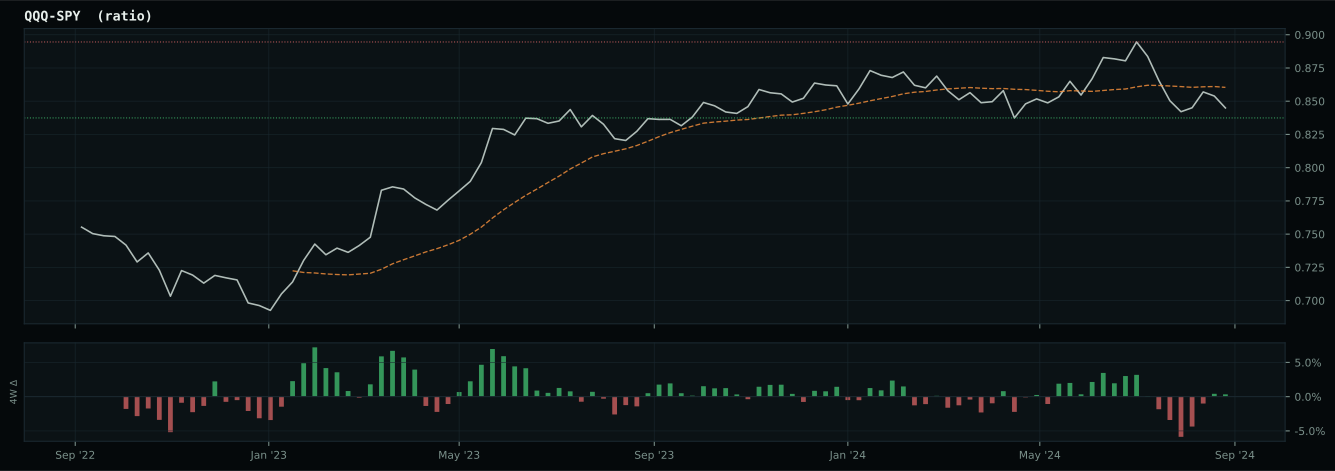
Market-implied signals behind the macro regime scores. Each ratio compares two assets; the direction and slope of the ratio is what the macro engine reads.
Crypto Regime — TrendBTC
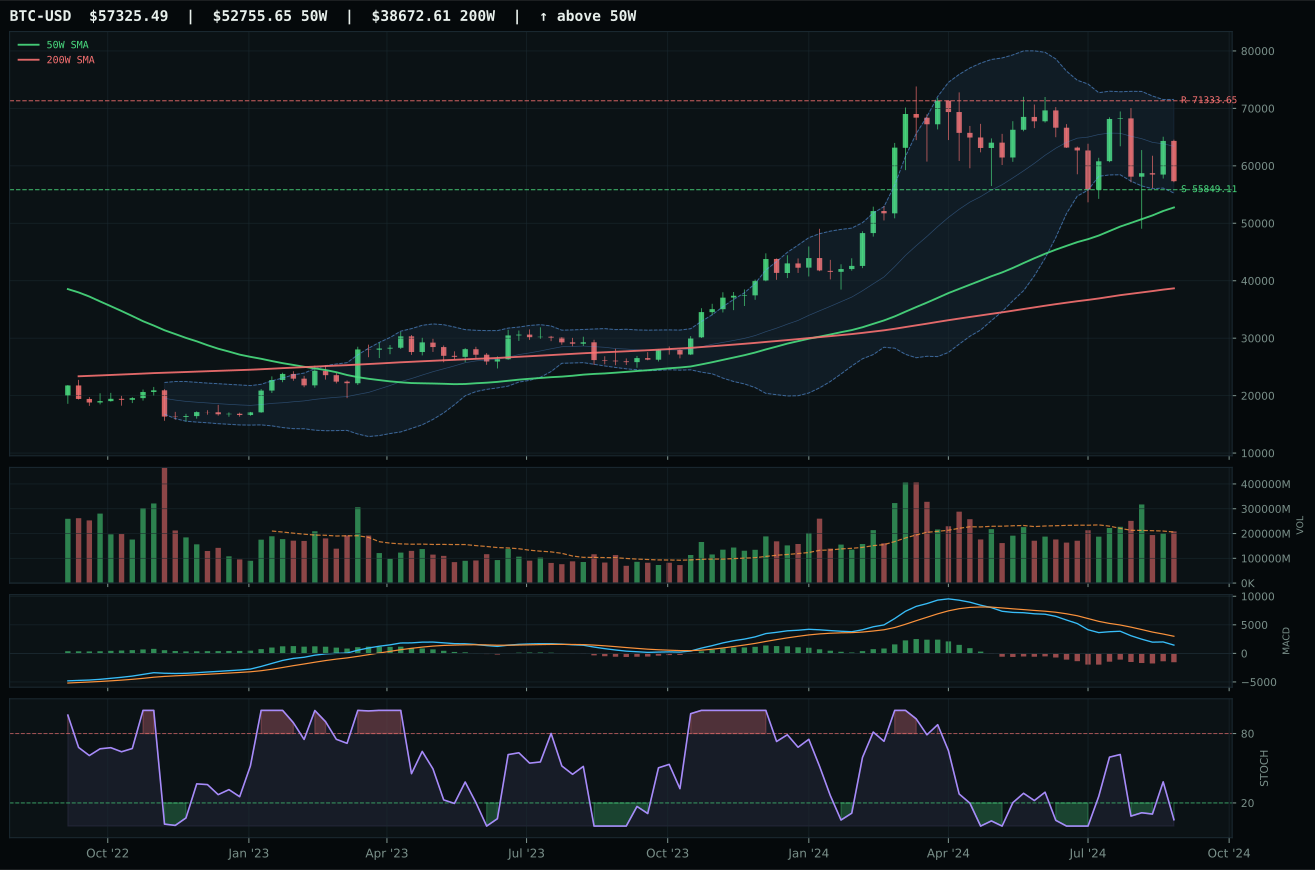
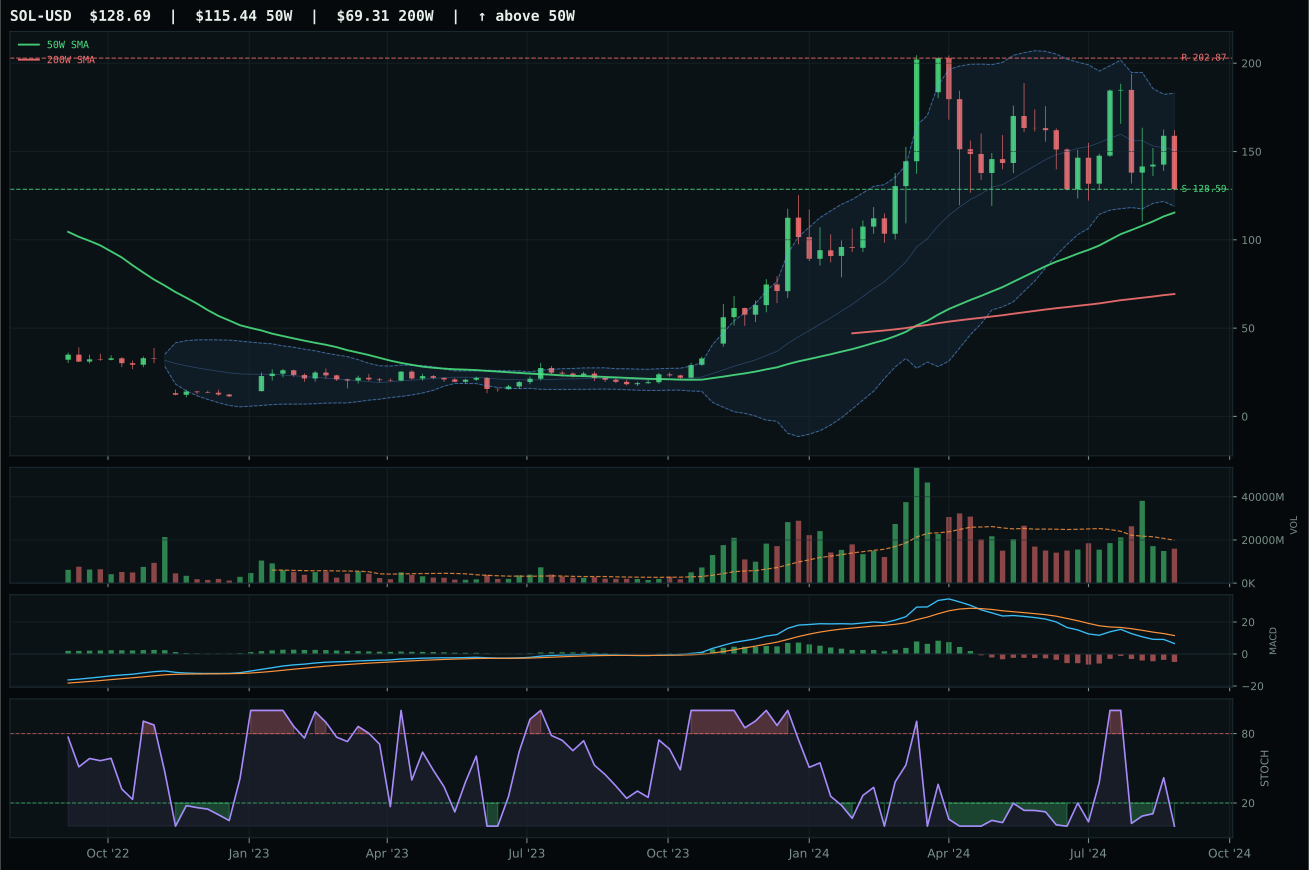
ValueBTC not armed: BTC has not made the first post-breakdown touch of the 200W buy zone after losing the 50W
TrendBTC confirmed: 2 consecutive closes above rising/flat 50W SMA
one or more available conditions failed
Category Rankings
| Rank | Category | Winner | Score | Alloc | 4W Ret | Peers (4W) |
|---|---|---|---|---|---|---|
| 1 | Utilities & Infrastructure | PAVE | 66.1 | 20% | +4.52% | IGF +4.2% · XLU +5.6% |
| 2 | Precious Metals | GLD | 58.0 | 20% | +5.90% | GDX +5.5% · SLV +10.4% |
| 3 | Technology | CIBR | 56.4 | 10% | +0.03% | IGV +2.6% · XLK +2.8% |
| 4 | Defense & Aerospace | XAR | 52.3 | 10% | +1.17% | ITA +1.2% · ROKT +3.5% |
| 5 | AI | SMH | 35.2 | 10% | +2.21% | AIQ +5.6% · BOTZ +2.7% |
| 6 | Nuclear Energy | URA | 26.0 | 10% | +14.70% | NLR +13.4% · URNM +13.3% |
| 7 | Emerging Markets | INDA | 22.4 | 10% | +1.61% | IEMG +7.5% · ILF +1.3% |
| 8 | Traditional Energy | XLE | 7.9 | 10% | -3.07% | FCG -5.3% · XOP -4.8% |
| 9 | Industrial Metals | COPX | 6.6 | 0% | +14.98% | PICK +14.6% · REMX +18.8% |
| 10 | Agriculture & Livestock | MOO | 2.4 | 0% | +3.42% | VEGI +3.5% · WEAT +5.7% |
Utilities & Infrastructure — PAVE
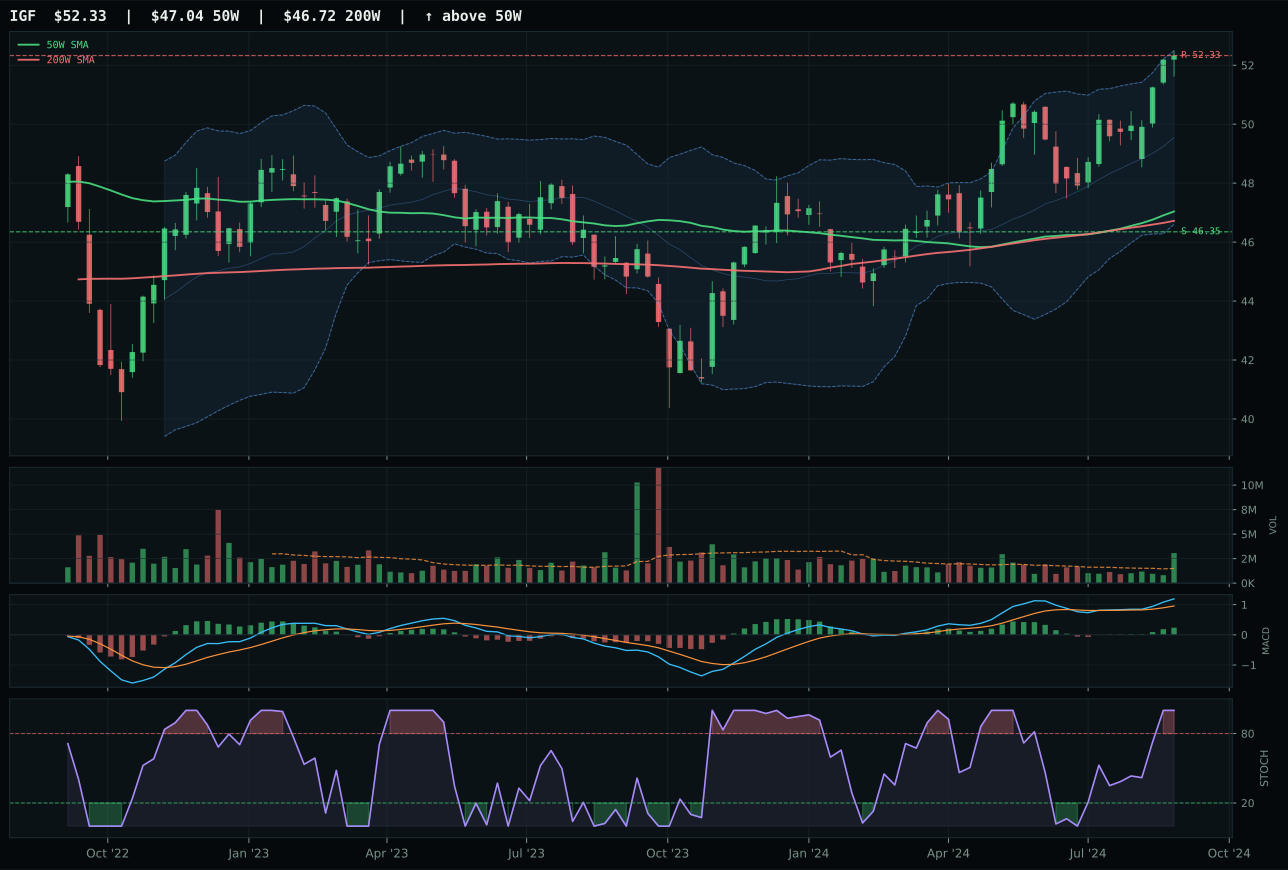
IGF has a neutral structure profile with -3.1% 13-week relative strength versus SPY.
A failed hold above support would weaken the setup.
Actionable but governed by invalidation levels.
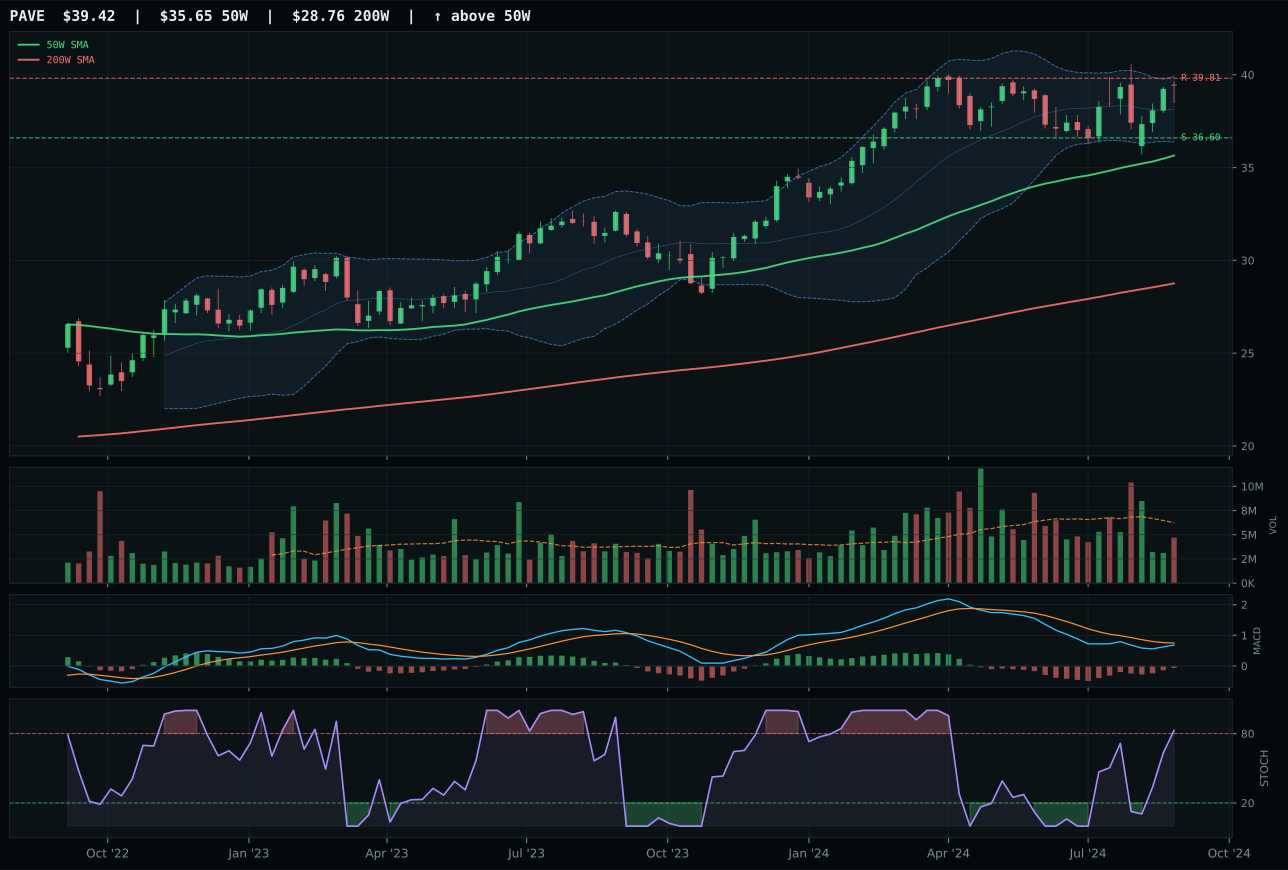
PAVE has a neutral structure profile with -5.0% 13-week relative strength versus SPY.
A failed hold above support would weaken the setup.
Actionable but governed by invalidation levels.
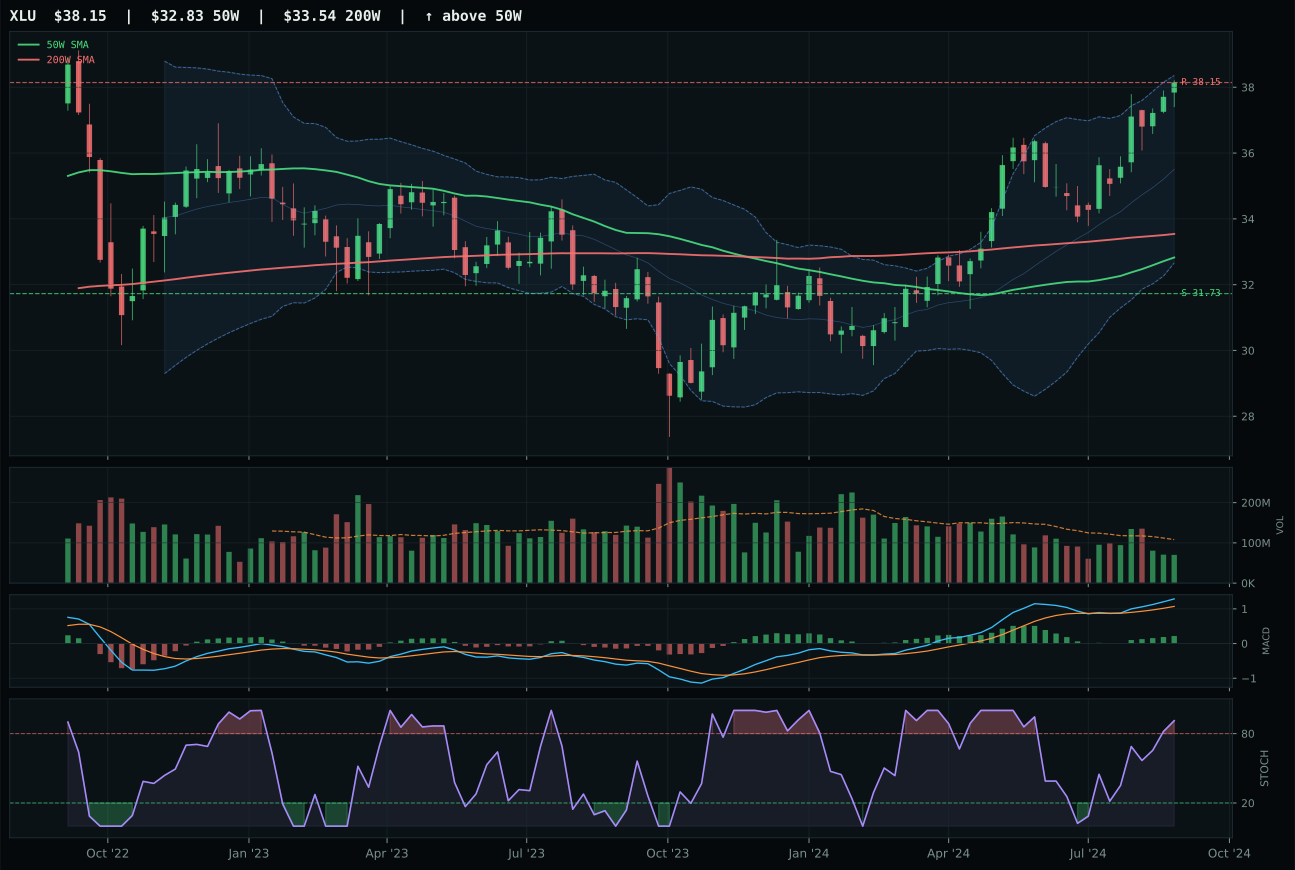
XLU has a vertical extension profile with -2.0% 13-week relative strength versus SPY.
A failed hold above support would weaken the setup.
Actionable but governed by invalidation levels.
PAVE wins the category with a -10.9-point gap versus IGF despite IGF's vastly superior technical evidence (89.8 vs 58.2) and stronger MACD (bullish vs bearish/improving) and volume confirmation (accumulation vs neutral). The decisive factor is that IGF's powerful technicals are not matched by category-relative strength (0.0% vs PAVE's -1.9%), and more critically, IGF's macro fit of 54.0/100 is only marginally better than PAVE's 39.0/100, while disinflation pressure adds 4 points to IGF but disinflation's structural benefit to utilities (the lower-duration, stable-income play) favors the domestic infrastructure angle. PAVE's trend is 85.5/100—clean uptrend, above both moving averages, 0.5% non-deteriorating slope—with structure of 74.0/100, putting it in the conviction zone even though MACD has not yet turned bullish. IGF's strength is real, but PAVE's representation in the category reflects the portfolio's preference for duration-hedge utility exposure over global income alternatives.
Utilities & Infrastructure secures 10% as a top-2 overweight because the category score of 66.1 ranks among the portfolio's highest and the macro case is genuinely constructive. Disinflation helps this exposure by 7 points, disinflation pressure adds 6 more, and the transition regime (+4) provides additional support—this category is a direct hedge against falling real rates and inflation-driven volatility. Category-level macro fit is 64.0/100, paired with a respectable 62% weight on technical evidence, creating conviction in both directions. PAVE's 58.2/100 technical evidence and 39.0/100 macro fit combine to a 51.9/100 momentum-confirmation score that lags ideal, but the trend structure (85.5/100) and risk/reward (39.3/100) are solid enough to justify equal weighting with precious metals. The portfolio is positioning for a falling-rate environment where long-duration utilities and infrastructure income are optimal allocation anchors. Risk is asymmetric: if disinflation accelerates and rates fall sharply, PAVE extends higher; if inflation re-accelerates suddenly, this position underperforms but is held as macro insurance rather than a return driver.
Precious Metals — GLD
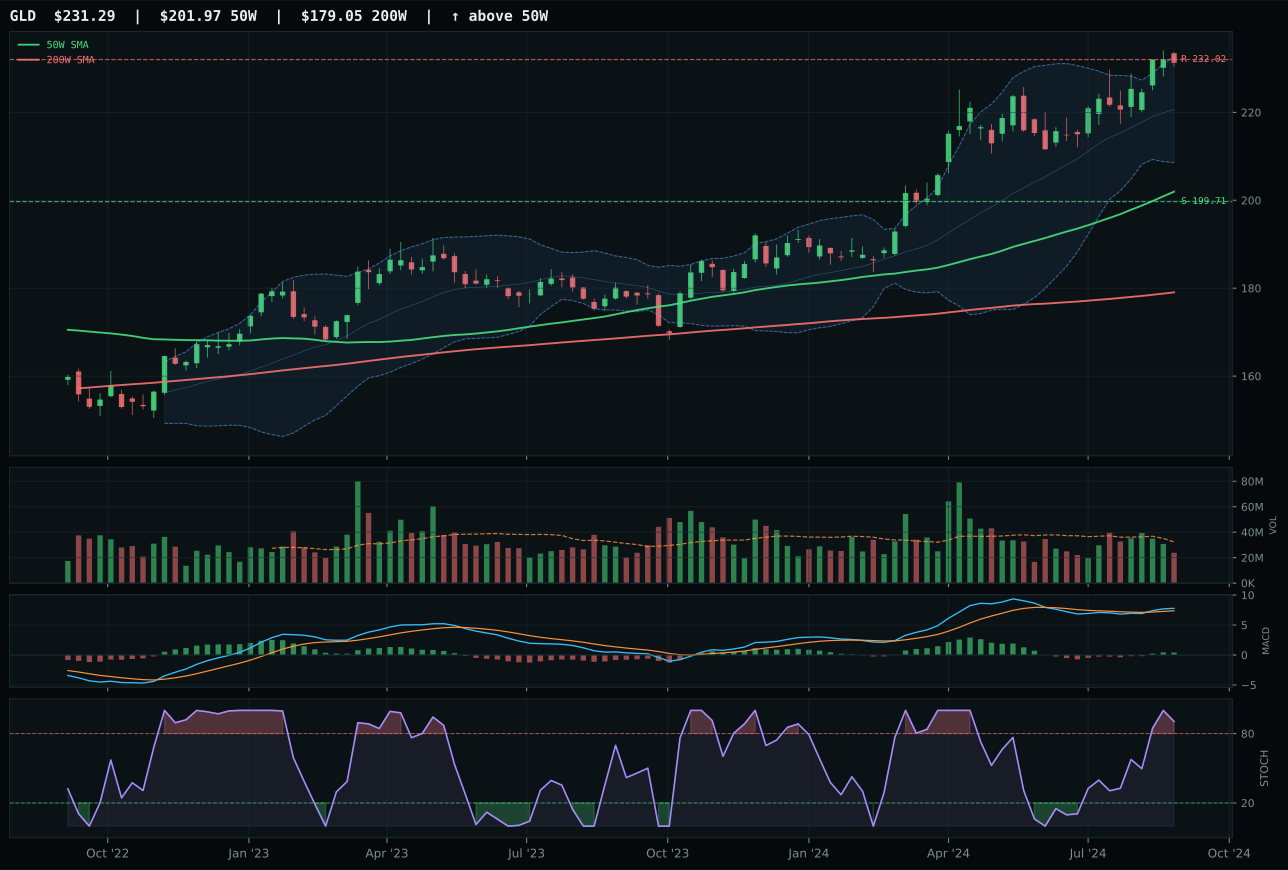
GLD has a neutral structure profile with 0.5% 13-week relative strength versus SPY.
A failed hold above support would weaken the setup.
Actionable but governed by invalidation levels.
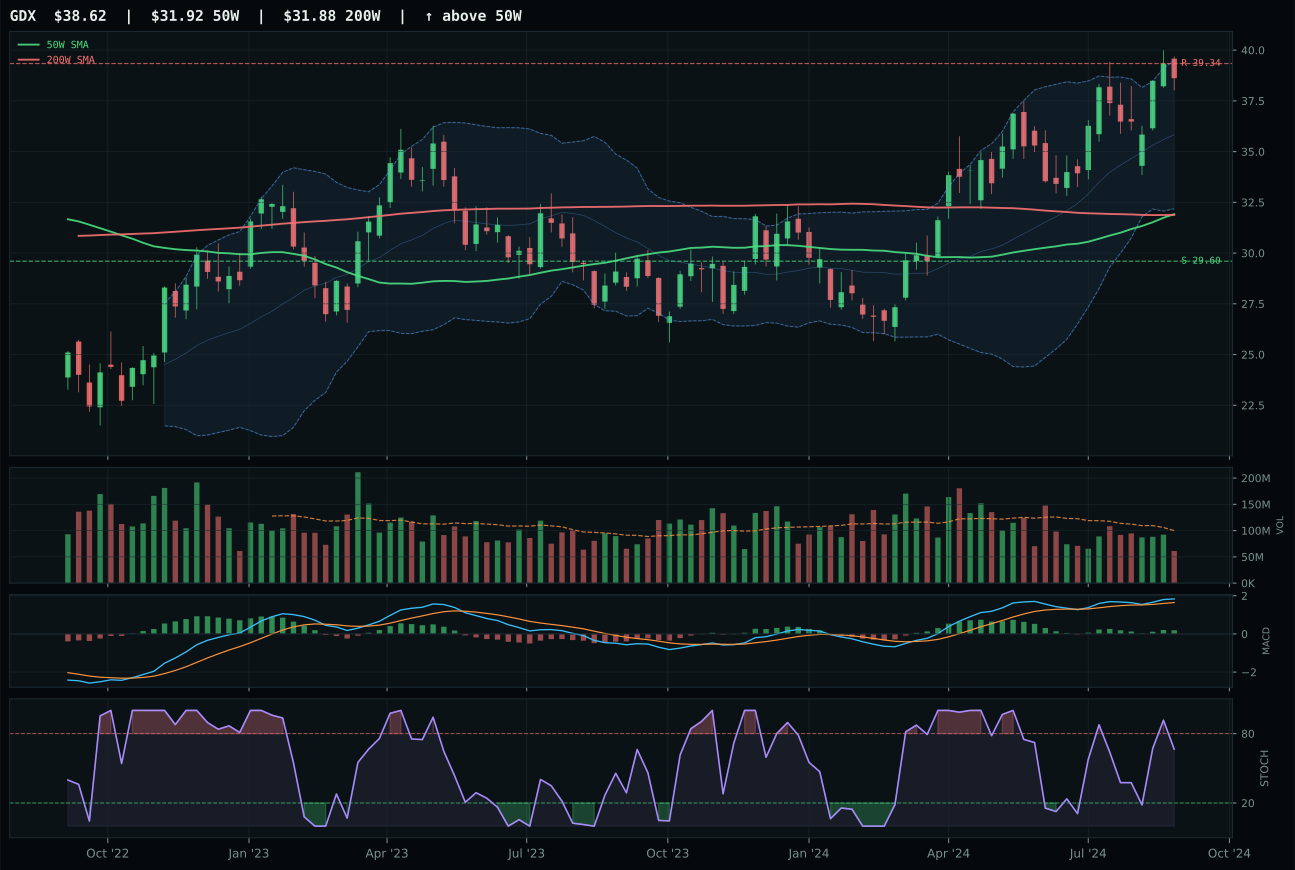
GDX has a vertical extension profile with 2.5% 13-week relative strength versus SPY.
A failed hold above support would weaken the setup.
Actionable but governed by invalidation levels.
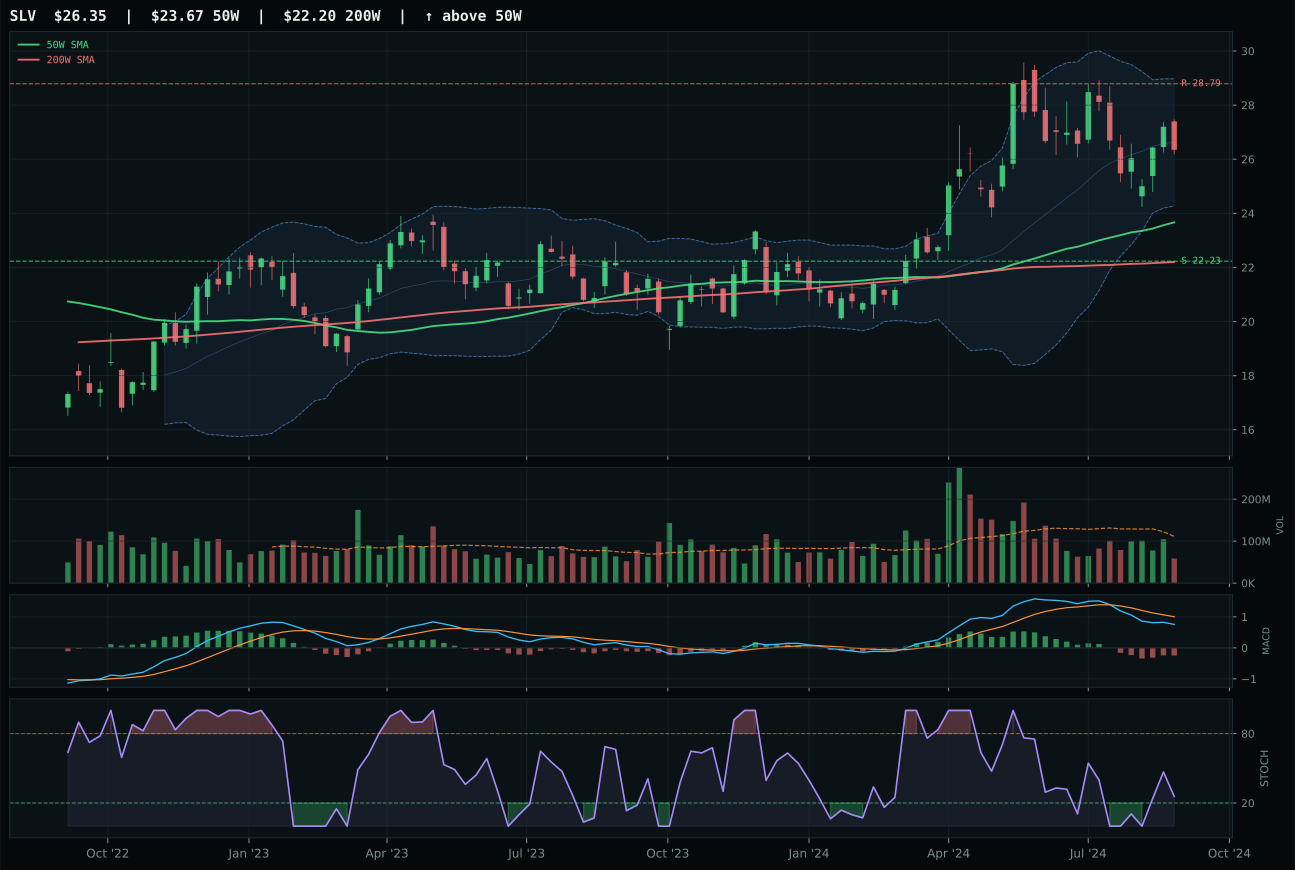
SLV has a neutral structure profile with -12.0% 13-week relative strength versus SPY.
A failed hold above support would weaken the setup.
Actionable but governed by invalidation levels.
GLD wins with a 5.8-point gap over GDX because it offers the safest pathway to monetary hedge exposure in a clean, liquid vehicle. Price is 14.5% above the 50W with a perfect 0.5% slope—exactly at the extension threshold where new money should slow—and MACD is bullish and improving with stochastic RSI overbought at 0.90, suggesting buyers are still active despite the stretch. The category-relative strength of 0.0% versus the median means GLD is not leading peers, but its 0.5% SPY-relative return speaks to genuine de-correlation rather than lag. GDX lost because it is extended 21.0% above the 50W, creating timing risk (53.0 vs 59.0 score), and its stochastic RSI is only rising mid-zone rather than overbought, suggesting the leveraged miner thesis has less sponsorship. Gold itself is the cleaner monetary hedge when the macro case (disinflation, potential flight-to-safety) drives demand; miners require additional operational leverage that GDX's thin volume participation (0.74x average) is not confirming.
Precious Metals secures 10% as a top-2 overweight because disinflation is the dominant macro theme and gold is its explicit beneficiary. The category score of 58.0 reflects strong technical evidence (74.6/100 for GLD) supported by powerful macro fit (64.0/100 category-level, with disinflation adding 8 points and disinflation pressure adding 6). This is genuine conviction: falling real rates lift gold valuations, credit stress encourages safe havens (+2), and liquidity stress, though it subtracts 3, is more than offset by the structural shift toward deflation hedging. GLD's neutral setup—not extended, not broken—allows the macro thesis to carry full weight without fighting technical resistance, a rare alignment. The 10% allocation weights precious metals equally with utilities as the two macro tailwinds available in this regime; both hedge duration risk in a falling-rate environment and both have technical merit. Risk to this positioning: a surprise reacceleration of inflation or a credit shock that forces liquidation of all risk assets would flatten gold gains despite macro support.
Technology — CIBR
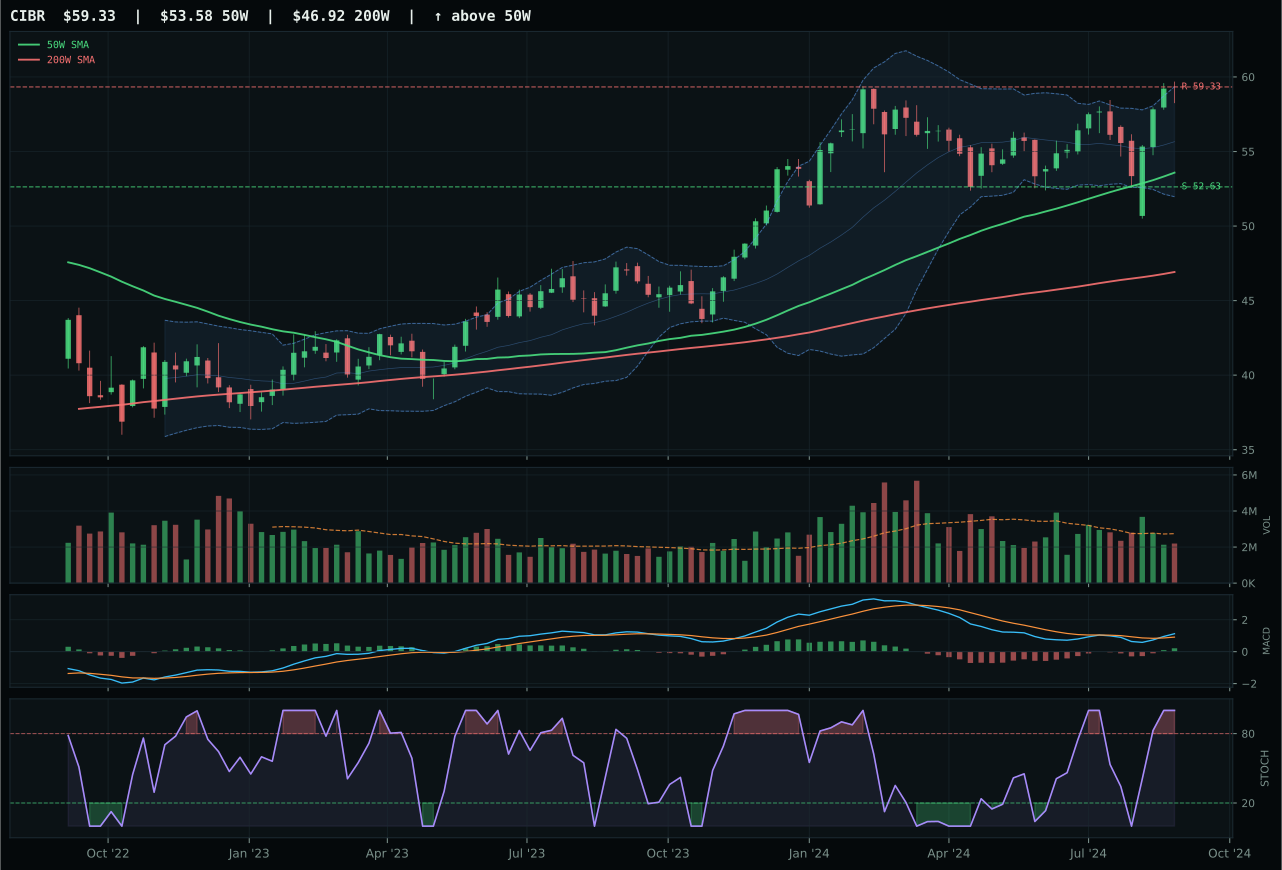
CIBR has a neutral structure profile with 4.3% 13-week relative strength versus SPY.
A failed hold above support would weaken the setup.
Actionable but governed by invalidation levels.
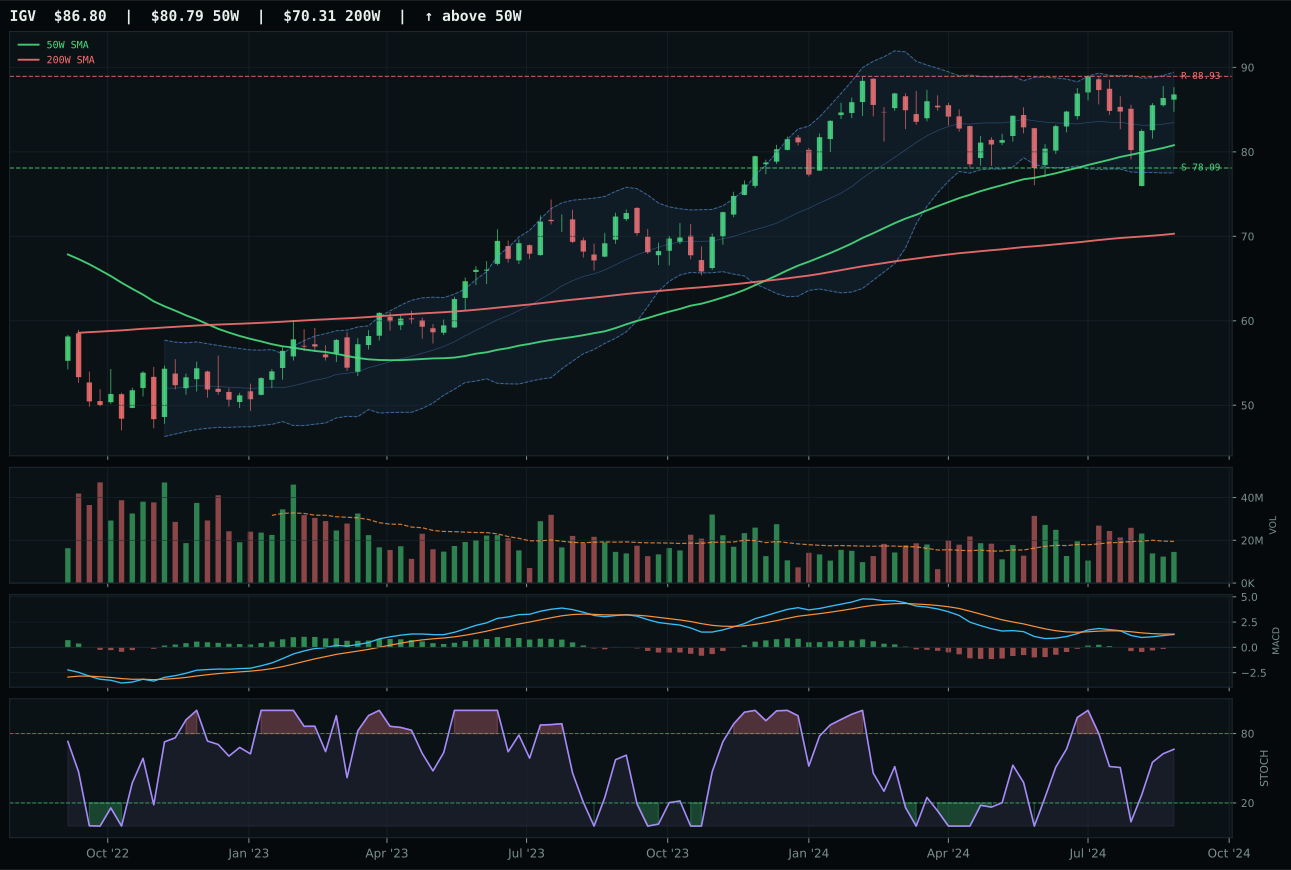
IGV has a neutral structure profile with 4.3% 13-week relative strength versus SPY.
A failed hold above support would weaken the setup.
Actionable but governed by invalidation levels.
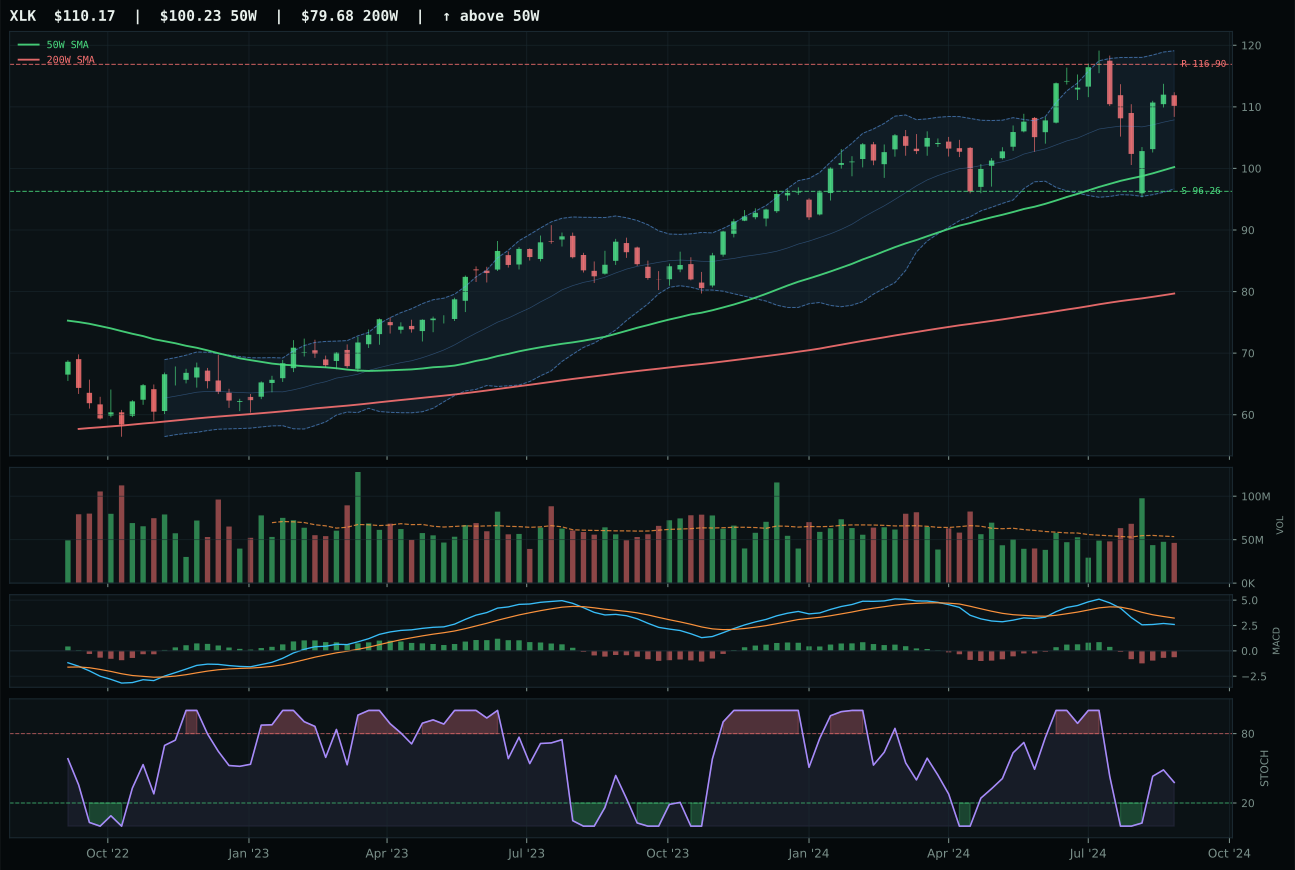
XLK has a neutral structure profile with -2.0% 13-week relative strength versus SPY.
A failed hold above support would weaken the setup.
Actionable but governed by invalidation levels.
CIBR wins the category with a score gap of 3.8 points over IGV because it delivers the cleanest combination of bullish momentum confirmation and relative strength inside the basket. Price sits just 10.7% above the 50W with a non-deteriorating 0.5% slope, MACD is bullish and improving, and stochastic RSI is overbought at 1.00—all signals that accumulation is active rather than bouncing. The 13W return of 11.2% matches the 4W return exactly, suggesting sustained buying rather than a one-week spike, and the 0.1% category-relative strength edge over the median, though modest, was enough to tip the scales when combined with superior structure cleanliness (75.0 vs 74.1) and risk/reward (48.3 vs 40.9). IGV fell short because its MACD is merely bearish but improving—not yet bullish—while volume confirmation was thinner, and it generated zero category-relative outperformance despite matching CIBR's SPY-relative return.
Technology ranks outside the top tier at 5% allocation, meaning it lost out to two higher-scoring categories in this disinflation regime. The category's 56.4 score reflects heavy macro headwinds: liquidity stress costs it 4 points at the descriptor level, while credit stress subtracts another 7, and disinflation pressure—the dominant macro condition this week—adds only 5 in return. CIBR's 71.8 reasoned technical evidence score (82.6/100 technical, 48.0/100 macro fit) is solid on its own terms, but the category-level macro fit of 45.0/100 drags down the overall positioning. The tension here is real: price action is clean and momentum is confirming, yet the macro regime punishes technology's duration-sensitive profile and the active credit and liquidity constraints limit how much capital should chase this setup despite near-term technicals. A sustained improvement in credit conditions or a surprise shift toward reflation would be required to move this category into top-2 weighting.
Defense & Aerospace — XAR
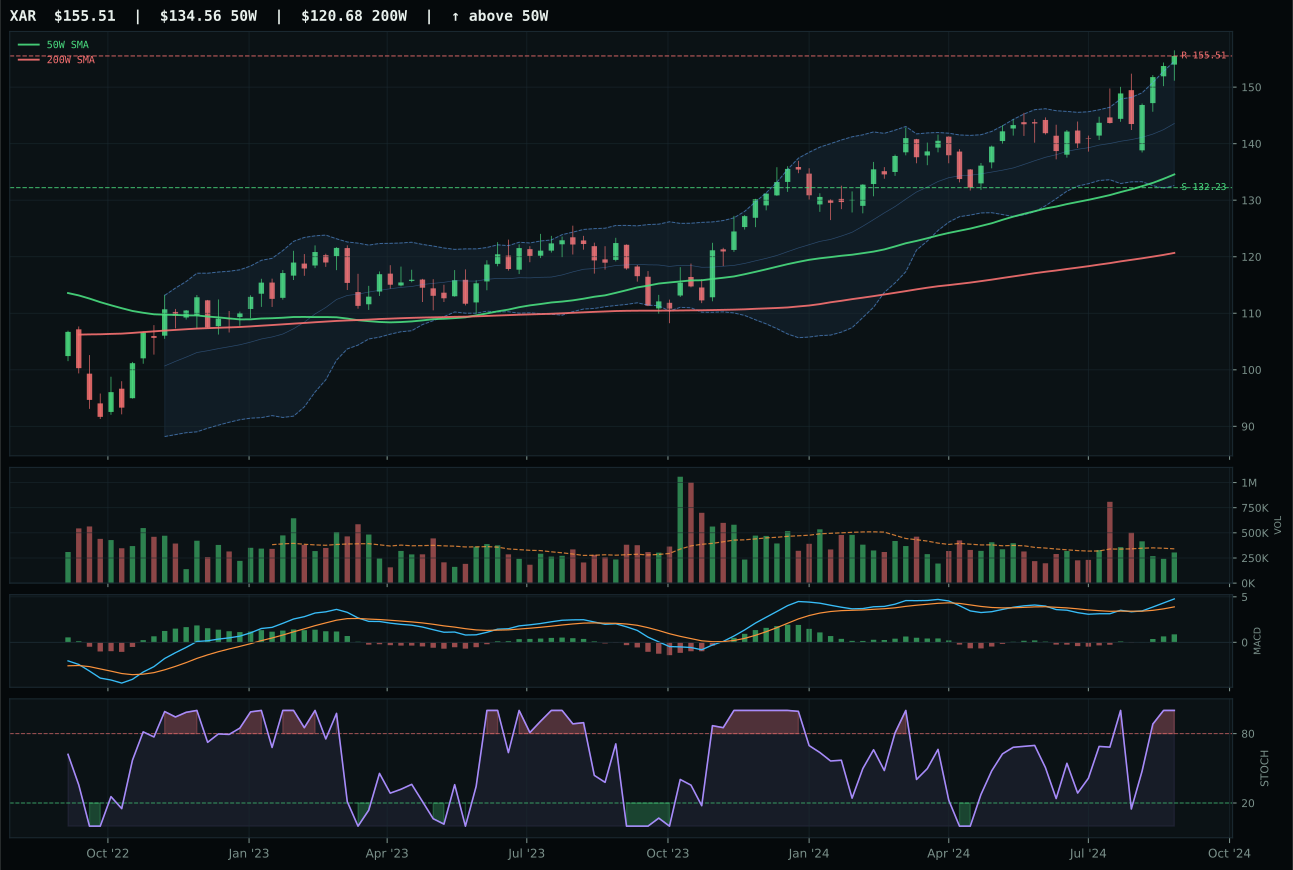
XAR has a vertical extension profile with 1.4% 13-week relative strength versus SPY.
A failed hold above support would weaken the setup.
Actionable but governed by invalidation levels.
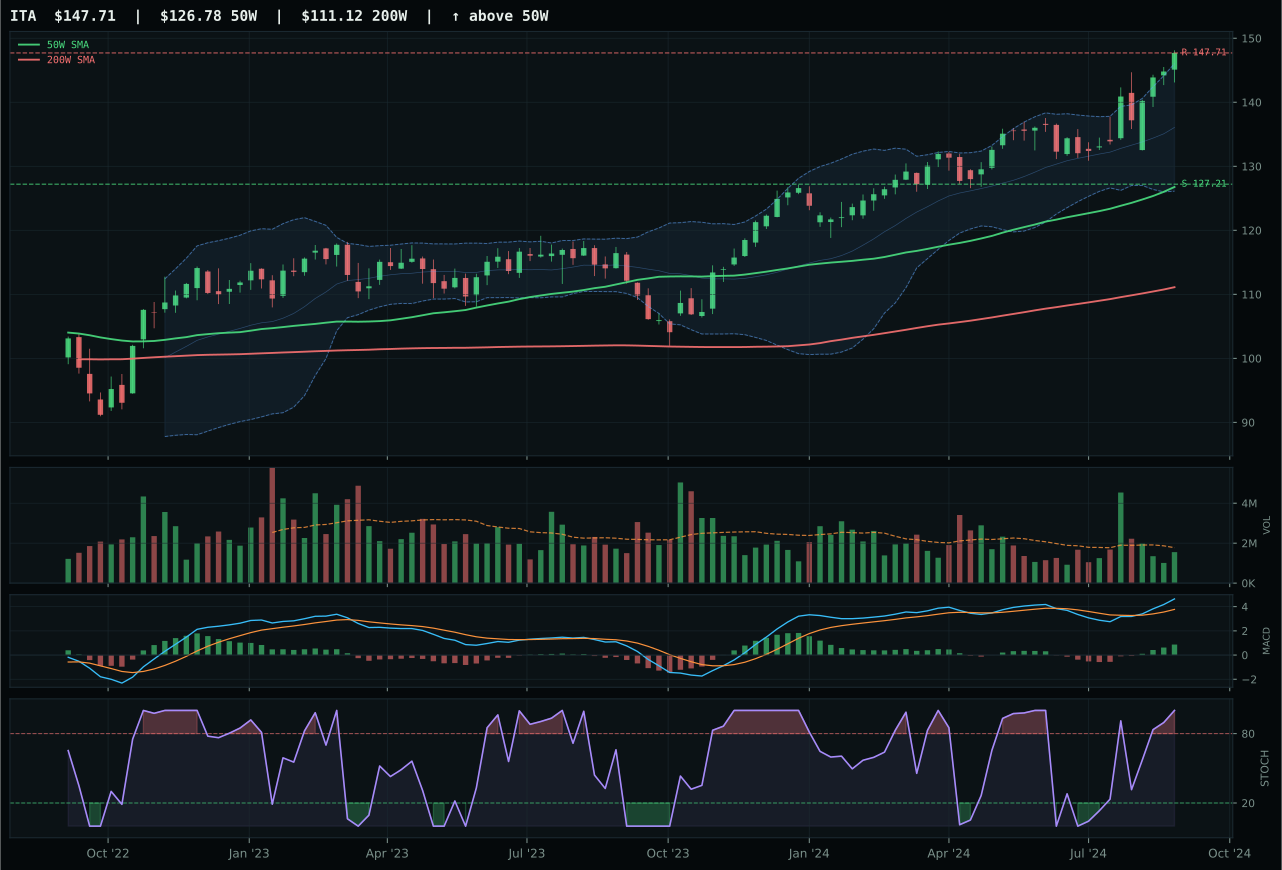
ITA has a vertical extension profile with 1.7% 13-week relative strength versus SPY.
A failed hold above support would weaken the setup.
Actionable but governed by invalidation levels.
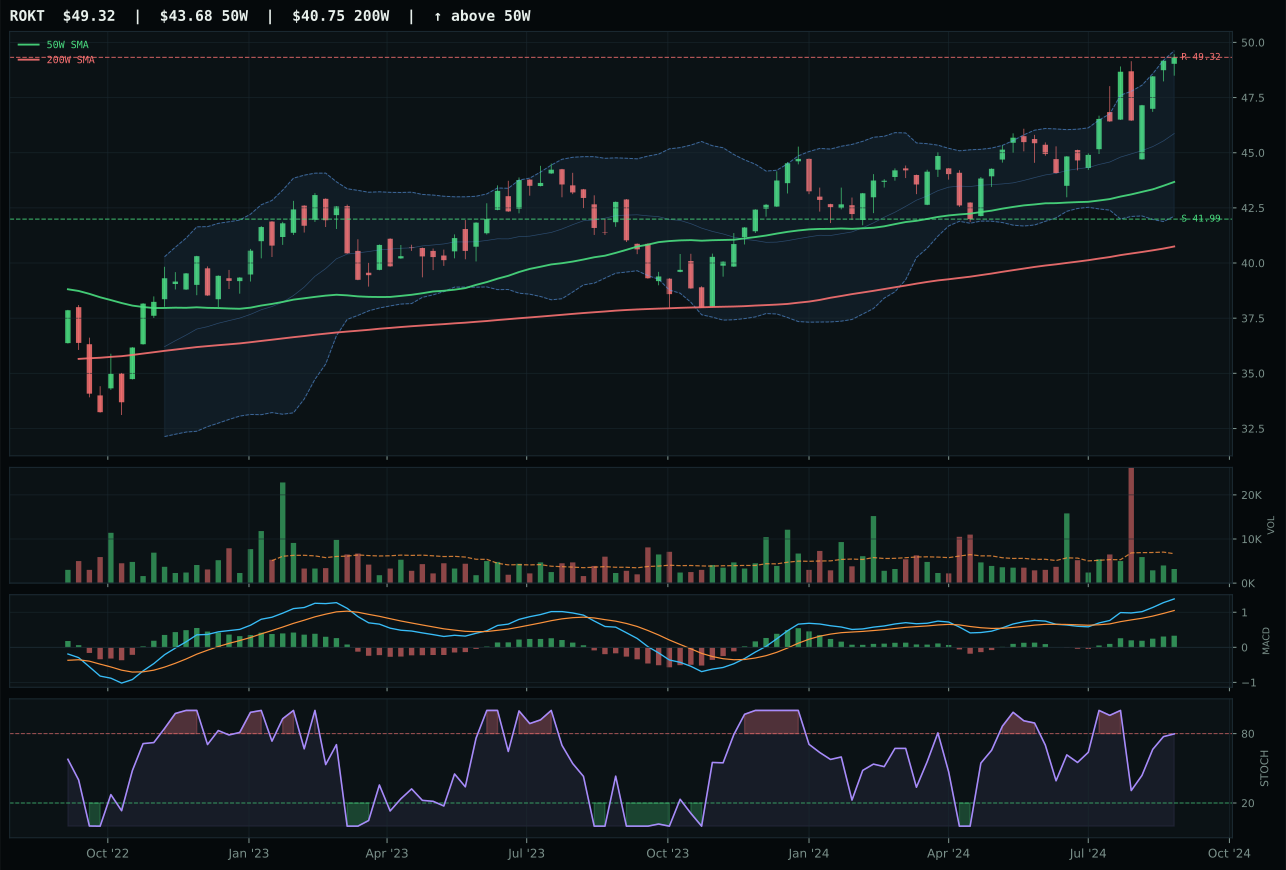
ROKT has a neutral structure profile with 1.7% 13-week relative strength versus SPY.
A failed hold above support would weaken the setup.
Tracked, but not top-2 eligible because: .
XAR and ITA have nearly identical technical evidence scores (67.8 vs 68.4) and are functionally equivalent in trend, setup, MACD, and momentum, yet XAR wins by the narrowest margin because it achieved slightly better blended execution across trend, structure, timing, and risk/reward. Both are extended 15.6% to 17% above their 50W, both are overbought on stochastic RSI at 1.00, and both carry neutral volume; the deciding factor was XAR's marginally tighter structure (77.2 vs 76.8) and superior category-relative strength at -0.2% versus ITA's 0.0%, a difference of rounding-level magnitude. This is functionally a coin flip between two competent executions, and the decision serves to demonstrate that category representativeness is driven by the 3/2/1 weighted basket—COPX at 44.8 brings down the category average and prevents either XAR or ITA from reaching escape velocity on conviction.
Defense & Aerospace earns 5% in tier-2 despite a 52.3 category score that ranks respectable on the surface, but the allocation reflects macro regime constraints, not technical merit. The category's macro fit is 51.0/100, neutral at best, because no category-specific macro descriptors favor or penalize defense equipment in a disinflation transition. Credit stress adds 2 points (a rare positive for this category), but liquidity stress costs 4, resulting in a muted macro contribution. XAR's setup is textbook bullish—price above both moving averages, MACD improving, overbought momentum—but that strength is being earned in an extended position 15.6% above the 50W, which means risk/reward is 45.2/100 and upside to resistance is nearly flat at 0.0%. The 5% slot acknowledges that defense has inherent stability and the technicals remain intact, but a rate-cutting cycle that lifts growth sectors, or deteriorating credit conditions that emphasize flight-to-safety, would be required to justify moving this to top-2 weighting.
AI — SMH
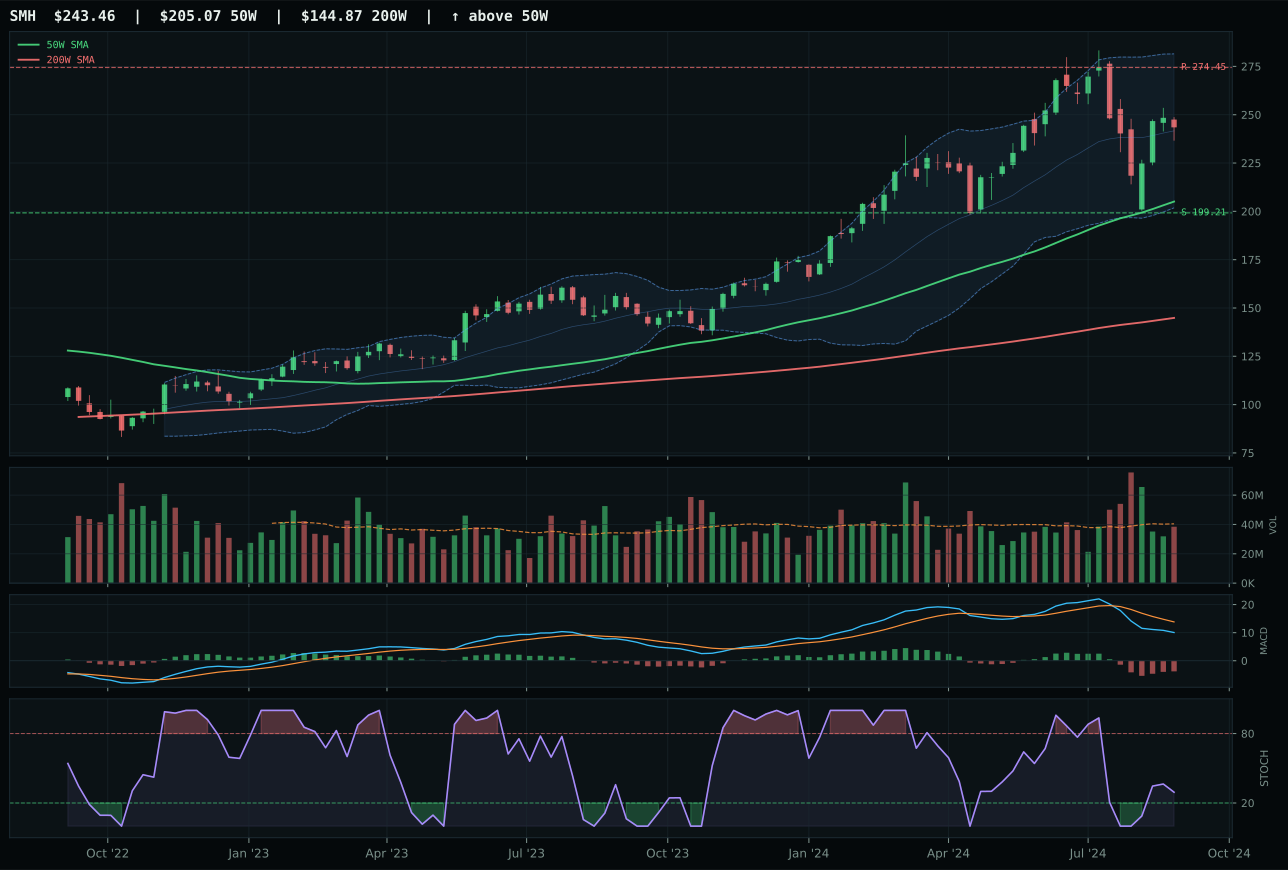
SMH has a vertical extension profile with -5.6% 13-week relative strength versus SPY.
A failed hold above support would weaken the setup.
Actionable but governed by invalidation levels.
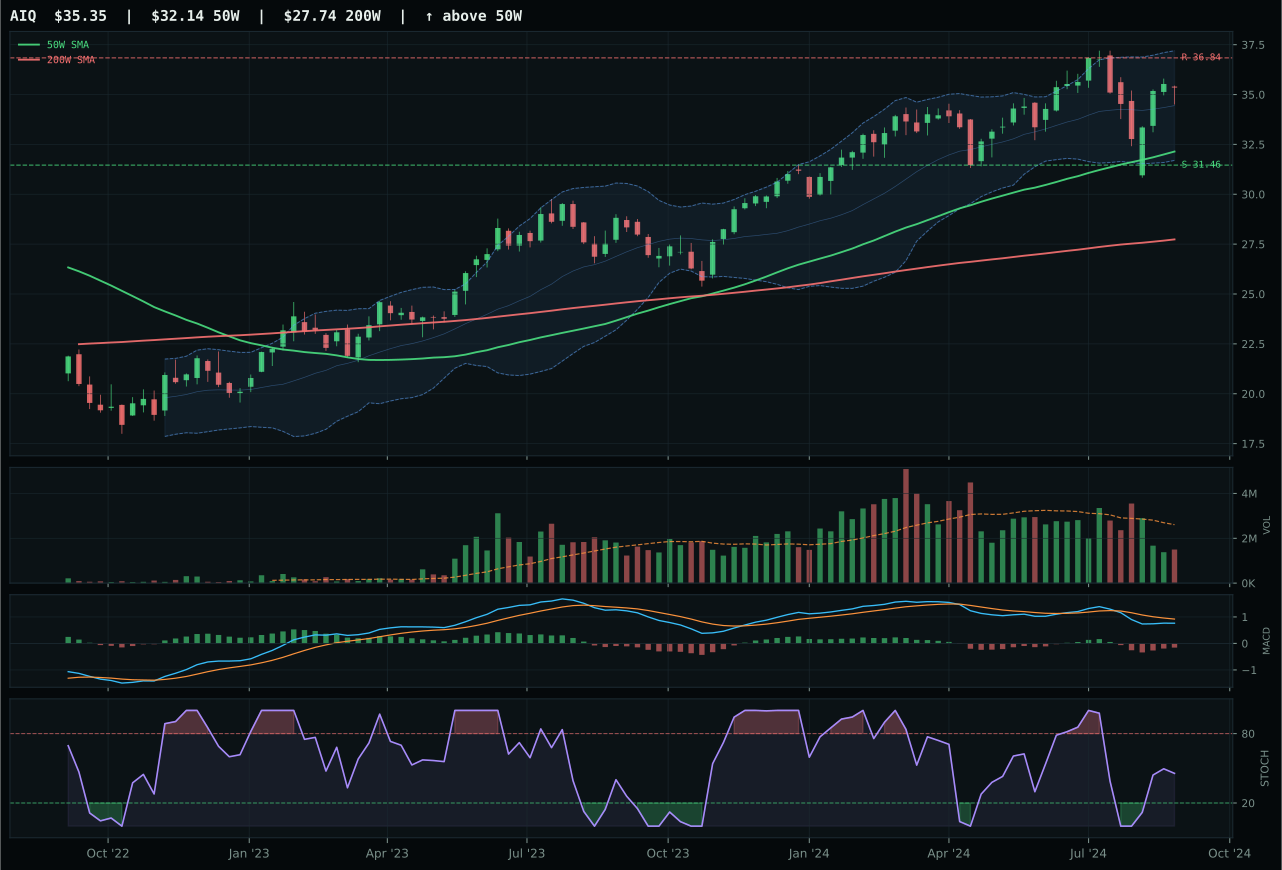
AIQ has a neutral structure profile with -0.9% 13-week relative strength versus SPY.
A failed hold above support would weaken the setup.
Actionable but governed by invalidation levels.
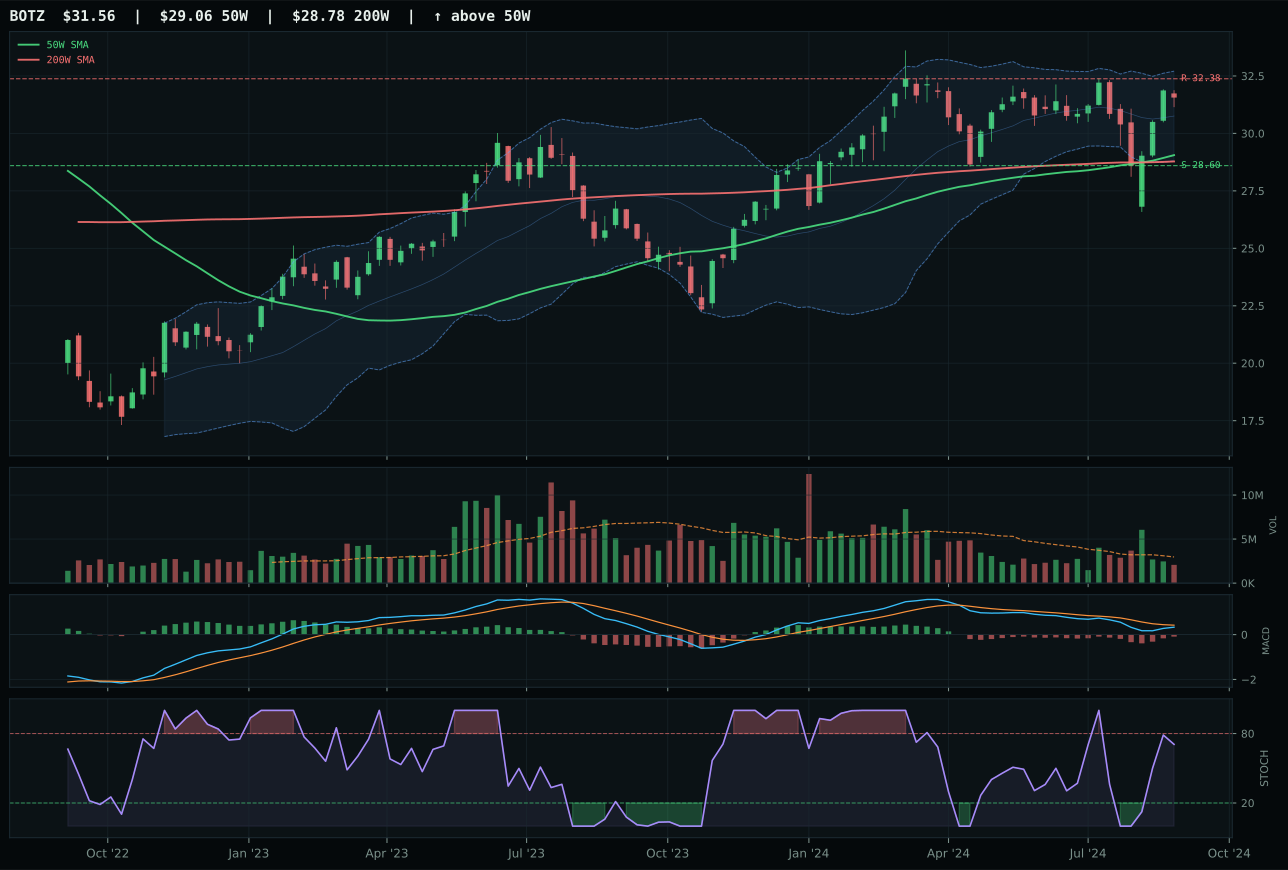
BOTZ has a neutral structure profile with -4.4% 13-week relative strength versus SPY.
A failed hold above support would weaken the setup.
Actionable but governed by invalidation levels.
SMH wins despite scoring lower than AIQ (54.3 vs 63.7 technical evidence) because volume confirmation proved decisive: SMH carries neutral participation at 0.95x average while AIQ is thin, and in a category already hobbled by poor momentum and macro fit, that participation difference prevented AIQ from translating its stronger trend reading into a win. Price is extended 18.7% above the 50W, which mechanically penalizes the risk/reward score (39.1/100), but MACD is bearish but improving and stochastic RSI is rising mid-zone, telling a story of potential bottoming rather than momentum exhaustion. The 1.2% 13W return is weak against a 4W return of 11.5%, revealing that this category has decelerated sharply, and the -5.6% RS versus SPY signals clear underperformance of the chip/AI compute thesis in a disinflation environment. AIQ's superior technical score reflects better trend quality and a neutral structure, yet that advantage collapsed against thin volume action—the market is not actively accumulating AI software on this pullback.
AI earns 5% allocation in tier-2, well below top-2 contention, because the category score of 35.2 reflects a toxic blend of weak technicals and hostile macro. Liquidity stress penalizes this category by 12 points; credit stress by another 8. The reasoning ETF order is AIQ 54.9, BOTZ 51.2, SMH 48.4—a narrow spread with SMH winning the representative slot only on volume quality, not conviction. Category-level macro fit is 35.0/100, and disinflation helps by only 5 points, a pittance against the 20-point drag from liquidity and credit constraints. The real problem: AI is long-duration, margin-dependent growth whose valuations compress in a credit-tight, disinflation environment. This position exists because some technical merit remains and because sector concentration in the portfolio needs to be managed, but do not mistake 5% as a conviction call. Substantial improvement in credit stress or volume participation into price would be needed to justify a top-2 position.
Nuclear Energy — URA
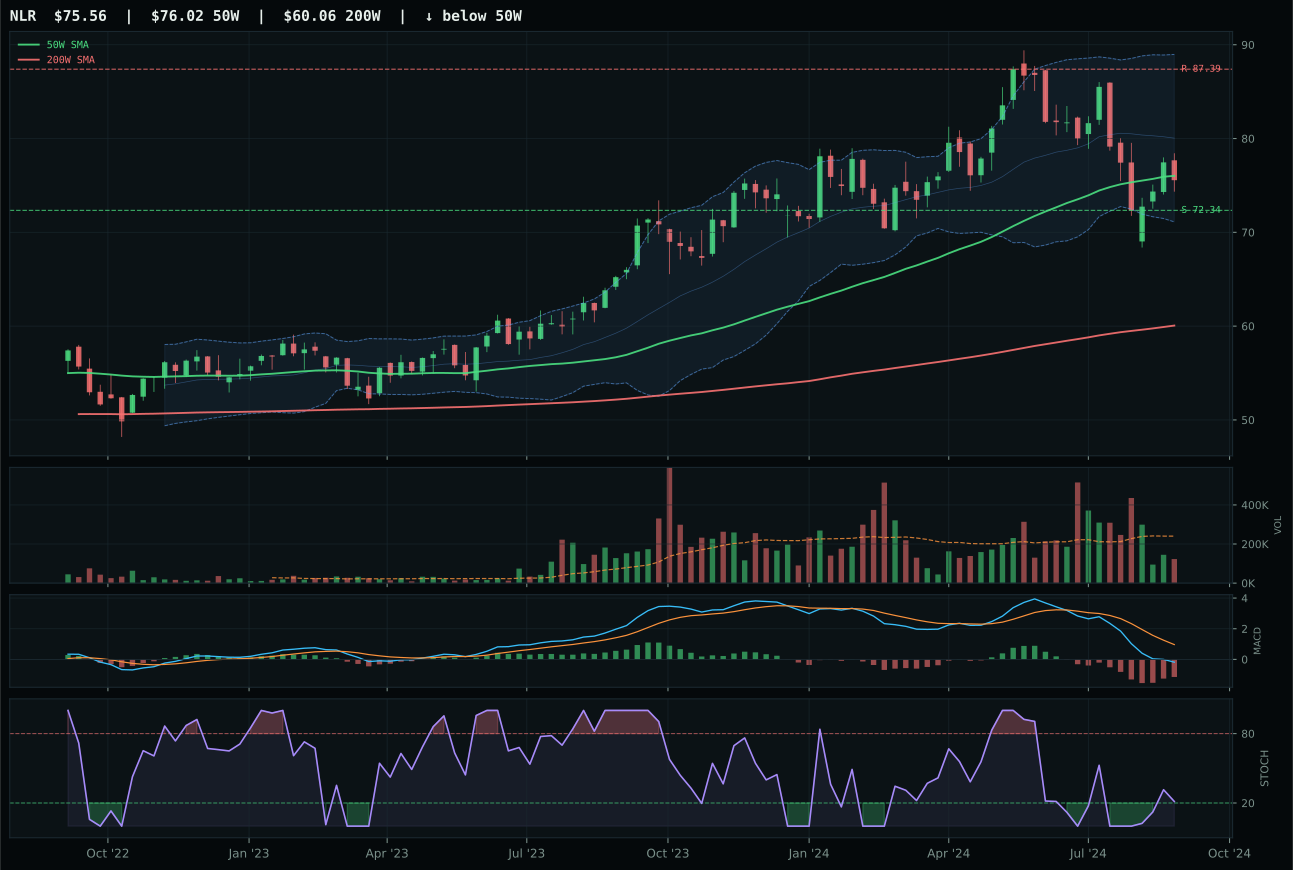
NLR has a pullback into support profile with -19.8% 13-week relative strength versus SPY.
A failed hold above support would weaken the setup.
Actionable but governed by invalidation levels.
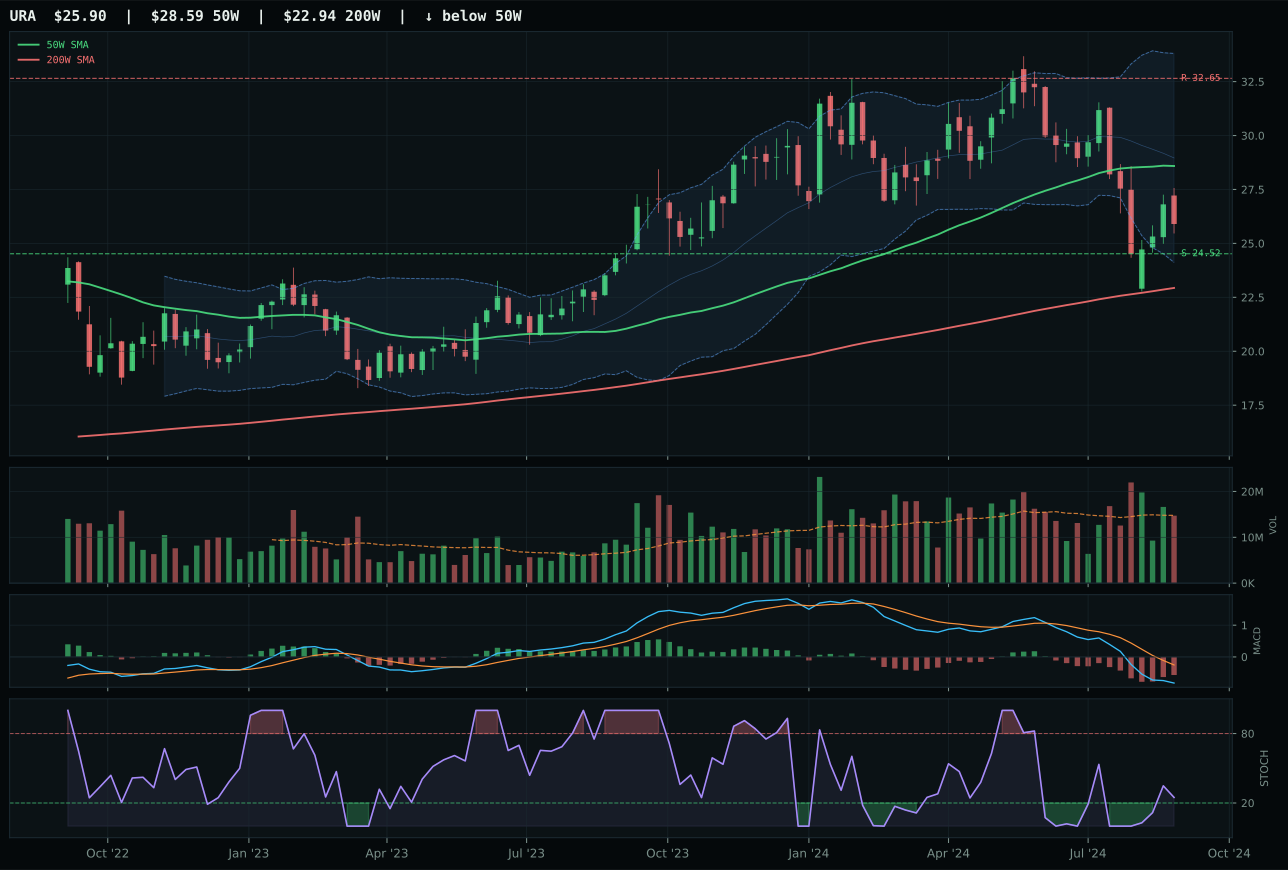
URA has a neutral structure profile with -26.6% 13-week relative strength versus SPY.
A failed hold above support would weaken the setup.
Actionable but governed by invalidation levels.
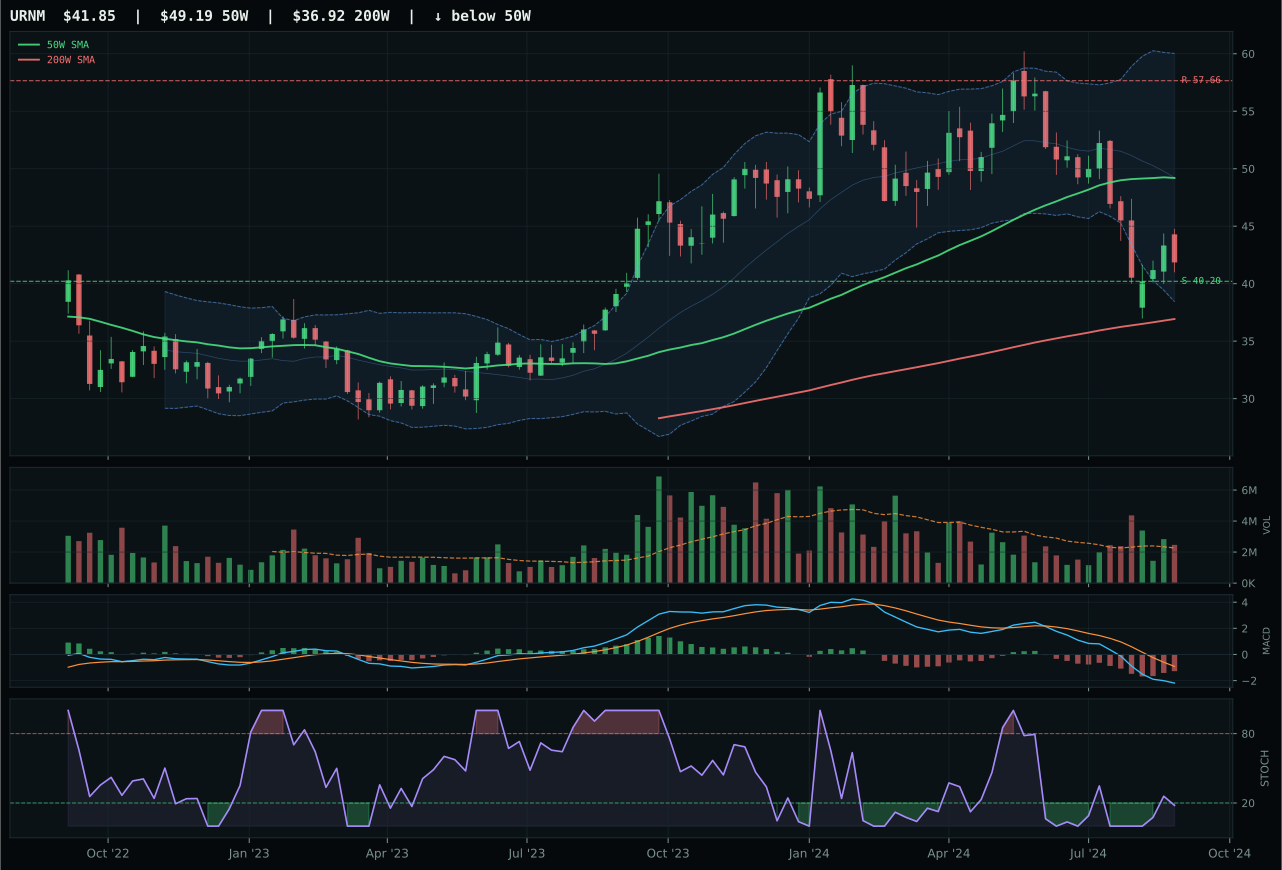
URNM has a pullback into support profile with -32.9% 13-week relative strength versus SPY.
A failed hold above support would weaken the setup.
Actionable but governed by invalidation levels.
URA wins the category despite a -17.1-point score gap versus NLR, the second-ranked ETF, because volume confirmation (neutral at 1.00x average versus thin participation for NLR) and slightly cleaner structure (67.0 vs 65.5) proved decisive in an otherwise weak category. Both are beaten down—URA at -19.7% over 13W and NLR at -12.9%—and both sit in Fibonacci value zones ready for reversal if structural support holds. URA trades 9.4% below the 50W with a -0.1% slope and rising mid-zone stochastic RSI, setting up a potential mean reversion, but the 0.0% momentum confirmation score reveals that both 4W and 13W returns are near-flat to negative, meaning this is purely a technical value setup with no forward momentum. The 50.1 technical evidence score for NLR is not sufficient to overcome URA's cleaner structure and superior volume action.
Nuclear Energy earns 5% in tier-2, ranking among the weaker categories, because the macro case is neutral (38.0/100 fit) and technicals are in reset mode rather than confirmation. URA's 45.1/100 technical evidence reflects a beaten-down setup with good timing (90/100 from deep Fib retracement and rising stochastic) but zero momentum confirmation (0.0/100) and massive SPY-relative underperformance (-26.6%), signaling that money is fleeing the sector entirely. Liquidity stress costs this category 7 points; credit stress costs 5 more. The macro environment is indifferent to nuclear: disinflation removes inflation-premium valuations that benefited uranium supply constraints, but energy demand weakness is sector-wide, not nuclear-specific. The 5% position acknowledges that URA has found technical support and the stochastic RSI reversal pattern is worth monitoring, but conviction is absent. A sustained credit or liquidity crisis that forces energy utilities to lock in long-term uranium supply, or an unexpected pivot back to inflation fears, would be required to move this from tactical positioning to strategic allocation.
Emerging Markets — INDA
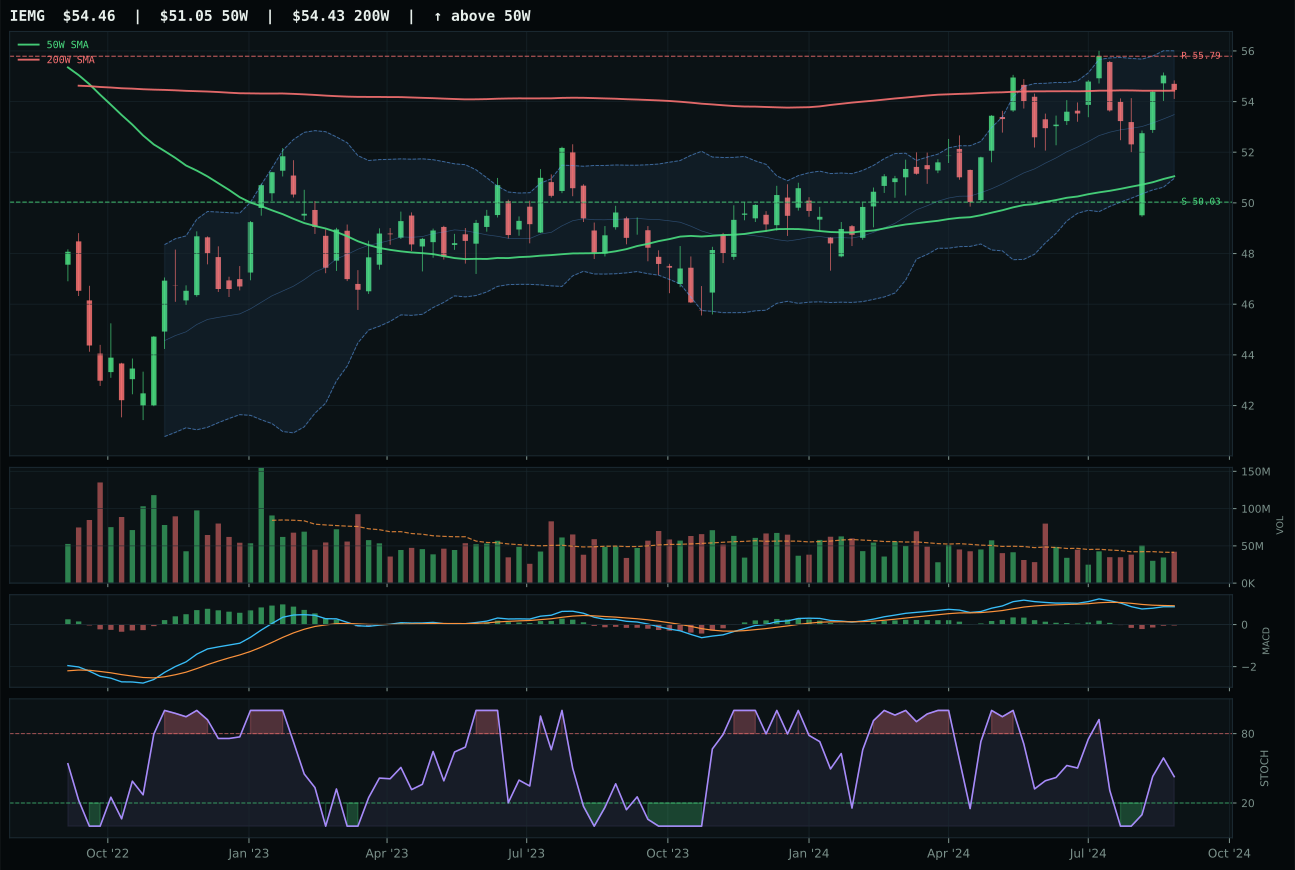
IEMG has a neutral structure profile with -3.3% 13-week relative strength versus SPY.
A failed hold above support would weaken the setup.
Actionable but governed by invalidation levels.
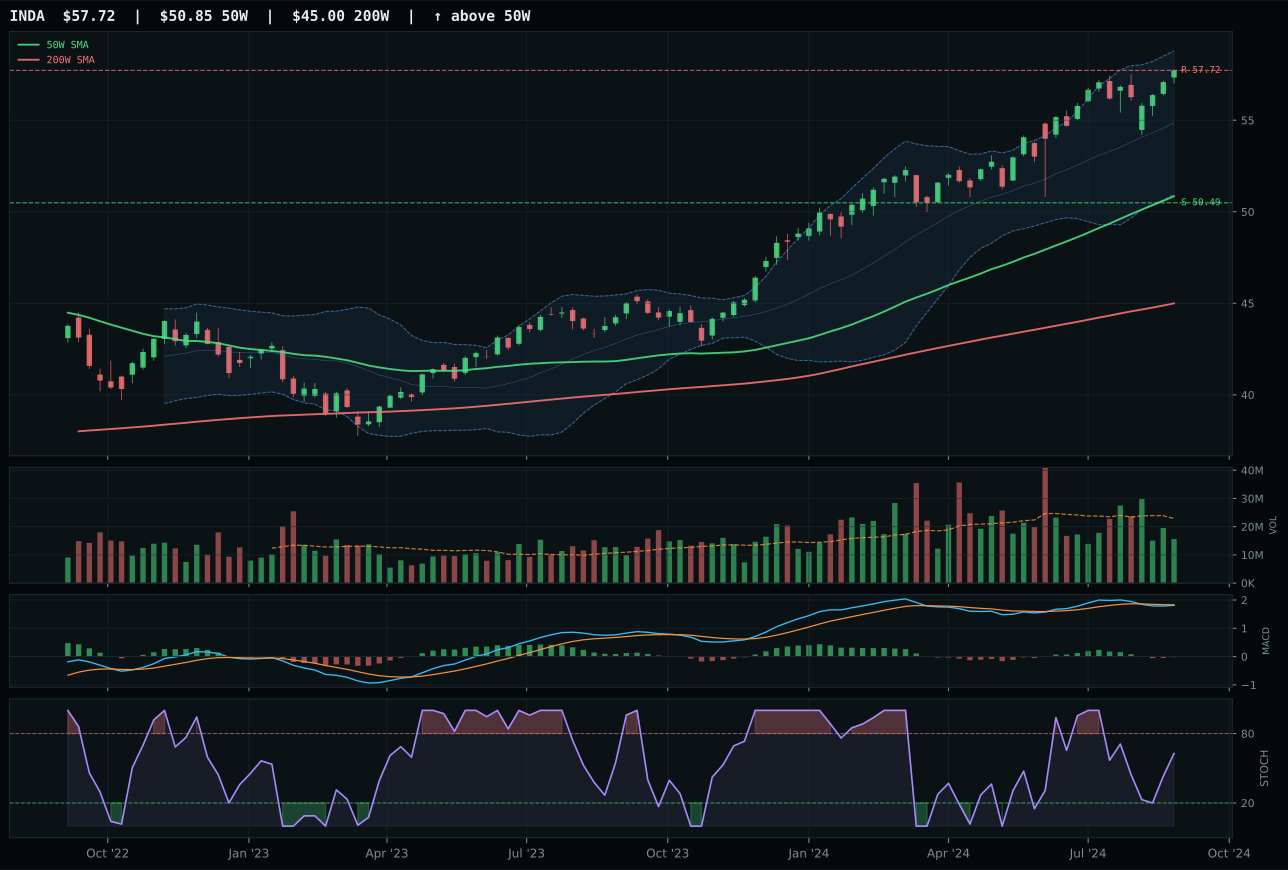
INDA has a neutral structure profile with 2.0% 13-week relative strength versus SPY.
A failed hold above support would weaken the setup.
Actionable but governed by invalidation levels.
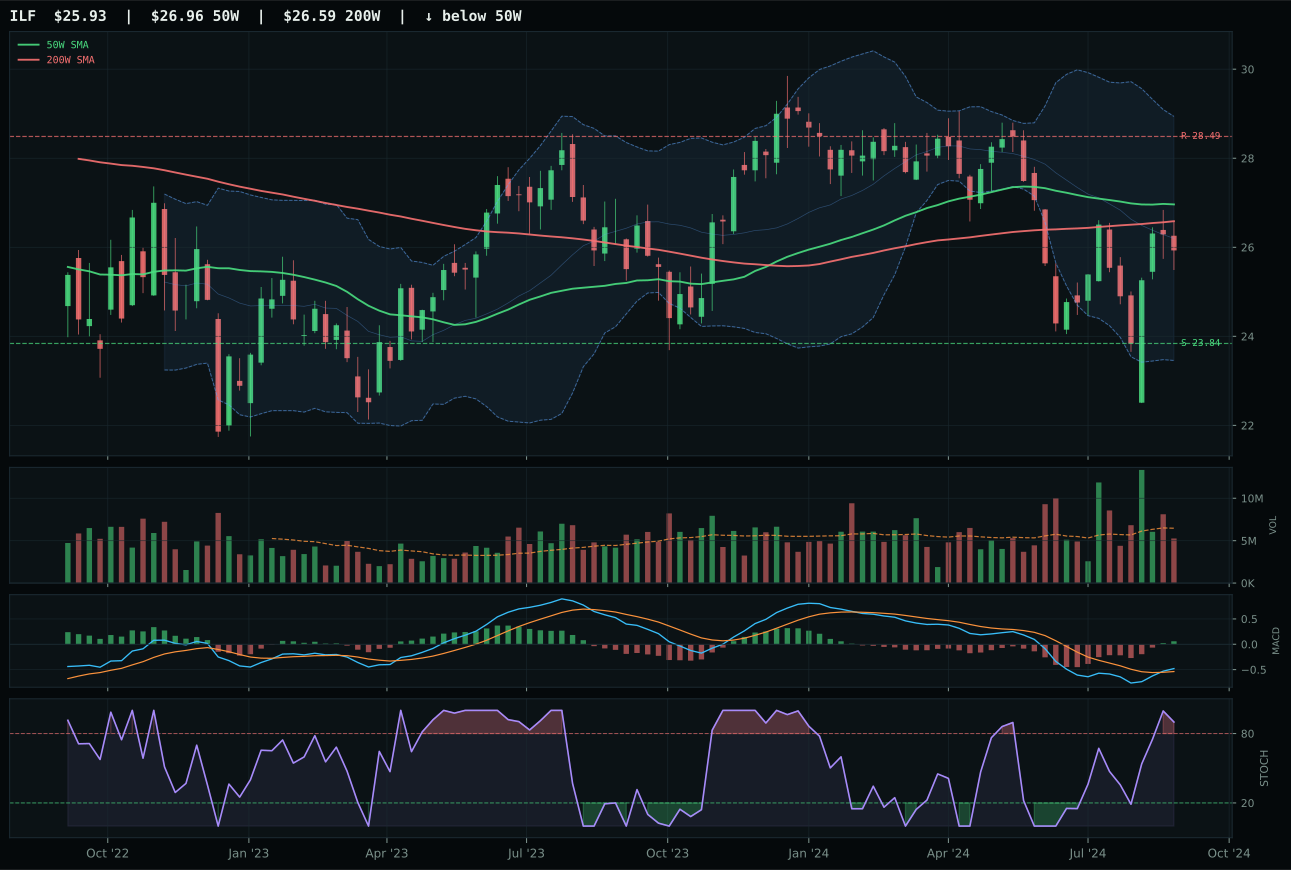
ILF has a neutral structure profile with -11.1% 13-week relative strength versus SPY.
A failed hold above support would weaken the setup.
Actionable but governed by invalidation levels.
INDA wins over IEMG with a -3.4-point gap in a category where every contender is weak, capturing the representative slot through superior category-relative strength (5.3% vs 0.0%) and marginally cleaner structure (76.6 vs 75.3) despite IEMG's superior technical evidence (68.0 vs 54.5). INDA's 8.9% 13W return beats IEMG's 3.6%, and the 5.3% outperformance within the basket is meaningful in a category where the broader emerging-market play (IEMG) is suffering from credit and liquidity stress. INDA's 2.0% SPY-relative performance is superior to IEMG's -3.3%, suggesting India's quality-growth bias is the one emerging-market thesis with relative sponsorship. IEMG's MACD is bearish but improving while INDA's is bearish/weakening, however, meaning INDA's technical picture is less constructive—the category-relative edge matters more than absolute momentum because the entire category is starved for buyers.
Emerging Markets earns 5% in tier-2 as a purely tactical slot because credit stress (-10 points) and liquidity stress (-10 points) create a -20-point macro headwind that overwhelms any technical merit. The category score of 22.4 and category-level macro fit of 30.0/100 place this among the portfolio's most constrained positions. INDA's 54.5/100 technical evidence is respectable—trend is 85.0/100 and the 8.9% 13W return shows relative strength—but the 40.0/100 macro fit reveals structural headwinds. Capital is rotating away from emerging markets into safer developed-market alternatives during a disinflation cycle with active credit and liquidity stress; INDA's India-specific quality bias earns it the slot, but this is not conviction in emerging-market upside. A substantial improvement in credit conditions, a surprise shift toward reflation, or a capital rotational catalyst would be required to move this allocation; as structured, the 5% is a hedge against missing a rebound, not a bet on emerging-market outperformance.
Traditional Energy — XLE
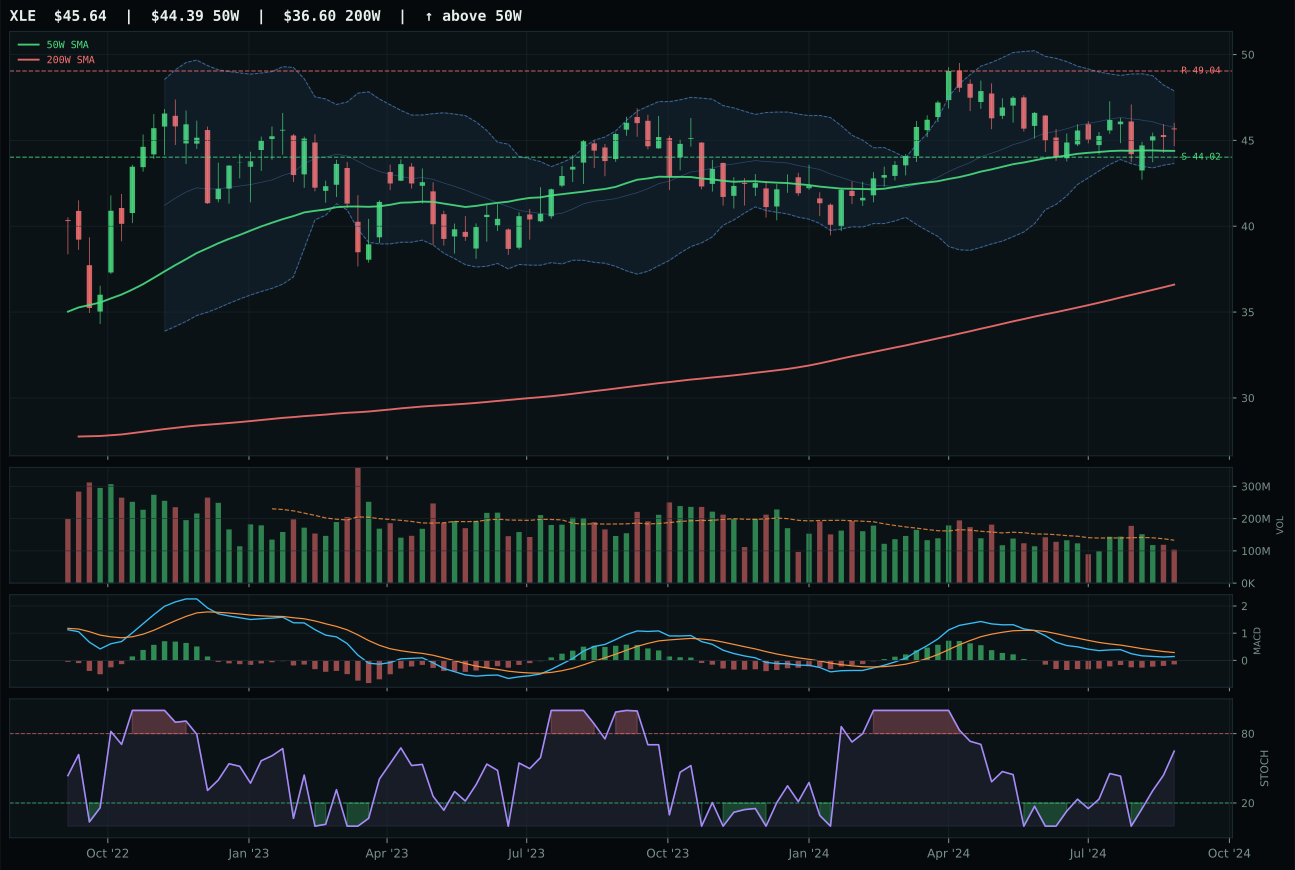
XLE has a pullback into support profile with -8.9% 13-week relative strength versus SPY.
A failed hold above support would weaken the setup.
Actionable but governed by invalidation levels.
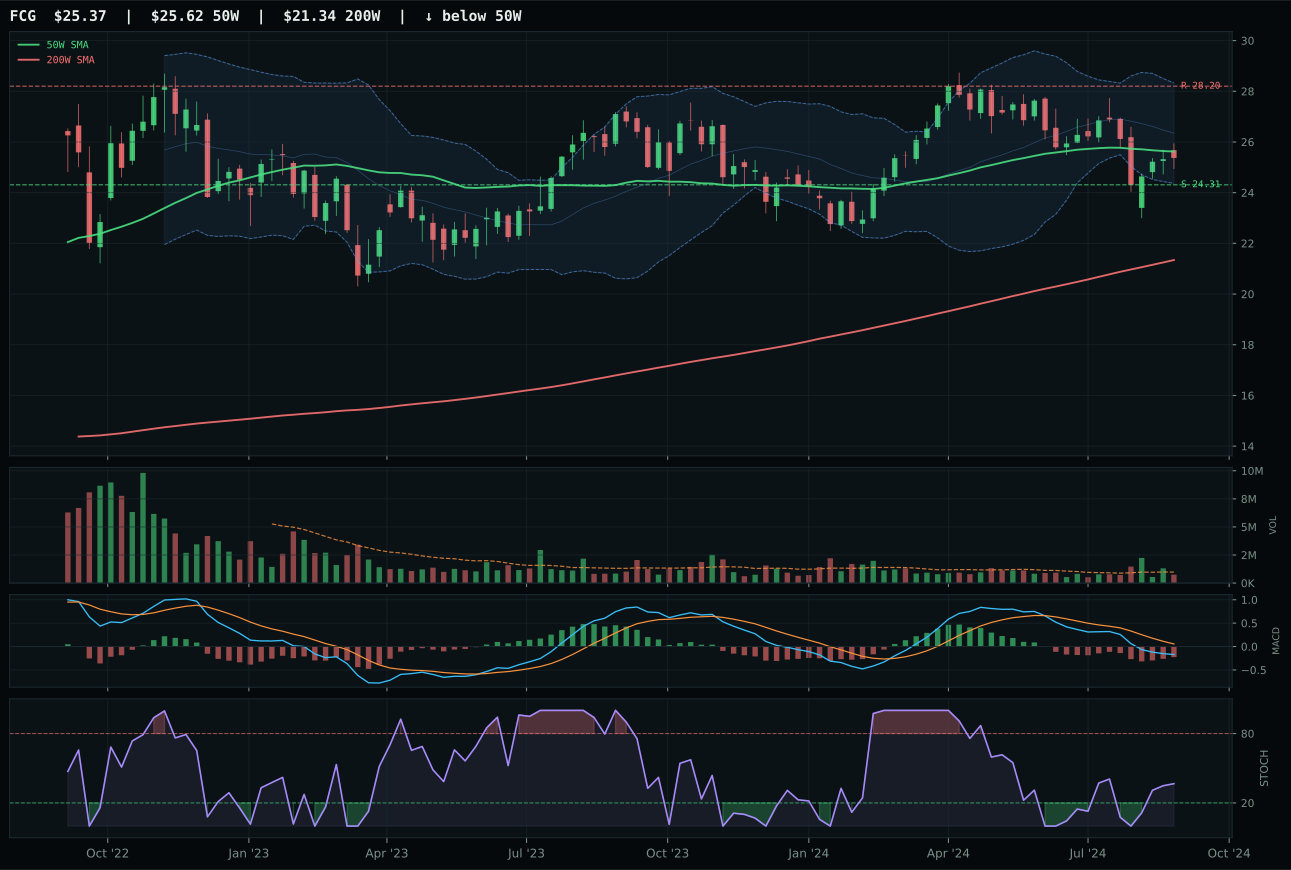
FCG has a pullback into support profile with -15.1% 13-week relative strength versus SPY.
A failed hold above support would weaken the setup.
Actionable but governed by invalidation levels.
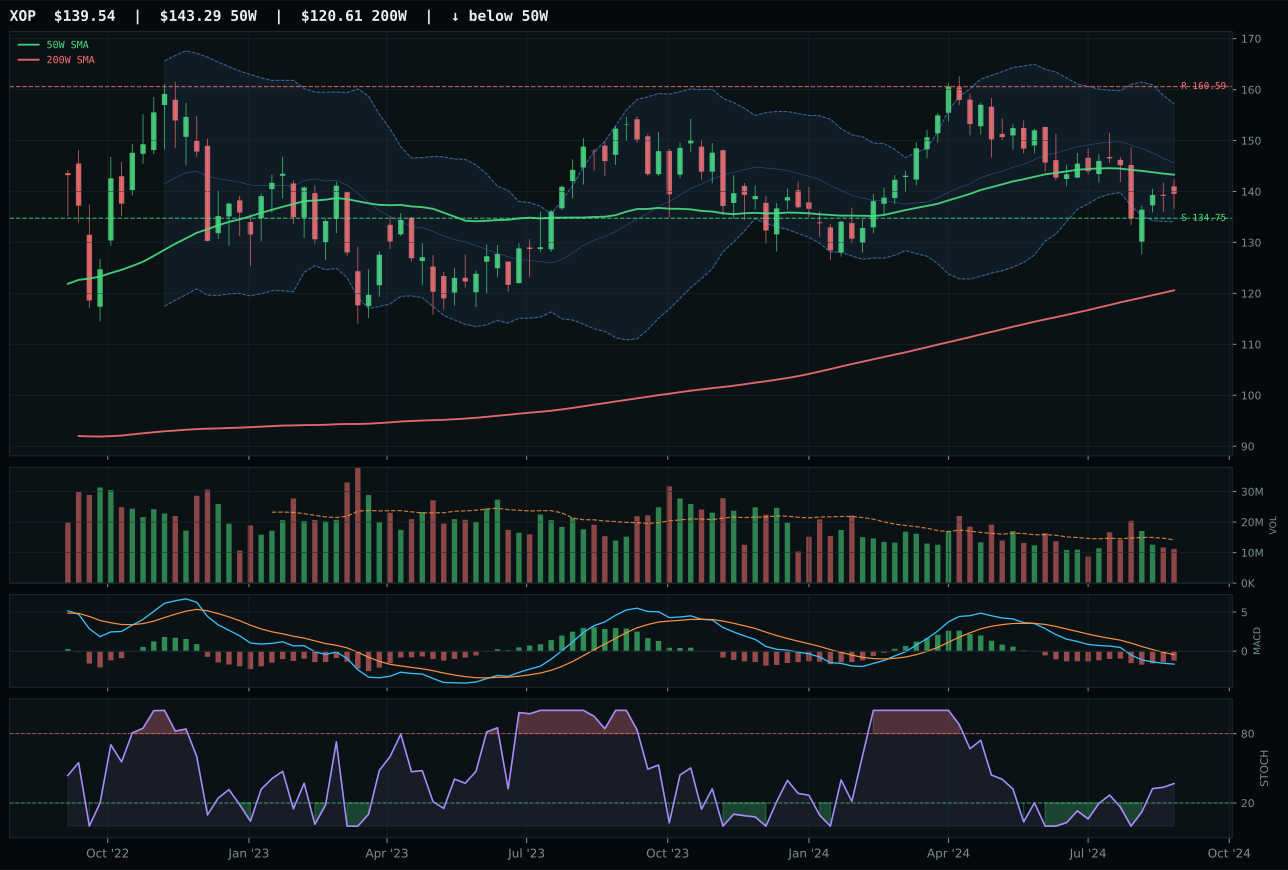
XOP has a pullback into support profile with -15.1% 13-week relative strength versus SPY.
A failed hold above support would weaken the setup.
Actionable but governed by invalidation levels.
XLE wins with a 7.4-point gap over FCG by virtue of superior category-relative strength (6.1% vs 0.0%) despite both trading near support with identical pullback-into-support setups. Both carry bearish MACD but improving, both show rising mid-zone stochastic RSI, both have neutral volume and identical -0.0% and -0.1% 50W slopes. XLE's 13W return of -2.1% beats FCG's -8.2%, and critically, XLE shows 6.1% outperformance within the category basket—the integrated energy play is finding relative demand even as sector weakness persists. FCG's natural-gas specialization has collapsed, a signal that energy demand is rolling over, which perfectly explains why XLE edges it out: broader integrated energy is a more defensive positioning than gas-specific exposure in a deflationary regime.
Traditional Energy earns 5% in tier-2 despite a category score of 7.9, one of the portfolio's weakest, because disinflation is actively hostile to commodity sectors and this allocation is tactical rather than strategic. The category-level macro fit is 16.0/100—disinflation hurts this exposure by 10 points, disinflation pressure subtracts another 10, and both credit and liquidity stress subtract 7 each—creating a -34-point macro headwind. XLE's technicals are respectable (74.1/100 technical evidence) with perfect timing (100/100 from distance to 50W and support/resistance setup), but timing does not overcome regime. The 5% slot acknowledges that XLE trades at the 50W with a defined support at 44.02 and is the best-positioned energy proxy, but this is not conviction in energy upside; it is recognition that XLE's pullback setup and relatively neutral macro fit (versus FCG's -15.1% underperformance) makes it the least-bad option. Sustained crude weakness and a continuation of deflationary momentum would push this allocation to 0%; only a credit shock or surprise inflation re-acceleration would lift it to top-2.
Industrial Metals — COPX
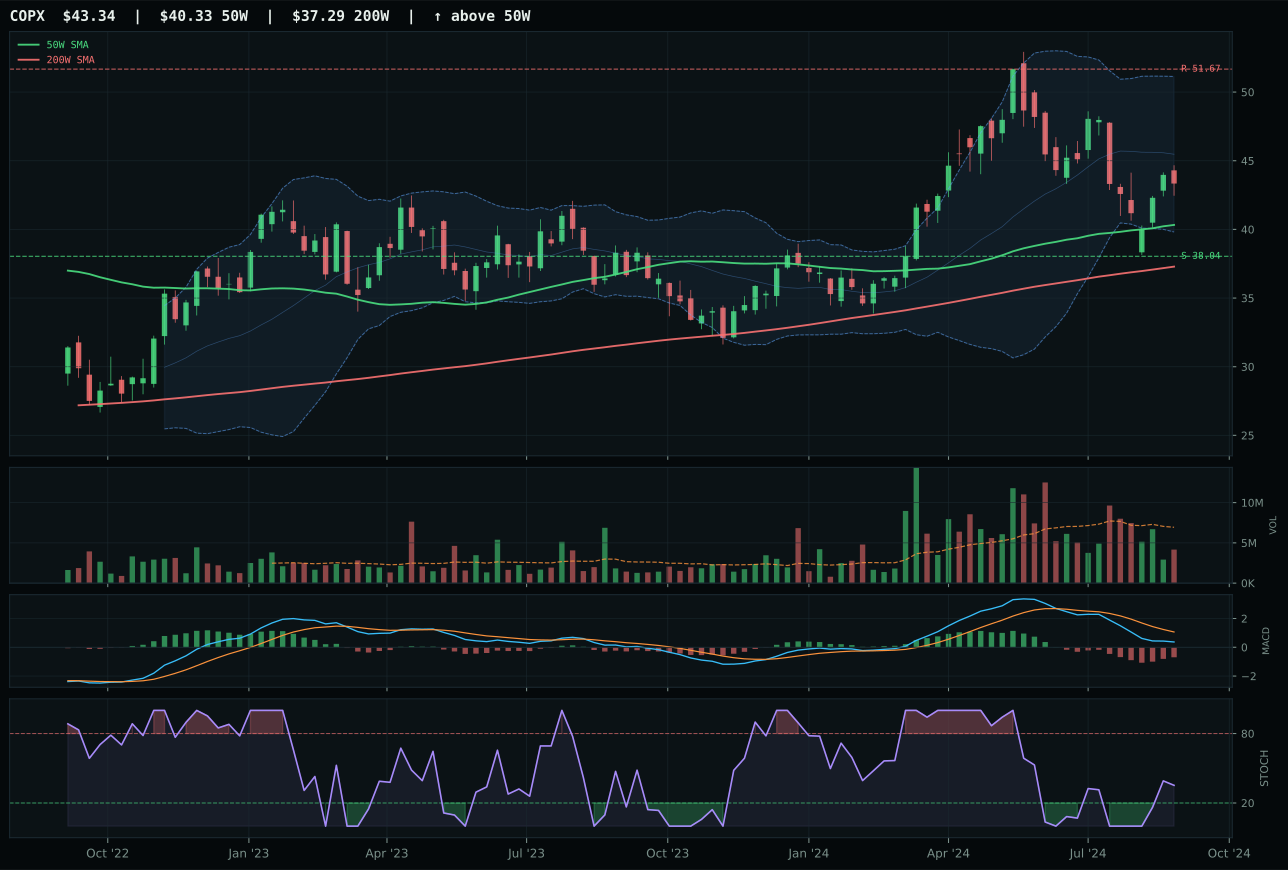
COPX has a neutral structure profile with -16.9% 13-week relative strength versus SPY.
A failed hold above support would weaken the setup.
Actionable but governed by invalidation levels.
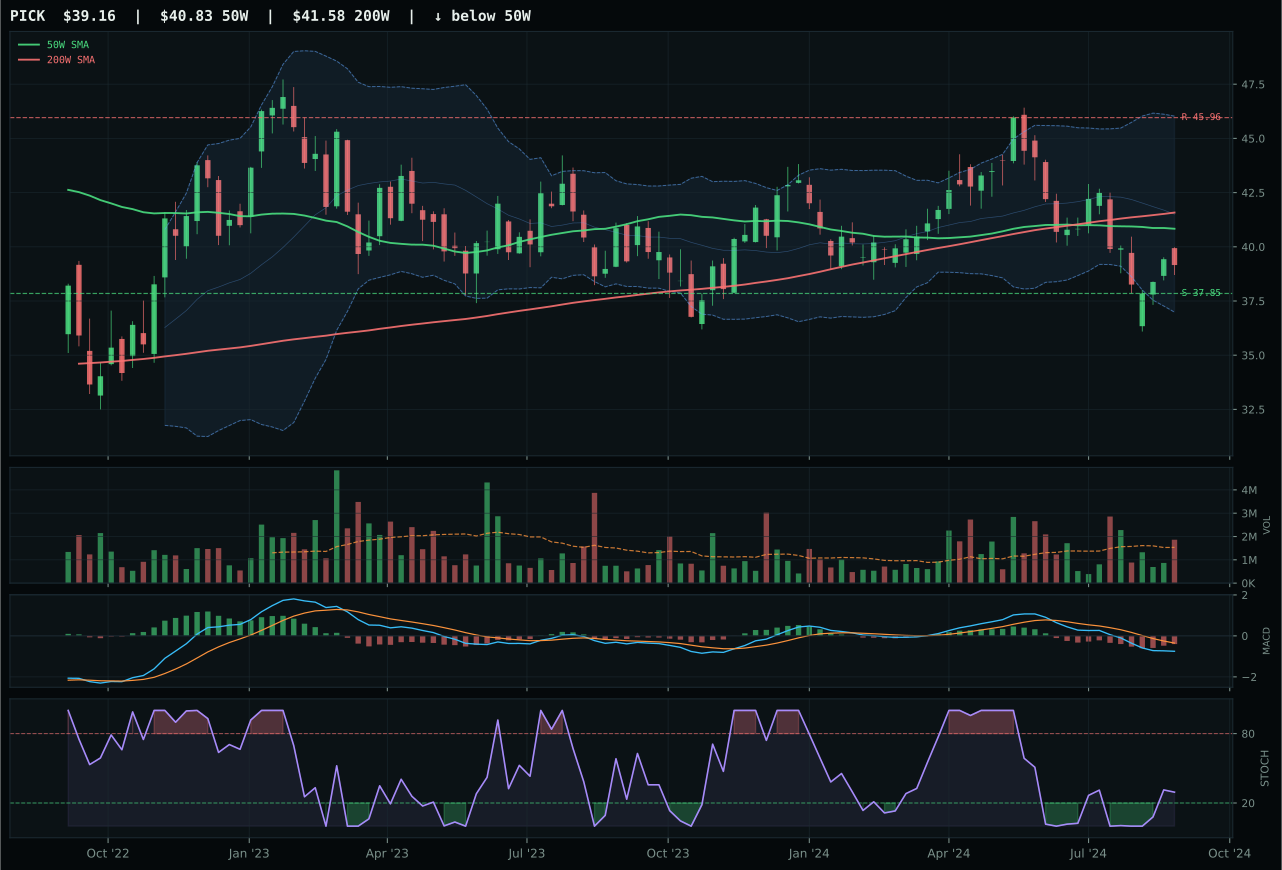
PICK has a pullback into support profile with -18.1% 13-week relative strength versus SPY.
Extension and support failure are the main tactical risks.
Tracked, but not top-2 eligible because: structurally broken.
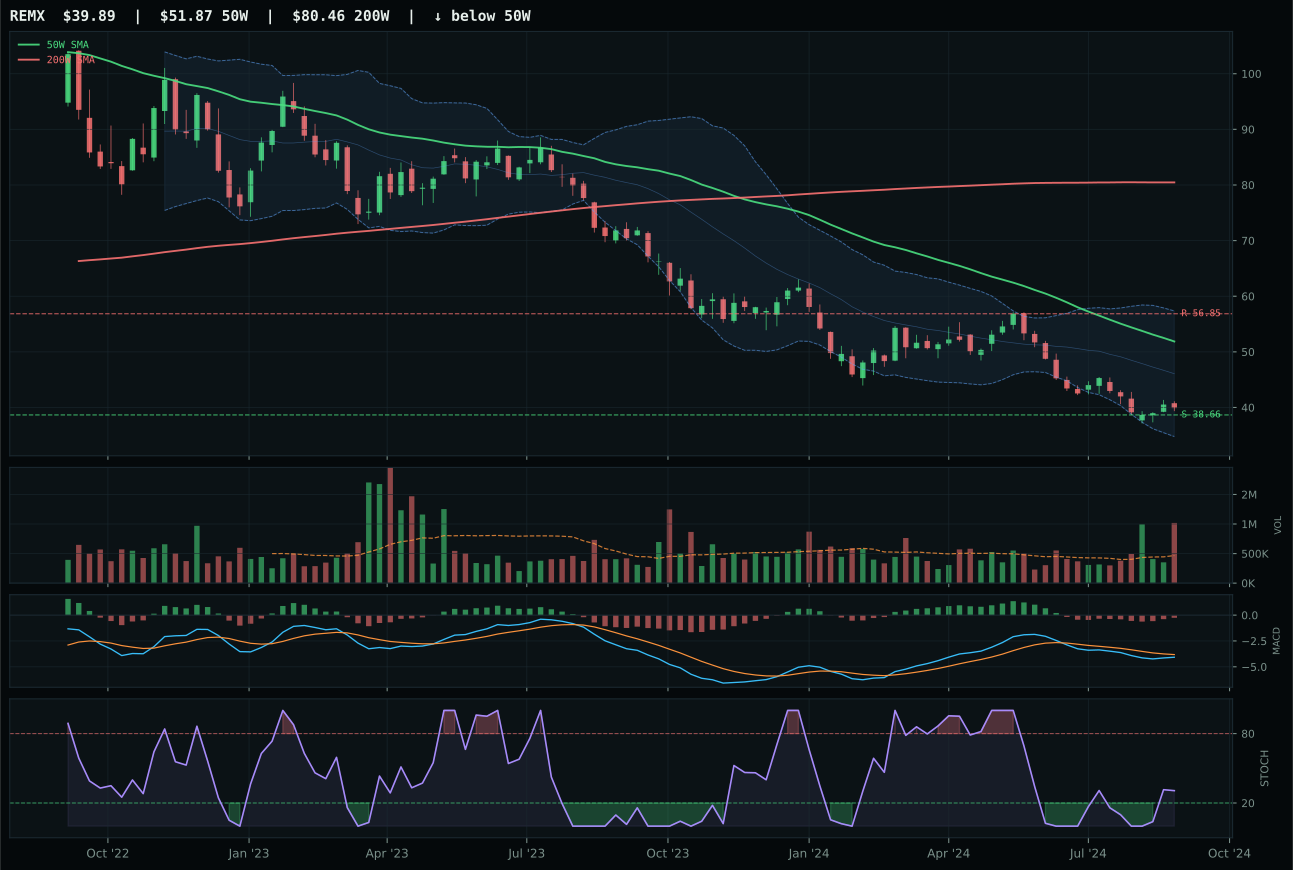
REMX has a pullback into support profile with -29.7% 13-week relative strength versus SPY.
Extension and support failure are the main tactical risks.
Tracked, but not top-2 eligible because: structurally broken.
COPX wins with a 32.1-point margin over PICK by preserving trend and technical evidence when the category is in structural distress. Price remains above both moving averages with a stable 0.3% slope, and despite a dreadful -10.1% 13W return, COPX's neutral structure, improved MACD, and middle Fibonacci zone (0.5 retracement) set up a potential reversal if demand signals change. Risk/reward is 73.8/100—favorable downside/upside ratio at 13.9% down to support versus only 16.1% up to resistance—suggesting the metal has found a defined washout zone. PICK, the mining play, has deteriorated further: the -11.3% 13W return is worse, structure is less clean (46.4 vs 62.2), and the pullback-into-support setup has failed to accumulate volume (above-average participation at spot price suggests distribution). COPX's 49.3/100 technical evidence, while weak, beats PICK's 42.0 by enough to claim representation.
Industrial Metals earns 5% in tier-2 despite a category score of 6.6, placing it outside conviction territory but alive for rebalancing if technicals shift. The macro case is brutal: liquidity stress subtracts 8 points, credit stress subtracts 7, and disinflation hurts metals demand by definition. COPX's -16.9% SPY-relative underperformance tells the full story—industrial metals are demand-linked and demand collapses in disinflationary regimes. The 5% slot is a placeholder that acknowledges COPX's technical stabilization and the Fibonacci support zone, but it is not a conviction position. Improvement would require either signs of credit tightening (paradoxically good for mining margins as supply constraints bite) or a macro pivot toward reflation or near-term stimulus. As constructed, the portfolio is 5% exposed to an industrial-metals bounce off technical support but fully expects that bounce to be sold into higher, not sustained.
Agriculture & Livestock — MOO
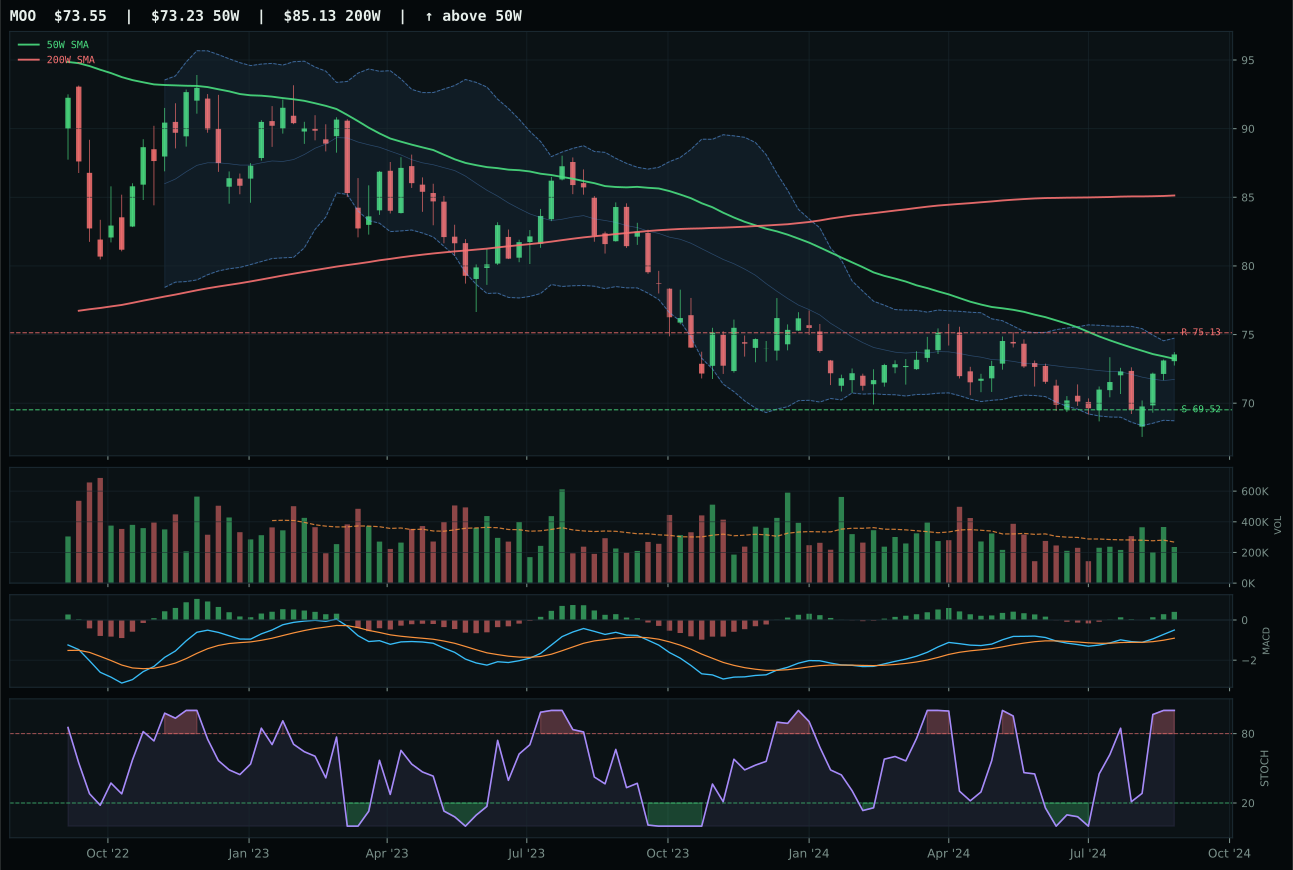
MOO has a compression near 50W profile with -5.6% 13-week relative strength versus SPY.
A failed hold above support would weaken the setup.
Actionable but governed by invalidation levels.
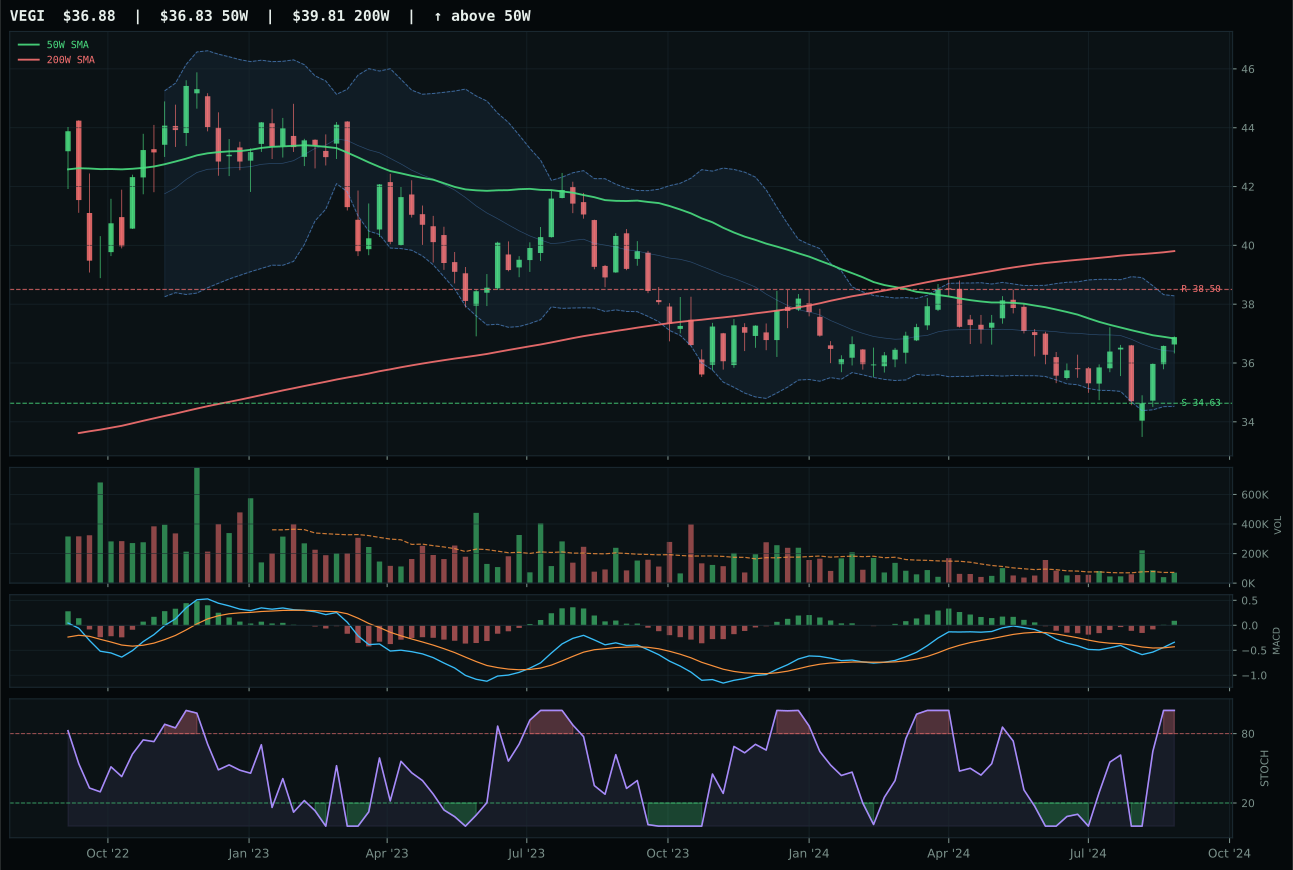
VEGI has a compression near 50W profile with -7.1% 13-week relative strength versus SPY.
A failed hold above support would weaken the setup.
Tracked, but not top-2 eligible because: .
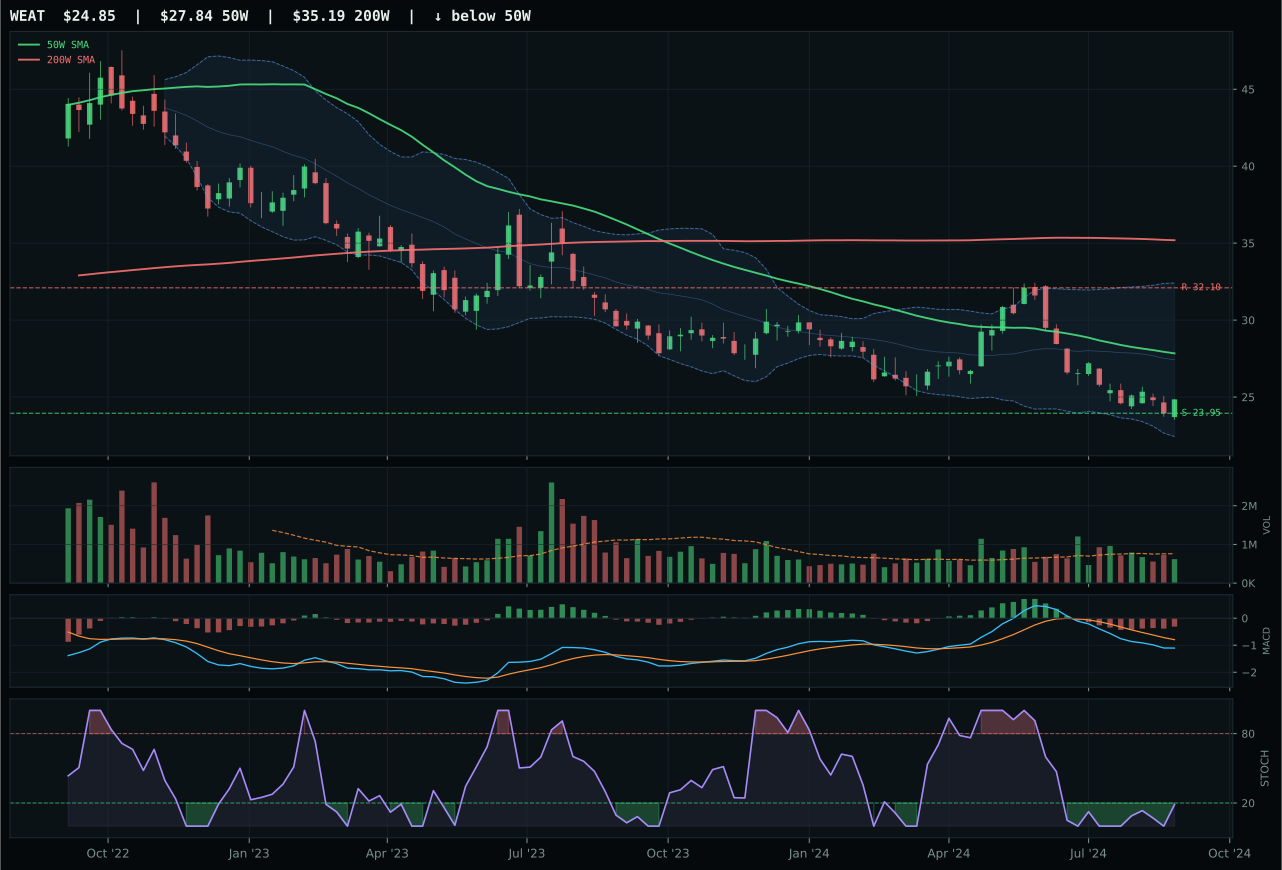
WEAT has a pullback into support profile with -28.2% 13-week relative strength versus SPY.
Extension and support failure are the main tactical risks.
Tracked, but not top-2 eligible because: structurally broken.
MOO wins decisively with a 20.7-point gap over VEGI despite both trading near their 50W with compression setups ready for expansion. MOO's advantage stems from superior category-relative strength (+1.4% vs 0.0%) combined with slightly cleaner structure (78.1 vs 77.8) and identical MACD/stochastic RSI confirmation. The real distinction is directional: MOO's 5.8% 4W return shows positive recent momentum while VEGI returned -0.2% over 13W, indicating the agribusiness thesis is finding marginal buyers in MOO even as the broader agriculture complex struggles. Both face severe macro headwinds—disinflation pressure subtracts 5 points for each, liquidity stress subtracts 4 and 3 respectively—yet MOO's 63.7 reasoned technical score beats VEGI's 42.5 because the market is showing relative preference for the equity expression over the broader producer basket.
Agriculture & Livestock receives 0% allocation this week, ranking 9th or 10th in the system, because the category score collapsed to 2.4 after testing the basket against macro constraints. The category-level macro fit is 32.0/100, driven by disinflation hurting this exposure by 6 points and disinflation pressure actively subtracting 8 more—every descriptor points away from commodity-linked agriculture in a disinflationary regime. Even MOO's compressed setup and bullish MACD cannot overcome the structural headwind: commodity prices are rolling over in a weakening inflation environment, farm equipment demand is softening, and input-cost relief only partially offsets lower output prices. WEAT, the third ETF in the basket, returned -21.4% over 13W and trades with -28.2% RS versus SPY, a signal of complete capitulation. A durable pivot toward inflation expectations, a shock to global crop supplies, or sustained credit tightening that drives hedging demand would be required to earn this category an allocation slot.