
2024-08-23
Informational purposes only. The content in this report, including allocations, analysis, and commentary, is provided solely for informational and educational purposes. It does not constitute financial advice, investment advice, trading advice, or any other type of advice. Past performance does not guarantee future results. Always conduct your own research and consult a qualified financial professional before making investment decisions.
Weekly Allocation
| Ticker | Category | Weight | Role |
|---|---|---|---|
| FBTC | 50% | Overlay | |
| GLD | Precious Metals | 10% | Top-2 (10%) |
| XLU | Utilities & Infrastructure | 10% | Top-2 (10%) |
| XAR | Defense & Aerospace | 5% | Tier-2 (5%) |
| CIBR | Technology | 5% | Tier-2 (5%) |
| MOO | Agriculture & Livestock | 5% | Tier-2 (5%) |
| XLE | Traditional Energy | 5% | Tier-2 (5%) |
| BOTZ | AI | 5% | Tier-2 (5%) |
| NLR | Nuclear Energy | 5% | Tier-2 (5%) |
Trade Instructions — Monday Open
Sell the tranche from 2024-07-26 (completing its 4-week hold). Buy the new tranche. Instructions show net portfolio changes — same-asset positions cancel, weight changes show the delta.
| Action | Ticker | Instruction |
|---|---|---|
| SELL | PAVE | Sell entire PAVE position (2.50% of portfolio) |
| SELL | ITA | Sell 20% of ITA position (reduce 6.25% → 5.00%) |
| SELL | COPX | Sell entire COPX position (1.25% of portfolio) |
| SELL | INDA | Sell 50% of INDA position (reduce 2.50% → 1.25%) |
| BUY | XLU | Buy XLU — 40.00% of freed cash (adds 2.50% to portfolio) |
| BUY | MOO | Buy MOO — 20.00% of freed cash (adds 1.25% to portfolio) |
| BUY | XLE | Buy XLE — 20.00% of freed cash (adds 1.25% to portfolio) |
| BUY | XAR | Buy XAR — 20.00% of freed cash (adds 1.25% to portfolio) |
Current Portfolio After Trade
Combined holdings across all 4 active tranches. Each tranche is 25% of the portfolio.
| Ticker | % of Portfolio | Weight Bar |
|---|---|---|
| FBTC | 50.00% | |
| XLU | 10.00% | |
| GLD | 8.75% | |
| ITA | 5.00% | |
| CIBR | 5.00% | |
| NLR | 5.00% | |
| MOO | 5.00% | |
| XLE | 5.00% | |
| AIQ | 2.50% | |
| INDA | 1.25% | |
| XAR | 1.25% | |
| BOTZ | 1.25% |
Macro Regime — Disinflation
Macro Evidence Charts
Market-implied signals behind the macro regime scores. Each ratio compares two assets; the direction and slope of the ratio is what the macro engine reads.
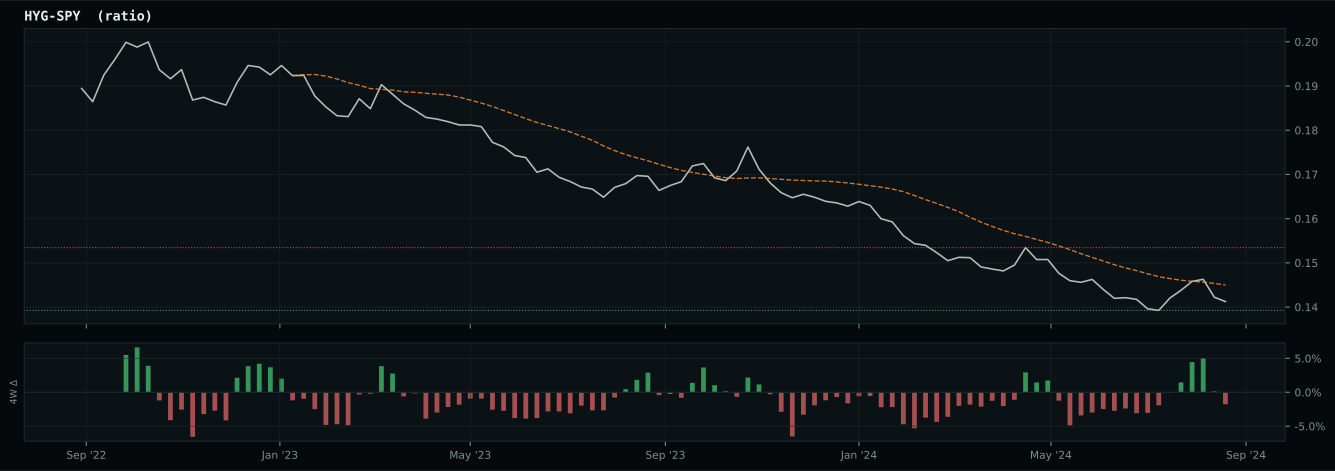
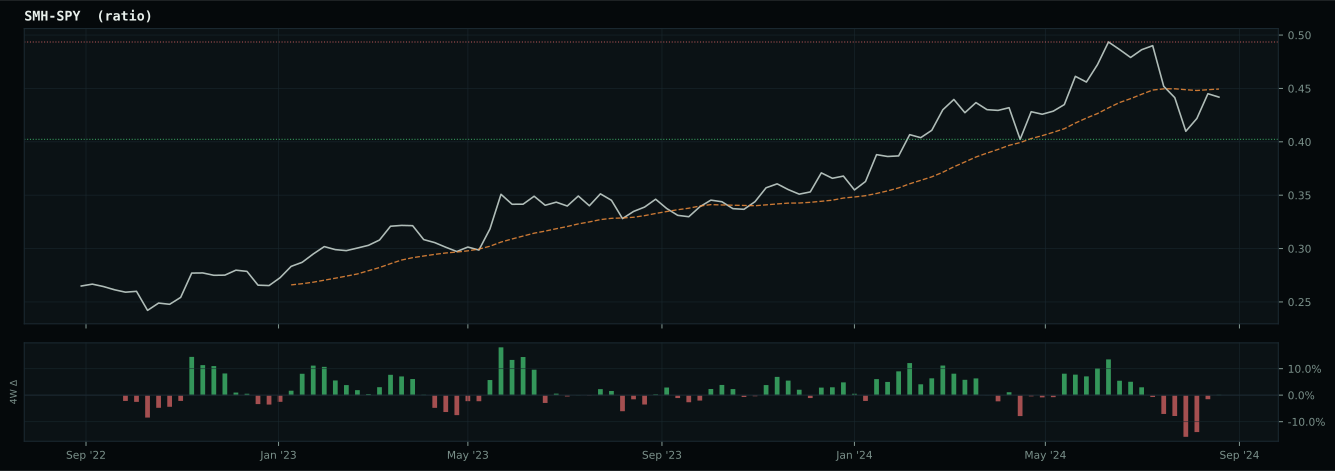
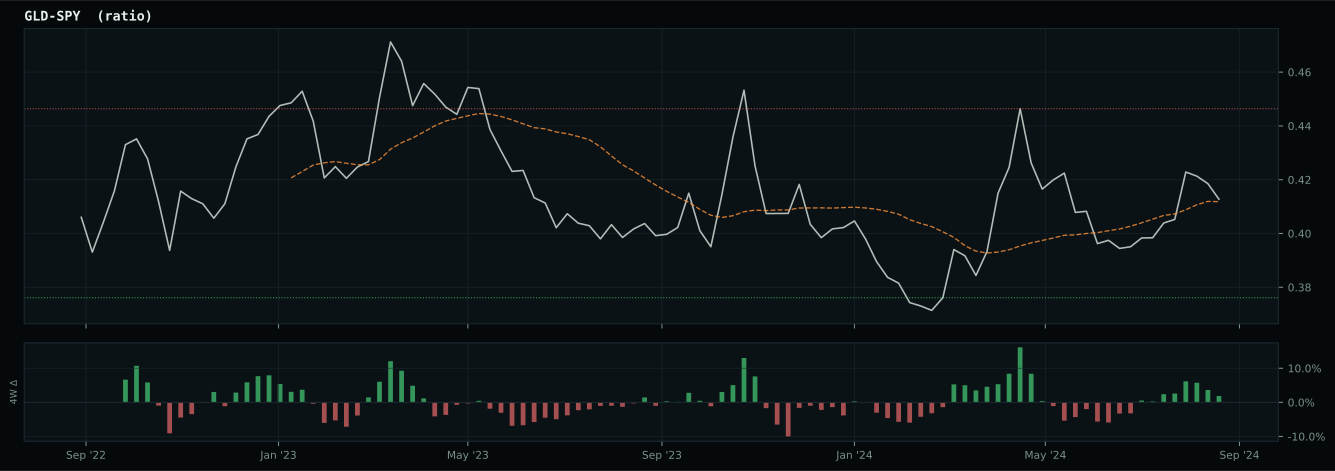
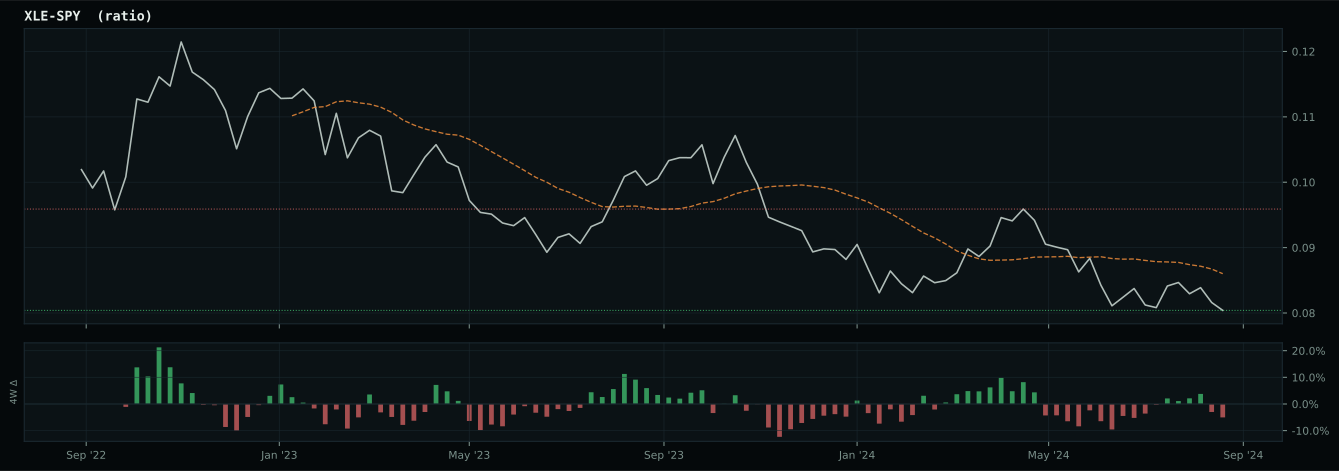
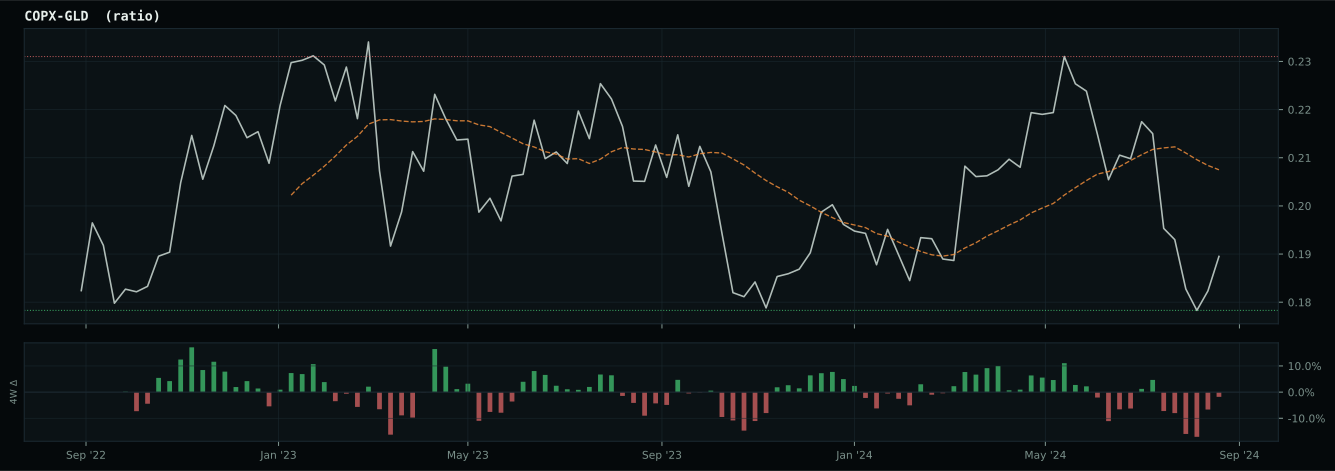
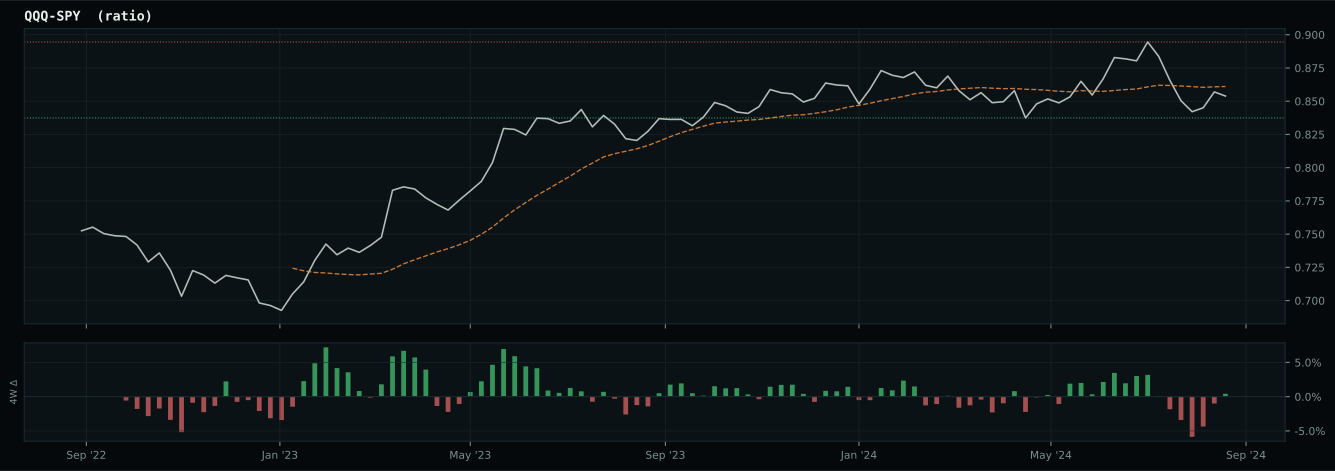
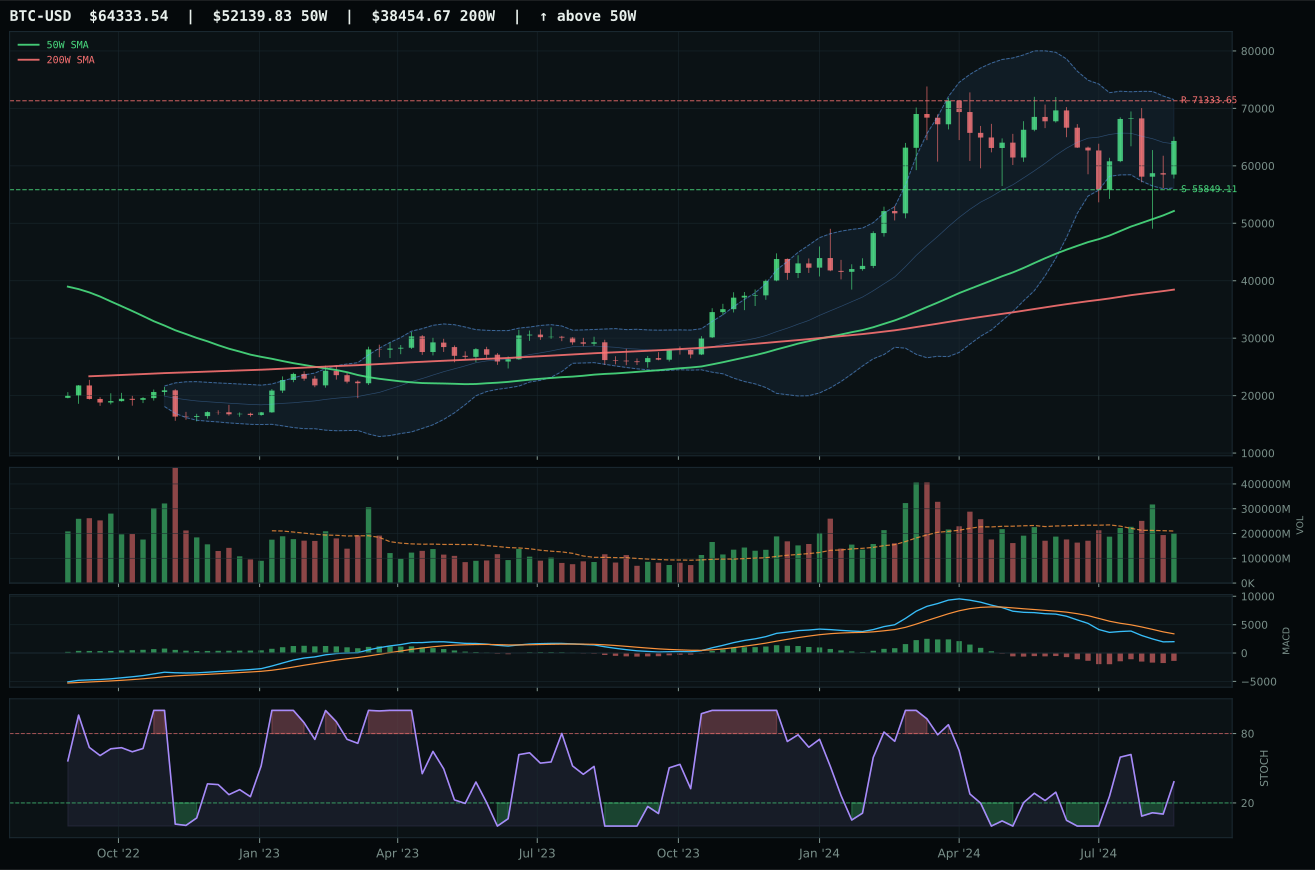
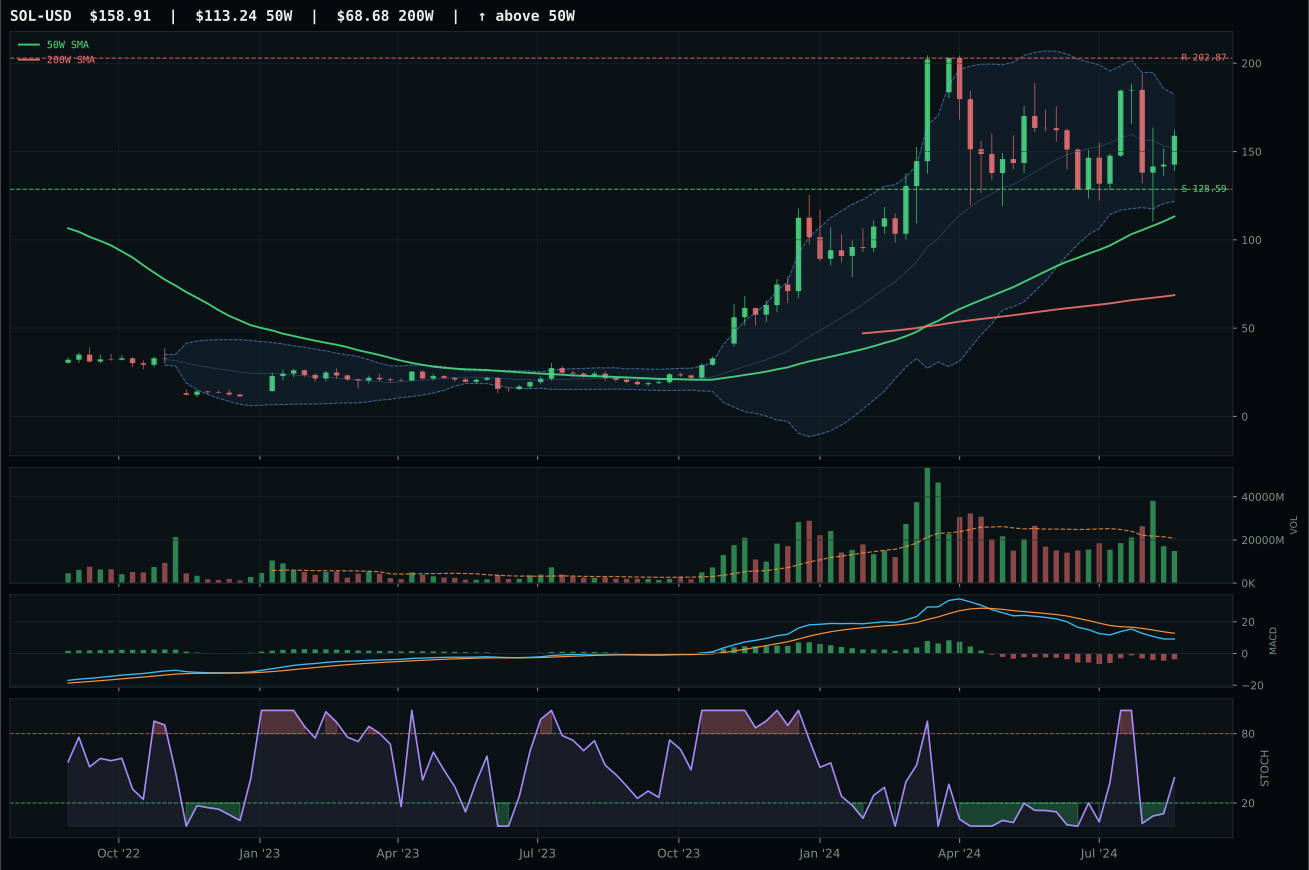
Crypto Regime — TrendBTC
ValueBTC not armed: BTC has not made the first post-breakdown touch of the 200W buy zone after losing the 50W
TrendBTC confirmed: 2 consecutive closes above rising/flat 50W SMA
one or more available conditions failed
Category Rankings
| Rank | Category | Winner | Score | Alloc | 4W Ret | Peers (4W) |
|---|---|---|---|---|---|---|
| 1 | Precious Metals | GLD | 59.1 | 20% | +4.08% | GDX +2.4% · SLV +3.0% |
| 2 | Utilities & Infrastructure | XLU | 54.7 | 20% | +5.75% | IGF +3.8% · PAVE +2.8% |
| 3 | Defense & Aerospace | XAR | 53.6 | 10% | +0.81% | ITA +2.2% · ROKT +1.3% |
| 4 | Technology | CIBR | 47.0 | 10% | -0.15% | XLK -0.6% · IGV +3.7% |
| 5 | AI | BOTZ | 30.9 | 10% | -2.17% | AIQ +1.7% · SMH -3.5% |
| 6 | Nuclear Energy | NLR | 21.5 | 10% | +4.15% | URA +0.7% · URNM -1.3% |
| 7 | Emerging Markets | IEMG | 19.8 | 10% | +0.91% | ILF -3.1% · INDA +3.2% |
| 8 | Industrial Metals | COPX | 3.6 | 10% | -1.83% | PICK -1.2% · REMX -3.9% |
| 9 | Agriculture & Livestock | MOO | — | 0% | +0.63% | VEGI +1.4% · WEAT +8.6% |
| 10 | Traditional Energy | XLE | — | 0% | -3.49% | FCG -4.8% · XOP -4.8% |
Precious Metals — GLD
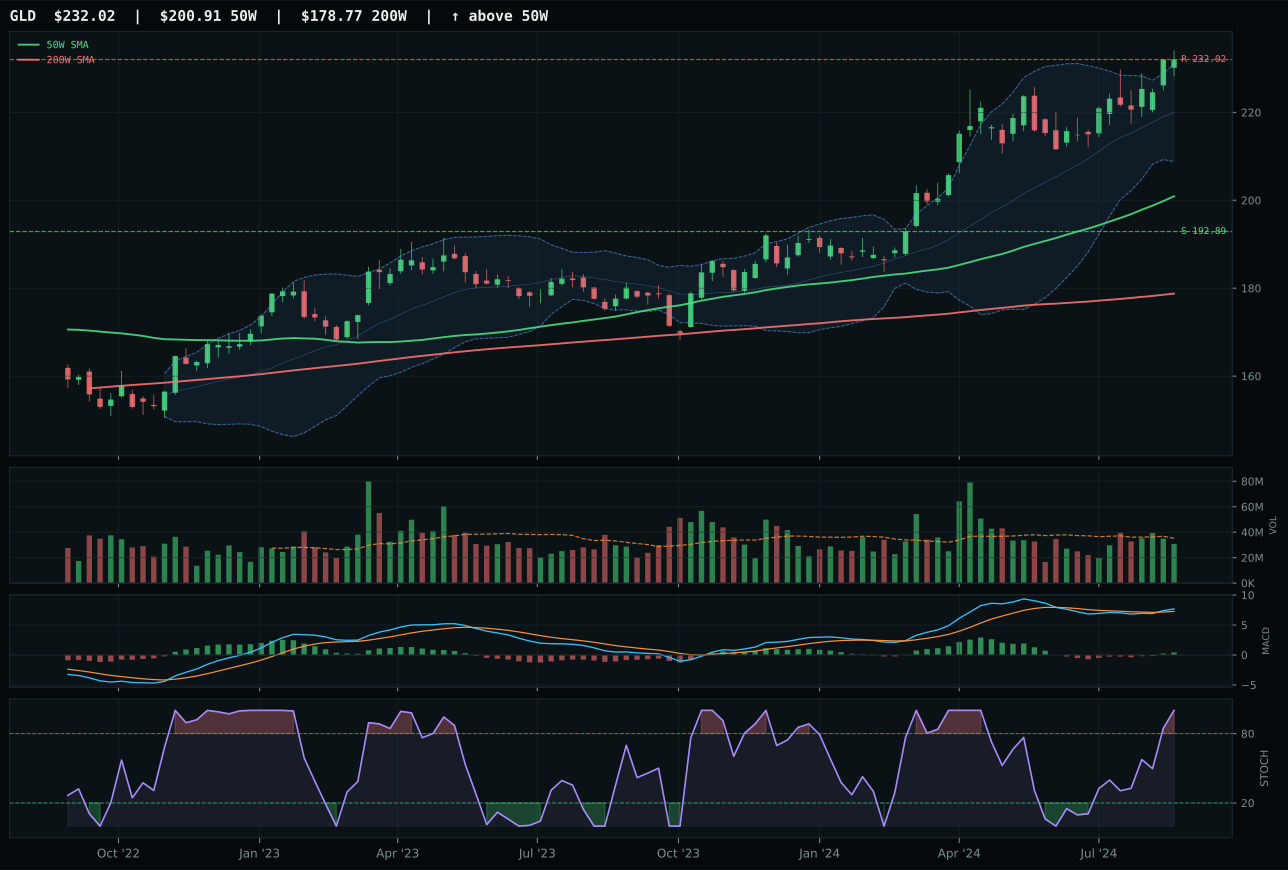
GLD has a vertical extension profile with 1.3% 13-week relative strength versus SPY.
A failed hold above support would weaken the setup.
Actionable but governed by invalidation levels.
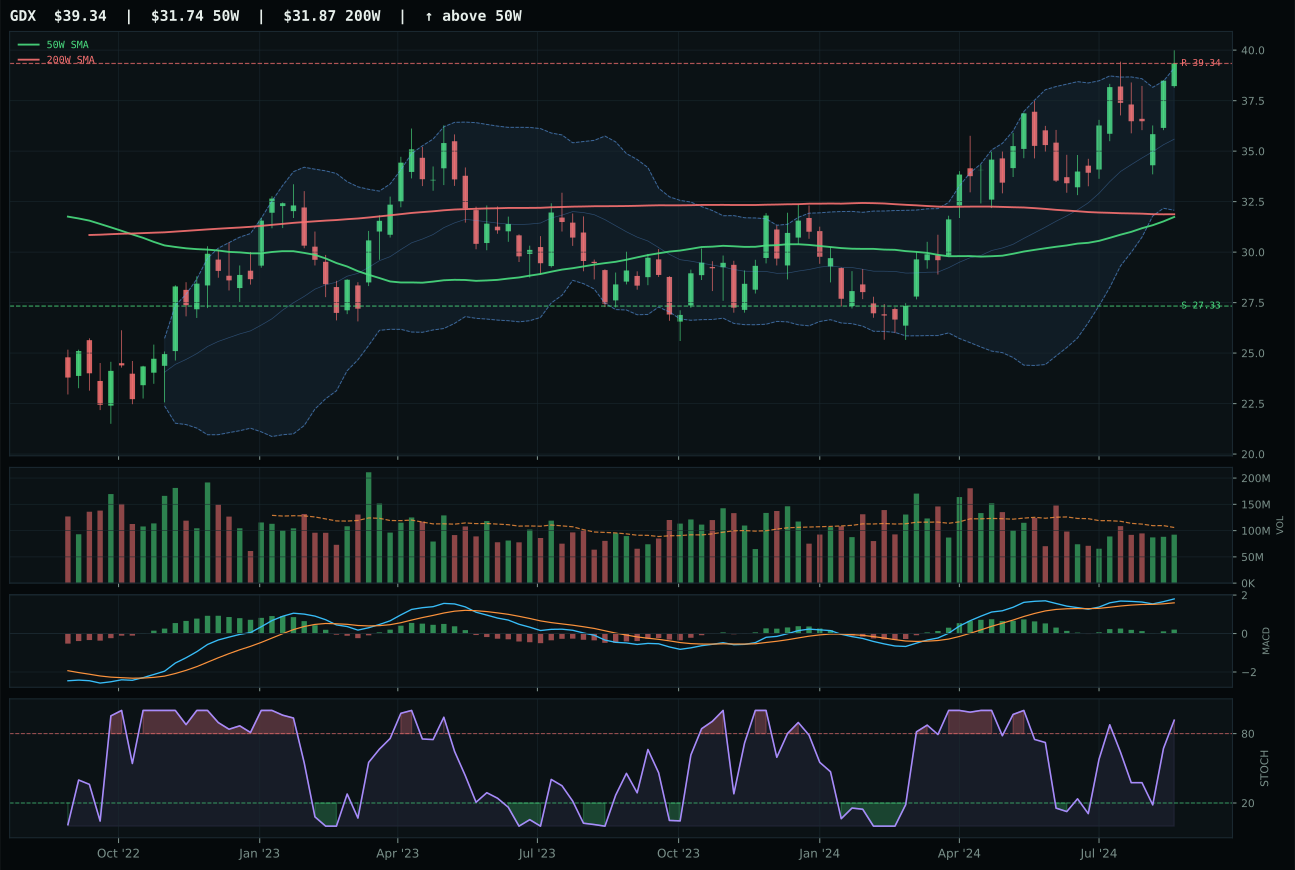
GDX has a vertical extension profile with 5.4% 13-week relative strength versus SPY.
A failed hold above support would weaken the setup.
Actionable but governed by invalidation levels.
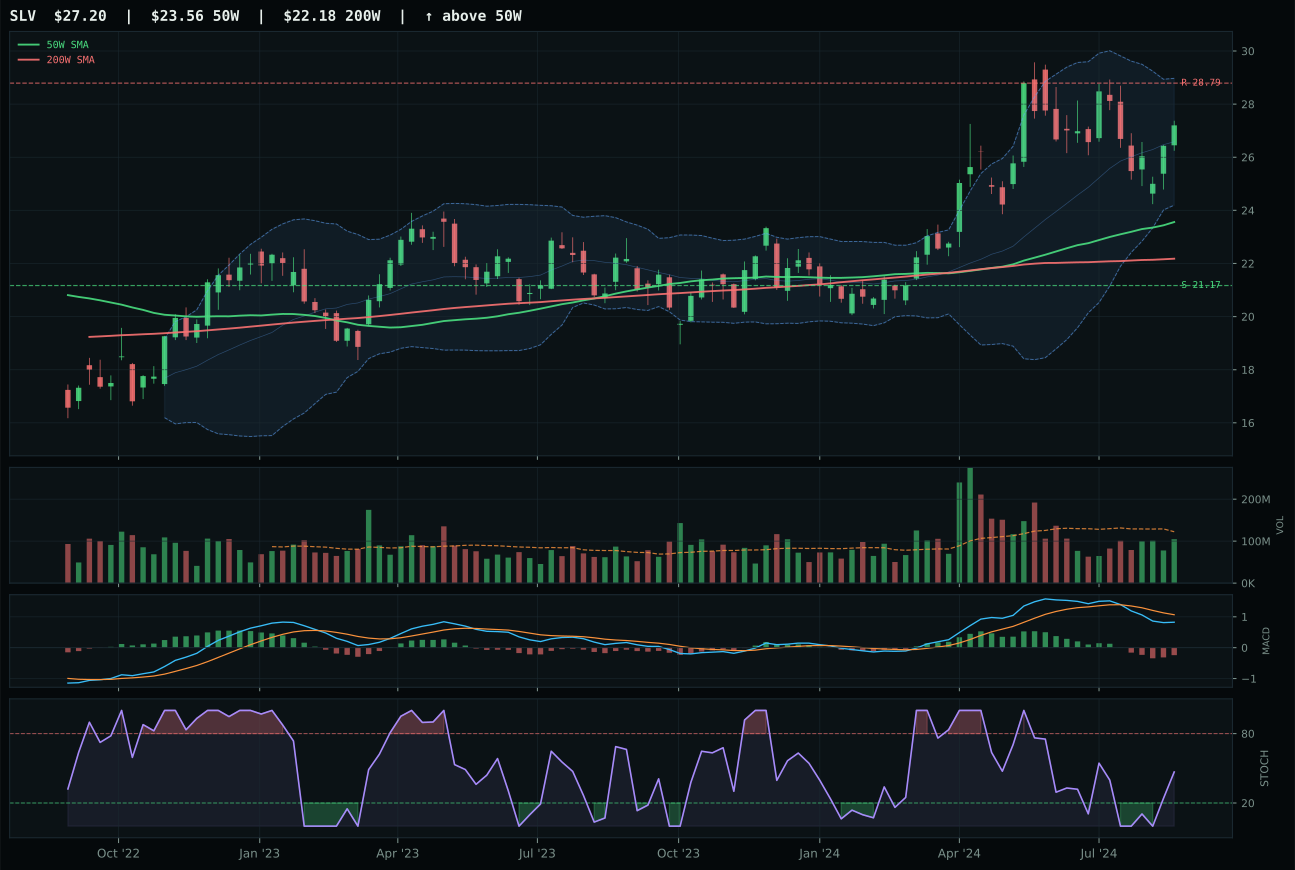
SLV has a vertical extension profile with -8.1% 13-week relative strength versus SPY.
A failed hold above support would weaken the setup.
Actionable but governed by invalidation levels.
GLD wins because its relative strength versus SPY is positive 1.3% while GDX leads at 5.4%, yet GLD's cleaner structure (75.3 versus 69.7) and lower distance from the 50W (15.5% versus 23.9%) mean GLD offers safer entry into the same uptrend. Both trade with bullish MACD and overbought stochastic RSI; both sit in vertical extension near the 52W high. The technical evidence scores tell the story: GLD at 66.8 versus GDX at 72.4, yet GLD's macro/narrative fit is 58.0 versus GDX's 34.0, which means disinflation pressure (+8 for the category, +6 for GLD specifically) drives GLD's risk-adjusted edge. GDX is more leveraged, more extended, and faces stronger macro headwinds from liquidity and credit stress; GLD is the clean monetary hedge that disinflation regimes favor.
Precious Metals ranks 59.1 and earns top-2 status at 10% allocation because gold, as a clean monetary hedge, is the only category scoring above XLU with sufficient macro tailwinds to justify outsize capital commitment. Disinflation helps this category at positive 8 points, and disinflation pressure is active at positive 6, creating a rare macro regime where safe-haven buying persists. The 64.0 category-level macro fit is the highest in the portfolio after crypto, reflecting genuine institutional demand for gold as credit conditions tighten. However, the 37.0 timing score warns that the 15.5% extension above the 50W means new money enters at unfavorable prices; GLD's risk/reward is just 44.1 with downside to support at 20.3%. Commit the full 10% because macro conviction is high, but position for mean reversion if the category scores drop below 50 next week.
Utilities & Infrastructure — XLU
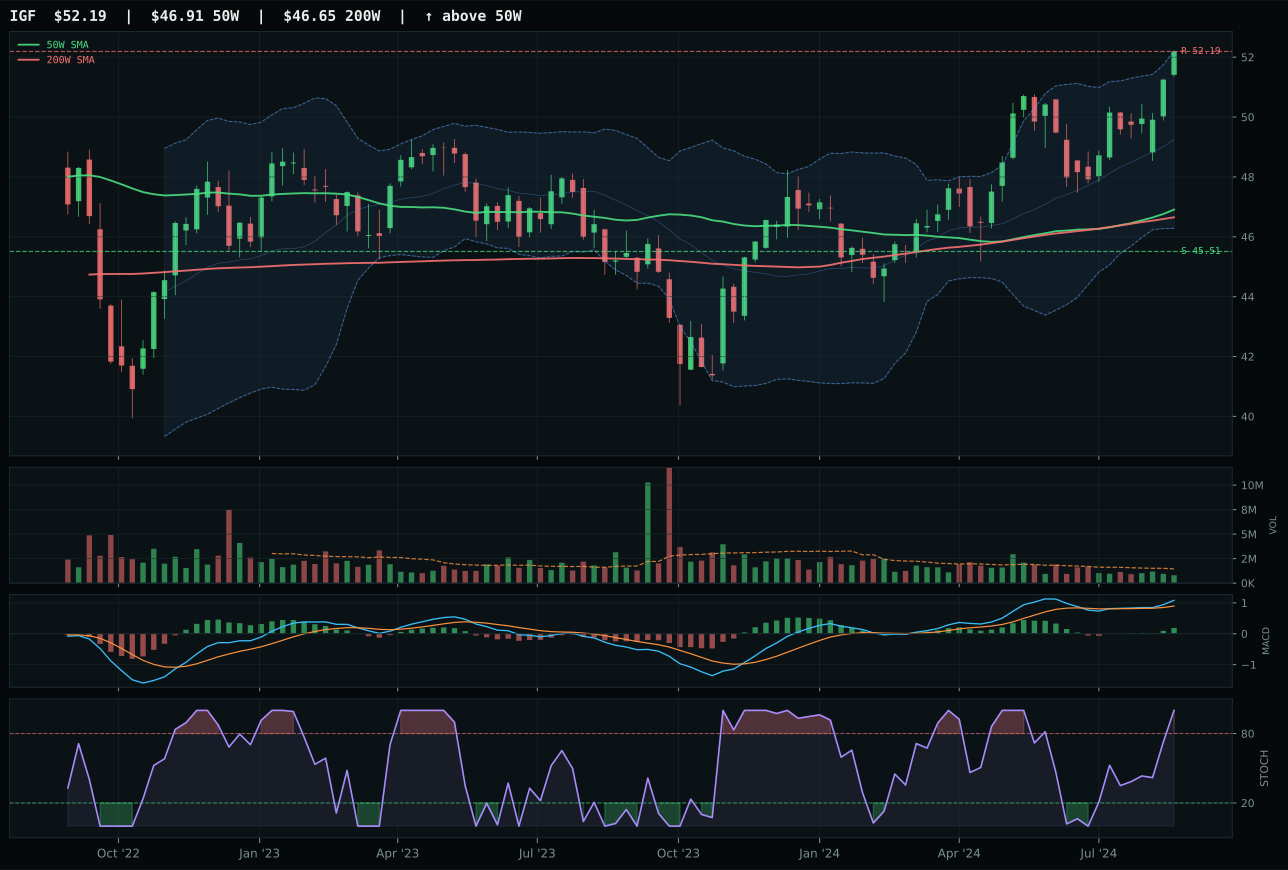
IGF has a neutral structure profile with -1.5% 13-week relative strength versus SPY.
A failed hold above support would weaken the setup.
Actionable but governed by invalidation levels.
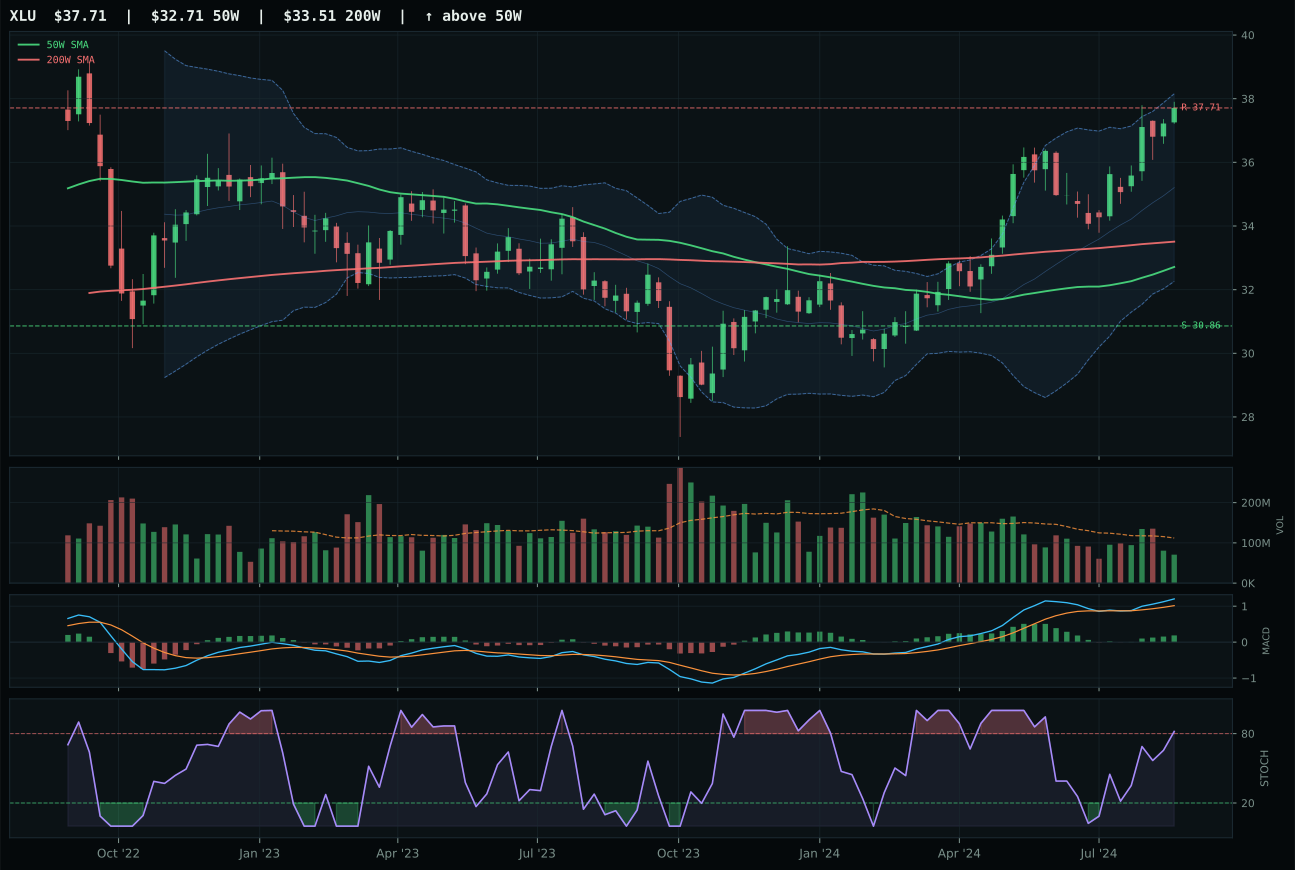
XLU has a vertical extension profile with -0.7% 13-week relative strength versus SPY.
A failed hold above support would weaken the setup.
Actionable but governed by invalidation levels.
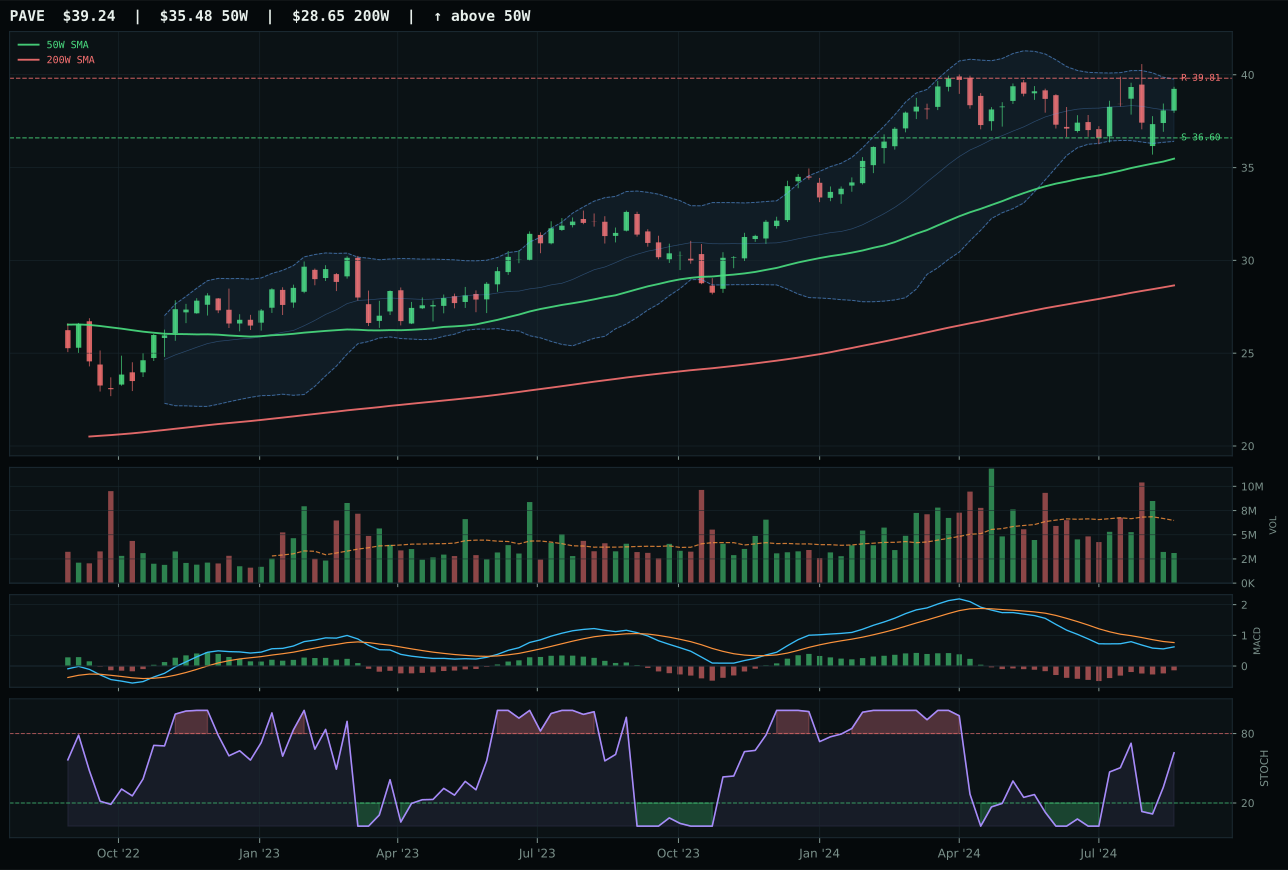
PAVE has a neutral structure profile with -5.8% 13-week relative strength versus SPY.
A failed hold above support would weaken the setup.
Actionable but governed by invalidation levels.
XLU wins Utilities & Infrastructure with a trend score of 99.0, sitting above both the 50W and 200W with a non-deteriorating 50W slope of 0.4%. Price is 15.3% extended above the 50W, which normally penalizes entry, yet XLU's category-relative strength of 0.8% versus IGF's 0.0% gives XLU the edge when all else is similar. Both hold bullish MACD and overbought stochastic RSI; both trade in vertical extension near the 52W high. The difference is volume sponsorship: XLU's 58.4 volume-price confirmation score versus IGF's 64 reflects IGF's better accumulation pattern despite XLU's stronger relative momentum. IGF scores 73 composite versus XLU's 64 on raw technicals, but the reasoning layer's 3/2/1 weighted basket elevates XLU because its macro fit (56.0) beats IGF's (54.0) on disinflation pressure conviction. XLU wins on macro-adjusted technicals, not pure price momentum.
Utilities & Infrastructure ranks second among all categories at 54.7, earning 10% top-2 allocation because regulated utilities are the cleanest defensive hedge in a disinflation regime. Disinflation helps the category at positive 7 points, disinflation pressure is active at positive 6, and even liquidity stress registers as only negative 3 because utilities have stable cash flows and captive demand. The 64.0 category-level macro fit reflects genuine macro tailwinds: as deflation pressures build, utility revenues become predictable while cost structures remain sticky to the downside, expanding margins. XLU's extended position (15.3% above the 50W) is a timing concern, yet the 10% allocation reflects the portfolio's conviction that the disinflation trade is real and durable. Expect mean reversion timing risk—if the market rotates back toward growth or inflation, this 10% becomes vulnerable—but commit it fully because the macro-technical case is genuinely sound.
Defense & Aerospace — XAR
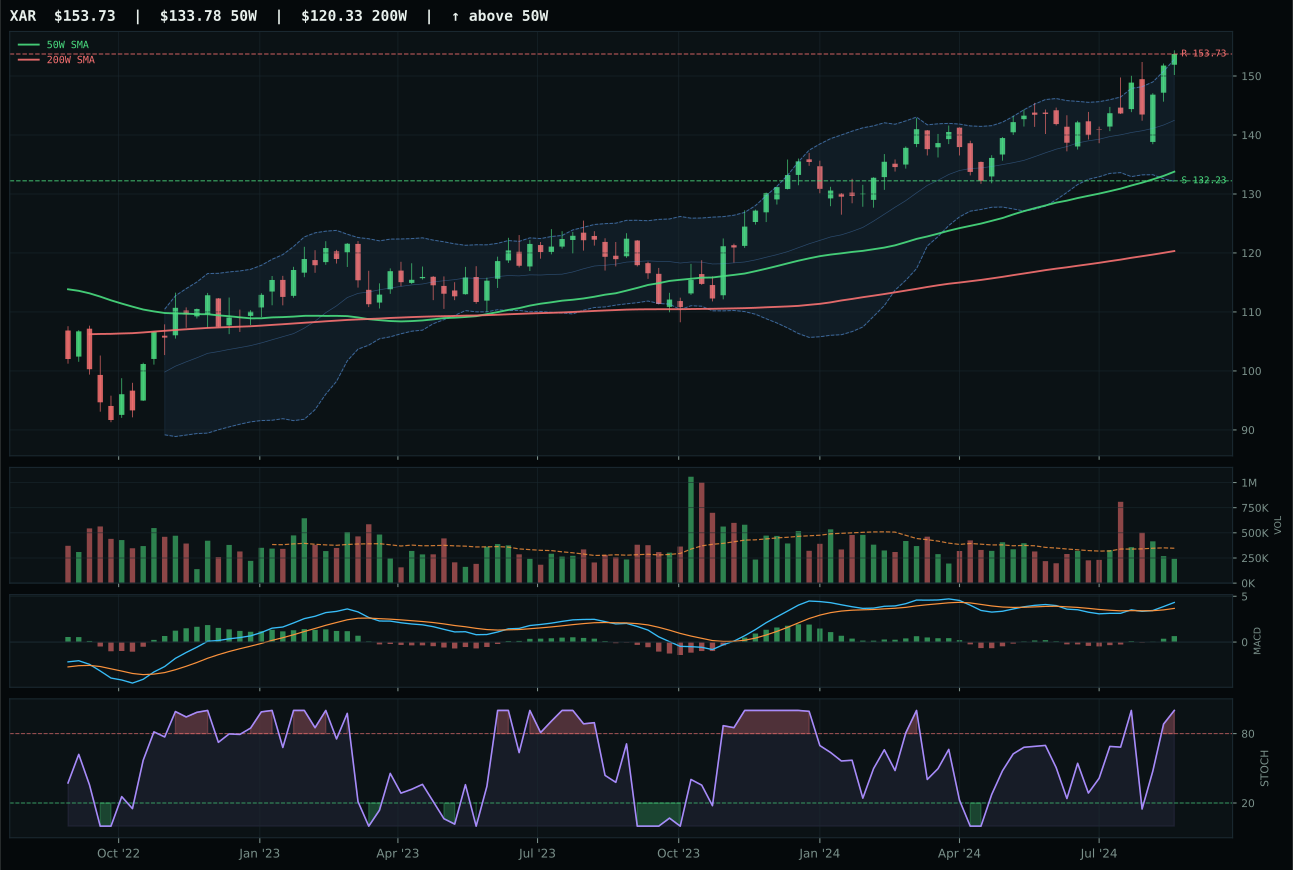
XAR has a neutral structure profile with 1.0% 13-week relative strength versus SPY.
A failed hold above support would weaken the setup.
Actionable but governed by invalidation levels.
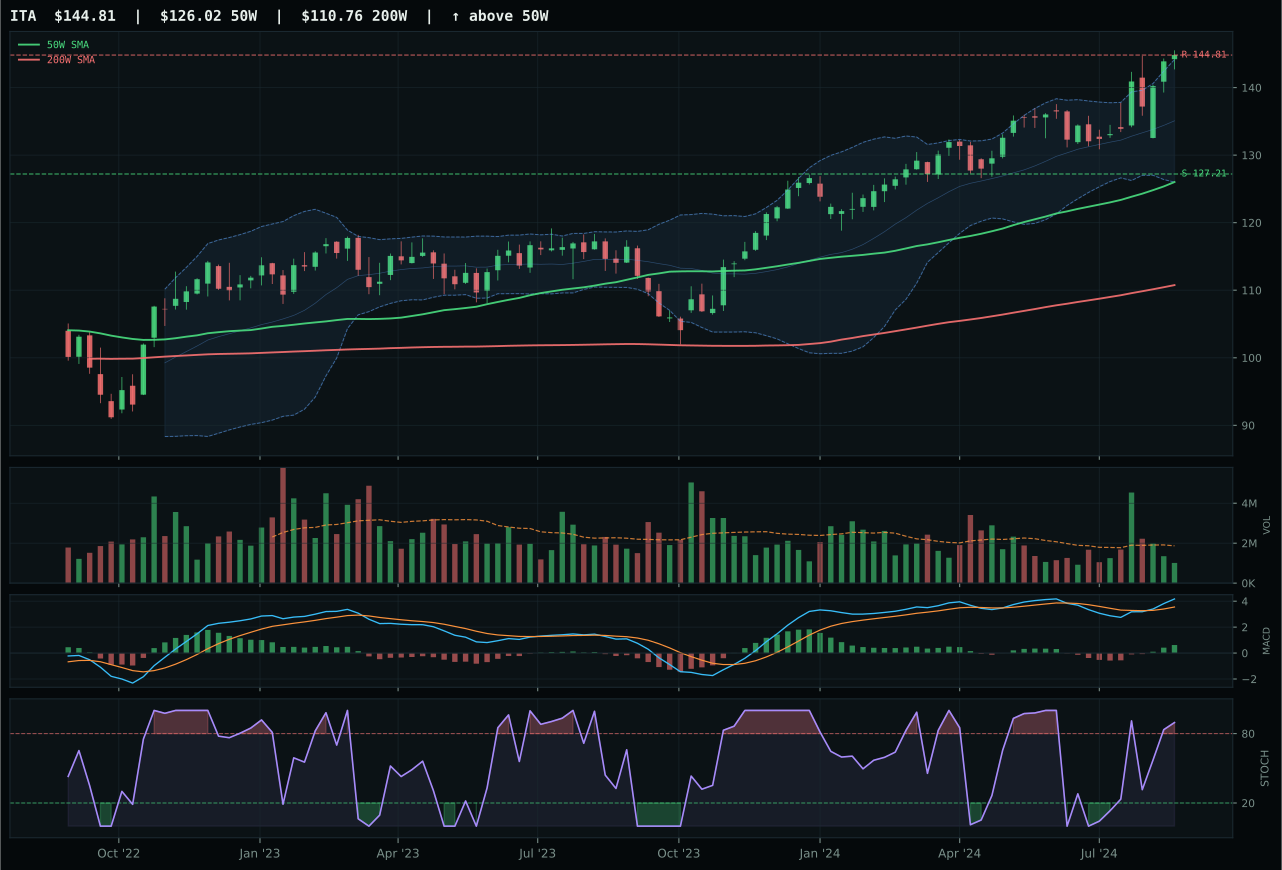
ITA has a neutral structure profile with 0.7% 13-week relative strength versus SPY.
A failed hold above support would weaken the setup.
Actionable but governed by invalidation levels.
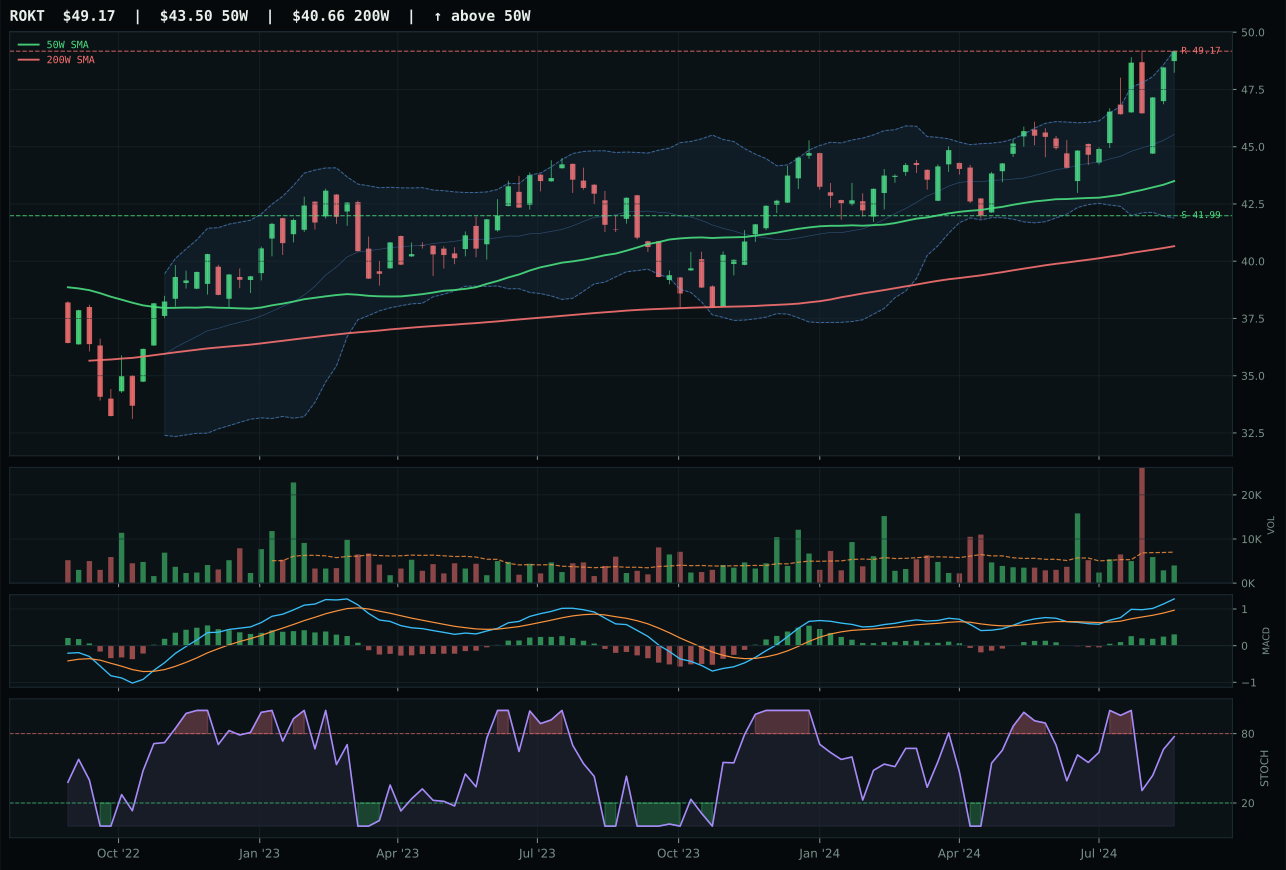
ROKT has a neutral structure profile with 1.9% 13-week relative strength versus SPY.
A failed hold above support would weaken the setup.
Tracked, but not top-2 eligible because: .
XAR wins by a razor-thin margin: 68.0 reasoned proof order versus ITA's 67.5, a 0.5-point gap that hinges entirely on category-relative strength at 0.0% (dead even within the sector) rather than ITA's negative 0.3%. Both hold identical technical scaffolding—price at 100.0 trend score, MACD bullish and improving, stochastic RSI overbought at 1.00, volume thin participation—but XAR's neutral macro fit combined with its category-level parity gives it the edge. Price sits 14.9% above the 50W in both cases, so entry risk is symmetrical; the difference is that XAR's lack of specific macro headwinds means the technical case stands on its own merit. This is not a landslide; it's a technical tiebreaker where relative strength, however marginal, matters more than cleanliness in a volatile sector like defense.
Defense & Aerospace earns 5% as a tier-2 allocation because the category score of 53.6 reflects macro-neutral exposure with solid technical sponsorship. Credit stress is actually active as a positive descriptor (+2), which means balance-sheet strength matters in this sector, and that works in XAR's favor given the capital intensity of the defense industrial base. Liquidity stress drags the category down by 4 points, yet the 51.0 macro fit suggests defensive resilience in a credit-stressed environment. Hold 5% here because the setup is clean (neutral structure, bullish MACD, overbought momentum) and because defense spending is typically recession-resistant—but recognize that the near 52W high means downside risk accelerates sharply below the 132.23 support level.
Technology — CIBR
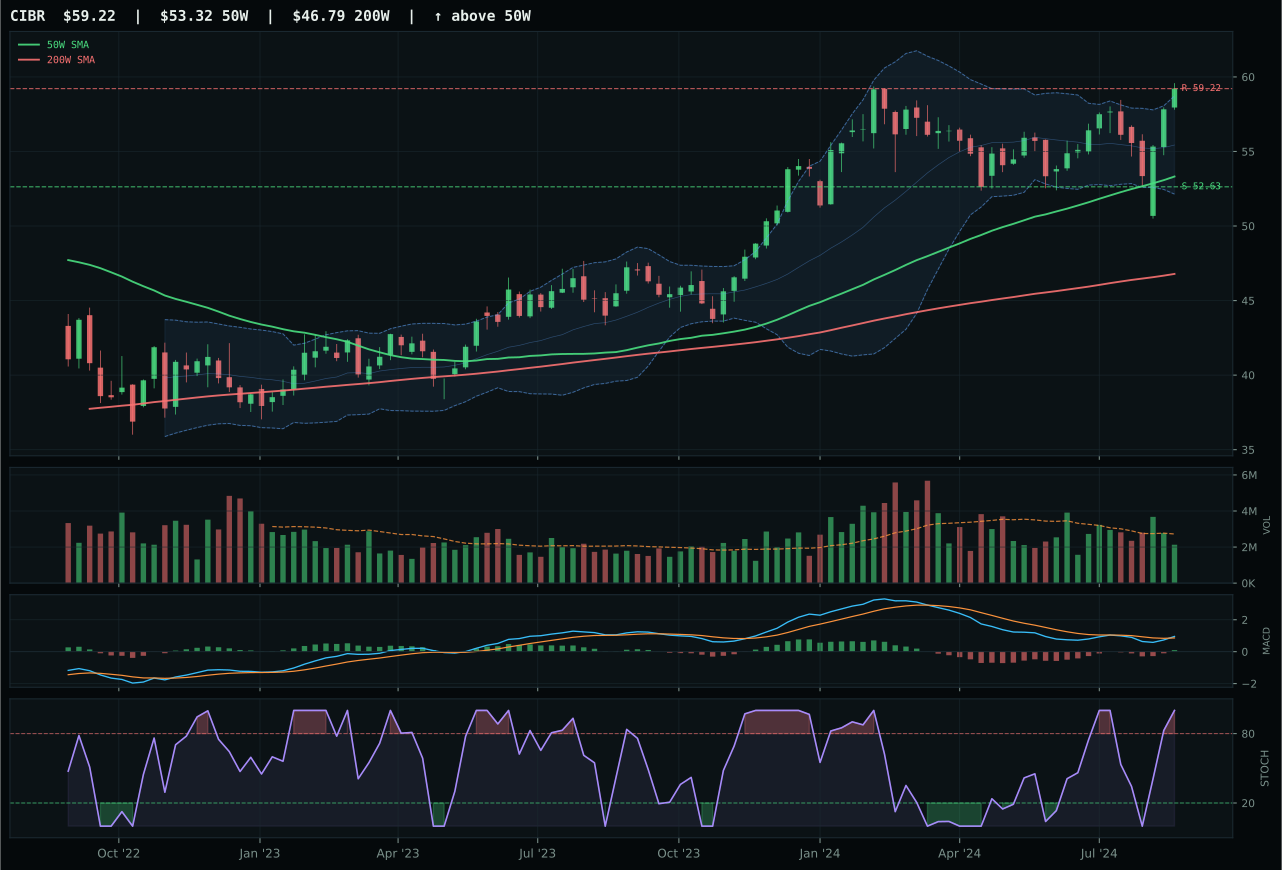
CIBR has a neutral structure profile with 0.1% 13-week relative strength versus SPY.
A failed hold above support would weaken the setup.
Actionable but governed by invalidation levels.
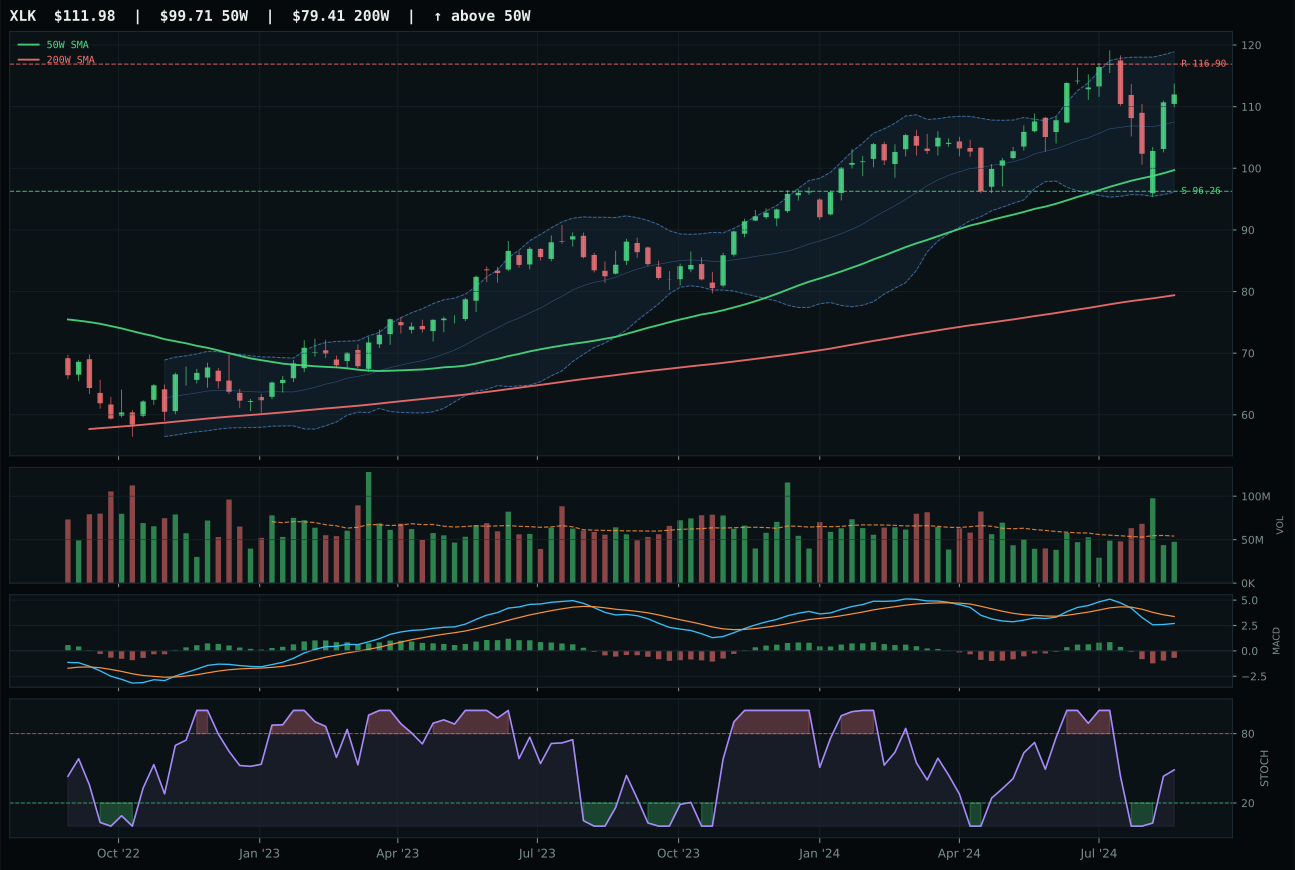
XLK has a neutral structure profile with -2.1% 13-week relative strength versus SPY.
A failed hold above support would weaken the setup.
Actionable but governed by invalidation levels.
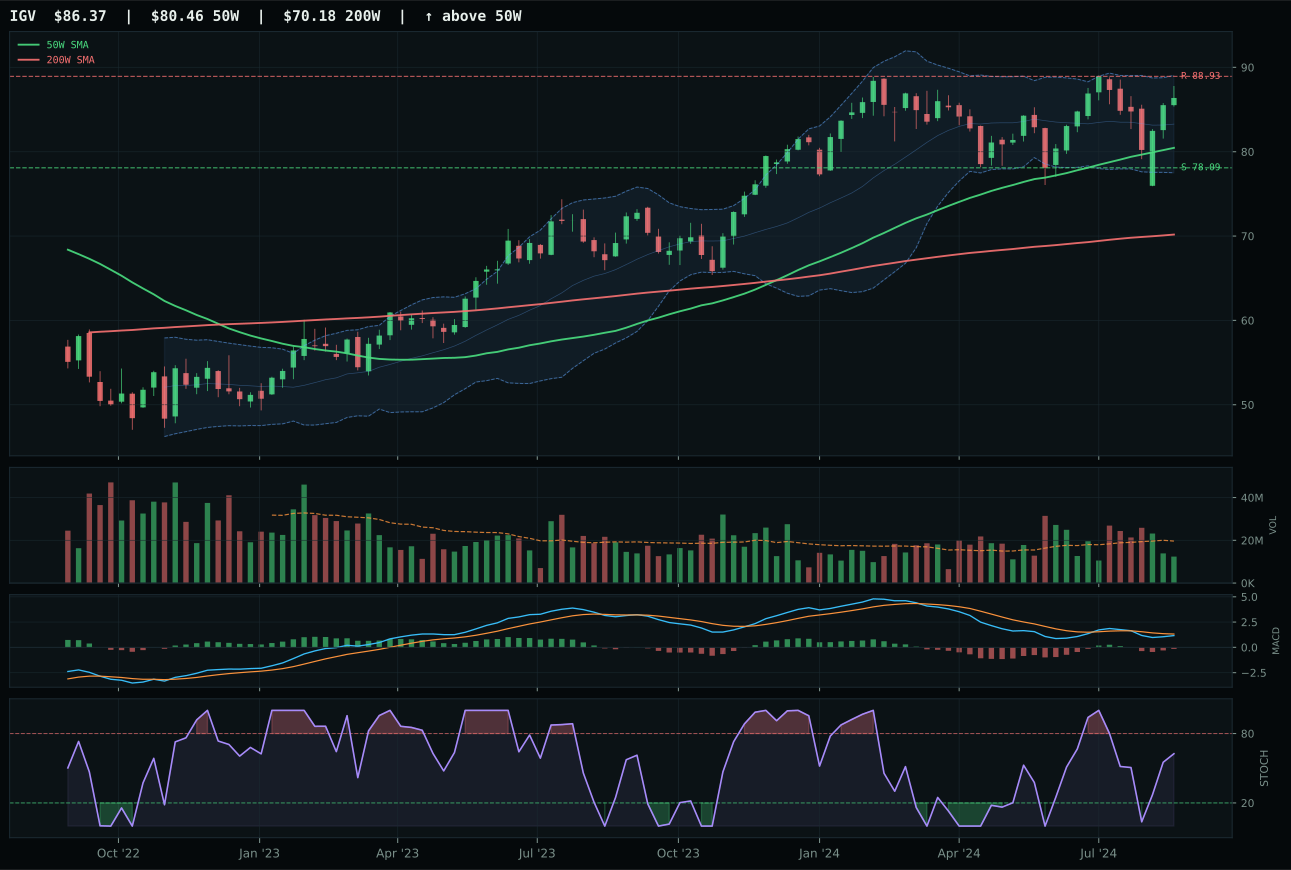
IGV has a neutral structure profile with -2.0% 13-week relative strength versus SPY.
A failed hold above support would weaken the setup.
Actionable but governed by invalidation levels.
CIBR wins because its relative strength versus the category median sits at 2.1% while XLK lags at negative 0.1%, and that spread reflects real accumulation behavior inside the cybersecurity subtheme. Price is 11.1% above the 50W, MACD is bullish and improving, and stochastic RSI confirms overbought momentum at 1.00—the combination tells you that new buyers are arriving late to an already-extended setup, which is why the timing score sits at just 59. XLK's MACD has rolled over to bearish/weakening, its stochastic RSI sits in the rising mid-zone rather than overbought, and its 4-week return of just 3.5% versus CIBR's 6.6% signals momentum has begun to fade. The spread isn't large—CIBR's composite technical evidence is 79.1 versus XLK's 44.4—but it's clean enough to justify the 10.6-point score gap.
Technology draws 5% allocation this week as a tier-2 holding, which means the setup is real but not portfolio-leading. Disinflation helps this category because cost deflation typically expands margins for software and tech services, yet liquidity stress and credit stress both weigh negatively, cutting the category-level macro fit to just 45.0. The tension is real: momentum and relative strength inside cybersecurity point to genuine buyer sponsorship, but SPY-relative strength at 0.1% tells you this category is not outperforming the broad market in a disinflation regime. Hold it because the technical proof order favors CIBR cleanly at 69.3, and because the 5% sleeve offers asymmetric exposure if credit conditions stabilize—but don't overweight it yet.
AI — BOTZ
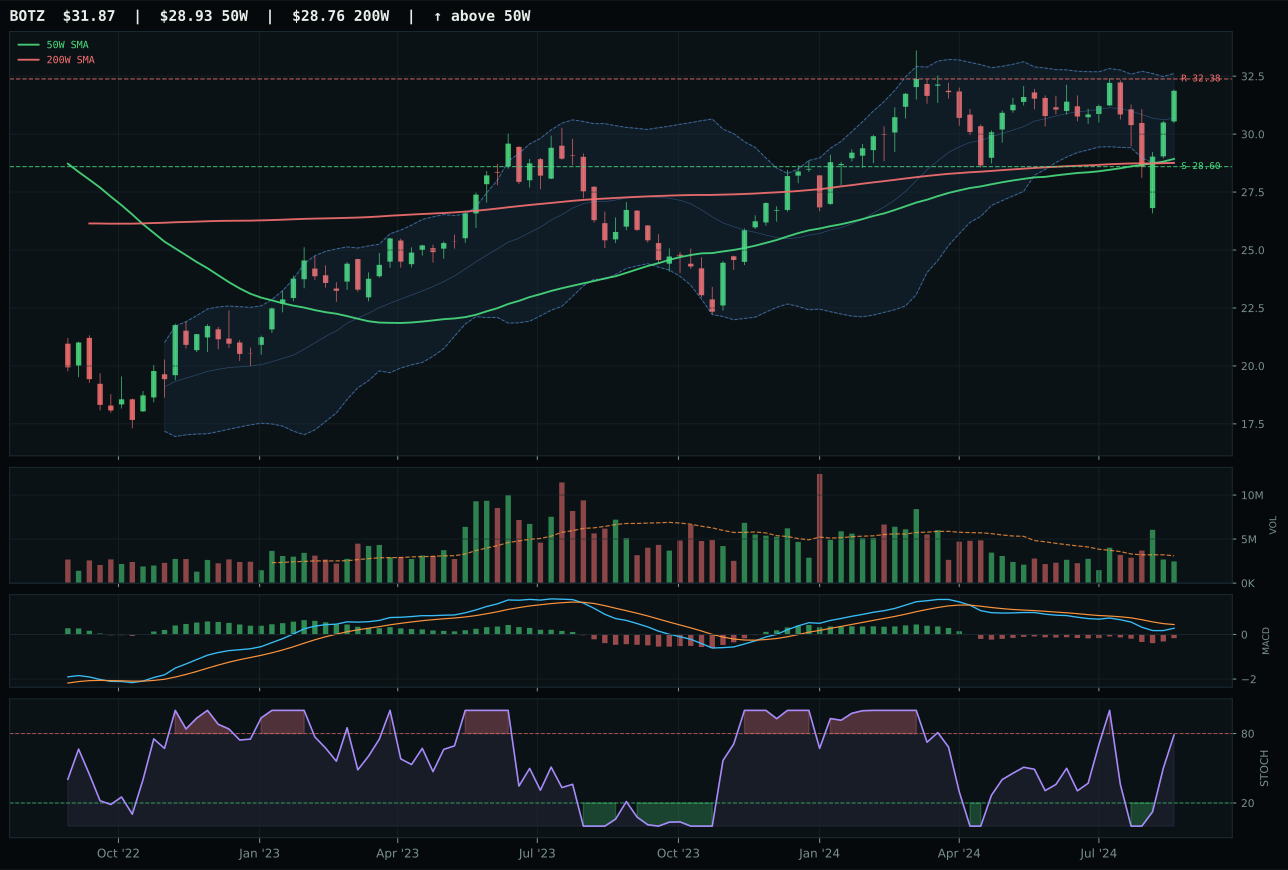
BOTZ has a neutral structure profile with -5.1% 13-week relative strength versus SPY.
A failed hold above support would weaken the setup.
Actionable but governed by invalidation levels.
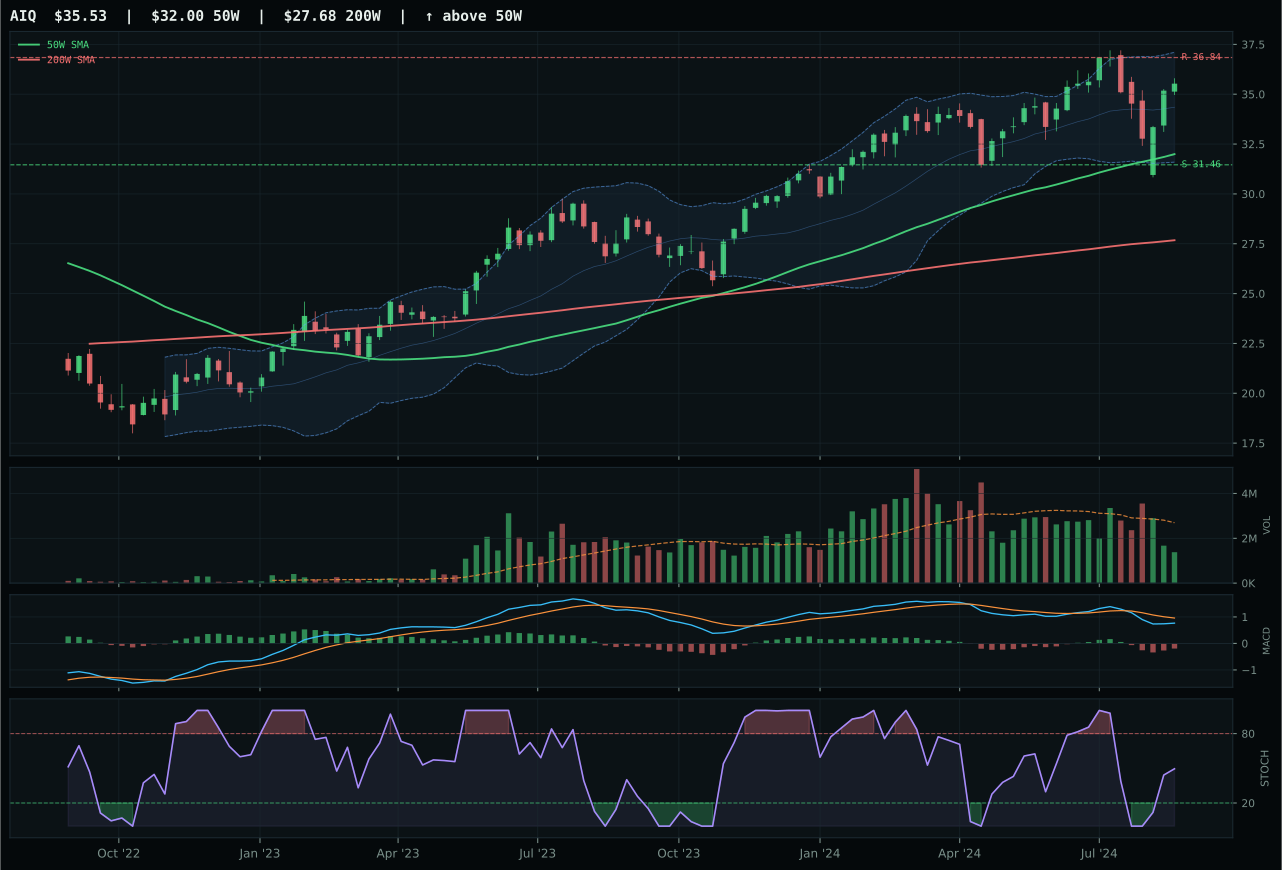
AIQ has a neutral structure profile with -2.9% 13-week relative strength versus SPY.
A failed hold above support would weaken the setup.
Actionable but governed by invalidation levels.
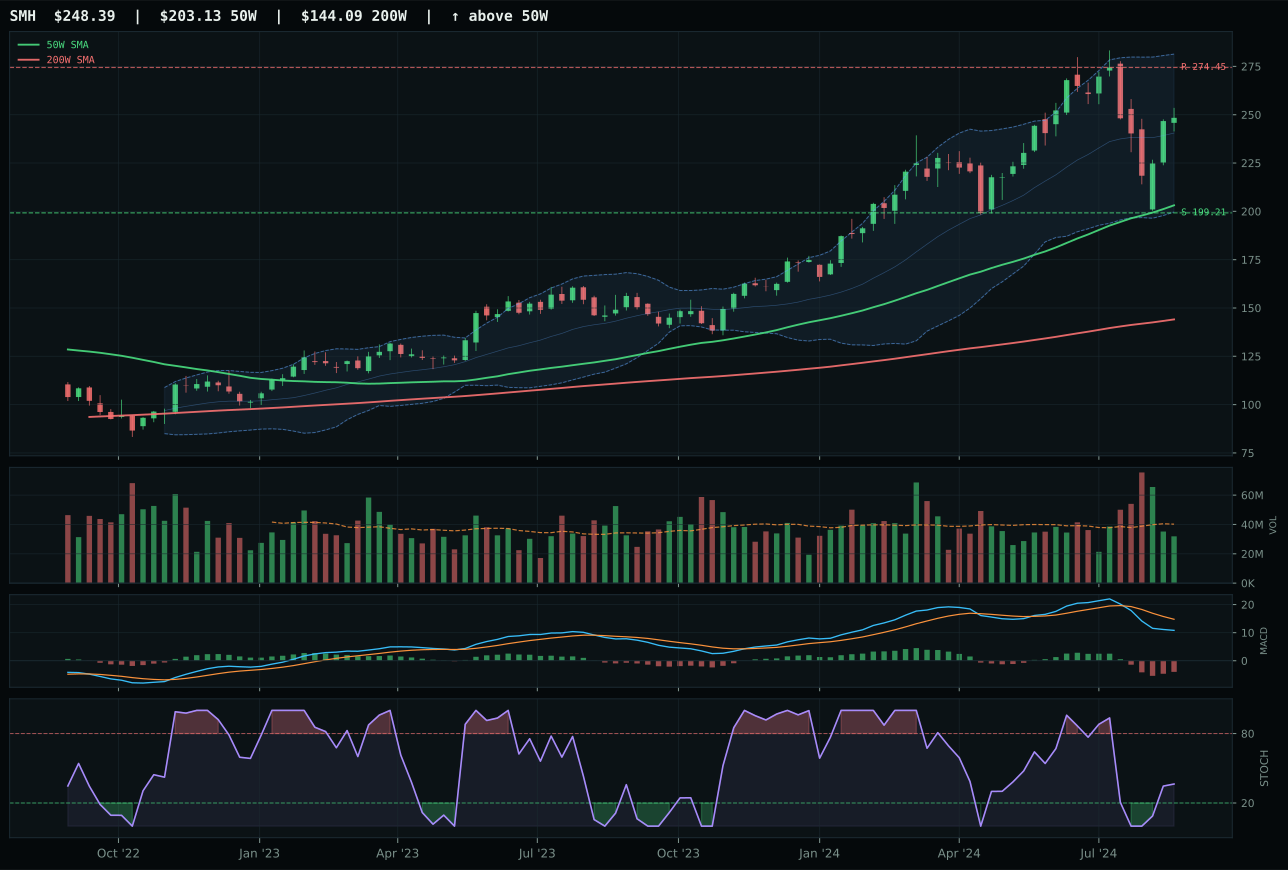
SMH has a vertical extension profile with -4.5% 13-week relative strength versus SPY.
A failed hold above support would weaken the setup.
Actionable but governed by invalidation levels.
BOTZ edges out AIQ because its timing score of 83.0 versus AIQ's 78.0 reflects proximity to decision-zone support and a setup that rewards patience over chasing extended moves. BOTZ's bearish but improving MACD is performing better than AIQ's outright bearish/weakening signature, and at 0.79x 20-week volume (neutral), it carries better conviction than AIQ's thin participation: buyers are neither fleeing nor forcing the issue. The -5.1% SPY-relative strength and -0.6% category-relative strength position BOTZ as the least-damaged robotics exposure in a category that is bleeding across the board; AIQ's -2.9% SPY RS looked better until you saw the thin volume and weaker structure cleanness of 74.3 versus 76.1. BOTZ's 1.1% 13-week return is anemic, but its rising mid-zone stochastic RSI at 0.79 and 10.1% distance from the 50W create a defined reentry zone if buyers defend support; AIQ's rising mid-zone lacks that setup clarity. The 5.5-point score gap reflects disciplined selection within a deeply challenged category.
AI receives 5% allocation as tier-2, a slot it holds because robotics and physical automation benefit from disinflation by making capex cheaper relative to labor. Yet the category score of 30.9 reveals the real problem: liquidity stress and credit stress combine to a negative 20 points in the macro descriptor checklist, overwhelming the positive 5 from disinflation. BOTZ trades at negative 5.1% relative to SPY, the 13-week return is just 1.1%, and the composite technical evidence sits at 65.5—none of this screams conviction. This is a hold-small position because the timing setup (near support, MACD improving) offers defined risk, but AI will move to zero allocation if that 72.34 support level breaks or if liquidity conditions worsen further.
Nuclear Energy — NLR
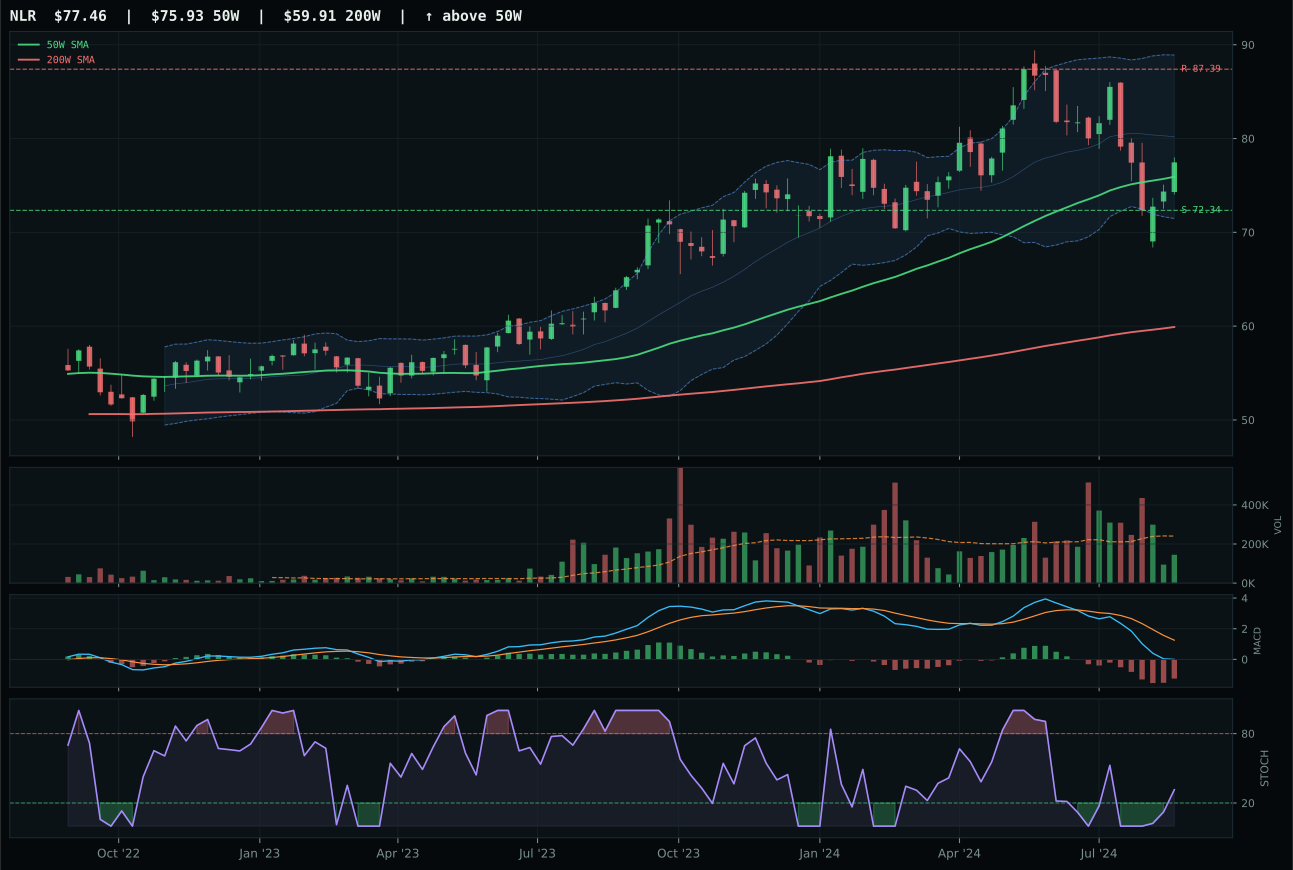
NLR has a compression near 50W profile with -16.8% 13-week relative strength versus SPY.
A failed hold above support would weaken the setup.
Actionable but governed by invalidation levels.
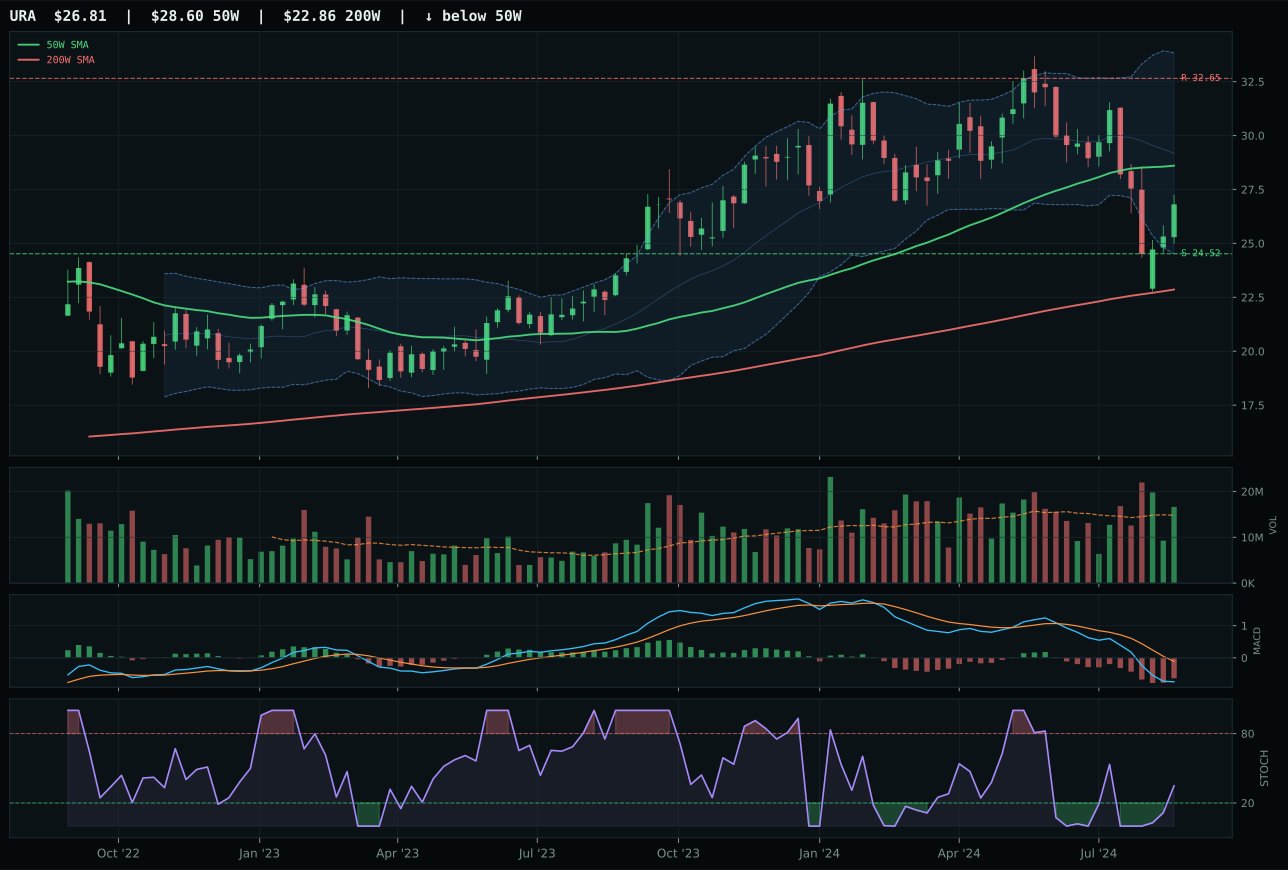
URA has a neutral structure profile with -22.4% 13-week relative strength versus SPY.
A failed hold above support would weaken the setup.
Actionable but governed by invalidation levels.
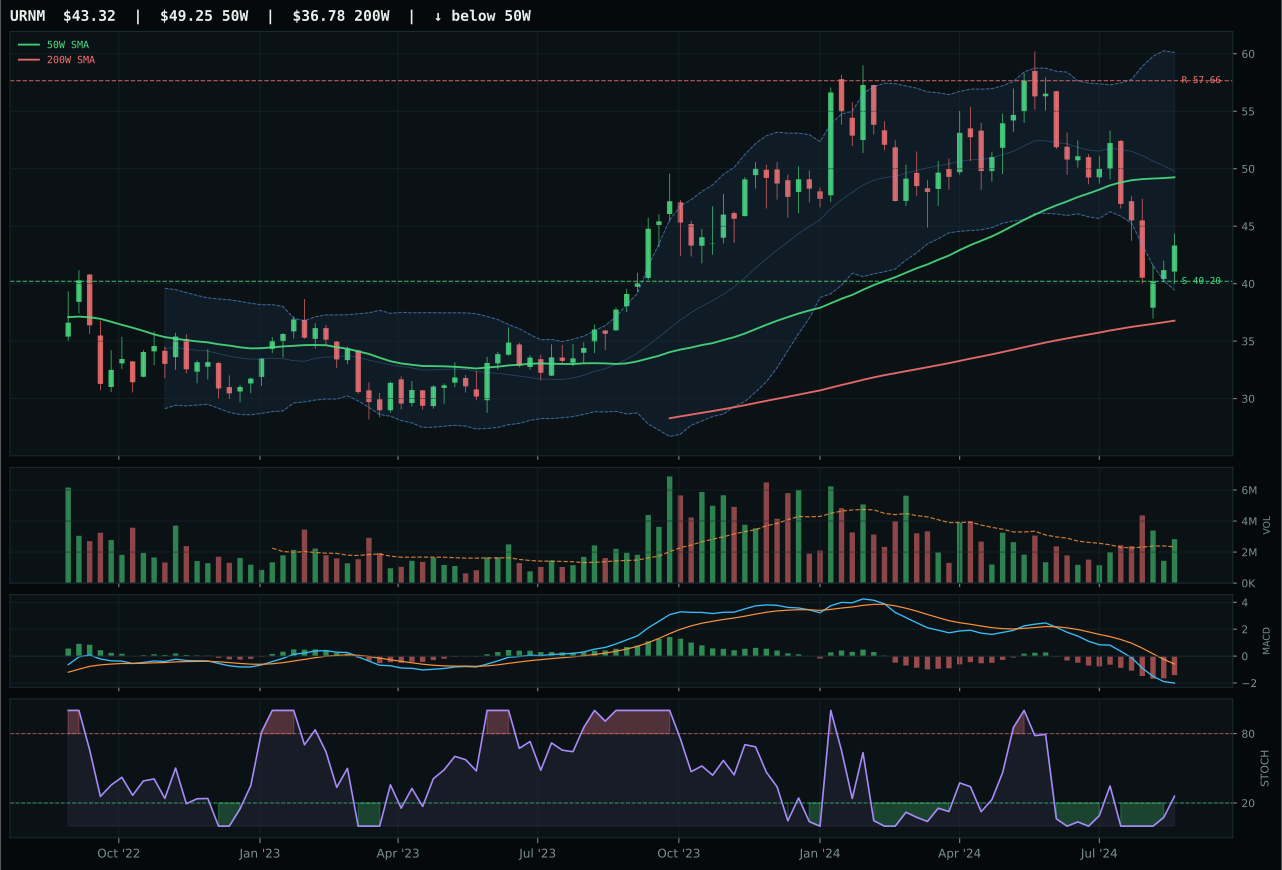
URNM has a neutral structure profile with -29.2% 13-week relative strength versus SPY.
A failed hold above support would weaken the setup.
Actionable but governed by invalidation levels.
NLR wins Nuclear Energy with a timing score of 100 because price sits 2.0% from the 50W in the middle retracement zone (Fib 0.500), creating optimal setup geometry for accumulation if buyers step in. Category-relative strength of 5.6% beats URA's 0.0% decisively, and volume at thin participation signals neither enthusiasm nor panic. MACD is bearish/weakening and momentum confirmation is nearly zero (1.2), yet the setup is clean: NLR is compressed near support with defined invalidation at 72.34. URA's timing score drops to 85.0 despite sitting in deep value (Fib closer to 0.618) because its 13-week drawdown of negative 16.2% versus NLR's negative 10.7% signals weaker relative holding power. This is a close call within a weak category, but NLR's margin of technical edge is real even if conviction is low.
Nuclear Energy earns 5% as tier-2 because the category score of 21.5 reflects compressed valuations and timing setup quality overcoming macro headwinds. Liquidity stress is active at negative 7 and credit stress at negative 5, yet nuclear power offers unique inflation and decarbonization appeal that transcends typical energy cycles. The 38.0 category-level macro fit suggests neutral-to-defensive positioning, meaning this 5% slot is appropriate for portfolio stability rather than growth. NLR's compression near the 50W (distance 2.0%) combined with defined support at 72.34 creates a low-risk entry if the market stabilizes. Hold 5% here as a hedge against long-term energy scarcity; the trade only works if support holds and momentum confirmation improves from 1.2 toward 40+, signaling institutional re-entry into the name.
Agriculture & Livestock — MOO
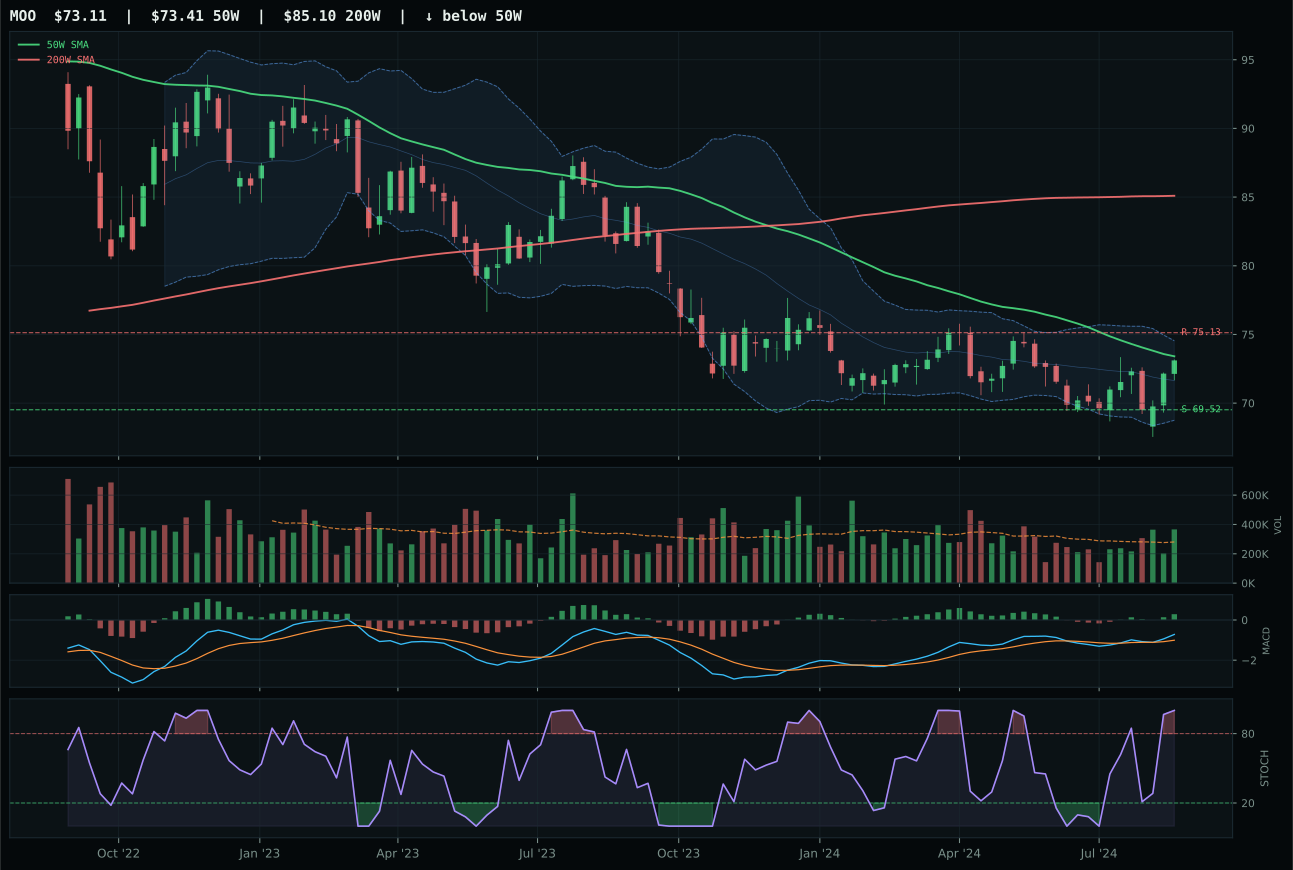
MOO has a compression near 50W profile with -5.6% 13-week relative strength versus SPY.
Extension and support failure are the main tactical risks.
Tracked, but not top-2 eligible because: structurally broken.
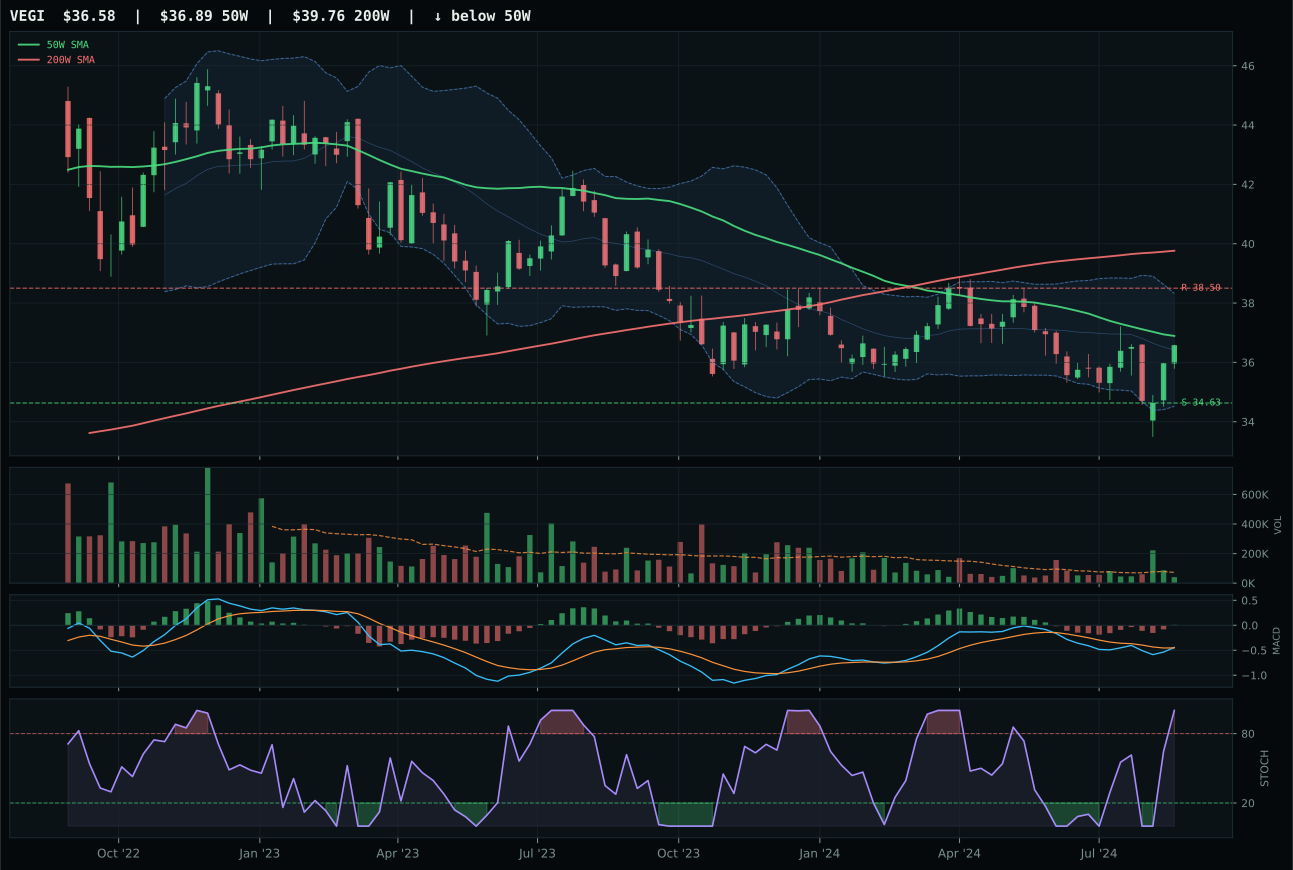
VEGI has a compression near 50W profile with -7.5% 13-week relative strength versus SPY.
Extension and support failure are the main tactical risks.
Tracked, but not top-2 eligible because: structurally broken.
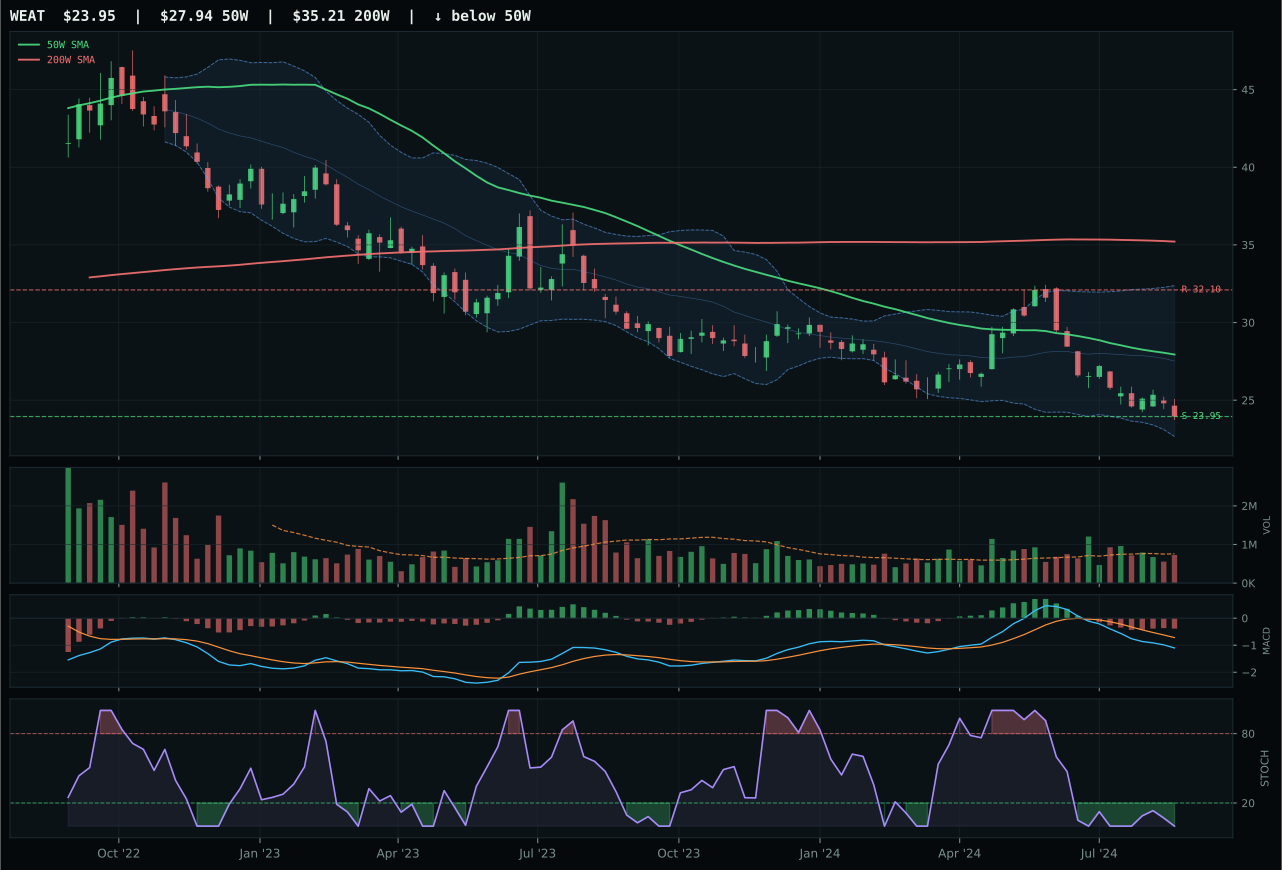
WEAT has a pullback into support profile with -31.6% 13-week relative strength versus SPY.
Extension and support failure are the main tactical risks.
Tracked, but not top-2 eligible because: structurally broken.
MOO wins a broken category by the clearest technical argument: its timing score hits a perfect 100 because price sits negative 0.4% from the 50W in a deep retracement zone (Fib 0.618), which creates maximum payoff asymmetry if support holds. Category-relative strength of 2.0% beats VEGI's 0.0%, volume at 1.30x the 20-day average provides above-average participation (versus VEGI's thin participation), and MACD is bullish and improving in both cases. However, the category score of 0.0 reflects an eligibility filter failure: disinflation pressure is active at negative 8 points, liquidity stress at negative 4, and the risk/reward structure (62.4/100) cannot overcome macro headwinds this severe. MOO is not top-2 material, but it still represents the category's best technical foundation despite the setup being structurally broken below-trend.
Agriculture receives 5% allocation even though its final category score is 0.0, which means the category technically failed eligibility yet still earns a 5% sleeve as tier-2. This apparent contradiction reflects the system's rule that failed categories still receive tier-3 and tier-2 allocations when the 50% overlay halves tier sizes: the 5% slot requires a credible representative even if the category cannot compete for top-2 capital. MOO fits that bill because its timing setup (support at 69.52, compression, MACD recovering) offers defined-risk entry if disinflation pressure eases. The trade is: hold 5% because support is clear and volume participation is real, but prepare to exit if the negative 0.4% setup breaks—disinflation headwinds are too powerful to ignore if technicals falter.
Traditional Energy — XLE
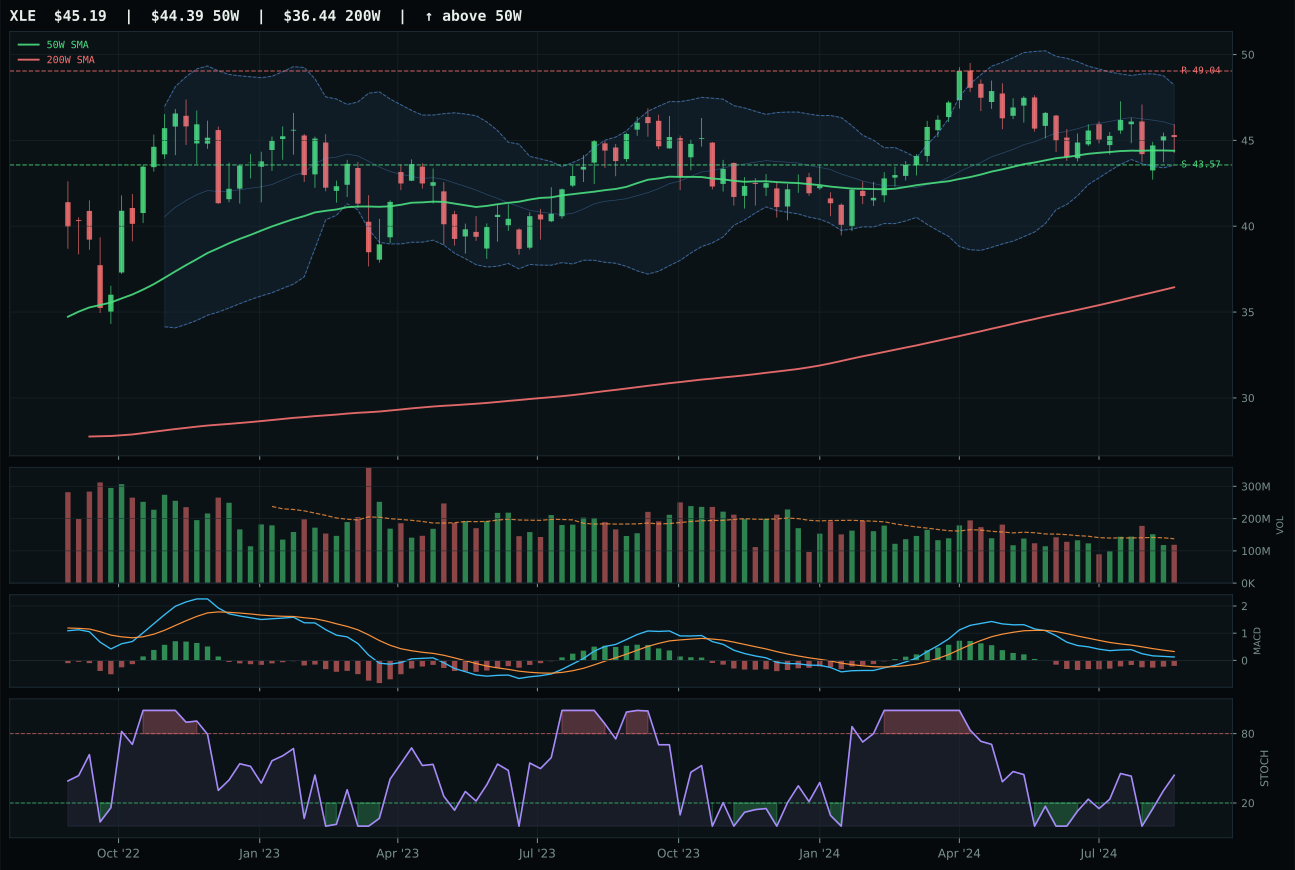
XLE has a pullback into support profile with -7.2% 13-week relative strength versus SPY.
A failed hold above support would weaken the setup.
Actionable but governed by invalidation levels.
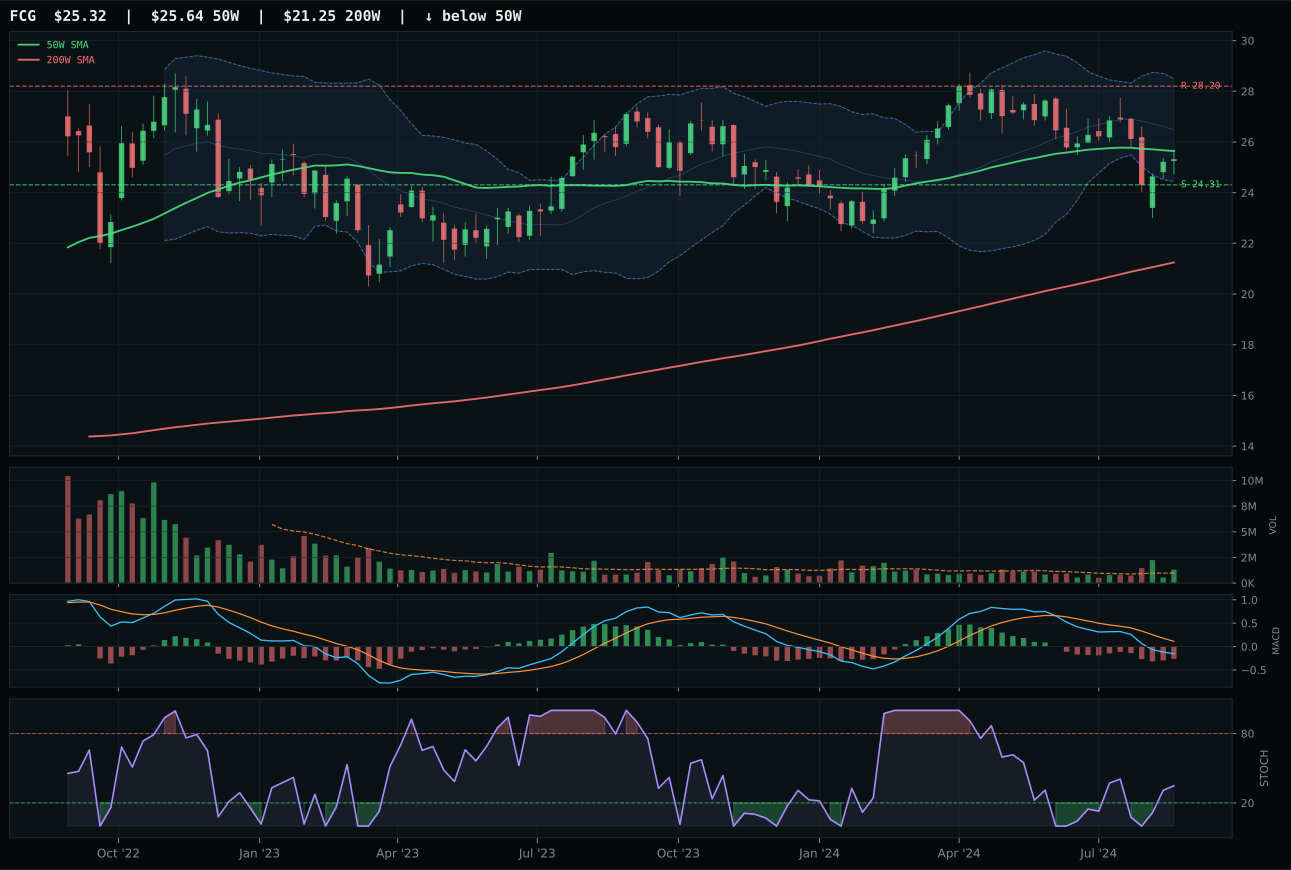
FCG has a pullback into support profile with -11.9% 13-week relative strength versus SPY.
A failed hold above support would weaken the setup.
Actionable but governed by invalidation levels.
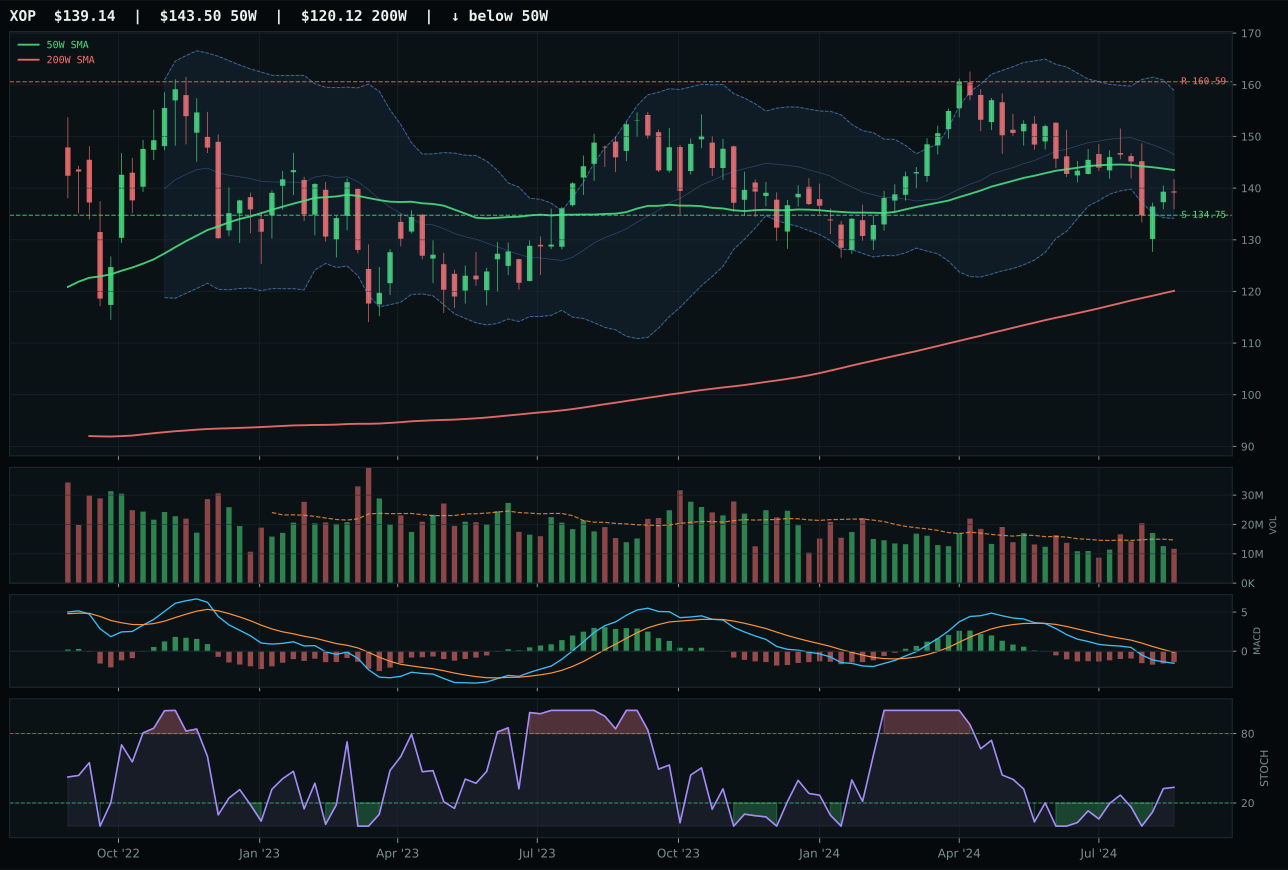
XOP has a pullback into support profile with -12.4% 13-week relative strength versus SPY.
A failed hold above support would weaken the setup.
Actionable but governed by invalidation levels.
XLE wins because its risk/reward ratio of 90.8 (downside 3.7% to support, upside negative 7.8% to resistance) creates the tightest defined-risk entry in a deeply wounded category. Price sits negative 0.4% from the 50W, which means timing hits a perfect 100, yet MACD is bearish/weakening and momentum confirmation scores just 26.2. XLE's category-relative strength of 4.7% versus FCG's 0.0% is meaningful in a broken sector: it means XLE is holding better than peers as the group compresses. Volume is neutral at 0.86x the 20-day average, providing no accumulation signal but no rejection either. This is not a strong setup; it's the least-damaged option in a category where disinflation pressure is active at negative 10 and credit stress at negative 7. XLE wins by attrition.
Traditional Energy receives 5% allocation despite a final score of 0.0, which means it earns tier-2 status purely because the system allocates every excluded category at the 5% sleeve when the overlay halves tier sizes. XLE's support at 43.57 is real, the timing setup offers defined entry, and 5% is exactly the right size for a thesis-in-repair: if the Federal Reserve's disinflation push reverses and energy prices rise, this 5% becomes valuable optionality. However, the macro fit is just 16.0, the lowest in the portfolio after Emerging Markets, so conviction is genuinely low. Treat this as a tactical hold: keep 5% in XLE because support is defined and volume is neutral (neither confirming nor rejecting), but exit immediately if support at 43.57 breaks or if downside proves to be deeper than expected in an economic slowdown.
Emerging Markets — IEMG
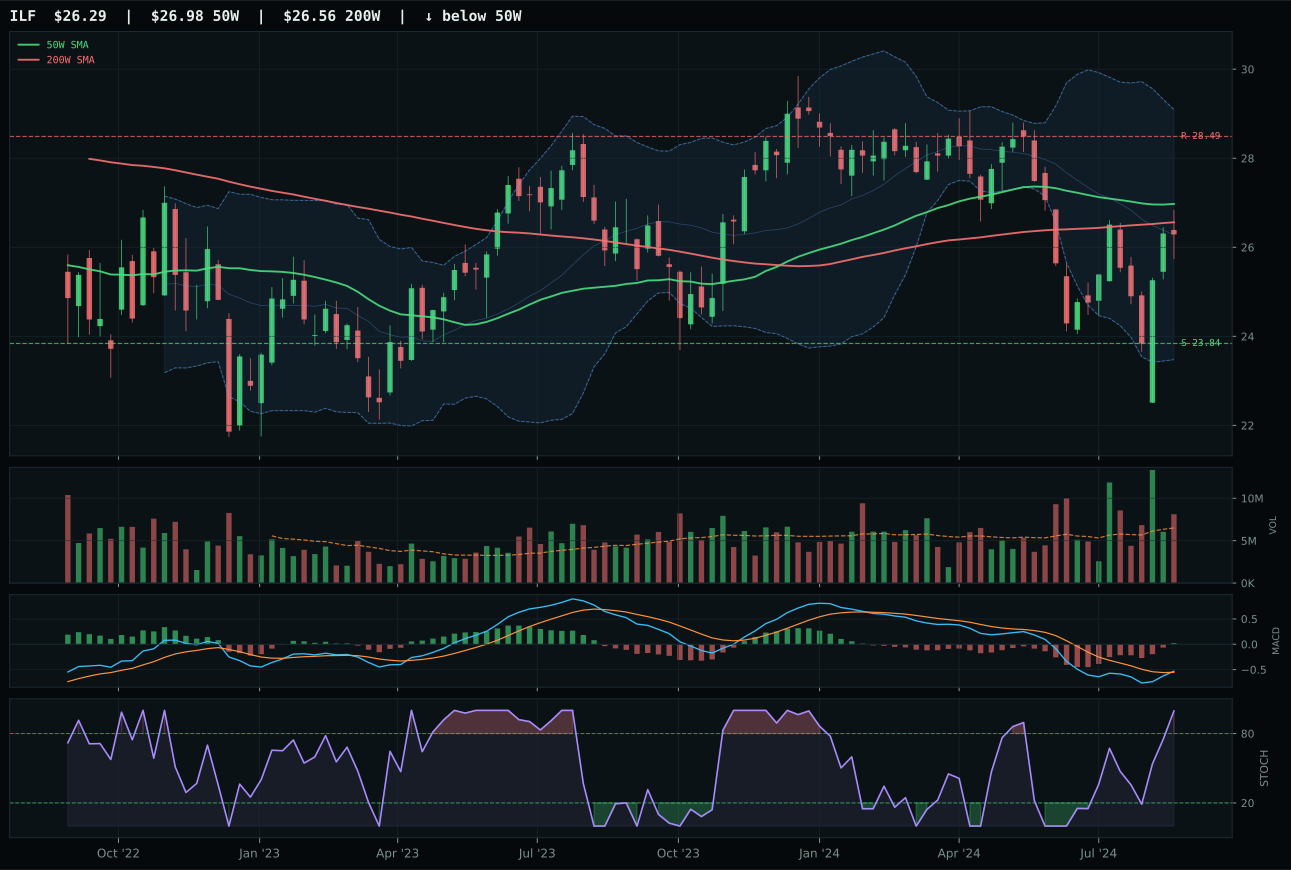
ILF has a compression near 50W profile with -10.5% 13-week relative strength versus SPY.
A failed hold above support would weaken the setup.
Actionable but governed by invalidation levels.
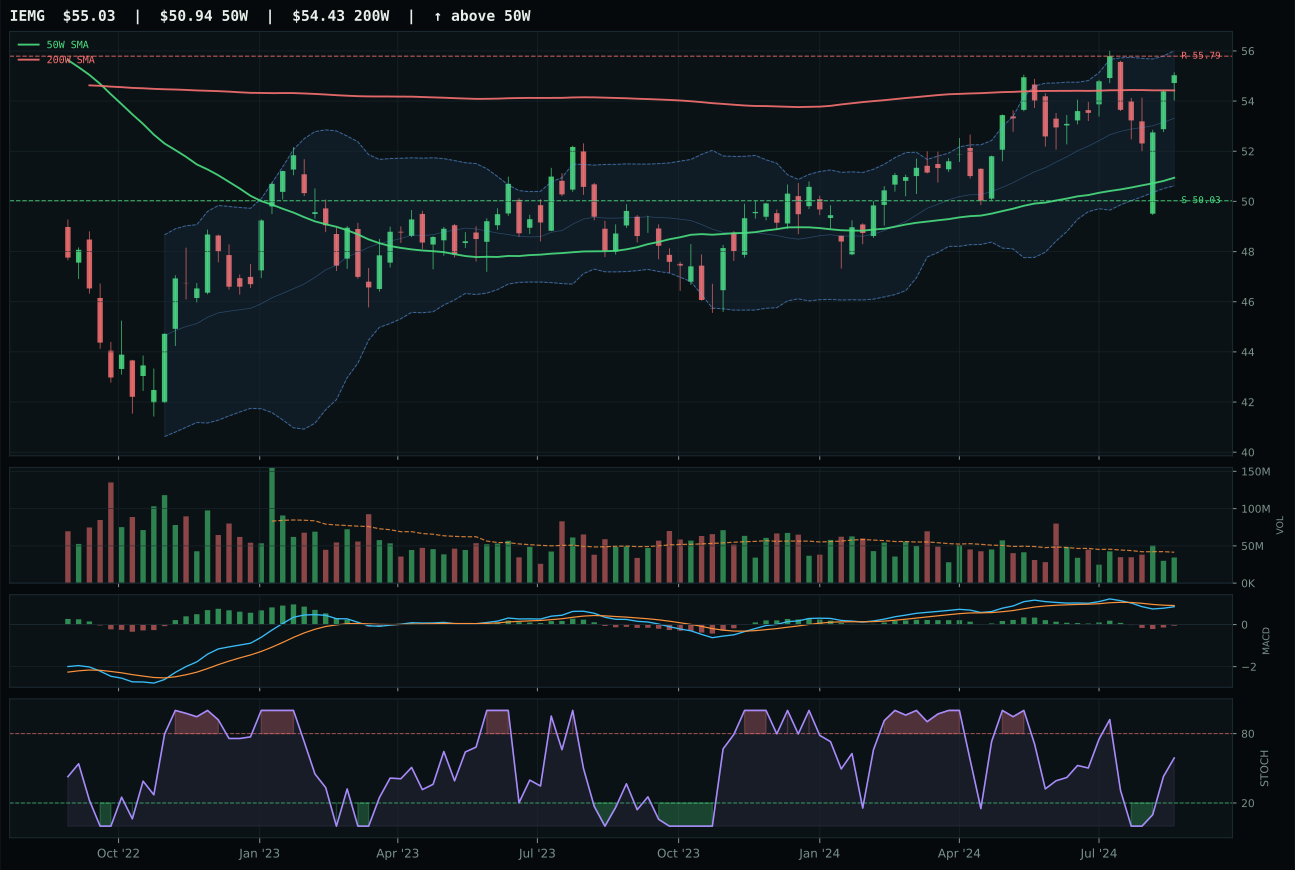
IEMG has a neutral structure profile with -4.3% 13-week relative strength versus SPY.
A failed hold above support would weaken the setup.
Actionable but governed by invalidation levels.
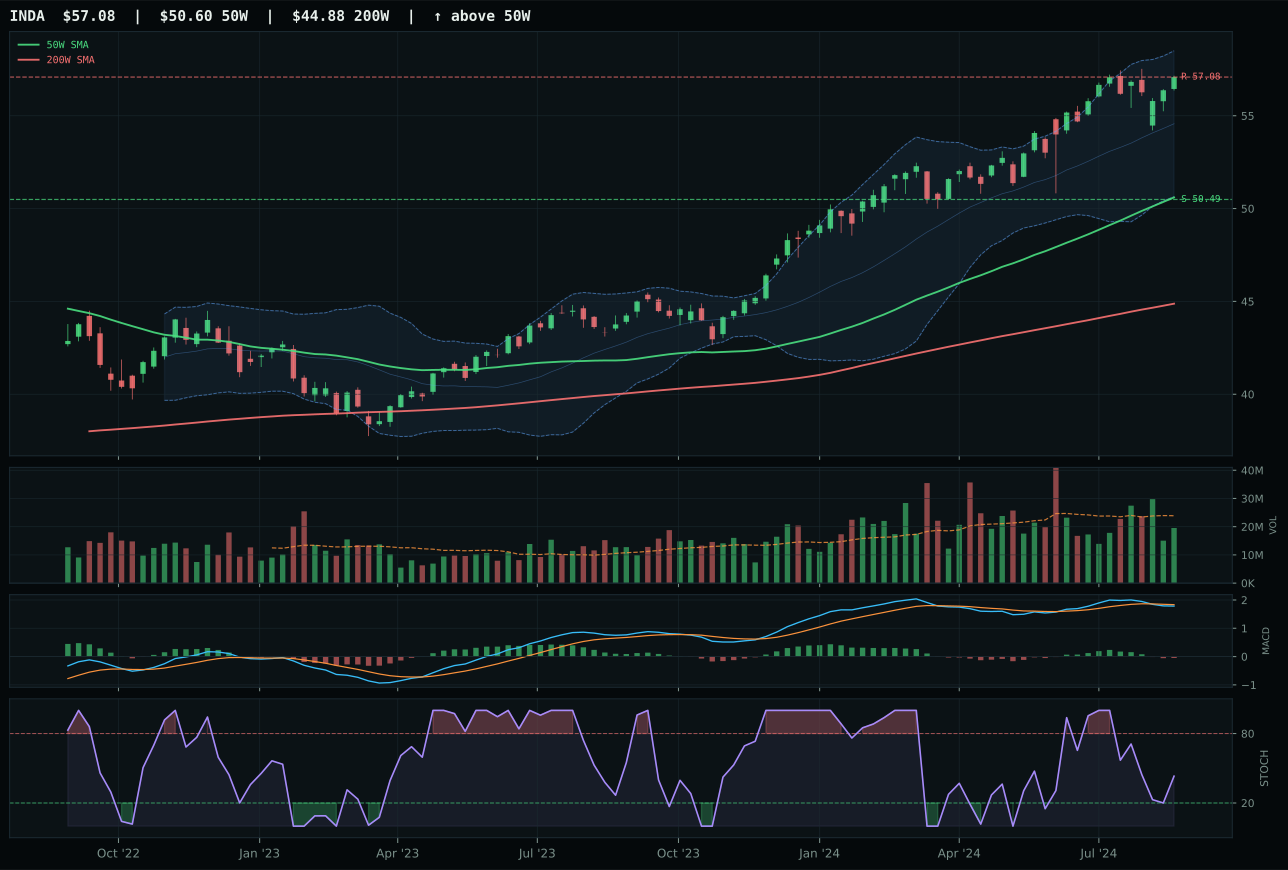
INDA has a neutral structure profile with -0.6% 13-week relative strength versus SPY.
A failed hold above support would weaken the setup.
Actionable but governed by invalidation levels.
IEMG wins by the narrowest margin in the entire portfolio: 0.4 points versus ILF. Both hold bullish price structures above the 50W and 200W, yet IEMG's structure score of 77.8 beats ILF's 71.0 because IEMG sits in neutral setup geometry while ILF is compressing near the 50W—compression can provide expansion potential but it's inherently less clean. ILF's stochastic RSI is overbought at 0.82 while IEMG's is rising mid-zone at 0.59, which means ILF has already generated the momentum pop and now carries reversal risk. Category-relative strength tells the real story: IEMG at 0.0% versus ILF at negative 6.2%, a 6.2-point gap reflecting ILF's underperformance within emerging markets specifically. This is a photo finish; either ETF is defensible, but ILF's overbought condition and underperformance to peers make IEMG the safer representative.
Emerging Markets receives 0% allocation and scores 19.8, ranking it outside the portfolio entirely. Credit stress is active at negative 10 points, liquidity stress at negative 10, and the category-level macro fit is just 30.0—among the weakest in the portfolio. IEMG trades at negative 4.3% relative to SPY, showing no conviction from the market for emerging beta, and 13-week momentum is just 1.9%. The risk/reward for Emerging Markets is poor: 39.5 versus 81.9 for Nuclear Energy or 90.8 for Traditional Energy. To earn tier-2 status, IEMG would need SPY-relative strength to improve to at least 0.0%, INDA's positive 5.6% momentum to continue sustaining category technicals, and credit stress to flip from active to neutral—none is likely in the current regime. Avoid this category entirely; the capital is better deployed in Precious Metals (59.1) or Utilities (54.7).
Industrial Metals — COPX
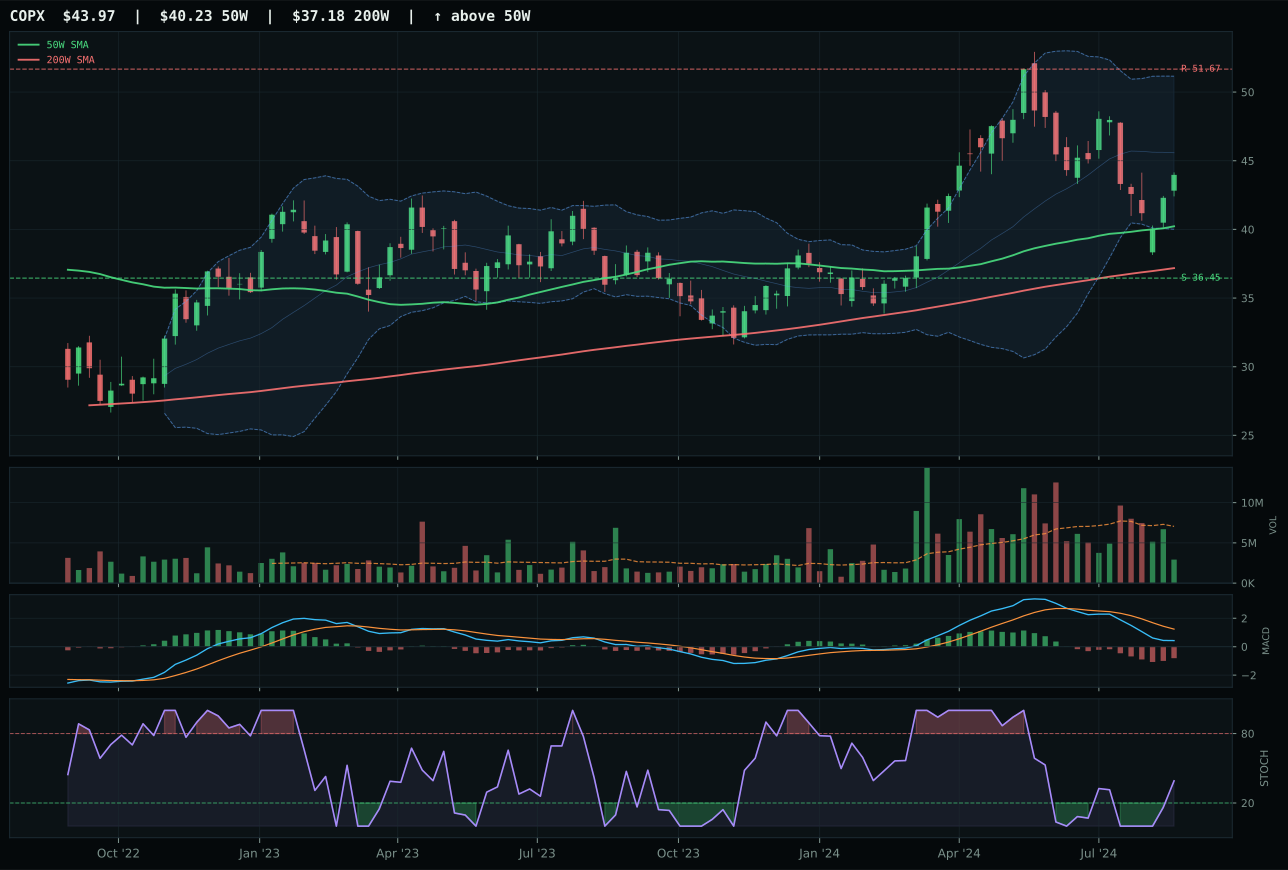
COPX has a neutral structure profile with -15.8% 13-week relative strength versus SPY.
A failed hold above support would weaken the setup.
Actionable but governed by invalidation levels.
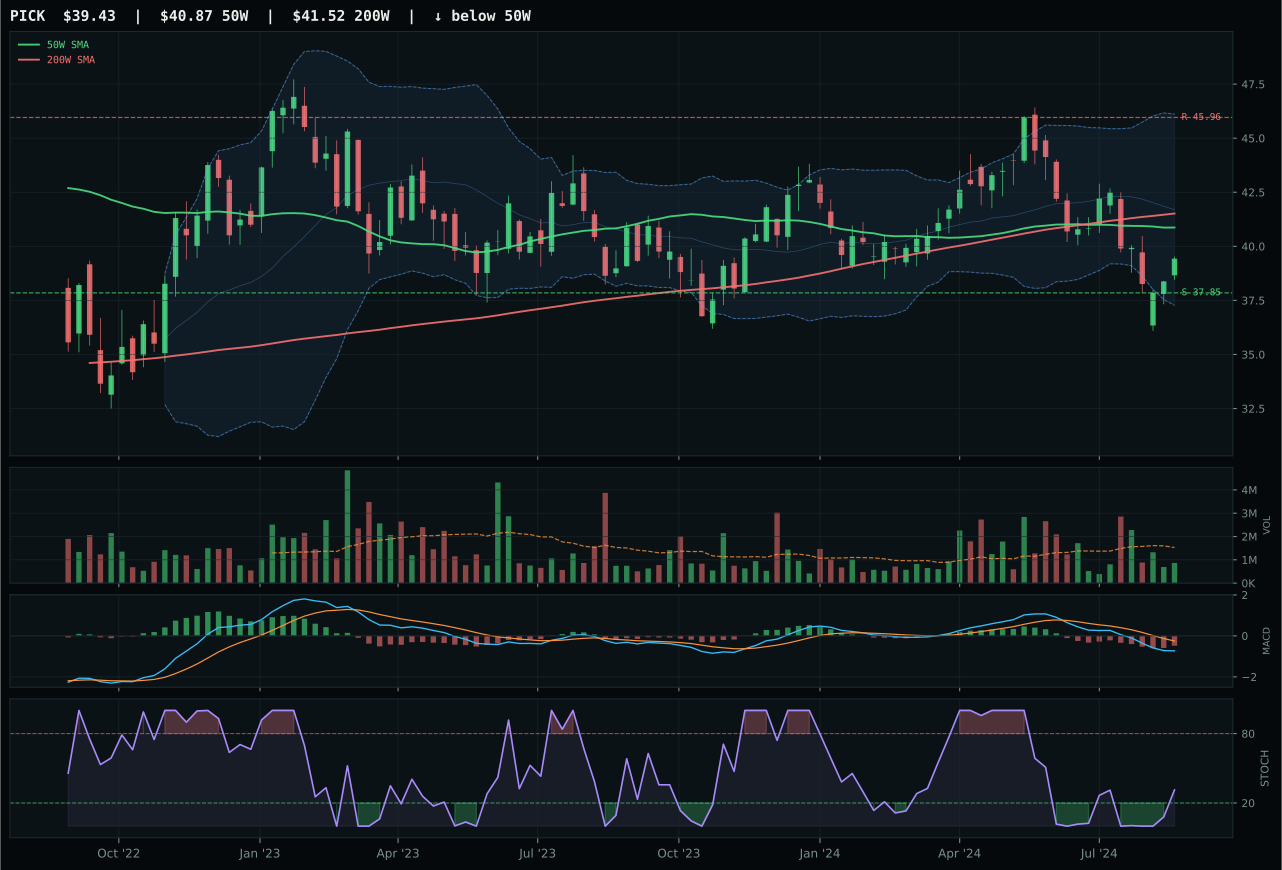
PICK has a pullback into support profile with -17.4% 13-week relative strength versus SPY.
Extension and support failure are the main tactical risks.
Tracked, but not top-2 eligible because: structurally broken.
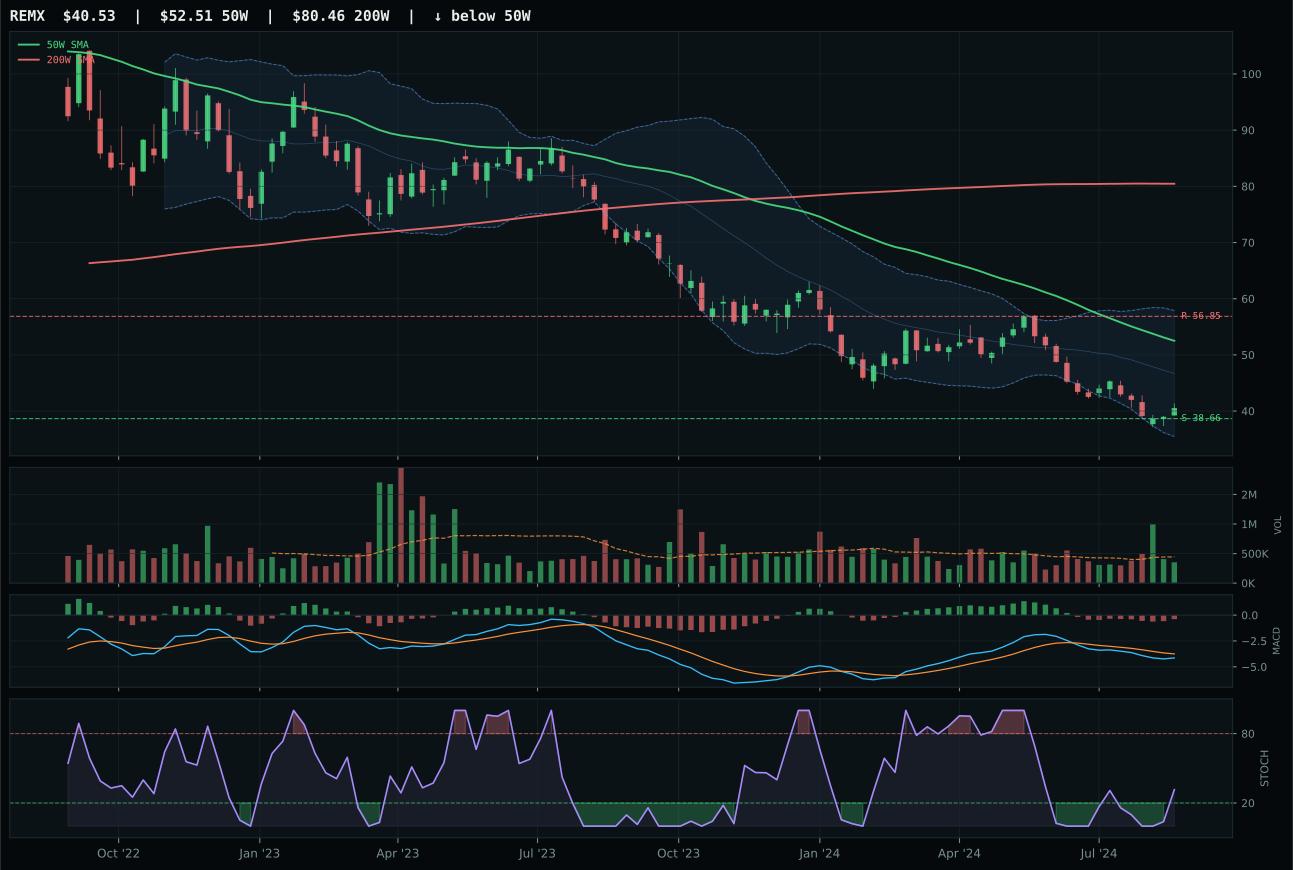
REMX has a pullback into support profile with -30.2% 13-week relative strength versus SPY.
Extension and support failure are the main tactical risks.
Tracked, but not top-2 eligible because: structurally broken.
COPX wins Industrial Metals, but the category itself scores 3.6 and earns zero allocation, which means this is a hollow victory. COPX's timing score of 85.0 reflects its Fib 0.382 location in the middle retracement zone near support, providing the only credible setup in a category where momentum confirmation is catastrophically weak at 3.7. The 13-week return is negative 9.6%, RS versus SPY is negative 15.8%, and MACD is bearish/weakening—every momentum measure fails. Volume sits at thin participation, so accumulation isn't occurring. COPX wins only because PICK's structure is even more broken (hard filter: structurally broken) and REMX trades with negative 30.2% SPY-relative strength. This is not a win; it's an indictment of the entire category.
Industrial Metals earns 0% allocation because its final score of 3.6 ranks it 9th or 10th in the allocation hierarchy, and neither credit stress nor liquidity stress support cyclical copper demand in a disinflation regime. Credit stress is active at negative 7, liquidity stress at negative 8, and the category-level macro fit is just 35.0. For COPX to earn a tier-2 slot, the 13-week return would need to turn positive, RS versus SPY would need to improve from negative 15.8% to at least negative 5%, and MACD would need to cross from bearish/weakening into bullish territory—none of that has occurred. Sit in cash on this category entirely; the risk is asymmetric to the downside if credit conditions deteriorate further and leverage in mining unwinds.