
2024-08-16
Informational purposes only. The content in this report, including allocations, analysis, and commentary, is provided solely for informational and educational purposes. It does not constitute financial advice, investment advice, trading advice, or any other type of advice. Past performance does not guarantee future results. Always conduct your own research and consult a qualified financial professional before making investment decisions.
Weekly Allocation
| Ticker | Category | Weight | Role |
|---|---|---|---|
| FBTC | 50% | Overlay | |
| XLU | Utilities & Infrastructure | 10% | Top-2 (10%) |
| GLD | Precious Metals | 10% | Top-2 (10%) |
| ITA | Defense & Aerospace | 5% | Tier-2 (5%) |
| CIBR | Technology | 5% | Tier-2 (5%) |
| AIQ | AI | 5% | Tier-2 (5%) |
| MOO | Agriculture & Livestock | 5% | Tier-2 (5%) |
| XLE | Traditional Energy | 5% | Tier-2 (5%) |
| NLR | Nuclear Energy | 5% | Tier-2 (5%) |
Trade Instructions — Monday Open
Sell the tranche from 2024-07-19 (completing its 4-week hold). Buy the new tranche. Instructions show net portfolio changes — same-asset positions cancel, weight changes show the delta.
| Action | Ticker | Instruction |
|---|---|---|
| SELL | IGV | Sell entire IGV position (2.50% of portfolio) |
| SELL | BOTZ | Sell 67% of BOTZ position (reduce 3.75% → 1.25%) |
| SELL | IGF | Sell entire IGF position (1.25% of portfolio) |
| SELL | INDA | Sell 33% of INDA position (reduce 3.75% → 2.50%) |
| SELL | XAR | Sell entire XAR position (1.25% of portfolio) |
| SELL | COPX | Sell 50% of COPX position (reduce 2.50% → 1.25%) |
| BUY | GLD | Buy GLD — 12.50% of freed cash (adds 1.25% to portfolio) |
| BUY | ITA | Buy ITA — 12.50% of freed cash (adds 1.25% to portfolio) |
| BUY | CIBR | Buy CIBR — 12.50% of freed cash (adds 1.25% to portfolio) |
| BUY | XLU | Buy XLU — 25.00% of freed cash (adds 2.50% to portfolio) |
| BUY | MOO | Buy MOO — 12.50% of freed cash (adds 1.25% to portfolio) |
| BUY | XLE | Buy XLE — 12.50% of freed cash (adds 1.25% to portfolio) |
| BUY | AIQ | Buy AIQ — 12.50% of freed cash (adds 1.25% to portfolio) |
Current Portfolio After Trade
Combined holdings across all 4 active tranches. Each tranche is 25% of the portfolio.
| Ticker | % of Portfolio | Weight Bar |
|---|---|---|
| FBTC | 50.00% | |
| GLD | 8.75% | |
| XLU | 7.50% | |
| ITA | 6.25% | |
| NLR | 5.00% | |
| CIBR | 5.00% | |
| MOO | 3.75% | |
| XLE | 3.75% | |
| INDA | 2.50% | |
| PAVE | 2.50% | |
| AIQ | 2.50% | |
| BOTZ | 1.25% | |
| COPX | 1.25% |
Macro Regime — Disinflation
Macro Evidence Charts
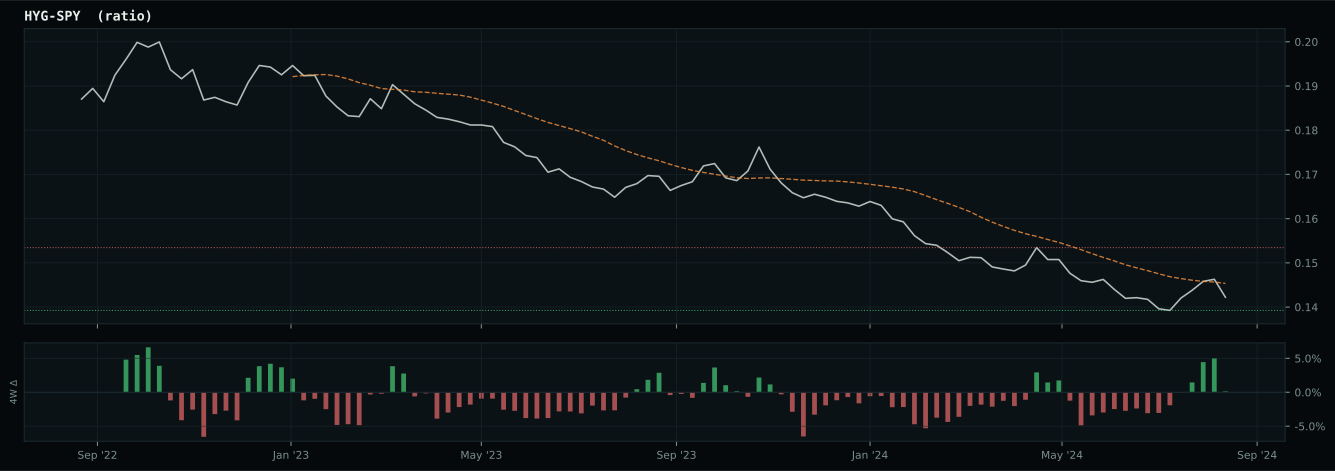
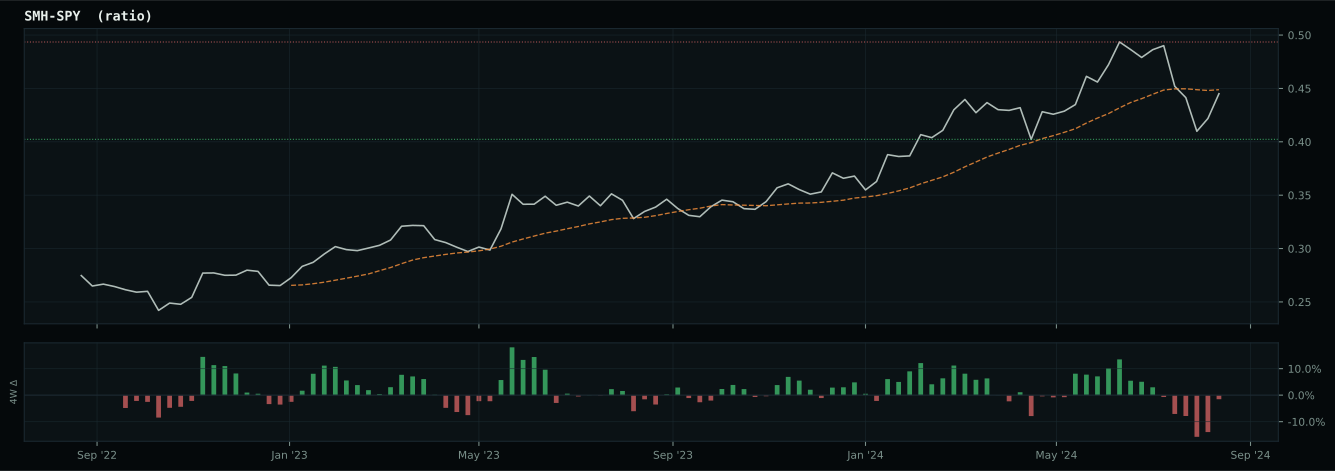
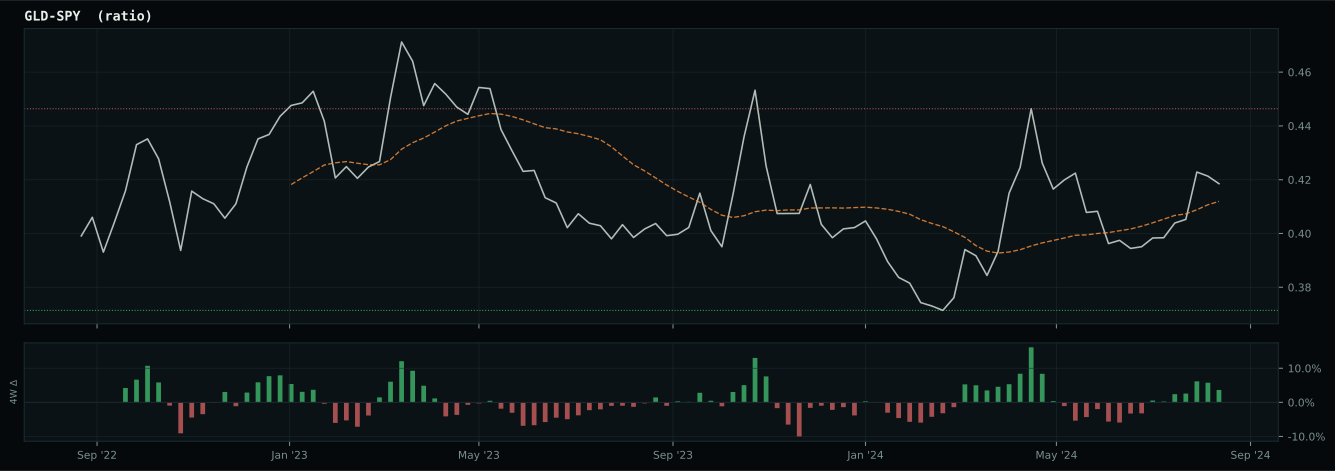
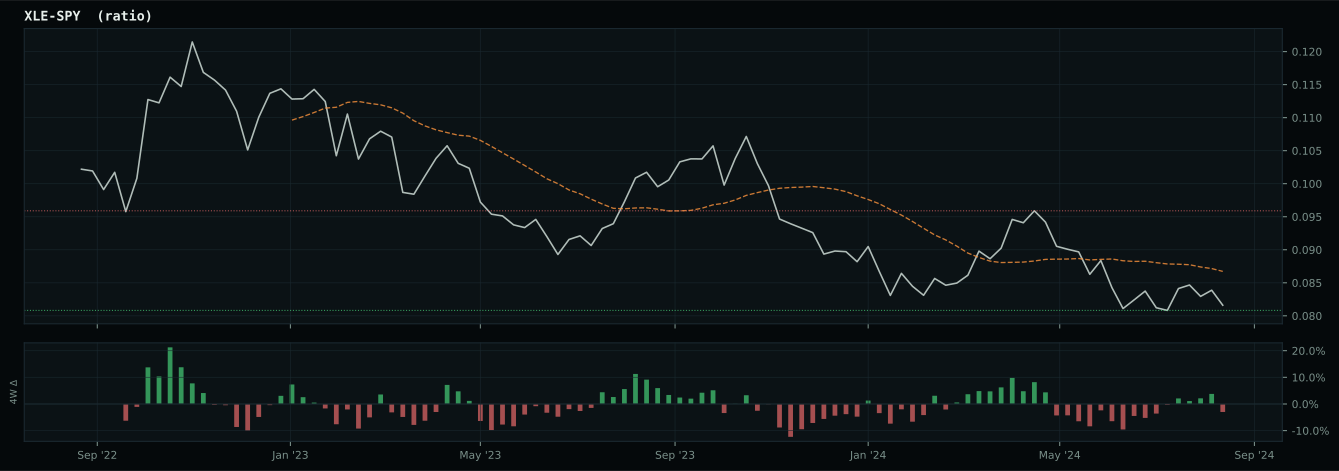
Market-implied signals behind the macro regime scores. Each ratio compares two assets; the direction and slope of the ratio is what the macro engine reads.
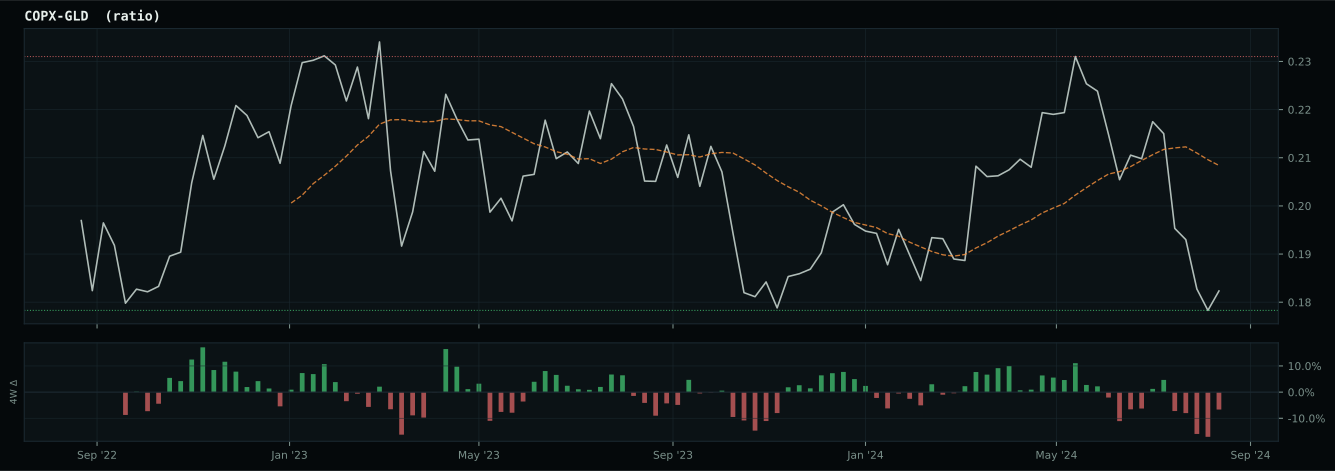
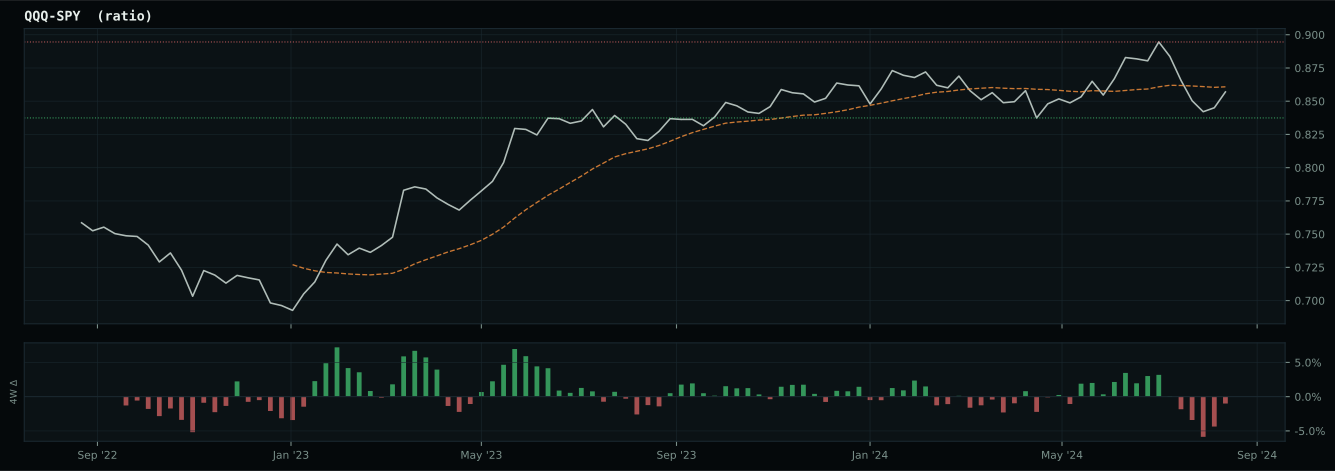
Crypto Regime — TrendBTC
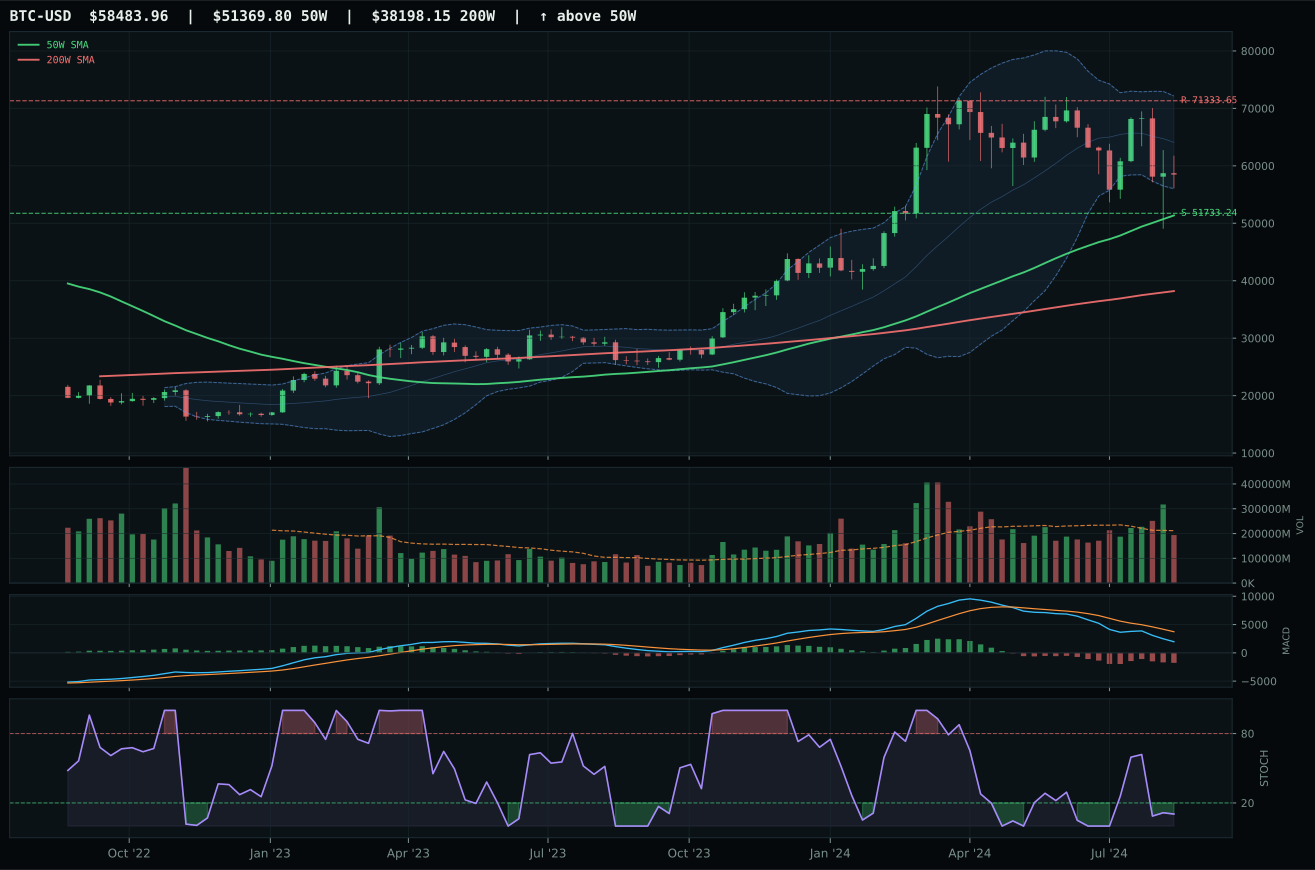
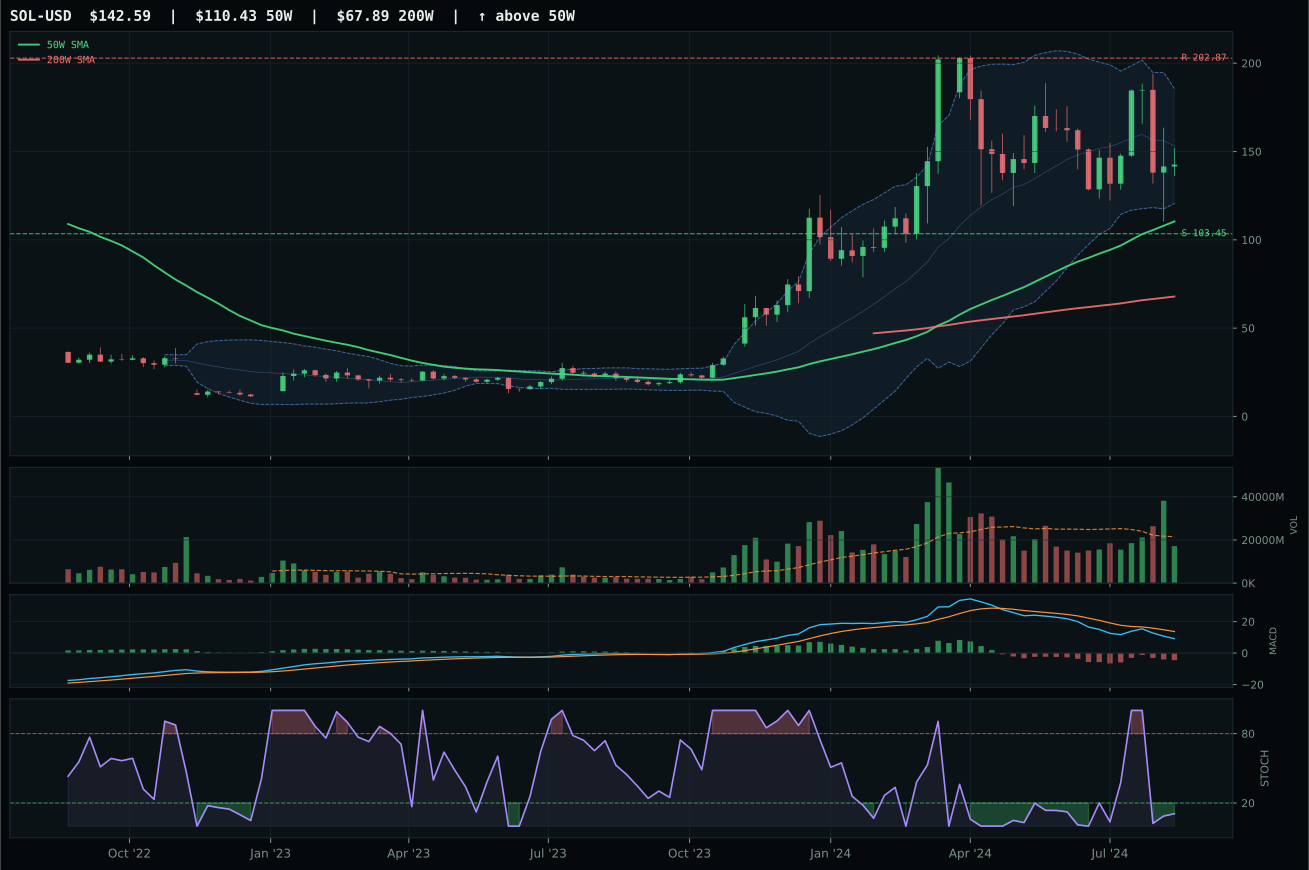
ValueBTC not armed: BTC has not made the first post-breakdown touch of the 200W buy zone after losing the 50W
TrendBTC confirmed: 2 consecutive closes above rising/flat 50W SMA
one or more available conditions failed
Category Rankings
| Rank | Category | Winner | Score | Alloc | 4W Ret | Peers (4W) |
|---|---|---|---|---|---|---|
| 1 | Utilities & Infrastructure | XLU | 62.5 | 20% | +5.74% | IGF +4.2% · PAVE +2.2% |
| 2 | Precious Metals | GLD | 50.2 | 20% | +3.73% | GDX +4.7% · SLV +6.9% |
| 3 | Defense & Aerospace | ITA | 49.2 | 10% | +1.19% | XAR +1.1% · ROKT -1.2% |
| 4 | Technology | CIBR | 47.7 | 10% | +0.00% | XLK -0.9% · IGV +2.3% |
| 5 | AI | AIQ | 45.0 | 10% | -0.14% | SMH -5.0% · BOTZ -0.4% |
| 6 | Nuclear Energy | NLR | 31.9 | 10% | +0.85% | URA +0.8% · URNM +0.0% |
| 7 | Emerging Markets | INDA | 16.7 | 10% | +2.83% | IEMG -1.4% · ILF -1.0% |
| 8 | Industrial Metals | COPX | 0.8 | 10% | -2.10% | PICK -0.6% · REMX -1.4% |
| 9 | Agriculture & Livestock | MOO | — | 0% | +0.39% | VEGI +2.1% · WEAT +6.3% |
| 10 | Traditional Energy | XLE | — | 0% | -4.76% | XOP -7.4% · FCG -6.4% |
Utilities & Infrastructure — XLU
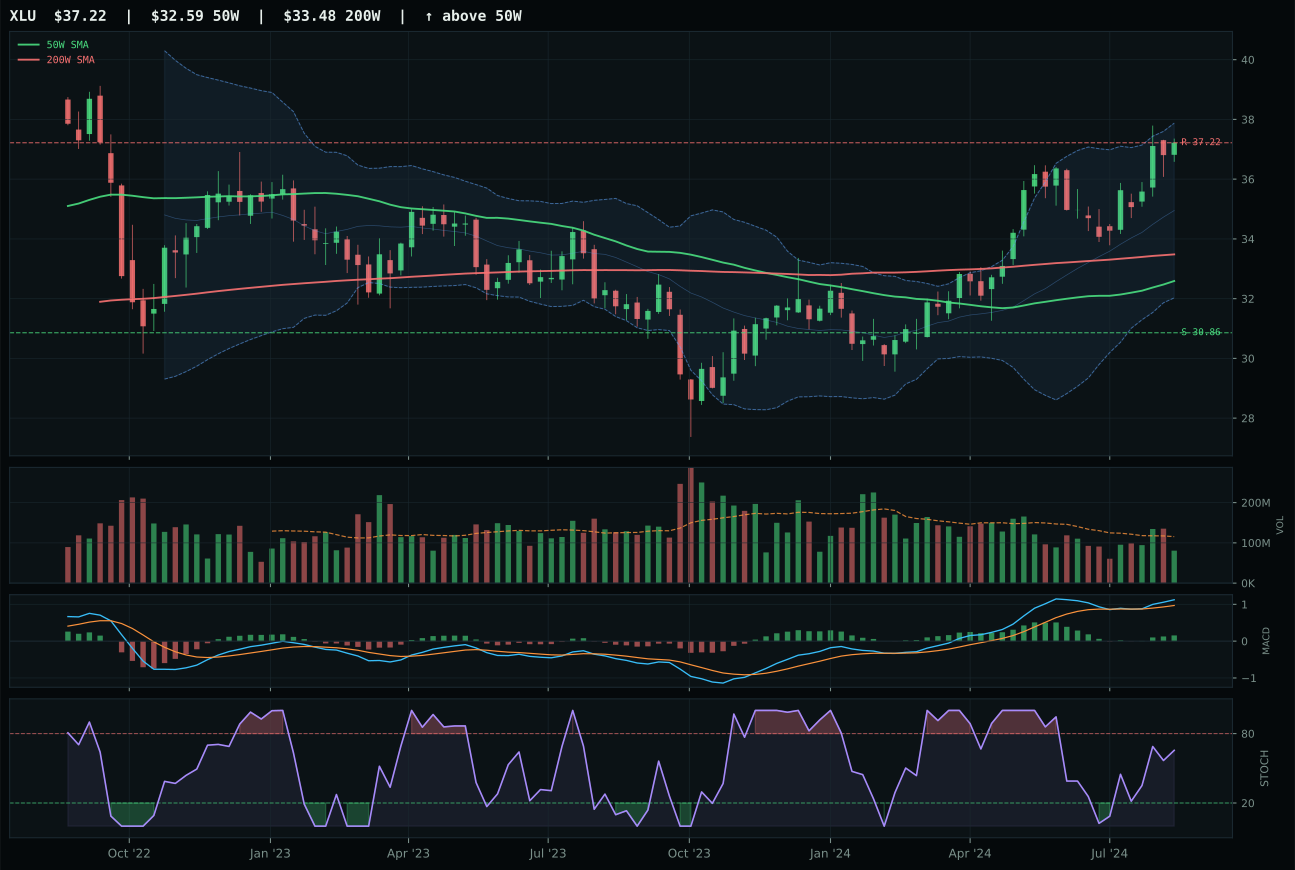
XLU has a neutral structure profile with -1.8% 13-week relative strength versus SPY.
A failed hold above support would weaken the setup.
Actionable but governed by invalidation levels.
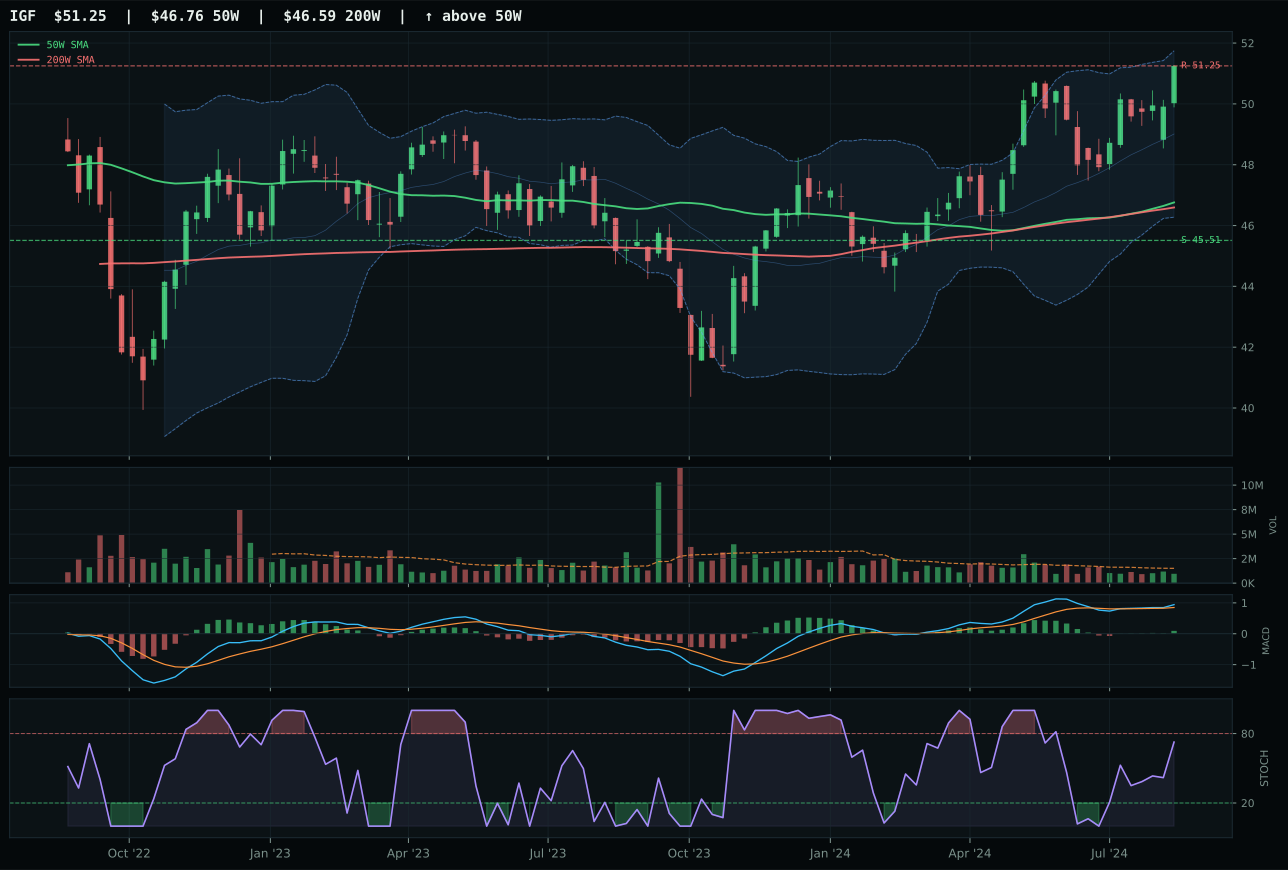
IGF has a neutral structure profile with -3.6% 13-week relative strength versus SPY.
A failed hold above support would weaken the setup.
Actionable but governed by invalidation levels.
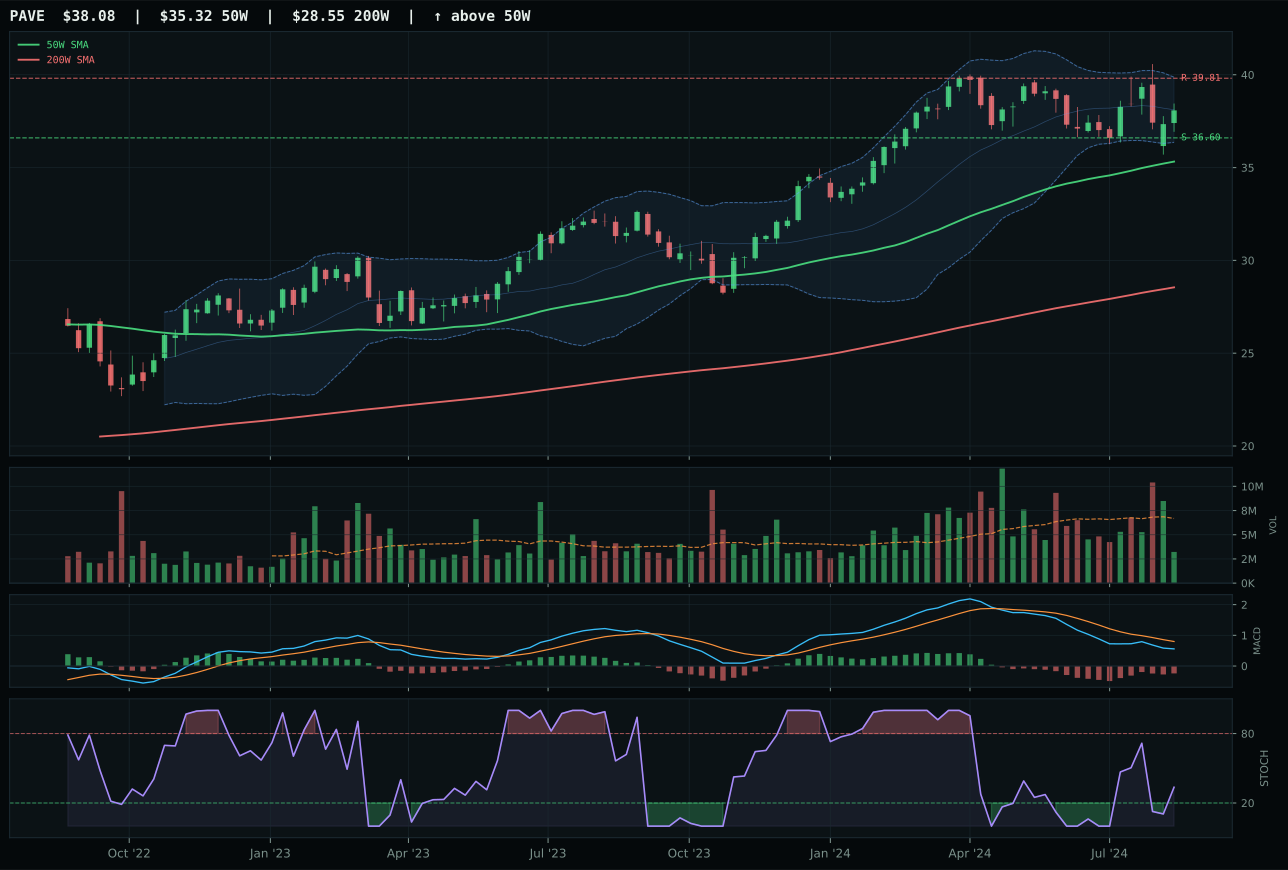
PAVE has a pullback into support profile with -7.0% 13-week relative strength versus SPY.
A failed hold above support would weaken the setup.
Actionable but governed by invalidation levels.
XLU claims the top-2 allocation (62.5 category score) by narrowly beating IGF despite nearly identical technical merit (75 and 75 composite scores), with victory delivered through 1.8% category-relative strength versus IGF's 0.0%. Both utilities and infrastructure ETFs sit 14.2-14.8% above their 50-week moving averages in neutral structure with bullish/improving MACD and rising-mid-zone stochastic RSI, but XLU's 2.9% 13-week return edges IGF's 1.1%, creating margin in a sector where basis-point differences compound. XLU's 97.3/100 trend score (price above both moving averages, 0.4% 50W slope, -1.8% SPY-relative weakness) is nearly identical to IGF's 95/100, but the tiebreaker is internal relative strength: XLU's 1.8% category-relative outperformance tells you institutional buyers are preferring regulated utility stability over infrastructure income. Volume at 0.70x for both reflects thin participation typical of defensive sectors; the MACD improvement differentiates both from the energy complex's stalled bearish conditions. XLU's 44.0/100 risk-reward (0% upside to 37.22 resistance, 20.6% downside to 30.86 support) is tighter than IGF's 48.0, signaling XLU is already pricing in base-case rate stability.
Utilities & Infrastructure earns 10% allocation (62.5 category score, tied with Precious Metals at the top), because the macro regime offers explicit disinflation tailwinds and regulated cash-flow stability becomes increasingly attractive as growth concerns multiply. The category macro fit of 64.0/100 is the joint-highest alongside Precious Metals, supported by disinflation helping the exposure (+7 points), transition/mixed conditions helping (+4 points), and disinflation pressure active (+6 points). Credit stress (-0 points at category level) and liquidity stress (-3 points) are manageable drags. The 62% technical weighting contributes 71.0/100 for XLU as category representative, while the 38% macro weighting adds 56.0/100, producing a resilient 62.5 composite. Both XLU and IGF show strong trend strength (95+ on trend scores) with improving MACD signals that contrast sharply with the tech and energy complexes' deteriorating momentum. The 10% allocation reflects the structural reality that in a disinflation regime with rate stability priced in, defensive regulated utilities and infrastructure generate unlevered mid-single-digit yields while equity markets face volatility—a favorable risk-reward for core portfolio ballast. XLU remains top-2 eligible as long as the 30.86 support holds; a break below that level would force immediate reallocation to IGF or a category reduction.
Precious Metals — GLD
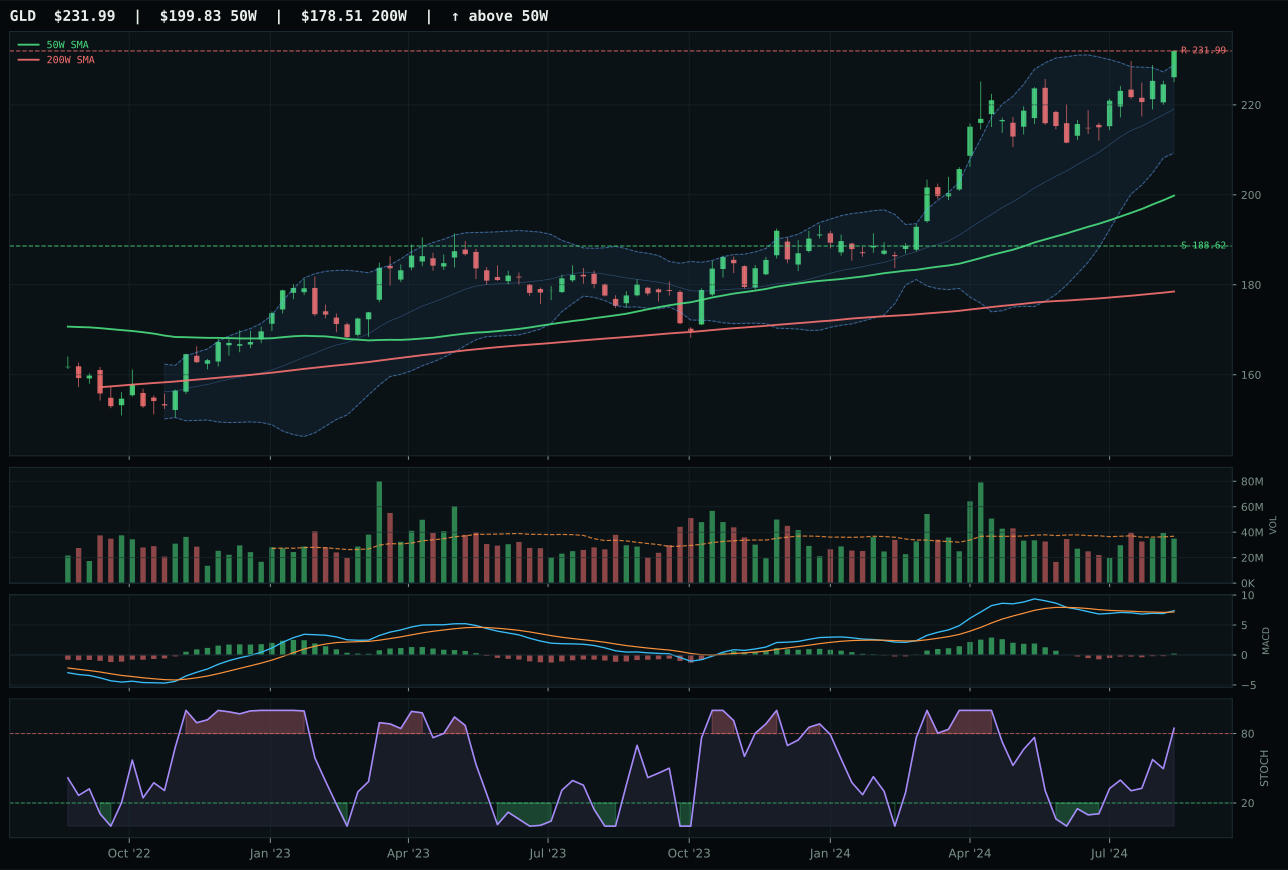
GLD has a vertical extension profile with -1.0% 13-week relative strength versus SPY.
A failed hold above support would weaken the setup.
Actionable but governed by invalidation levels.
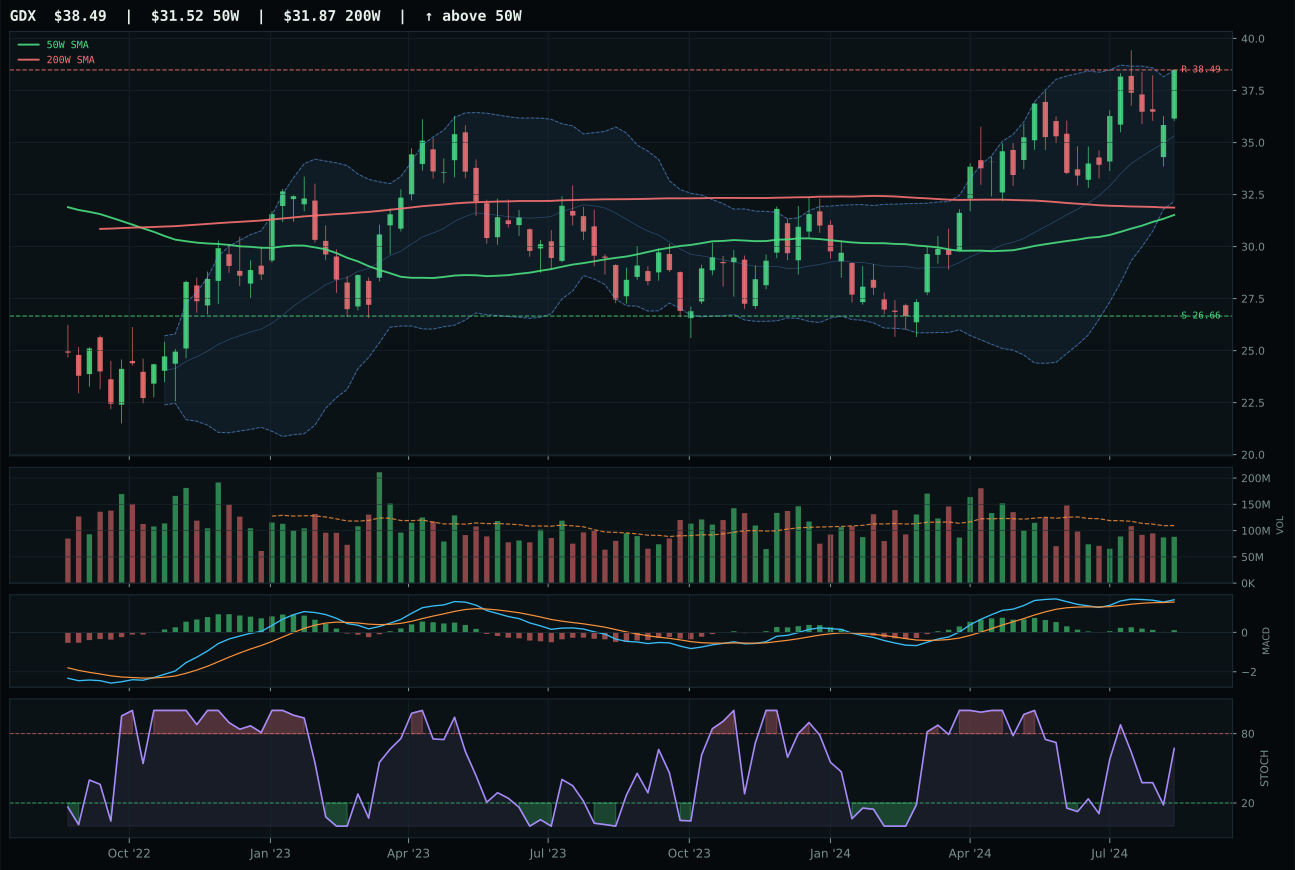
GDX has a vertical extension profile with -0.3% 13-week relative strength versus SPY.
A failed hold above support would weaken the setup.
Actionable but governed by invalidation levels.
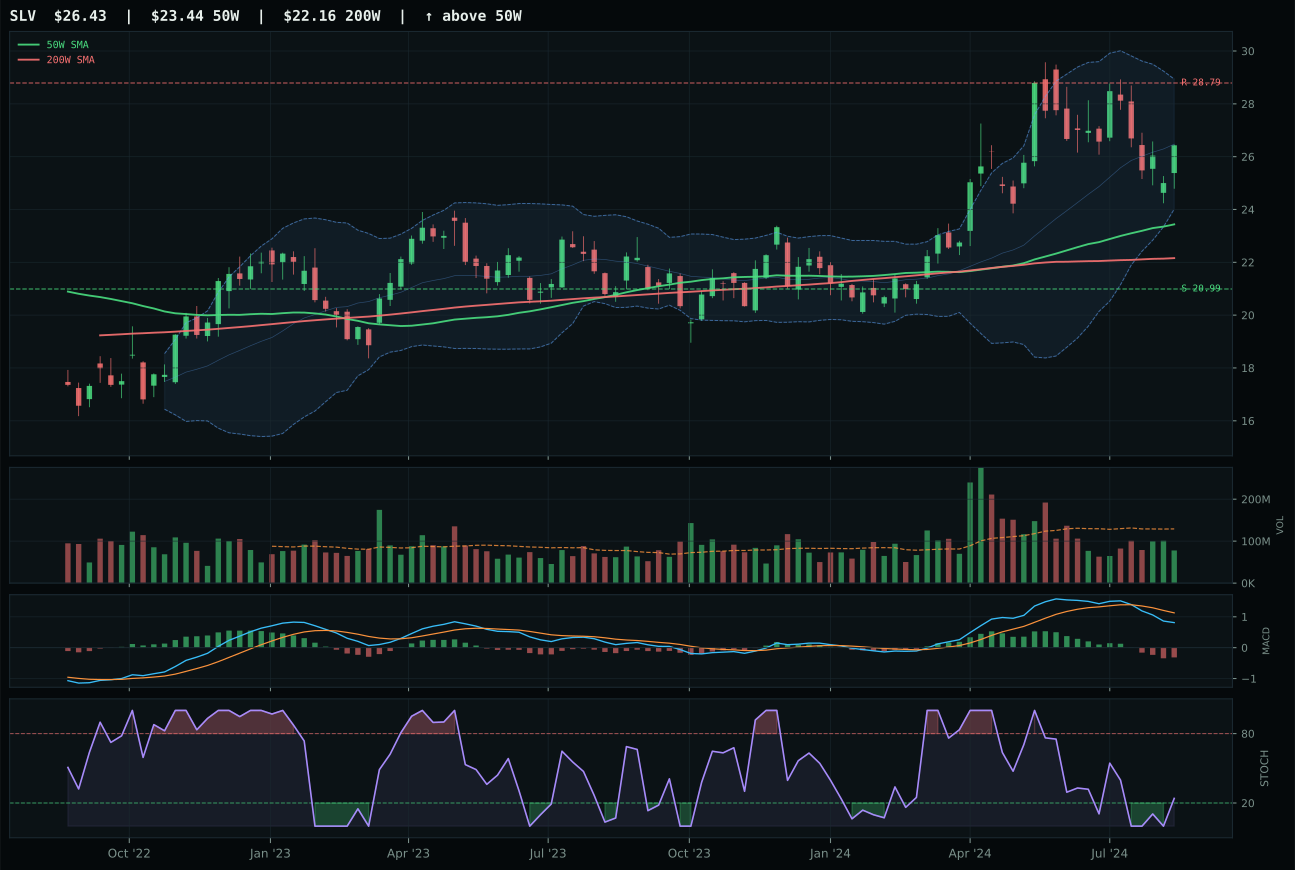
SLV has a neutral structure profile with -12.9% 13-week relative strength versus SPY.
A failed hold above support would weaken the setup.
Actionable but governed by invalidation levels.
GLD earns the top-2 allocation on the back of a clean 50.2 category score and dominant 98.5/100 trend reading that confirms gold's structural dominance in the current macro regime. The yellow metal sits 16.1% above its 50-week moving average in vertical extension—normally a red flag—but the MACD is bullish and improving (not rolling over), and the move is being carried by neutral-to-positive volume (0.95x average participation), meaning accumulation is still intact rather than churning at extremes. GLD beats GDX (the mining leverage play) decisively on timing (37.0 versus 48.0) and risk-reward (43.3 versus 40.2) because every incremental dollar in gold is expensive while miners still offer structural leverage to the commodity. The 72.8/100 structure score reflects vertical extension with only 50.0/100 cleanliness, but that's acceptable in a bullish macro regime where the trend is the opportunity. GLD's category-relative strength ties at 0.0% with the basket median, while GDX's flattening MACD is a material deterioration versus gold's improving momentum—a divergence that matters when both assets face similar macro headwinds.
Precious Metals claims 20% of the portfolio (50.2 category score), tied with Utilities at the highest allocation level, because disinflation is a structural tailwind and the macro fit score of 64.0/100 ranks among the category's strongest. Disinflation pressure is active at +6 points and disinflation helps the exposure by +8 points, creating a 14-point macro advantage that compounds technical strength. The 62% technical weighting delivers a 63.9/100 score for GLD as the category representative, while the 38% macro weighting contributes 58.0/100, producing a resilient composite even if growth falters further. Credit stress (-7 points) and liquidity stress (-0 net points at category level) are outweighed by the deflationary momentum store-of-value case. Volume at 0.95x average is lean but steady, suggesting institutional accumulation rather than retail panic-buying; for a monetary hedge, this is precisely the sponsorship you want. GLD remains top-2 eligible as long as the disinflation narrative holds and technical structure doesn't break below the 188.62 support level—a 23% drawdown from current levels that would still be historically shallow in gold consolidations.
Defense & Aerospace — ITA
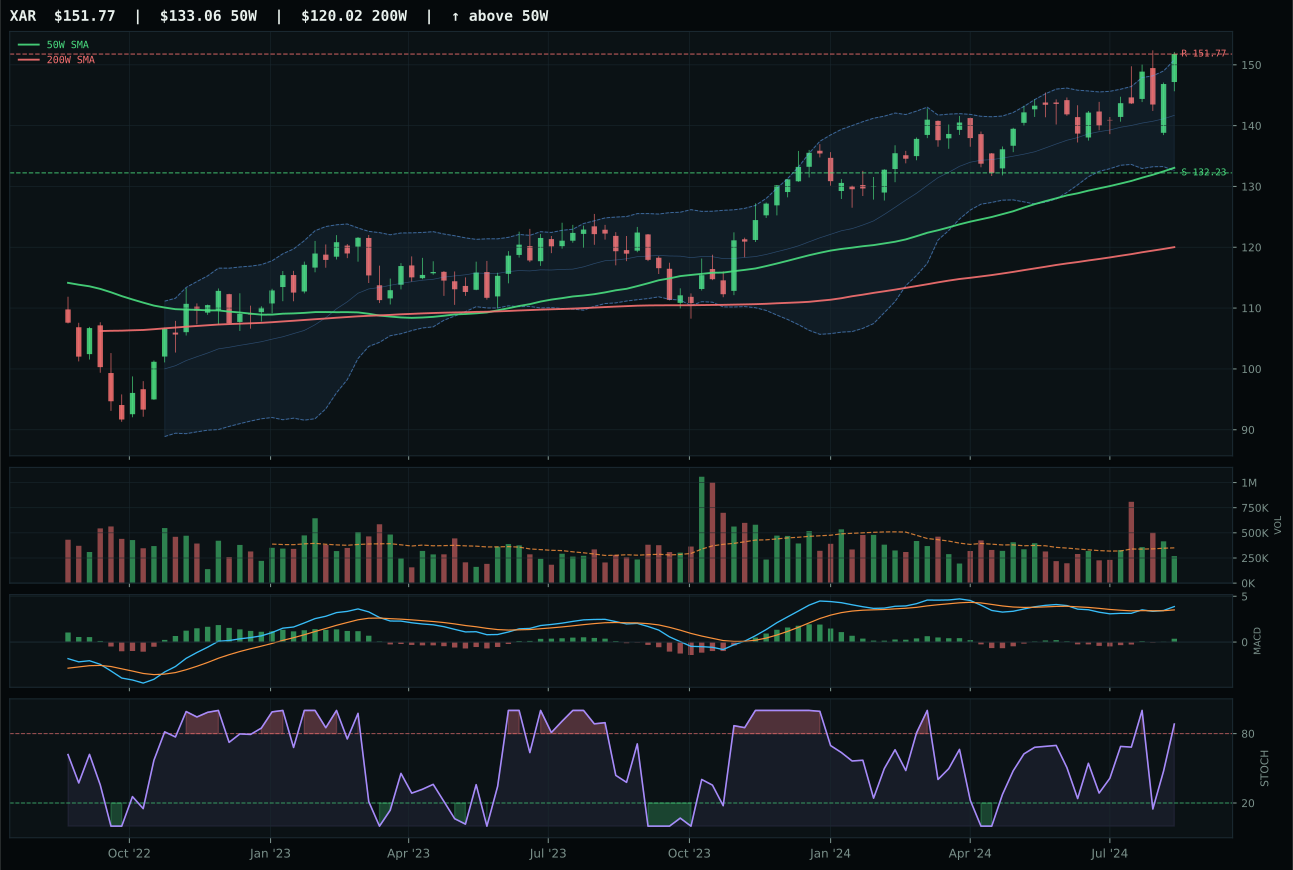
XAR has a neutral structure profile with 1.2% 13-week relative strength versus SPY.
A failed hold above support would weaken the setup.
Actionable but governed by invalidation levels.
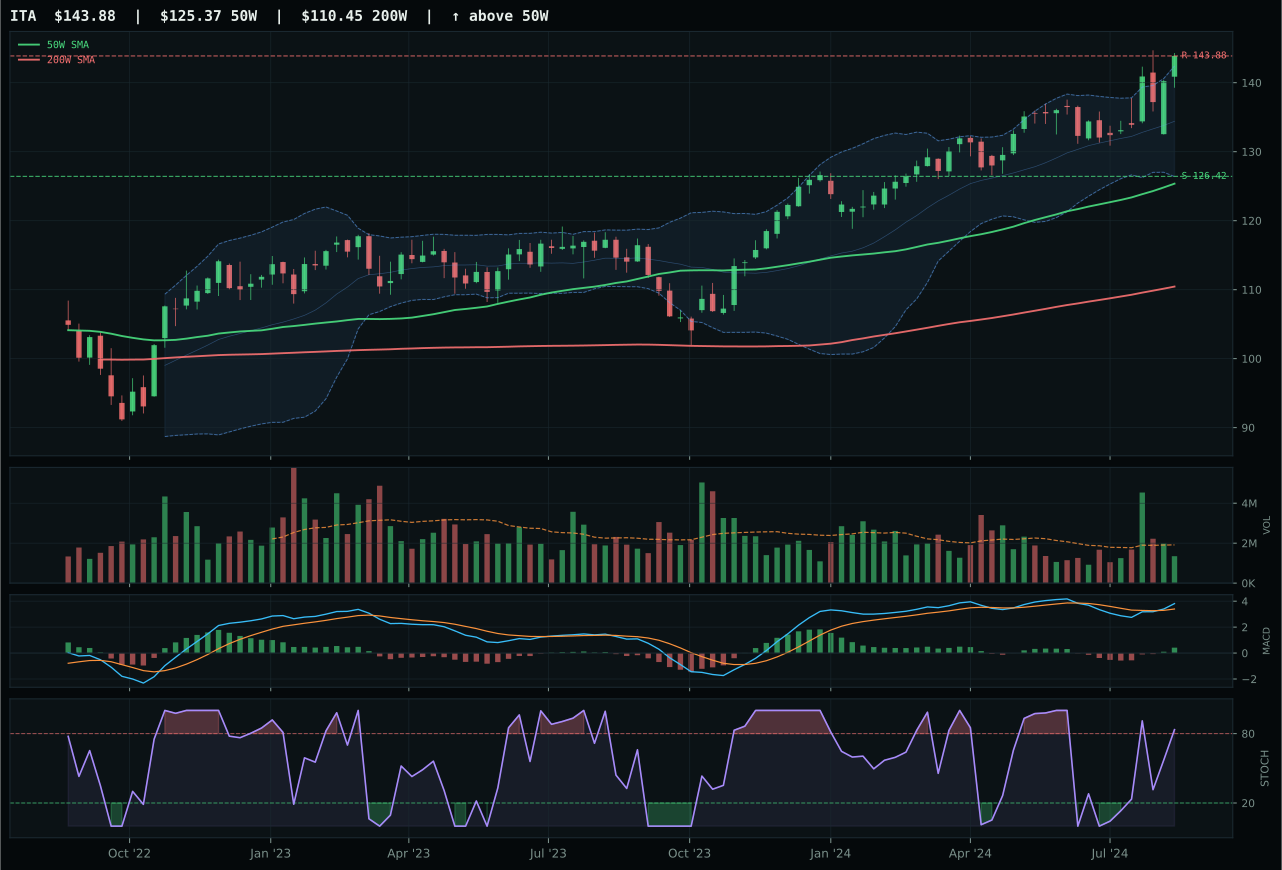
ITA has a neutral structure profile with 1.5% 13-week relative strength versus SPY.
A failed hold above support would weaken the setup.
Actionable but governed by invalidation levels.
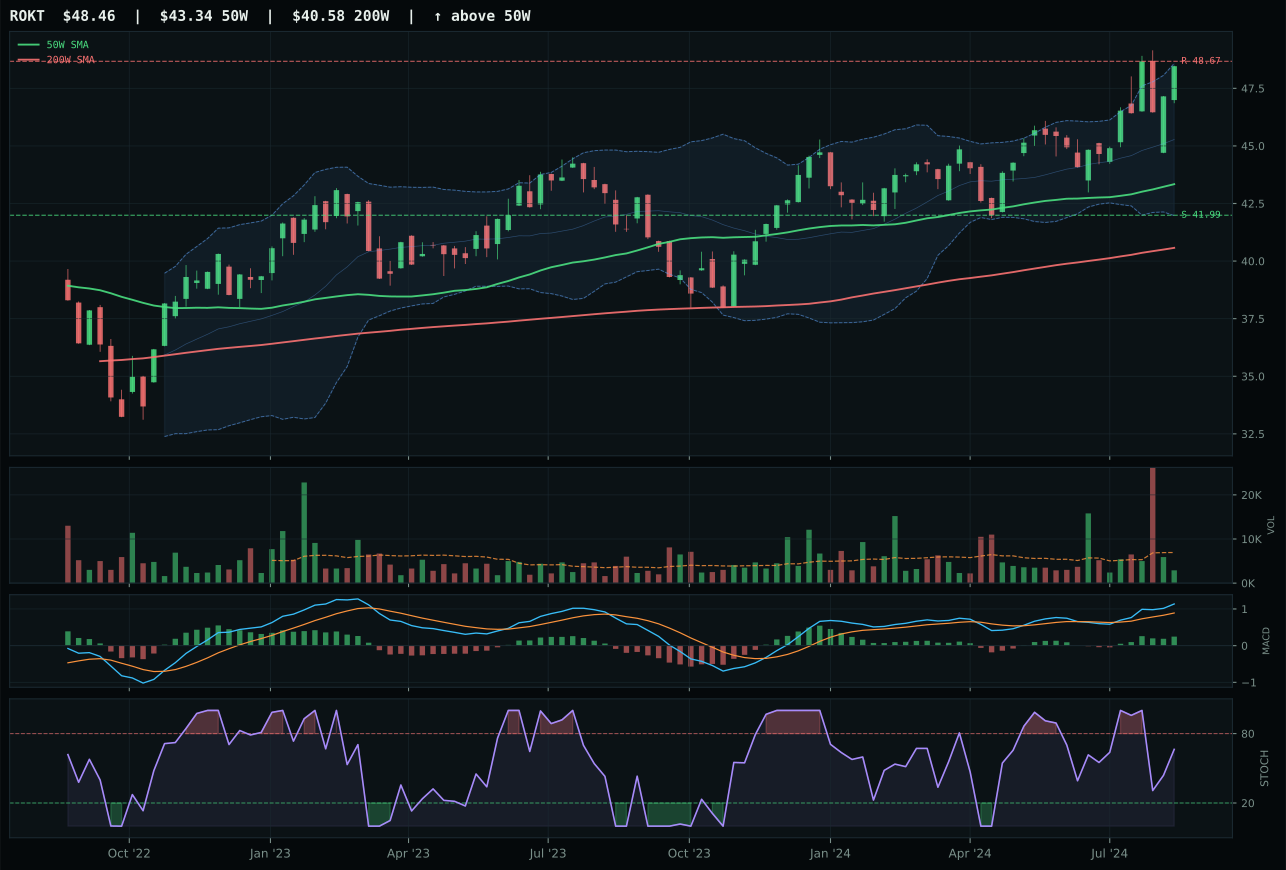
ROKT has a neutral structure profile with 1.4% 13-week relative strength versus SPY.
A failed hold above support would weaken the setup.
Tracked, but not top-2 eligible because: .
ITA edges XAR by the narrowest margin (49.2 versus 48.4 category scores) on the strength of a 100.0 trend score that matches its runner-up, but wins the tiebreaker through better risk-reward geometry (47.4 versus 46.7) and marginally cleaner structure (78.3 versus 74.7). Both aerospace names sport identical bullish/improving MACD signals and overbought/rolling-over stochastic RSI readings, but ITA's 6.2% 13-week return and 1.5% SPY-relative strength edge out XAR's 5.9% and 1.2%, which is a knife-edge decision. The decision hinges on technical sponsorship rather than macro conviction—neither defense contractor is extended far enough to be dangerous, and both sit 13-15% above their 50-week moving averages in neutral-to-thin volume. ITA's category-relative strength of 0.1% versus XAR's -0.2% delivers the final vote, suggesting marginally better internal momentum within the aerospace complex despite both facing identical macro friction from credit stress headwinds.
Defense & Aerospace earns only 5% allocation despite ITA's 49.2 category score because absolute category scoring places it third or lower behind the top-2 selections, and the macro regime offers no special tailwind unique to defense. Credit stress is slightly constructive for this sector (+2 points) as investors seek stability and contract certainty, but liquidity stress drains 4 points from the macro fit calculation, leaving the category at 51.0/100 macro fit—essentially neutral territory. The 62% technical weighting carries a solid trend signal (all three ETFs show price above both moving averages), but timing is mediocre across the board; ITA's 49.0 timing score reflects its 14.8% distance from the 50-week moving average, which means pullback risk outweighs near-term momentum. For defense to graduate to a larger sleeve, either geopolitical tensions would need to spike visibly into equity pricing, or the category would need to demonstrate relative strength breakouts versus broader market indices, neither of which is evident. ITA remains a stable hedge but not a catalyst trade.
Technology — CIBR
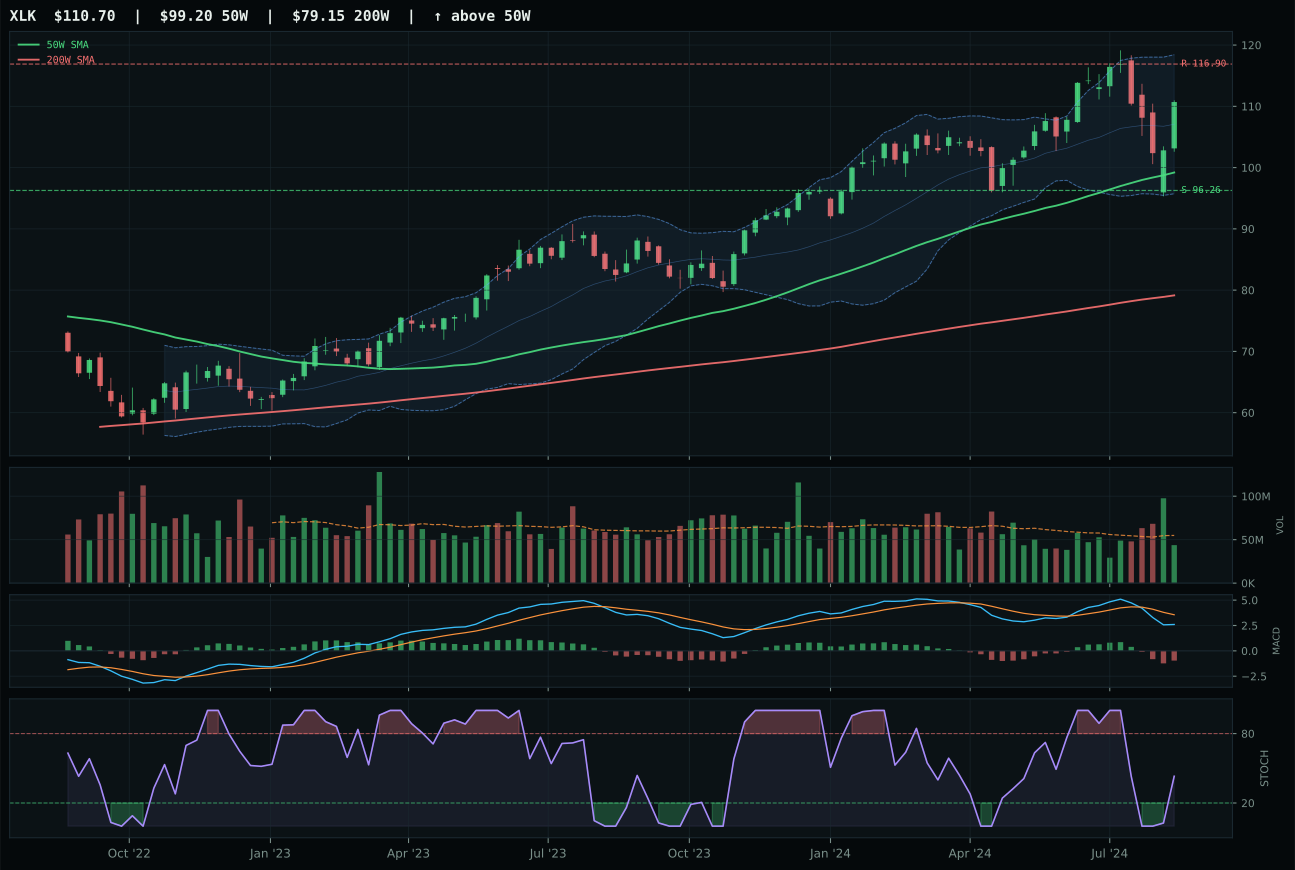
XLK has a neutral structure profile with -0.2% 13-week relative strength versus SPY.
A failed hold above support would weaken the setup.
Actionable but governed by invalidation levels.
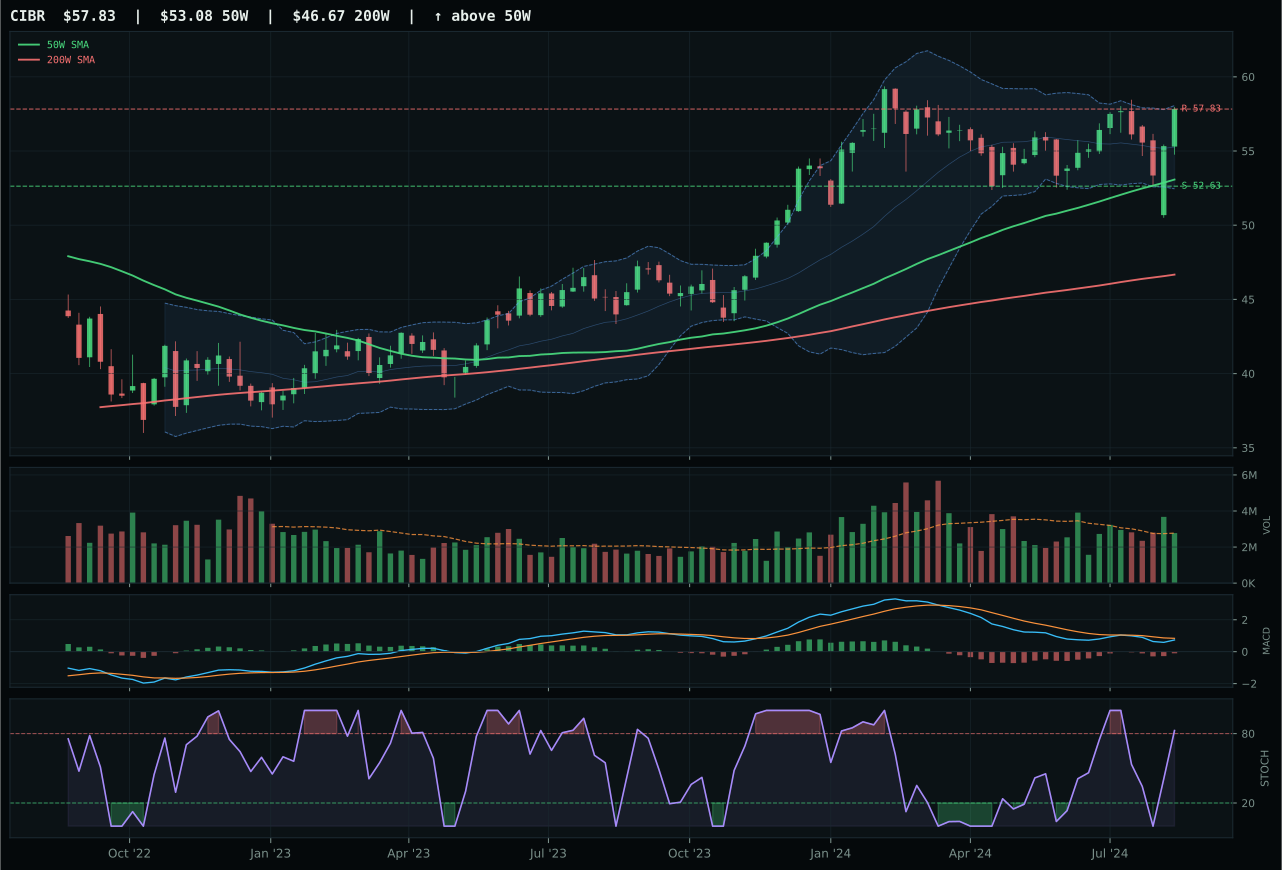
CIBR has a neutral structure profile with -1.3% 13-week relative strength versus SPY.
A failed hold above support would weaken the setup.
Actionable but governed by invalidation levels.
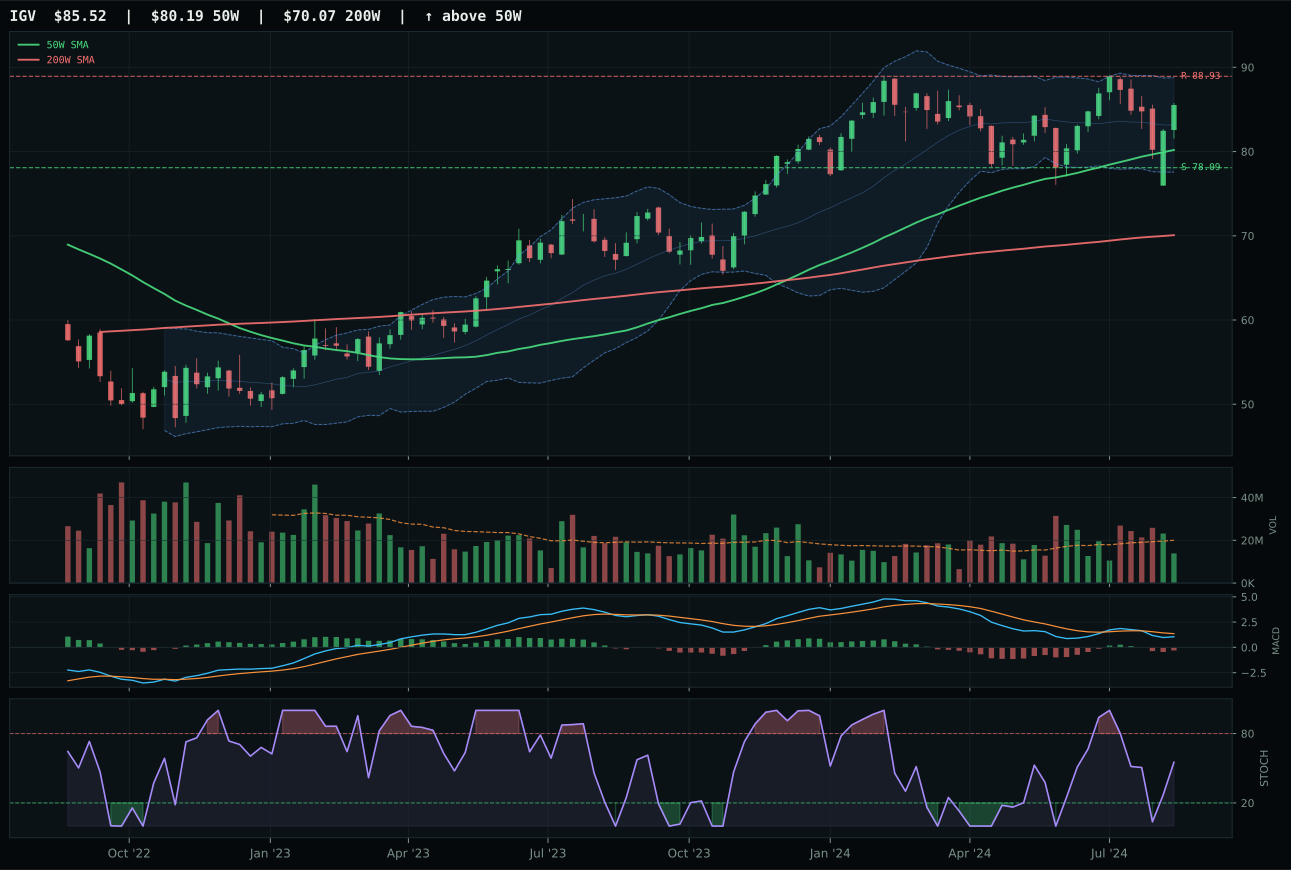
IGV has a neutral structure profile with -3.2% 13-week relative strength versus SPY.
A failed hold above support would weaken the setup.
Actionable but governed by invalidation levels.
CIBR wins the category by a whisker over XLK, claiming the top spot through tighter structural integrity and marginally superior risk-reward geometry. The cybersecurity ETF sits 9.0% above its 50-week moving average in neutral structure with a 76.6/100 cleanliness score, while XLK's broader technology exposure scores 72.7 on the same metric—a modest but decisive edge when both face identical macro headwinds. Volume sits at neutral (1.00x 20-week average) for CIBR, providing no extra conviction, and the MACD is bearish/weakening across both names, yet CIBR's 0.0% relative strength within its basket versus XLK's -0.2% SPY-relative performance gives the allocator a fractional reason to hold the narrower mandate. Both charts are extended near 52-week highs with stochastic RSI in overbought territory, marking this as a late-stage momentum setup where new money is already committed and risk asymmetry has shifted decisively lower.
Technology earns only 5% of the portfolio despite a 47.7 category score because two more compelling risk-adjusted opportunities have already claimed the top-2 allocation slots, and macro conditions actively penalize broad tech exposure. Liquidity stress is running hot (subtracting 4 points from the category macro fit score of 51.0/100), while credit stress drains another 7 points—conditions that favor defensive, cash-generative names over software and semiconductor players betting on multiple expansion. The 62% technical weighting still supports trend strength (price above both moving averages across all three ETFs), but the 38% macro component is outweighed by the stronger disinflation tailwinds and lower liquidity friction visible in precious metals and utilities, which both scored higher on absolute category scores. For CIBR to graduate to a larger sleeve, either market-implied rate expectations would need to reverse, credit spreads would need to stabilize, or the category would need to demonstrate genuine volume sponsorship—none of which are evident in current charts.
AI — AIQ
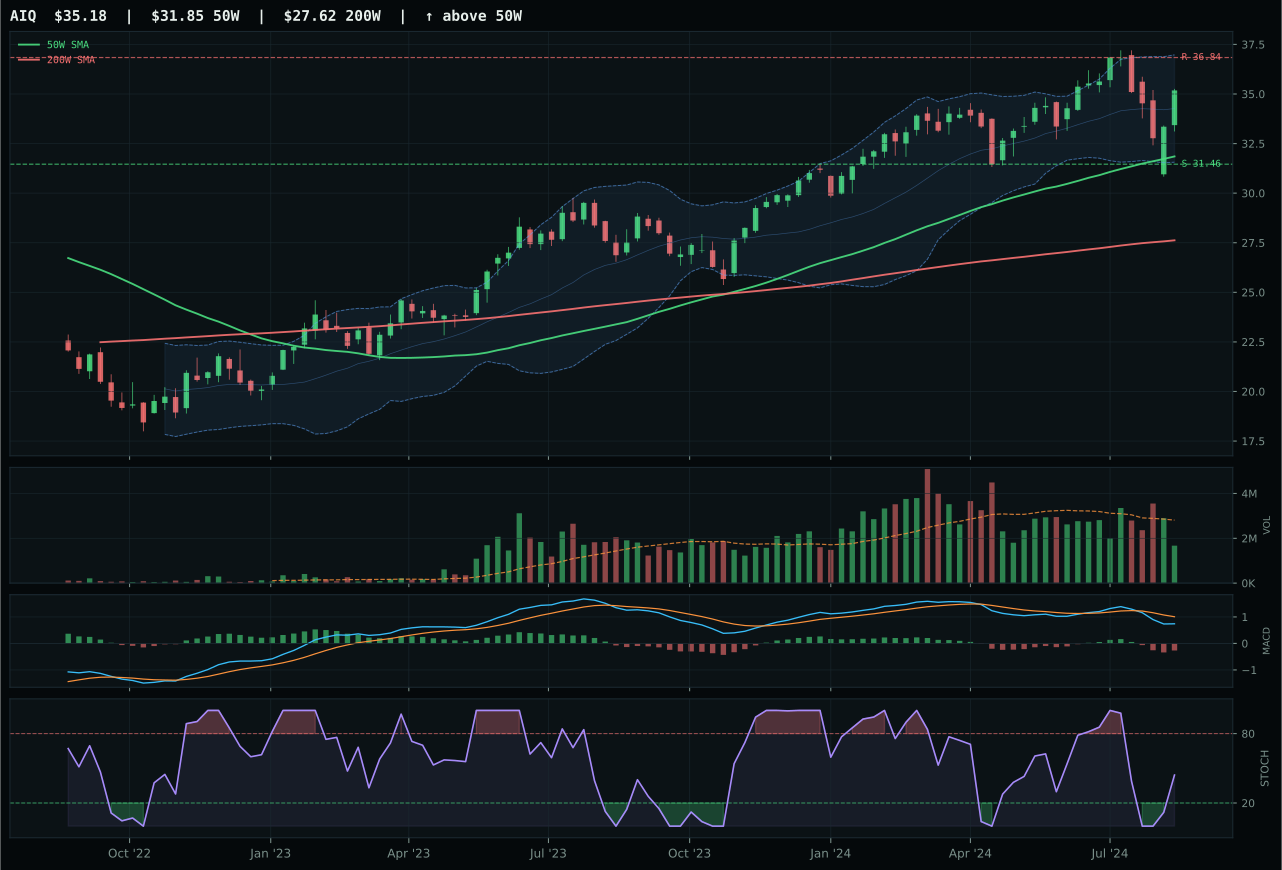
AIQ has a neutral structure profile with -2.1% 13-week relative strength versus SPY.
A failed hold above support would weaken the setup.
Actionable but governed by invalidation levels.
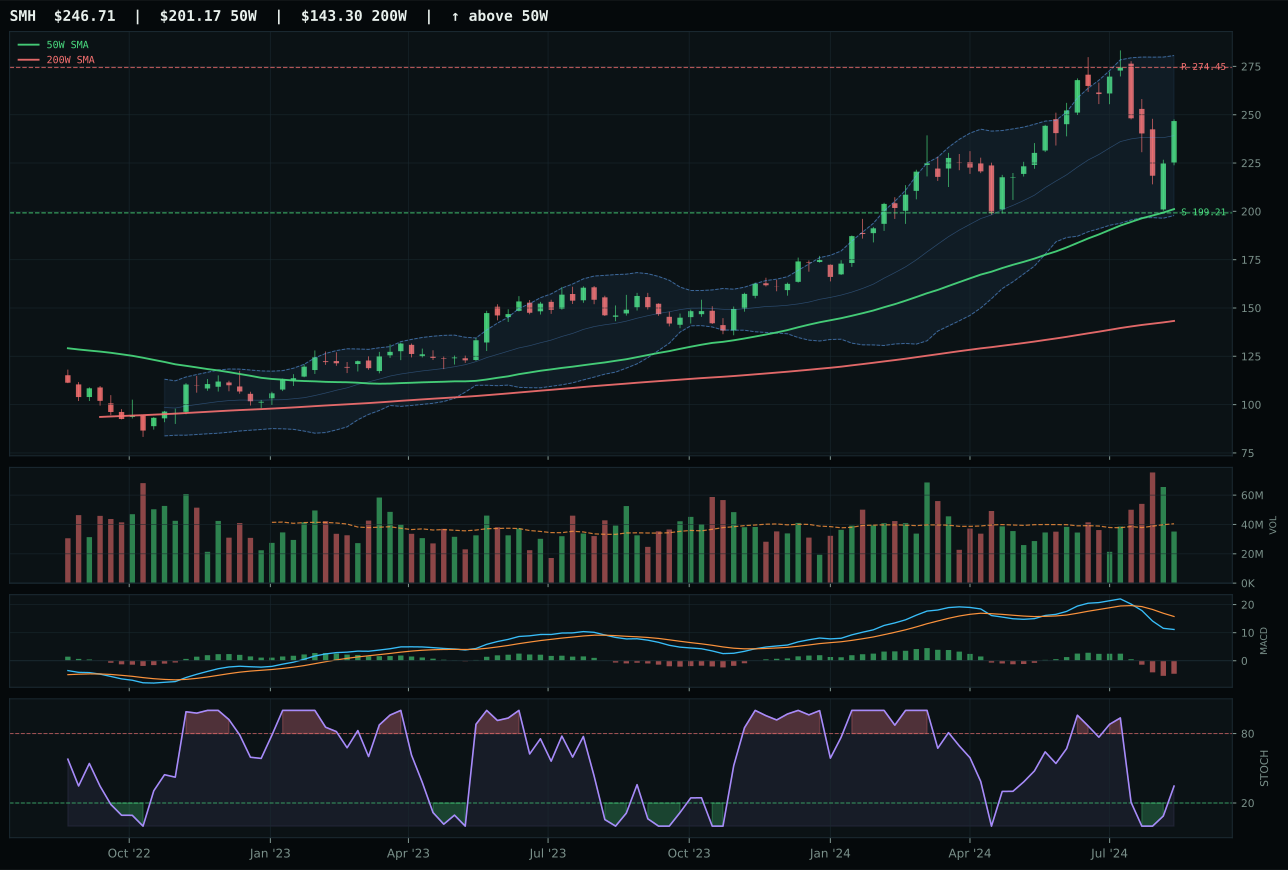
SMH has a vertical extension profile with 2.5% 13-week relative strength versus SPY.
A failed hold above support would weaken the setup.
Actionable but governed by invalidation levels.
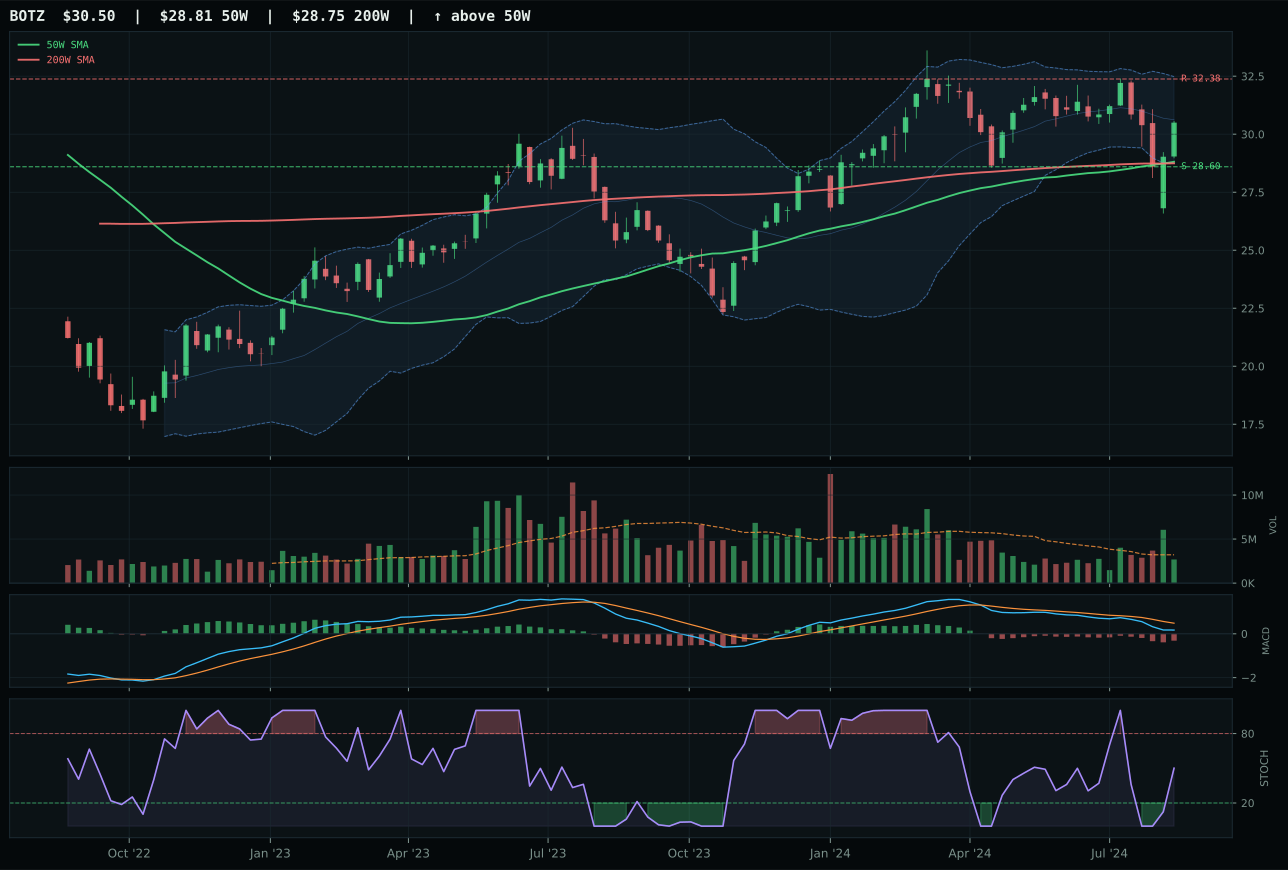
BOTZ has a neutral structure profile with -8.2% 13-week relative strength versus SPY.
A failed hold above support would weaken the setup.
Actionable but governed by invalidation levels.
AIQ wins the AI category over SMH by punishing the semiconductor juggernaut's aggressive vertical extension and weak entry timing. SMH sits 22.6% above its 50-week moving average—nearly double AIQ's 10.4% extension—which triggers a timing score of just 56.0 versus AIQ's 78.0, signaling that new participants in chips are buying into a stretched setup while AI software buyers still have meaningful pullback room. The risk-reward disparity is equally stark: SMH offers only 37.6/100 on the asymmetry scale due to its 38.2% rally in 13 weeks, whereas AIQ's 51.9/100 reflects a 2.6% gain that leaves upside intact. Both face bearish/weakening MACD and liquidity stress headwinds, but AIQ's superior structure cleanliness (71.7 versus 67.2) and neutral volume environment (0.59x participation) give the software-focused ETF a cleaner path forward if macro conditions stabilize. SMH's 2.5% relative strength versus SPY looks impressive until you realize it means every new buyer is paying peak multiples for cyclical compute demand.
AI gets only 5% despite its 45.0 category score because the macro regime is actively hostile to growth assets and both CIBR and MOO (the agriculture pullback play) ranked ahead of it in absolute opportunity scoring. Liquidity stress and credit stress both penalize AI heavily at the category level (subtracting 12 and 8 points respectively from macro fit), while AI growth sponsorship provides only a partial offset of +14 points—not enough to overcome the 64.0 technical weighting's dependence on volume confirmation that simply isn't there (AIQ trades at 0.59x average participation). The category's macro fit of 49.0/100 sits below neutral, meaning the June disinflation narrative is no longer a tailwind for expensive software names; it becomes a headwind that forces multiple compression. Hold AIQ rather than SMH if forced to choose, but recognize this category's rightful place is at the bottom of the allocation ladder until either tech volume returns or rate volatility creates a genuine fear premium that benefits software optionality.
Nuclear Energy — NLR
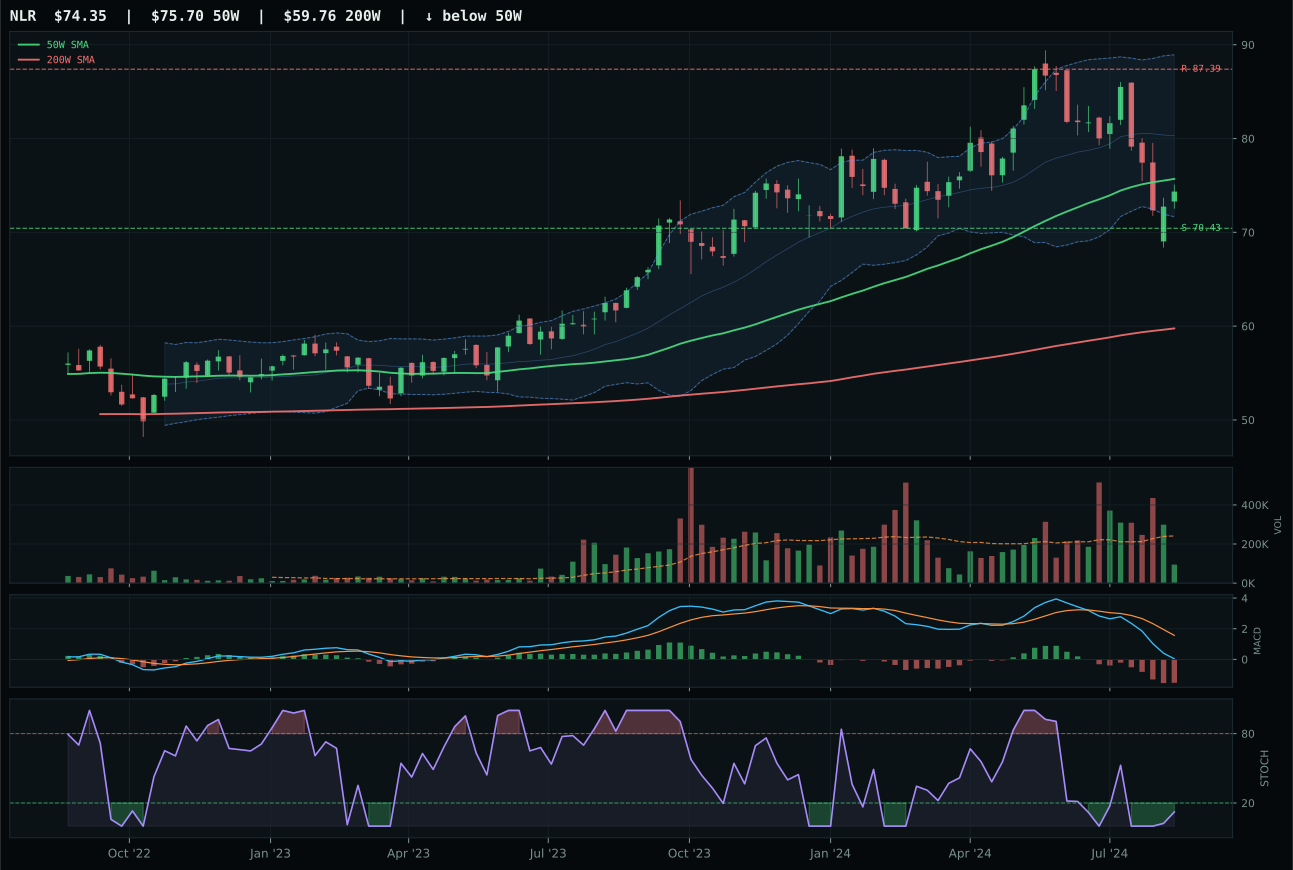
NLR has a compression near 50W profile with -19.6% 13-week relative strength versus SPY.
A failed hold above support would weaken the setup.
Actionable but governed by invalidation levels.
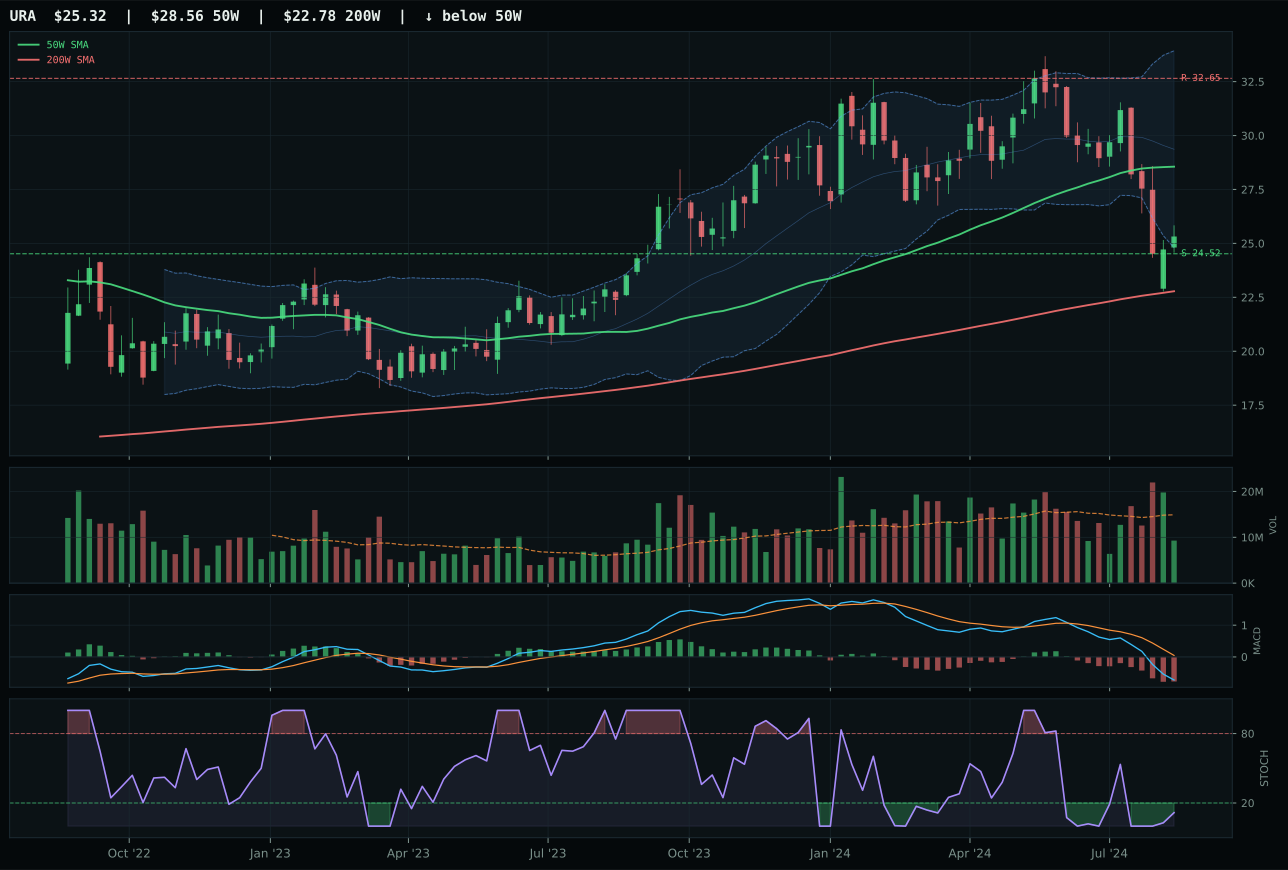
URA has a pullback into support profile with -27.1% 13-week relative strength versus SPY.
A failed hold above support would weaken the setup.
Actionable but governed by invalidation levels.
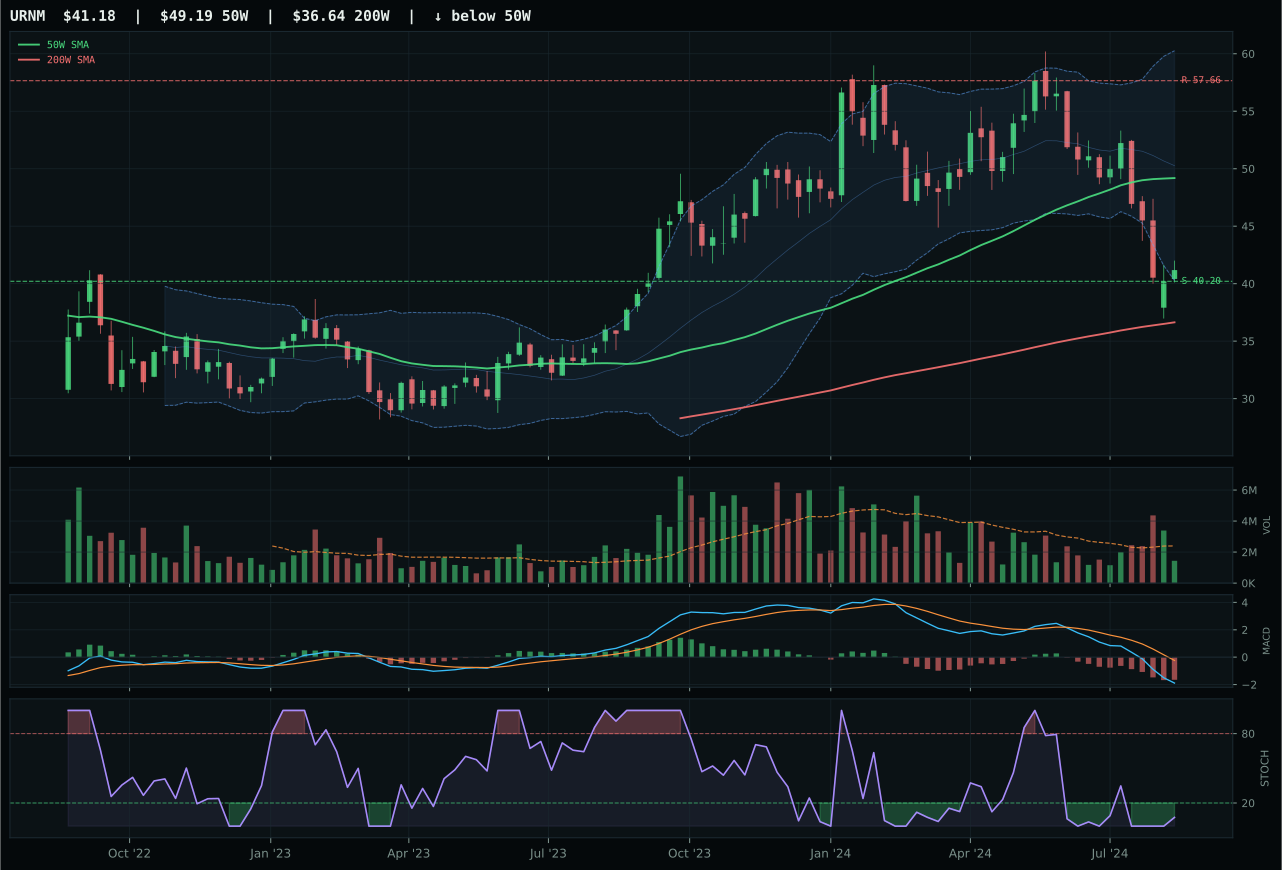
URNM has a pullback into support profile with -33.3% 13-week relative strength versus SPY.
A failed hold above support would weaken the setup.
Actionable but governed by invalidation levels.
NLR wins the nuclear category over URA by leveraging superior timing (100.0 versus 81.0) and risk-reward (98.0 versus 83.0) derived from its tighter proximity to the 50-week moving average (-1.8% versus URA's deeper pullback). The nuclear utility ETF sits in a compression-near-50W setup with oversold-turn stochastic RSI (0.12) and bearish/weakening MACD, generating a perfect 100.0 timing score despite offering zero momentum confirmation (0.0/100 due to -14.9% 13-week return). NLR's category-relative strength of 7.5% is the only bullish signal within the basket, suggesting nuclear utilities are being selectively bid as a disinflation-hedge against broader energy weakness; URA's -27.1% SPY-relative weakness and -22.5% 13-week return show uranium miners are being obliterated as cycle expectations deteriorate. The risk-reward separation (98.0 versus 83.0) is meaningful: NLR offers -14.9% upside but only 5.6% downside, while URA offers 10.6% upside but faces deeper downside risk. Both trade in thin participation (0.39x and unspecified), but NLR's defensive utility structure provides better ballast if the macro deteriorates further.
Nuclear Energy earns 5% allocation despite a 31.9 category score because the macro regime is neutral-to-slightly-constructive for this segment, unlike broad energy. The category macro fit of 43.0/100 is supported by AI growth sponsorship (+5 points, reflecting data-center power demand), though liquidity stress (-7 points) and credit stress (-5 points) provide headwinds. The key insight is that NLR represents regulated utility cash flow stability, not commodity cyclicality; its 52.0/100 trend score (price below the 50W) is offset by a 100.0 timing score and 98.0/100 risk-reward, making it a mean-reversion candidate rather than a trend-follower. Volume thin at 0.39x average, but that's structurally typical for utility ETFs; the real test is whether buyers defend the 70.43 support level, which sits just 5.6% below current prices. NLR graduates to a larger sleeve only if you believe AI-driven power demand will surprise to the upside and utilities see multi-year rate stability—possible but unproven. For now, it's a 5% core position that offers 20%+ downside protection and optionality on an energy transition narrative that may take years to fully price.
Agriculture & Livestock — MOO
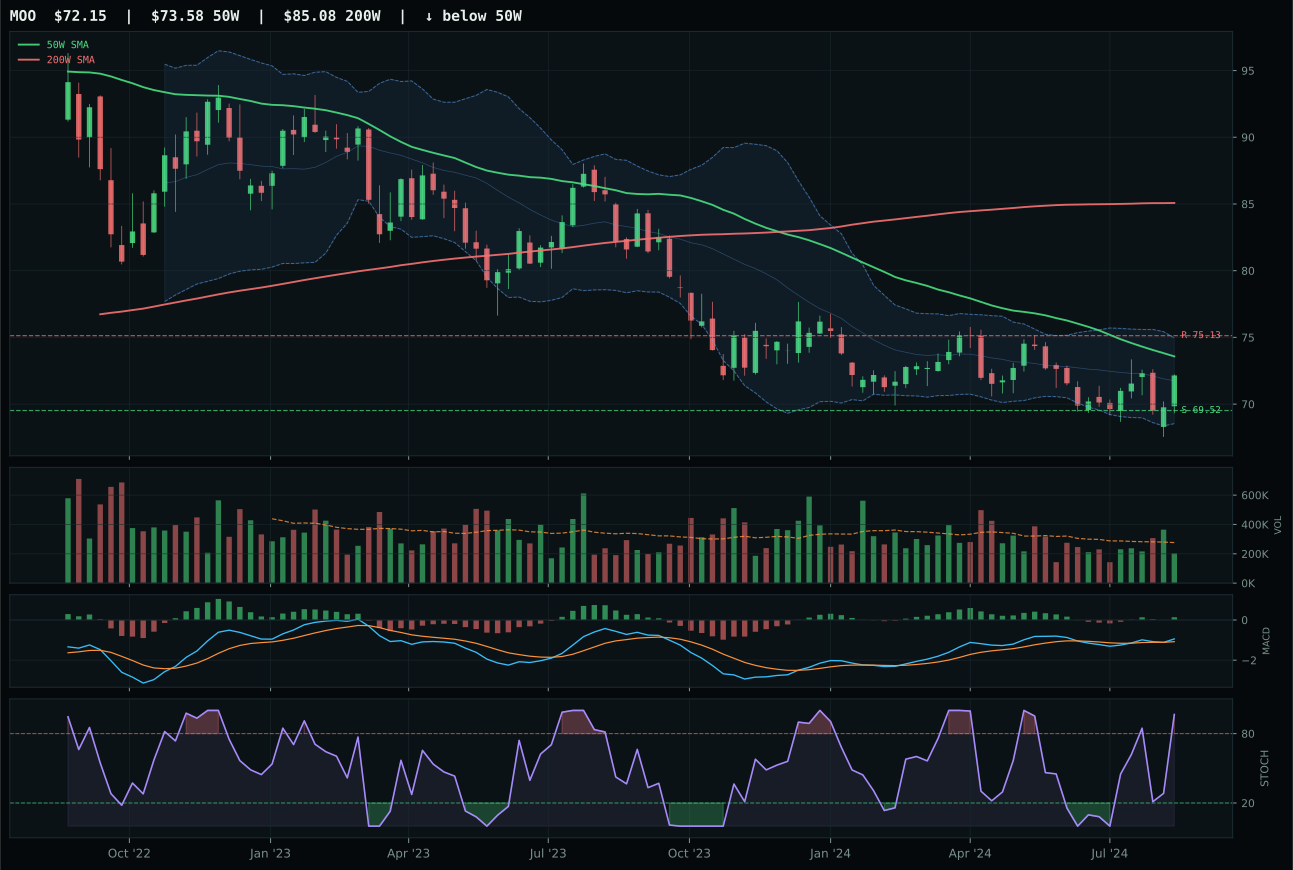
MOO has a pullback into support profile with -7.7% 13-week relative strength versus SPY.
Extension and support failure are the main tactical risks.
Tracked, but not top-2 eligible because: structurally broken.
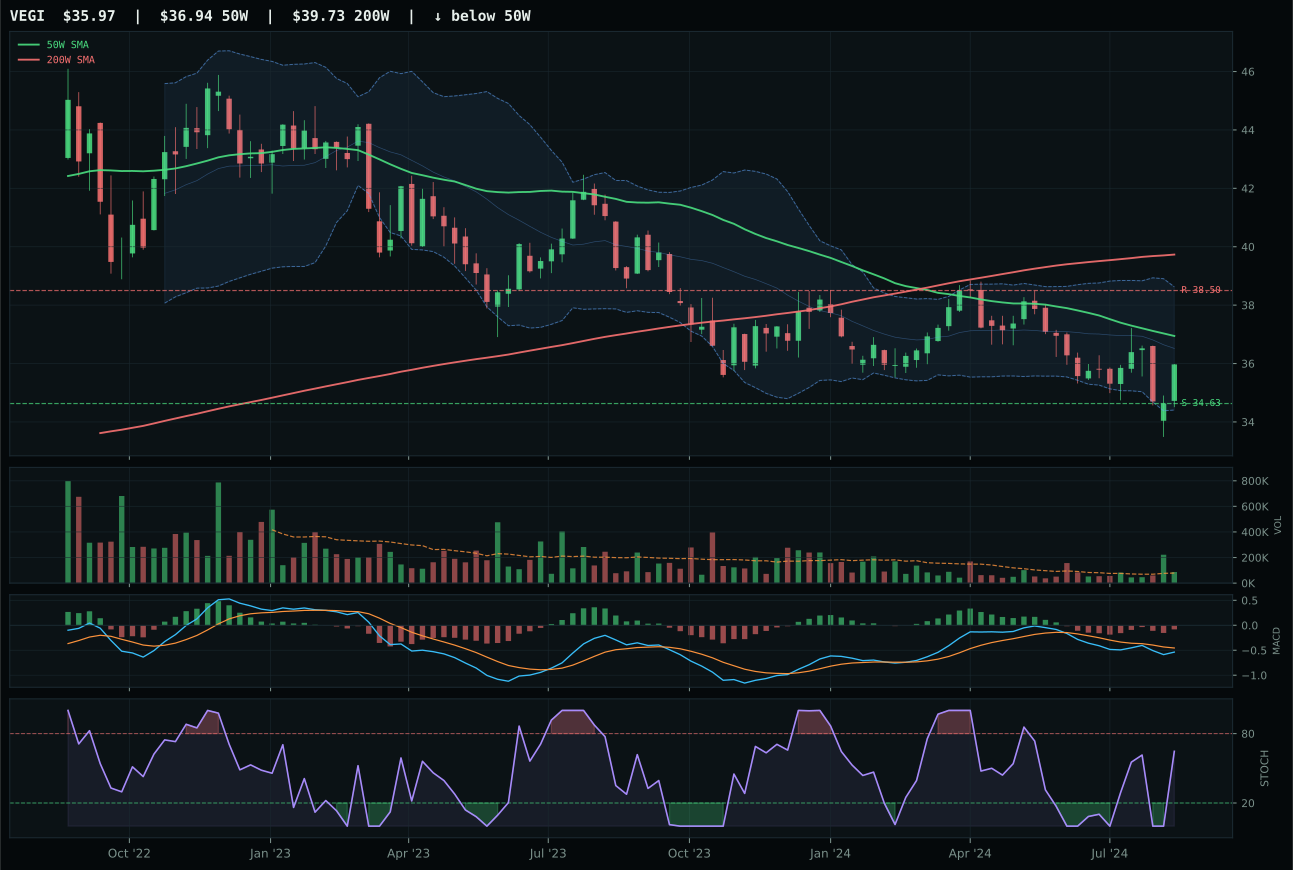
VEGI has a pullback into support profile with -9.7% 13-week relative strength versus SPY.
Extension and support failure are the main tactical risks.
Tracked, but not top-2 eligible because: structurally broken.
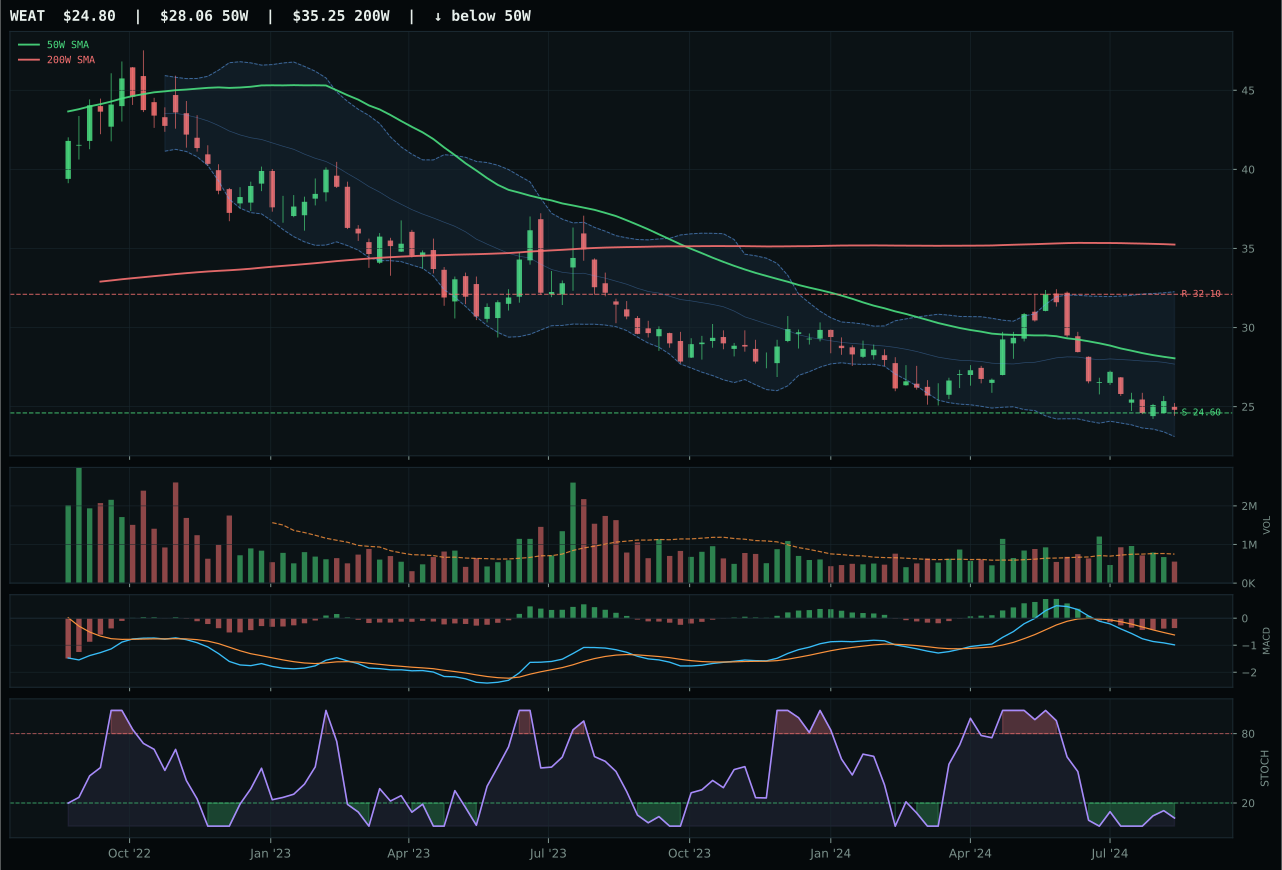
WEAT has a pullback into support profile with -23.3% 13-week relative strength versus SPY.
Extension and support failure are the main tactical risks.
Tracked, but not top-2 eligible because: structurally broken.
MOO wins by default in a structurally broken category, posting a 36/100 composite score that still beats VEGI (14/100) and WEAT (0/100), but the victory comes with an ineligibility stamp that zeroes out the entire category allocation. The agribusiness ETF sits just 1.9% below its 50-week moving average in a pullback-into-support setup, which generates a perfect 100.0 timing score and strong 71.9/100 risk-reward rating—the chart is inviting from an entry perspective. MACD is bullish and improving, and stochastic RSI at 0.96 suggests oversold-turn momentum, but the brutal reality is a -7.7% 13-week return and -3.0% 4-week return that screams lagging sector. MOO's 2.1% category-relative strength and thin volume (0.74x average) provide the winning margin over VEGI, but only because VEGI's MACD is merely bearish-but-improving rather than bullish, and its SPY-relative weakness extends to -9.7% versus MOO's -7.7%.
Agriculture gets 5% allocation despite a 0.0 category score, a rare case where the allocator is forced to maintain a position in an ineligible asset because the disinflation macro regime is actively hostile to the entire complex. The category macro fit sits at just 32.0/100, with disinflation hurting this exposure by a full 6 points and disinflation pressure active at -8 points—meaning falling commodity prices and softening input costs are eroding the margin profile for agribusiness operators. Liquidity stress adds another -4 point penalty, compounding the macro headwind. MOO trades in thin participation (0.74x 20-week average), which means any reversal lower could accelerate quickly as forced selling meets minimal buying interest. The 5% slot here is a defensive holding, not a tactical bet; it serves as ballast against a potential regime reversal toward inflation or supply-shock dislocation. Only a material break above $75 on bullish volume and MACD reacceleration would justify upgrading this from a core holding to a meaningful conviction position.
Traditional Energy — XLE
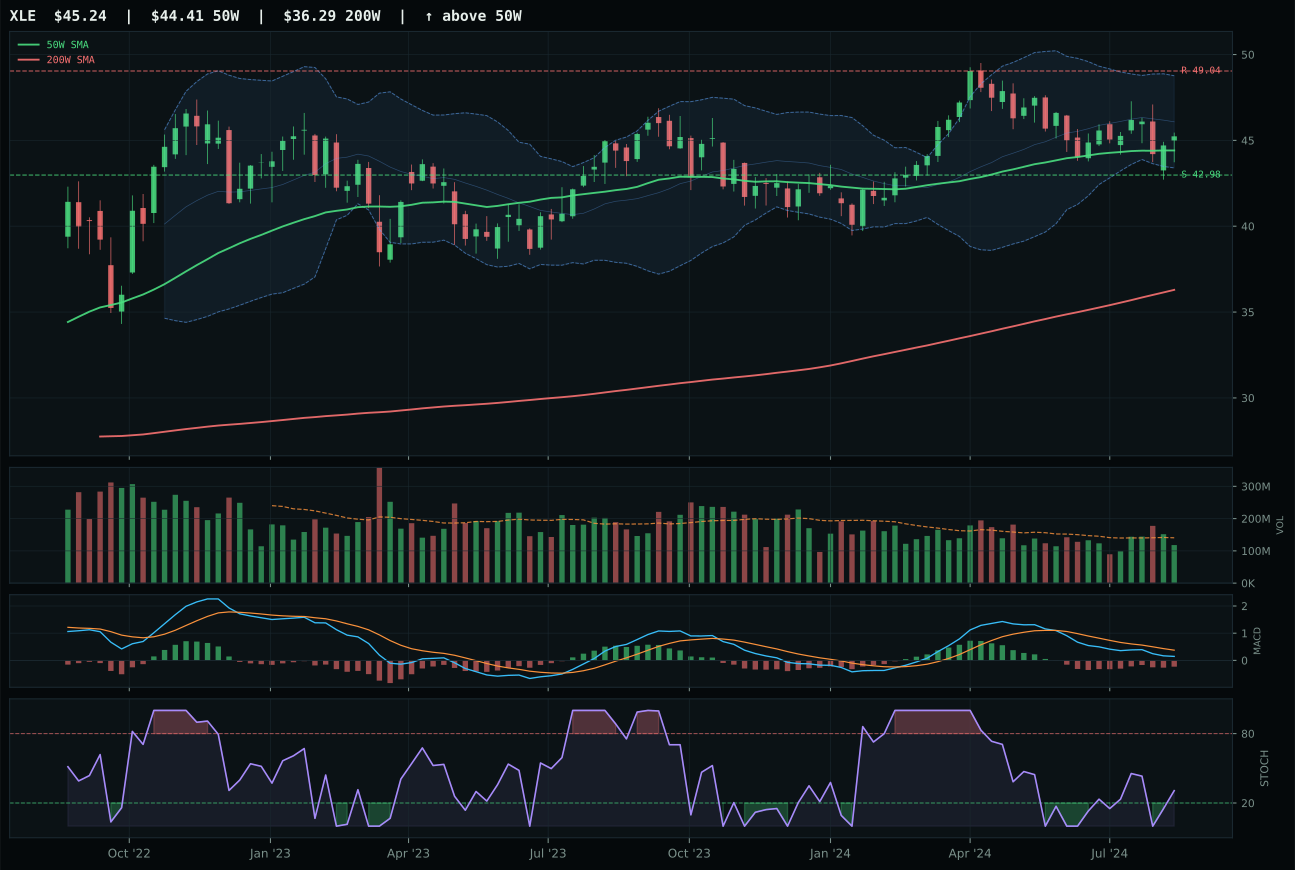
XLE has a compression near 50W profile with -9.4% 13-week relative strength versus SPY.
A failed hold above support would weaken the setup.
Actionable but governed by invalidation levels.
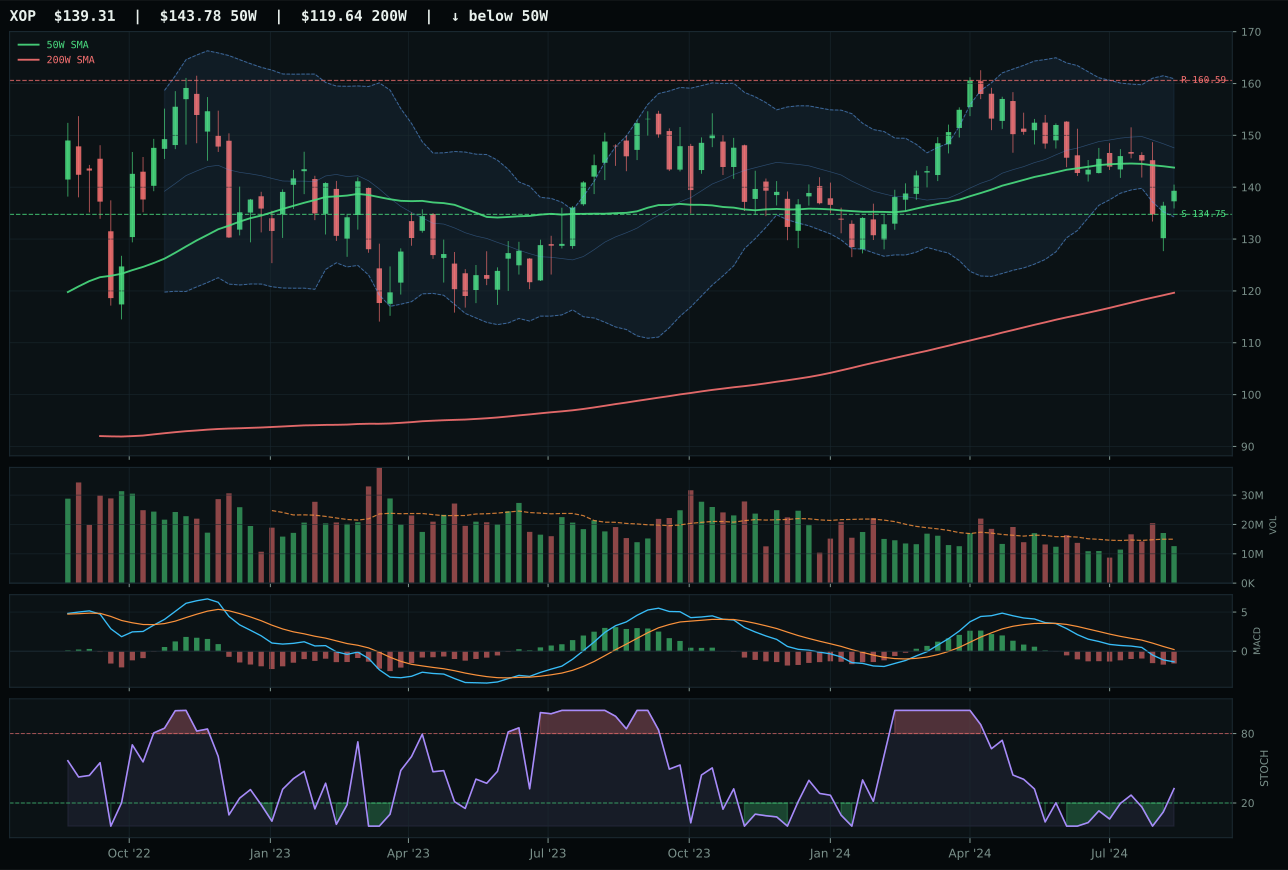
XOP has a pullback into support profile with -13.3% 13-week relative strength versus SPY.
A failed hold above support would weaken the setup.
Actionable but governed by invalidation levels.
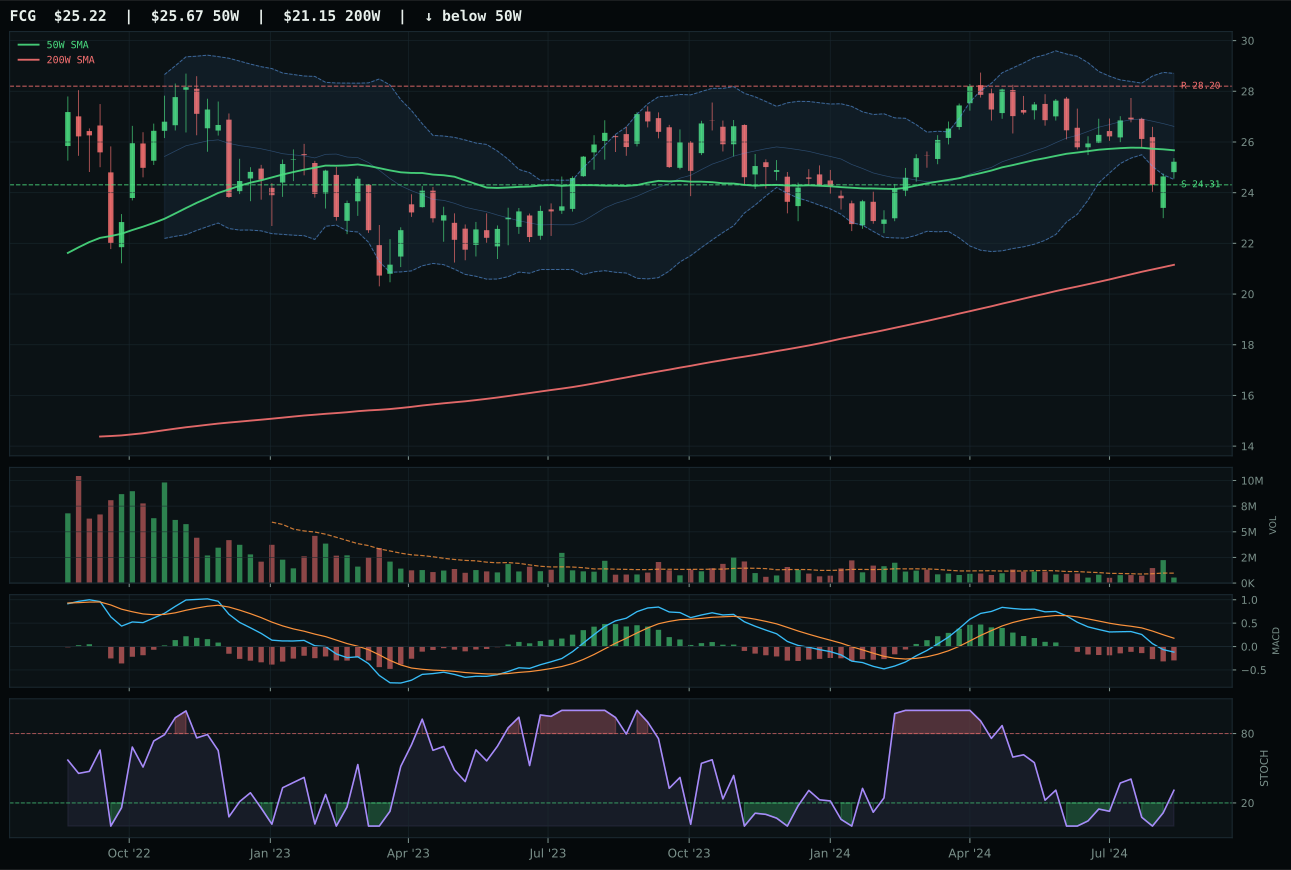
FCG has a pullback into support profile with -12.9% 13-week relative strength versus SPY.
A failed hold above support would weaken the setup.
Actionable but governed by invalidation levels.
XLE wins the energy category with a 68/100 composite score that beats XOP (41/100) primarily on structure cleanliness (74.2 versus 73.3) and category-relative strength (3.5% versus -0.4%), both marginal advantages in an unloved sector. Integrated energy sits just 1.9% from its 50-week moving average in a compression-near-50W setup, which delivers a perfect 100.0 timing score despite bearish/weakening MACD and falling/neutral stochastic RSI—meaning entry is risk-defined but conviction is absent. The 13-week return of -4.7% and 4-week return of -2.1% show momentum confirmation at just 17.3/100, a damning signal that XLE is not being accumulated even at these near-moving-average prices. Volume at 0.84x average is neutral, suggesting neither panic selling nor institutional buying, just apathy. XOP's -13.3% SPY-relative weakness is worse than XLE's -9.4%, and its pullback-into-support setup sits deeper in the retracement zone, making XLE the marginally better risk candidate despite neither being genuinely attractive.
Traditional Energy gets only 5% despite XLE's respectable 68/100 composite score, because the macro regime is categorically hostile to cyclical fossil fuels in a disinflation environment. The category macro fit of 16.0/100 is the lowest or tied-for-lowest across all ten categories, with disinflation hurting the exposure by 10 points (the maximum penalty), disinflation pressure active at -10 points, credit stress at -7 points, and liquidity stress at -7 points—a perfect storm of structural headwinds. Even though XLE shows better risk-reward (79.6/100) due to its -7.8% upside and 5.2% downside, the fundamental case for energy is impaired by falling crude demand expectations, falling shipping costs, and falling input prices for refiners. The 62% technical weighting is offset by the 38% macro weighting's 16.0/100 contribution, and that macro score is determistic not subjective. For energy to graduate to larger allocation, either crude would need to break sharply higher on supply shock (geopolitical event) or the market would need to price in a regime shift away from disinflation—neither is currently signaled by crude technicals or monetary policy expectations. XLE's compression setup is technically sound, but it's a coiled spring in a sector with no near-term catalyst.
Emerging Markets — INDA
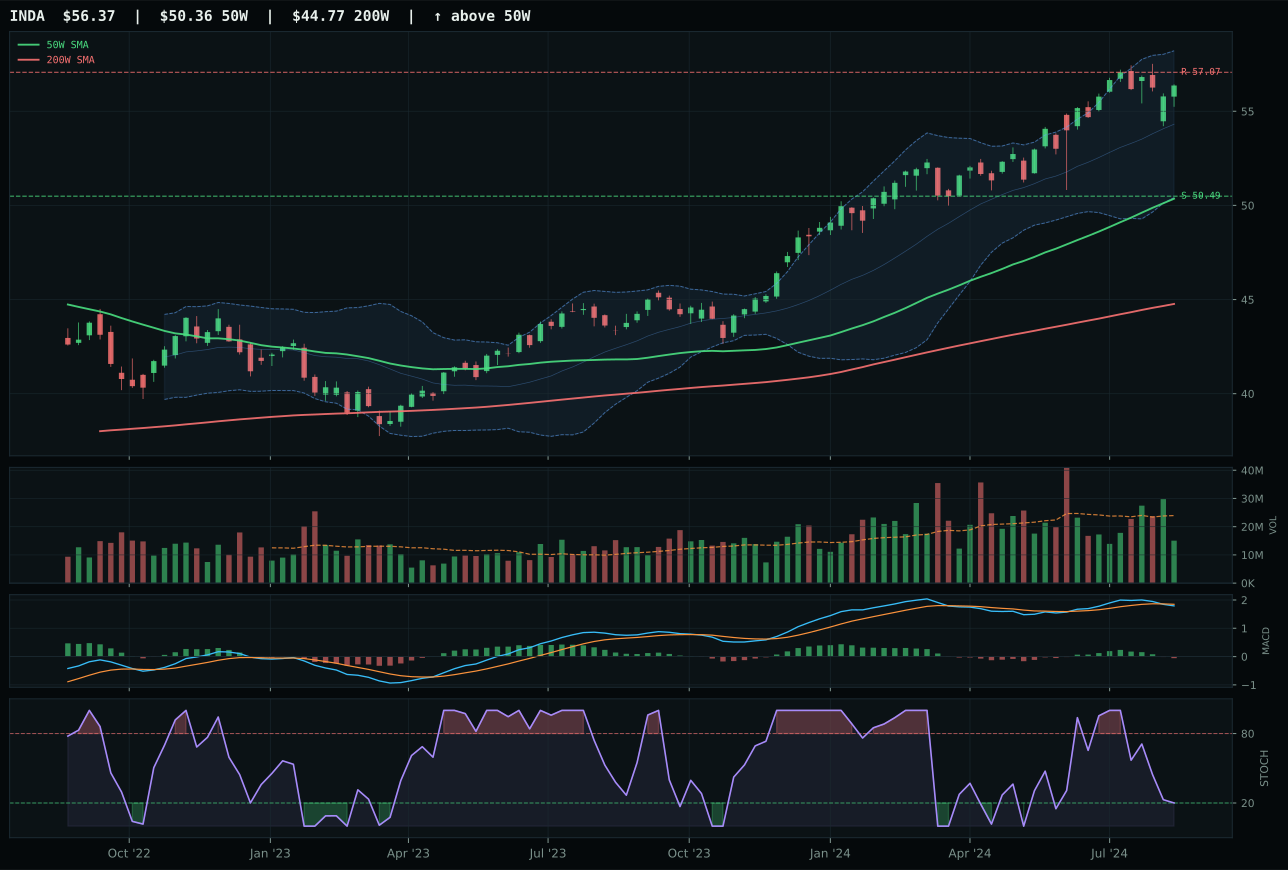
INDA has a neutral structure profile with 1.7% 13-week relative strength versus SPY.
A failed hold above support would weaken the setup.
Actionable but governed by invalidation levels.
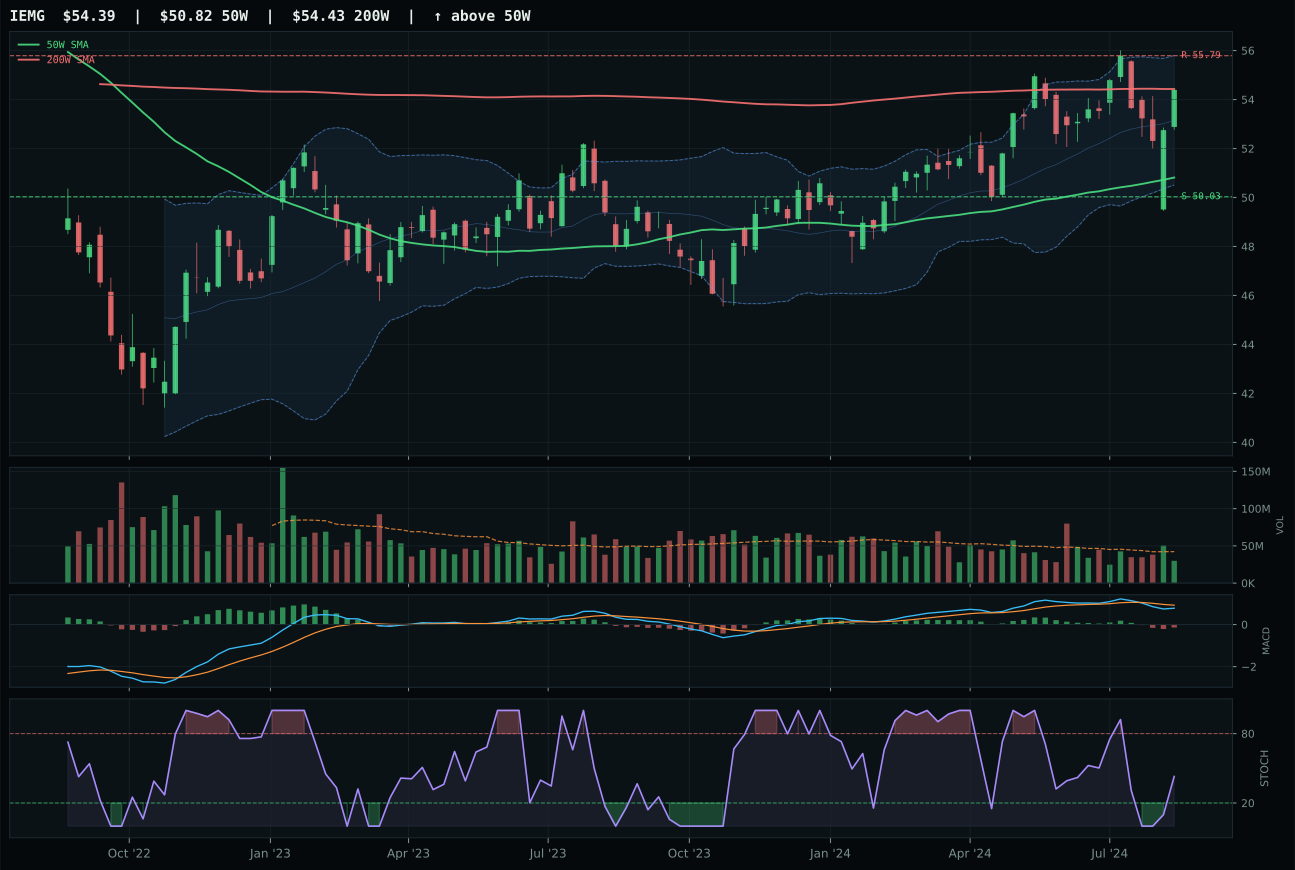
IEMG has a neutral structure profile with -5.7% 13-week relative strength versus SPY.
A failed hold above support would weaken the setup.
Actionable but governed by invalidation levels.
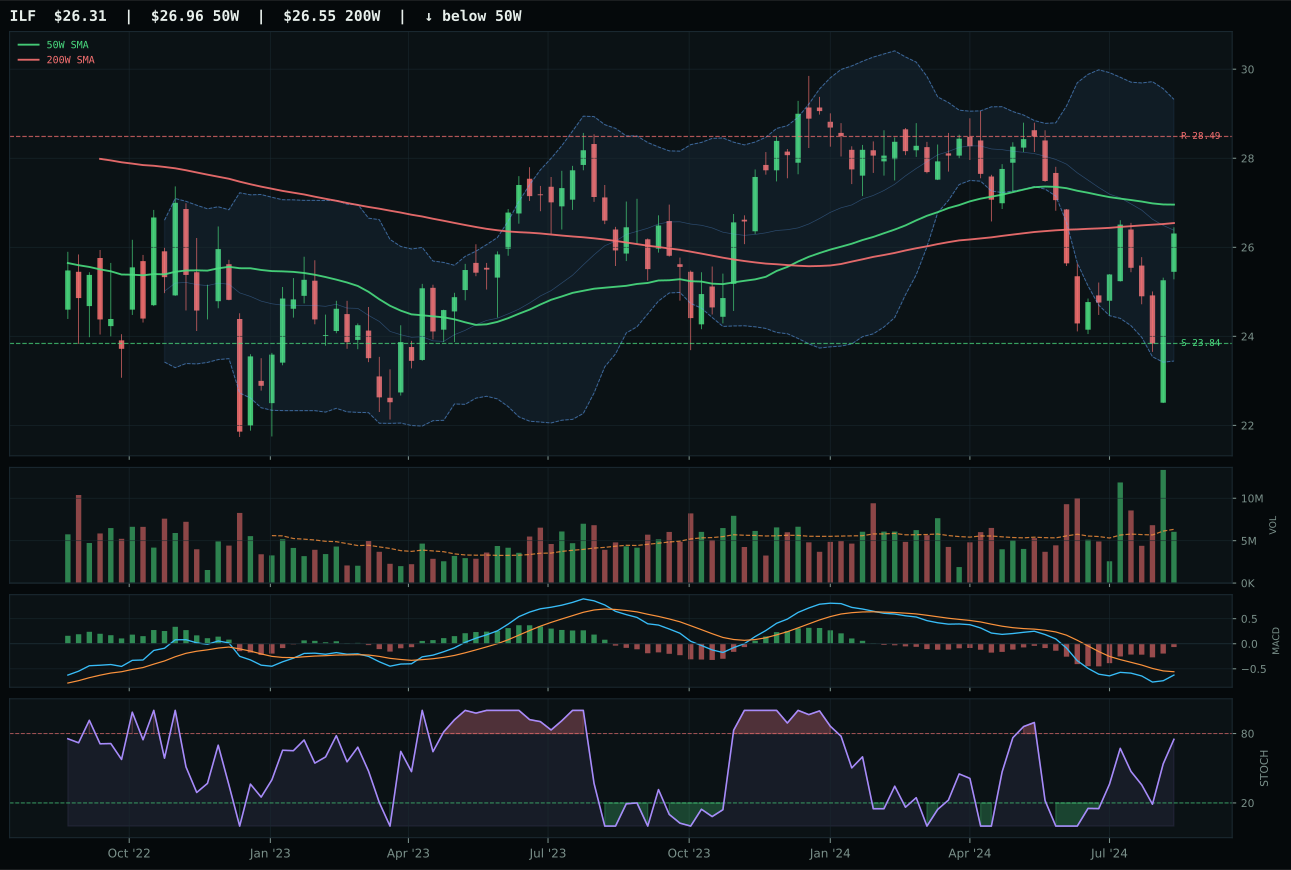
ILF has a compression near 50W profile with -12.3% 13-week relative strength versus SPY.
A failed hold above support would weaken the setup.
Actionable but governed by invalidation levels.
INDA wins the emerging markets category over IEMG on the strength of superior category-relative strength (7.4% versus 0.0%) and comparable structure quality (73.9 versus 73.4 structure scores), but the margin is wafer-thin in a sector being crushed by macro headwinds. India's 6.4% 13-week return and 1.7% SPY-relative strength represent the sole outperformance within the emerging-market universe, positioning INDA as the "least ugly" option rather than a genuine strength signal. Both INDA and IEMG face identical bearish/weakening MACD and sit 11.9% to 12.0% above their respective 50-week moving averages, but INDA's stochastic RSI at 0.20 (falling/neutral) suggests the overbought excess is gradually unwinding versus IEMG's rising-mid-zone reading. Volume thin at 0.63x for INDA and unspecified for IEMG, indicating both face limited institutional participation. The 84.6/100 trend score for INDA is deceptive—it reflects positioning above moving averages, not bullish momentum—while the 38.9/100 risk-reward admits that INDA is already expensive 11.9% above its 50W with minimal upside to resistance.
Industrial Metals — COPX
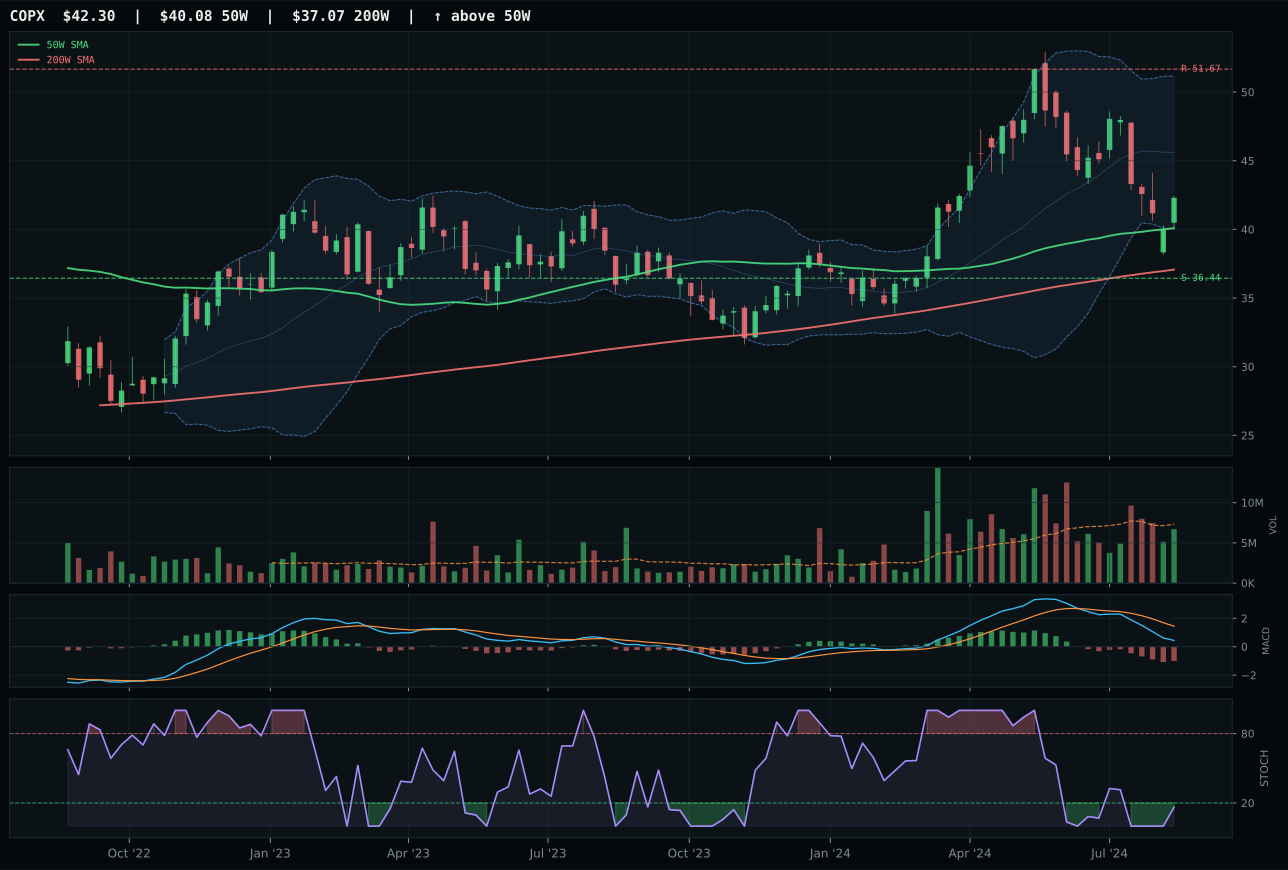
COPX has a neutral structure profile with -22.8% 13-week relative strength versus SPY.
A failed hold above support would weaken the setup.
Actionable but governed by invalidation levels.
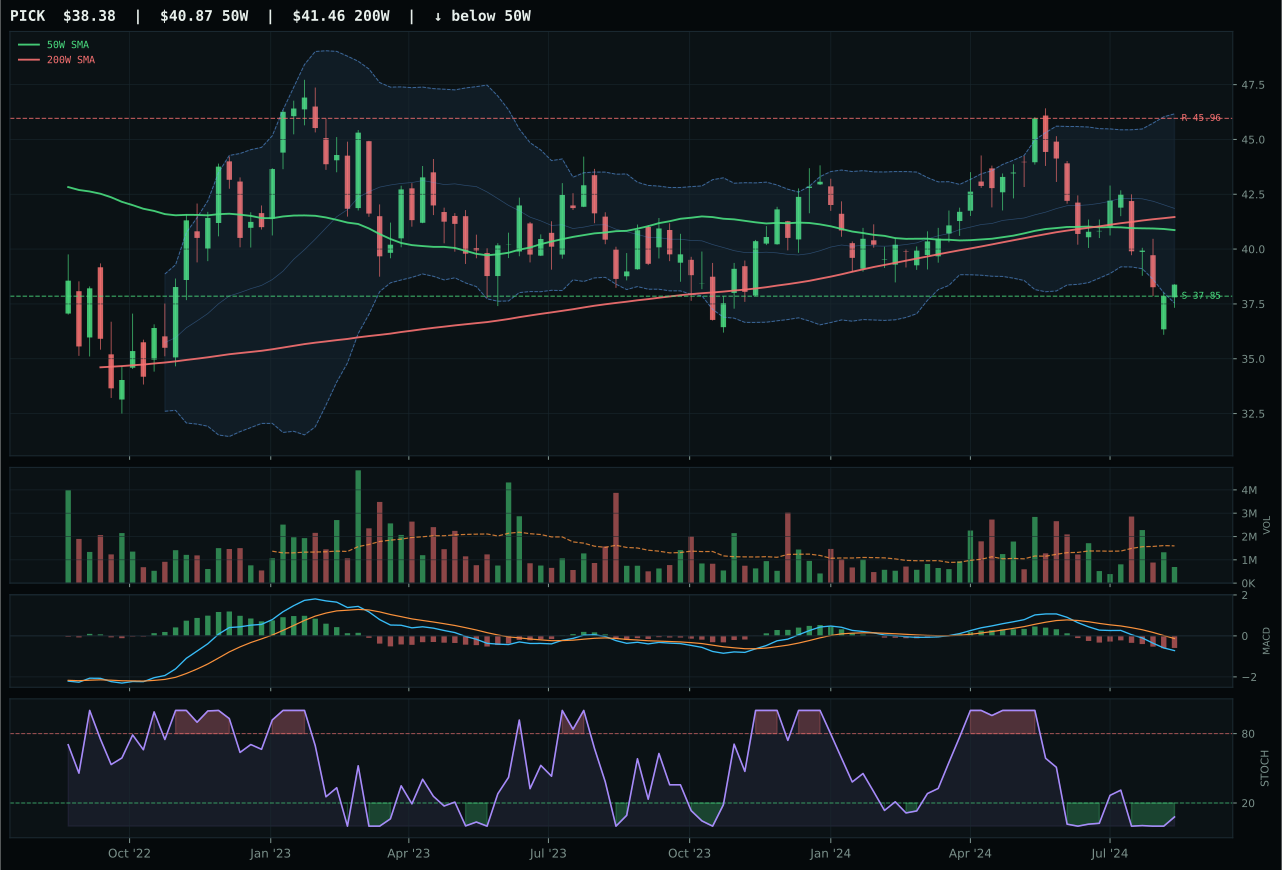
PICK has a pullback into support profile with -21.2% 13-week relative strength versus SPY.
Extension and support failure are the main tactical risks.
Tracked, but not top-2 eligible because: structurally broken.
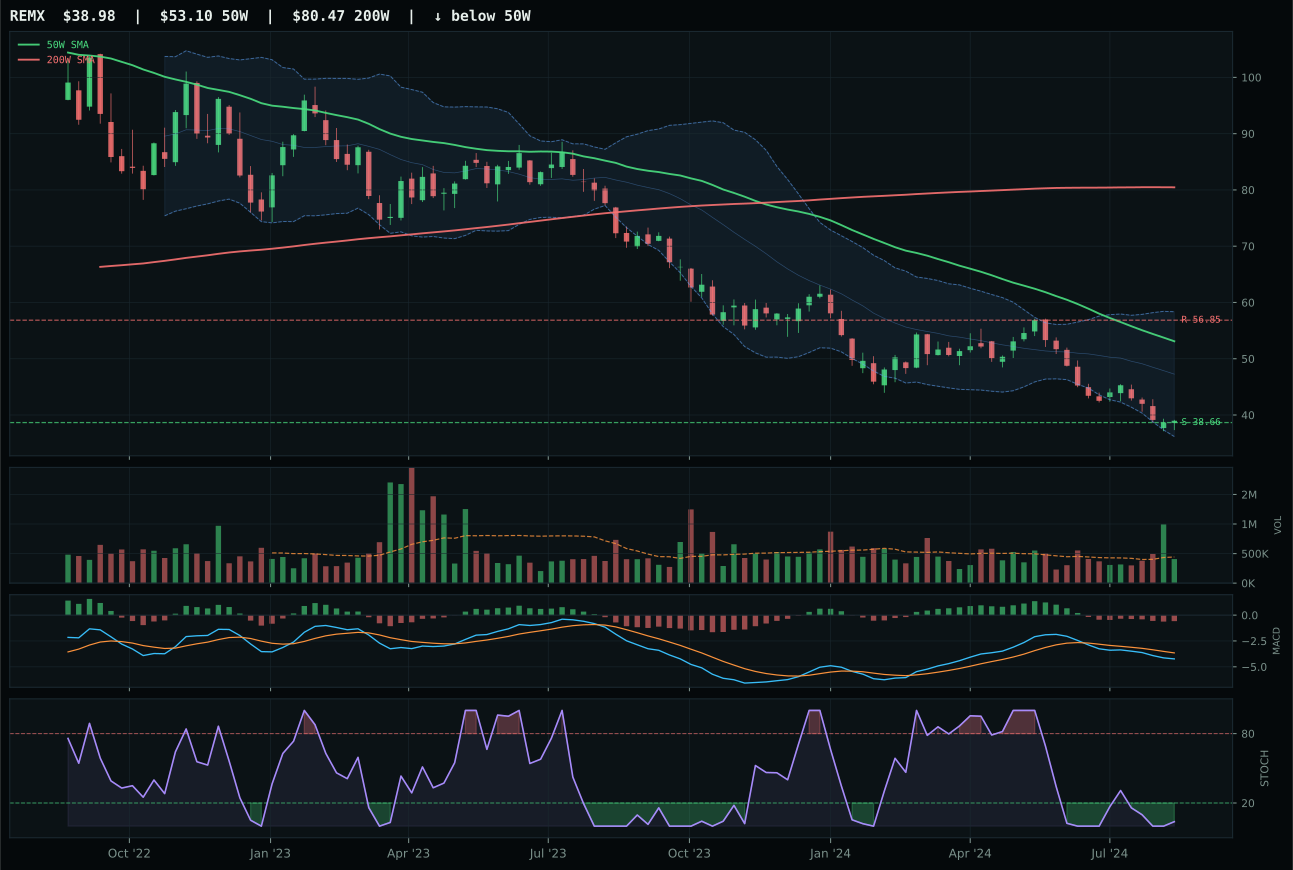
REMX has a pullback into support profile with -36.1% 13-week relative strength versus SPY.
Extension and support failure are the main tactical risks.
Tracked, but not top-2 eligible because: structurally broken.
COPX wins a deeply broken industrial metals category with a 0.8 composite score that reflects the sector's structural damage in a disinflation regime, outpacing PICK (13/100) only on tighter structure (60.4 versus 38.8) and neutral volume versus PICK's thin participation. Copper sits 5.5% above its 50-week moving average—the only bullish proximity metric in the entire basket—but the 13-week return is a brutal -18.1% with -22.8% relative weakness versus SPY, a death spiral that no amount of oversold RSI (0.16) can immediately reverse. The timing score of 91.0/100 reflects that COPX is near the 50-week moving average with MACD bearish/weakening, meaning entry risk is limited, but that's a trader's edge, not a believer's conviction. MACD's weakness and stochastic's oversold condition create a potential reversal setup, but momentum confirmation scores 0.0/100 because the 4-week and 13-week returns offer no proof of accumulation. PICK's deeper pullback (near 52-week lows) and near-50W proximity make it appear cheaper, but its thin volume means any reversal spike could evaporate on wide spreads.