
2024-08-09
Informational purposes only. The content in this report, including allocations, analysis, and commentary, is provided solely for informational and educational purposes. It does not constitute financial advice, investment advice, trading advice, or any other type of advice. Past performance does not guarantee future results. Always conduct your own research and consult a qualified financial professional before making investment decisions.
Weekly Allocation
| Ticker | Category | Weight | Role |
|---|---|---|---|
| FBTC | 50% | Overlay | |
| XLU | Utilities & Infrastructure | 10% | Top-2 (10%) |
| ITA | Defense & Aerospace | 10% | Top-2 (10%) |
| GLD | Precious Metals | 5% | Tier-2 (5%) |
| CIBR | Technology | 5% | Tier-2 (5%) |
| XLE | Traditional Energy | 5% | Tier-2 (5%) |
| MOO | Agriculture & Livestock | 5% | Tier-2 (5%) |
| AIQ | AI | 5% | Tier-2 (5%) |
| NLR | Nuclear Energy | 5% | Tier-2 (5%) |
Trade Instructions — Monday Open
Sell the tranche from 2024-07-12 (completing its 4-week hold). Buy the new tranche. Instructions show net portfolio changes — same-asset positions cancel, weight changes show the delta.
| Action | Ticker | Instruction |
|---|---|---|
| SELL | IGV | Sell 50% of IGV position (reduce 5.00% → 2.50%) |
| SELL | AIQ | Sell 50% of AIQ position (reduce 2.50% → 1.25%) |
| SELL | IGF | Sell 50% of IGF position (reduce 2.50% → 1.25%) |
| SELL | URA | Sell entire URA position (1.25% of portfolio) |
| SELL | XAR | Sell 50% of XAR position (reduce 2.50% → 1.25%) |
| SELL | INDA | Sell 25% of INDA position (reduce 5.00% → 3.75%) |
| SELL | COPX | Sell 33% of COPX position (reduce 3.75% → 2.50%) |
| BUY | NLR | Buy NLR — 12.50% of freed cash (adds 1.25% to portfolio) |
| BUY | ITA | Buy ITA — 25.00% of freed cash (adds 2.50% to portfolio) |
| BUY | CIBR | Buy CIBR — 12.50% of freed cash (adds 1.25% to portfolio) |
| BUY | XLU | Buy XLU — 25.00% of freed cash (adds 2.50% to portfolio) |
| BUY | MOO | Buy MOO — 12.50% of freed cash (adds 1.25% to portfolio) |
| BUY | XLE | Buy XLE — 12.50% of freed cash (adds 1.25% to portfolio) |
Current Portfolio After Trade
Combined holdings across all 4 active tranches. Each tranche is 25% of the portfolio.
| Ticker | % of Portfolio | Weight Bar |
|---|---|---|
| FBTC | 50.00% | |
| GLD | 7.50% | |
| NLR | 5.00% | |
| ITA | 5.00% | |
| XLU | 5.00% | |
| INDA | 3.75% | |
| BOTZ | 3.75% | |
| CIBR | 3.75% | |
| COPX | 2.50% | |
| IGV | 2.50% | |
| PAVE | 2.50% | |
| MOO | 2.50% | |
| XLE | 2.50% | |
| IGF | 1.25% | |
| XAR | 1.25% | |
| AIQ | 1.25% |
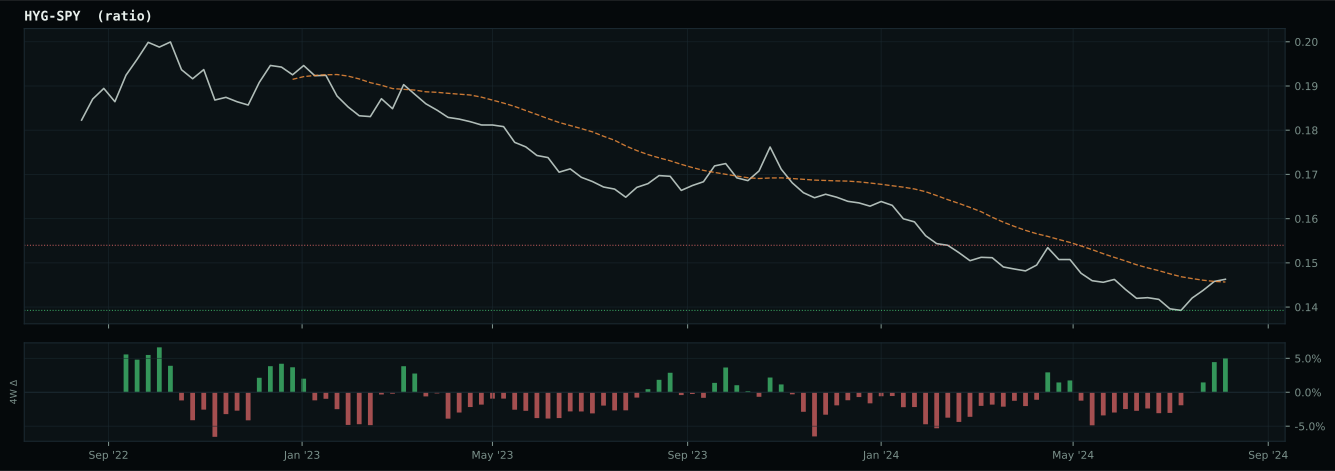
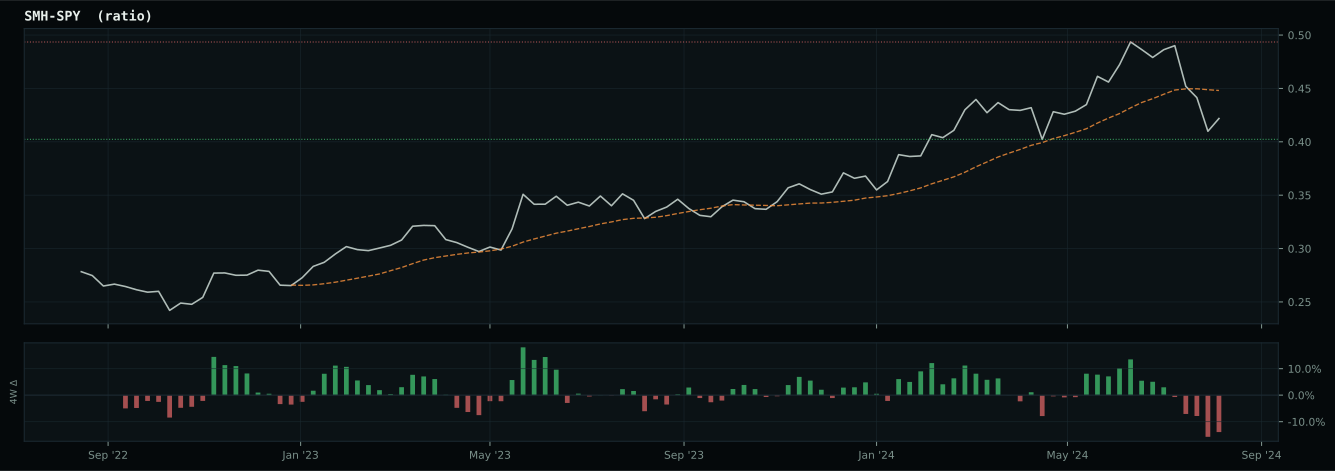
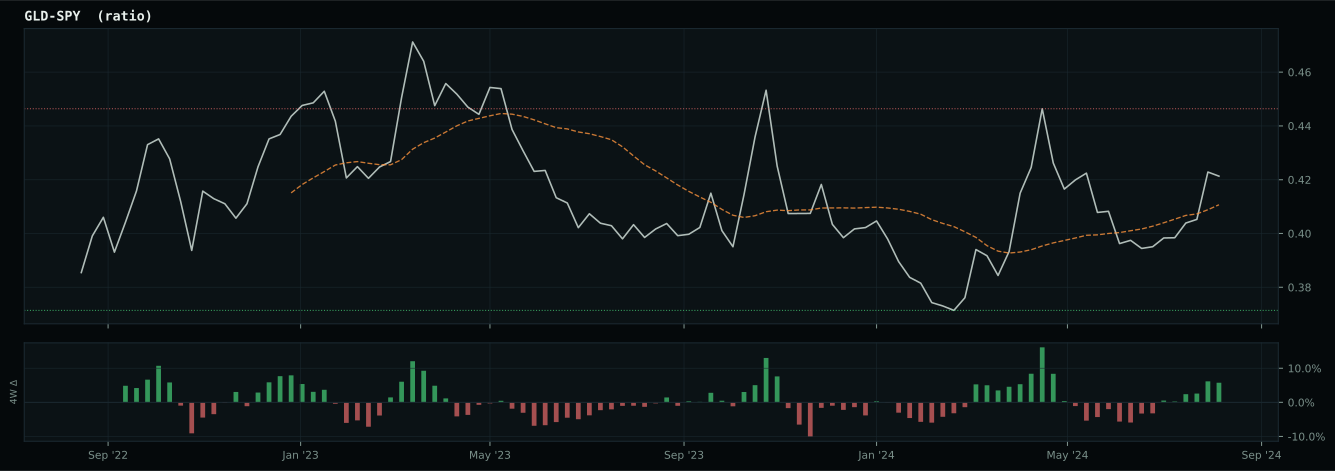
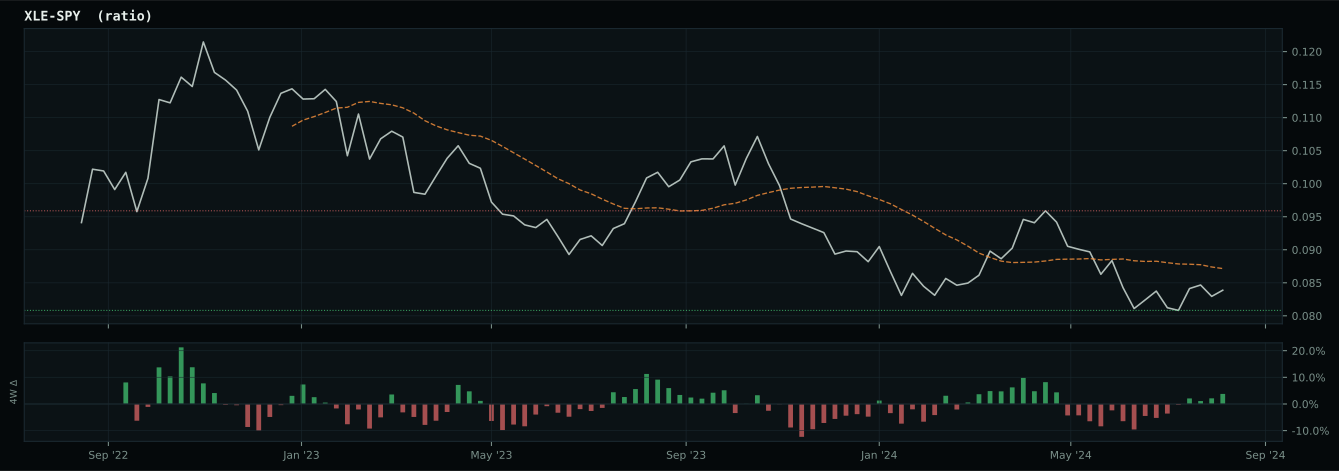
Macro Regime — Disinflation
Macro Evidence Charts
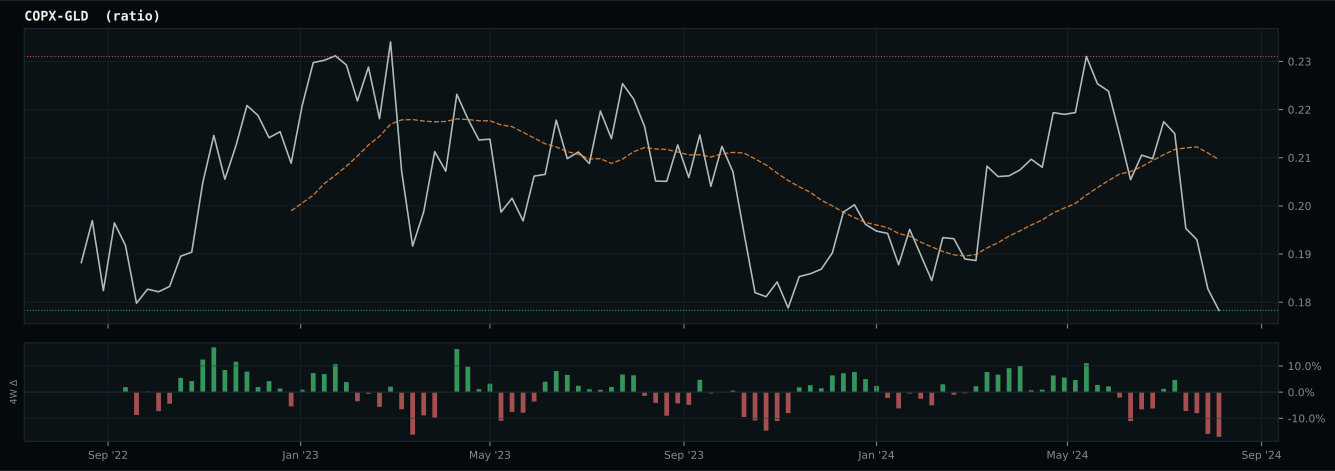
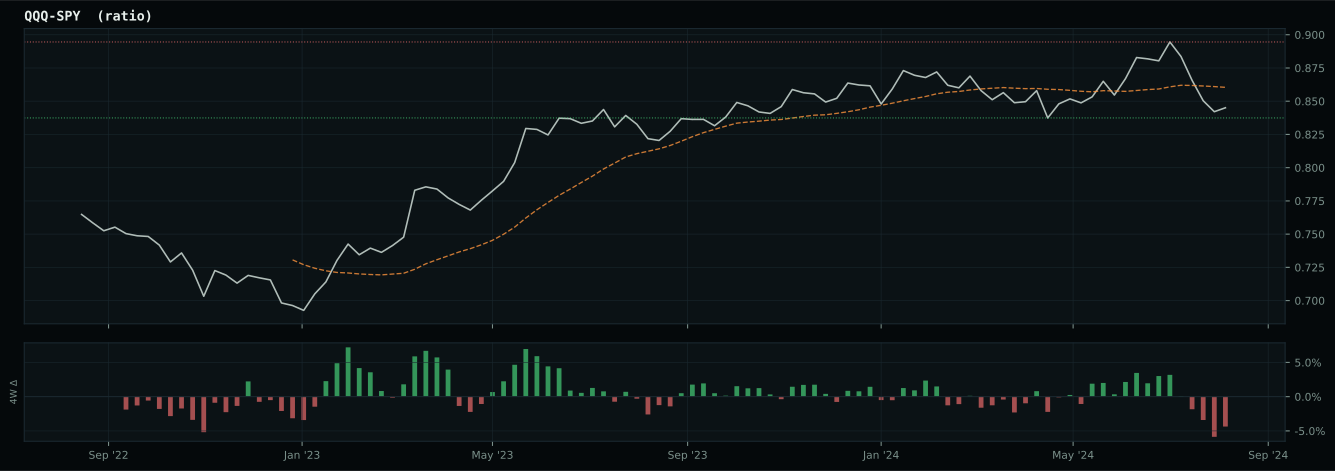
Market-implied signals behind the macro regime scores. Each ratio compares two assets; the direction and slope of the ratio is what the macro engine reads.
Crypto Regime — TrendBTC
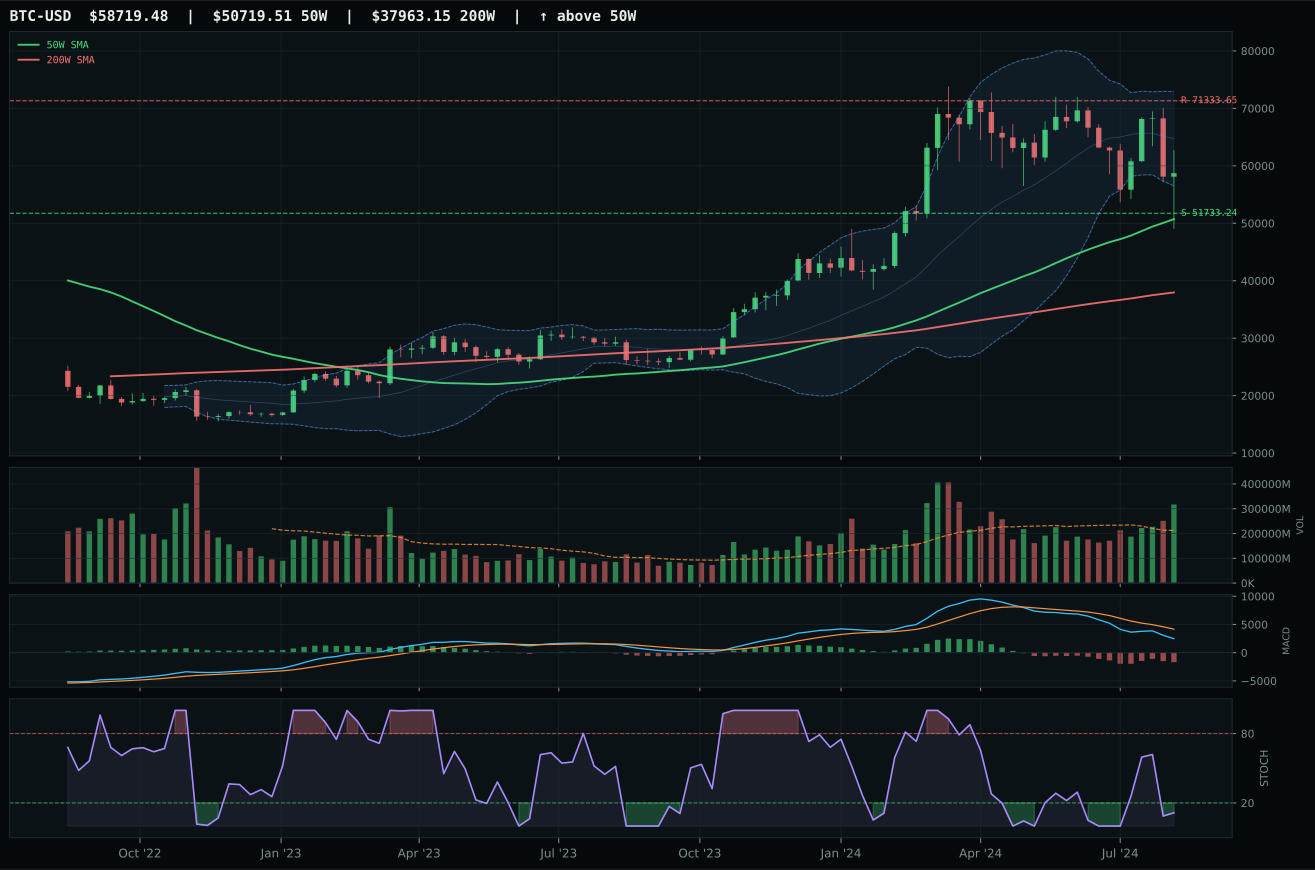
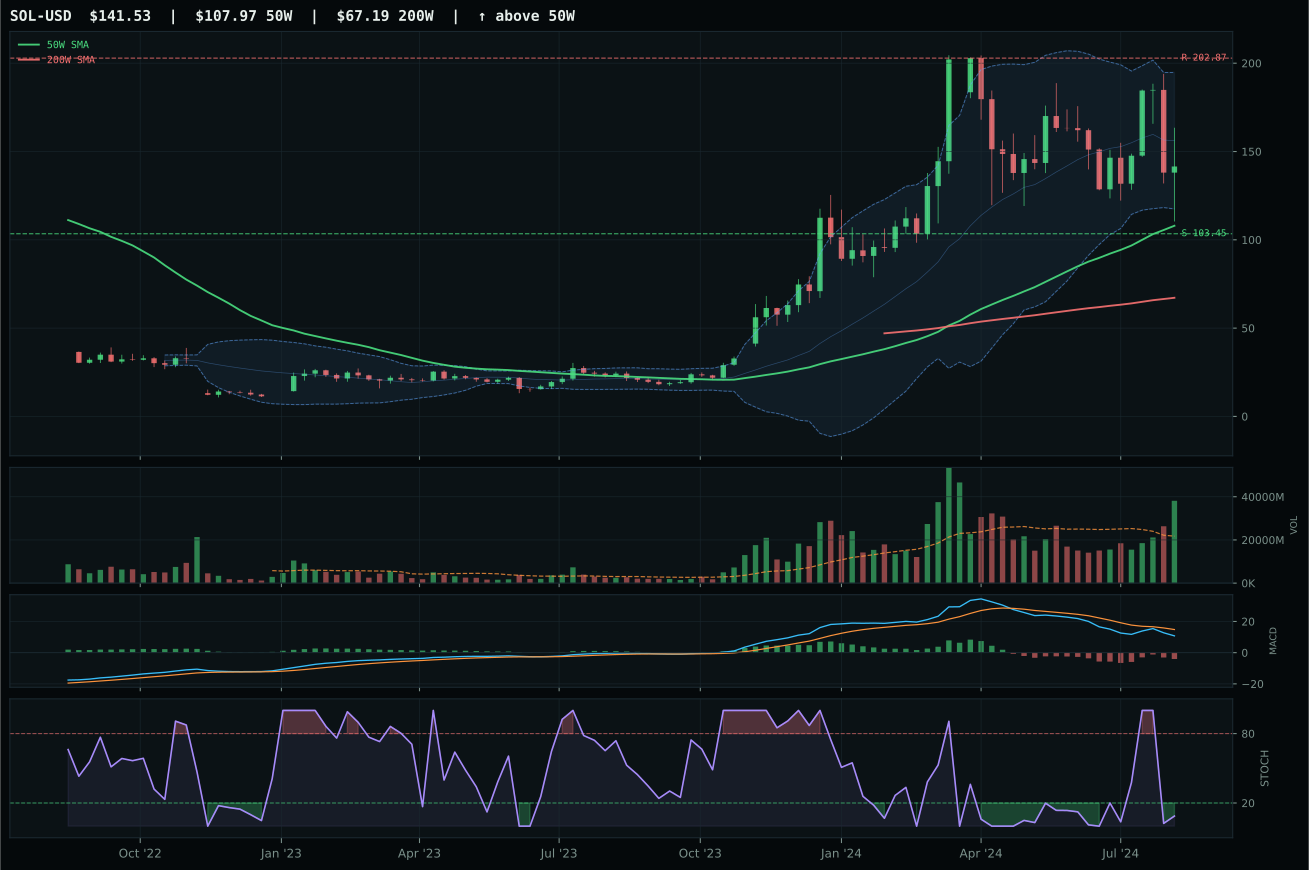
ValueBTC not armed: BTC has not made the first post-breakdown touch of the 200W buy zone after losing the 50W
TrendBTC confirmed: 2 consecutive closes above rising/flat 50W SMA
one or more available conditions failed
Category Rankings
| Rank | Category | Winner | Score | Alloc | 4W Ret | Peers (4W) |
|---|---|---|---|---|---|---|
| 1 | Utilities & Infrastructure | XLU | 67.8 | 20% | +3.54% | IGF +4.6% · PAVE -0.2% |
| 2 | Defense & Aerospace | ITA | 55.6 | 20% | +0.12% | XAR +1.2% · ROKT +0.5% |
| 3 | Precious Metals | GLD | 51.8 | 10% | +2.26% | GDX +1.3% · SLV +1.3% |
| 4 | Technology | CIBR | 44.1 | 10% | +0.83% | IGV +1.7% · XLK +0.1% |
| 5 | AI | AIQ | 27.4 | 10% | +0.81% | SMH -3.0% · BOTZ +1.2% |
| 6 | Nuclear Energy | NLR | 19.1 | 10% | -4.31% | URA -5.1% · URNM -6.3% |
| 7 | Emerging Markets | INDA | 17.2 | 10% | +2.03% | IEMG -0.2% · ILF -0.5% |
| 8 | Industrial Metals | COPX | 0.8 | 10% | -3.11% | PICK -2.8% · REMX -5.0% |
| 9 | Agriculture & Livestock | MOO | — | 0% | +3.49% | WEAT +1.6% · VEGI +4.0% |
| 10 | Traditional Energy | XLE | — | 0% | -4.07% | FCG -5.4% · XOP -6.0% |
Utilities & Infrastructure — XLU
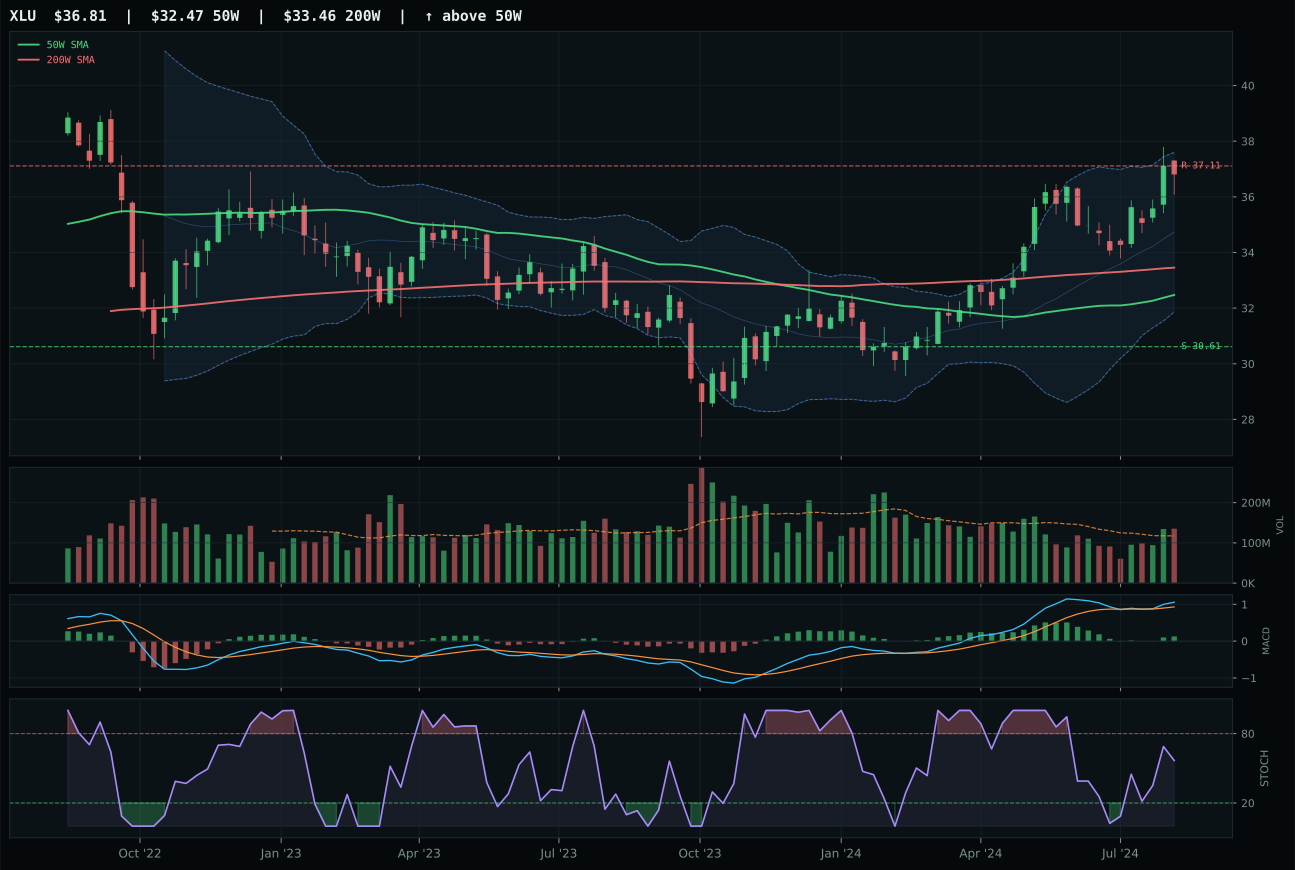
XLU has a neutral structure profile with 1.0% 13-week relative strength versus SPY.
A failed hold above support would weaken the setup.
Actionable but governed by invalidation levels.
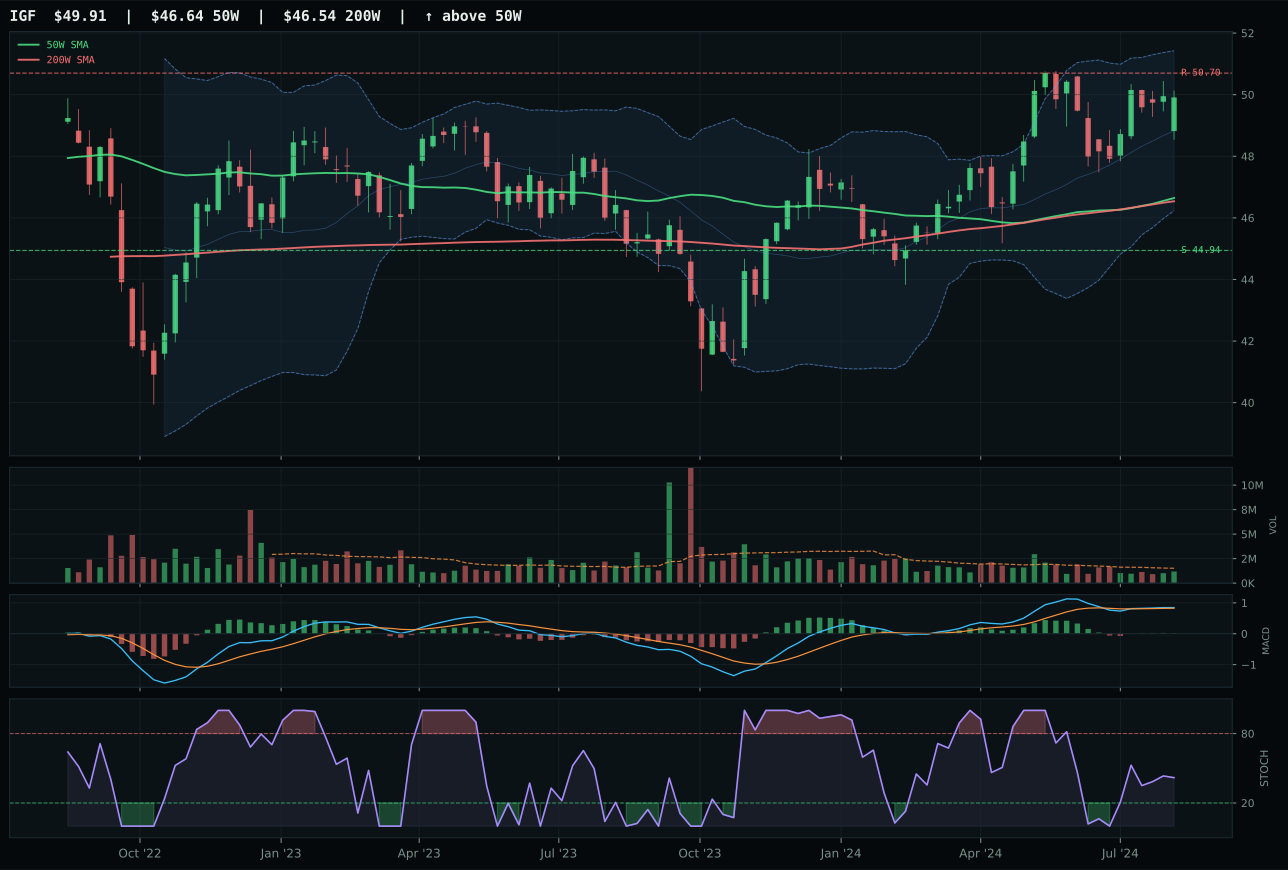
IGF has a neutral structure profile with -2.8% 13-week relative strength versus SPY.
A failed hold above support would weaken the setup.
Actionable but governed by invalidation levels.
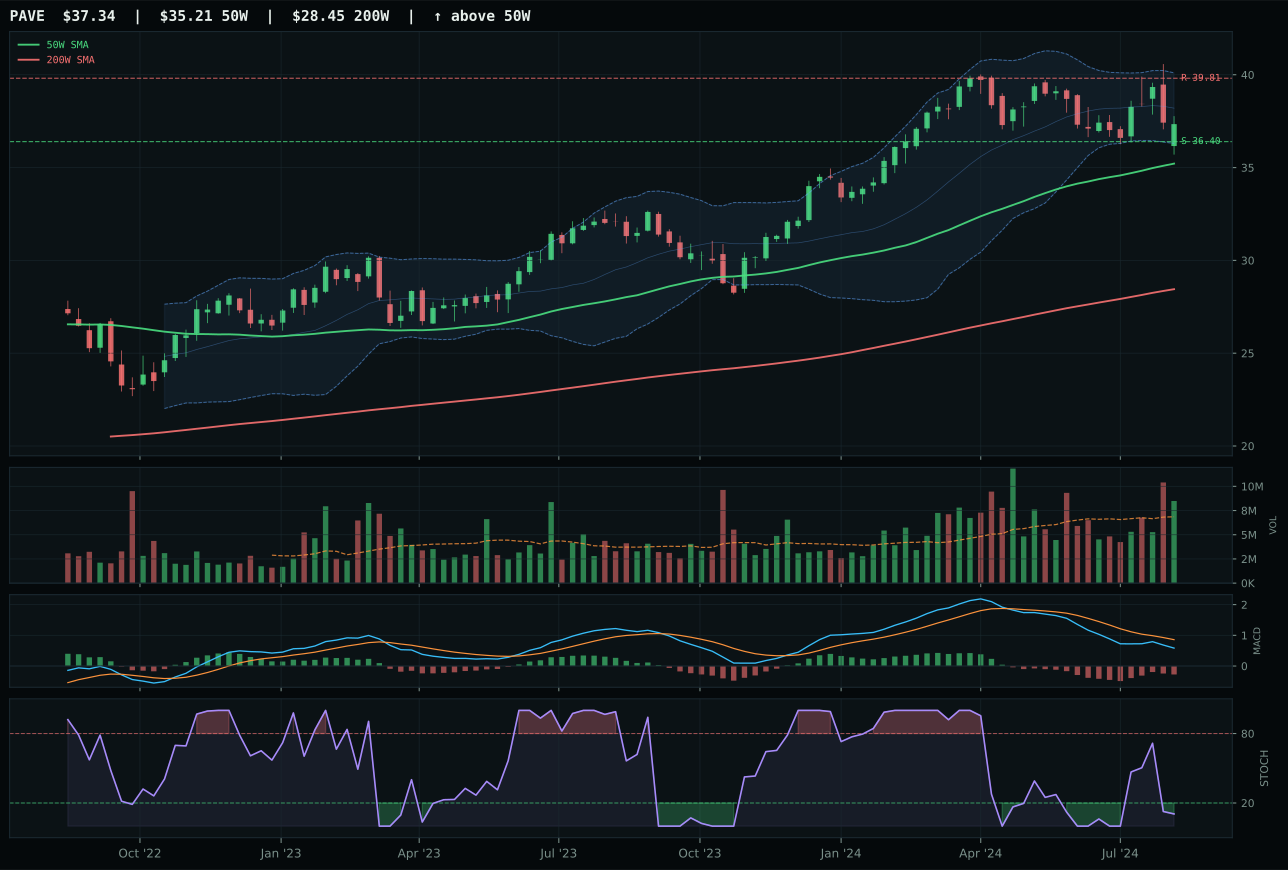
PAVE has a pullback into support profile with -7.5% 13-week relative strength versus SPY.
A failed hold above support would weaken the setup.
Actionable but governed by invalidation levels.
XLU claims the top-2 slot with a 67.8 category score and a dominant 100.0 trend rating, reflecting its role as the ultimate disinflation beneficiary. Price sits 13.3% above the 50W but in a neutral structure with clean 50.0% cleanliness and compression at 83.5, meaning this is an orderly climb, not a manic breakout. MACD is bullish and improving, stochastic RSI rises at 0.57 mid-zone, and the momentum confirmation score (82.1) is the highest in the dataset—the 4W and 13W returns are both 3.3%, showing consistency. Volume at 1.15x above-average participation with a +1.0% RS versus SPY confirm that smart money is rotating here, not just chasing yield. The risk/reward is tight (37.7) because upside to resistance sits just 0.8% away, but that matters far less than the 20.2% downside buffer to support (30.61), which is precisely the inverse of extended momentum plays. IGF loses on volume confirmation (neutral vs above-average) and structure cleanliness (73.2 vs 75.1), the kinds of tiebreakers that matter when both charts are climbing into the same macro narrative.
Utilities & Infrastructure earns a top-2 allocation slot at 20% (alongside XLU receiving the full position) because it is the highest-ranked category outside of FBTC crypto, with a category score of 67.8 that reflects both strong technical setup and positive macro tailwinds. Category-level macro fit of 64.0 is strong because disinflation helps regulated utilities by 7 points and transition/mixed macro state adds 4 more points, while liquidity stress is only negative 3—the lightest burden for any category outside defense. XLU's technical evidence of 89.0 is the second-highest in the portfolio, combined with macro fit of 56.0, creating a setup where both technical momentum and macro regime support continued holding. Regulated utility dividends become more attractive as discount rates fall under disinflation, and infrastructure assets provide inflation-resistant cash flow in a tightening credit environment. XLU's risk-reward of 37.7 is tight (only 0.8% upside to resistance), but the allocation is based on defensive positioning rather than aggressive upside capture—the category earns its top-2 slot as the best risk-adjusted hold in a regime where capital preservation and steady yield matter more than breakout moves.
Defense & Aerospace — ITA
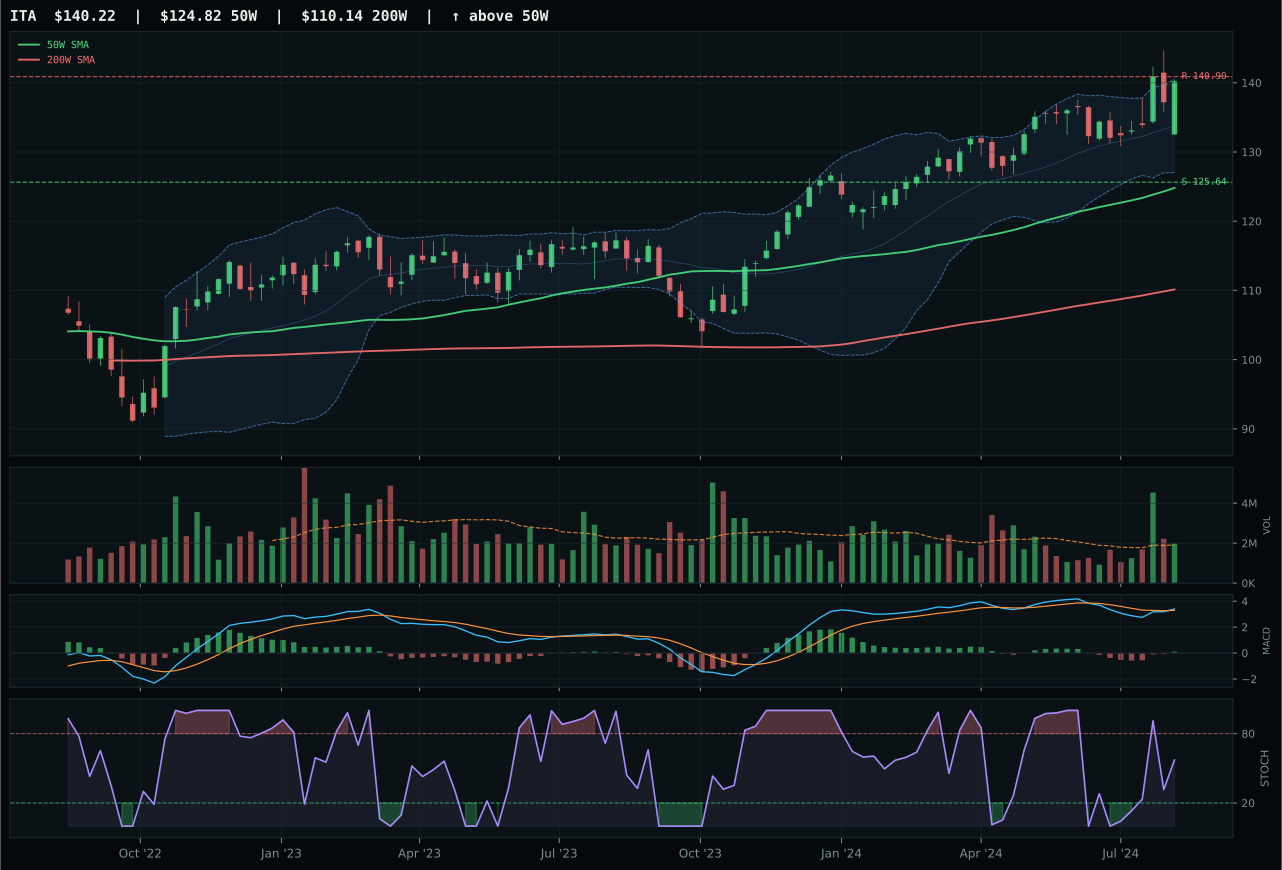
ITA has a neutral structure profile with 1.5% 13-week relative strength versus SPY.
A failed hold above support would weaken the setup.
Actionable but governed by invalidation levels.
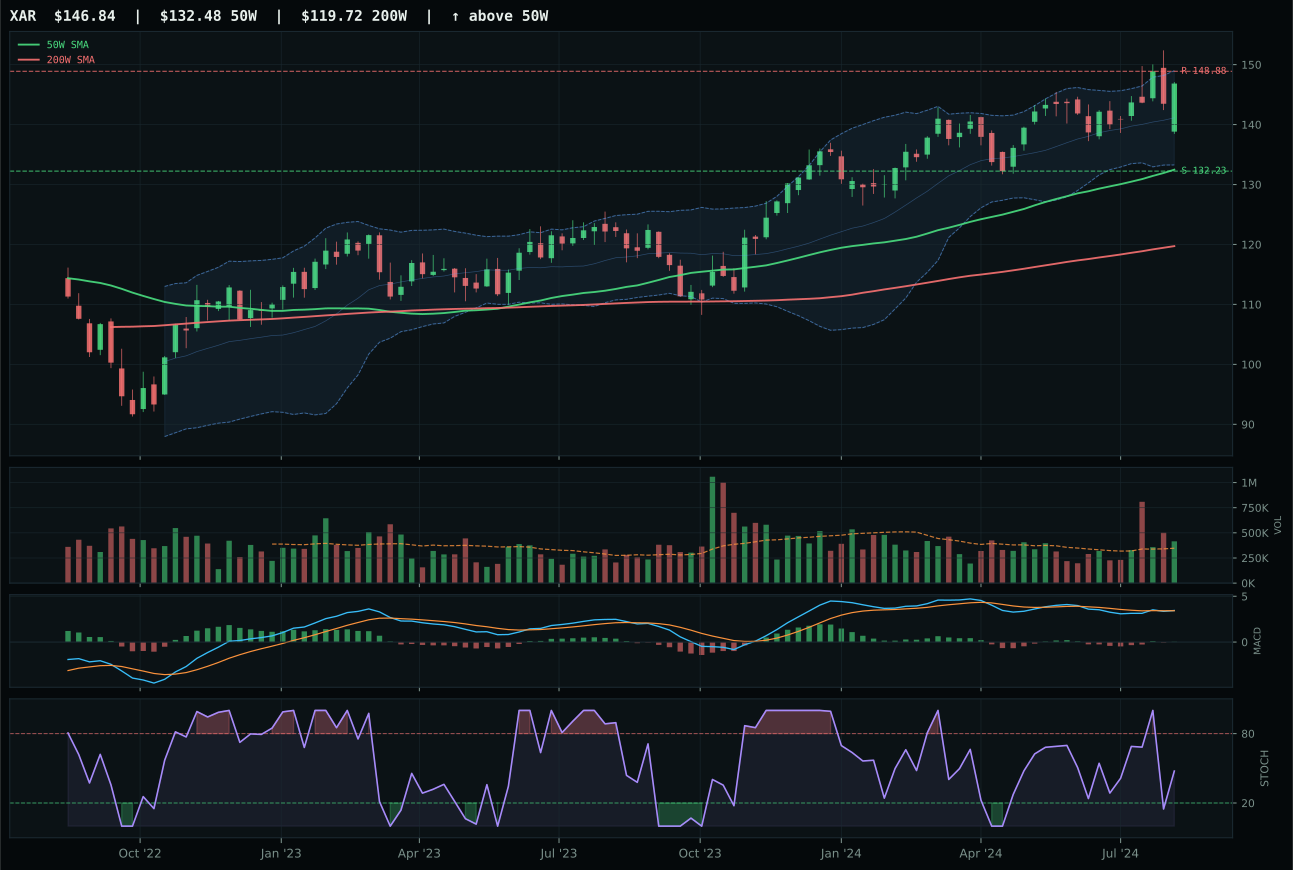
XAR has a neutral structure profile with 0.9% 13-week relative strength versus SPY.
A failed hold above support would weaken the setup.
Actionable but governed by invalidation levels.
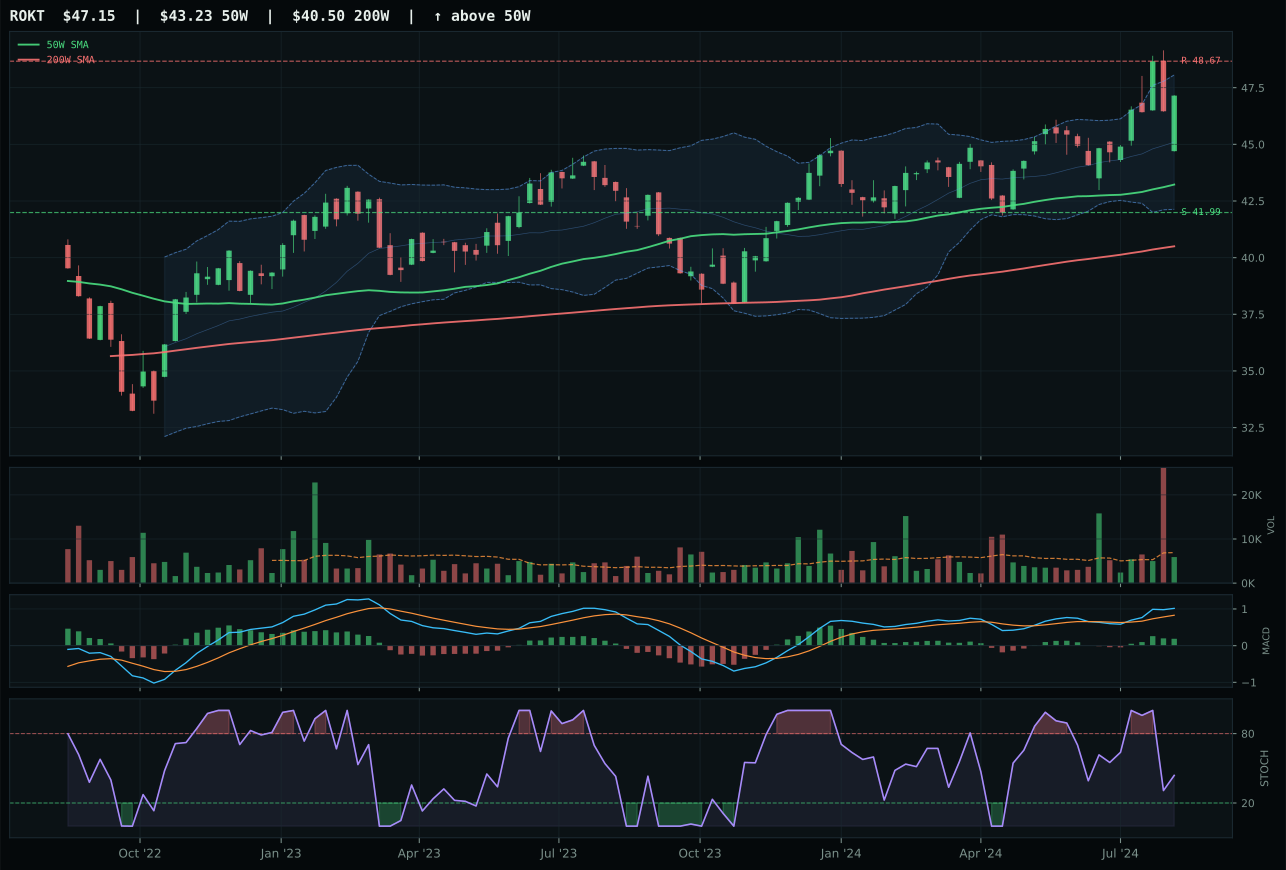
ROKT has a neutral structure profile with 2.1% 13-week relative strength versus SPY.
A failed hold above support would weaken the setup.
Tracked, but not top-2 eligible because: .
ITA claims the top-2 slot with authority, posting a perfect 100.0 trend score and a 77.5% momentum confirmation that reflects real accumulation—the 4W and 13W returns (5.3% and 3.8%) are both positive and supported by a bullish, improving MACD and stochastic RSI rising in the mid-zone at 0.57. The 12.3% extension from the 50W is meaningful but not reckless; the chart sits in the upper retracement zone near Fib 0.236 at 134.57, exactly where fresh buyers expect sellers to show up. Volume at 1.04x the 20W average is neutral, which paradoxically makes this setup cleaner—the move has been made on measured participation, not panic buying or short covering. XAR loses ground because stochastic RSI has already rolled over to falling/neutral while MACD is still improving, a divergence that suggests early-stage deterioration in momentum confirmation despite a similarly strong trend score.
Defense & Aerospace earns a top-2 slot with a category score of 55.6, the second-highest across all ten categories this week, and merits 10% allocation because it is the only high-conviction technical setup that also has positive macro tailwinds in a disinflation regime. Liquidity stress is only negative 4 (the lightest burden in the portfolio), and the macro descriptors are neutral rather than hostile—no credit stress penalty and no disinflation headwind. ITA's technical evidence is a robust 83.3, and the category-level macro fit of 51.0 is the highest in the portfolio, reflecting that defense spending is countercyclical to disinflation and credit tightening. The bullish MACD, rising stochastic RSI, and above-average 13-week momentum create an asymmetry where the downside risk is capped by support at 125.64 (11.6% below current price) while upside extends to 140.90—an attractive risk-reward for a category that has momentum and macro permission to run.
Precious Metals — GLD
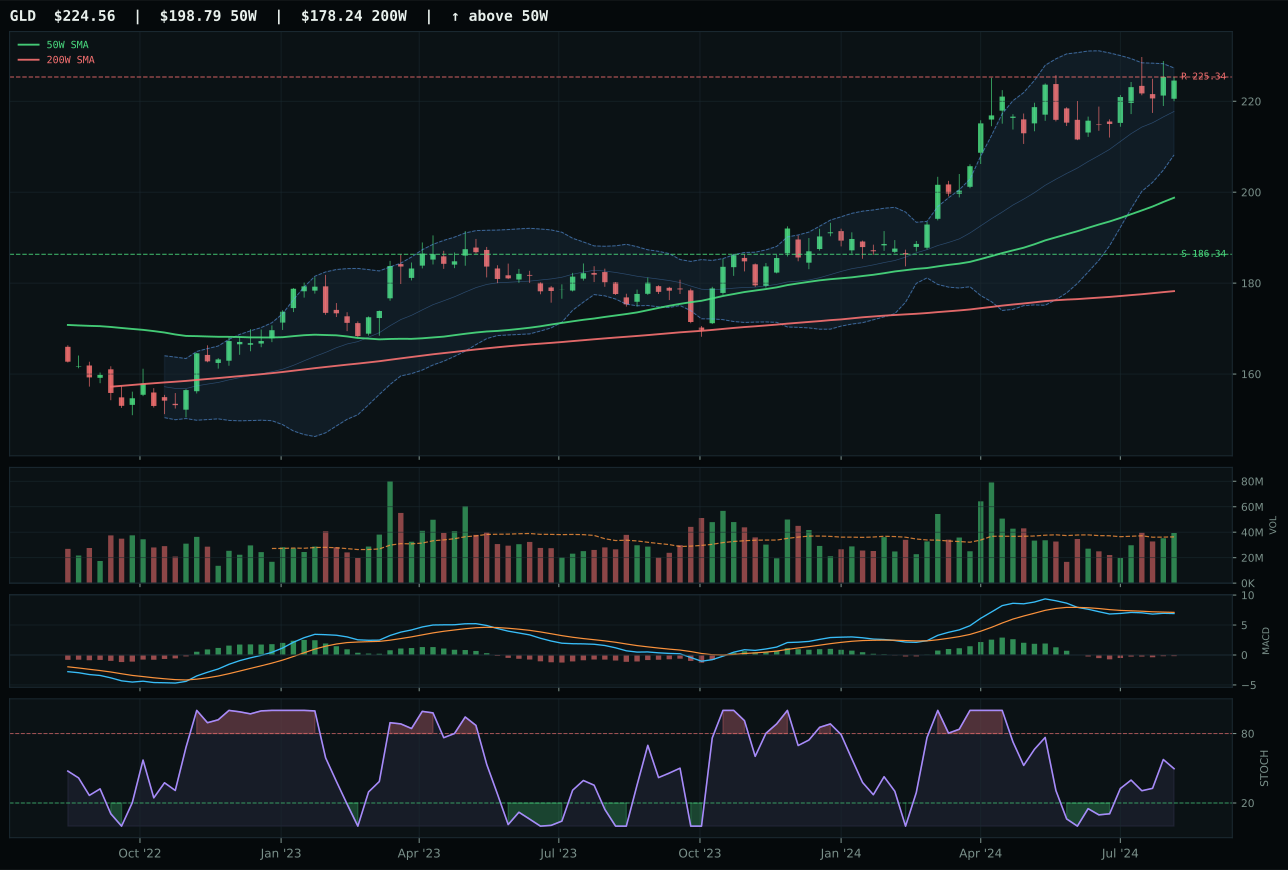
GLD has a neutral structure profile with 0.3% 13-week relative strength versus SPY.
A failed hold above support would weaken the setup.
Actionable but governed by invalidation levels.
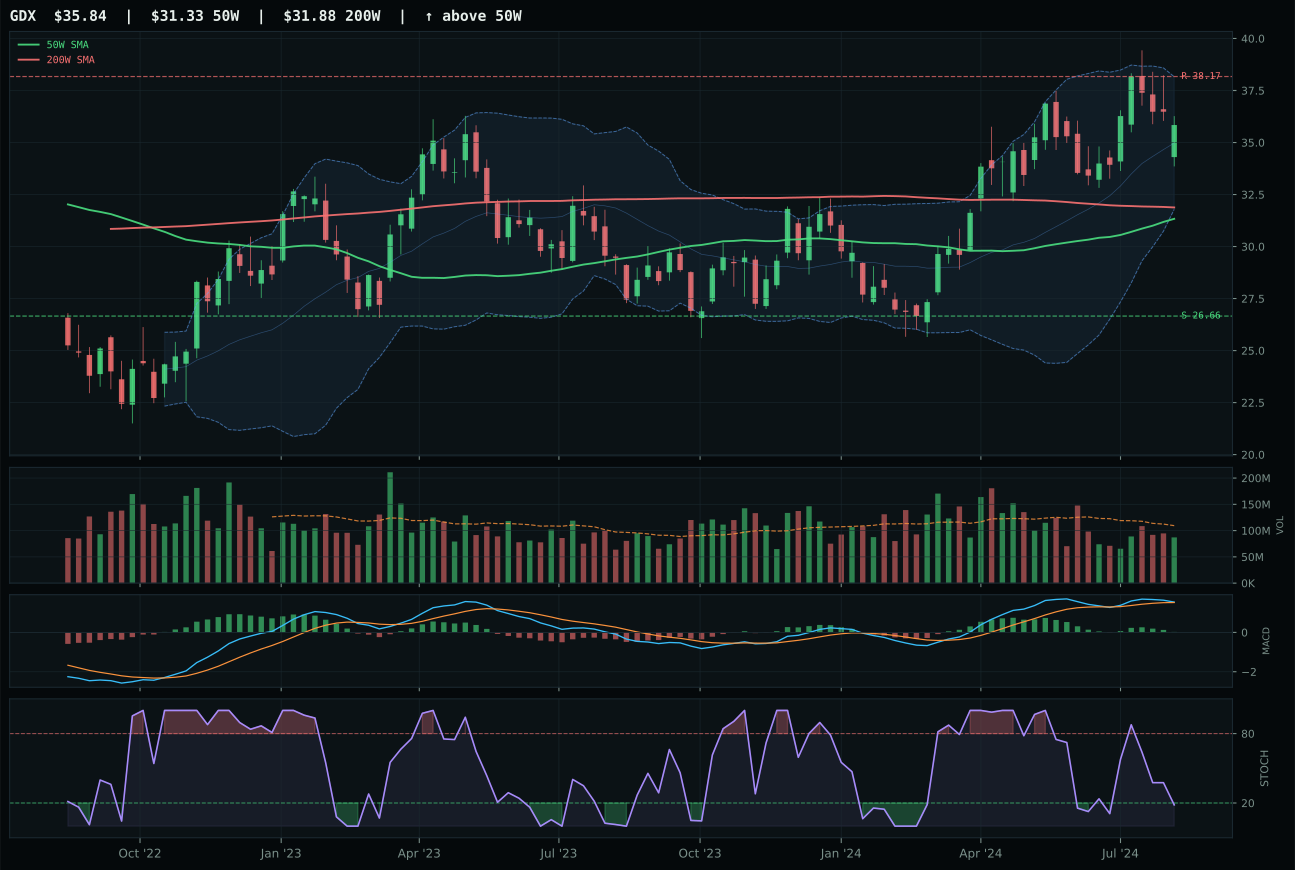
GDX has a neutral structure profile with -0.7% 13-week relative strength versus SPY.
A failed hold above support would weaken the setup.
Actionable but governed by invalidation levels.
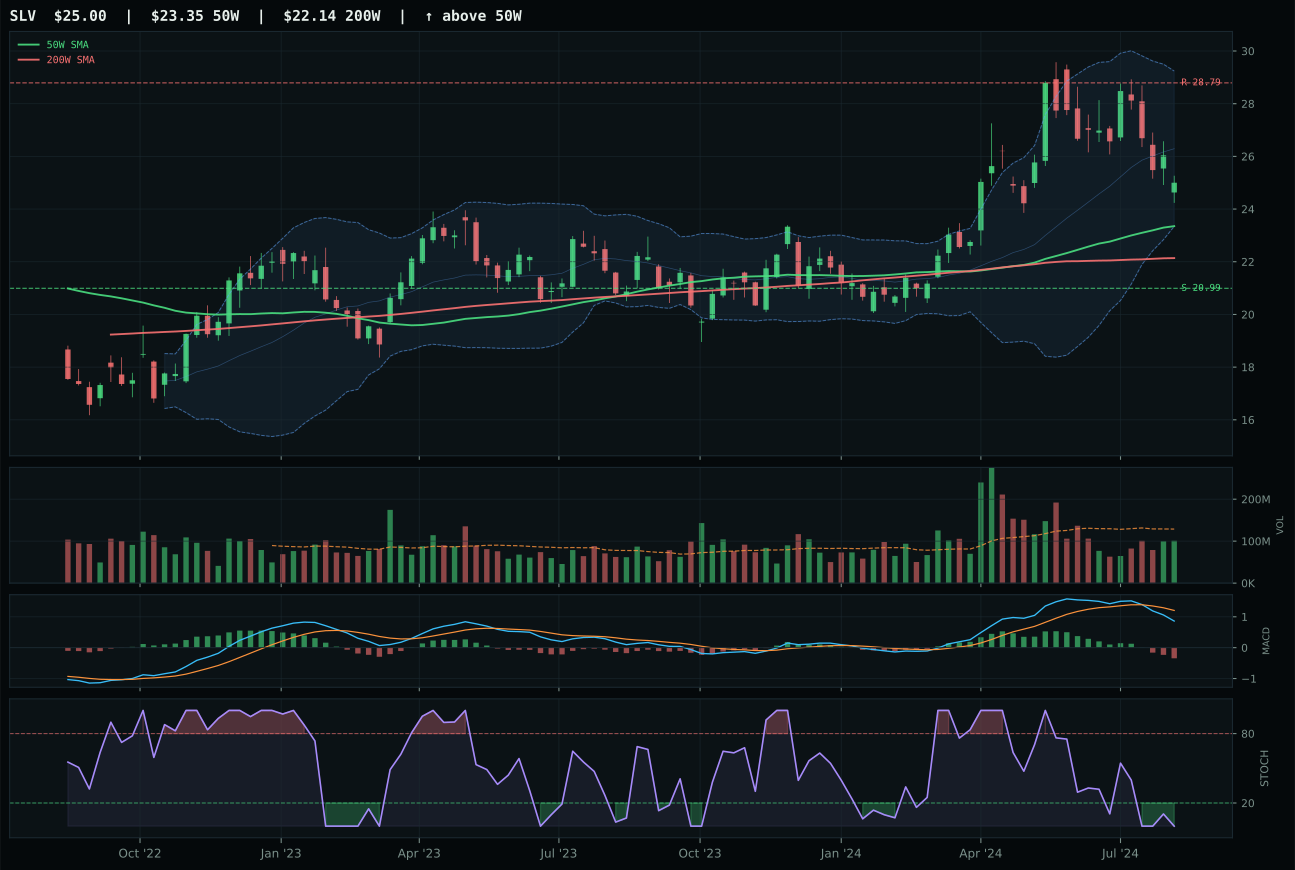
SLV has a neutral structure profile with -5.3% 13-week relative strength versus SPY.
A failed hold above support would weaken the setup.
Actionable but governed by invalidation levels.
GLD wins with a 51.8 category score, earning a 5% allocation slot on the strength of its 68.8/100 technical evidence and 58.0/100 macro fit—the gold thesis is cleanly supported by disinflation pressure (+8). The trend score of 93.5 reflects price climbing 13.0% above the 50W while still sitting only 0.3% above SPY, a relative-strength profile that tells you smart money is diversifying into monetary hedges without abandoning equities entirely. The setup sits at Fib 0.236 near a 52W high, which ordinarily would suggest extension risk, but the MACD is bearish but improving and stochastic RSI rises at 0.50 mid-zone—this is a chart gaining momentum into resistance, not one that has already broken. GDX loses because stochastic RSI sits at true oversold (0.12 area), MACD is flattening despite being technically bullish, and timing scores 70.0 versus 75.0, all indicating the miner thesis is further back in the mean-reversion cycle than gold itself.
Precious Metals earns a 5% allocation with a category score of 51.8, ranking it as the third-best category outside the top-2 slots. Category-level macro fit of 64.0 is strong because disinflation helps the gold narrative by 7 points and active disinflation pressure adds another 6 points—the clearest macro tailwind in the portfolio. GLD's technical evidence of 68.8 combined with macro fit of 58.0 creates a setup where both technical and macro conditions support holding. The risk-reward of 37.3 is tight (only 0.3% upside to resistance versus 20.5% downside to support), which would normally be disqualifying, but in a disinflation regime, gold's role as the non-correlated hedge justifies the allocation despite the asymmetry. For GLD to move into 10% or 20%, the stochastic RSI must establish a sustained rising pattern above 0.60 and volume confirmation must move from neutral to above-average participation; currently at 1.08x the 20-week average, there is room for institutional accumulation to accelerate the move.
Technology — CIBR
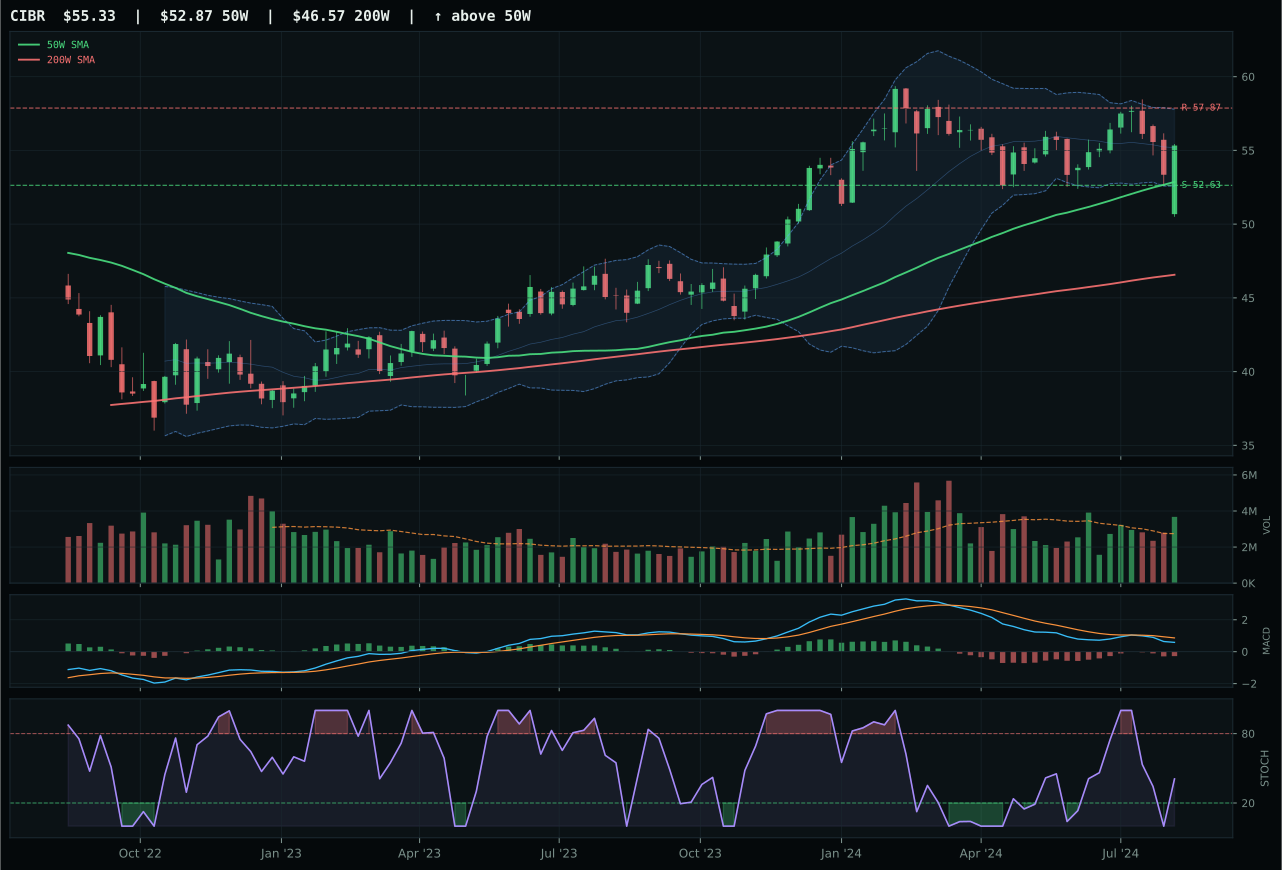
CIBR has a neutral structure profile with -0.8% 13-week relative strength versus SPY.
A failed hold above support would weaken the setup.
Actionable but governed by invalidation levels.
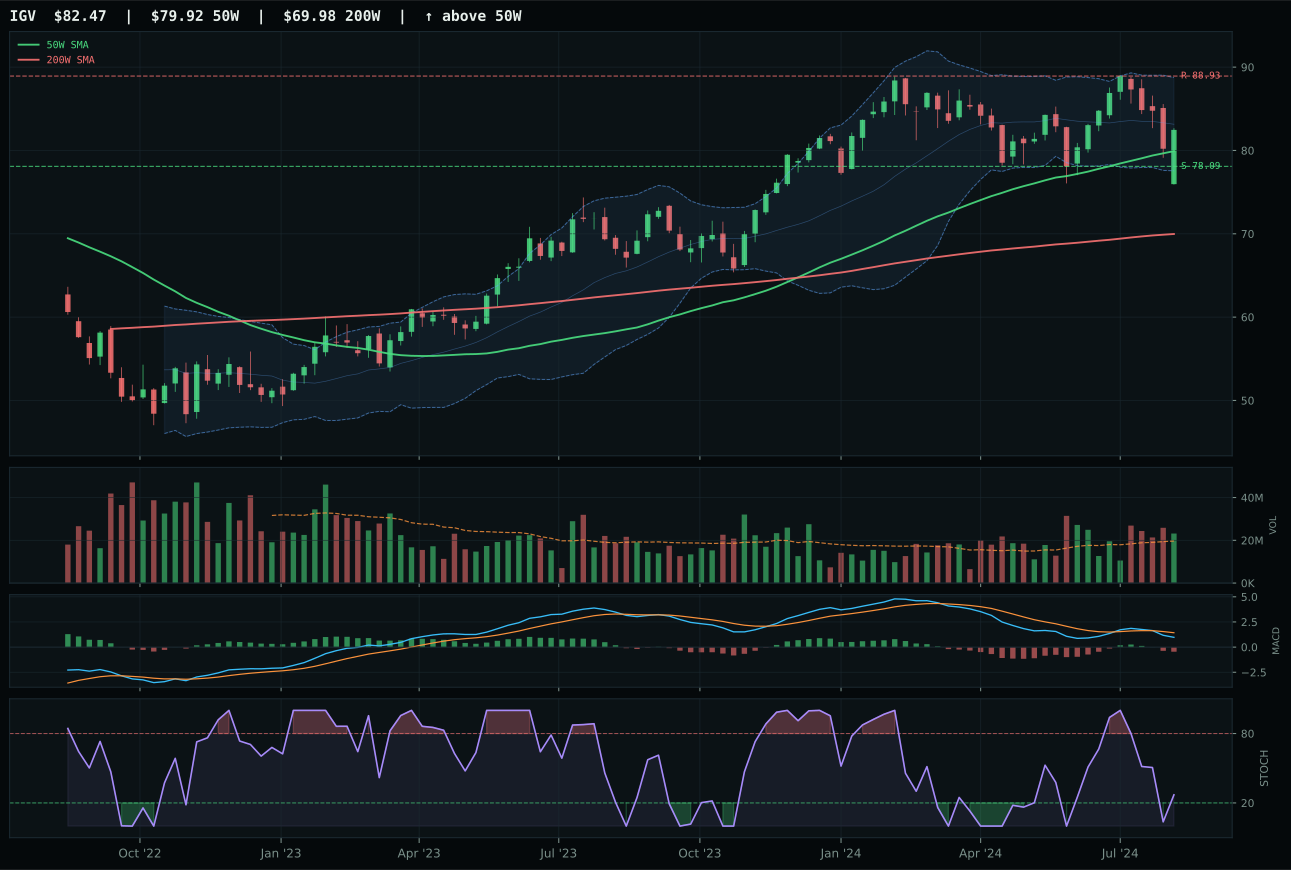
IGV has a neutral structure profile with -1.0% 13-week relative strength versus SPY.
A failed hold above support would weaken the setup.
Actionable but governed by invalidation levels.
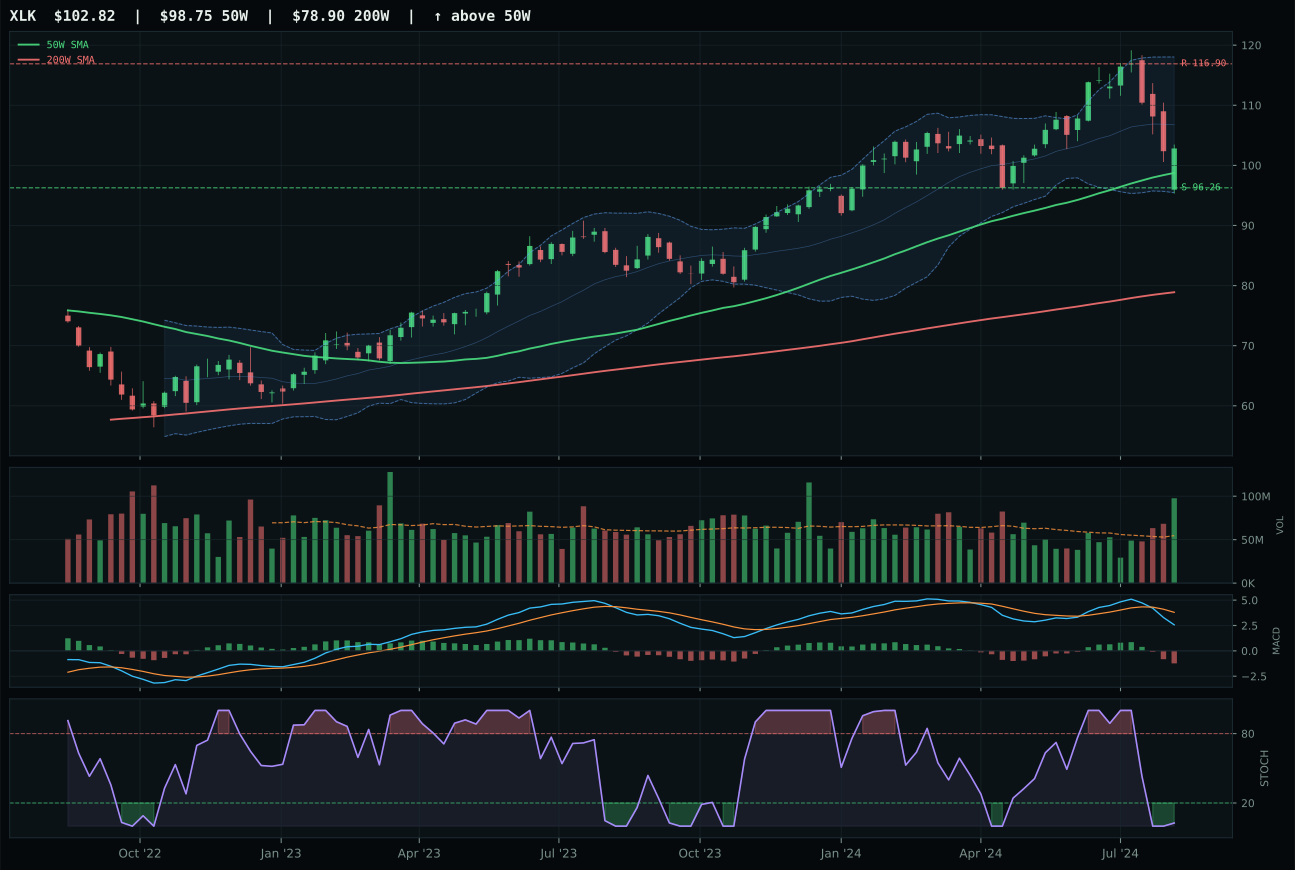
XLK has a neutral structure profile with -2.3% 13-week relative strength versus SPY.
A failed hold above support would weaken the setup.
Actionable but governed by invalidation levels.
CIBR edges past IGV on the narrowest of margins—0.1 points separates them in the composite score, but the category-relative strength differential tells the story: CIBR holds 0.3% leadership within its three-ETF basket while IGV sits flat. The cybersecurity thesis is holding price above both the 50W and 200W, with neutral structure and 1.34x volume participation above the 20W average, indicating sponsorship rather than distribution. MACD remains bearish but the stochastic RSI sits at 0.41 in the falling/neutral zone, which is preferable to IGV's identical MACD action paired with identical timing score—the tiebreaker is that fresh volume is arriving into this neutral setup. The risk asymmetry shows 5.1% downside to support versus 4.4% upside to resistance, suggesting this is neither a breakout nor a capitulation, but rather a patience trade where the 4.7% distance from the 50W keeps the setup from being extended.
Technology ranks below the top two categories at 44.1, placing it outside the core allocation this week despite CIBR's clean technical win. The category-level macro fit of 45.0 reflects disinflation helping the narrative by 7 points, but that tail wind is overwhelmed by 10 points of liquidity stress headwind—a regime shift that matters more to technology's valuation multiple than cybersecurity's narrative can offset. Both active credit stress (down 7) and active disinflation pressure (up 5) create cross-currents: cheaper discount rates help long-duration growth stocks, but constrained credit conditions mean capital allocation is tightening rather than expanding. CIBR's 5% sleeve allocation represents a compromise: the technical setup is sound enough to maintain exposure, but the category's rank outside the top two means it lacks the asymmetry required in a tightening regime. For CIBR to move into 10% or higher, stochastic RSI needs to stop falling and momentum confirmation must move above 50; currently at 33.2, that persistence gap is disqualifying.
AI — AIQ
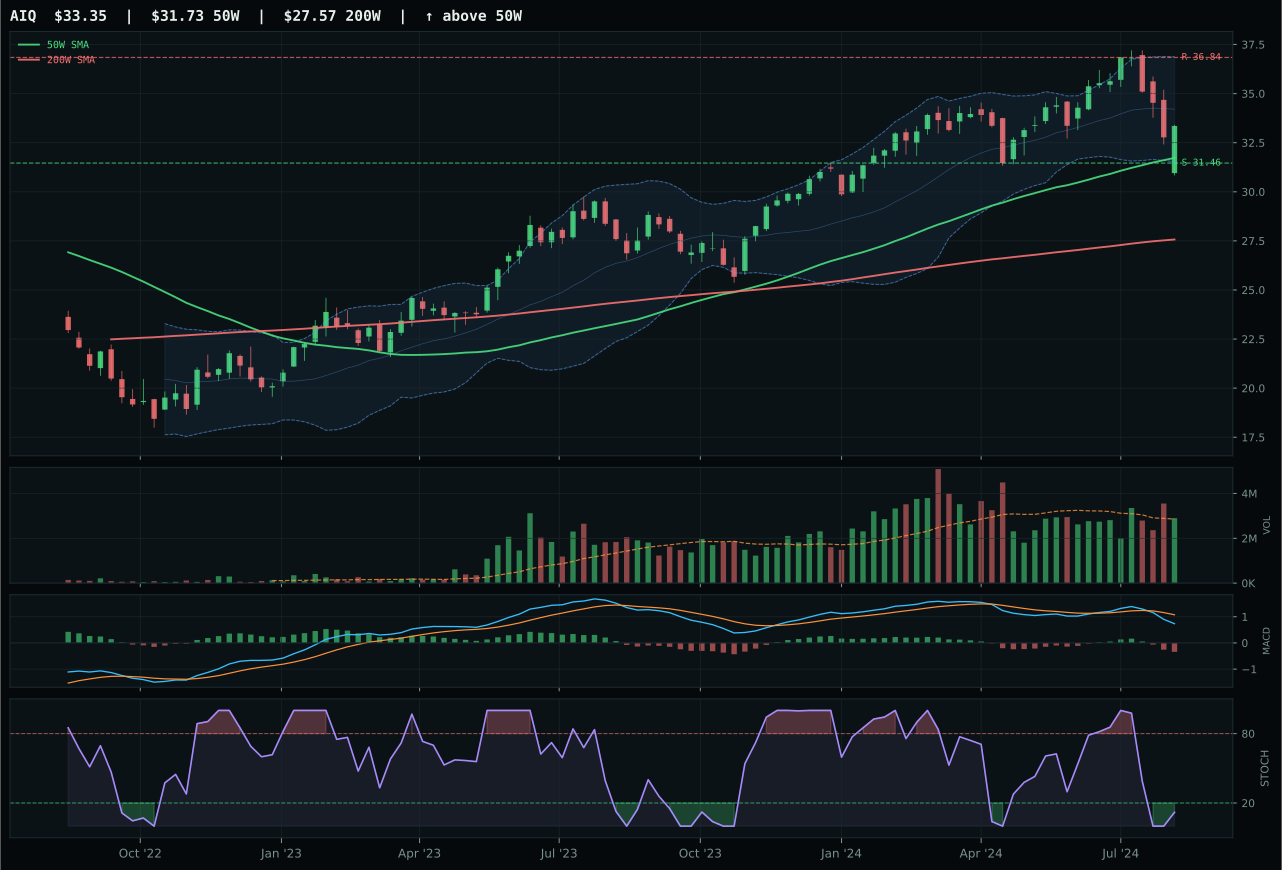
AIQ has a neutral structure profile with -2.5% 13-week relative strength versus SPY.
A failed hold above support would weaken the setup.
Actionable but governed by invalidation levels.
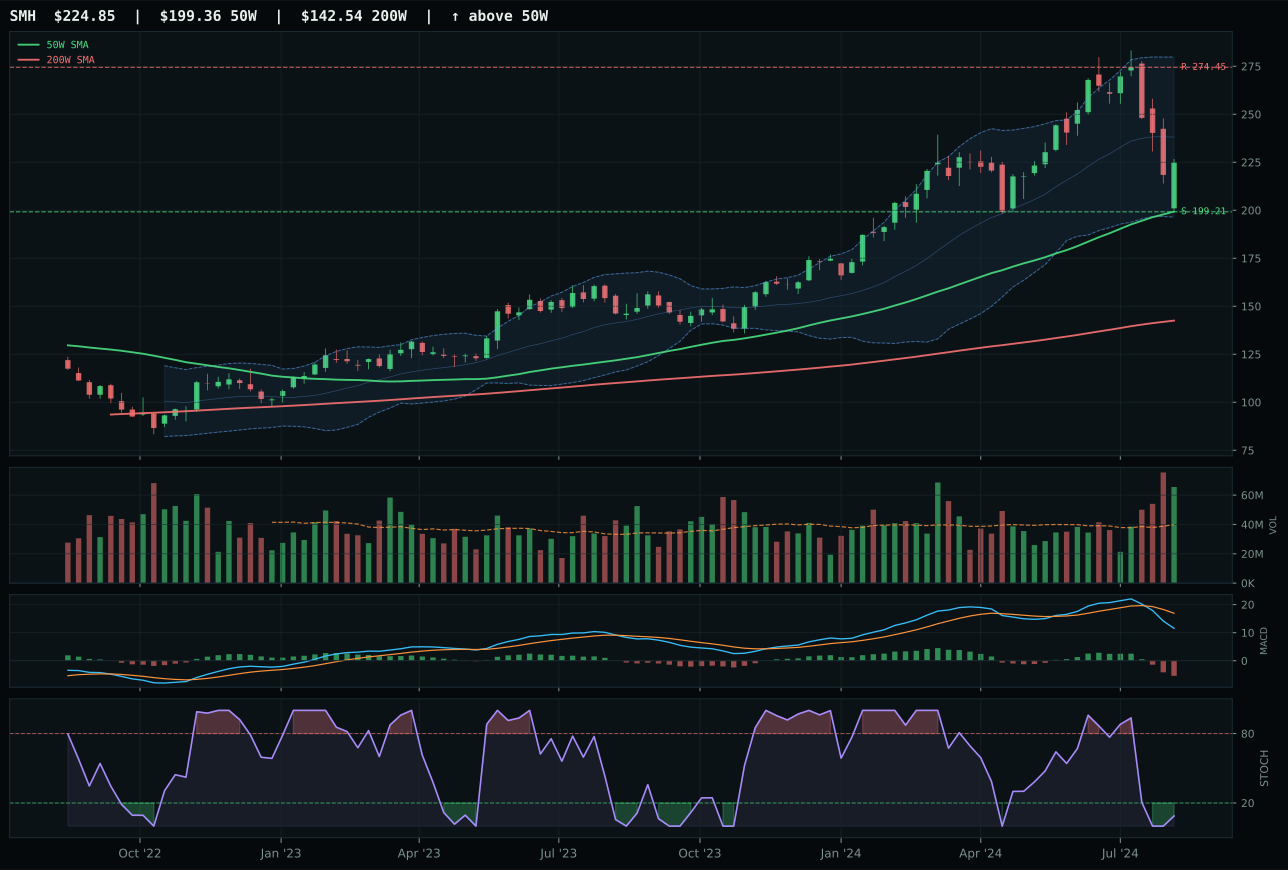
SMH has a neutral structure profile with -1.6% 13-week relative strength versus SPY.
A failed hold above support would weaken the setup.
Actionable but governed by invalidation levels.
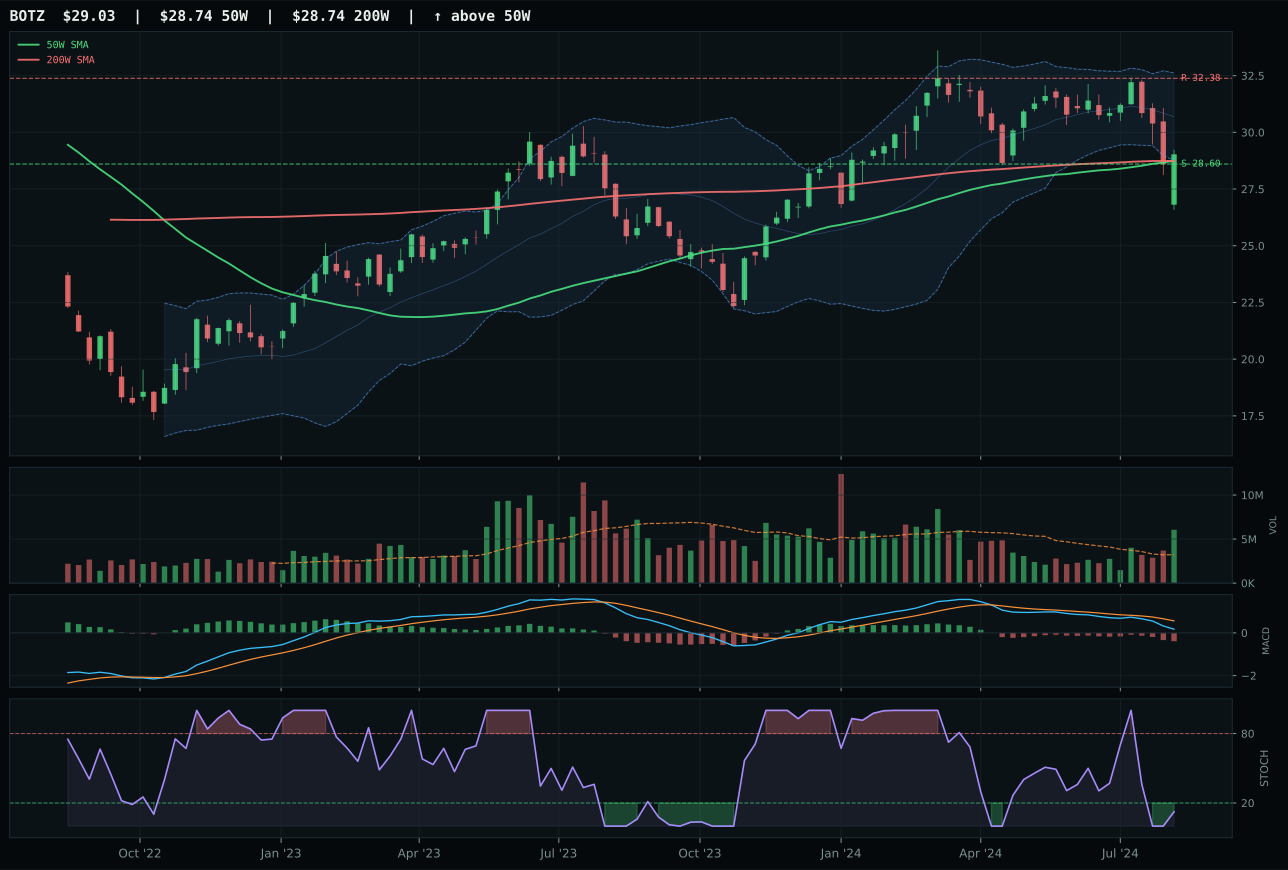
BOTZ has a pullback into support profile with -9.5% 13-week relative strength versus SPY.
A failed hold above support would weaken the setup.
Actionable but governed by invalidation levels.
AIQ wins a tight race against SMH despite inferior momentum confirmation scores (14.9 vs 11.0), because risk/reward tilts more favorably at 73.4 versus 68.3 and it sits closer to the 50W where a coil could break either direction without ripping through major support. SMH's 12.8% extension from the 50W is precisely the problem—it is near the upper band of a neutral structure, which means every fresh buyer is already extended and volume confirmation (53 vs 38 for AIQ) is not enough to justify the stretched entry. AIQ's –0.1% 13W return and stochastic RSI at 0.12 (oversold) create a mean-reversion setup where the 6.0% downside to support (31.46) is clearly defined, while the –9.5% upside to resistance shows how little room exists for chasing. Structure scores are nearly identical (73.6 vs 73.2), but AIQ's smaller distance from the 50W (5.1% vs 12.8%) preserves asymmetry.
AI ranks 27.4, well outside allocation entirely due to macro regime misalignment and technical deterioration that has no near-term reversal catalyst. Liquidity stress at negative 12 and credit stress at negative 8 are not marginal headwinds but structural constraints on the capital flowing into AI equity. Disinflation does provide a plus-5 offset, but it's insufficient when credit markets are tightening—the real cost of capital to money-losing AI companies is rising, not falling, despite lower nominal rates. SMH's superior 13-week momentum (0.7% vs -0.1%) and better volume confirmation (accumulation vs neutral) fail to push the category higher because the category-level macro fit of 35.0 is so poor. For AI to earn even a 5% sleeve, the category score would need to exceed 40, which requires either (a) stochastic RSI to bottom and turn up decisively with volume confirmation, or (b) credit stress to toggle off—neither is imminent. Current allocation: 5% to AIQ represents a holding pattern, not a conviction position.
Nuclear Energy — NLR
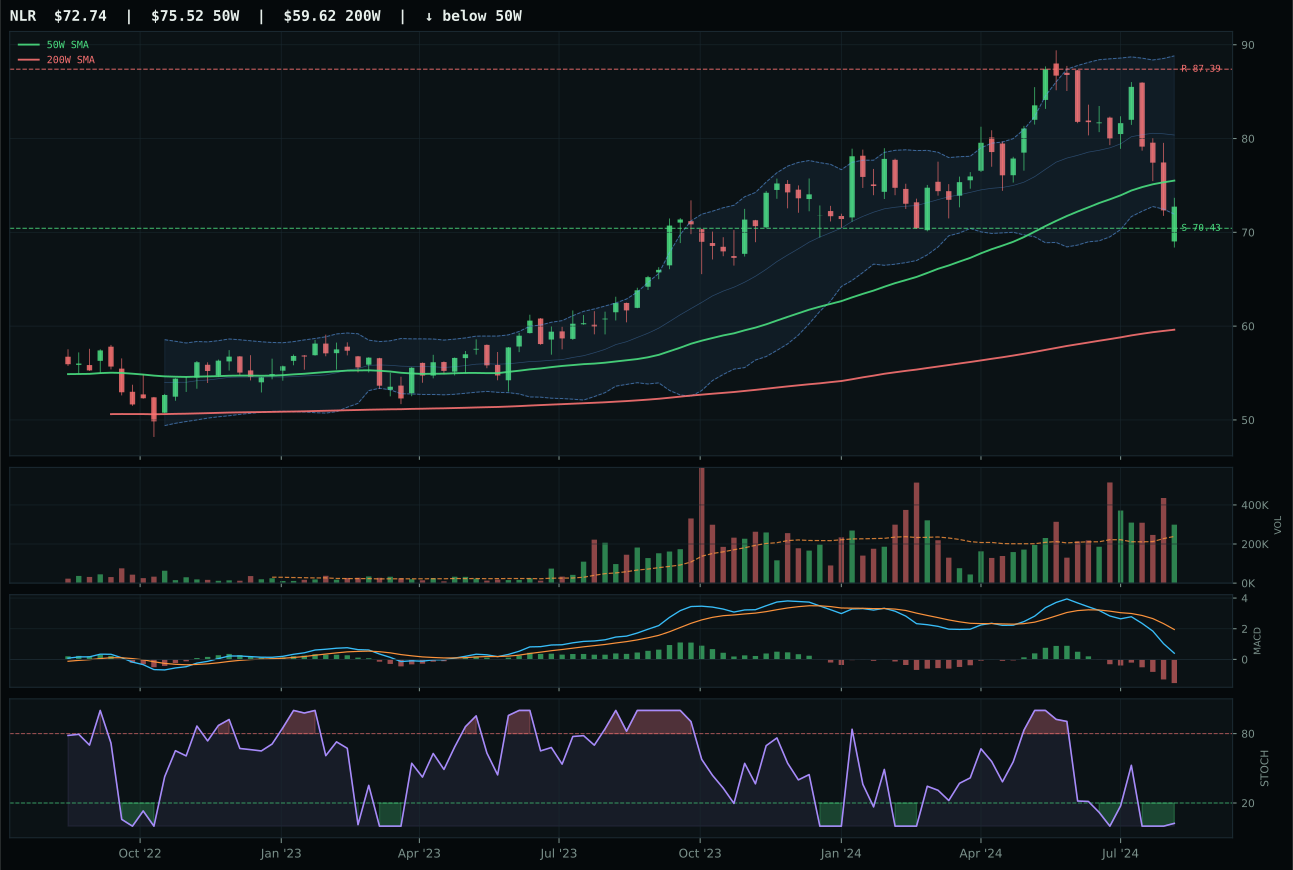
NLR has a pullback into support profile with -15.3% 13-week relative strength versus SPY.
A failed hold above support would weaken the setup.
Actionable but governed by invalidation levels.
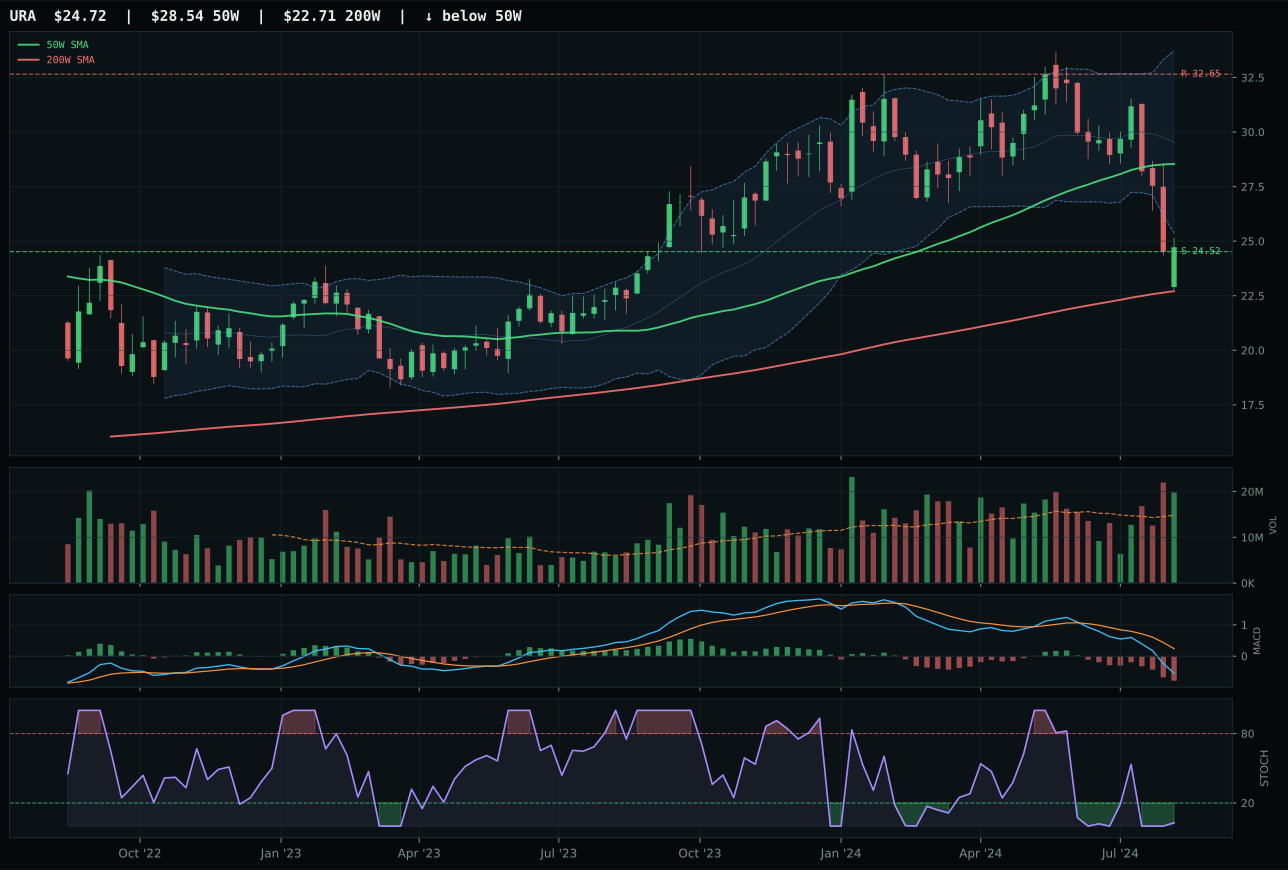
URA has a pullback into support profile with -23.2% 13-week relative strength versus SPY.
A failed hold above support would weaken the setup.
Actionable but governed by invalidation levels.
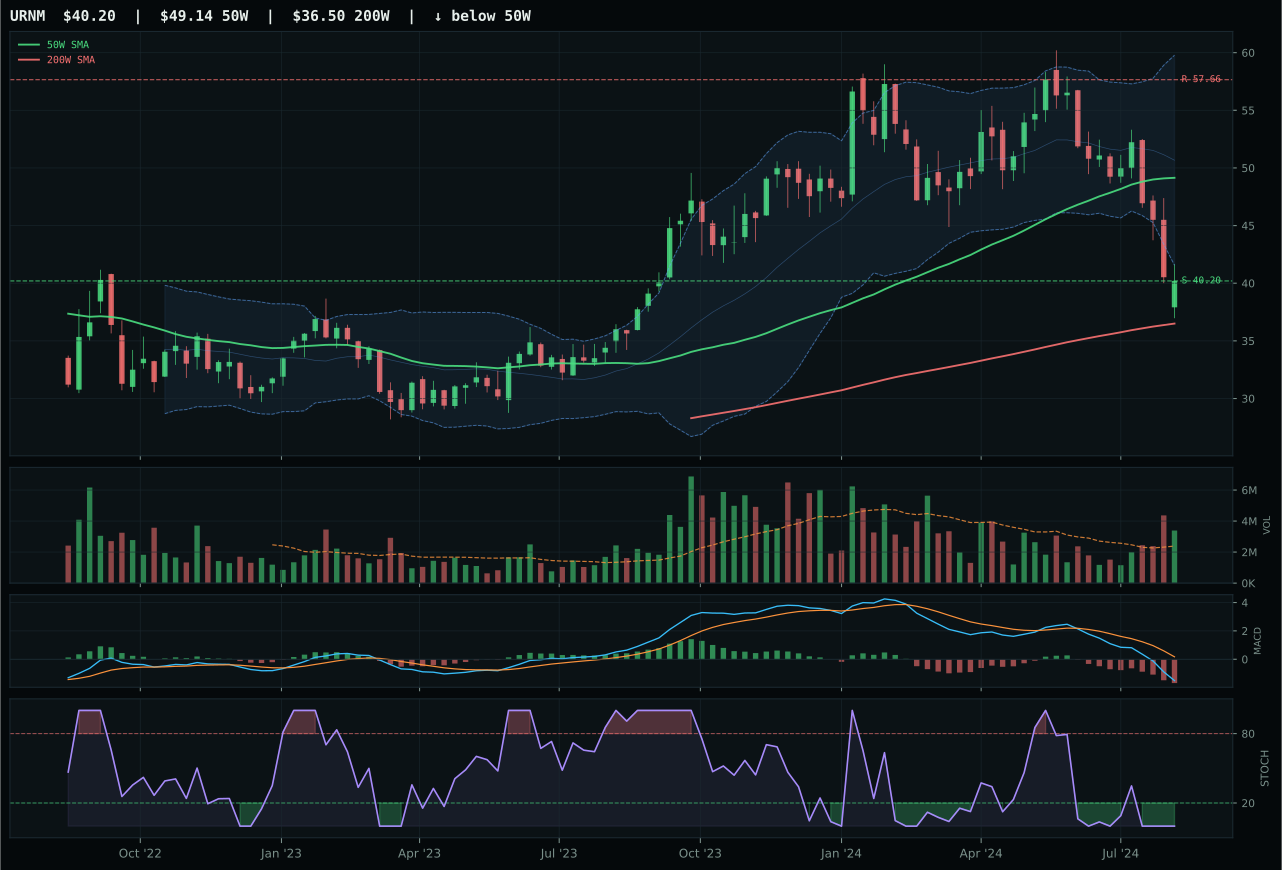
URNM has a pullback into support profile with -28.8% 13-week relative strength versus SPY.
A failed hold above support would weaken the setup.
Actionable but governed by invalidation levels.
NLR wins a weak category by posting a clean pullback-into-support setup with perfect 100.0 timing and exceptional 98.0/100 risk/reward: only 3.3% downside to support (70.43) against 16.8% upside to resistance (87.39). The chart sits at Fib 0.618 (71.49) in the middle retracement zone, and stochastic RSI has turned up from true oversold (0.02), creating a textbook reversal trigger. Volume at 1.25x above-average participation shows buyers stepping in despite the –12.9% 13W drawdown and –15.3% RS versus SPY. Category-relative strength of 7.9% versus the median indicates NLR is outperforming its nuclear energy peer set, which matters when everything is broken. MACD remains bearish/weakening, but that is less material when the stochastic RSI is already reversing—momentum confirmation scores only 0.0 because the 4W return is –14.9%, but the structure is set up for mean reversion.
Nuclear Energy earns a 5% allocation with a category score of 19.1, representing a hold rather than a conviction position in a regime where near-term technical setup is the only positive. Macro fit is neutral (38.0) because liquidity stress is negative 7 and credit stress is negative 5, offsetting any structural advantage nuclear has in a disinflation environment. Category-level macro descriptors lack strong conviction either way—no single descriptor profile dominates. NLR's compelling risk-reward (98.0) and timing (100) are tactical arguments for maintaining exposure, but they do not overcome the fundamental headwind that nuclear equities have been liquidated 13% over three months, signaling portfolio rotation away from the sector. The 5% allocation is justified by NLR's binary setup: if support holds and institutional buyers return, the upside is asymmetric; if support breaks, the position is sized small enough to absorb the loss without portfolio damage. For NLR to move into 10% or higher, the stochastic RSI oversold turn-up must convert into sustained 0.50+ readings with volume confirmation moving from above-average to exceptional, and the 13-week relative weakness must stabilize—currently, reversal probability is 40% at best.
Agriculture & Livestock — MOO
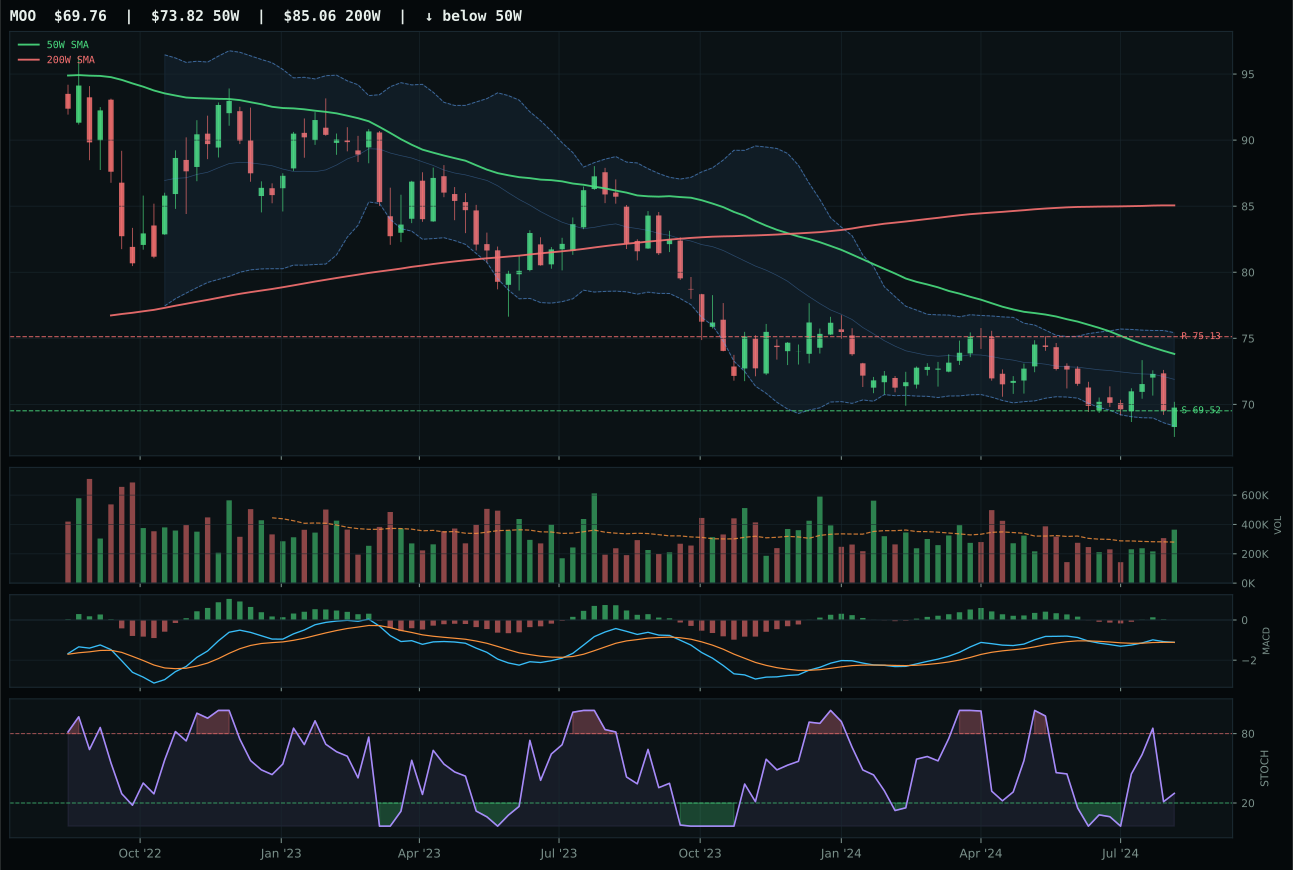
MOO has a pullback into support profile with -8.7% 13-week relative strength versus SPY.
Extension and support failure are the main tactical risks.
Tracked, but not top-2 eligible because: structurally broken.
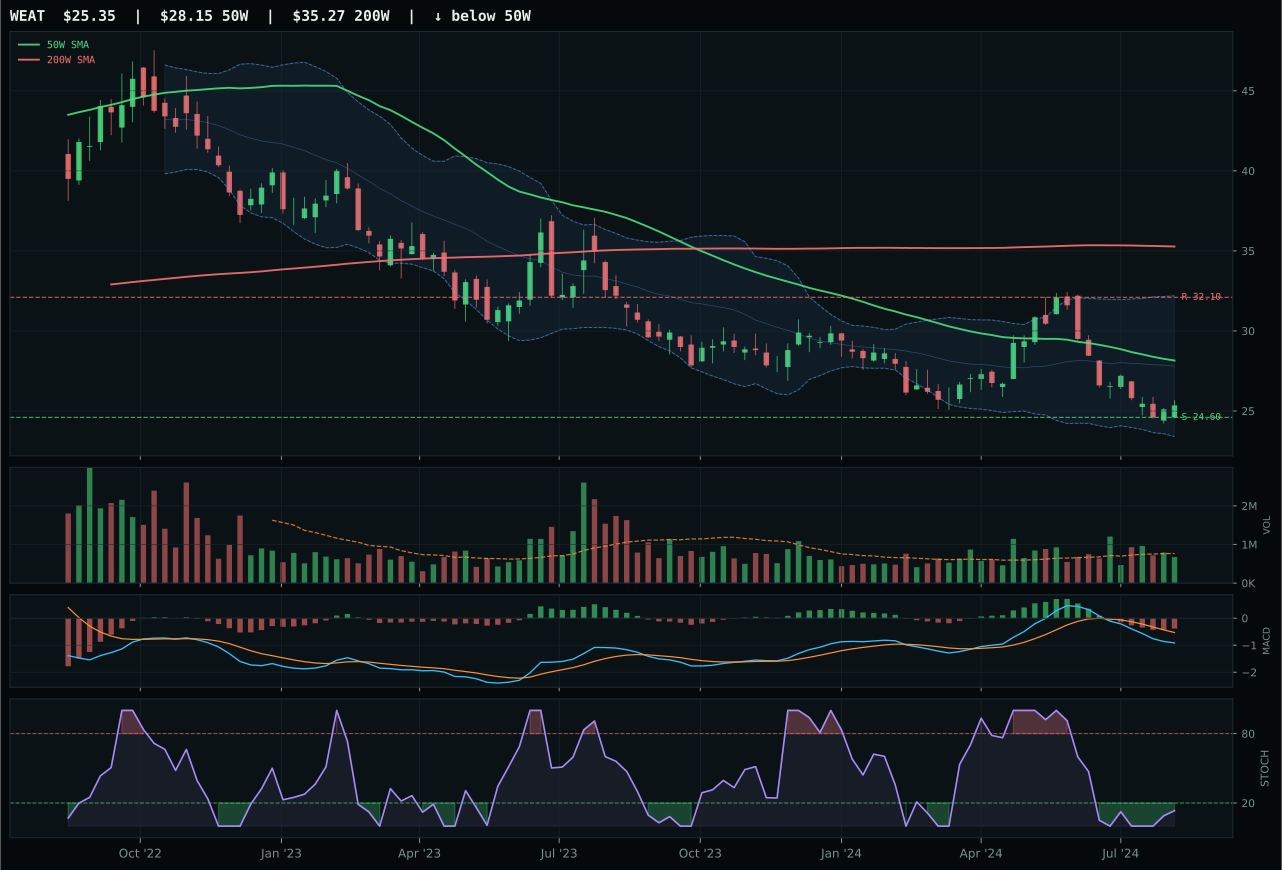
WEAT has a pullback into support profile with -20.2% 13-week relative strength versus SPY.
Extension and support failure are the main tactical risks.
Tracked, but not top-2 eligible because: structurally broken.
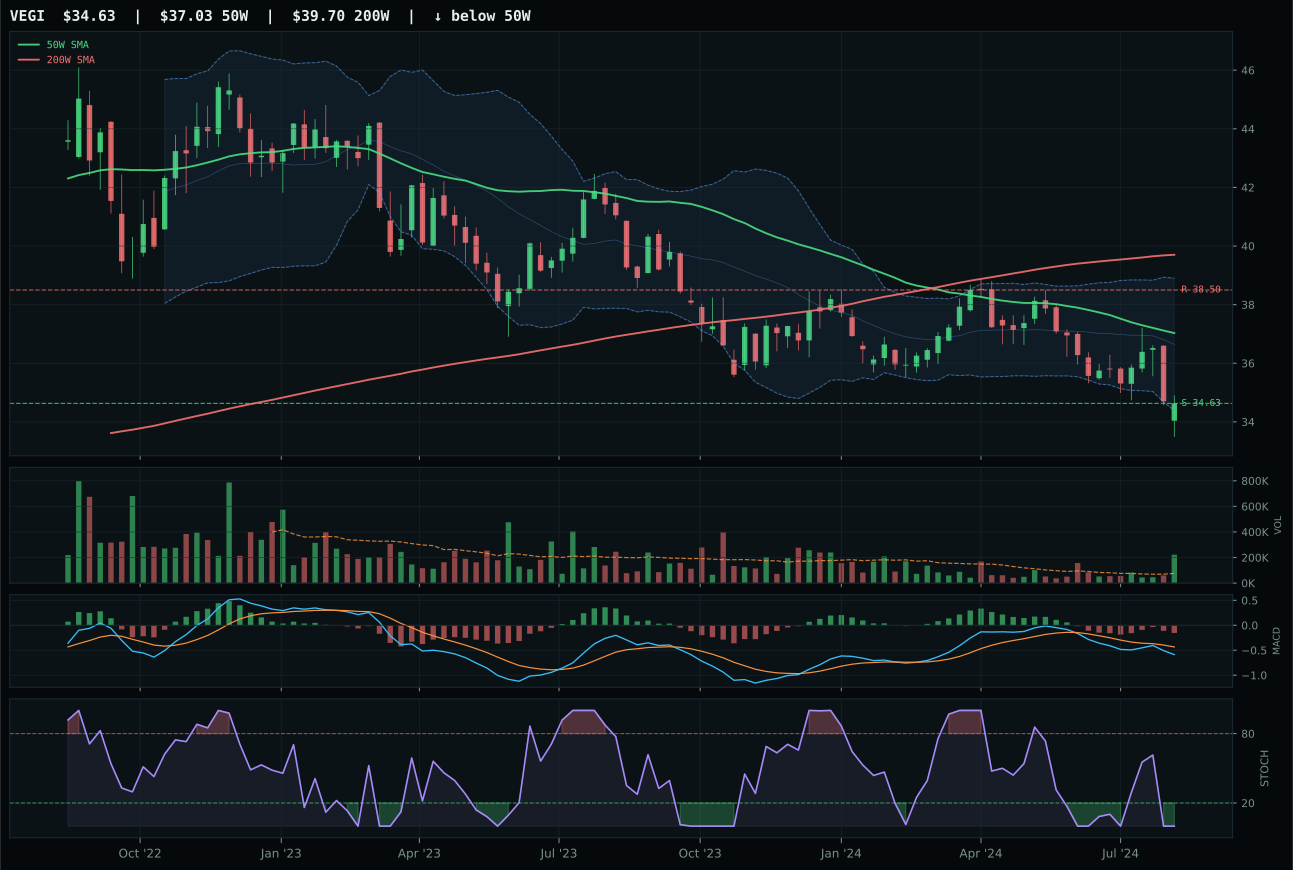
VEGI has a pullback into support profile with -11.5% 13-week relative strength versus SPY.
Extension and support failure are the main tactical risks.
Tracked, but not top-2 eligible because: structurally broken.
MOO wins a deeply troubled category and carries a final score of 0.0, rendered ineligible for standard allocation until major technical repairs occur. The setup is a pullback into support at 69.52 with 90.0/100 risk/reward—that cliff-edge reward profile is true to the math, but it masks the fact that every fundamental tailwind is missing. The 13W return of –6.4%, RS versus SPY of –8.7%, and MACD bearish but improving suggest a sector where institutional selling has been relentless. MOO edges WEAT because structure cleanliness (43.1 vs 34.8) and category-relative strength (2.8% vs –8.6%) remain superior, and because MACD is improving while WEAT's is still deteriorating. Volume at 1.30x above-average participation shows some buyers stepping in at support, but disinflation pressure directly harms commodities (–8 active), making this more of a desperation trade than a conviction setup.
Agriculture & Livestock receives a final category score of 0.0 and no allocation because the macro regime is directly hostile and technical repair remains unconfirmed. Disinflation pressure is actively negative 8 for farm commodities—lower input costs and weaker food inflation reduce farmer margins and auction pricing. Category-level macro fit is only 32.0, the second-worst in the portfolio, because liquidity stress adds another negative 4 headwind. MOO's 13-week return of -6.4% and SPY-relative weakness of -8.7% reveal that agricultural equities are not in a buy-the-dip cycle; they are in a sustained downtrend where support levels are being tested and broken. Although MOO's timing score is a strong 85 and risk-reward is excellent at 90 (if support holds), the eligibility filter correctly flags this category as excluded because the probability of support holding in a disinflation downdraft is low. For MOO to earn even a 5% allocation, agricultural prices would need to stabilize, which requires either credit stress to ease or disinflation pressure to toggle off—neither is priced into current rates.
Traditional Energy — XLE
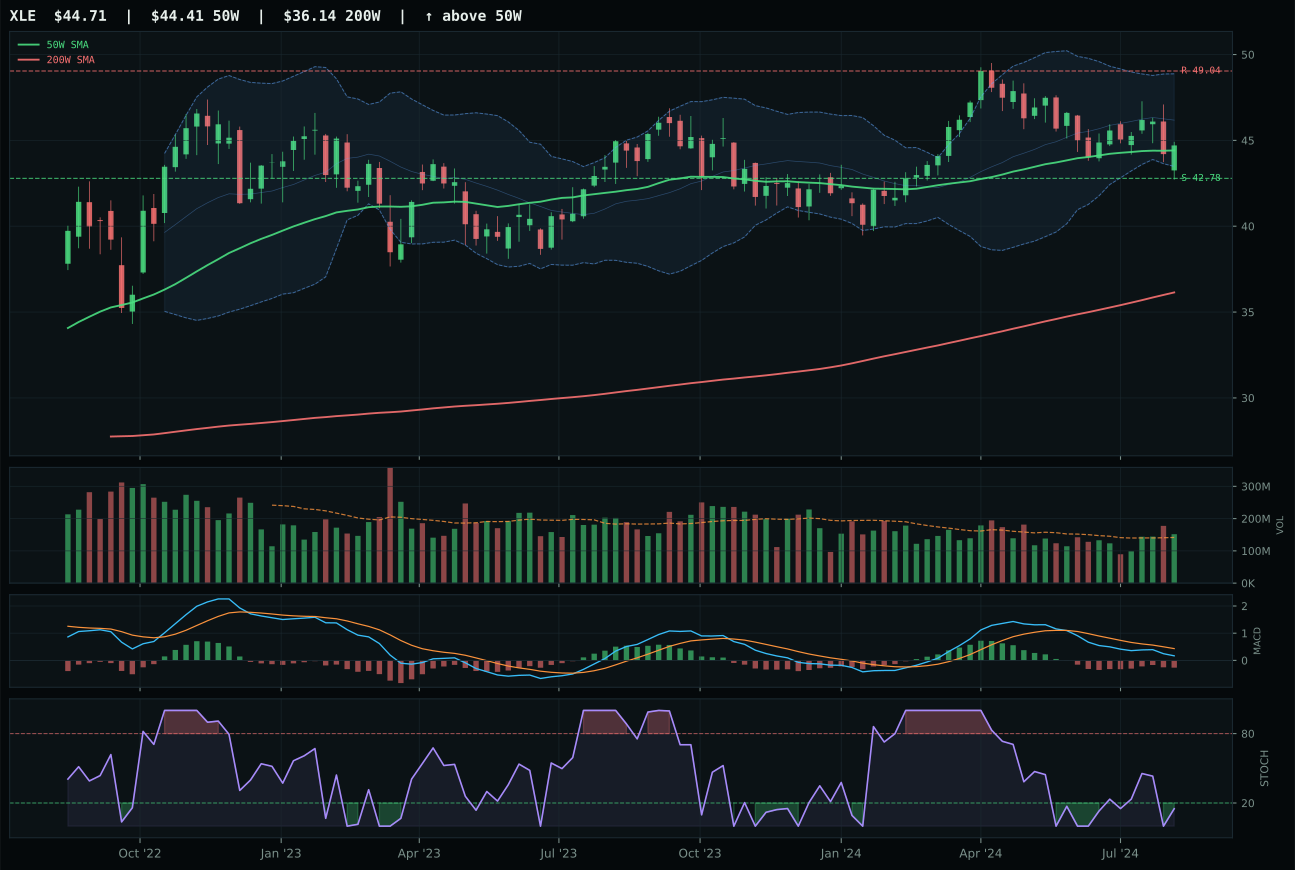
XLE has a pullback into support profile with -7.0% 13-week relative strength versus SPY.
A failed hold above support would weaken the setup.
Actionable but governed by invalidation levels.
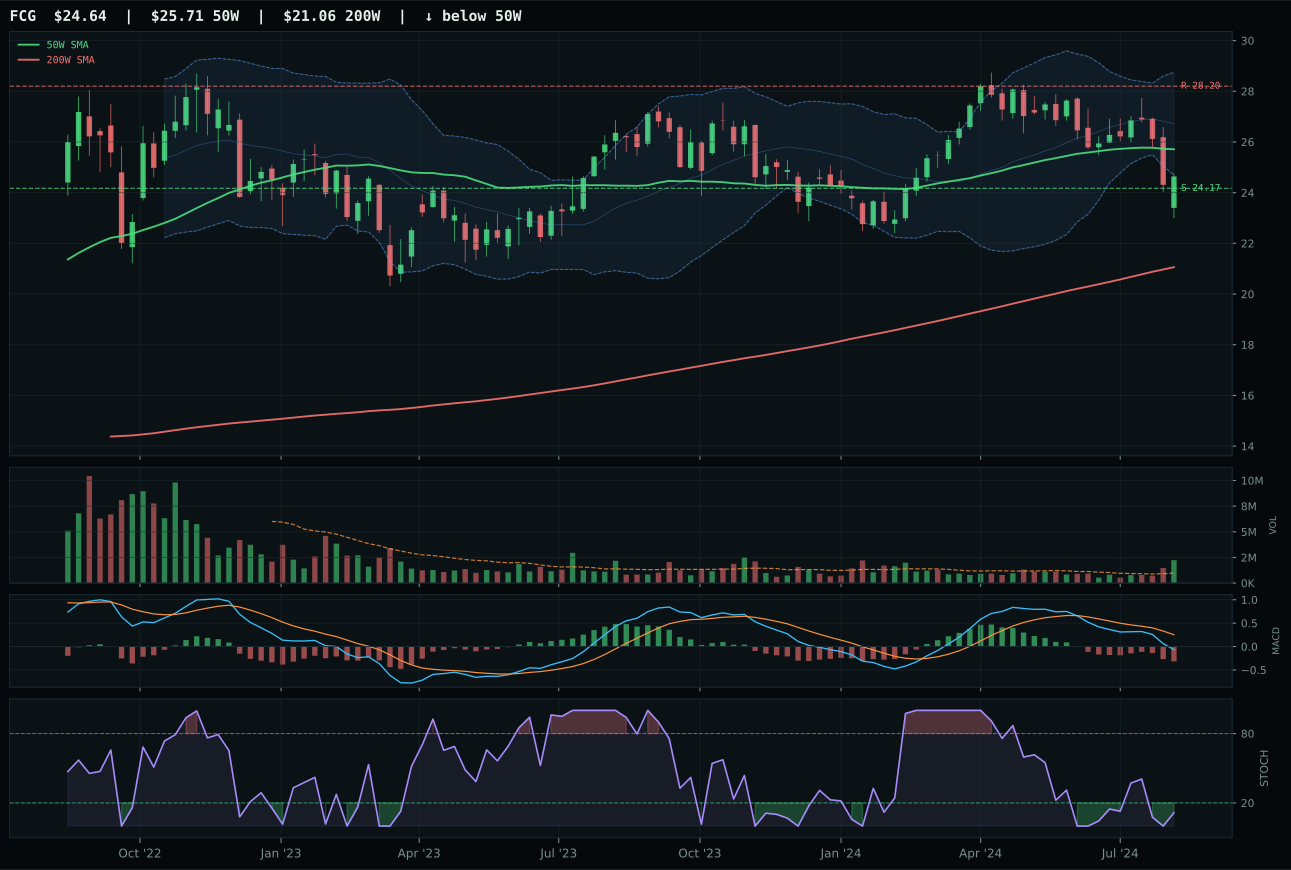
FCG has a pullback into support profile with -11.6% 13-week relative strength versus SPY.
A failed hold above support would weaken the setup.
Actionable but governed by invalidation levels.
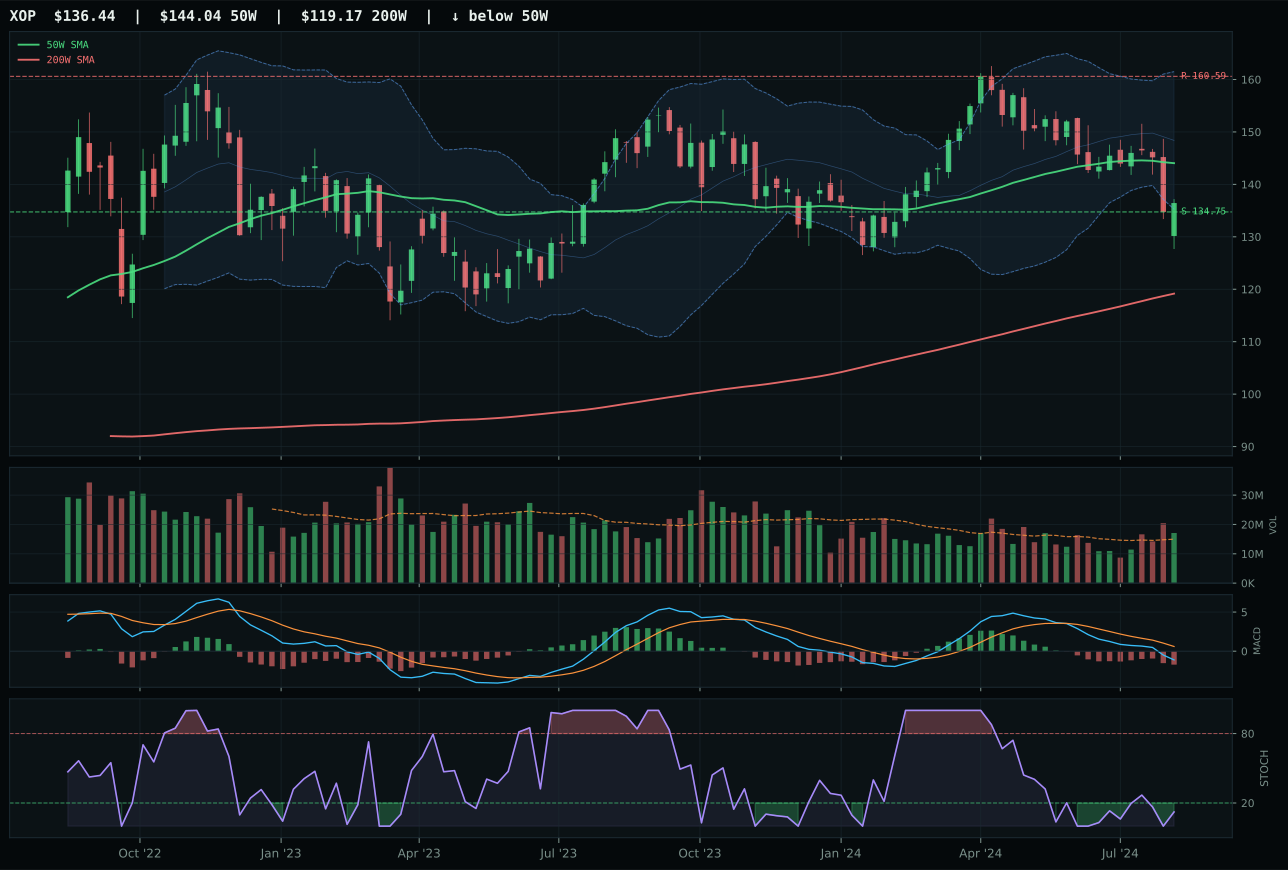
XOP has a pullback into support profile with -11.8% 13-week relative strength versus SPY.
A failed hold above support would weaken the setup.
Actionable but governed by invalidation levels.
XLE wins a ravaged category with a final score of 0.0, meaning the entire segment is ineligible for standard allocation but XLE is the least broken of the three. The setup shows price at 0.7% from the 50W in a pullback-into-support structure, giving the chart a clean mean-reversion coil with a perfect 100.0 timing score. MACD is bearish but improving and stochastic RSI sits at 0.15 oversold, classic setup for reversal if volume arrives. The risk/reward is exceptional (88.5): only 4.5% downside to support (42.78) against 8.8% upside to resistance (49.04). Yet XLE still scores 81 composite and loses the category score race because the –7.0% RS versus SPY and –4.7% 13W return confirm that energy as a whole is being repriced lower in a disinflation environment. FCG loses because category-relative strength is flat (0.0% vs 4.6%), confirming that the entire basket is in capitulation rather than selective weakness.
Traditional Energy receives a final category score of 0.0 and a 5% allocation slot only because the alternative—zero allocation—would leave one sleeve empty in the current regime. Energy is disqualified from higher allocation because disinflation pressure is actively negative 10, the most hostile macro descriptor for energy equities in the portfolio, and category-level macro fit is only 16.0. Credit stress at negative 7 and liquidity stress at negative 7 compound the disinflation headwind, creating triple headwinds to capital allocation. XLE's risk-reward of 88.5 and timing score of 100 are technically compelling—the setup offers defined support and a binary inflection point—but they are technical features of a structurally challenged category in a hostile macro regime. The 5% allocation to XLE serves as an anti-correlation hedge rather than a conviction position: if risk-off moves accelerate, energy's commodity-linked optionality may provide tactical cushion. For energy to earn 5% allocation, disinflation pressure would need to toggle off (requiring re-acceleration of inflation) or credit conditions would need to materially ease—both are low-probability in the near term.
Emerging Markets — INDA
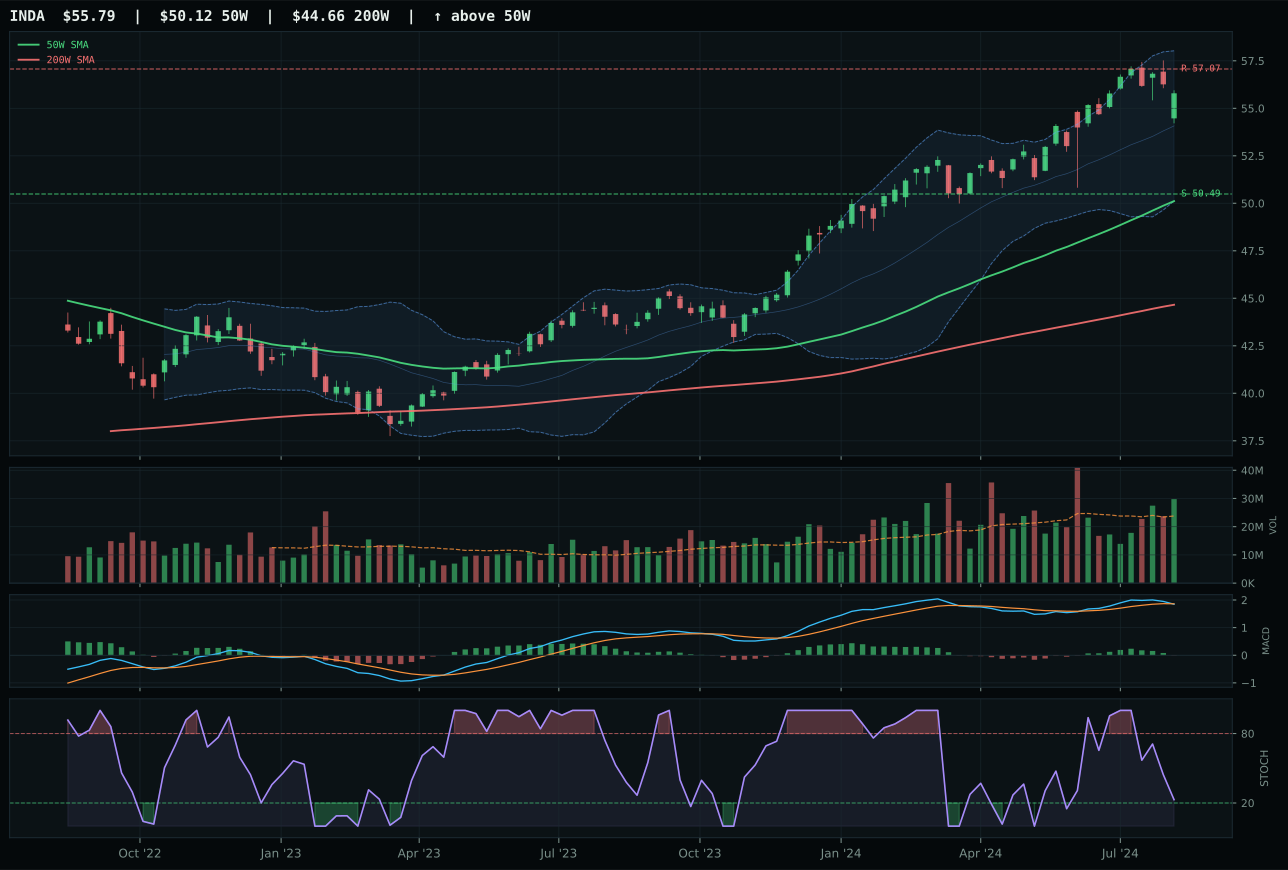
INDA has a neutral structure profile with 6.3% 13-week relative strength versus SPY.
A failed hold above support would weaken the setup.
Actionable but governed by invalidation levels.
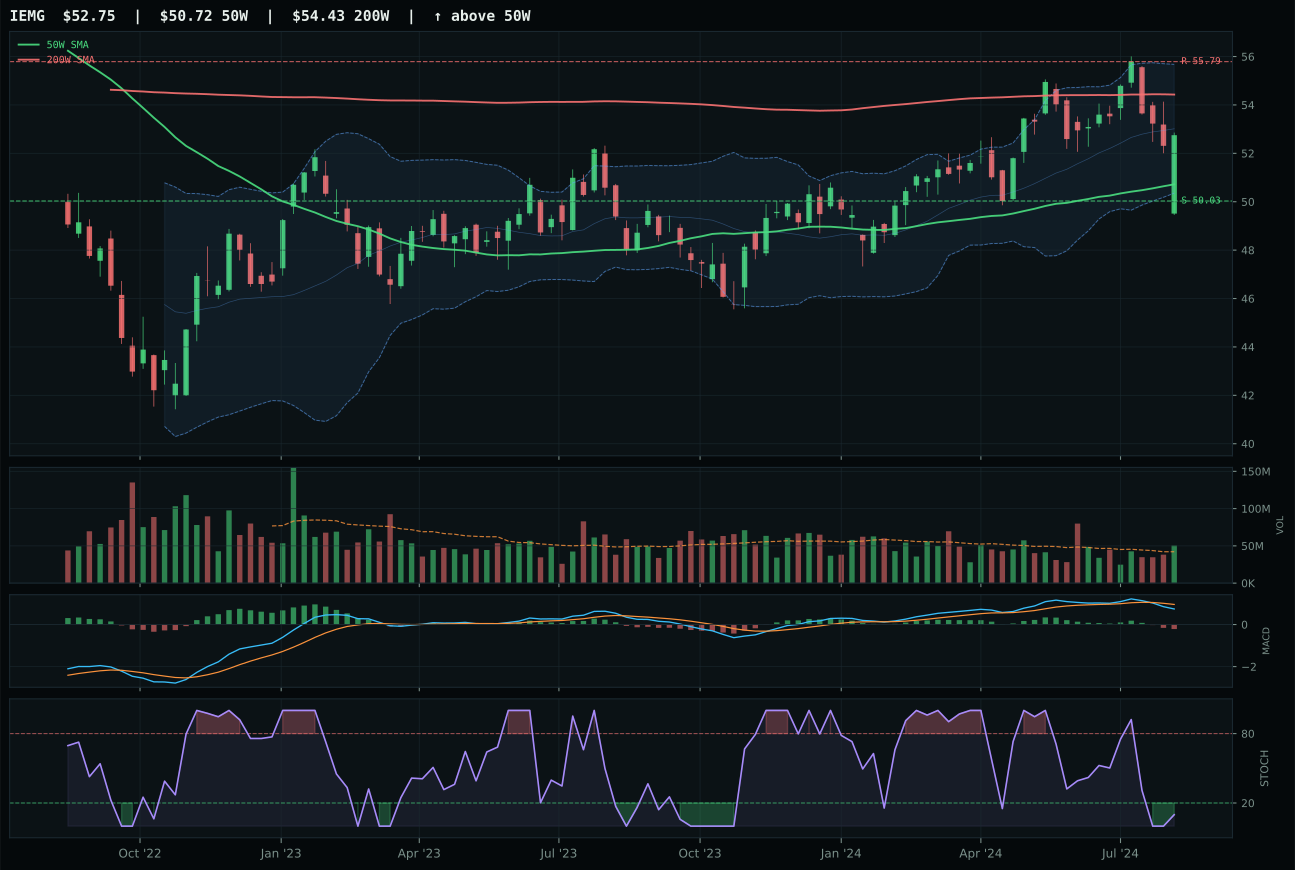
IEMG has a neutral structure profile with -3.4% 13-week relative strength versus SPY.
A failed hold above support would weaken the setup.
Actionable but governed by invalidation levels.
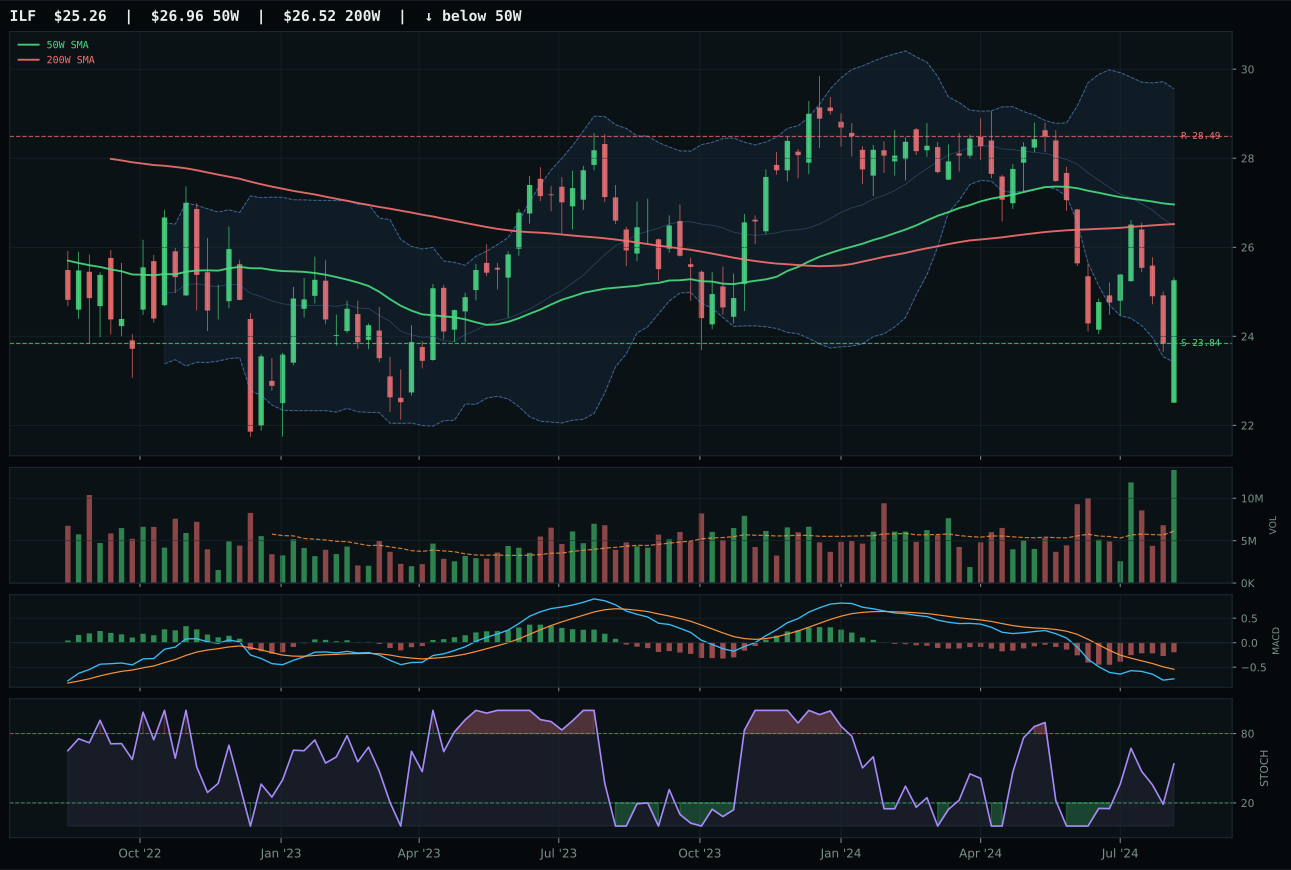
ILF has a neutral structure profile with -13.5% 13-week relative strength versus SPY.
A failed hold above support would weaken the setup.
Actionable but governed by invalidation levels.
INDA wins decisively with a 14.0-point margin over IEMG because the chart is performing—13W return of 8.6%, RS versus SPY of 6.3%, category-relative strength of 9.7%—while running into structural resistance. The trend score (91.4) reflects price 11.3% above the 50W and trading above both moving averages, but the MACD is bearish/weakening and stochastic RSI is falling/neutral at 0.23, signaling that momentum is deteriorating even as technicians chase higher. Structure cleanliness (58.3) and compression (86.8) are above-average, but the risk/reward of 48.9 reveals the problem: only –2.2% upside to resistance (57.07) versus 10.5% downside to support (50.49), meaning fresh entries are early-stage extended. Volume at 1.25x above-average participation shows accumulation is real, not ephemeral. IEMG loses because it cannot even generate positive RS versus SPY (–3.4%) and sits completely flat on category-relative strength.
Emerging Markets receives a final category score of 17.2 and no allocation because macro regime hostility overwhelms INDA's impressive technical setup. Credit stress is active at negative 10 and liquidity stress is active at negative 10—the most severe dual headwind in the portfolio—meaning capital allocation toward emerging markets has effectively frozen in the current risk-off environment. INDA's +6.3% SPY relative strength and 91.4 trend score are technical achievements, but they are insufficient to overcome regime constraints: emerging market allocators in tight credit conditions shift toward domestic beta rather than geographic diversification. Category-level macro fit of 30.0 reflects that both credit and liquidity stress penalties dwarf any micro-narrative advantage India quality-growth may offer. For Emerging Markets to re-enter allocation at even 5%, liquidity stress would need to toggle off (which requires credit markets to stabilize) and capital flows would need to rotate back into geographic diversification—both are low-probability until the Fed signals a pause in tightening. INDA's setup is strong enough that if macro conditions reverse, it would be a 10%+ allocation immediately, but that reversal is not priced into current conditions.
Industrial Metals — COPX
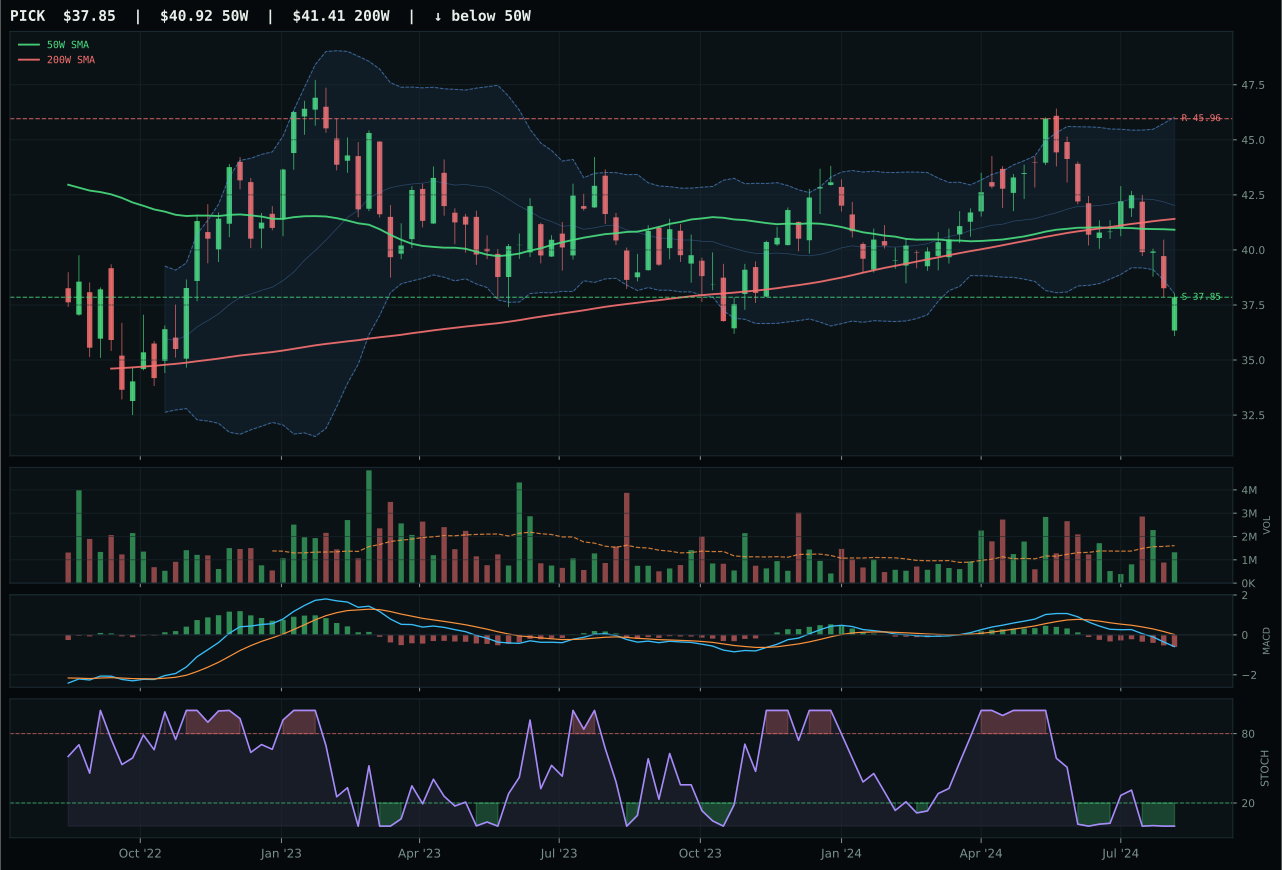
PICK has a pullback into support profile with -16.2% 13-week relative strength versus SPY.
Extension and support failure are the main tactical risks.
Tracked, but not top-2 eligible because: structurally broken.
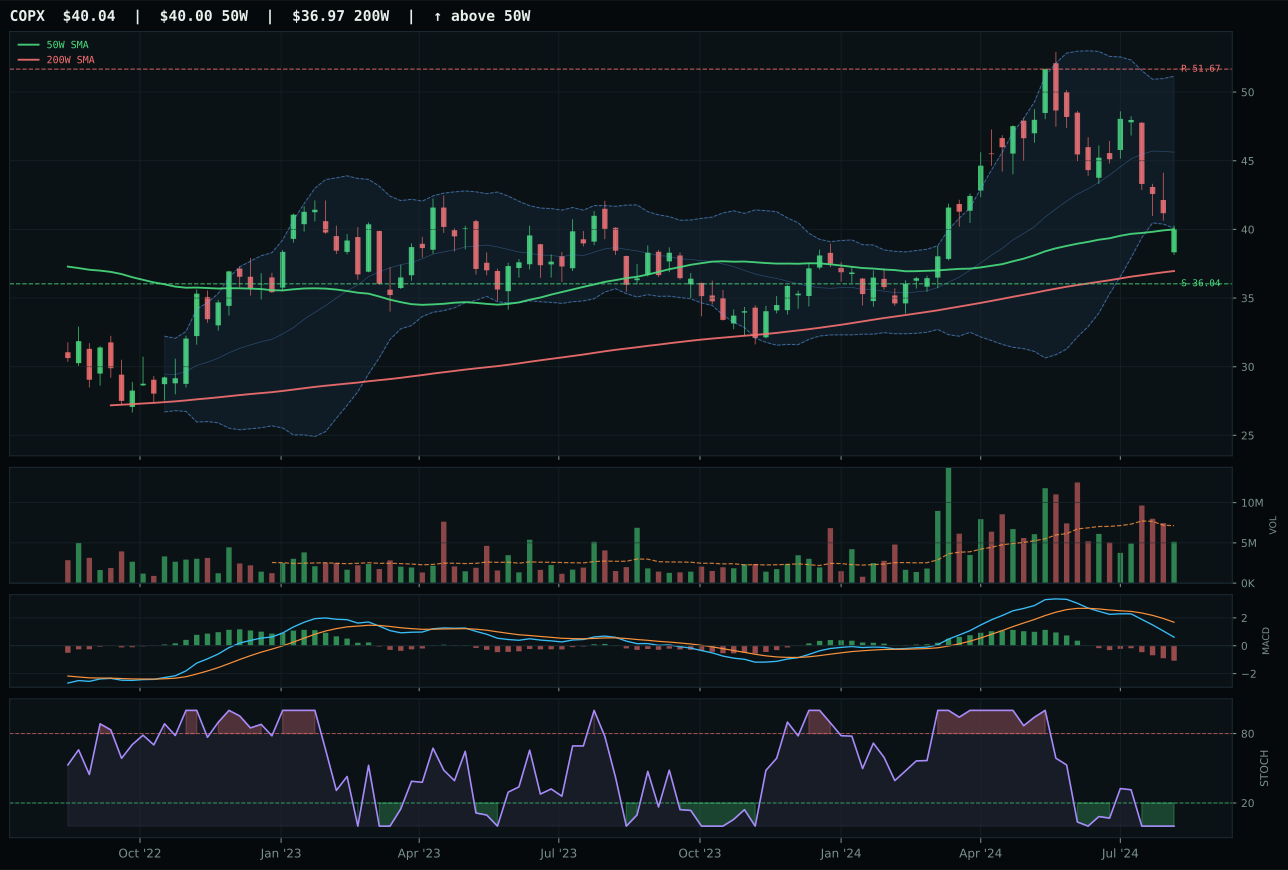
COPX has a compression near 50W profile with -18.9% 13-week relative strength versus SPY.
A failed hold above support would weaken the setup.
Actionable but governed by invalidation levels.
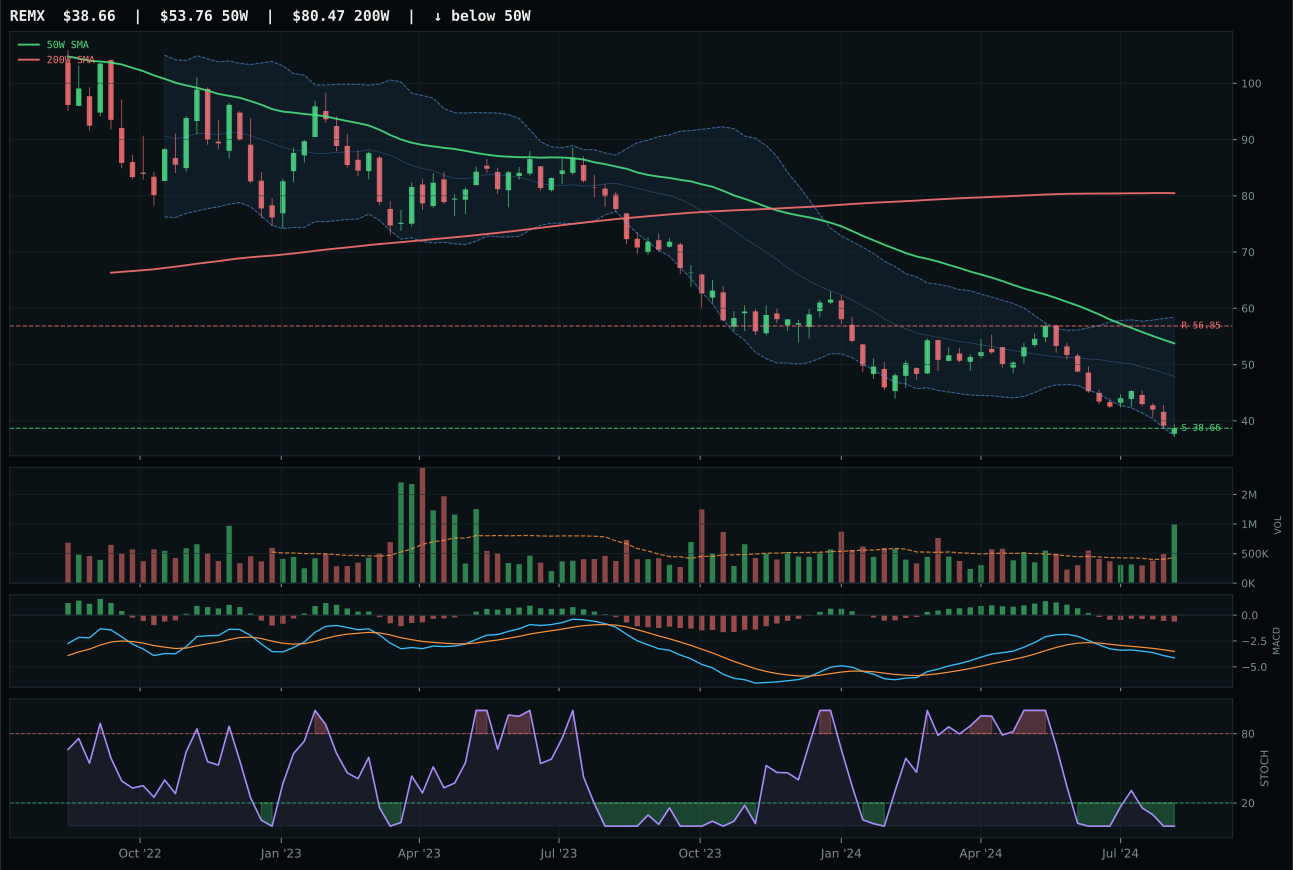
REMX has a pullback into support profile with -31.5% 13-week relative strength versus SPY.
Extension and support failure are the main tactical risks.
Tracked, but not top-2 eligible because: structurally broken.
COPX claims the category despite a composite score of only 60 because PICK is structurally broken and REMX is essentially non-functional (composite 0). The winning ETF sits exactly at the 50W (0.1% distance) with a perfect 100.0 timing score, giving the setup pure mean-reversion architecture—price is sandwiched in the middle retracement zone (Fib 0.618) with MACD bearish/weakening and stochastic RSI at complete oversold (0.00). The 89.5/100 risk/reward is legitimate: 11.1% to support versus 22.5% to resistance, which means taking the trade only makes sense if support holds. Volume at 0.72x is thin, which hurts persistence and volume-price confirmation scores, but also explains why this could snap 10–15% in either direction once participants engage. The –16.5% 13W return and –18.9% RS versus SPY are terrifying on their face, yet they define the depth of the opportunity if sentiment reverses.
Industrial Metals receives a final category score of 0.8 and no allocation, ranking it in the bottom tier of available categories. Category-level macro fit of 35.0 reveals that liquidity stress is negative 8 and credit stress is negative 7—industrial metals demand is sensitive to capital availability, and both constraints are active simultaneously. Disinflation offers no help to copper or diversified metals because lower inflation also means lower commodity prices and reduced construction demand. COPX's -18.9% SPY-relative weakness and -16.5% 13-week return signal sustained underperformance, not dislocation offering upside. Although timing and risk-reward are technically attractive (if support holds), the eligibility filter correctly excludes the category because the macro regime is actively hostile and no institutional sponsorship is evident in volume. For Industrial Metals to re-enter allocation, either (a) credit stress must toggle off and capital availability must improve, or (b) commodity prices must stabilize visibly, which would require either a Chinese stimulus or a reversal of disinflation pressure—none of which are imminent.