
2024-08-02
Informational purposes only. The content in this report, including allocations, analysis, and commentary, is provided solely for informational and educational purposes. It does not constitute financial advice, investment advice, trading advice, or any other type of advice. Past performance does not guarantee future results. Always conduct your own research and consult a qualified financial professional before making investment decisions.
Weekly Allocation
| Ticker | Category | Weight | Role |
|---|---|---|---|
| FBTC | 50% | Overlay | |
| XLU | Utilities & Infrastructure | 10% | Top-2 (10%) |
| GLD | Precious Metals | 10% | Top-2 (10%) |
| ITA | Defense & Aerospace | 5% | Tier-2 (5%) |
| CIBR | Technology | 5% | Tier-2 (5%) |
| MOO | Agriculture & Livestock | 5% | Tier-2 (5%) |
| XLE | Traditional Energy | 5% | Tier-2 (5%) |
| NLR | Nuclear Energy | 5% | Tier-2 (5%) |
| INDA | Emerging Markets | 5% | Tier-2 (5%) |
Trade Instructions — Monday Open
Sell the tranche from 2024-07-05 (completing its 4-week hold). Buy the new tranche. Instructions show net portfolio changes — same-asset positions cancel, weight changes show the delta.
| Action | Ticker | Instruction |
|---|---|---|
| SELL | IGV | Sell 33% of IGV position (reduce 7.50% → 5.00%) |
| SELL | AIQ | Sell 50% of AIQ position (reduce 5.00% → 2.50%) |
| SELL | SLV | Sell entire SLV position (1.25% of portfolio) |
| SELL | IGF | Sell 33% of IGF position (reduce 3.75% → 2.50%) |
| SELL | XAR | Sell 33% of XAR position (reduce 3.75% → 2.50%) |
| SELL | COPX | Sell 25% of COPX position (reduce 5.00% → 3.75%) |
| BUY | GLD | Buy GLD — 25.00% of freed cash (adds 2.50% to portfolio) |
| BUY | ITA | Buy ITA — 12.50% of freed cash (adds 1.25% to portfolio) |
| BUY | CIBR | Buy CIBR — 12.50% of freed cash (adds 1.25% to portfolio) |
| BUY | XLU | Buy XLU — 25.00% of freed cash (adds 2.50% to portfolio) |
| BUY | MOO | Buy MOO — 12.50% of freed cash (adds 1.25% to portfolio) |
| BUY | XLE | Buy XLE — 12.50% of freed cash (adds 1.25% to portfolio) |
Current Portfolio After Trade
Combined holdings across all 4 active tranches. Each tranche is 25% of the portfolio.
| Ticker | % of Portfolio | Weight Bar |
|---|---|---|
| FBTC | 50.00% | |
| GLD | 7.50% | |
| IGV | 5.00% | |
| INDA | 5.00% | |
| NLR | 3.75% | |
| COPX | 3.75% | |
| BOTZ | 3.75% | |
| IGF | 2.50% | |
| XAR | 2.50% | |
| AIQ | 2.50% | |
| PAVE | 2.50% | |
| ITA | 2.50% | |
| CIBR | 2.50% | |
| XLU | 2.50% | |
| URA | 1.25% | |
| MOO | 1.25% | |
| XLE | 1.25% |
Macro Regime — Disinflation
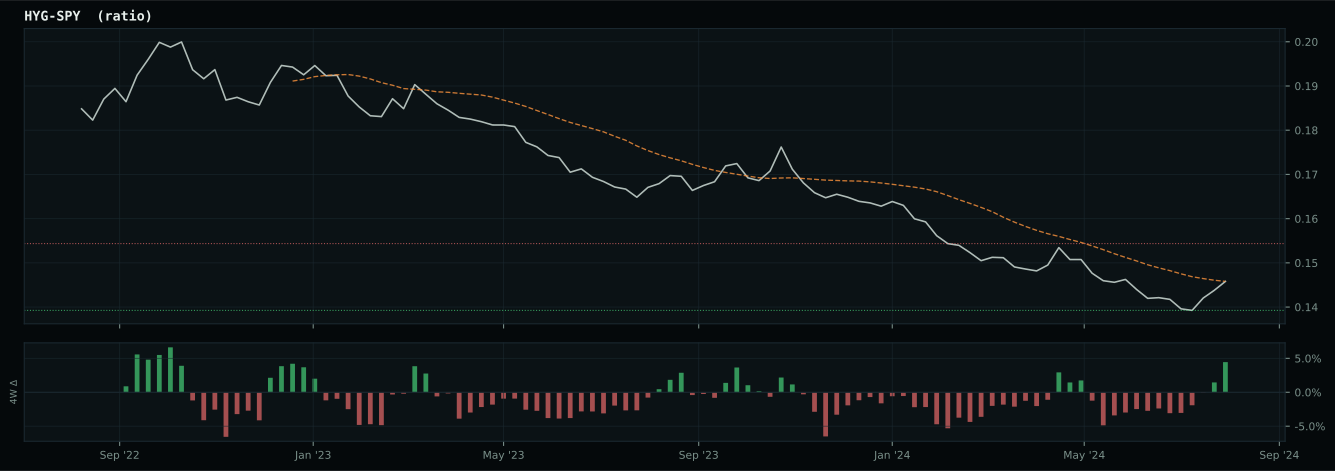
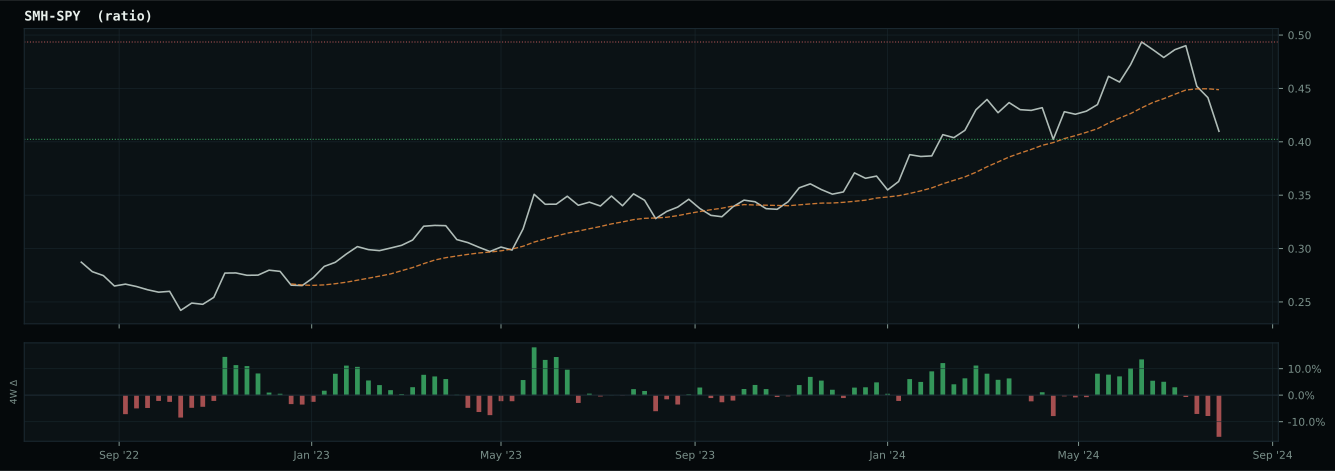
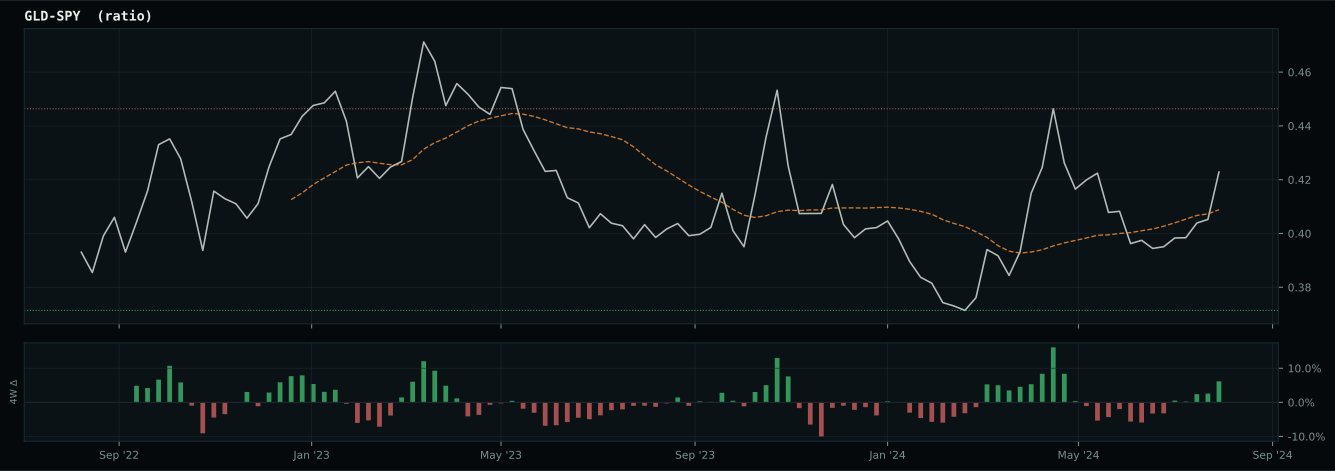
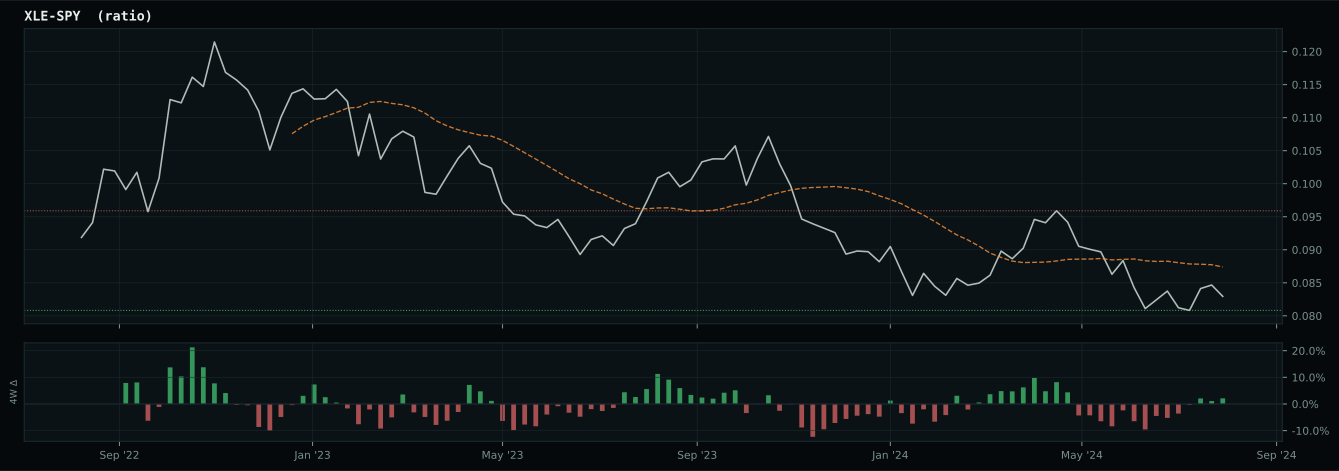
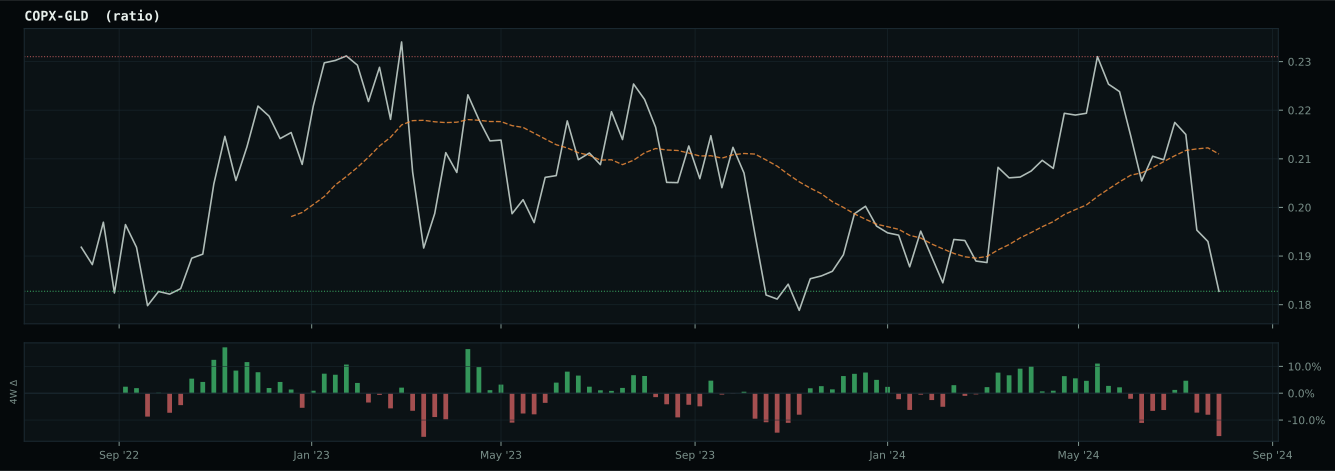
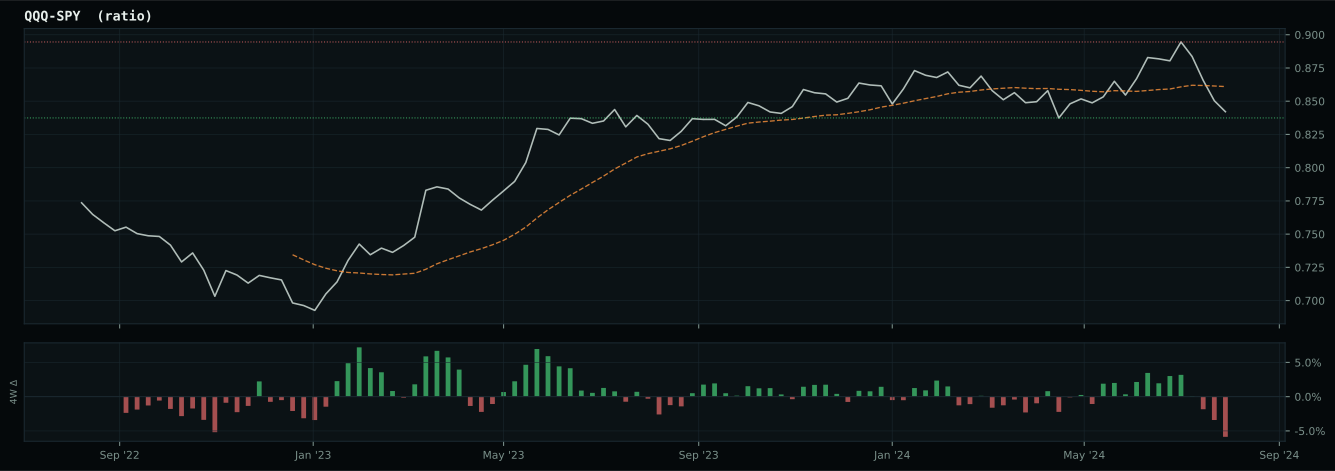
growth data is not confirming the weak market-implied risk appetite signal
Macro Evidence Charts
Market-implied signals behind the macro regime scores. Each ratio compares two assets; the direction and slope of the ratio is what the macro engine reads.
Crypto Regime — TrendBTC
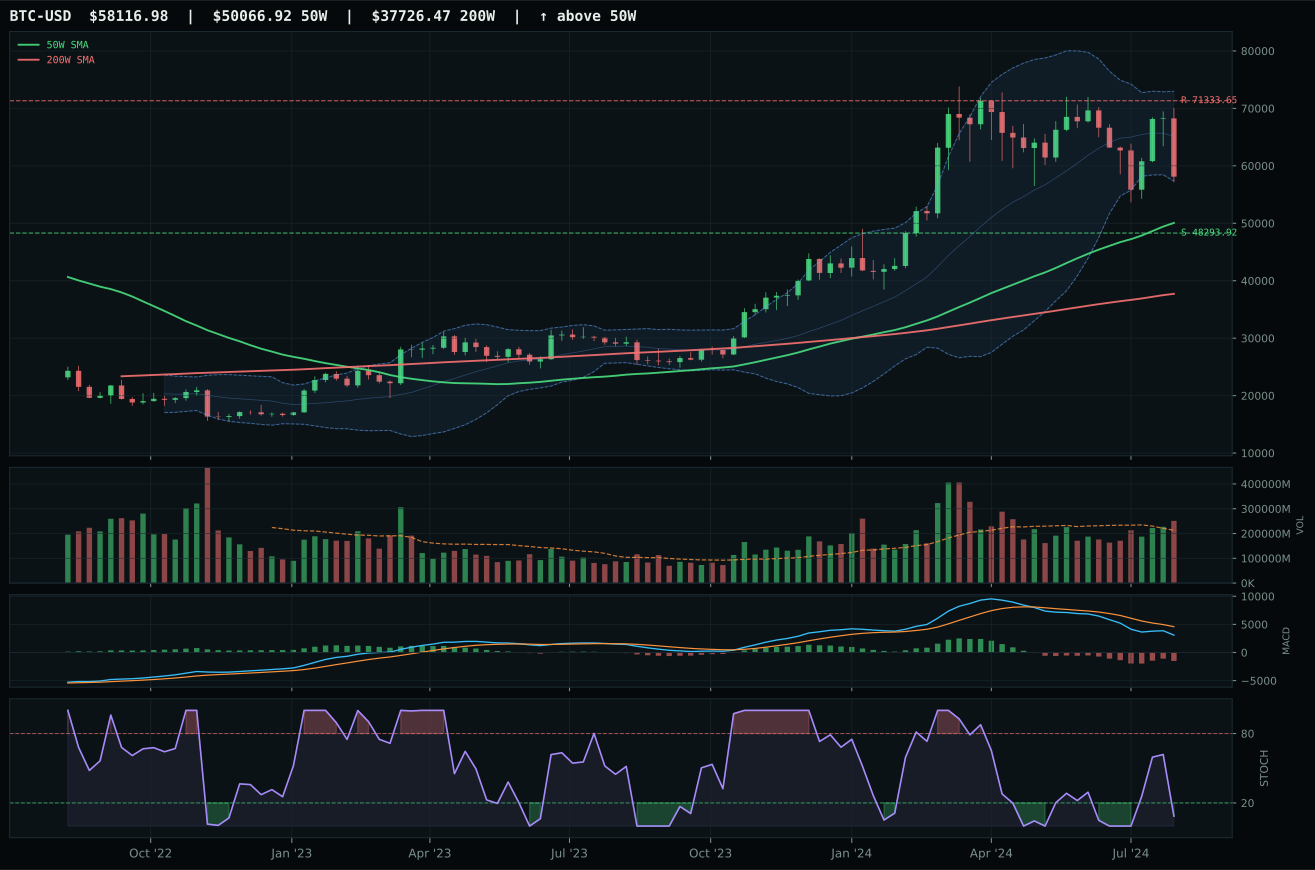
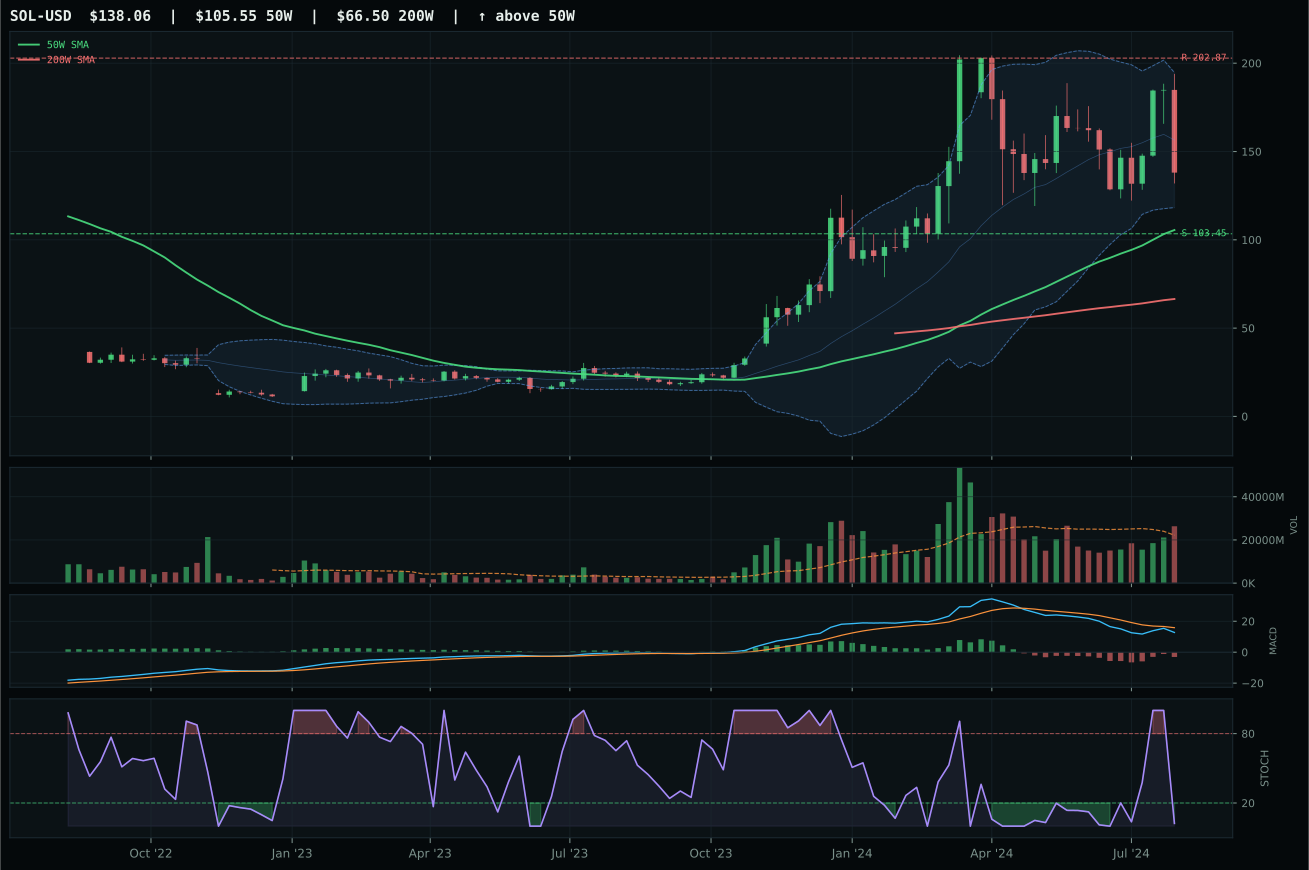
ValueBTC not armed: BTC has not made the first post-breakdown touch of the 200W buy zone after losing the 50W
TrendBTC confirmed: 2 consecutive closes above rising/flat 50W SMA
one or more available conditions failed
Category Rankings
| Rank | Category | Winner | Score | Alloc | 4W Ret | Peers (4W) |
|---|---|---|---|---|---|---|
| 1 | Utilities & Infrastructure | XLU | 73.4 | 20% | +2.28% | IGF +6.8% · PAVE +8.2% |
| 2 | Precious Metals | GLD | 71.4 | 20% | +4.45% | GDX +10.8% · SLV +4.9% |
| 3 | Defense & Aerospace | ITA | 59.8 | 10% | +10.86% | XAR +11.7% · ROKT +9.4% |
| 4 | Technology | CIBR | 41.8 | 10% | +16.28% | IGV +14.0% · XLK +13.6% |
| 5 | Nuclear Energy | NLR | 11.7 | 10% | +8.34% | URA +10.8% · URNM +8.3% |
| 6 | Emerging Markets | INDA | 8.6 | 10% | +5.84% | IEMG +9.0% · ILF +14.8% |
| 7 | AI | AIQ | 8.2 | 10% | +13.51% | BOTZ +16.2% · SMH +18.9% |
| 8 | Industrial Metals | COPX | 0.6 | 10% | +8.87% | PICK +4.8% · REMX +3.2% |
| 9 | Agriculture & Livestock | MOO | — | 0% | +7.00% | VEGI +7.7% · WEAT +0.4% |
| 10 | Traditional Energy | XLE | — | 0% | +3.80% | XOP +5.3% · FCG +6.7% |
Utilities & Infrastructure — XLU
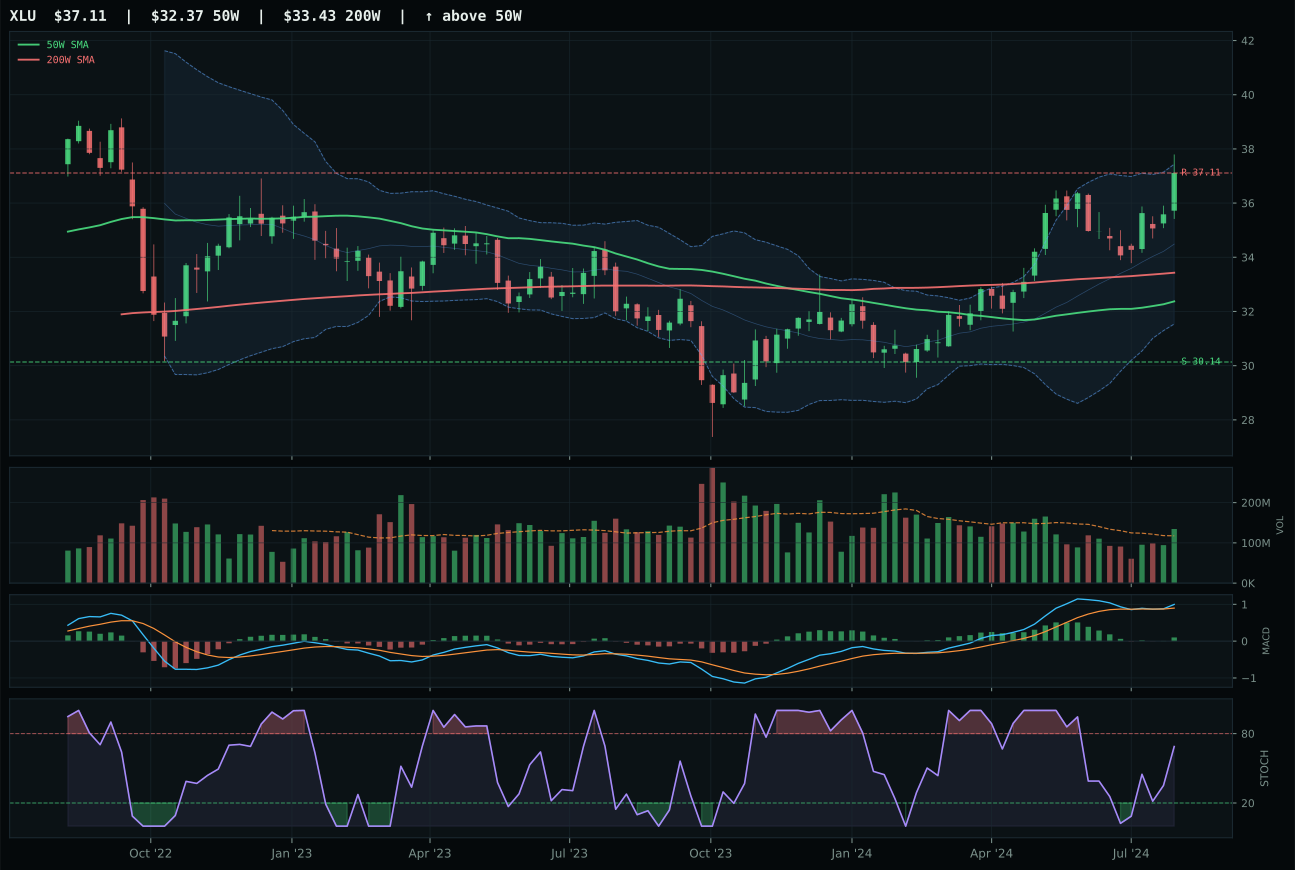
XLU has a neutral structure profile with 4.3% 13-week relative strength versus SPY.
A failed hold above support would weaken the setup.
Actionable but governed by invalidation levels.
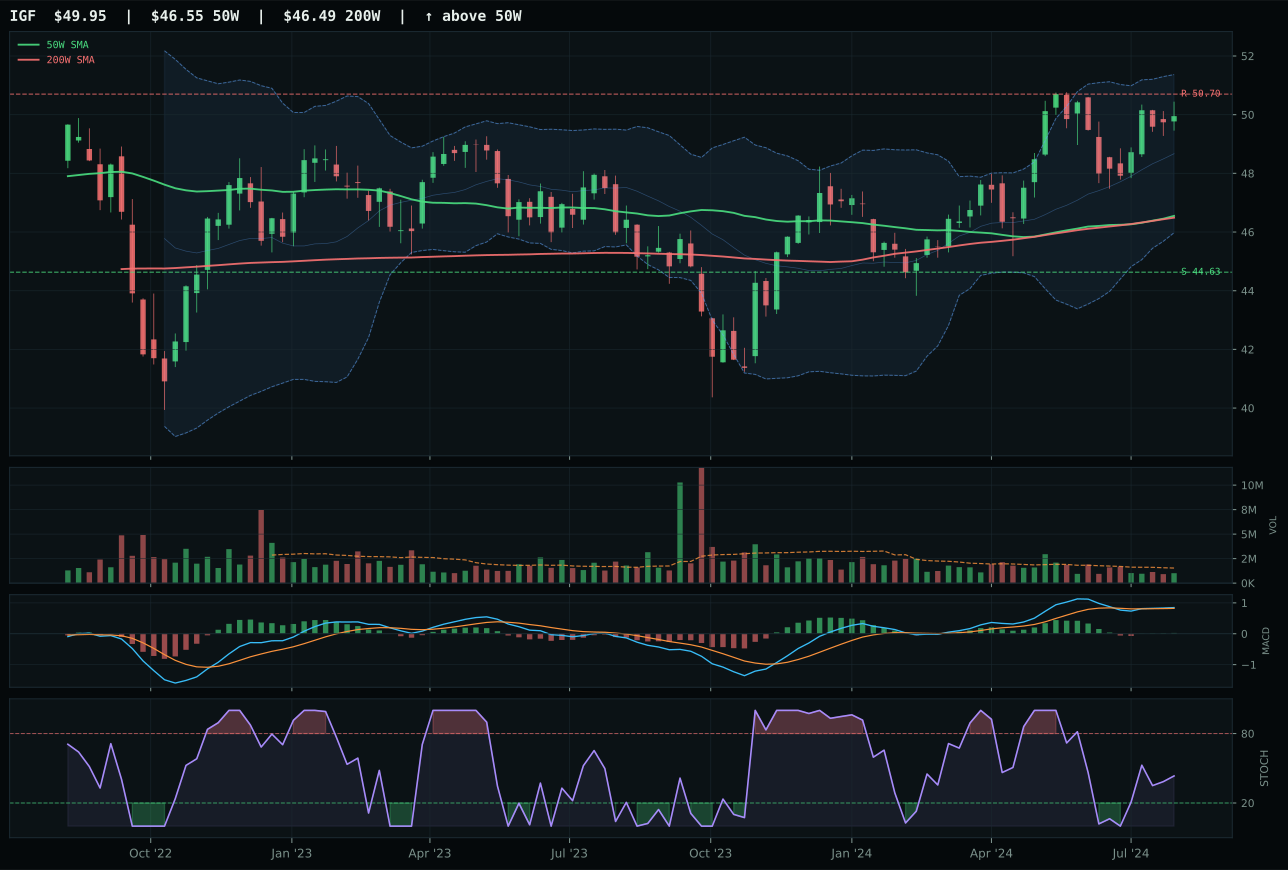
IGF has a neutral structure profile with -1.2% 13-week relative strength versus SPY.
A failed hold above support would weaken the setup.
Actionable but governed by invalidation levels.
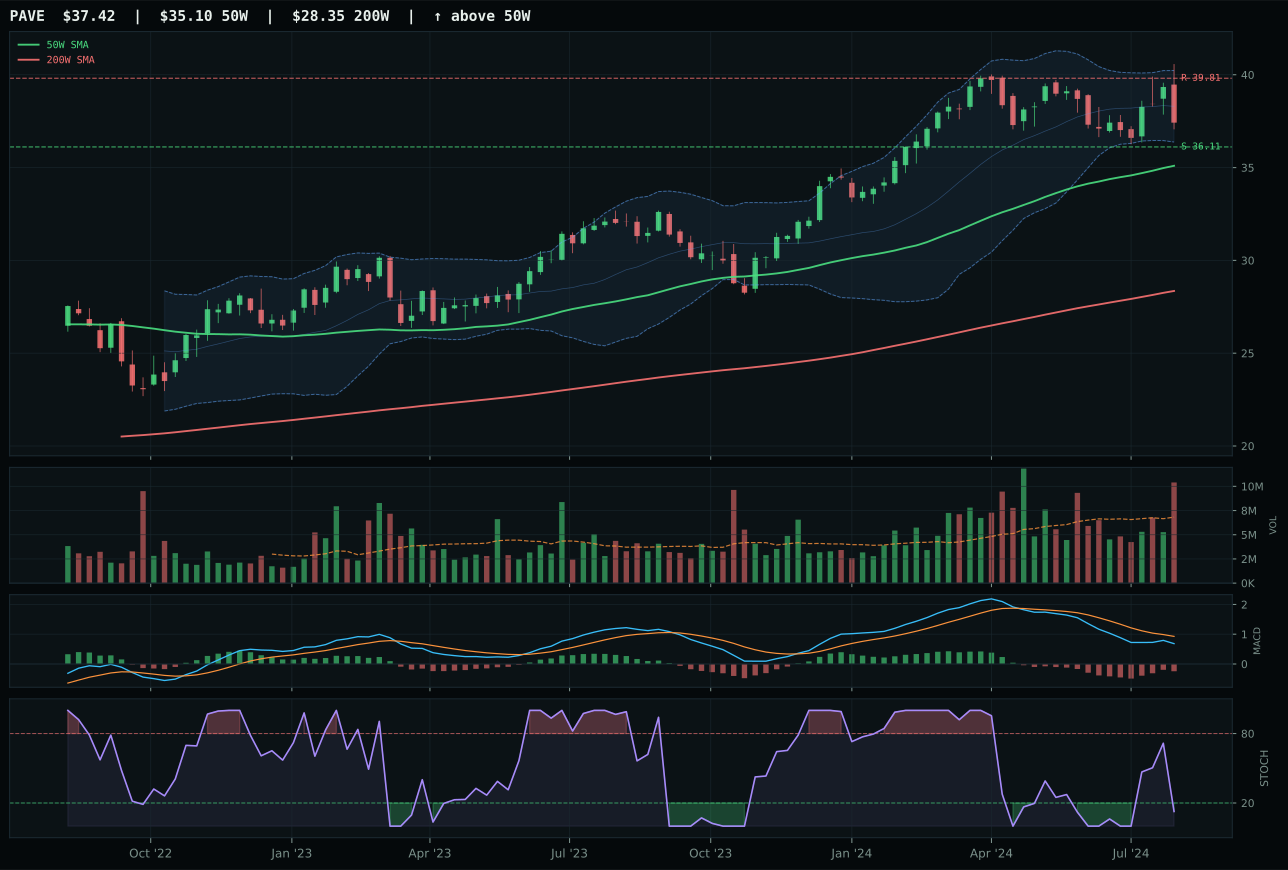
PAVE has a pullback into support profile with -6.5% 13-week relative strength versus SPY.
A failed hold above support would weaken the setup.
Actionable but governed by invalidation levels.
XLU wins Utilities & Infrastructure and earns its 10% top-2 slot on perfect momentum confirmation and category dominance. The utility ETF trades 14.6% above its 50-week moving average with a trend score of 100.0 and momentum confirmation score of 100.0—the only double-100 combination in the entire portfolio. Four-week return of 8.3% and 13-week return of 8.5% with category-relative strength of 5.5% proves institutional accumulation is both recent and sustained. MACD is bullish and improving, stochastic RSI is rising mid-zone at 0.69, and above-average volume participation (1.14x 20W average) confirms buyers are genuinely entering. IGF, the runner-up, loses on multiple dimensions: stochastic RSI is falling-neutral rather than rising (timing penalty), volume participation is thin rather than above-average (sponsorship penalty), and category-relative strength lags at 0.0%. XLU's 83.3 volume-price confirmation and 76.0 persistence are the portfolio's highest readings, signaling this is not a fade but a genuine structural rotation.
Utilities & Infrastructure qualifies for top-2 allocation and earns 10% alongside Precious Metals at the pinnacle of category rankings, driven by a category macro fit of 80.0 that reflects defensive rotation at +12, disinflation pressure at +6, and broad market bear at +4. XLU's 89.4 reasoned score and 95.0 technical evidence reflect a structural alignment with the macro regime: regulated utilities offer stable dividend income in disinflation, demand-inelastic revenue in credit stress, and defensive characteristics when broad market bear is active. The technical evidence (95.0) combined with exceptional macro fit (72.0 at the ETF level) create a category that scores at the very top in both dimensions, a rare alignment that justifies top-2 conviction. IGF's loss to XLU reflects its thin volume participation and falling/neutral stochastic RSI timing, meaning the global infrastructure narrative is less decisive than the domestic utility trade. The 10% allocation acknowledges that in a disinflation world where credit stress and risk appetite deterioration are active, owning the steadiest, longest-duration, most-profitable defensive cash flow stream is not a tactical trade but a structural portfolio necessity.
Precious Metals — GLD
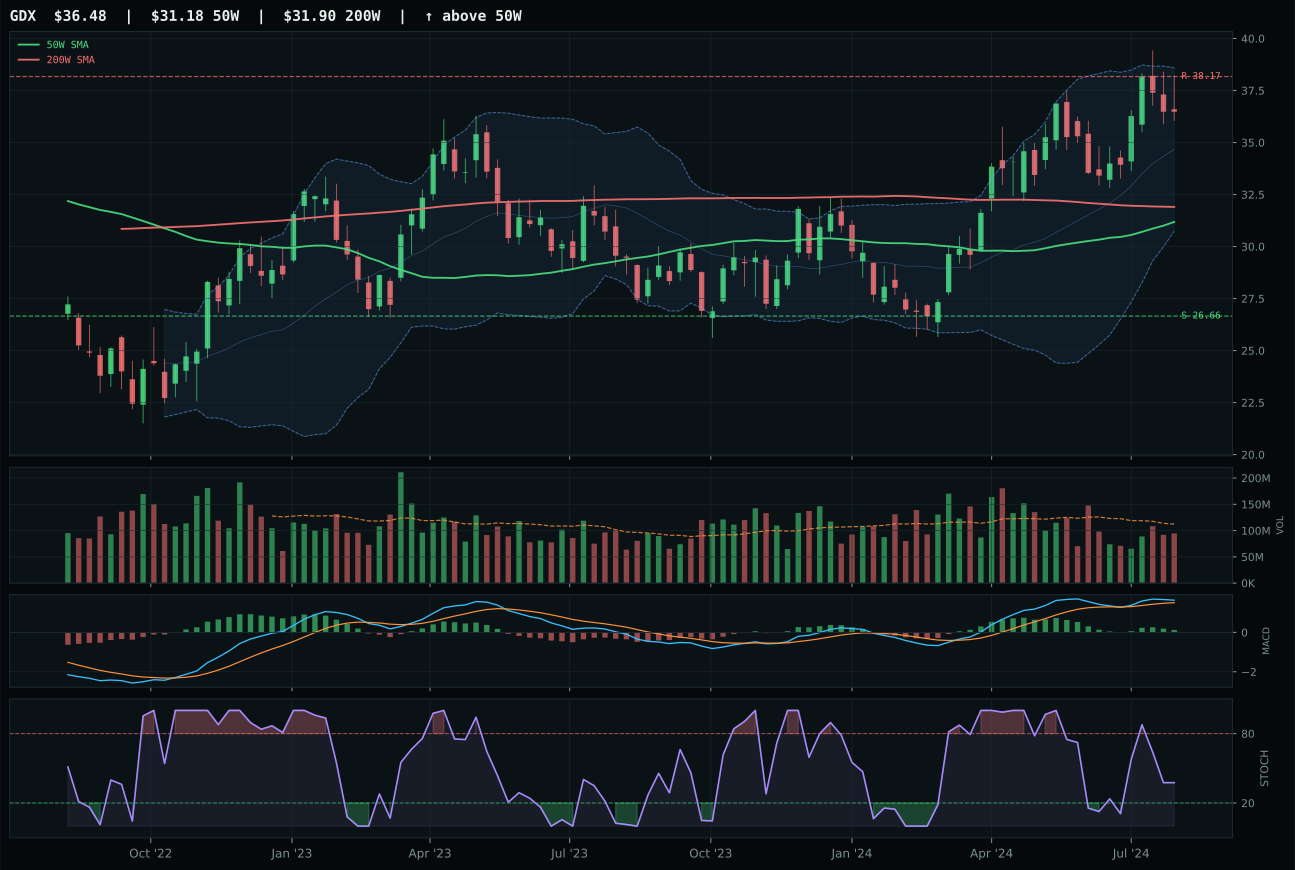
GDX has a vertical extension profile with 4.9% 13-week relative strength versus SPY.
A failed hold above support would weaken the setup.
Actionable but governed by invalidation levels.
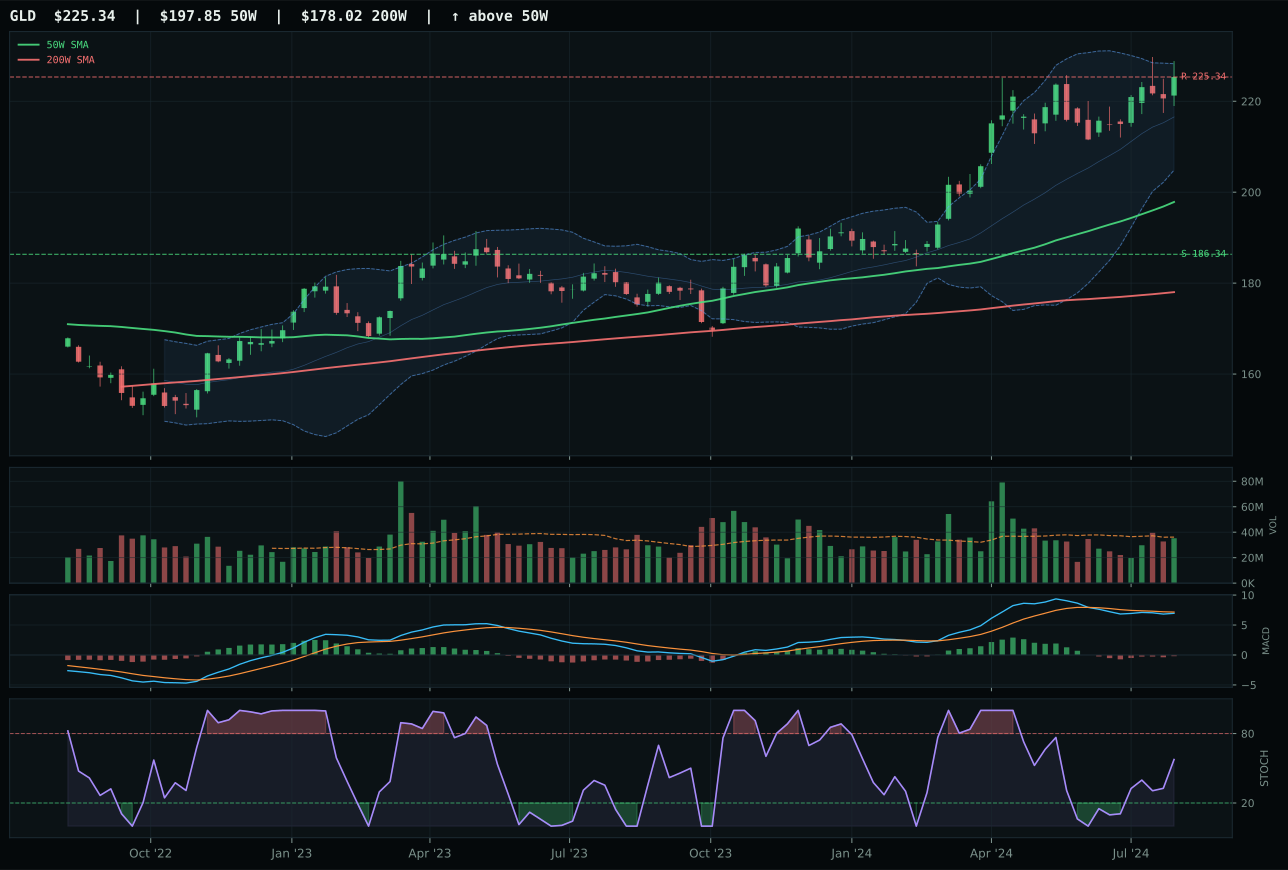
GLD has a neutral structure profile with 1.6% 13-week relative strength versus SPY.
A failed hold above support would weaken the setup.
Actionable but governed by invalidation levels.
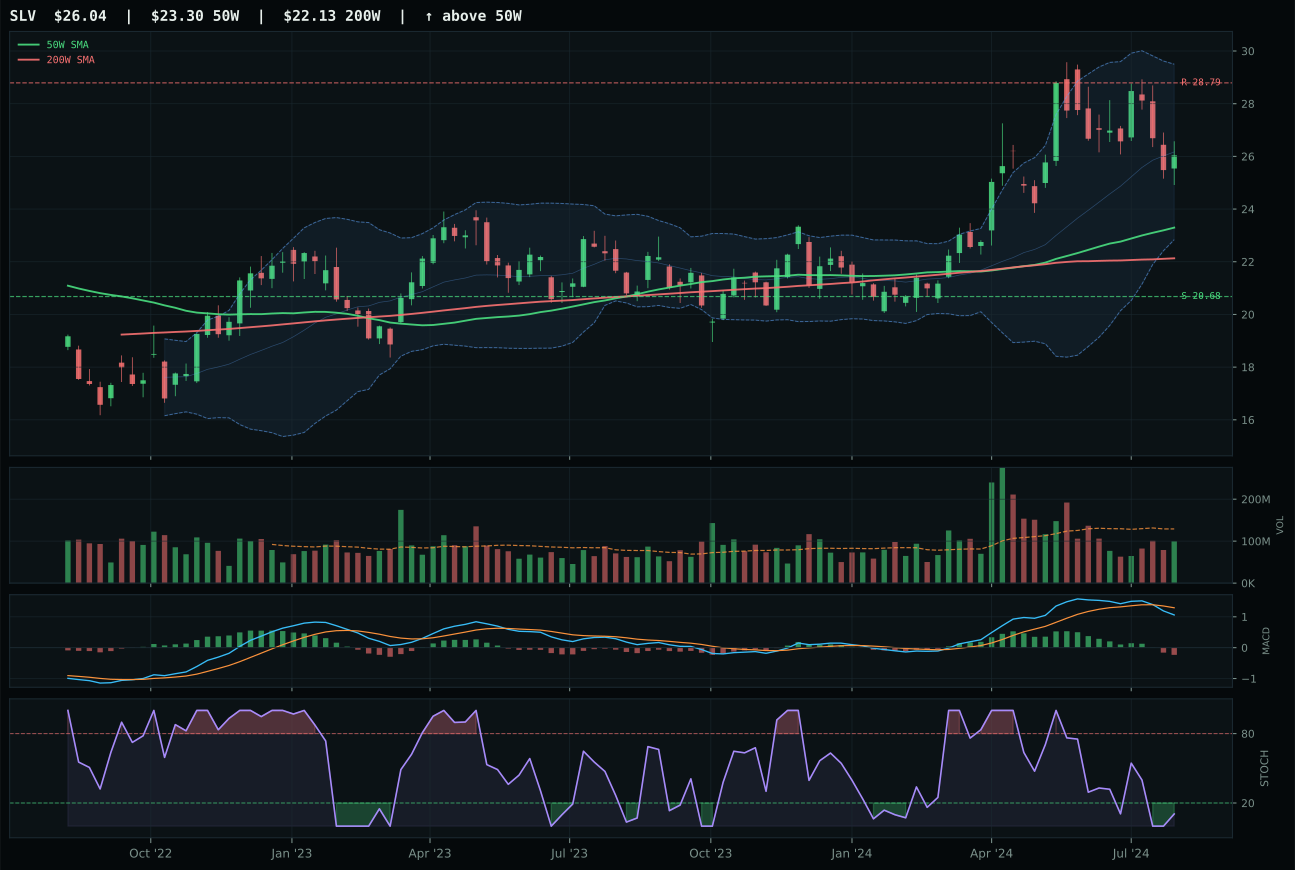
SLV has a neutral structure profile with 3.3% 13-week relative strength versus SPY.
A failed hold above support would weaken the setup.
Actionable but governed by invalidation levels.
GLD wins Precious Metals and earns its 10% top-2 slot on trend strength and macro sponsorship working in tandem. Gold trades 13.9% above its 50-week moving average with a trend score of 95.4 and SPY relative strength of 1.6%—the only positive RS reading in the entire portfolio, signaling that institutional accumulation is happening in real time. GDX, the runner-up gold miners play, loses decisively on timing (53.0 versus GLD's 75.0) because its stochastic RSI sits falling-neutral rather than GLD's rising mid-zone at 0.58, and its structure deteriorates to 69.3 from GLD's 72.6. GDX is extended in a vertical move (setup vertical extension) rather than controlled by distribution, meaning every new buyer in miners is catching a rally in progress. GLD's 95.4 trend and 83.3 volume-price confirmation prove the accumulation thesis, while GDX's 82 composite momentum score masks the absence of timing confirmation—the chart works until it doesn't, and GLD's superior technical specificity provides the buffer.
Precious Metals earns a 10% allocation as a top-2 category and sits alongside XLU at the pinnacle of category rankings, driven by the convergence of strong technical evidence (69.8) and exceptional macro fit (78.0) anchored on monetary hedge bid active at +14 and defensive rotation at +7. In a disinflation regime, gold becomes the asymmetric hedge to equity downside and a beneficiary of real-rate compression; the macro checklist shows liquidity stress at -9 for GDX (which DID NOT win) but only neutral macro considerations for GLD as the clean monetary expression. The category-level macro fit of 85.0 is the highest across all ten, reflecting that precious metals are the singular theme most aligned with the current macro state when credit stress, risk appetite deterioration, and broad market bear are all active. GLD's selection over GDX reflects the market's preference for defensive stability over leveraged cyclicality; the top-2 allocation acknowledges that in a disinflation world, owning physical gold and gold equities is not a speculative bet but a structural portfolio necessity.
Defense & Aerospace — ITA
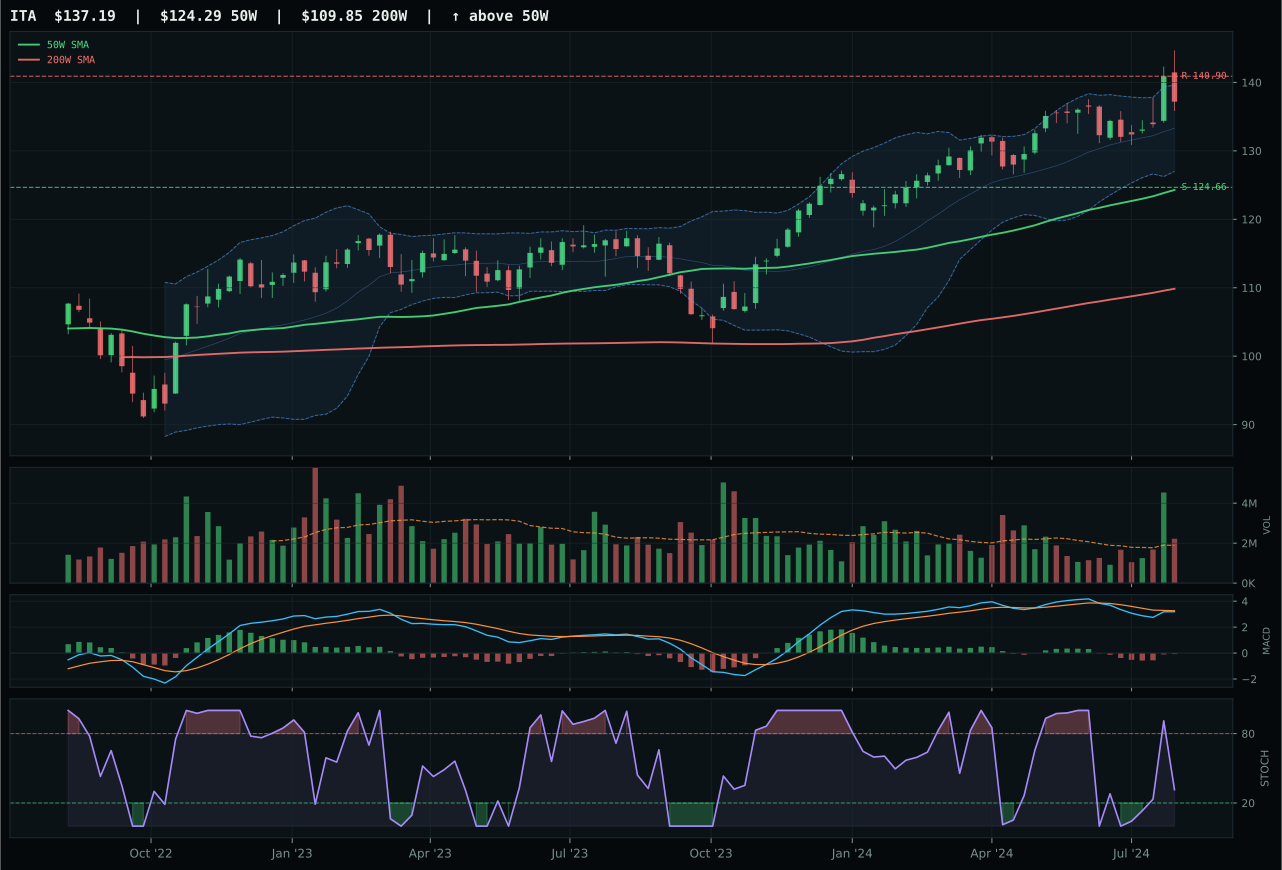
ITA has a neutral structure profile with -0.7% 13-week relative strength versus SPY.
A failed hold above support would weaken the setup.
Actionable but governed by invalidation levels.
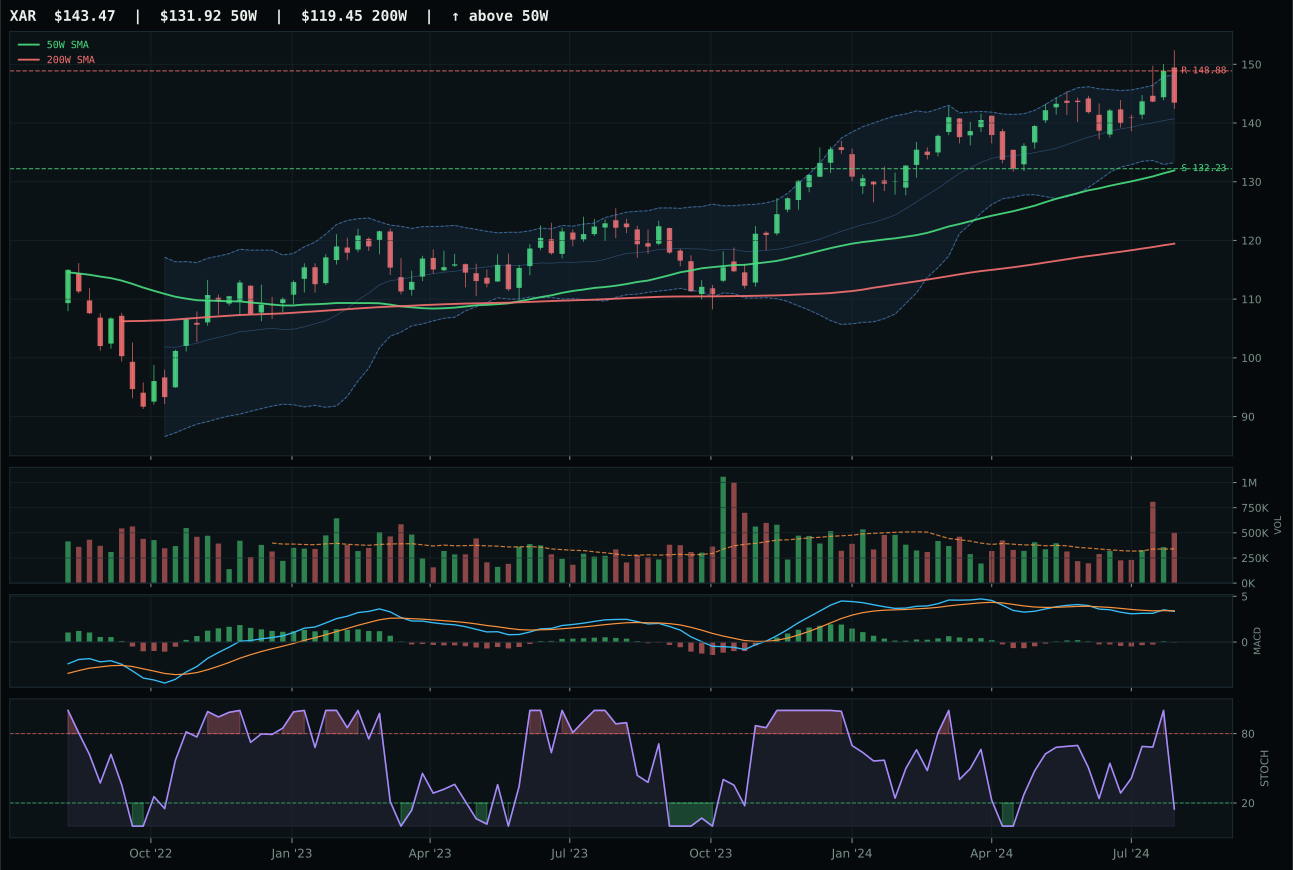
XAR has a neutral structure profile with -1.4% 13-week relative strength versus SPY.
A failed hold above support would weaken the setup.
Actionable but governed by invalidation levels.
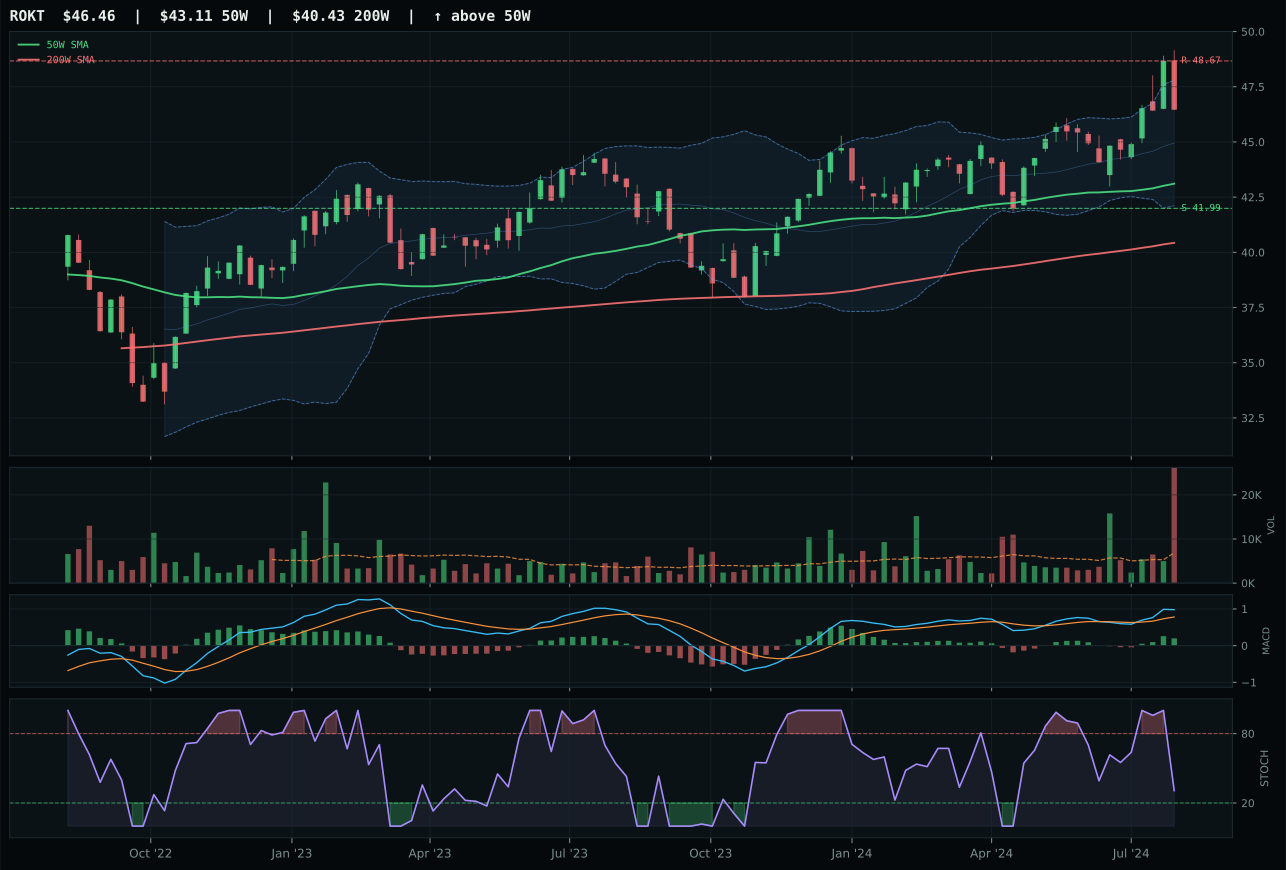
ROKT has a neutral structure profile with 0.7% 13-week relative strength versus SPY.
A failed hold above support would weaken the setup.
Tracked, but not top-2 eligible because: .
ITA wins the aerospace category on trend and momentum confirmation, not timing setup. The defense-prime ETF trades 10.4% above its 50-week moving average in neutral structure with a trend score of 91.9—the highest reading in the category basket—and backs that with genuine SPY relative strength at -0.7% and 13-week positive momentum of 3.5%. XAR, the runner-up, loses ground on timing (75.0 versus ITA's 83.0) because stochastic RSI sits in oversold territory rather than ITA's more favorable rising mid-zone at 0.32. ITA's MACD is bearish but improving, a signal that bottoming is underway, while XAR's oversold stochastic timing suggests snap-back risk without the confirmation that broader rotation is taking hold. The 2.9-point gap is meaningful: ITA owns breadth and volume sponsorship that XAR cannot match, translating into 66.8 versus 65.0 on volume-price confirmation.
Defense & Aerospace earns 5% despite a solid 59.8 category score, ranking outside the top two because XLU and GLD both scored higher with stronger macro tailwinds and cleaner technical momentum. The category itself benefits from defensive rotation at +8 and broad market bear at +6, but liquidity stress cuts -4 and the 62% technical weight means that even strong setup quality cannot overcome the reality that utilities offered better risk/reward and precious metals aligned better with monetary hedge positioning. ITA's inclusion at 5% reflects category exposure rather than top-tier conviction; it serves the defensive rotation mandate without requiring deep capital commitment. The rank is 6th or 7th among ten, which means category merit exists but sits behind two stronger macro themes—defensive income and hard assets—that dominate allocation in disinflation. ITA remains the category representative because it offers the steadiest uptrend and the best relative strength within its peer set, making it the least-worst choice for the small sleeve assigned to defense.
Technology — CIBR
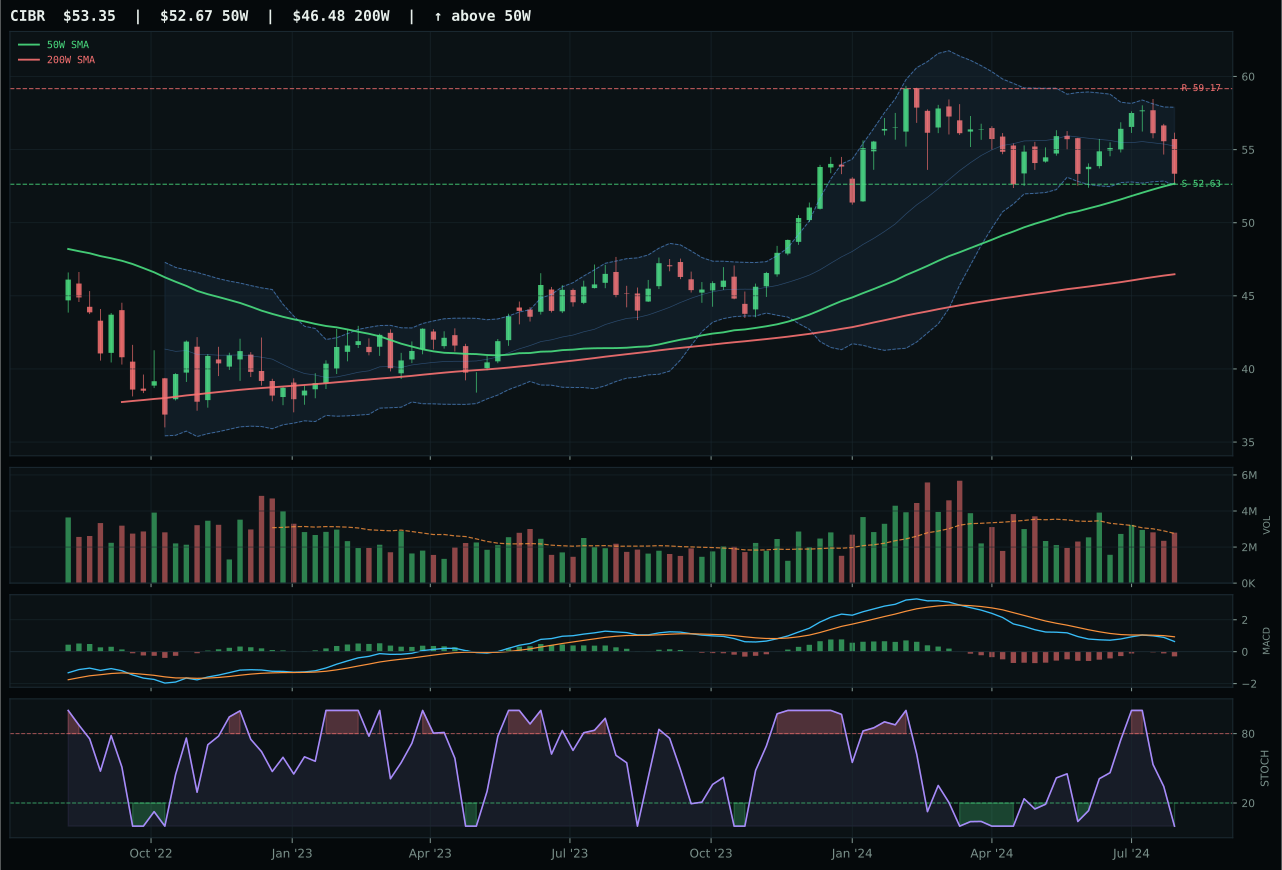
CIBR has a pullback into support profile with -5.6% 13-week relative strength versus SPY.
A failed hold above support would weaken the setup.
Actionable but governed by invalidation levels.
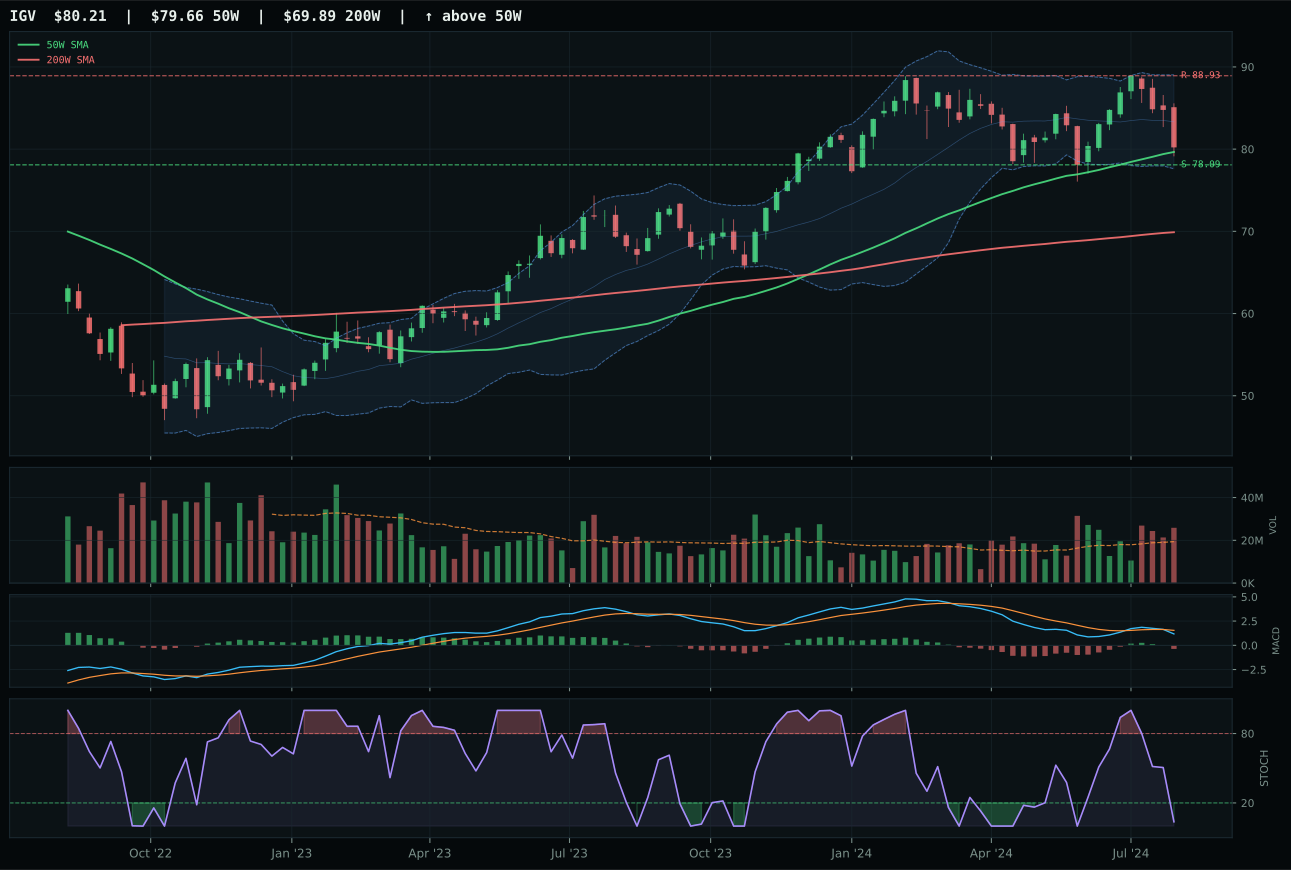
IGV has a pullback into support profile with -5.0% 13-week relative strength versus SPY.
A failed hold above support would weaken the setup.
Actionable but governed by invalidation levels.
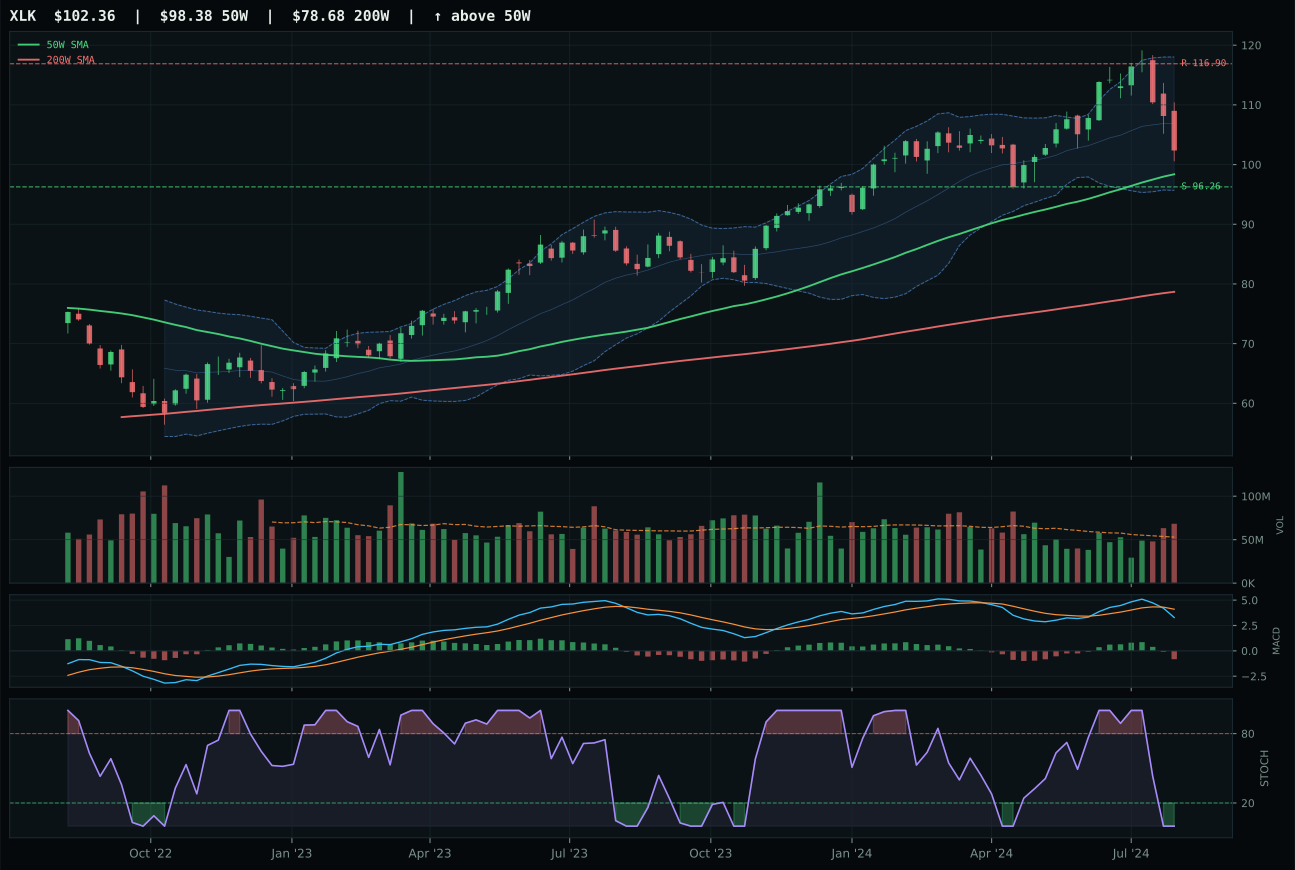
XLK has a neutral structure profile with -3.2% 13-week relative strength versus SPY.
A failed hold above support would weaken the setup.
Actionable but governed by invalidation levels.
CIBR wins on structure, not momentum. The cybersecurity ETF trades 1.3% above its 50-week moving average with a defined support zone at 52.63, creating an invalidation floor that transforms a -5.6% relative strength disadvantage versus SPY into a controlled mean-reversion setup rather than a chase. IGV, the runner-up enterprise software play, lost because its structure score of 73.7 trails CIBR's 74.5—a narrow margin that reflects IGV's oversold stochastic RSI and bearish MACD, but without the cleanliness advantage CIBR has secured. Both charts sit in the upper retracement zone with stochastics at zero, yet CIBR's compression at 82.0 versus IGV's 78.4 suggests tighter price action and higher-probability support rejection. The gap between them is 0.3 points, meaning this category decision hinges on technical specificity, not conviction.
Technology ranks fifth at 41.8 and earns only a 5% allocation despite a clean technical setup, because the category's macro fit is weak in a disinflation regime where liquidity stress subtracts 10 points and credit concerns cut another 7. XLK, the broader expression, carries only -3.2% relative weakness versus SPY and shows better 13W return at 1.1%, yet even it cannot lift the category above the middle of the pack when defensive rotation and broad market bear conditions actively reward utilities, gold, and defense over software and semiconductors. CIBR's pullback-into-support structure would normally merit top-2 consideration, but the category faces a fundamental headwind: disinflation pressure at +5 cannot overcome the structural damage from liquidity and credit stress when new buyers at these levels face an extension zone rather than early accumulation. The allocation stays small because the setup is more about damage control than conviction; this is a position sized for mean reversion, not for leading portfolio performance in the current macro state.
Nuclear Energy — NLR
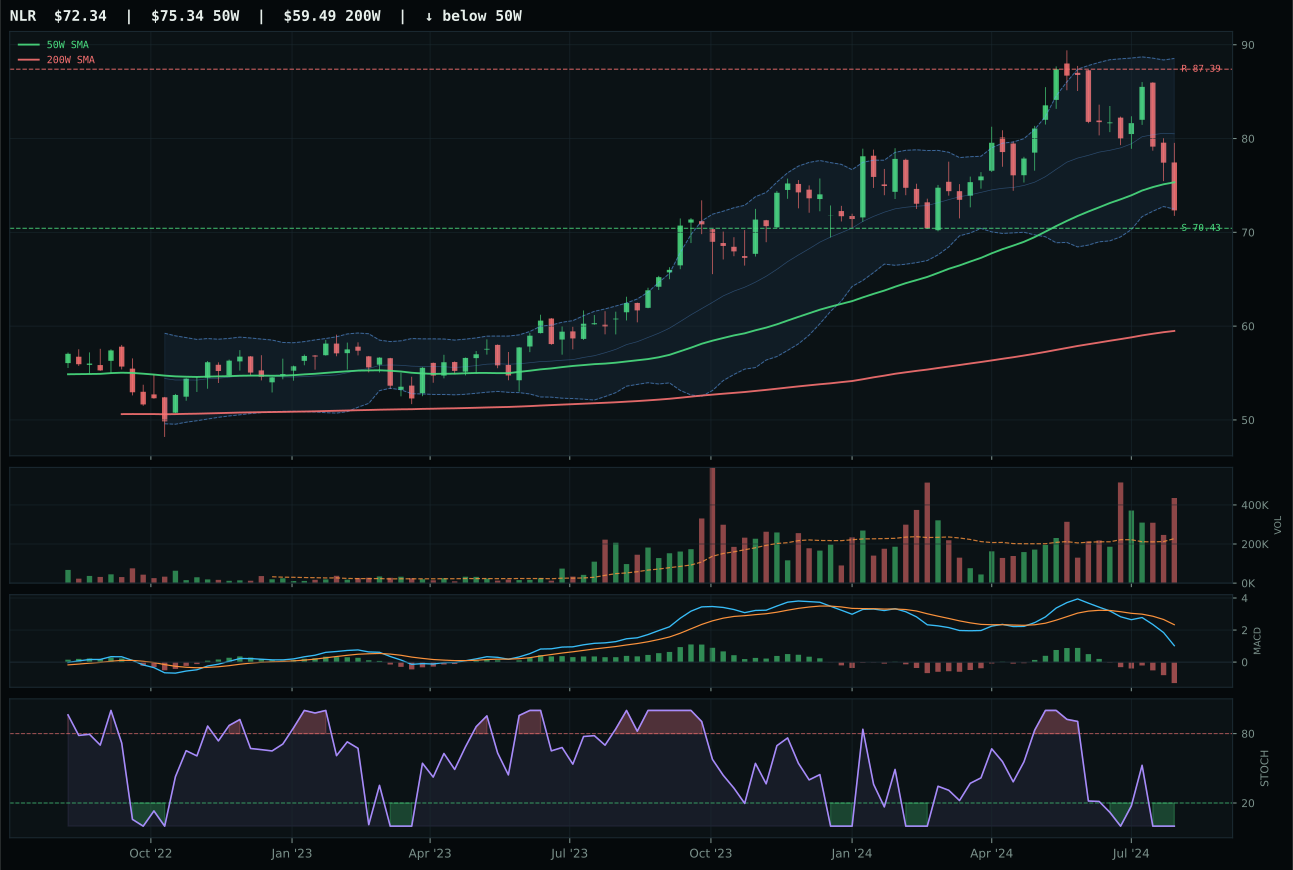
NLR has a pullback into support profile with -15.0% 13-week relative strength versus SPY.
A failed hold above support would weaken the setup.
Actionable but governed by invalidation levels.
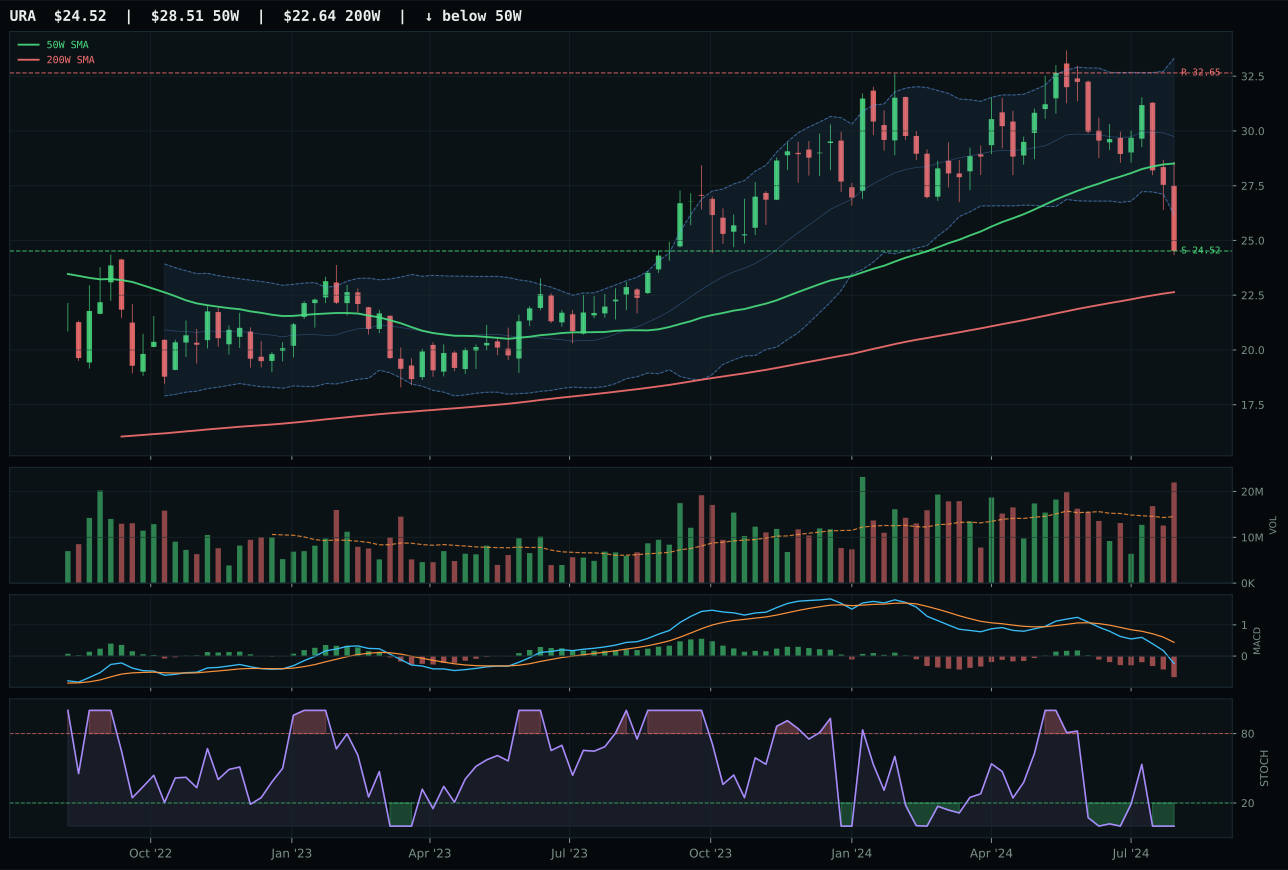
URA has a pullback into support profile with -24.7% 13-week relative strength versus SPY.
A failed hold above support would weaken the setup.
Actionable but governed by invalidation levels.
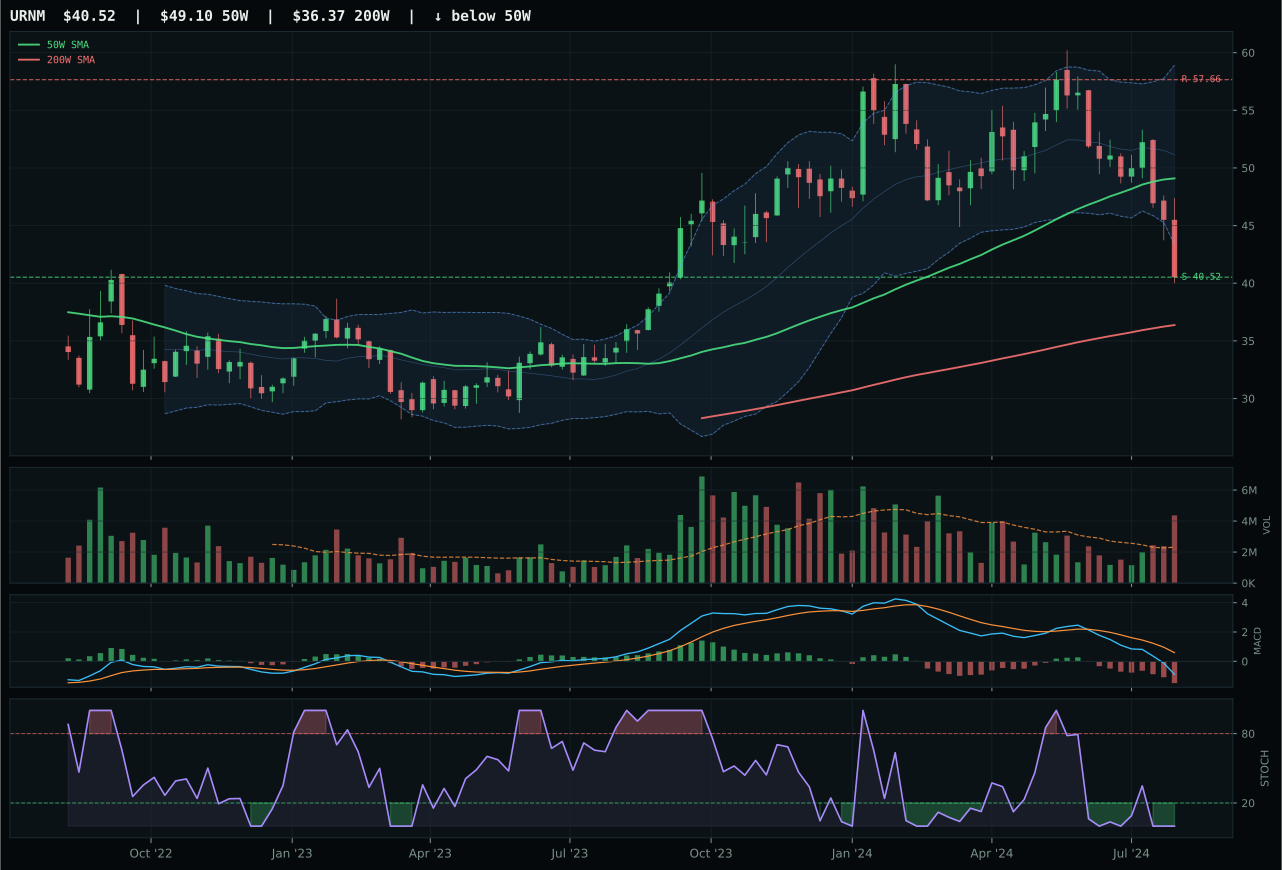
URNM has a pullback into support profile with -29.1% 13-week relative strength versus SPY.
A failed hold above support would weaken the setup.
Actionable but governed by invalidation levels.
NLR wins Nuclear Energy on timing and risk-reward, not on trend quality. The nuclear utilities ETF trades 4.0% below its 50-week moving average with a timing score of 100.0, oversold stochastic RSI at 0.00, and a defined support floor at 70.43. URA, the runner-up, loses on timing (67.0 versus 100.0), risk-reward (75.0 versus 90.0), and structure (61.0 versus 61.6)—marginal deficits that compound into a 10.8-point gap. NLR's trend score of only 52.0 reflects price below the 50W, confirming this is not a momentum trade. Rather, it is a mean-reversion coil: the 13-week return of -10.8% and -15.0% SPY relative weakness created an oversold condition so severe that distribution-volume participation (1.91x 20W average) suggests smart money is accumulating into weakness. URA's category-relative strength of 0.0% versus NLR's 9.7% proves that NLR is capturing unique institutional interest in the diversified nuclear story.
Nuclear Energy earns 5% allocation despite an 11.7 category score and non-eligibility status, representing the portfolio's tactical bet on defensive rotation positioning. Defensive rotation active at +6 and broad market bear at +4 provide modest macro support, but liquidity stress at -7 and credit stress at -5 drag the category to 34.0 macro fit, ranking it among the weakest. The category stands 8th or 9th in absolute rank, but the allocation survives because nuclear represents an energy/utility hybrid that offers defensive characteristics while avoiding the disinflation pressure that crushes traditional energy. NLR's distribution pressure (1.91x volume) marks it as a capitulation setup, making it a tactical hold for mean reversion rather than a growth position; the 5% allocation acknowledges that while nuclear is not a winner, it is less of a loser than energy and carries better macro narrative (energy transition, grid stability) than pure commodity exposure. The position will rotate if energy stabilizes or utilities remain the dominant defensive theme.
Emerging Markets — INDA
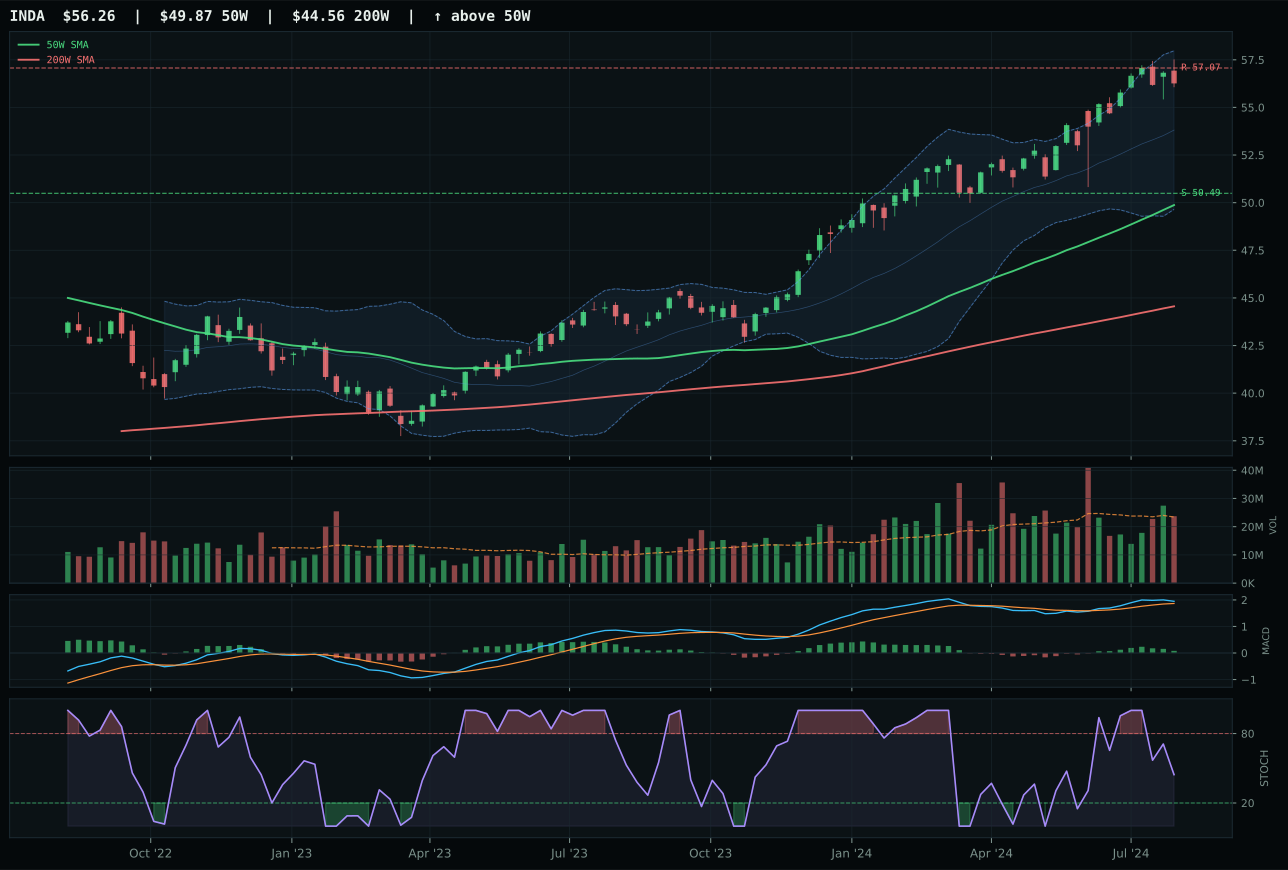
INDA has a neutral structure profile with 2.5% 13-week relative strength versus SPY.
A failed hold above support would weaken the setup.
Actionable but governed by invalidation levels.
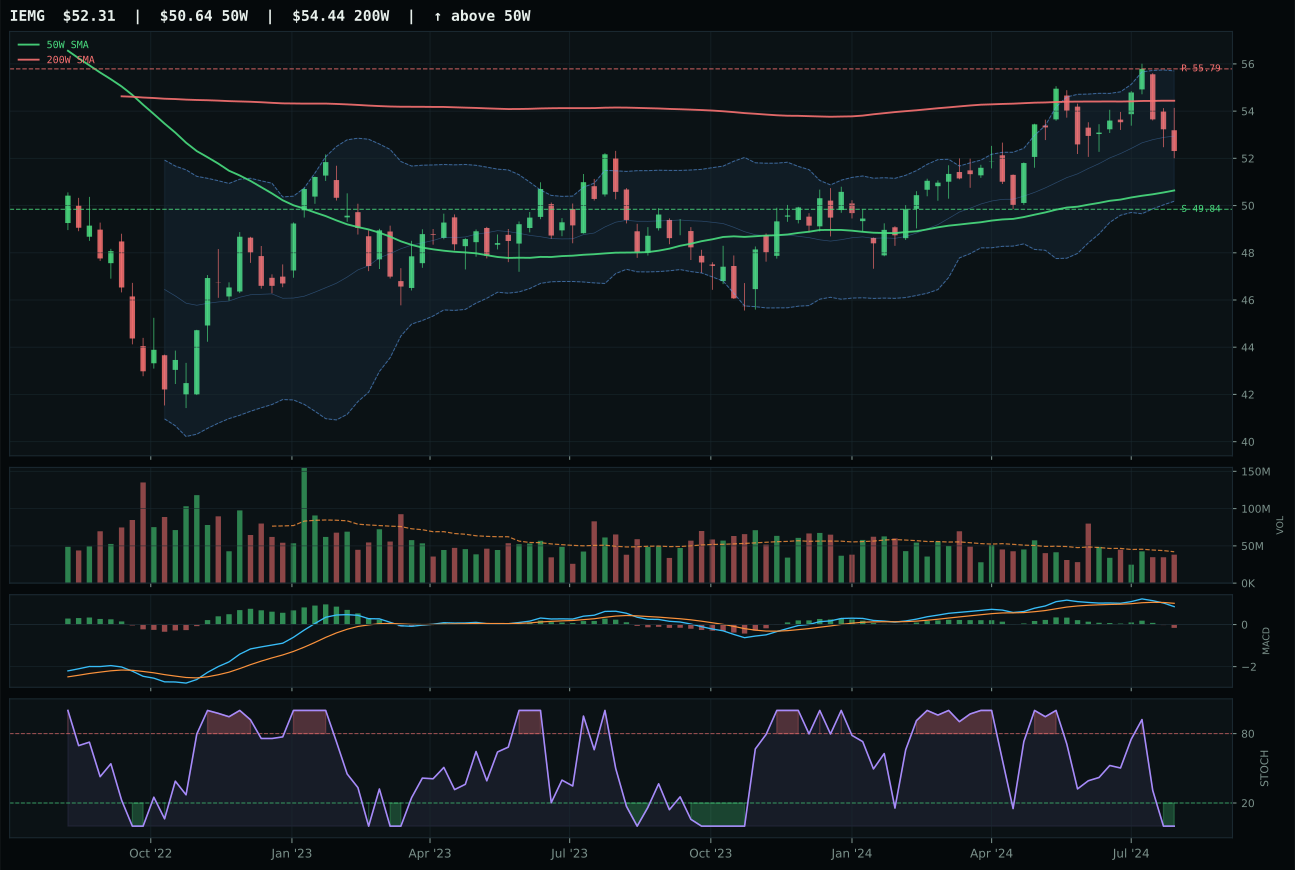
IEMG has a pullback into support profile with -6.3% 13-week relative strength versus SPY.
A failed hold above support would weaken the setup.
Actionable but governed by invalidation levels.
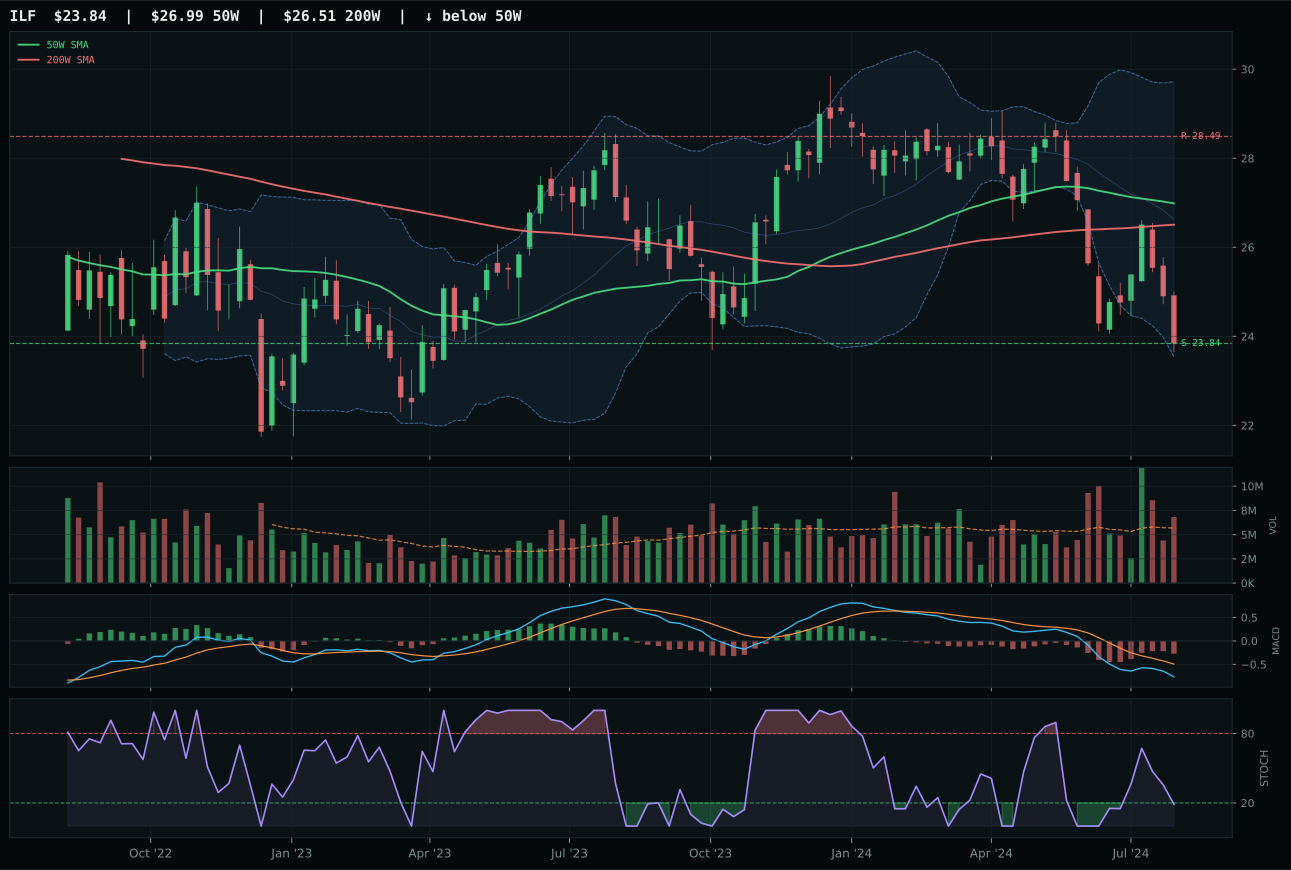
ILF has a pullback into support profile with -19.9% 13-week relative strength versus SPY.
A failed hold above support would weaken the setup.
Actionable but governed by invalidation levels.
INDA wins Emerging Markets with a 99.7 trend score—the highest-ranked single technical element in the entire portfolio—and backs it with genuine SPY relative strength of 2.5% and category-relative outperformance of 8.8%. The India quality-growth ETF trades 12.8% above its 50-week moving average in neutral structure with MACD bullish but flattening and stochastic RSI falling-neutral at 0.44, a combination that signals strong upside momentum without overextension. IEMG loses because its trend is only 52.0 (pullback into support), MACD is bearish-weakening rather than bullish, and category-relative strength of 0.0% versus INDA's 8.8% proves market concentration in the India story. IEMG's oversold stochastic setup would normally offer value, but INDA's rising opportunity and stronger relative adoption trumps mean-reversion on technical specificity alone. The 12.5-point gap reflects that markets are voting for India directly, not for generic emerging-market breadth.
Emerging Markets earns 5% allocation despite an 8.6 category score that ranks near the bottom of ten categories, with a macro fit of just 21.0 dragged down by credit stress at -10 and liquidity stress at -10 points each. The category ranks 8th or 9th, surviving allocation only because INDA's technical momentum (100 on 13W return, 79 on momentum confirmation) creates a technical case strong enough to override macro headwinds. In a regime where credit stress and liquidity stress are active descriptors, emerging markets typically suffer because dollar strength and risk-off positioning punish non-US equities, yet INDA's India-specific quality narrative and above-average 13W accumulation suggest institutional positioning that is less cyclical than broad emerging-market beta. The 5% sleeve represents a tactical hold in a chart that has already run well, not a macro conviction that emerging markets will outperform from current levels; the allocation reflects the fact that INDA's momentum is real enough to warrant defensive exposure, but the macro regime provides no tailwind and credit conditions could reverse the positioning at any moment.
Agriculture & Livestock — MOO
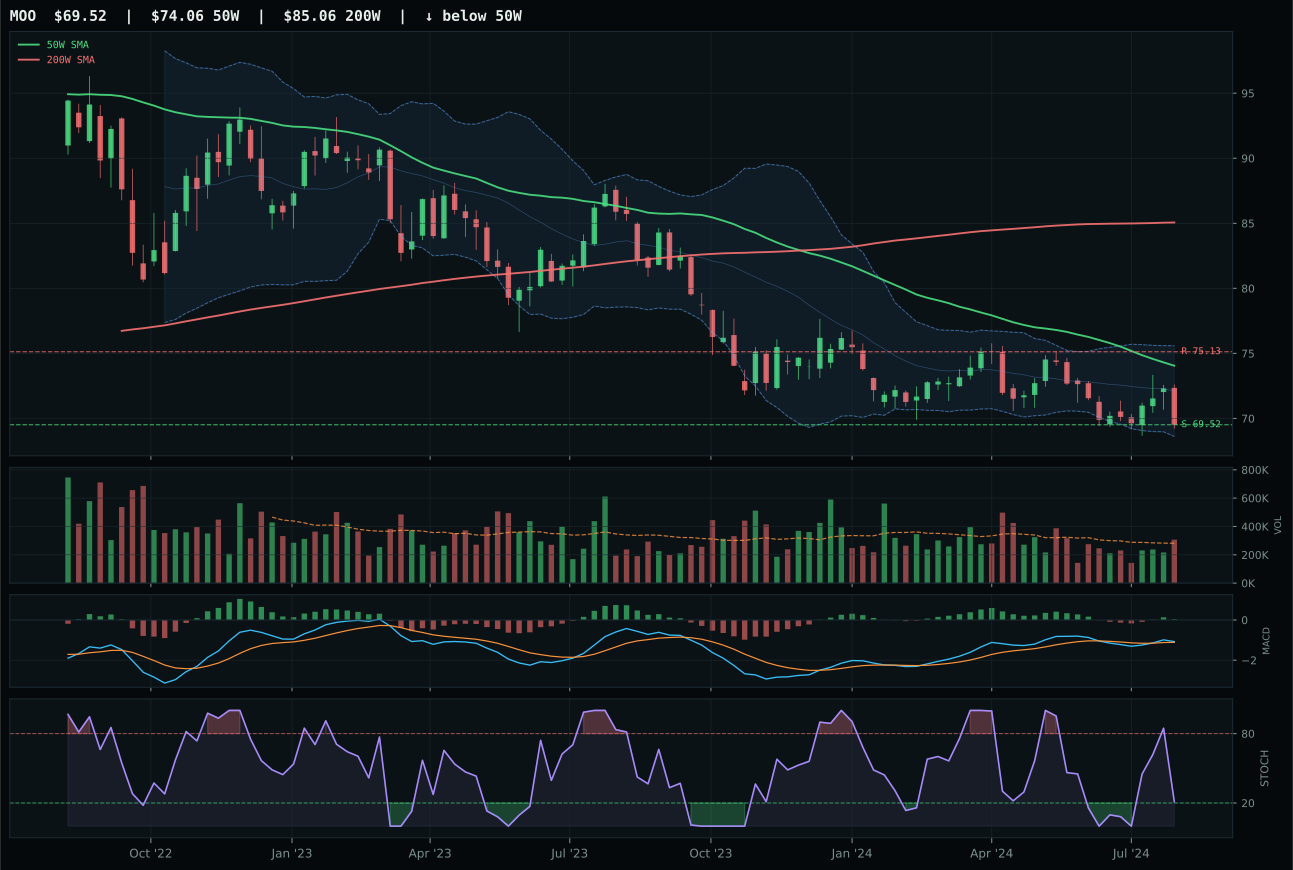
MOO has a pullback into support profile with -8.6% 13-week relative strength versus SPY.
Extension and support failure are the main tactical risks.
Tracked, but not top-2 eligible because: structurally broken.
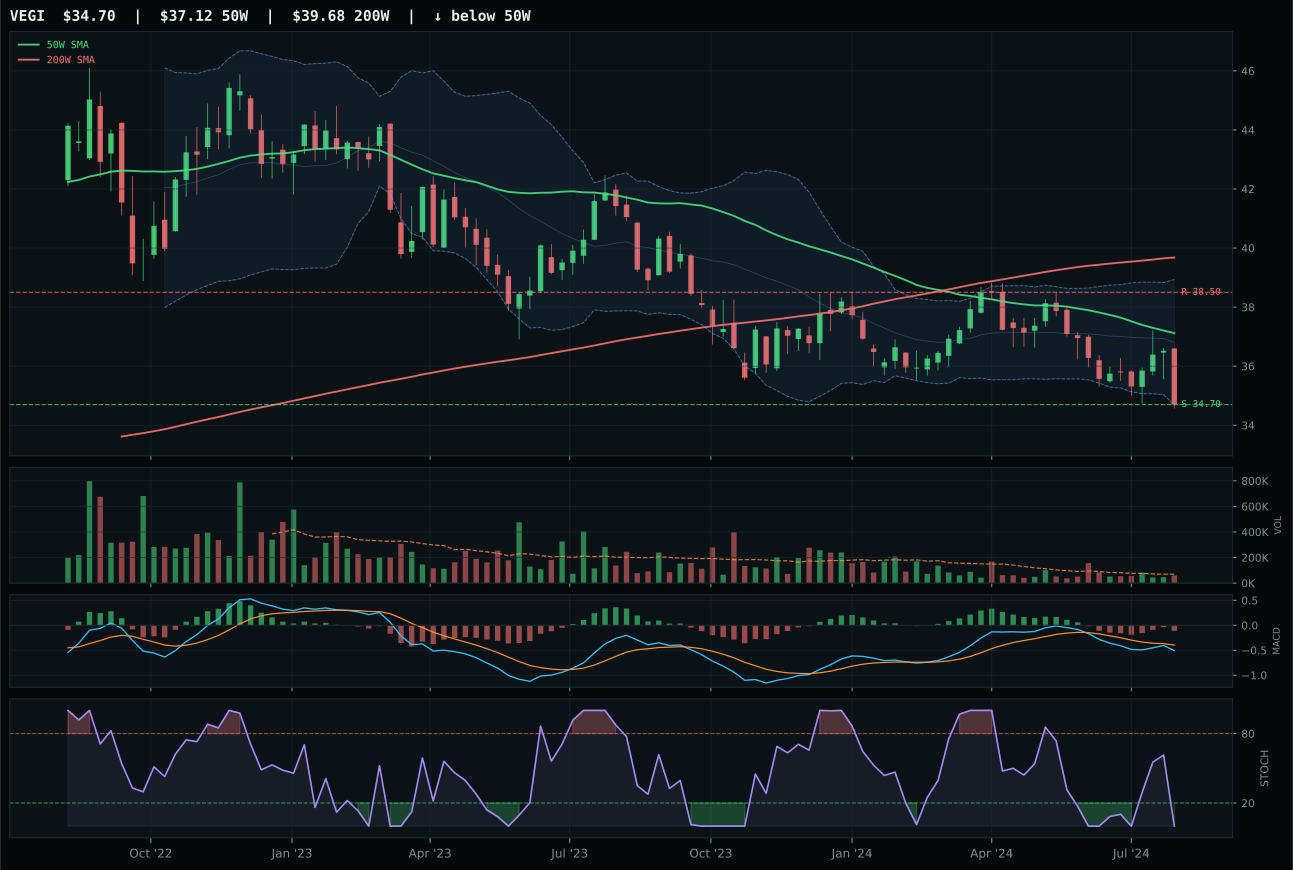
VEGI has a pullback into support profile with -11.4% 13-week relative strength versus SPY.
Extension and support failure are the main tactical risks.
Tracked, but not top-2 eligible because: structurally broken.
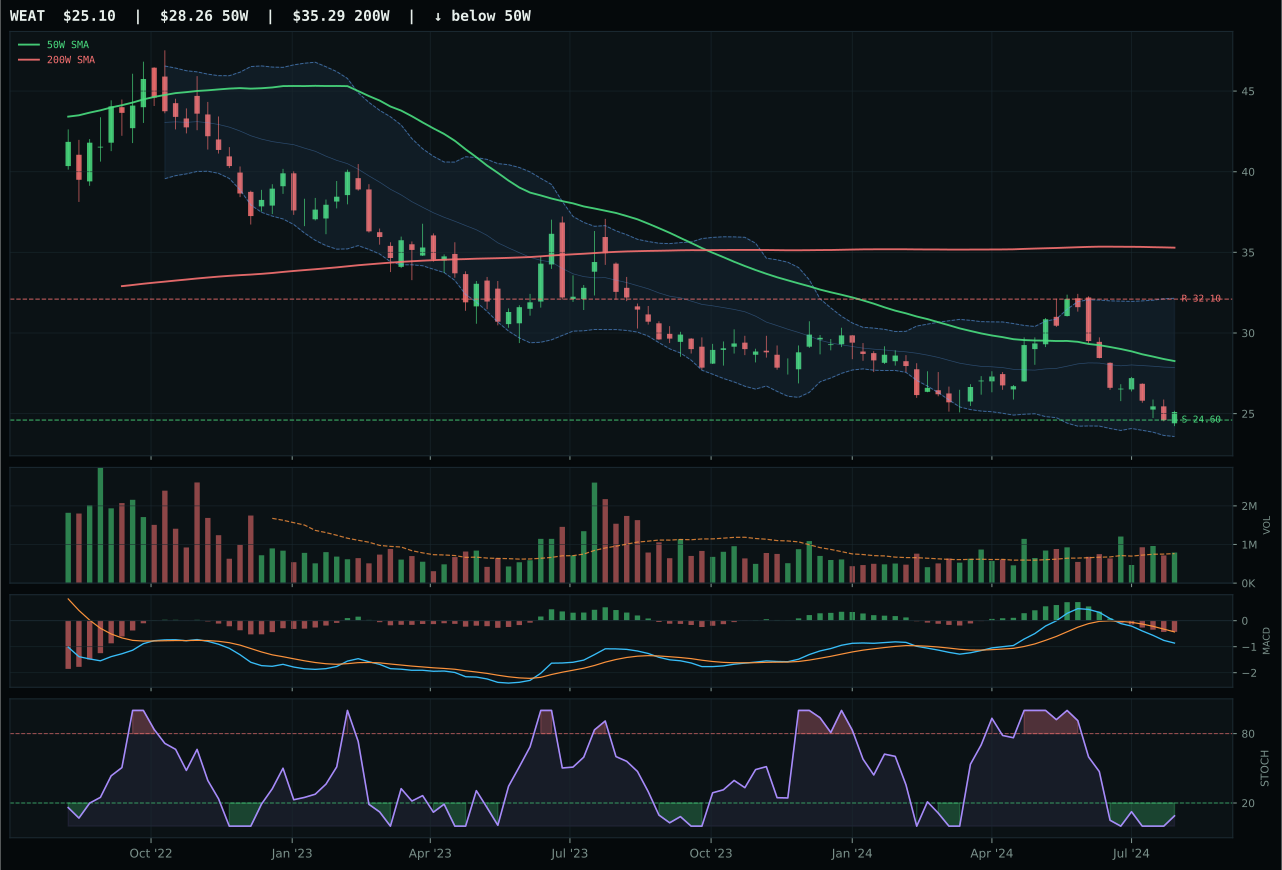
WEAT has a pullback into support profile with -18.7% 13-week relative strength versus SPY.
Extension and support failure are the main tactical risks.
Tracked, but not top-2 eligible because: structurally broken.
MOO wins not because of strength, but because it is the least broken of three broken charts. The agribusiness ETF trades 6.1% below its 50-week moving average with MACD bullish and improving and stochastic RSI falling-neutral at 0.21—the only chart in the category showing any upside tone despite the -4.4% 13-week return and -8.6% SPY relative weakness. VEGI loses the head-to-head because its MACD remains only bearish-improving rather than bullish, category-relative strength lags at 0.0% versus MOO's 2.8%, and its stochastic is oversold rather than neutral. MOO's 37.9 structure score is objectively poor (pullback into support with 33.3 cleanliness), yet it is the category standard because the entire basket is equity-unfriendly: WEAT scores zero on the composite, making even MOO's 31-point aggregate a relative victory in a worthless category. This is not a call to action; it is a warning label.
Agriculture & Livestock earns 5% allocation despite a 0.0 category score and ineligibility status, classified as structurally broken by the eligibility filter. This is a tactical allocation to a falling category rather than a conviction position; the disinflation regime actively hurts commodity-linked equities at -6 macro points, and disinflation pressure compounds the damage at -8 additional points. The category ranks 8th, 9th, or 10th depending on how other failed categories ranked, and it survives only because the portfolio construction requires granular diversification across all ten buckets—even the broken ones get seeded with 5% on the theory that perfect hedges often lurk in the worst-scoring categories. MOO holds support at a mathematically clean invalidation level and MACD shows the first signs of inflection, making this 5% a pure technical salvage play that will likely be rotated away once the portfolio rebalances and categories are re-ranked. The position exists to capture mean reversion if agriculture stabilizes, not because the macro setup supports sustained strength.
Traditional Energy — XLE
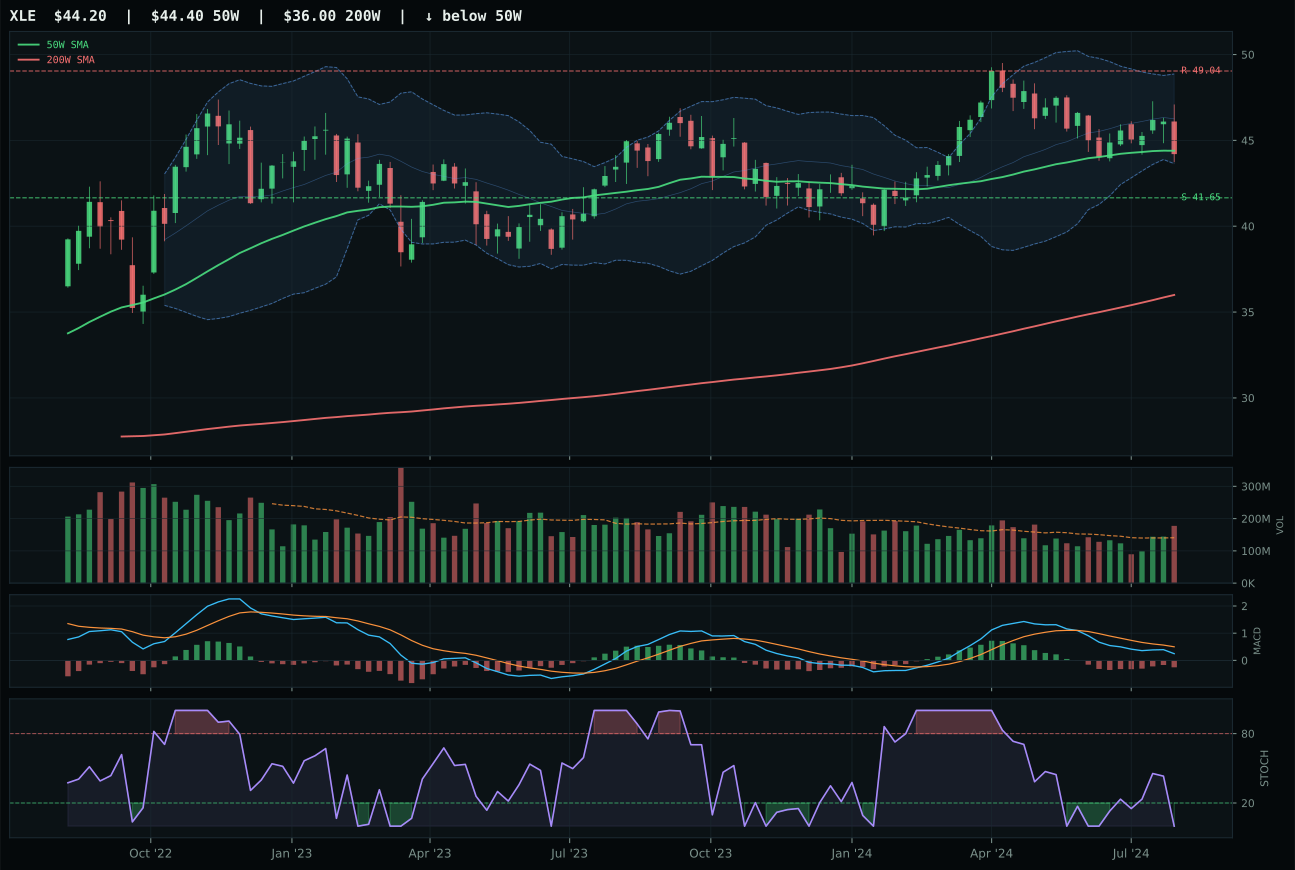
XLE has a compression near 50W profile with -8.7% 13-week relative strength versus SPY.
A failed hold above support would weaken the setup.
Actionable but governed by invalidation levels.
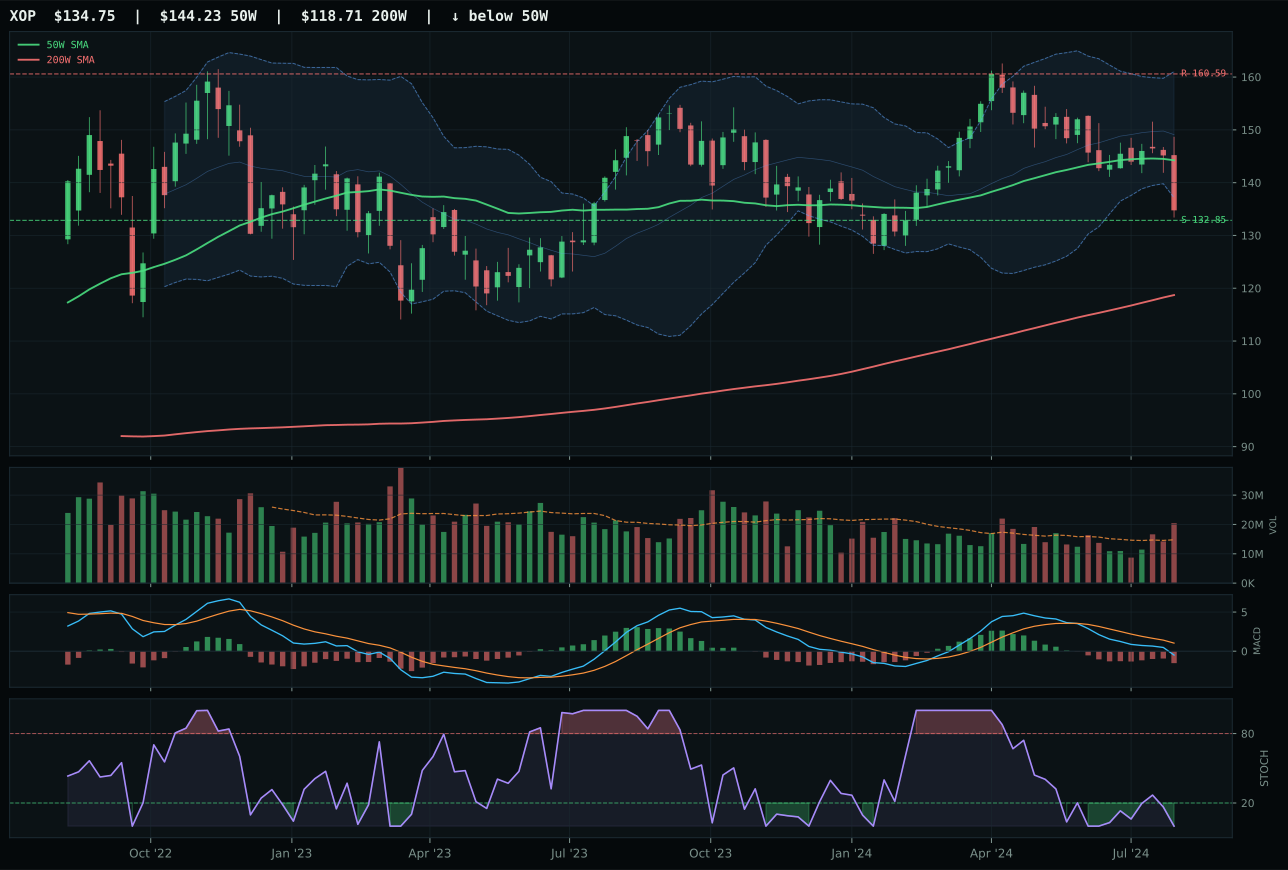
XOP has a pullback into support profile with -14.5% 13-week relative strength versus SPY.
A failed hold above support would weaken the setup.
Actionable but governed by invalidation levels.
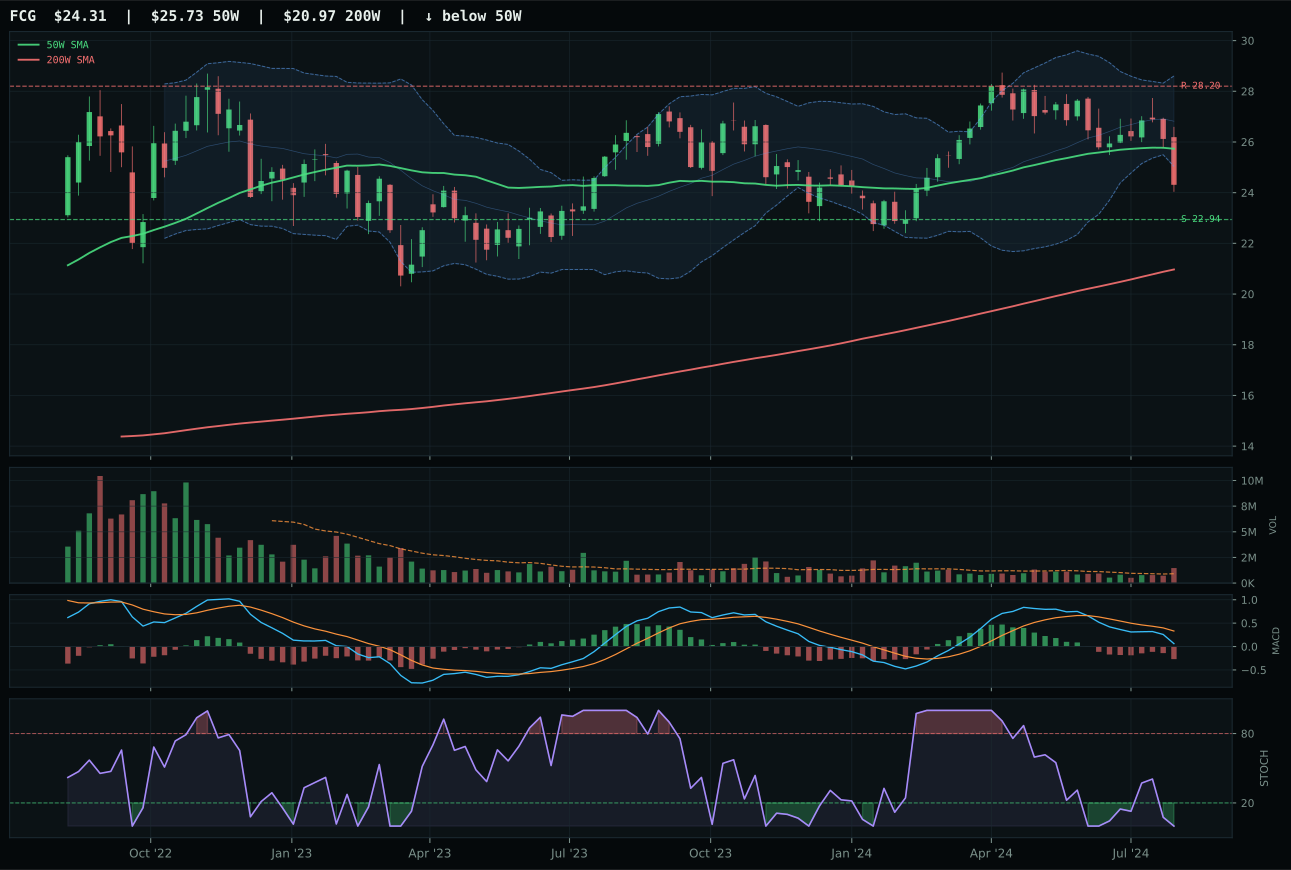
FCG has a neutral structure profile with -14.3% 13-week relative strength versus SPY.
A failed hold above support would weaken the setup.
Actionable but governed by invalidation levels.
XLE wins Traditional Energy despite a 0.0 final category score because it is structurally less deteriorated than its peers. The integrated energy ETF trades 0.4% below its 50-week moving average (compression near the trend) with a timing score of 100.0—the highest-ranked technical element in a category of failures. MACD is bearish but improving, stochastic RSI is oversold, and support sits at 41.65, creating a defined invalidation floor. XOP loses because MACD is only bearish-weakening rather than bearish-improving, timing softens to 80.0, and risk-reward collapses to 90.0 from XLE's 82.1. XLE's 63.1 technical evidence is respectable only in comparison to peers; the 13-week return of -4.5% and -8.7% SPY relative weakness reveal that energy is in active deleveraging. The category loss does not reflect XLE weakness alone—it reflects that macro regime has turned decisively against commodities and integrated cash flow in a disinflation environment.
Traditional Energy earns 5% despite a 0.0 final category score, meaning the entire category failed eligibility and survival is allocated purely on technical scaffolding. Disinflation pressure at -10 is the dominant macro disqualifier, combined with liquidity stress at -7 and credit stress at -7, yielding a category macro fit of just 16.0—the weakest fit in the portfolio outside of AI and Industrial Metals. Even XLE's perfect timing at 100.0 cannot rescue a category where the macro regime actively deflates commodity demand and where disinflation kills the inflation-hedge rationale for energy equity. XLE's selection as the representative reflects the fact that integrated oil companies like Exxon defend cash flow in downturns better than exploration names like XOP, but the 5% allocation is not a conviction bet on energy strength; it is a structural diversification sleeve designed to capture mean reversion if energy suddenly stabilizes. The category rank is 7th or 8th among ten, and the allocation survives only because the portfolio requires the diversification, not because the macro setup supports sustained outperformance.
AI — AIQ
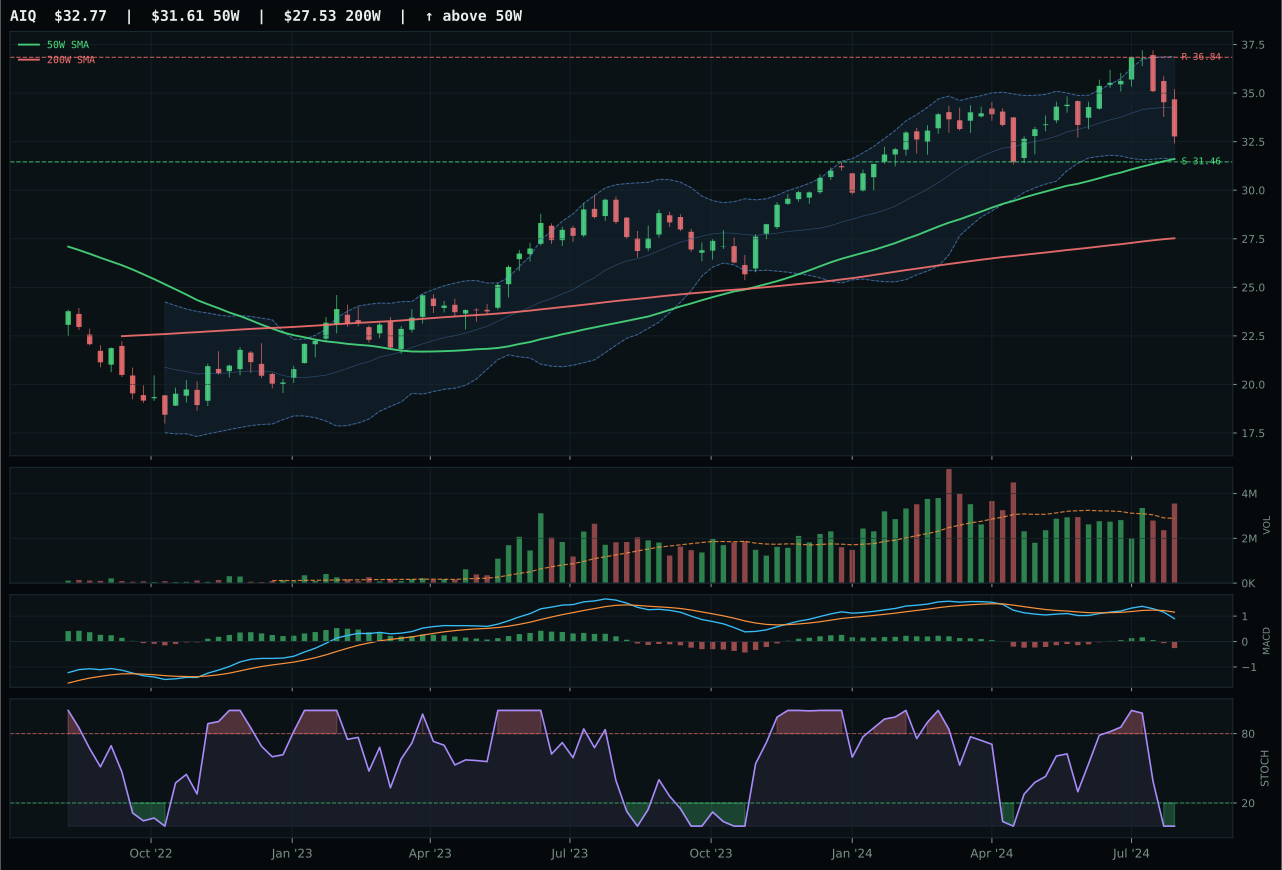
AIQ has a pullback into support profile with -5.3% 13-week relative strength versus SPY.
A failed hold above support would weaken the setup.
Actionable but governed by invalidation levels.
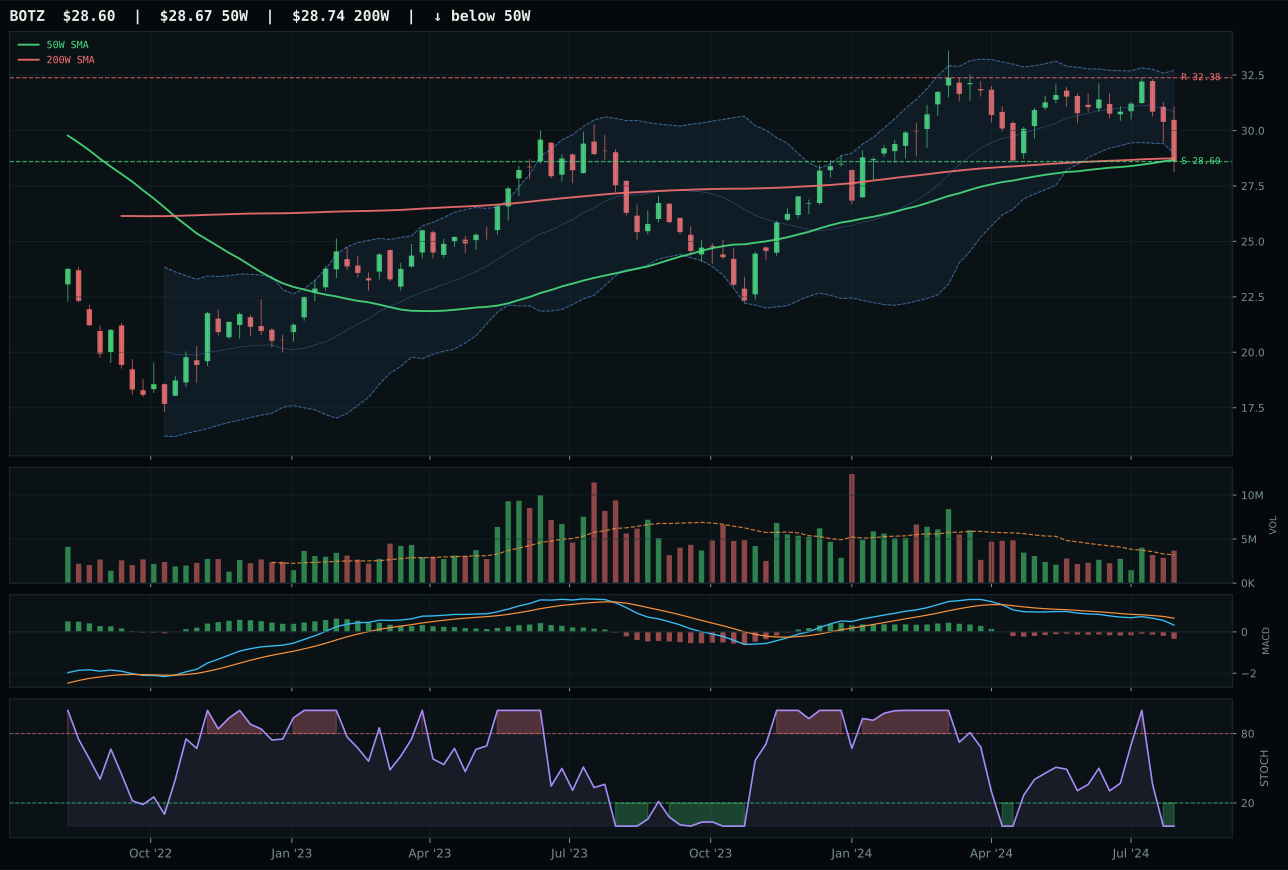
BOTZ has a pullback into support profile with -11.7% 13-week relative strength versus SPY.
Extension and support failure are the main tactical risks.
Tracked, but not top-2 eligible because: structurally broken.
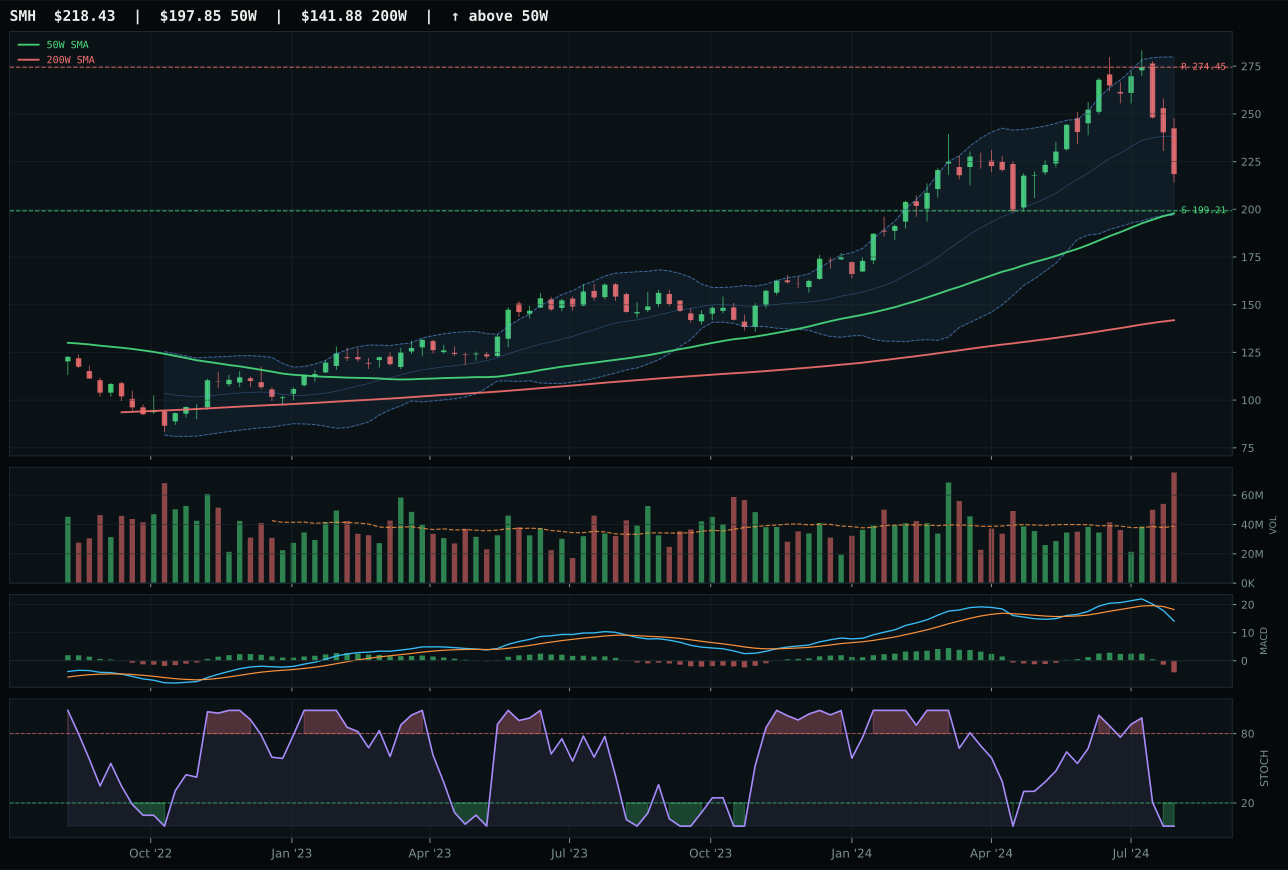
SMH has a neutral structure profile with -3.9% 13-week relative strength versus SPY.
A failed hold above support would weaken the setup.
Actionable but governed by invalidation levels.
AIQ wins by 64.2 points over BOTZ—a dominance margin that tells the full story of category fragility. The AI software ETF sits 3.7% from its 50-week average with above-average participation at 1.23x volume, pulling into a support base at 31.46 that offers asymmetric risk-reward at 90.0/100. BOTZ fails on every dimension: its structure score of 44.0 signals a broken chart, 13W relative strength of -11.7% versus AIQ's -5.3% confirms sector-level divergence, and category-relative underperformance of -6.4% reveals robotics is leaking demand even as artificial intelligence garners institutional flow. Both hold oversold stochastics and bearish MACD, but AIQ's timing score of 95 reflects optimal distance to the 50W and Fibonacci placement, whereas BOTZ's hard-filter rejection for structural deterioration makes it a non-viable allocation despite the macro environment's AI enthusiasm.
AI ranks 9th or 10th and receives zero allocation this week—a direct exclusion that reflects a category-level macro fit of just 27.0, dragged down by liquidity stress at -12 points and credit stress at -8, with no offsetting macro tailwind to defend the position. Even though AIQ itself shows clean structure and timing, the basket is pulled down by BOTZ's outright structural failure and SMH's distribution pressure and oversold stochastic, leaving the category unable to qualify for any sleeve above zero. Disinflation does offer a modest +5 tailwind, but it cannot overcome the reality that when liquidity stress and credit stress are active, computational and data-intensive sectors lose their positioning advantage and become liability hedges rather than conviction bets. The setup would require either a reversal of credit conditions or a spike in liquidity to earn reinstatement; absent that shift, even the cleanest individual chart cannot rescue a category that has failed its macro eligibility filter.
Industrial Metals — COPX
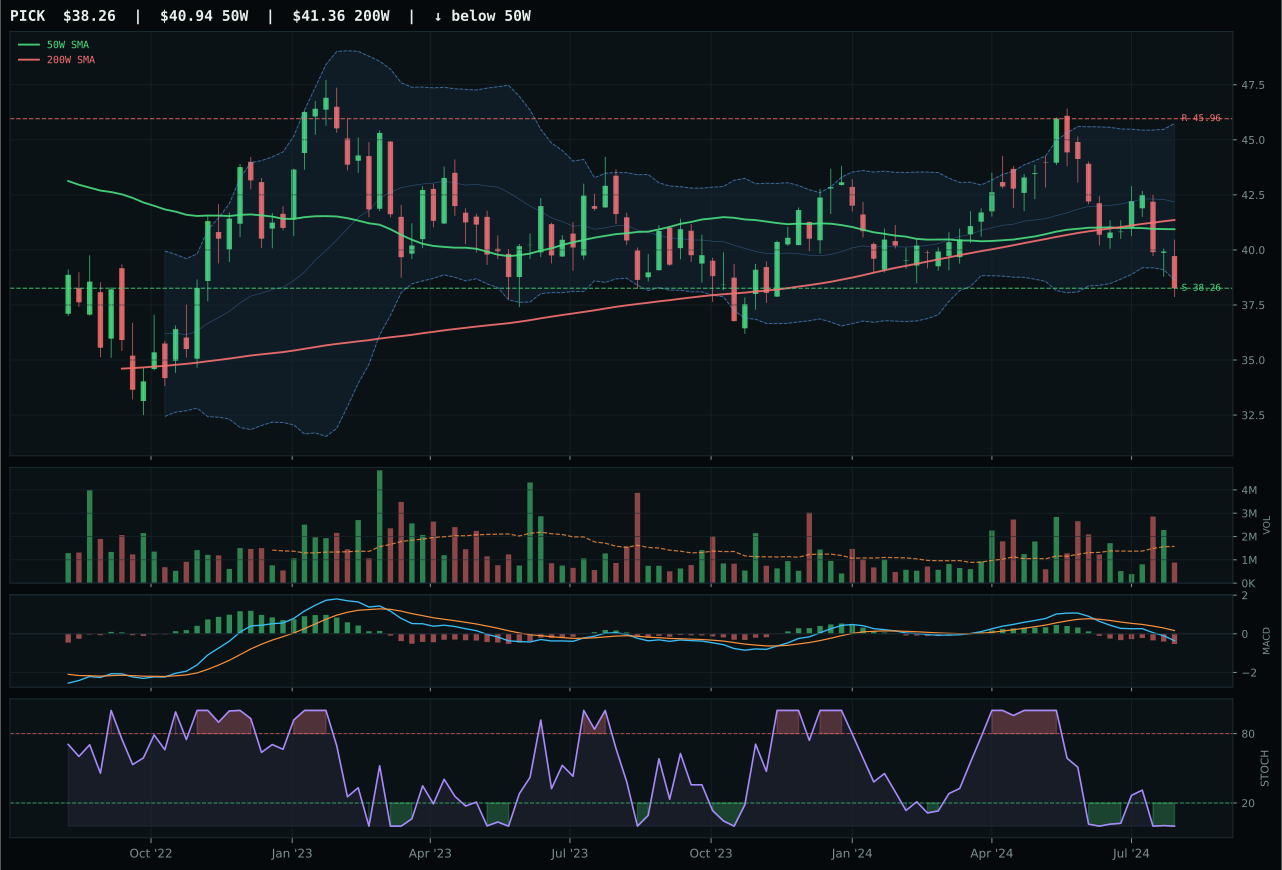
PICK has a pullback into support profile with -16.3% 13-week relative strength versus SPY.
Extension and support failure are the main tactical risks.
Tracked, but not top-2 eligible because: structurally broken.
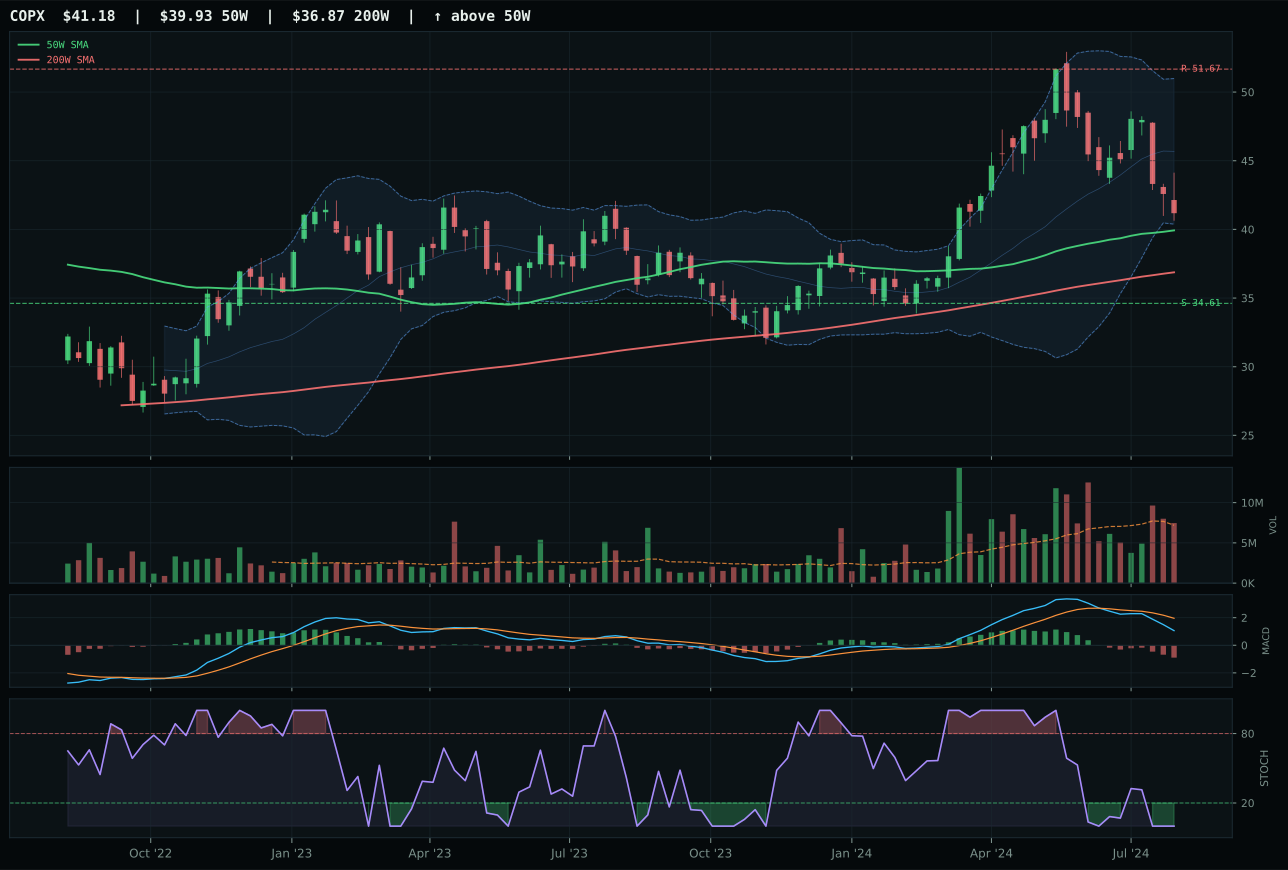
COPX has a neutral structure profile with -15.9% 13-week relative strength versus SPY.
A failed hold above support would weaken the setup.
Actionable but governed by invalidation levels.
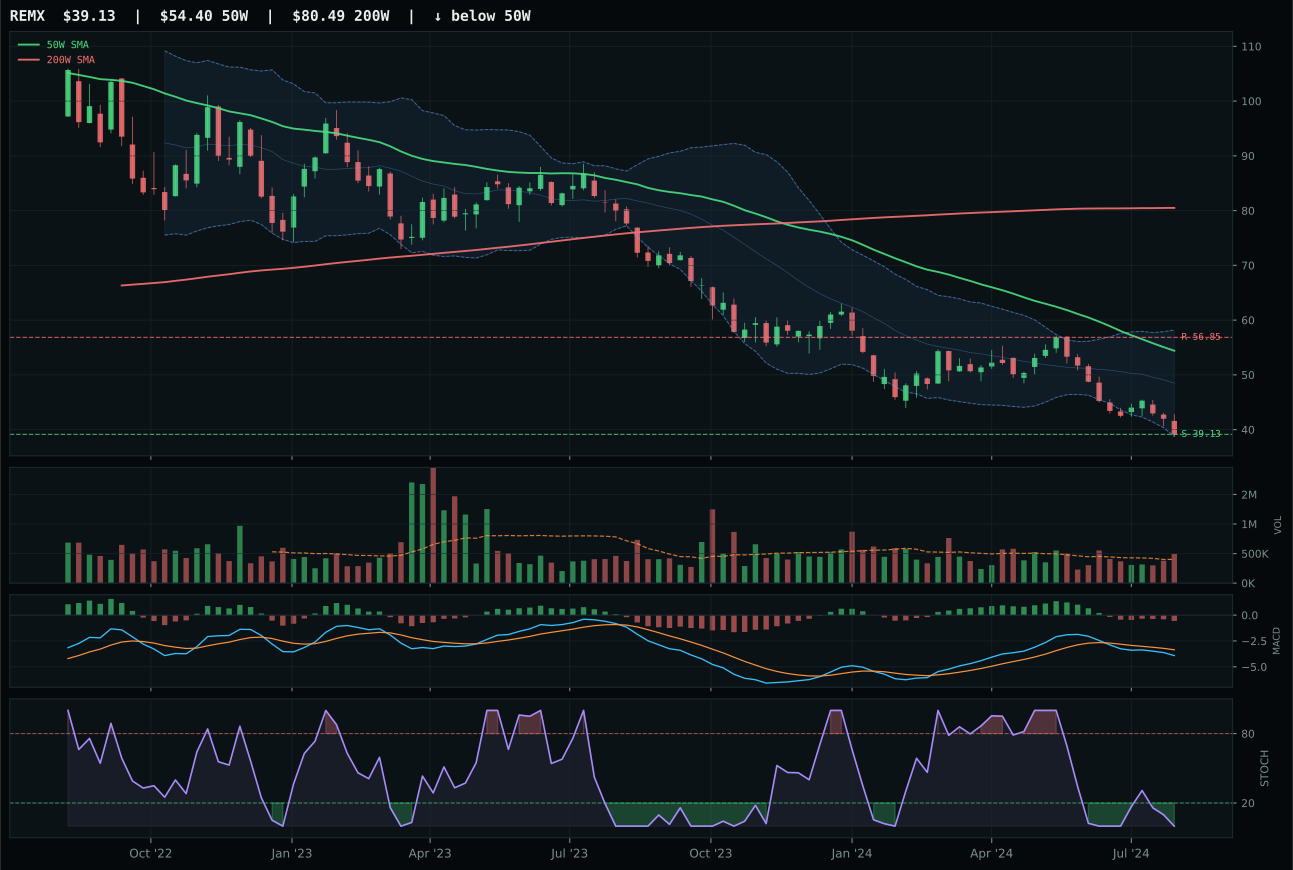
REMX has a pullback into support profile with -30.5% 13-week relative strength versus SPY.
Extension and support failure are the main tactical risks.
Tracked, but not top-2 eligible because: structurally broken.
COPX wins Industrial Metals narrowly, but the margin is so thin it amounts to a category rejection. Copper trades 3.1% above its 50-week moving average with a timing score of 92.0 that reflects optimal distance to trend and oversold stochastic placement—the only real technical merit in the category. PICK loses because structure is weaker (38.9 versus 60.2), timing is softer (80.0 versus 92.0), and the hard-filter rejection for structural deterioration disqualifies it entirely. COPX's strength relative to PICK is real but not meaningful: both charts show -15% or worse SPY relative weakness, both carry zero momentum confirmation, and the 3/2/1 basket (COPX 33.5, PICK 24.7, REMX 9.6) is so weak that category-level testing pushes the final score to 0.6. COPX's 72.2 risk-reward looks appealing on paper (20.3% upside to resistance, only 19.0% downside), but that asymmetry exists precisely because the chart is broken and prices will go lower if buyers fail to defend.
Industrial Metals earns zero allocation with a final score of 0.6, ranking among the lowest categories as the macro regime actively punishes commodity-linked cyclical exposure. Liquidity stress at -8 and credit stress at -7 create a macro headwind of -15 points that the category's 35.0 macro fit score cannot overcome, especially when COPX itself shows zero momentum confirmation and carries -15.9% relative weakness against SPY. The category ranks 9th or 10th, with the primary disqualifier being that industrial metals require risk appetite and credit availability to sustain industrial demand; in a regime where both are constrained, copper scarcity and mining breadth become liability positions rather than hedges. Even though timing is perfectly positioned for a reversal (92.0), the absence of any volume-price or momentum confirmation means the market is not yet convinced that the bottom is in. The allocation remains zero because the macro prerequisites for a copper or mining rebound—looser credit, better risk appetite, or China demand inflection—are not yet active in the descriptor checklist.