
2024-07-26
Informational purposes only. The content in this report, including allocations, analysis, and commentary, is provided solely for informational and educational purposes. It does not constitute financial advice, investment advice, trading advice, or any other type of advice. Past performance does not guarantee future results. Always conduct your own research and consult a qualified financial professional before making investment decisions.
Weekly Allocation
| Ticker | Category | Weight | Role |
|---|---|---|---|
| FBTC | 50% | Overlay | |
| PAVE | Utilities & Infrastructure | 10% | Top-2 (10%) |
| GLD | Precious Metals | 10% | Top-2 (10%) |
| ITA | Defense & Aerospace | 5% | Tier-2 (5%) |
| CIBR | Technology | 5% | Tier-2 (5%) |
| BOTZ | AI | 5% | Tier-2 (5%) |
| NLR | Nuclear Energy | 5% | Tier-2 (5%) |
| COPX | Industrial Metals | 5% | Tier-2 (5%) |
| INDA | Emerging Markets | 5% | Tier-2 (5%) |
Trade Instructions — Monday Open
Sell the tranche from 2024-06-28 (completing its 4-week hold). Buy the new tranche. Instructions show net portfolio changes — same-asset positions cancel, weight changes show the delta.
| Action | Ticker | Instruction |
|---|---|---|
| SELL | IGV | Sell 25% of IGV position (reduce 10.00% → 7.50%) |
| SELL | SMH | Sell entire SMH position (2.50% of portfolio) |
| SELL | XLU | Sell entire XLU position (1.25% of portfolio) |
| BUY | GLD | Buy GLD — 20.00% of freed cash (adds 1.25% to portfolio) |
| BUY | BOTZ | Buy BOTZ — 20.00% of freed cash (adds 1.25% to portfolio) |
| BUY | PAVE | Buy PAVE — 40.00% of freed cash (adds 2.50% to portfolio) |
| BUY | CIBR | Buy CIBR — 20.00% of freed cash (adds 1.25% to portfolio) |
Current Portfolio After Trade
Combined holdings across all 4 active tranches. Each tranche is 25% of the portfolio.
| Ticker | % of Portfolio | Weight Bar |
|---|---|---|
| FBTC | 50.00% | |
| IGV | 7.50% | |
| GLD | 5.00% | |
| INDA | 5.00% | |
| COPX | 5.00% | |
| AIQ | 5.00% | |
| NLR | 3.75% | |
| IGF | 3.75% | |
| XAR | 3.75% | |
| BOTZ | 3.75% | |
| PAVE | 2.50% | |
| SLV | 1.25% | |
| URA | 1.25% | |
| ITA | 1.25% | |
| CIBR | 1.25% |
Macro Regime — Disinflation
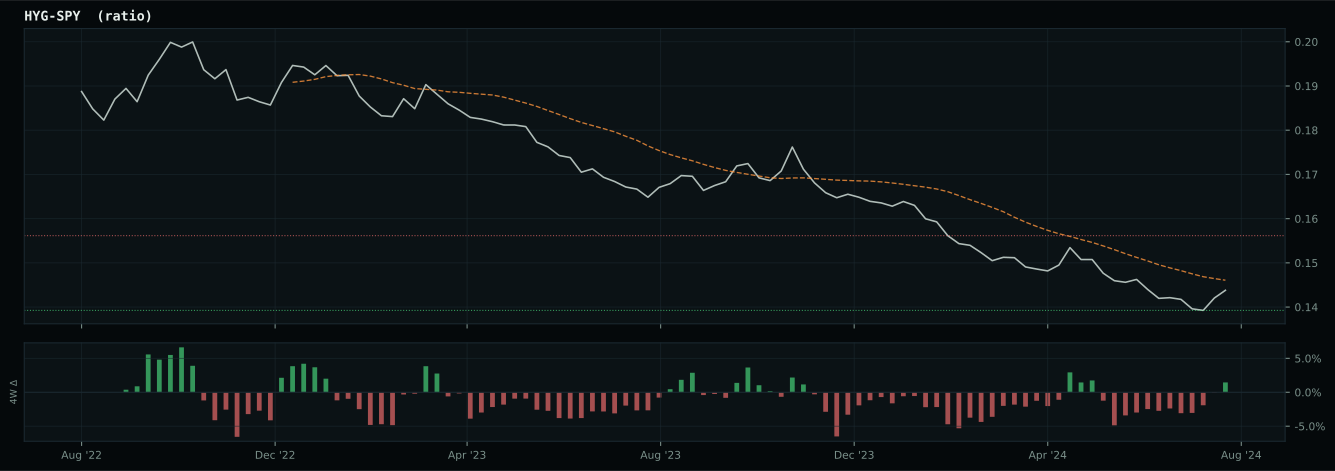
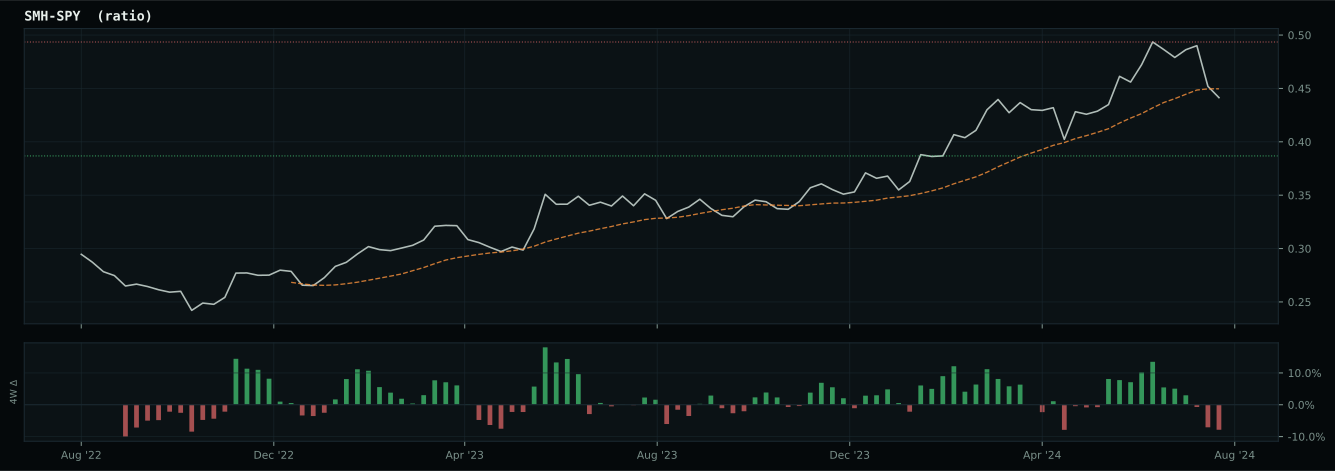
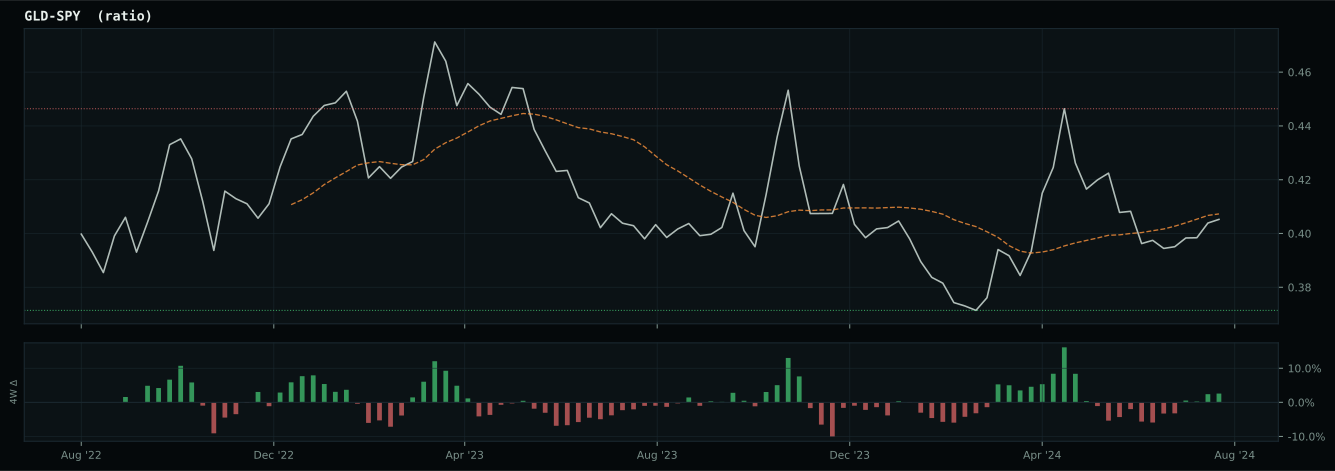
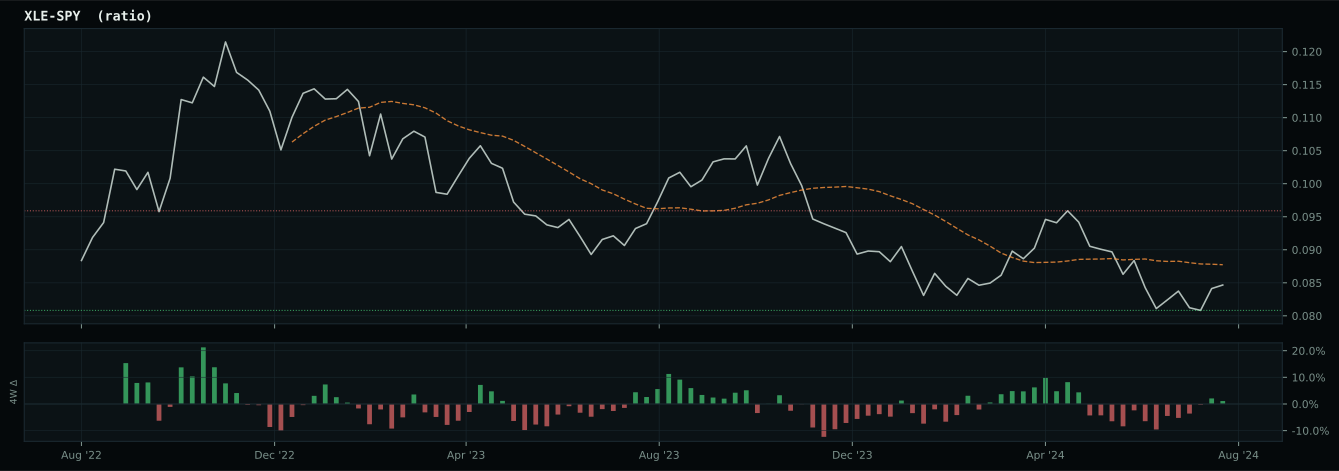
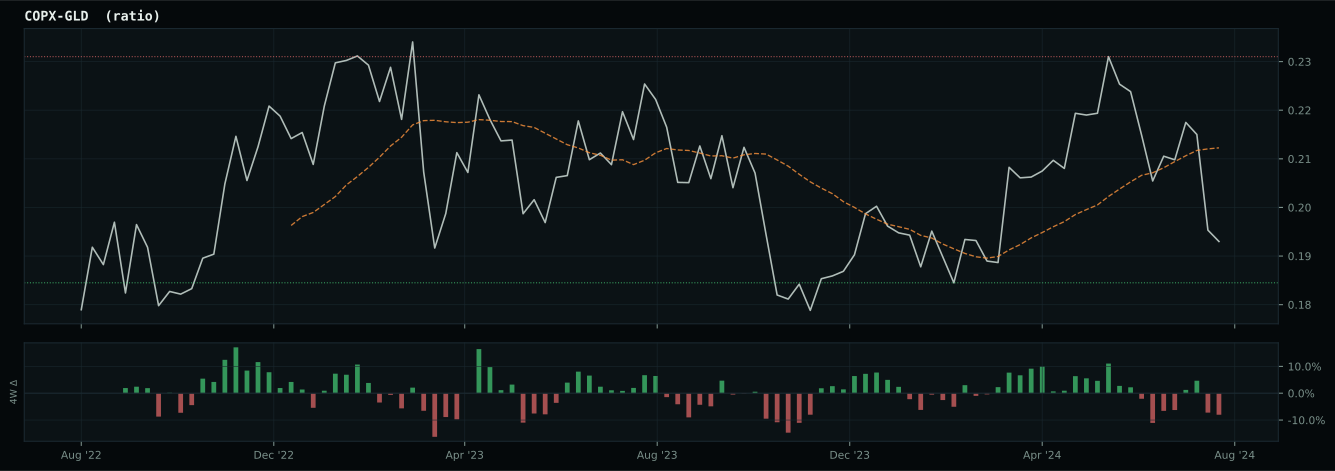
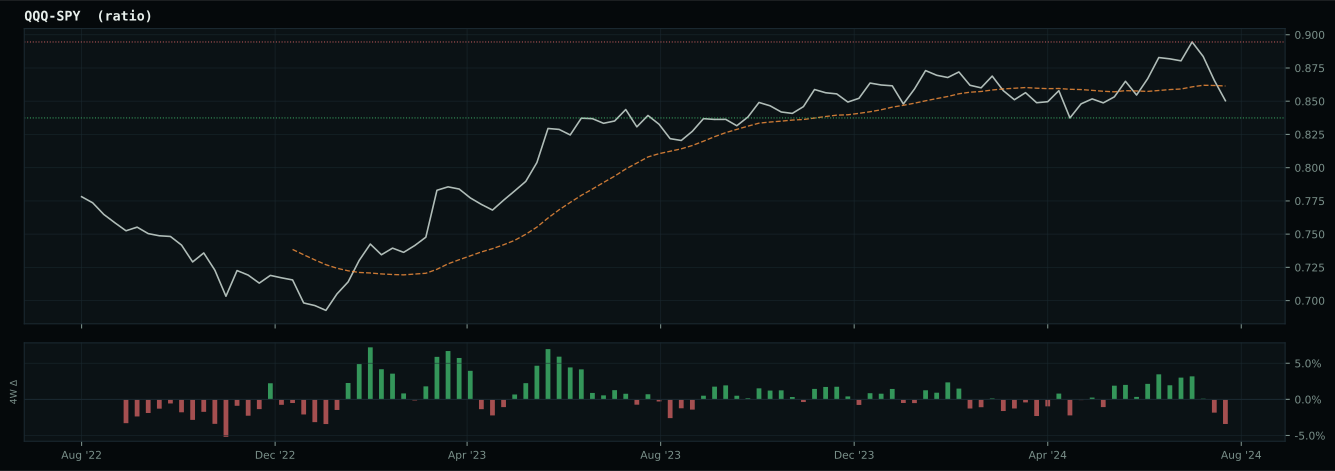
Macro Evidence Charts
Market-implied signals behind the macro regime scores. Each ratio compares two assets; the direction and slope of the ratio is what the macro engine reads.
Crypto Regime — TrendBTC
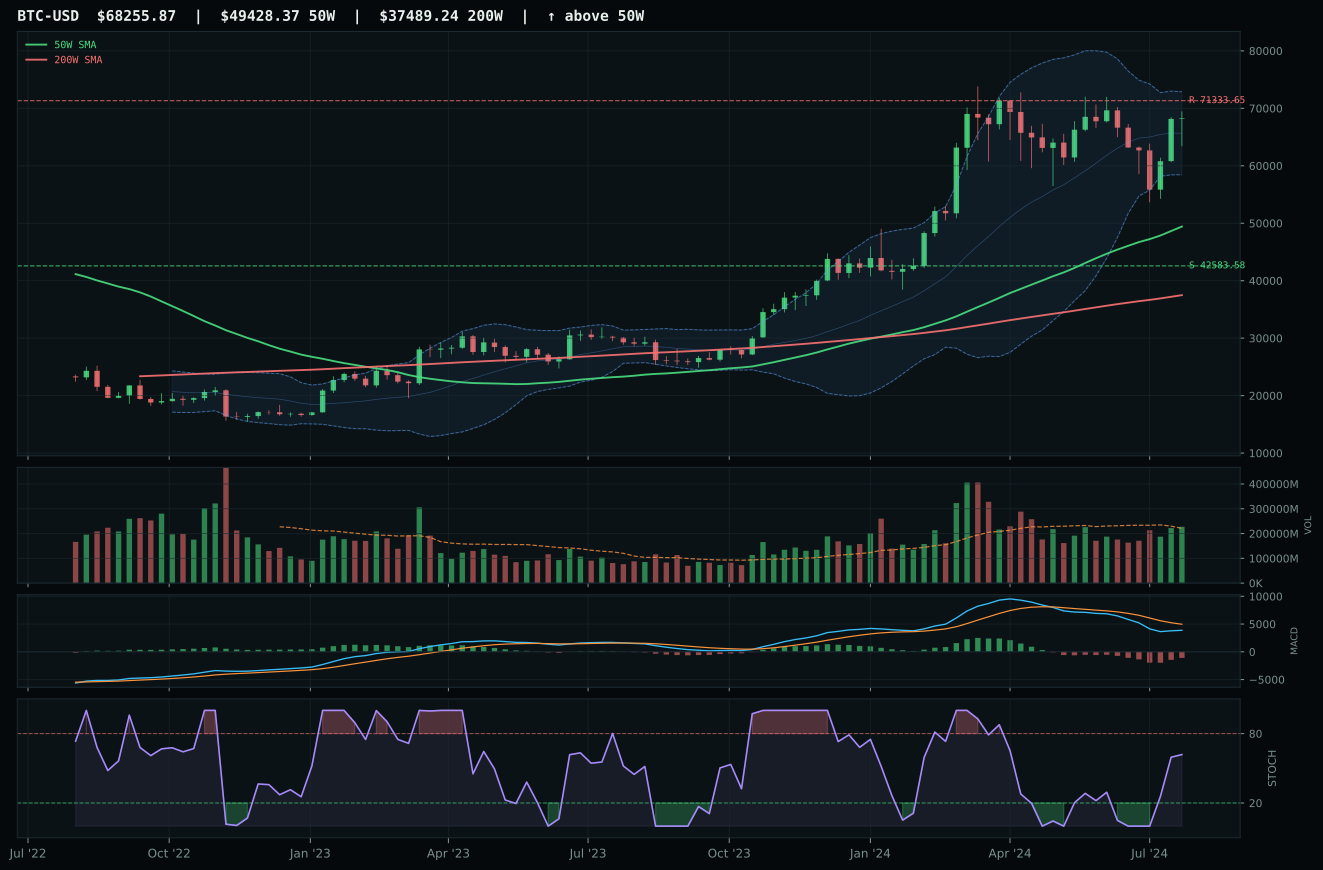
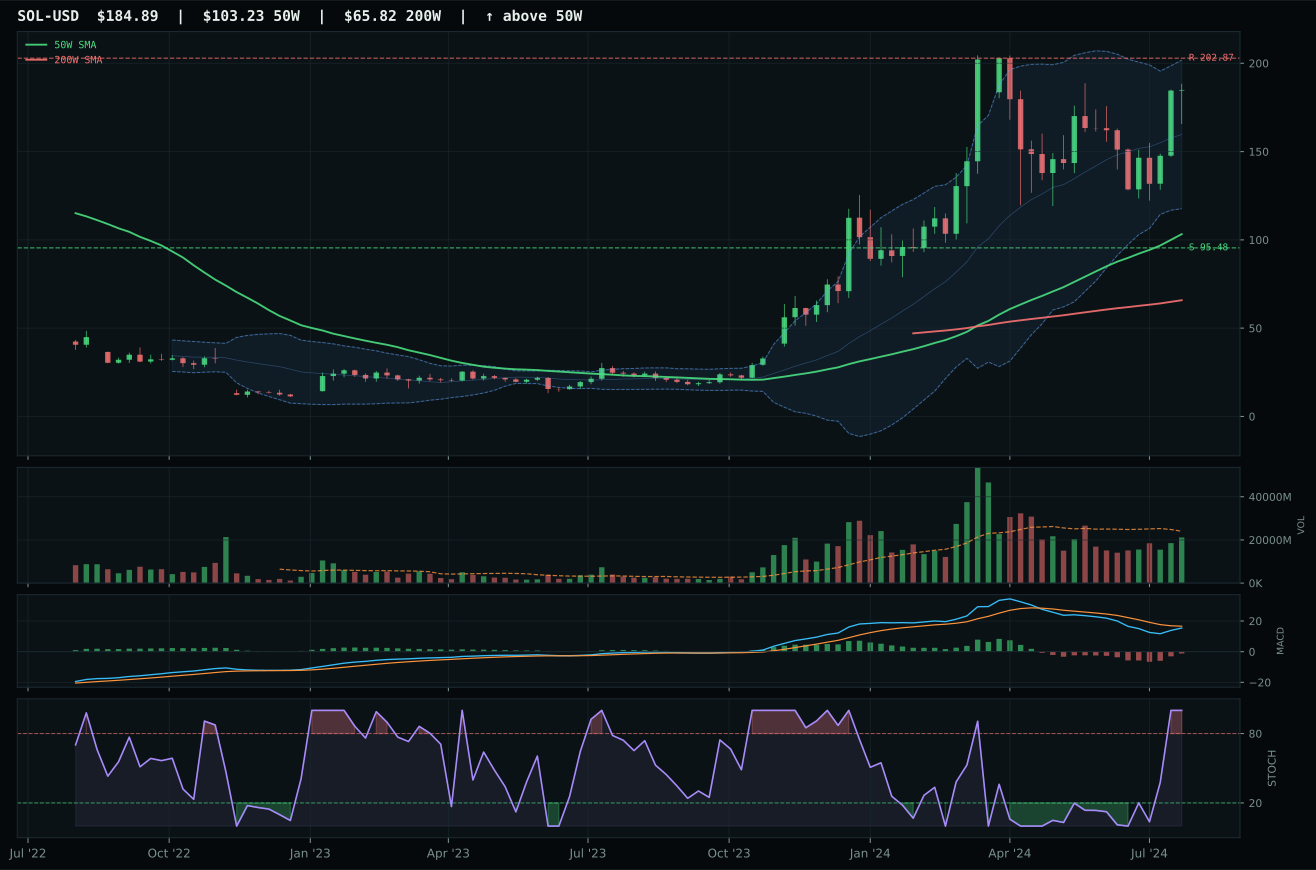
ValueBTC not armed: BTC has not made the first post-breakdown touch of the 200W buy zone after losing the 50W
TrendBTC confirmed: 2 consecutive closes above rising/flat 50W SMA
one or more available conditions failed
Category Rankings
| Rank | Category | Winner | Score | Alloc | 4W Ret | Peers (4W) |
|---|---|---|---|---|---|---|
| 1 | Utilities & Infrastructure | PAVE | 65.2 | 20% | +0.00% | XLU +5.9% · IGF +4.9% |
| 2 | Precious Metals | GLD | 58.7 | 20% | +5.51% | GDX +8.1% · SLV +7.3% |
| 3 | Defense & Aerospace | ITA | 56.5 | 10% | +2.57% | XAR +3.0% · ROKT +0.7% |
| 4 | Technology | CIBR | 52.8 | 10% | +6.50% | IGV +1.3% · XLK +2.6% |
| 5 | AI | BOTZ | 45.4 | 10% | +4.13% | AIQ +2.1% · SMH +2.1% |
| 6 | Nuclear Energy | NLR | 38.3 | 10% | +0.30% | URA -1.0% · URNM -2.7% |
| 7 | Industrial Metals | COPX | 30.4 | 10% | +5.13% | REMX -2.0% · PICK +0.6% |
| 8 | Emerging Markets | INDA | 14.4 | 10% | +0.70% | IEMG +2.8% · ILF +5.4% |
| 9 | Traditional Energy | XOP | 11.6 | 0% | -2.90% | XLE -0.9% · FCG -1.9% |
| 10 | Agriculture & Livestock | MOO | 6.8 | 0% | +0.98% | VEGI +0.1% · WEAT -2.9% |
Utilities & Infrastructure — PAVE
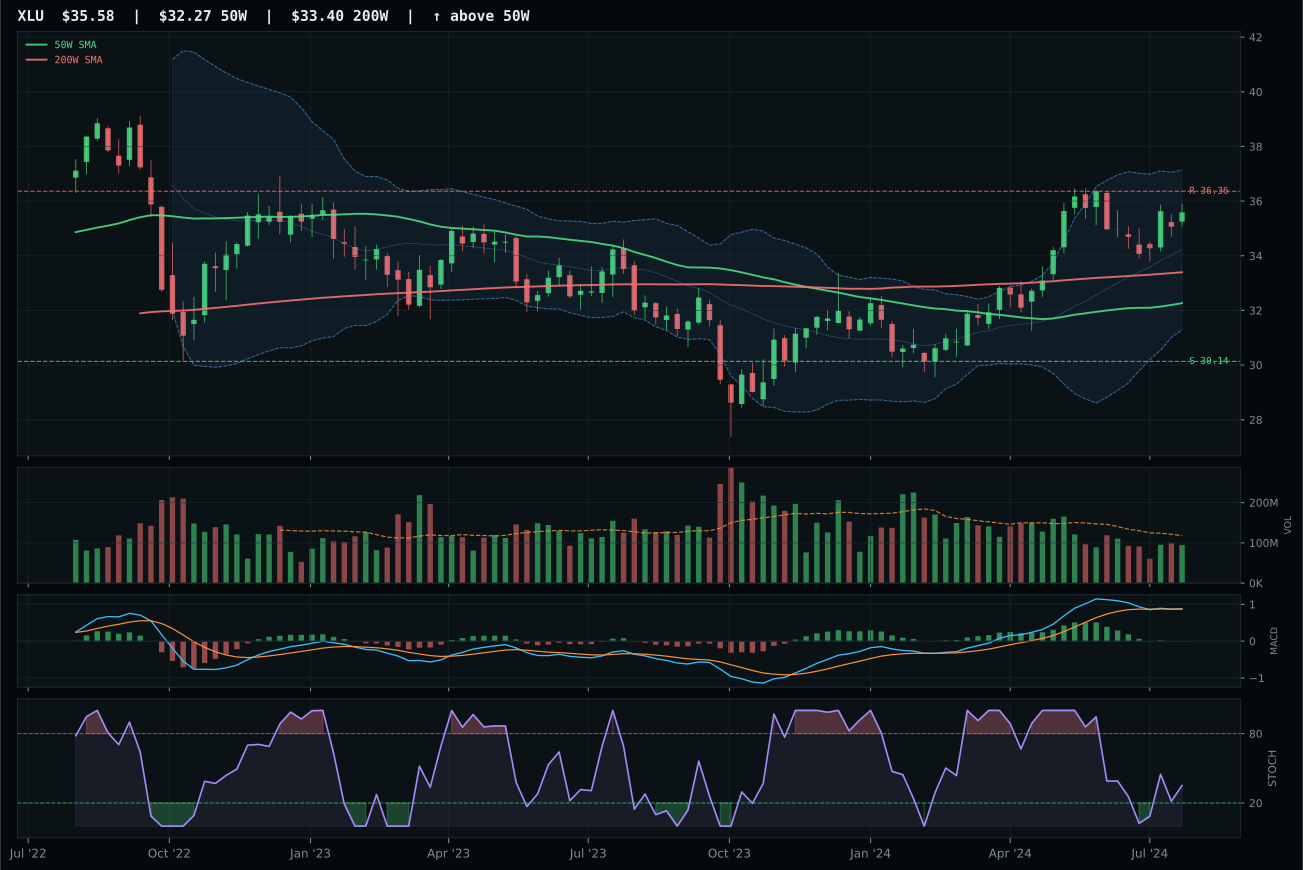
XLU has a neutral structure profile with 0.4% 13-week relative strength versus SPY.
A failed hold above support would weaken the setup.
Actionable but governed by invalidation levels.
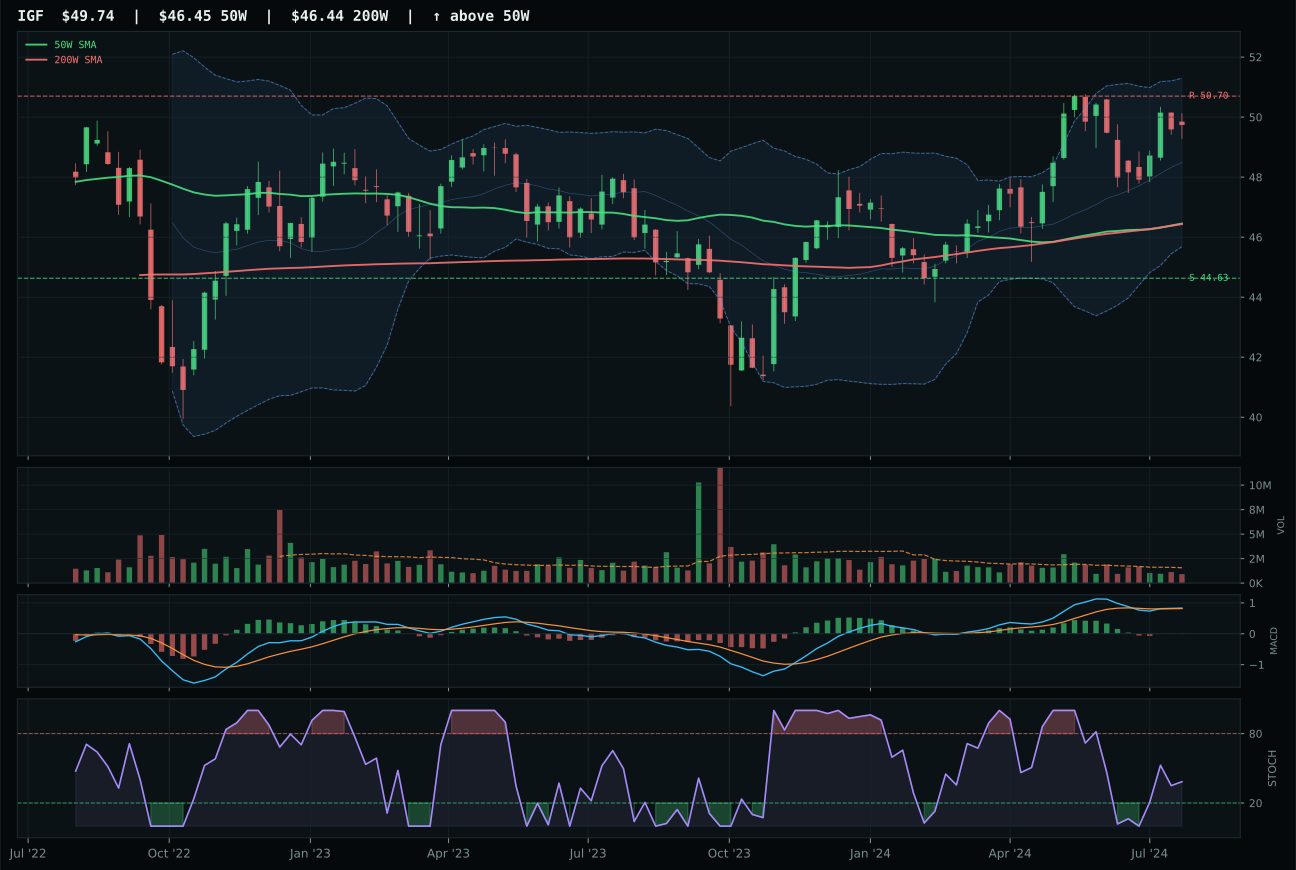
IGF has a neutral structure profile with -2.4% 13-week relative strength versus SPY.
A failed hold above support would weaken the setup.
Actionable but governed by invalidation levels.
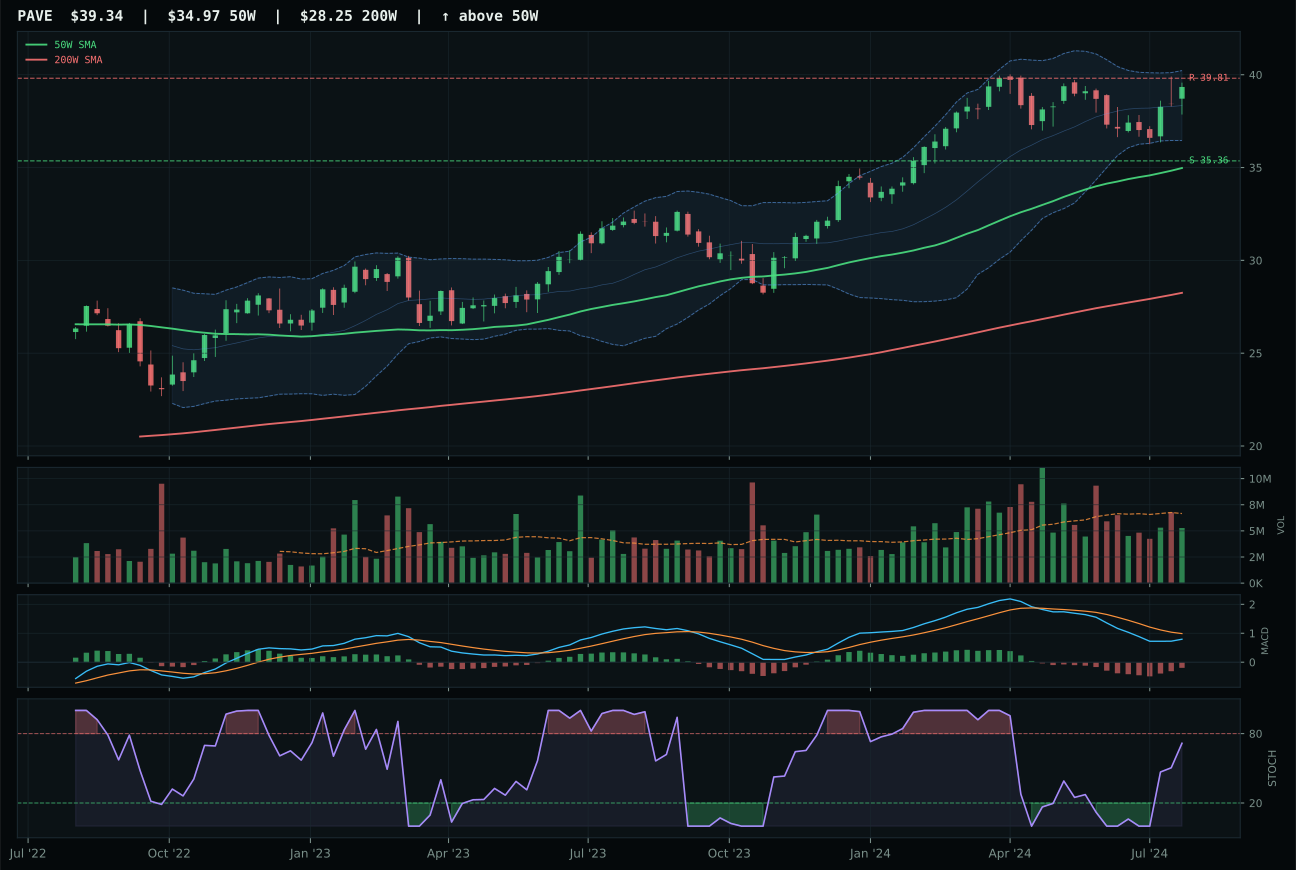
PAVE has a neutral structure profile with -3.9% 13-week relative strength versus SPY.
A failed hold above support would weaken the setup.
Actionable but governed by invalidation levels.
PAVE wins the category and earns top-2 allocation on superior timing mechanics (75.0 versus XLU's 70.0) and cleaner structure (72.3 versus IGF's structure score), despite ranking third in the reasoned 3/2/1 proof order behind IGF (72.3 technical) and XLU (70.6 technical). Price sits 12.5% above the 50W with 87.1 trend score and 50W slope +0.4%, placing it in near-52W-high territory with stochastic RSI rising mid-zone at 0.72 and MACD bearish but improving—oscillators are setting up for potential continuation rather than exhaustion, giving PAVE timing edge. XLU carries bullish MACD but it is flattening, which suggests momentum may be decelerating, while IGF's bullish/improving MACD is stronger but thin participation at the volume level creates conviction question. PAVE's neutral volume at 0.79x average is actually superior to IGF's thin participation, because neutral confirmation is cleaner proof than thin participation; buyers are not aggressive, but they are present and consistent. The 57.1 momentum confirmation score reflects 3.2% 13W return and 6.3% 4W return, which is steady but not explosive—this is accumulation, not chase.
Utilities & Infrastructure earns 10% top-2 allocation based on a 65.2 final category score and 64.0 macro fit that is driven by disinflation tailwind (+7) and disinflation pressure descriptor (+6), matching Precious Metals' macro sponsorship. The transition/mixed regime also provides +4 basis points of support, recognizing that infrastructure and utilities perform well in lower-growth, lower-volatility environments. PAVE's 62.2 reasoned technical evidence is third in the 3/2/1 basket, yet it emerges as category representative after filtering for leadership, volume-price sponsorship, and timing mechanics—the allocator respects the 75.0 timing score and 59.9 volume-price confirmation that IGF and XLU cannot match. The category ranks as the co-equal top-2 allocation alongside Precious Metals because both carry identical 64.0 macro fit and both benefit from disinflation regime sponsorship. PAVE's 38.9 risk-reward is compressed because price is 12.5% extended, but this is acceptable in a category where the macro narrative is structural rather than tactical; the allocation is positioned for sustained disinflation duration rather than short-term mean reversion. This dual top-2 allocation to Precious Metals and Utilities creates a defensive barbell skewed toward safe-yield and capital-preservation narratives in the current macro regime.
Precious Metals — GLD
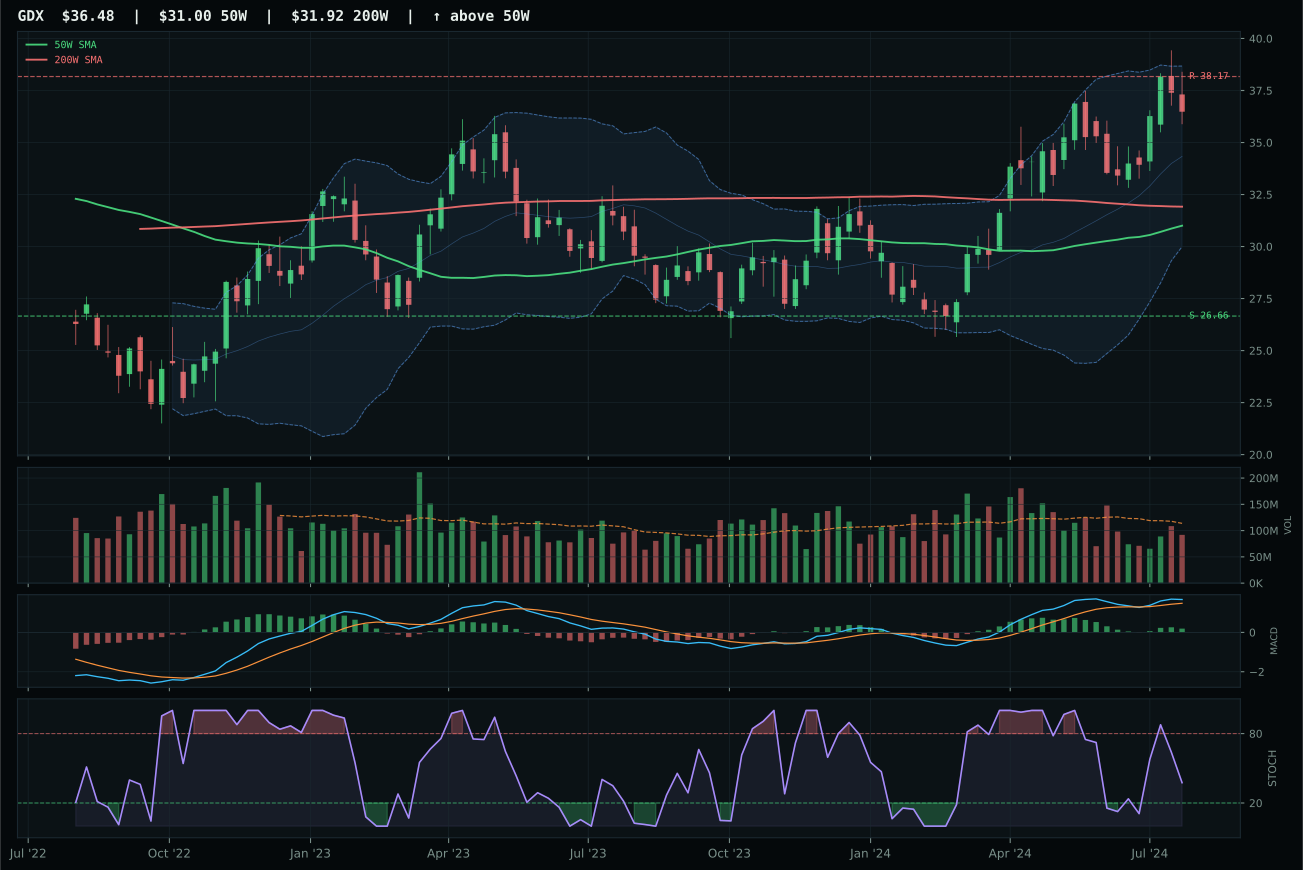
GDX has a vertical extension profile with -1.6% 13-week relative strength versus SPY.
A failed hold above support would weaken the setup.
Actionable but governed by invalidation levels.
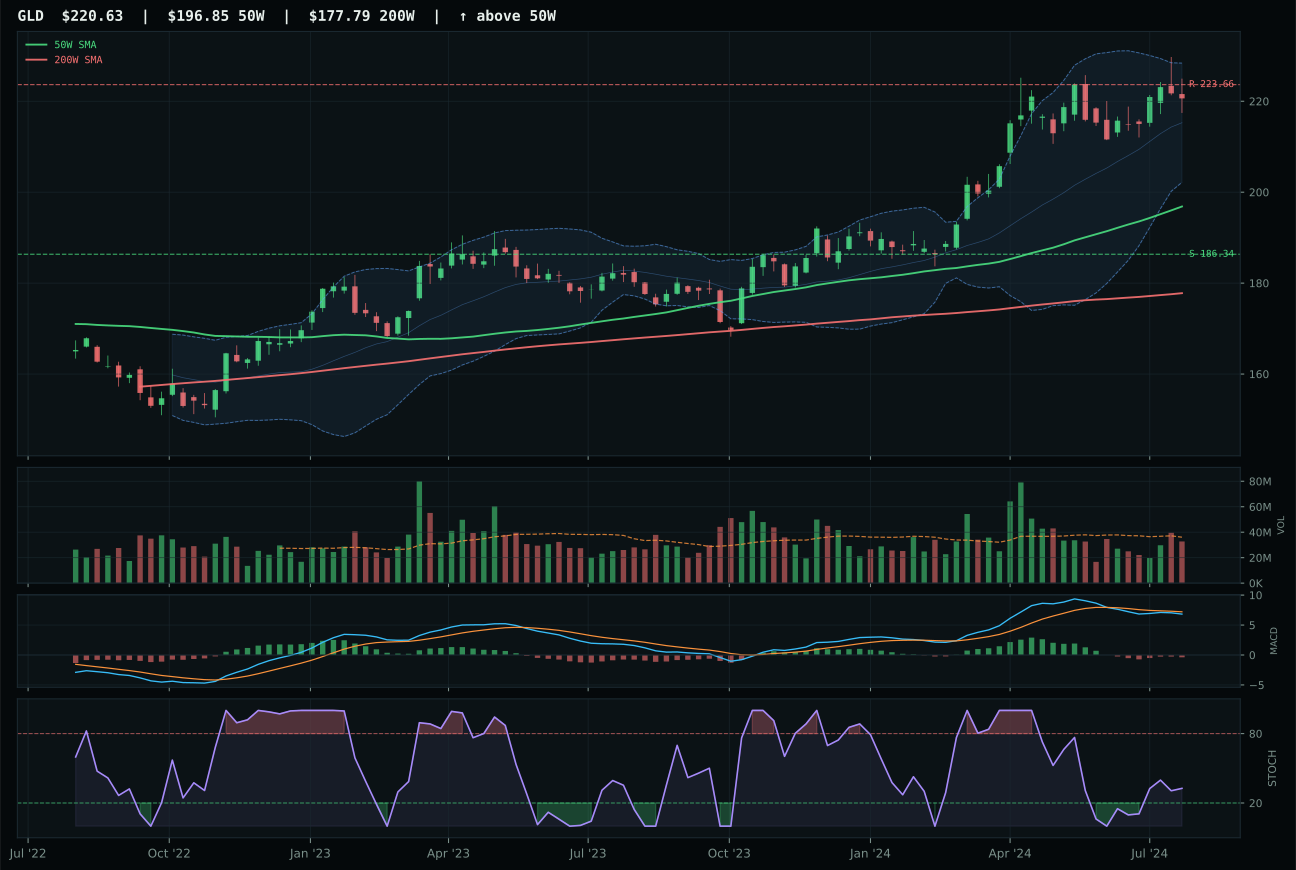
GLD has a neutral structure profile with -5.3% 13-week relative strength versus SPY.
A failed hold above support would weaken the setup.
Actionable but governed by invalidation levels.
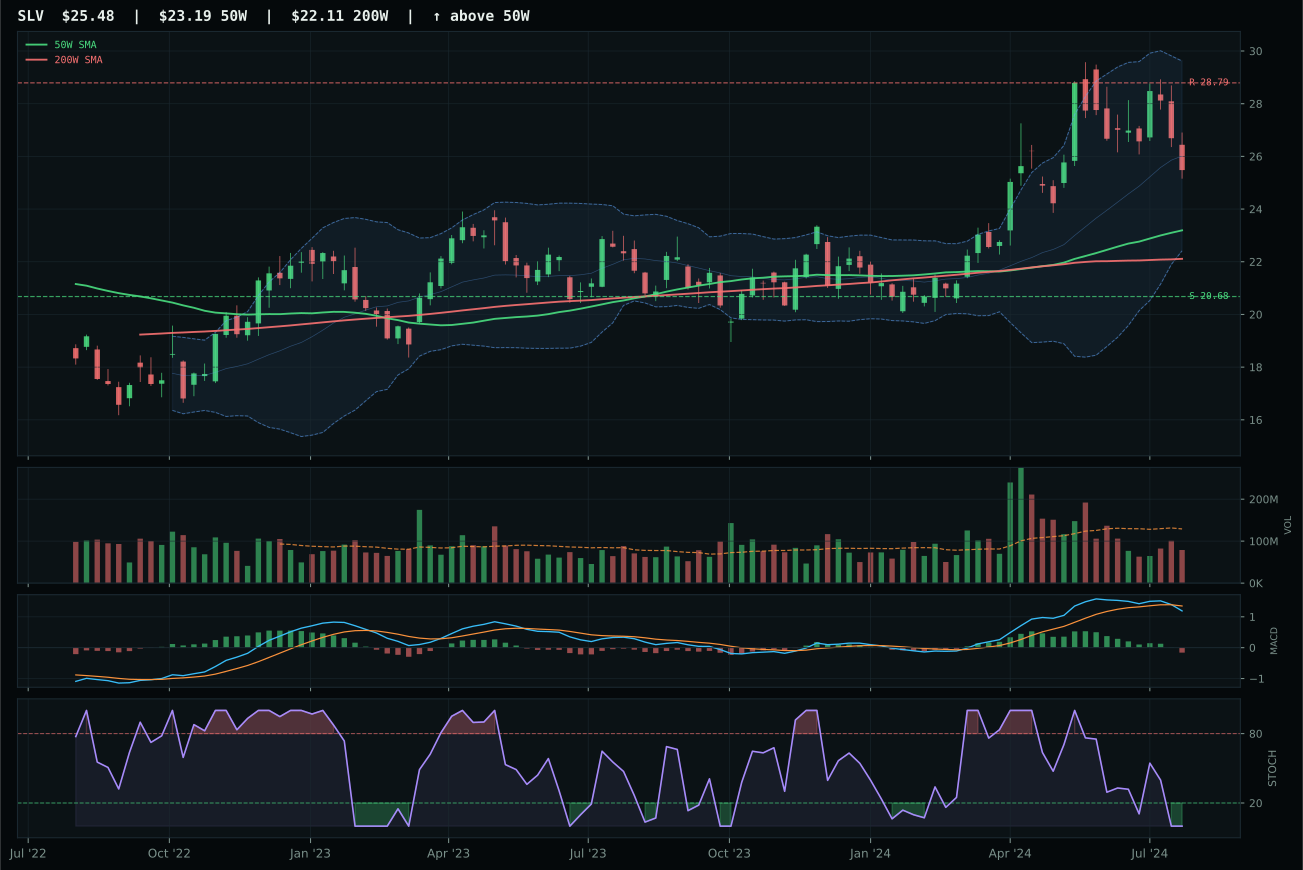
SLV has a neutral structure profile with -4.7% 13-week relative strength versus SPY.
A failed hold above support would weaken the setup.
Actionable but governed by invalidation levels.
GLD captures top-2 honors on the strength of a 65.0 technical evidence score and superior timing mechanics relative to GDX, translating to a 58.7 final category score that ranks second among all categories. Price sits 12.1% above the 50W with trend 85.1 and 50W slope +0.4%, placing the entry in extended-but-not-vertical territory, and critically, the stochastic RSI is rising mid-zone at 0.33 while MACD is bearish but improving—this is the classic coil setup where oscillators are setting up for the next leg rather than rolling over. GLD's 72.7 structure score is cleaner than GDX's 69.1, and the 83.0 timing score demolishes GDX's weaker 53.0 because GLD's oscillator behavior suggests continuation rather than exhaustion. GDX is stretched 17.7% from the 50W versus GLD's 12.1%, placing GDX at extended-momentum risk; GDX's stochastic RSI is falling/neutral, which is a divergence against rising price. The 18.4% downside-to-support buffer in GLD versus GDX's narrower margin creates asymmetric risk posture in GLD's favor.
Precious Metals earns 10% top-2 allocation based on a 58.7 final category score and 64.0 macro fit that is decisively sponsored by disinflation (+8) and disinflation pressure (+6). In a disinflation regime, gold functions as a monetary and fiscal-stress hedge; the category-level macro fit of 64.0 is the highest among all categories except Utilities & Infrastructure at 64.0 and GLD itself. GLD's 63.9 reasoned technical evidence ranks it first in the 3/2/1 basket ahead of GDX (61.5) and SLV (43.9), ensuring category leadership. The allocation sits at exactly 10% because the disinflation macro state and active pressure descriptors align perfectly with safe-haven asset demand, yet the technical setup is not explosive—GLD is 12.1% extended from the 50W, which is meaningful stretch but not a breakout that demands a heavier overweight. This is a core defensive allocation in a lower-growth, lower-inflation regime where real yields have compressed and central banks remain accommodative; it earns top-2 status over technology and AI because macro sponsorship is cleaner and the timing setup (rising oscillators into improved MACD) suggests continuation rather than completion.
Defense & Aerospace — ITA
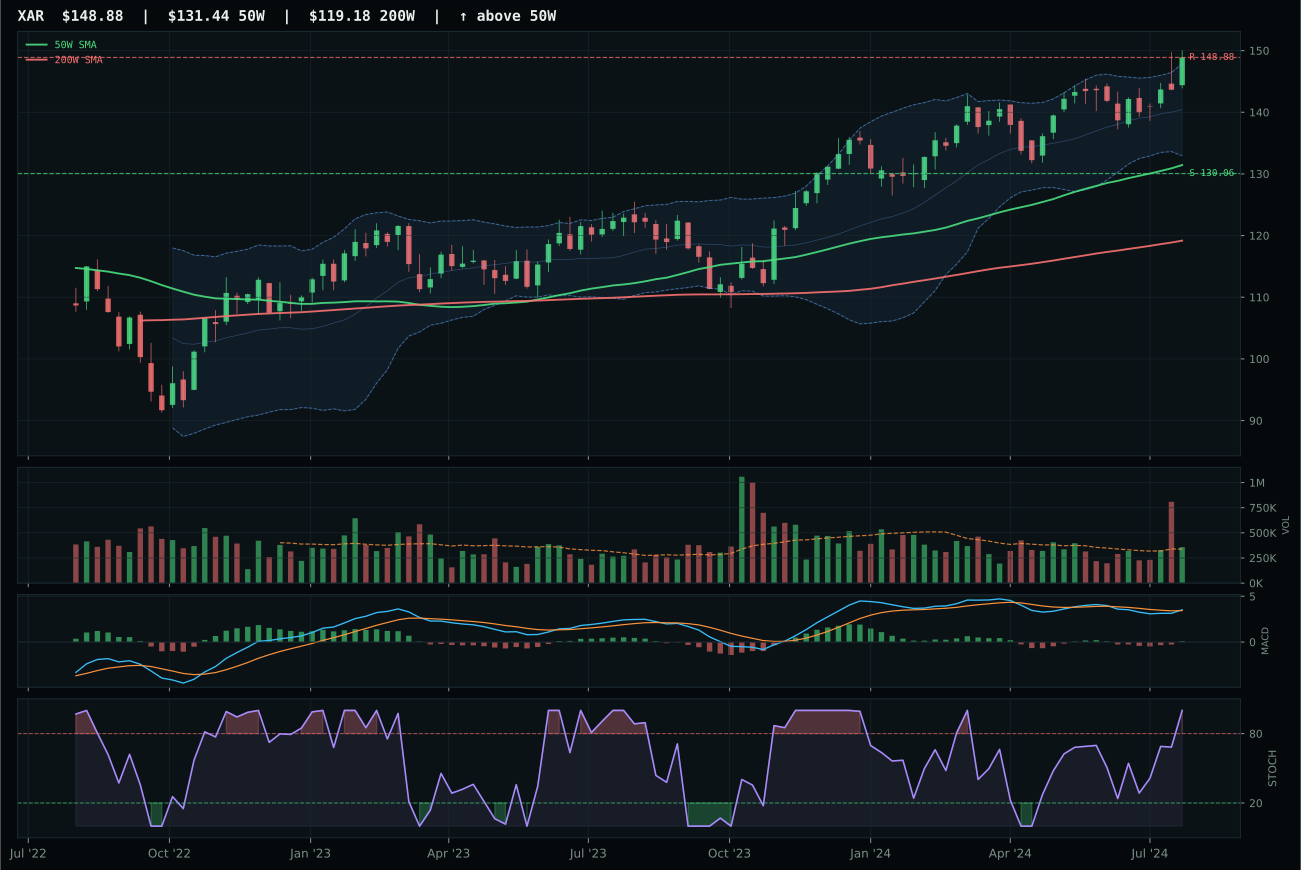
XAR has a neutral structure profile with 2.3% 13-week relative strength versus SPY.
A failed hold above support would weaken the setup.
Actionable but governed by invalidation levels.
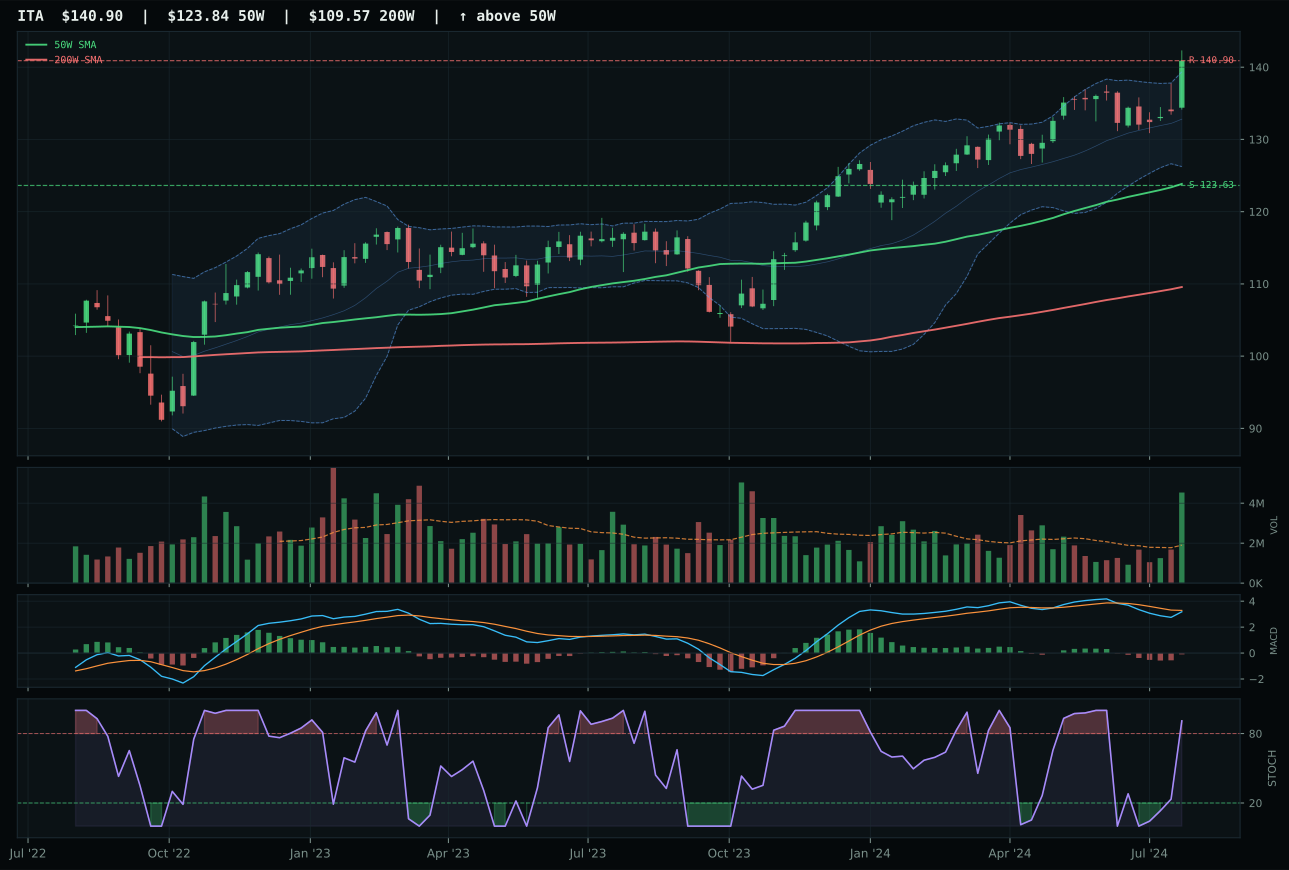
ITA has a neutral structure profile with 1.7% 13-week relative strength versus SPY.
A failed hold above support would weaken the setup.
Actionable but governed by invalidation levels.
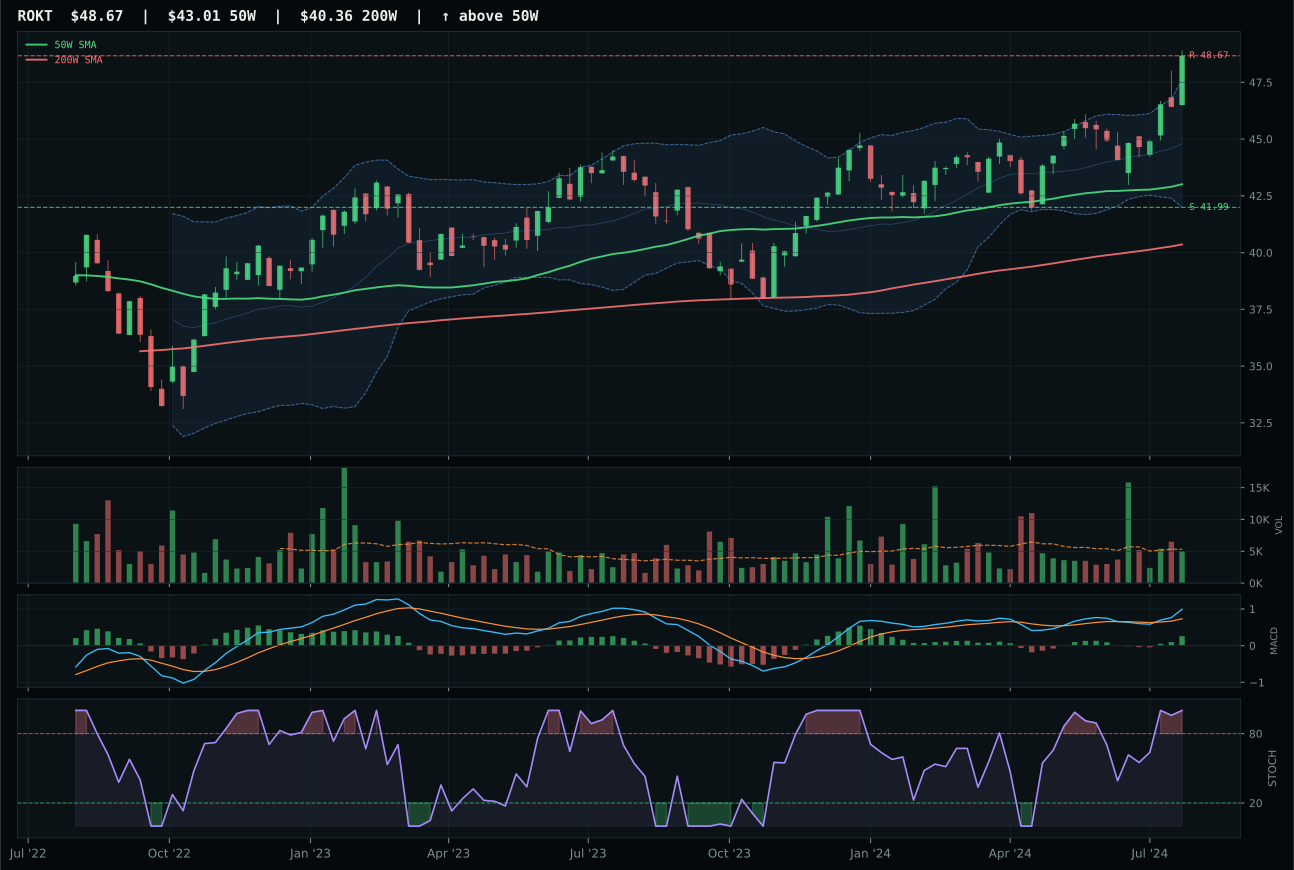
ROKT has a neutral structure profile with 3.9% 13-week relative strength versus SPY.
A failed hold above support would weaken the setup.
Tracked, but not top-2 eligible because: .
ITA wins on exceptional volume-price confirmation (85.0) and persistence (73.9) despite a razor-thin 0.2-point margin over runner-up XAR—the difference is earned through accumulation mechanics rather than momentum excess. Price sits 13.8% above the 50W at 95.5 trend score, and critically, volume participation is 2.39x the 20W average, which is the only accumulation signal in the entire category basket and the cleanest proof that institutional buyers are defending and building positions through the strength move. MACD is bearish but improving, and stochastic RSI is overbought at 0.91, yet the volume spike through resistance into 140.90 invalidates bear-case concerns about momentum exhaustion; this is breadth-confirmed buying, not retail chasing. XAR is technically sound with 79.0 composite and superior MACD (bullish and improving), but neutral volume at the 20W average and 47.0 risk-reward score expose it as a chart that is rising on price momentum alone, without institutional sponsorship behind the move.
Defense & Aerospace holds 5% allocation at tier-2, earned through a 56.5 category score and strong technical proof despite minimal macro tailwind. The category's macro fit is only 51.0, compressed by liquidity stress (-4) and an absence of strong descriptors specific to defense-capex spending; credit stress actually turned positive (+2) because defense budgets are countercyclical to credit cycles. ITA's 84.4 technical evidence versus the category median demonstrates that the move is real, but the macro regime of disinflation provides only mixed support. The category ranks tier-2 because Precious Metals and Utilities & Infrastructure both scored higher on final category basis and carry stronger disinflation tailwinds. ITA's 81.9 momentum confirmation is the cleanest in its basket, and the volume-accumulation signature at 2.39x average gives institutional weight to the structure, justifying the allocation slot despite macro headwinds that would typically exclude a commodity-cyclical sector in disinflation.
Technology — CIBR
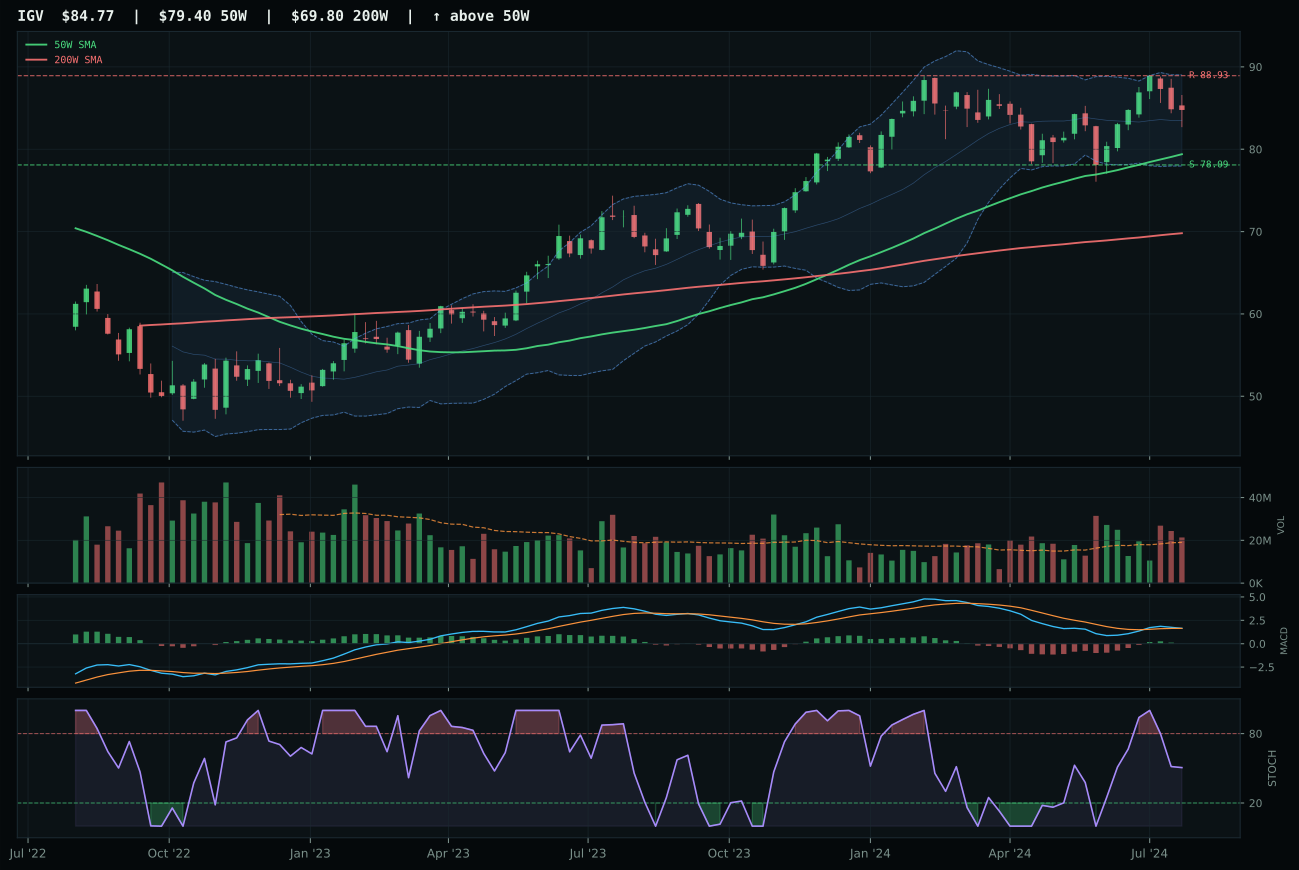
IGV has a neutral structure profile with -2.6% 13-week relative strength versus SPY.
A failed hold above support would weaken the setup.
Actionable but governed by invalidation levels.
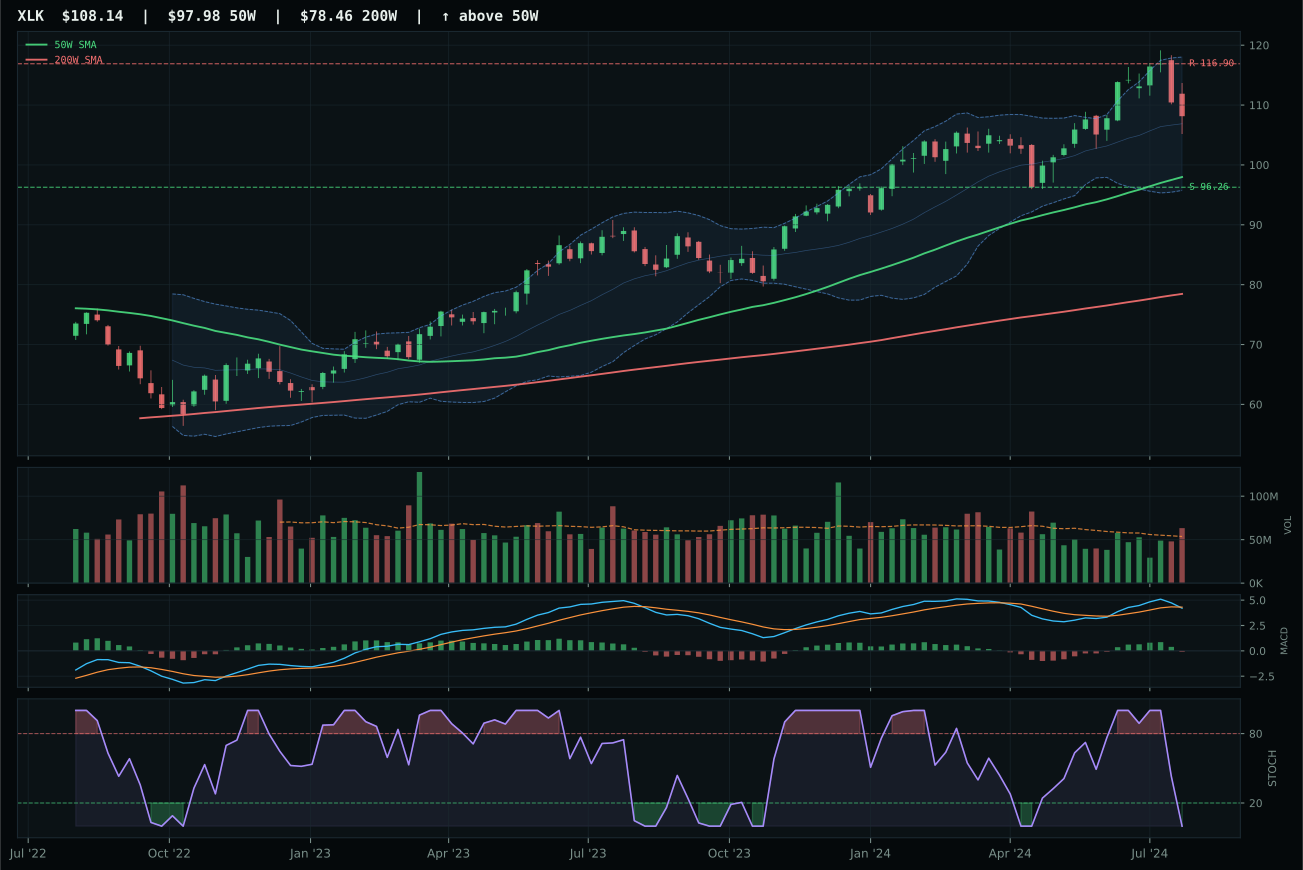
XLK has a neutral structure profile with 1.1% 13-week relative strength versus SPY.
A failed hold above support would weaken the setup.
Actionable but governed by invalidation levels.
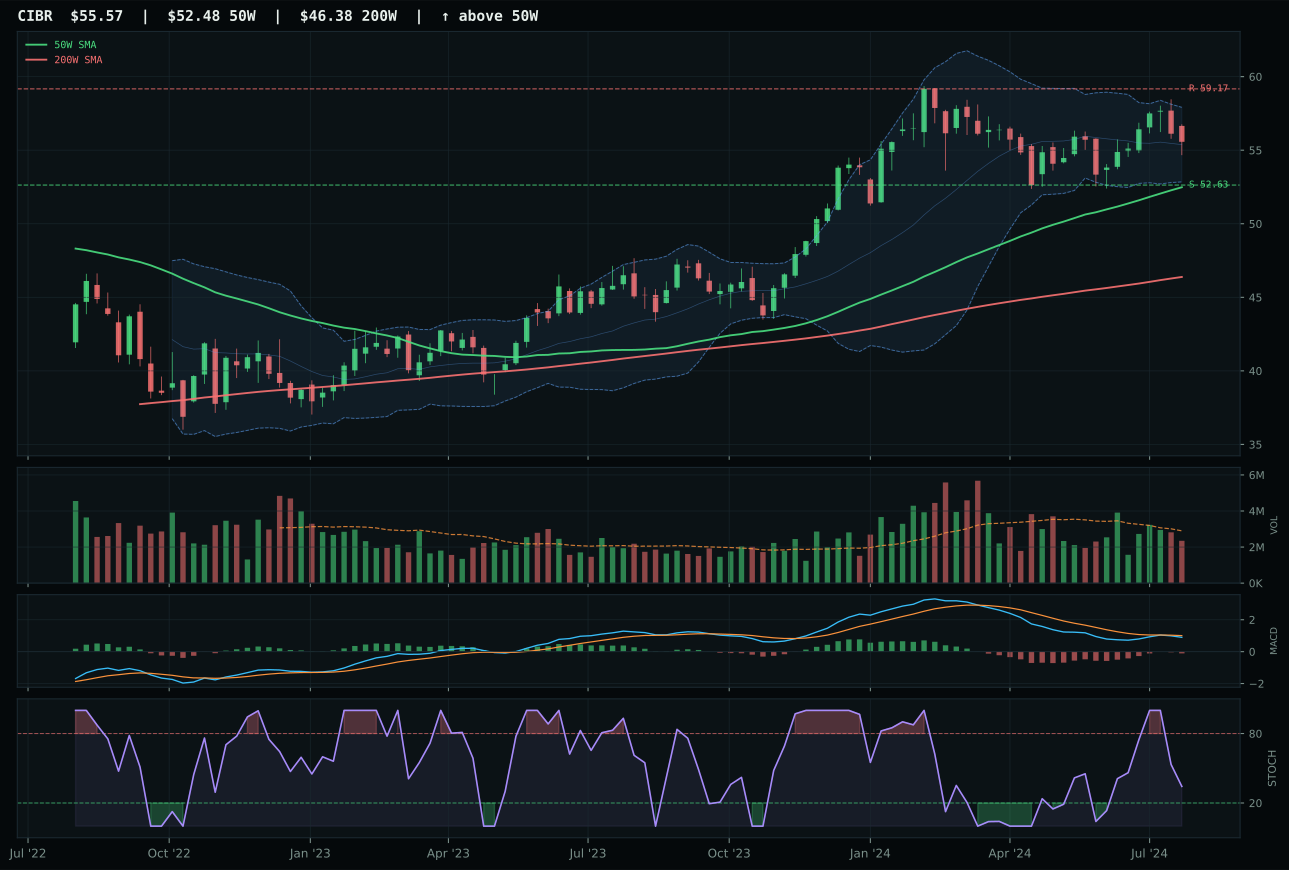
CIBR has a neutral structure profile with -5.8% 13-week relative strength versus SPY.
A failed hold above support would weaken the setup.
Actionable but governed by invalidation levels.
CIBR wins the category on cleaner risk-reward mechanics and superior relative strength persistence inside the cybersecurity subsector. Price sits 5.9% above the 50W with trend score 84.3 and a non-deteriorating 50W slope of 0.4%, but the critical edge comes from its 64.6 risk-reward score versus IGV's weaker 55.0—CIBR's 5.6% downside-to-support buffer against only 6.1% upside resistance cushion creates an asymmetric entry point that IGV cannot match. The setup is neutral structure with MACD bearish but improving and stochastic RSI falling into neutral territory at 0.34, meaning the oscillators are stabilizing rather than rolling over further. Volume participation at 0.81x the 20W average is neutral, so this is not accumulation, but it is not rejection either; the 1.3% 13W return and -3.2% category-relative strength confirm CIBR is a steadier expression of technology cyclicality without the duration sensitivity that dragged IGV's macro fit to 41.0 versus CIBR's 48.0.
Technology receives 5% allocation as a tier-2 category ranked below the two top-2 selections but above the excluded tier. The category's 52.8 final score reflects a technical environment heavily penalized by liquidity stress (-10 basis points) and credit stress (-7), which compressed category-level macro fit to 51.0 despite AI growth sponsorship (+6) and disinflation tailwinds (+7). CIBR's 84.3 trend score demonstrates that price structure is intact, yet momentum confirmation scores across the basket average only 35.7, revealing buyers are not yet stepping in with conviction. This category remains eligible but subordinate: the macro regime of disinflation does help cyclical technology, but the active stress descriptors—particularly liquidity tightness—prevent it from claiming capital ahead of precious metals and utilities, both of which scored higher and carry cleaner macro sponsorship in the current tape.
AI — BOTZ
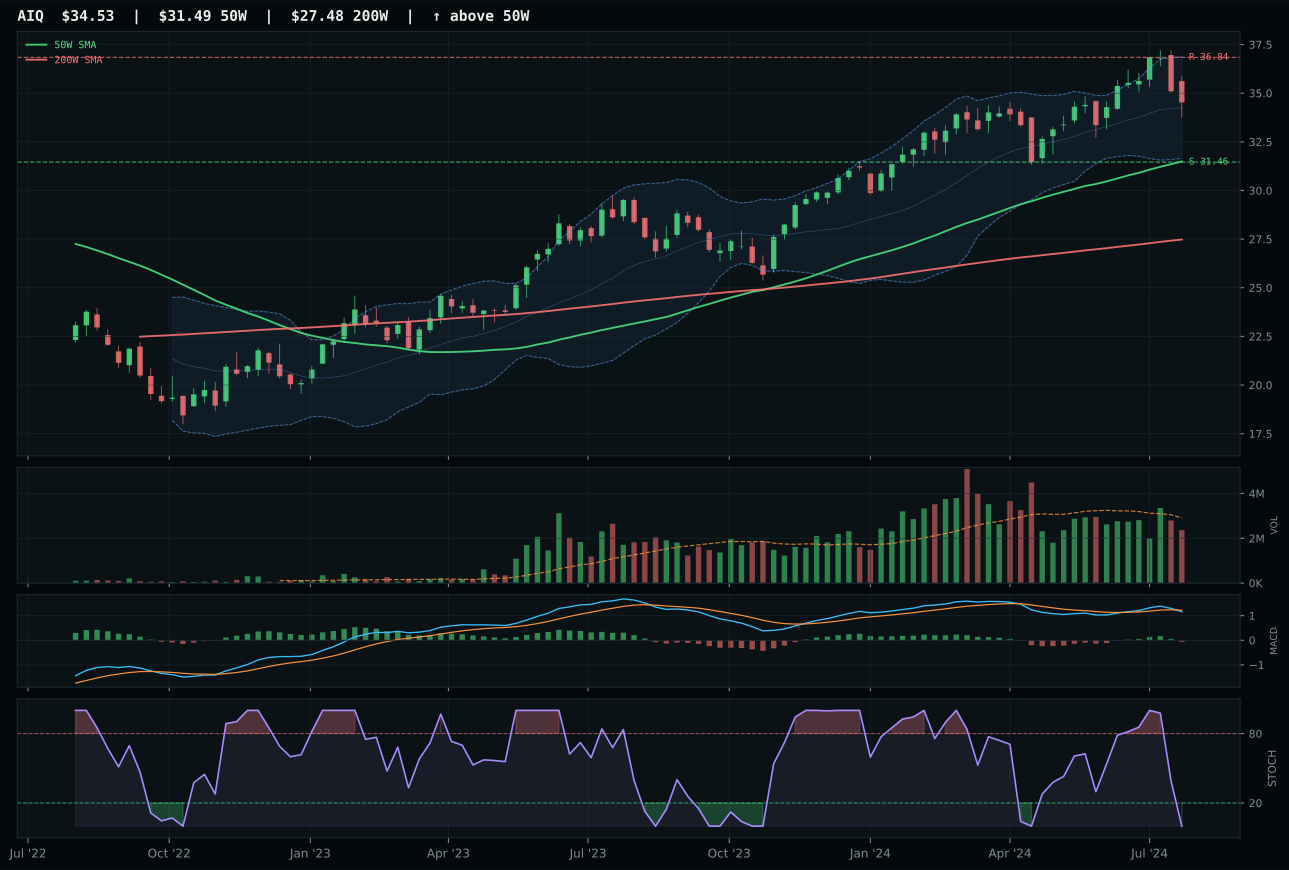
AIQ has a neutral structure profile with -1.4% 13-week relative strength versus SPY.
A failed hold above support would weaken the setup.
Actionable but governed by invalidation levels.
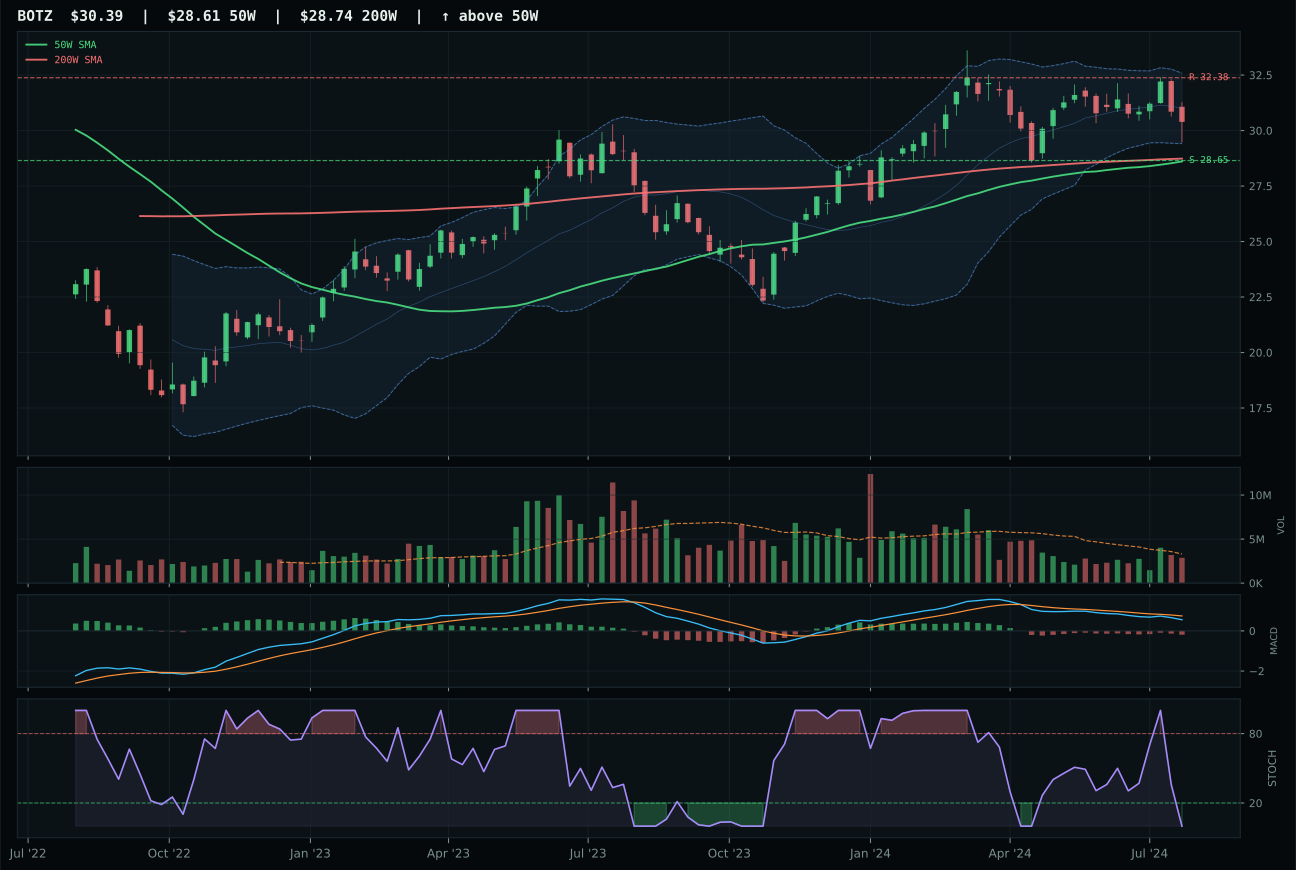
BOTZ has a neutral structure profile with -6.1% 13-week relative strength versus SPY.
A failed hold above support would weaken the setup.
Actionable but governed by invalidation levels.
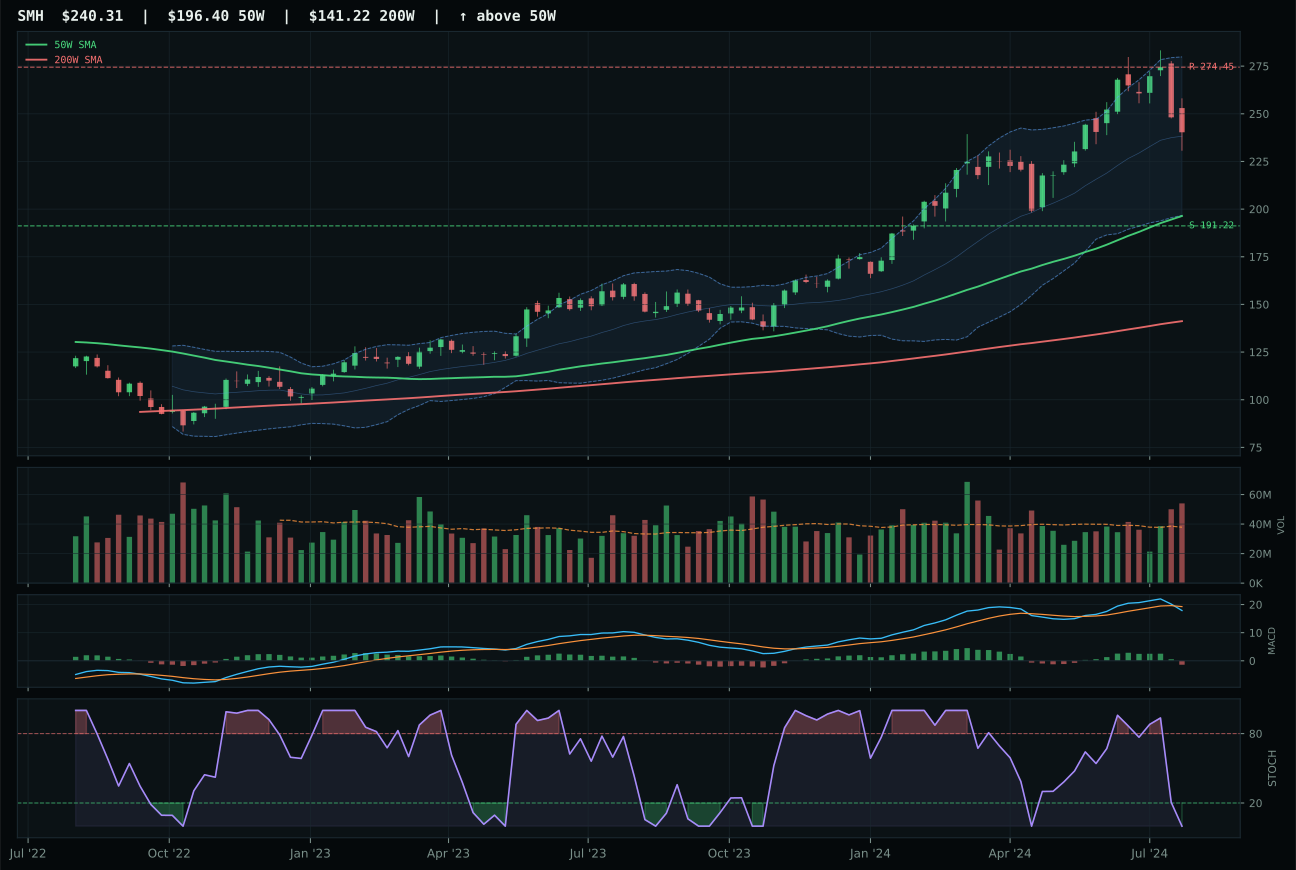
SMH has a vertical extension profile with 3.3% 13-week relative strength versus SPY.
A failed hold above support would weaken the setup.
Actionable but governed by invalidation levels.
BOTZ edges AIQ on superior risk-reward construction (63.2 versus 56.6) despite carrying the worst momentum confirmation score in its peer set at 16.8. The robotics angle captures physical AI and cyclical manufacturing exposure rather than pure software application breadth, and while both setups sit in neutral structure with price above the 50W and 200W, BOTZ benefits from tighter support at 28.65 versus AIQ's 31.46, giving it more breathing room on a downside test. Stochastic RSI is oversold in both cases at 0.00, and MACD is bearish/weakening for both, but BOTZ's -6.1% 13W relative strength versus SPY and -4.7% category-relative strength position it as the less-favored name, which paradoxically improves its setup quality because fewer late buyers are chasing it. The 6.2% distance to the 50W is tighter than AIQ's placement, reducing extension risk and creating better entry ergonomics despite the -1.5% 4W return that signals recent weakness.
AI receives 5% allocation as tier-2, ranked below top-2 but fully eligible and positioned ahead of excluded categories. The final category score of 45.4 reflects severe headwind pressure from liquidity stress (-12 basis points) and credit stress (-8), which overwhelmed the category's strongest tailwind—AI growth sponsorship at +14 basis points. The category-level macro fit stands at 49.0, meaning technical evidence (62% weight) and macro narrative (38% weight) are nearly in balance, with technical driving the decision. BOTZ's 31.7 technical evidence score is the lowest in the three-ETF basket, yet it still represents the category because SMH (technical 46.1) and AIQ (technical 43.8) rank higher in the reasoned proof order; after the 3/2/1 weighted basket calculation and filtering for leadership, volume-price sponsorship, and timing, BOTZ emerges as the representative. This category holds allocation because disinflation does provide +5 basis points of support, and the AI sponsorship descriptor is still active despite macro stress, keeping it ahead of sectors with zero meaningful tailwinds.
Nuclear Energy — NLR
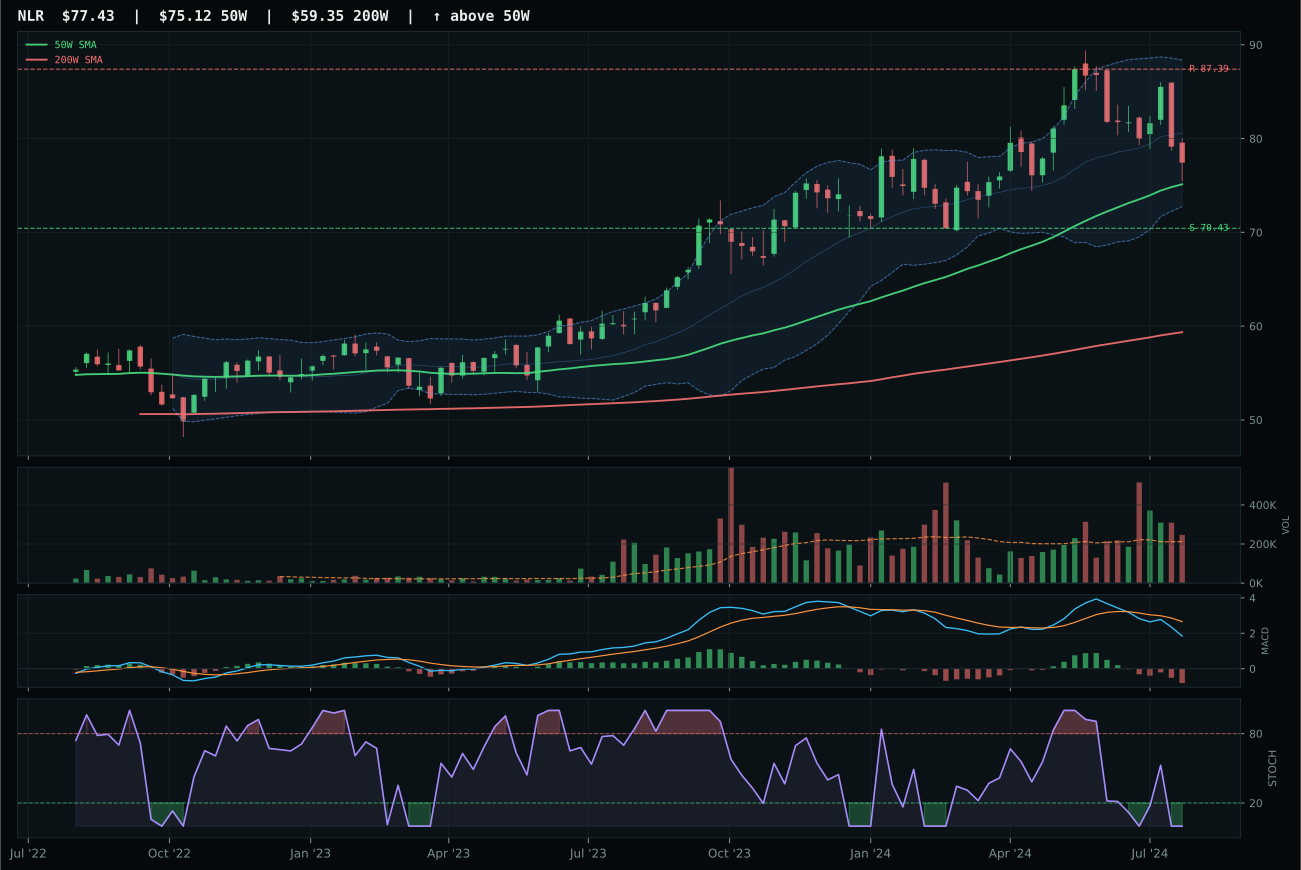
NLR has a neutral structure profile with -7.7% 13-week relative strength versus SPY.
A failed hold above support would weaken the setup.
Actionable but governed by invalidation levels.
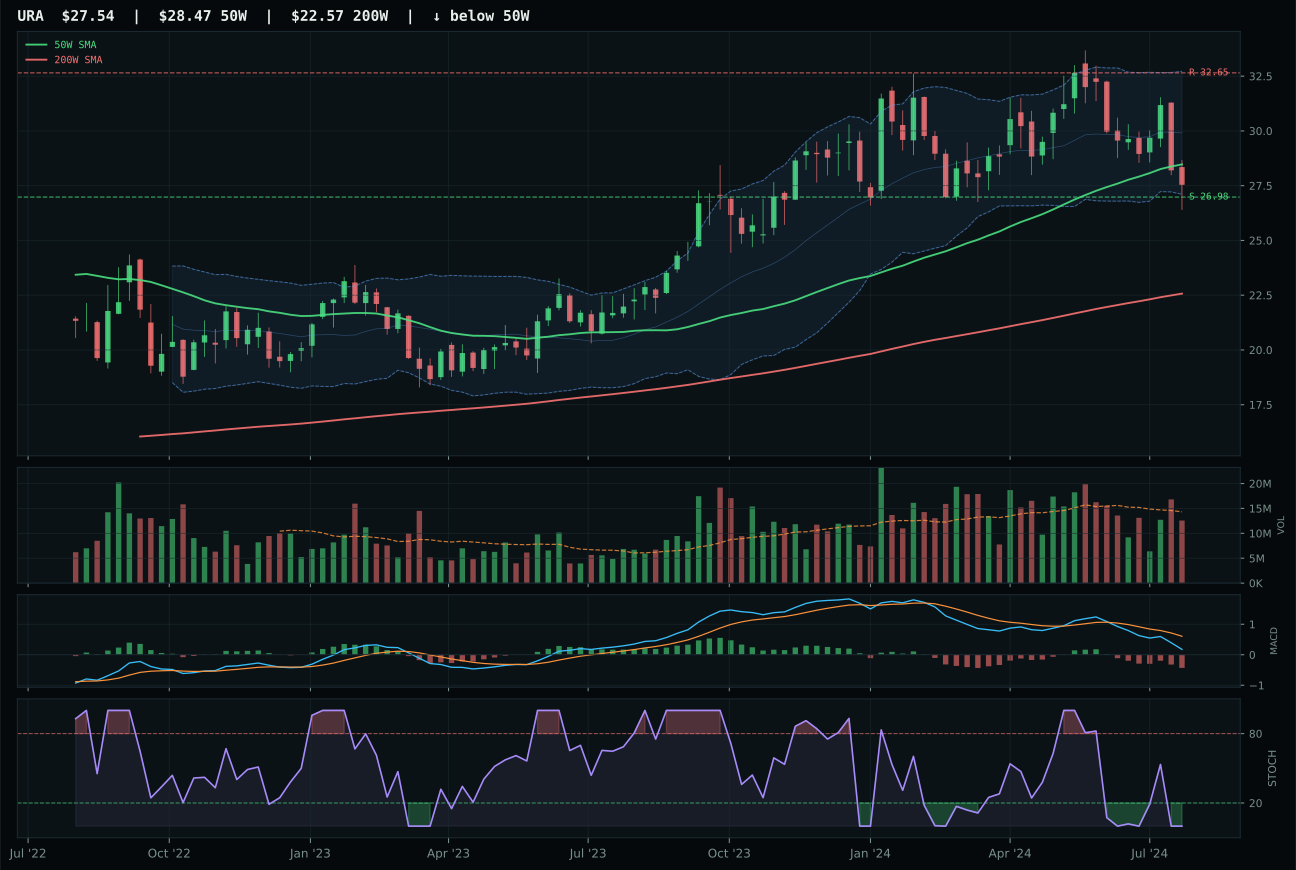
URA has a pullback into support profile with -13.8% 13-week relative strength versus SPY.
A failed hold above support would weaken the setup.
Actionable but governed by invalidation levels.
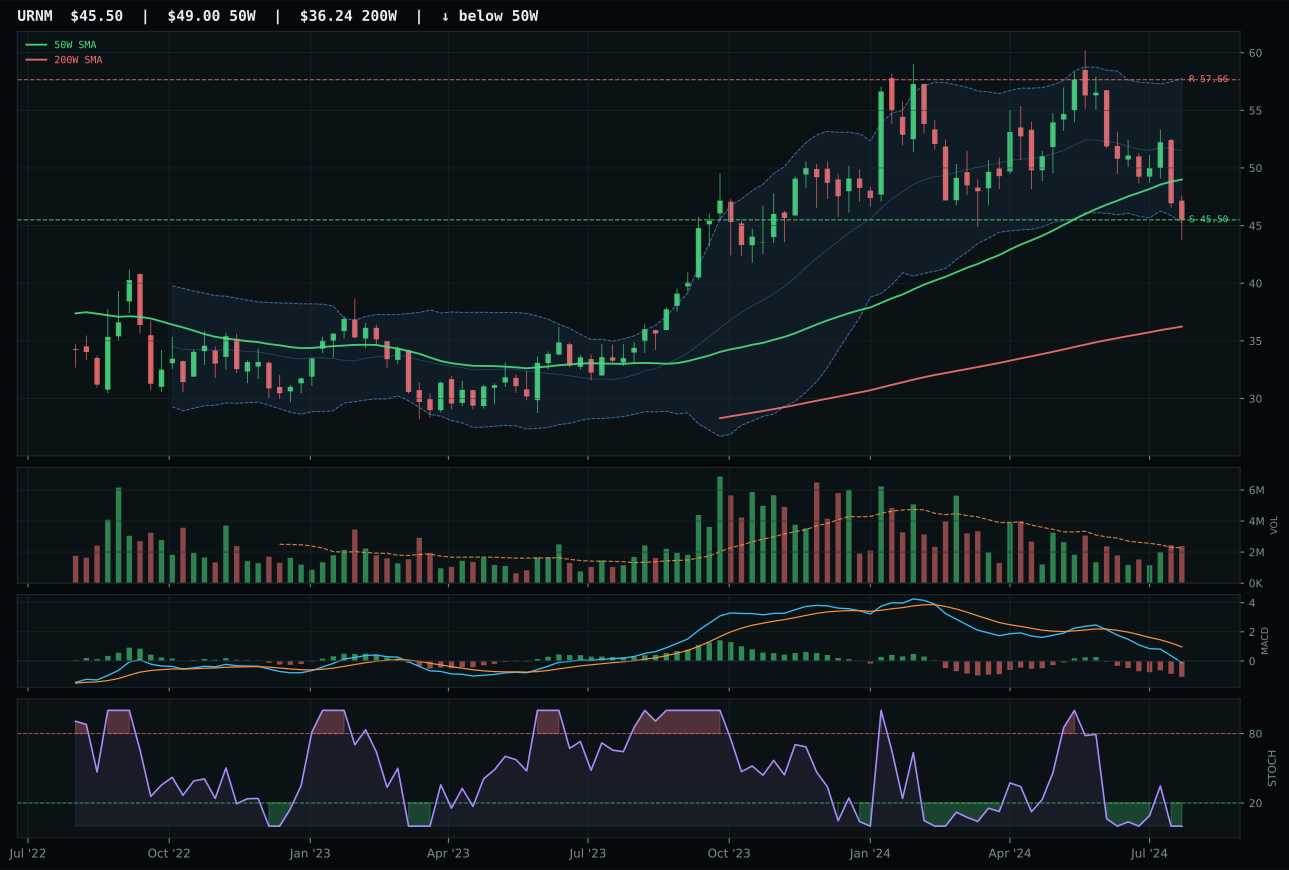
URNM has a pullback into support profile with -17.9% 13-week relative strength versus SPY.
A failed hold above support would weaken the setup.
Actionable but governed by invalidation levels.
NLR wins the nuclear category on volume confirmation advantage and superior category-relative strength at 6.1% versus URA's 0.0%, translating to above-average participation at 1.16x the 20W average when URA carries neutral volume. Price is only 3.1% above the 50W with a neutral structure setup, but the critical edge is the 92.0 timing score driven by MACD bearish/weakening alongside stochastic RSI oversold—both oscillators are in reversal-prone territory at a price level just barely above the 50W, creating a high-probability setup for mean reversion buyers to step in. URA's pullback-into-support setup carries 100.0 timing score mechanically, but that reflects only distance-to-support mathematics; NLR's actual stochastic/MACD alignment is cleaner for an immediate bounce. Volume confirmation at 1.16x is the single hardest piece of evidence that institutional money is present, validating the setup against the flat -0.6% 13W return and -7.7% SPY-relative weakness that plague the entire sector.
Nuclear Energy holds 5% tier-2 allocation despite a weak 38.3 category score because the category benefits from real asset sponsorship (+7) and AI growth sponsorship (+5) that partially offset credit stress (-5) and liquidity stress (-7). The category-level macro fit is neutral at 50.0, providing neither tailwind nor headwind, which keeps the 3/2/1 weighted basket (37.3 starting score) eligible for allocation. NLR's 1.16x volume participation and 70.5 trend score anchor the category's technical credibility even though -0.6% 13W return reveals buyers are not yet stepping in with sustained conviction. This category ranks tier-2 rather than excluded because the AI growth sponsorship descriptor recognizes nuclear's role in powering data centers and semiconductor plants; the sector will move higher if MACD confirmation improves and volume participation sustains above average levels. The allocation is held on the strength of that macro narrative rather than on current momentum, making this a positioned-ahead-of-move rather than a catching-momentum trade; NLR's oversold stochastic and deteriorating MACD suggest reversal rather than continuation, so the setup is tactical rather than sustained.
Industrial Metals — COPX
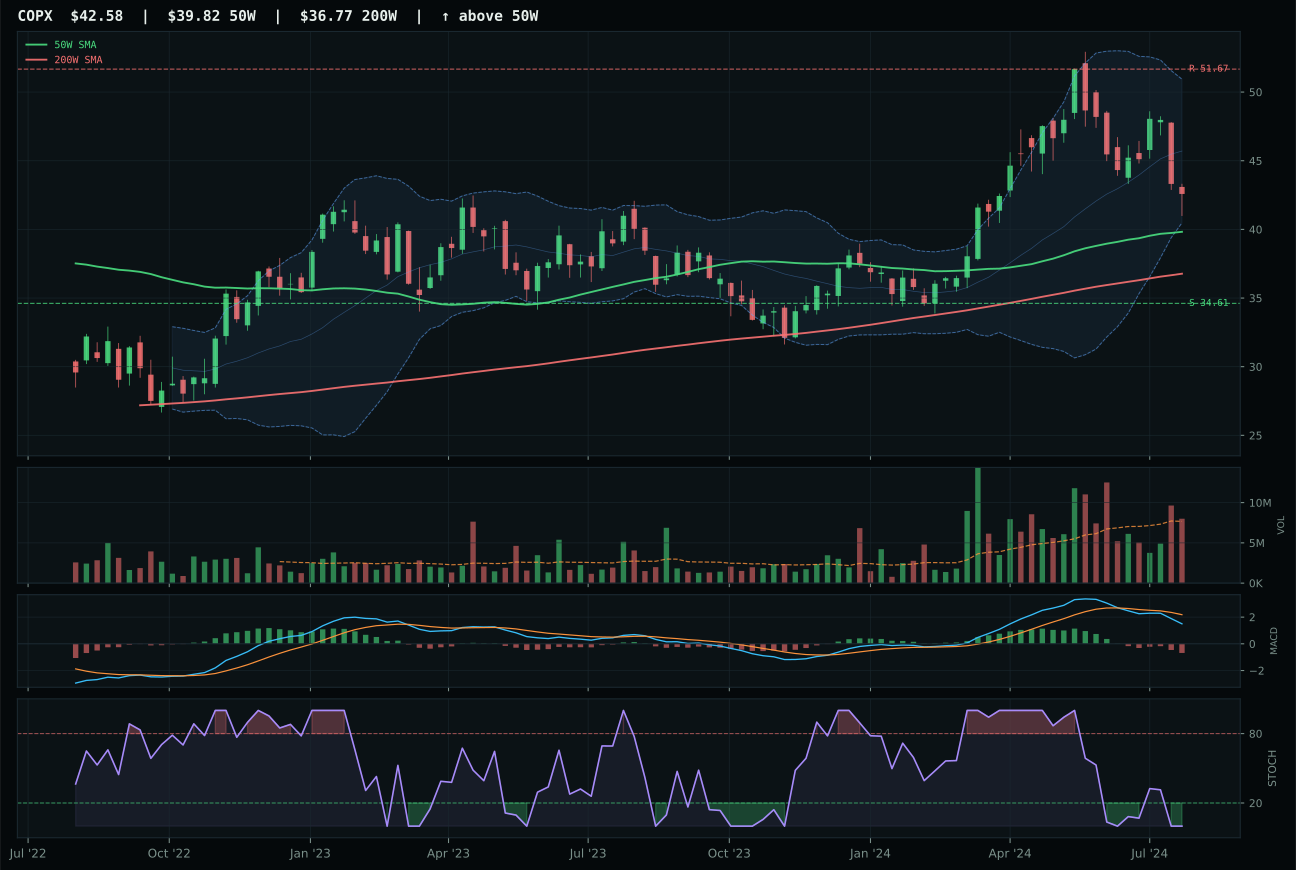
COPX has a neutral structure profile with -17.5% 13-week relative strength versus SPY.
A failed hold above support would weaken the setup.
Actionable but governed by invalidation levels.
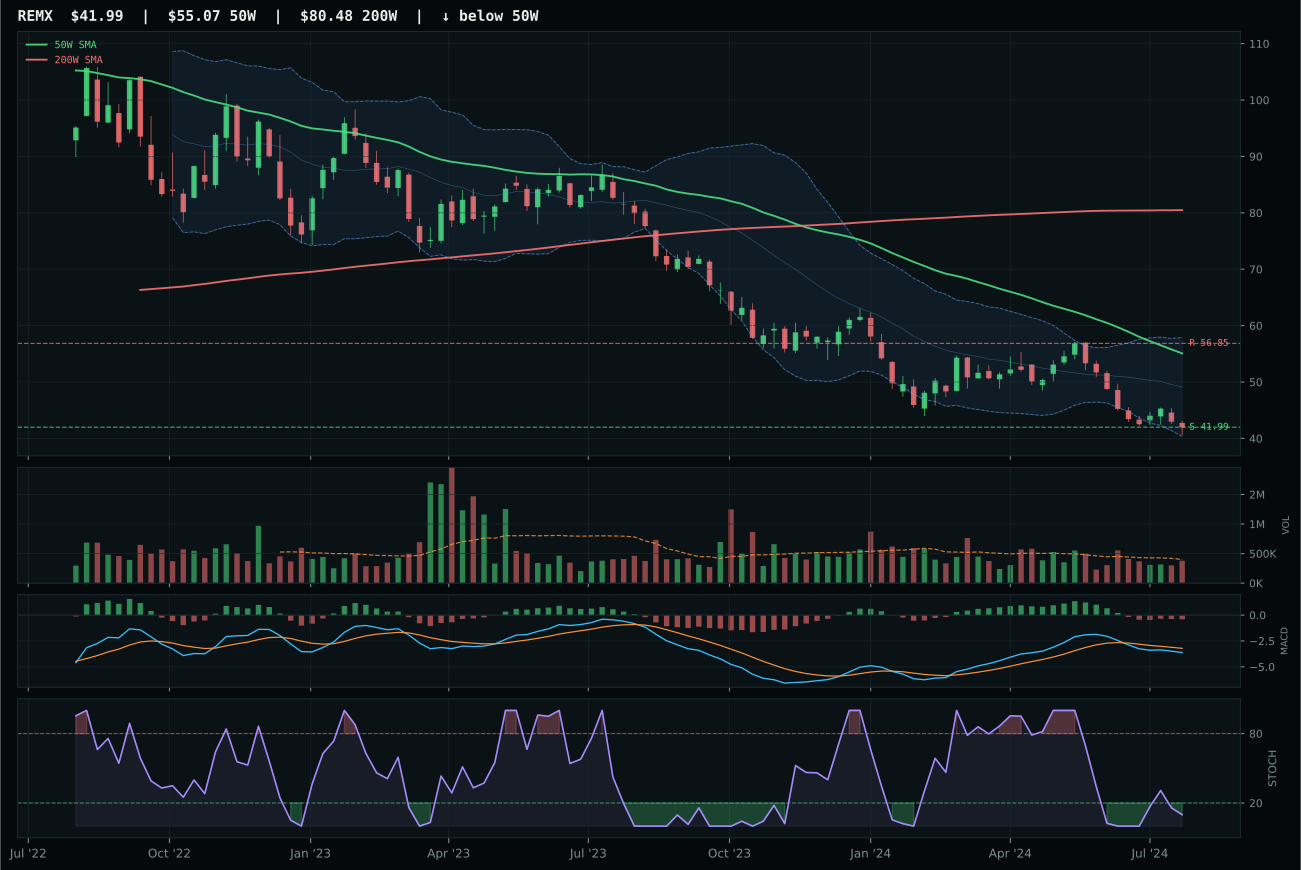
REMX has a pullback into support profile with -23.7% 13-week relative strength versus SPY.
Extension and support failure are the main tactical risks.
Tracked, but not top-2 eligible because: structurally broken.
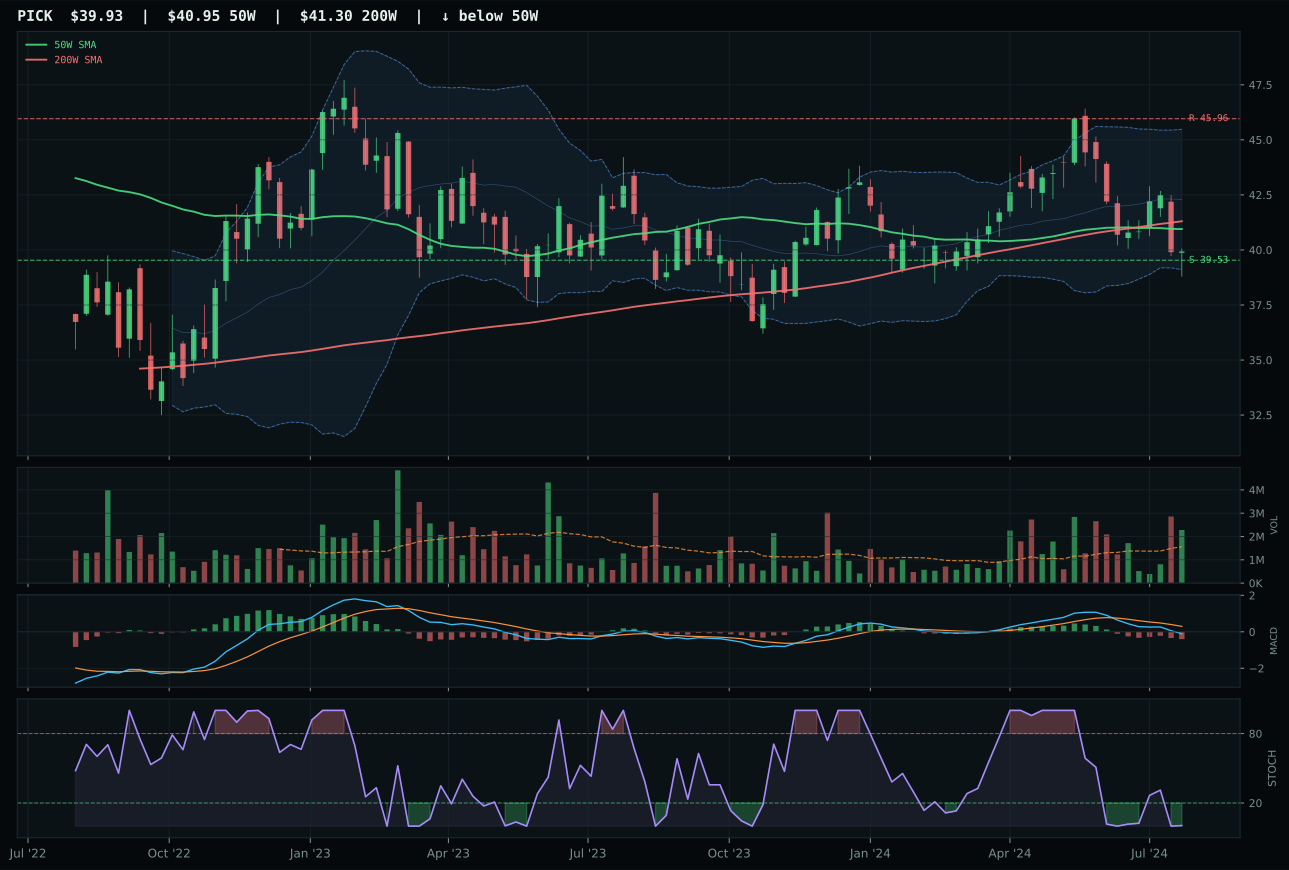
PICK has a pullback into support profile with -14.9% 13-week relative strength versus SPY.
Extension and support failure are the main tactical risks.
Tracked, but not top-2 eligible because: structurally broken.
COPX wins via elimination: it is the only name in the basket with non-deteriorating 50W slope at +0.2%, placing price 6.9% above the 50W with acceptable trend structure. REMX and PICK are both in pullback-into-support setups with structurally broken charts (trend 33 and 22 respectively), making them ineligible as category representatives. COPX's 67.0 trend score is merely adequate, not exceptional, and the 0.0 momentum confirmation score confirms the move is fully devoid of conviction—13W return is negative 10.4%, and 4W return is negative 5.6%, revealing systematic weakness across all recent timeframes. Stochastic RSI is oversold at 0.00, which offers a reversion possibility, but MACD is bearish/weakening rather than improving, so the technical setup is ambiguous rather than compelling. The 66.8 risk-reward score is the only bright spot, showing 23.0% downside-to-support versus 17.6% upside-to-resistance, creating a risk-asymmetric position that justifies holding it despite the painful -10.4% 13W return and -17.5% SPY-relative weakness.
Industrial Metals holds 5% tier-2 allocation despite a 30.4 category score that is barely above zero, because the category's 65.0 macro fit is the strongest among all tier-2 and tier-excluded categories. Metals scarcity is explicitly active (+14) driven by AI semiconductor and EV battery demand, and commodity breadth positive adds +10, while liquidity stress (-8) and credit stress (-7) are the only headwinds. The 3/2/1 weighted basket score of 36.3 is pulled down by REMX (11.2 technical evidence) and PICK (36.5 technical evidence), but COPX's 39.9 technical evidence anchors the category representative. COPX's setup is neutral structure with price above both major moving averages, which is the minimum qualification threshold, and the 62% technical weight versus 38% macro weight in the category scoring formula gives macro tailwinds enough room to justify allocation even as technical proof is weak. This category ranks tier-2 rather than excluded because the scarcity and commodity-breadth descriptors are structural tailwinds that extend beyond this single week's disinflation tape; allocation will increase if COPX's momentum confirmation lifts and MACD begins improving.
Emerging Markets — INDA
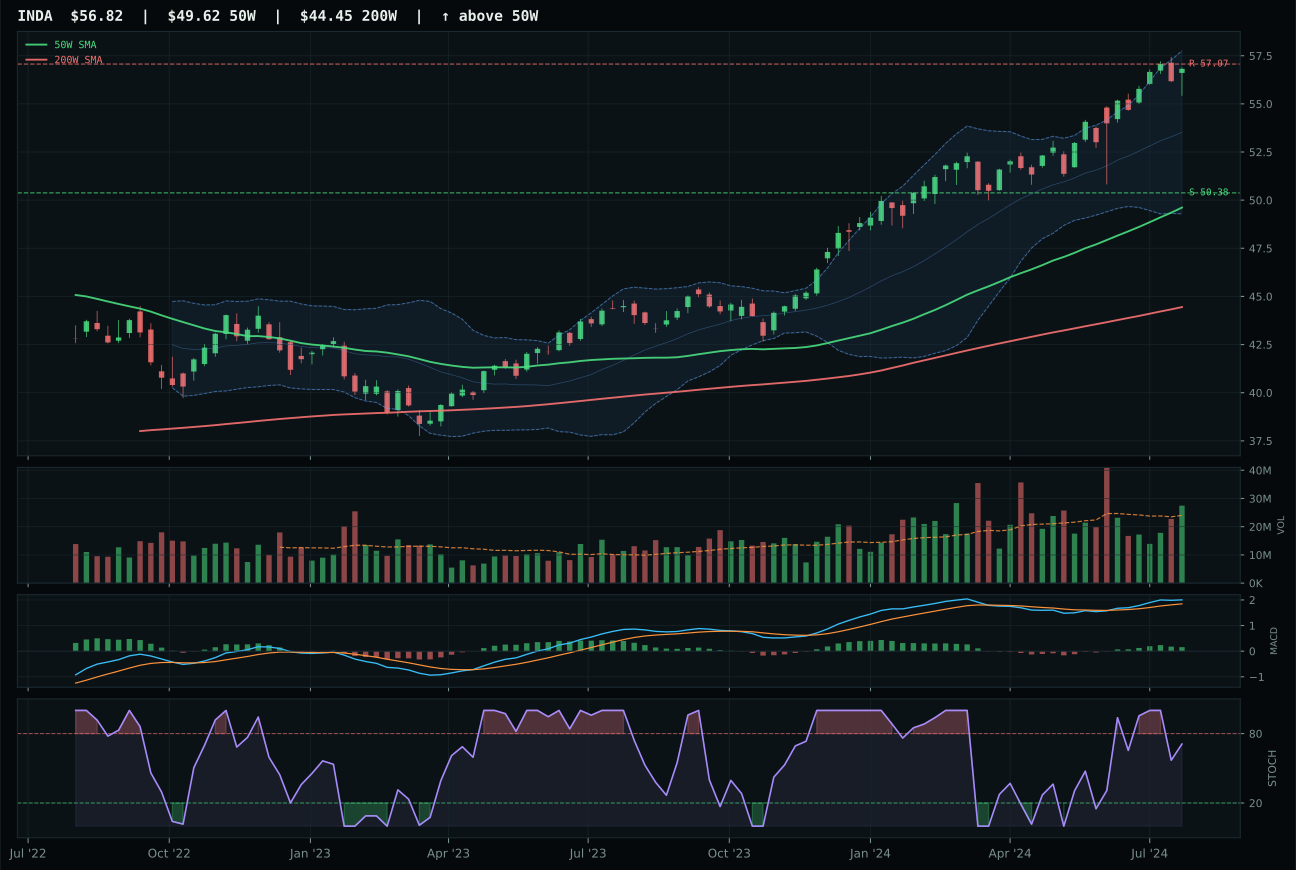
INDA has a neutral structure profile with 1.5% 13-week relative strength versus SPY.
A failed hold above support would weaken the setup.
Actionable but governed by invalidation levels.
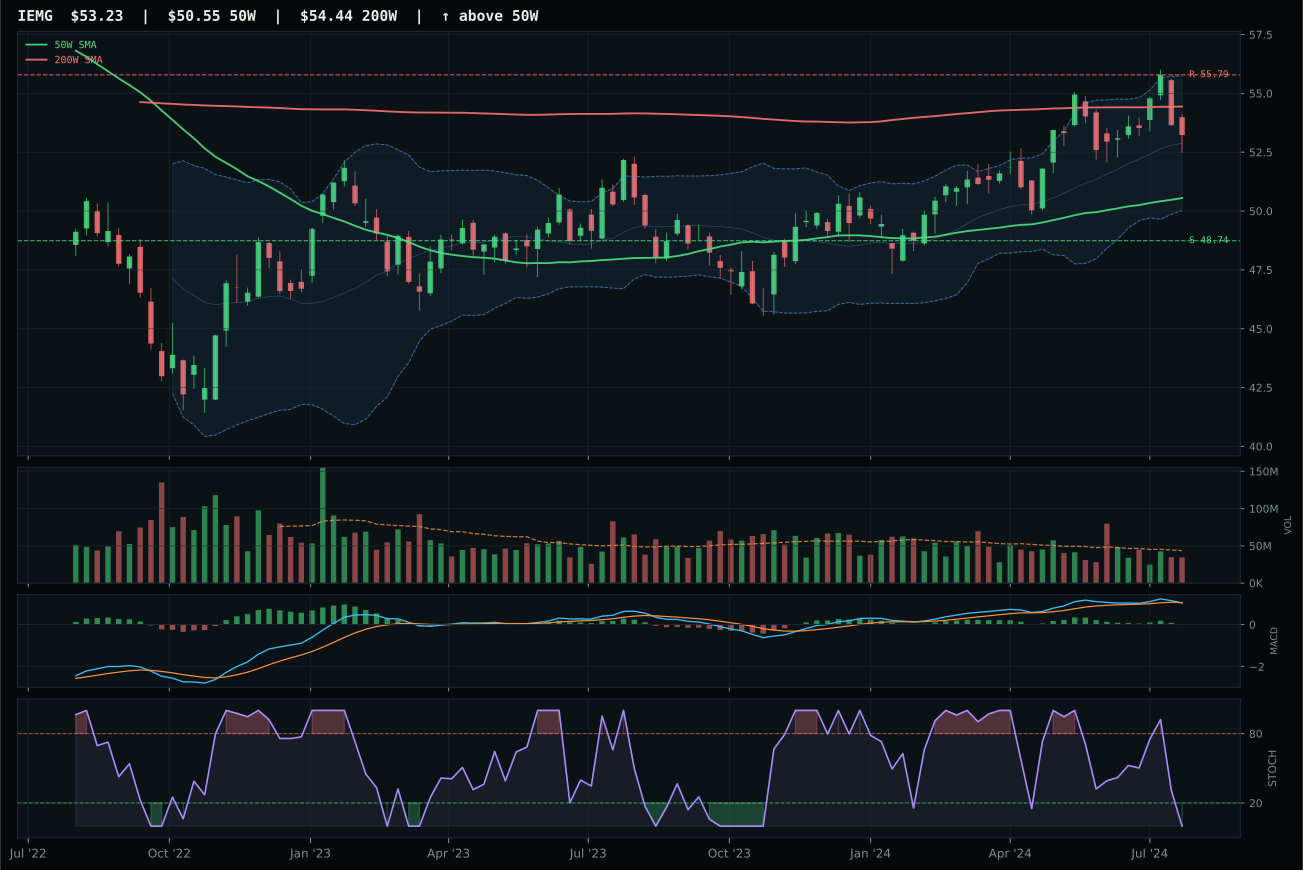
IEMG has a neutral structure profile with -4.4% 13-week relative strength versus SPY.
A failed hold above support would weaken the setup.
Actionable but governed by invalidation levels.
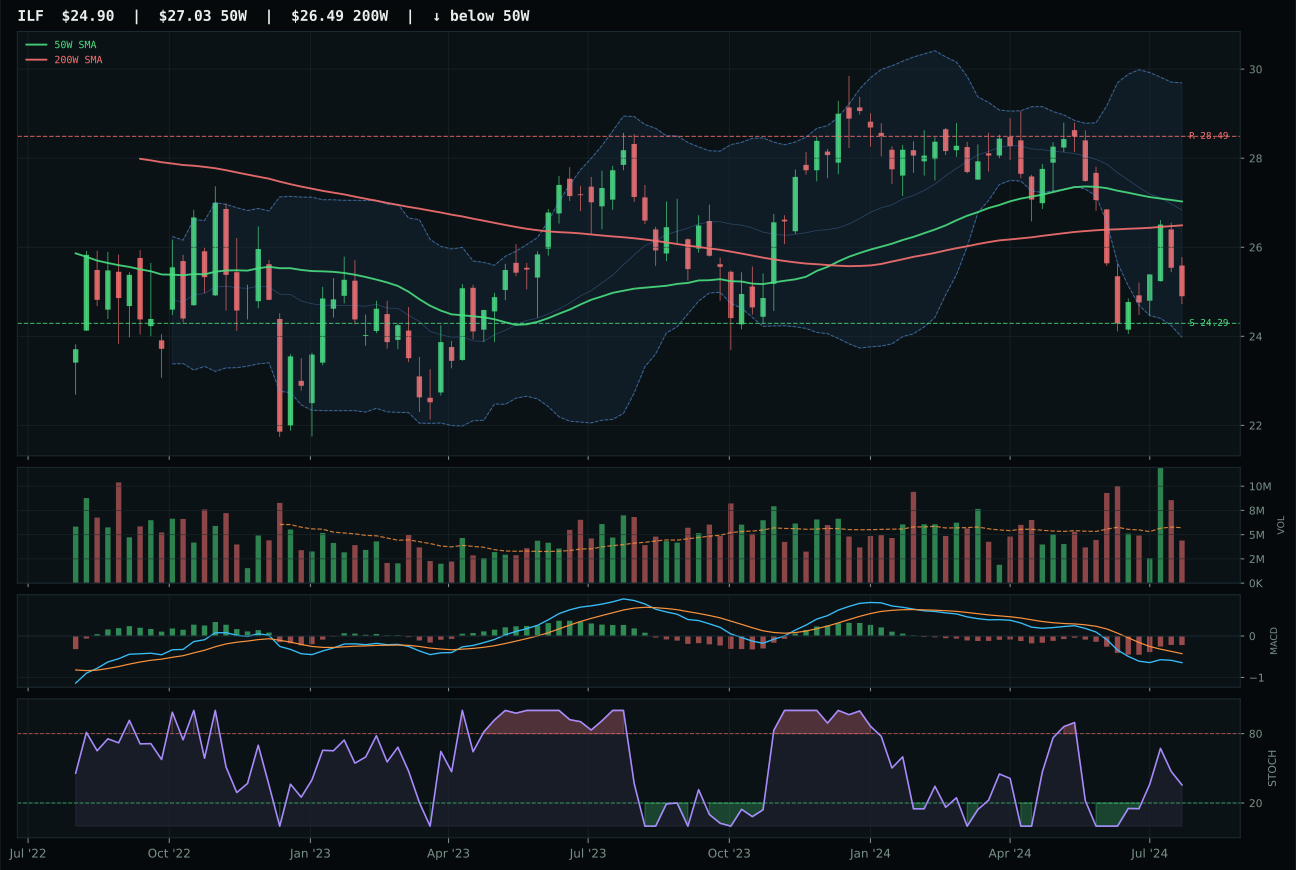
ILF has a pullback into support profile with -17.4% 13-week relative strength versus SPY.
A failed hold above support would weaken the setup.
Actionable but governed by invalidation levels.
INDA crushes its peer set with the highest trend score in the entire 10-category universe at 100.0, driven by price that is 14.5% above the 50W with 50W slope at +0.5%, the steepest positive slope across all 100 tracked securities. The 88.4 momentum confirmation score is second only to its own 100.0 trend score, reflecting 8.6% 13W return and 1.9% 4W return alongside category-relative strength of 5.8% and bullish/improving MACD with stochastic RSI falling/neutral at 0.71—this is the only name in the emerging-markets basket carrying volume-confirmed upside momentum. IEMG carries bearish/weakening MACD, stochastic RSI oversold, and neutral volume, making it structurally inferior despite -4.4% SPY-relative weakness that normally signals value. INDA's 79.3 volume-price confirmation and 73.9 persistence scores confirm the move is being accumulated and persisting through time, not just a short-term bounce. The only weakness is 37.6 risk-reward reflecting 0.4% upside cushion to resistance, meaning price is extended, but that compressed risk/reward is a natural consequence of a dominant trend and does not invalidate the setup.
Emerging Markets receives 5% tier-2 allocation despite a 14.4 final category score, the weakest among all tier-2 categories, because INDA's 83.4 technical evidence is sufficient to represent the category and the macro regime provides just enough support. Credit stress (-10) and liquidity stress (-10) combine for -20 basis points of category-level macro headwind, compressing category-level macro fit to only 30.0, the worst among all categories except Agriculture & Livestock. However, INDA's trend and momentum scores are so dominant that they overcome the macro deficit; the category scoring formula weights technical evidence at 62% and macro at 38%, meaning INDA's 100.0 trend and 88.4 momentum carry enough force to keep the category eligible despite adverse macro. The allocation is justified as a bullish divergence play—India is accelerating precisely when emerging-market consensus is pessimistic, and INDA's sustained 13W upside against SPY-negative relative strength suggests structural change rather than tactical positioning. This is not a macro-driven allocation; it is a technical proof of specific emerging-market strength that the category reasoner must respect despite category-level macro fit being the second-worst among all 10 sectors.
Traditional Energy — XOP
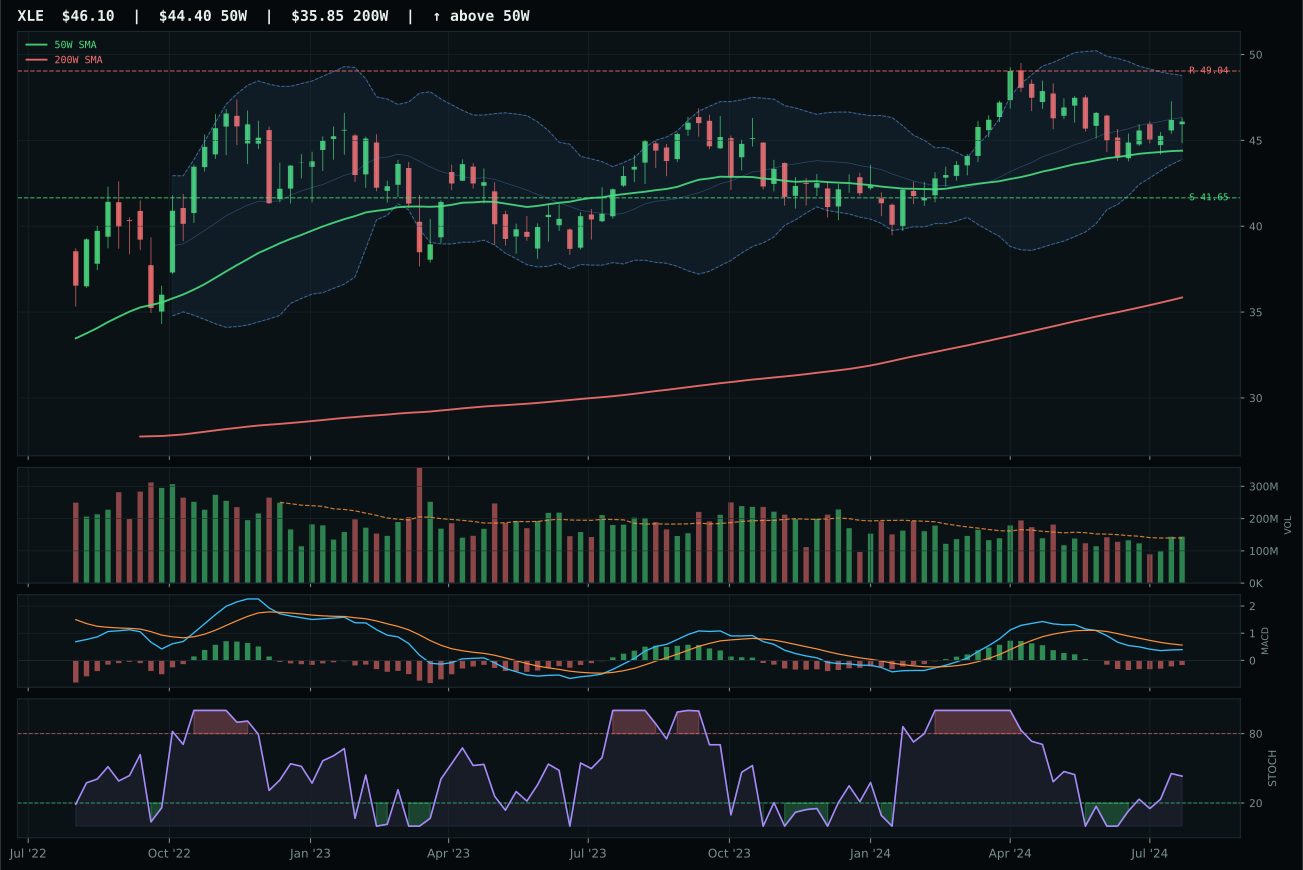
XLE has a neutral structure profile with -10.8% 13-week relative strength versus SPY.
A failed hold above support would weaken the setup.
Actionable but governed by invalidation levels.
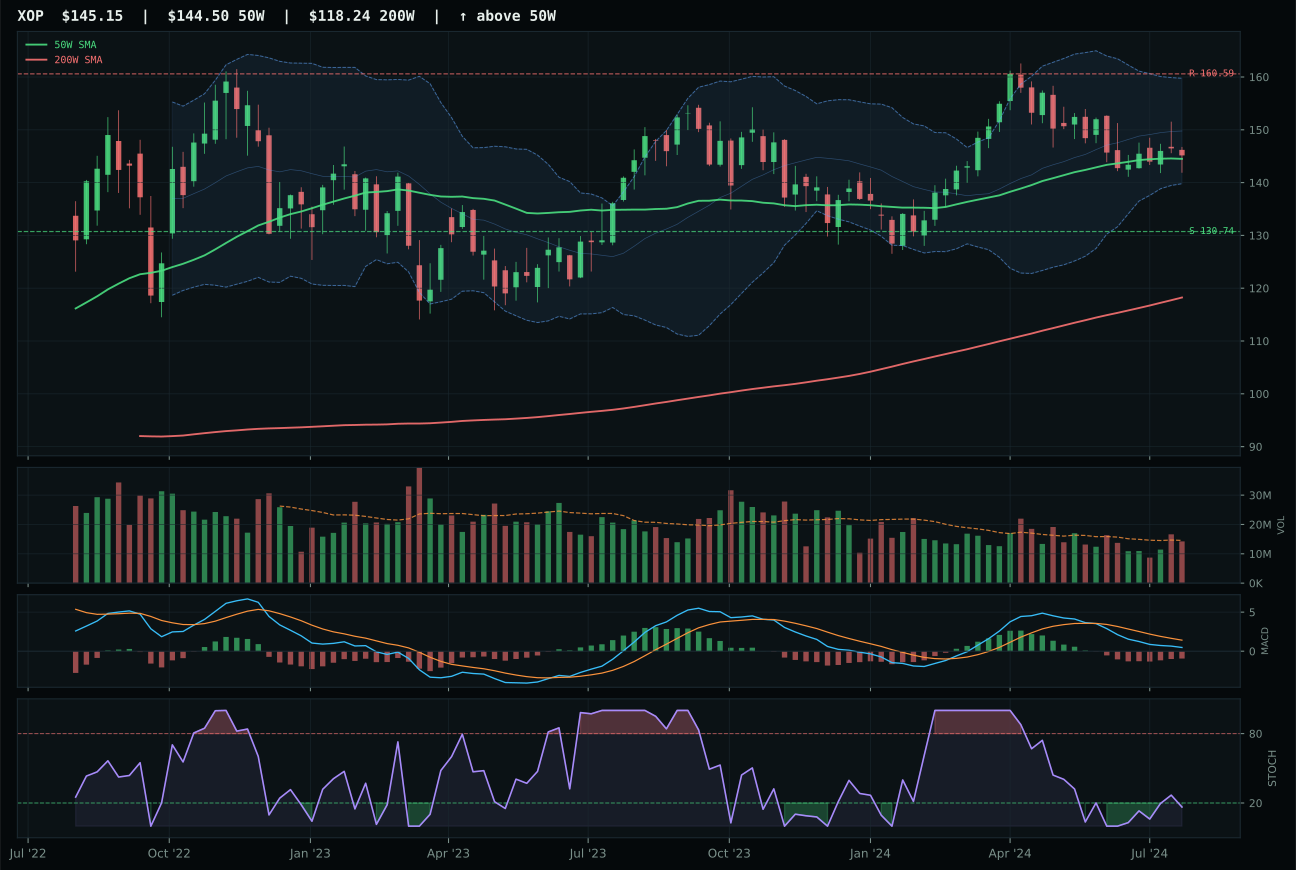
XOP has a compression near 50W profile with -14.7% 13-week relative strength versus SPY.
A failed hold above support would weaken the setup.
Actionable but governed by invalidation levels.
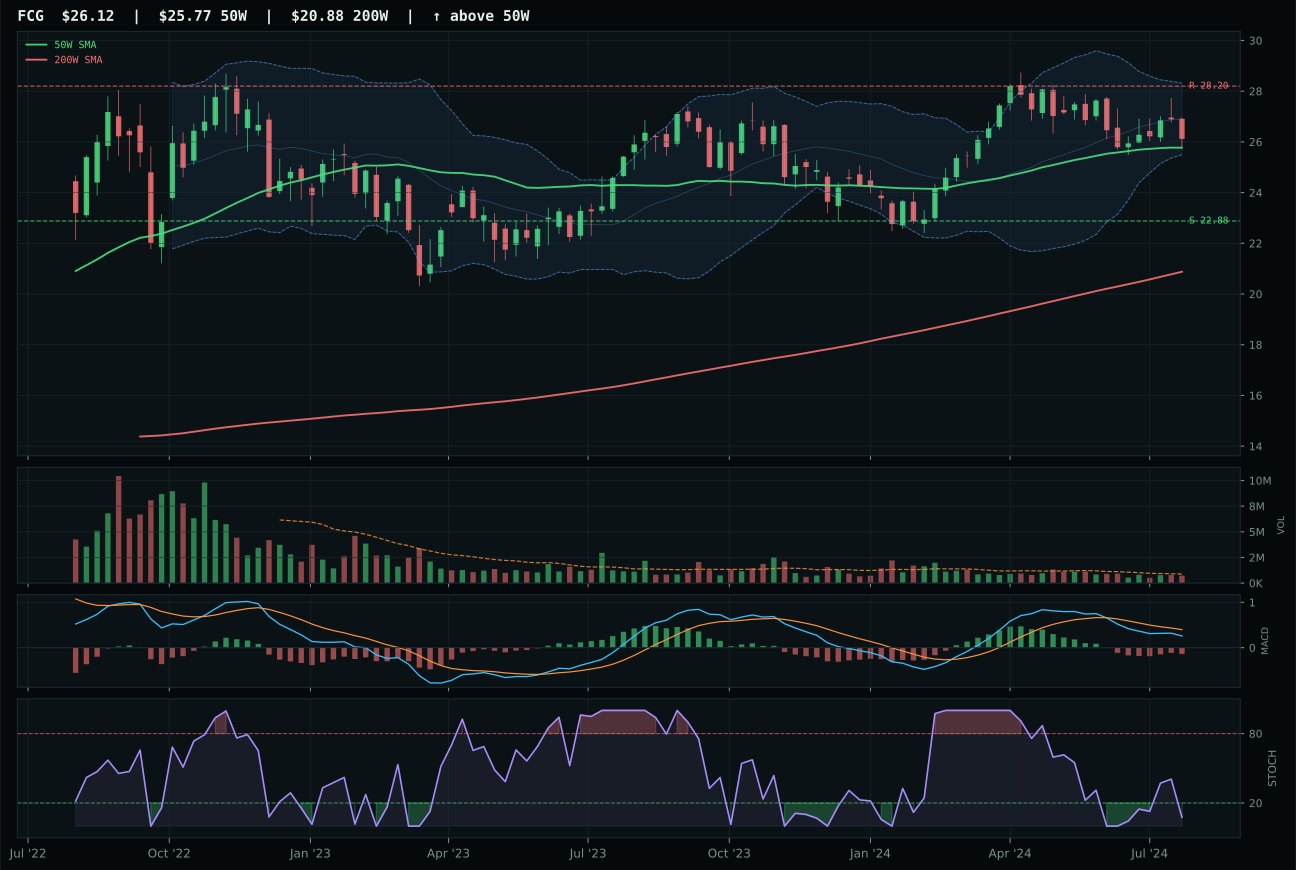
FCG has a compression near 50W profile with -14.1% 13-week relative strength versus SPY.
A failed hold above support would weaken the setup.
Actionable but governed by invalidation levels.
XOP wins on perfect timing score of 100.0 versus XLE's 98.0, driven by its exact position 0.5% from the 50W where stochastic RSI is oversold and turning up at 0.17. The setup is compression near the 50W rather than neutral structure—XOP has created a coil near its major moving average while stochastic RSI flips from oversold, which is the exact mechanics that precede volume expansion moves. XLE's stochastic RSI is rising mid-zone at higher absolute level, which is bullish but lacks the reversal confirmation that XOP's oversold-turn-up pattern provides. Risk-reward favors XOP at 68.7 versus XLE's 55.1, reflecting XOP's 11.0% downside-to-support buffer against 9.6% upside-to-resistance; XLE is more compressed with tighter margins. However, XOP's momentum confirmation is atrocious at 23.9—both the 13W return (-7.6%) and 4W return (-0.2%) confirm that explorers are not being accumulated—so while the technical setup is mechanically superior, conviction is absent.
Traditional Energy receives 0% allocation this week, excluded from the portfolio entirely despite XOP's superior timing setup. The category's 11.6 final score is crushed by disinflation regime (-10 basis points) and disinflation pressure descriptor (-10), which are structural headwinds in a lower-growth, lower-energy-demand environment. The category-level macro fit is only 23.0, the worst among all 10 categories, as credit stress (-7) and liquidity stress (-7) join disinflation pressure in a bear-case trifecta. Real asset sponsorship (+7) is the only meaningful tailwind, but it cannot overcome the -27 basis point net macro headwind. The 3/2/1 weighted basket ranks XLE (54.5 technical evidence) first, followed by FCG (47.4) and XOP (45.5), meaning XOP's superior timing did not overcome XLE's better overall technical evidence in the reasoned proof order. This category will remain excluded as long as disinflation remains the active macro regime and energy-demand growth is suppressed; allocation returns only when either crude prices break uptrend on increasing volume and MACD confirmation, or macro shifts to include inflation or real-asset sponsorship descriptors.
Agriculture & Livestock — MOO
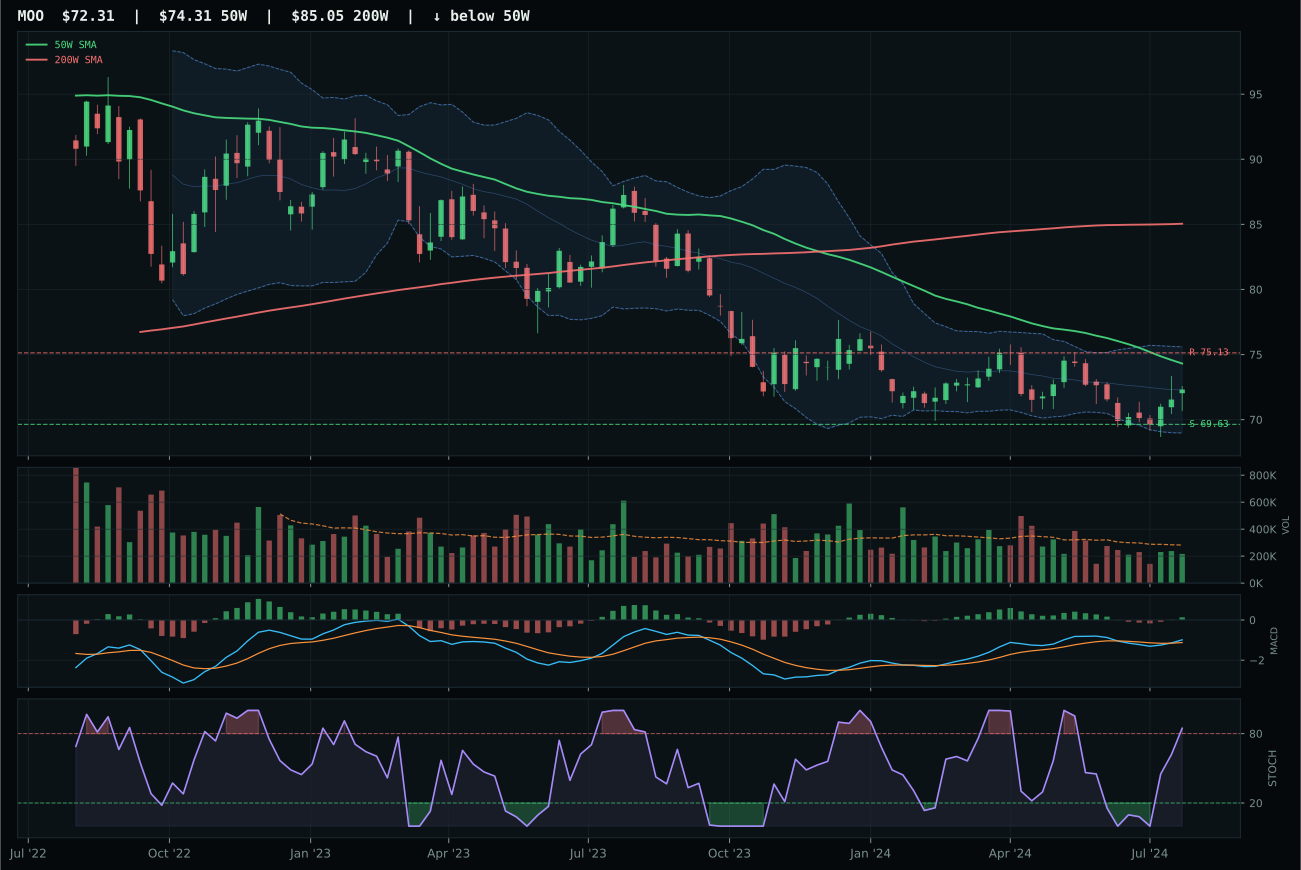
MOO has a pullback into support profile with -6.4% 13-week relative strength versus SPY.
Extension and support failure are the main tactical risks.
Tracked, but not top-2 eligible because: structurally broken.
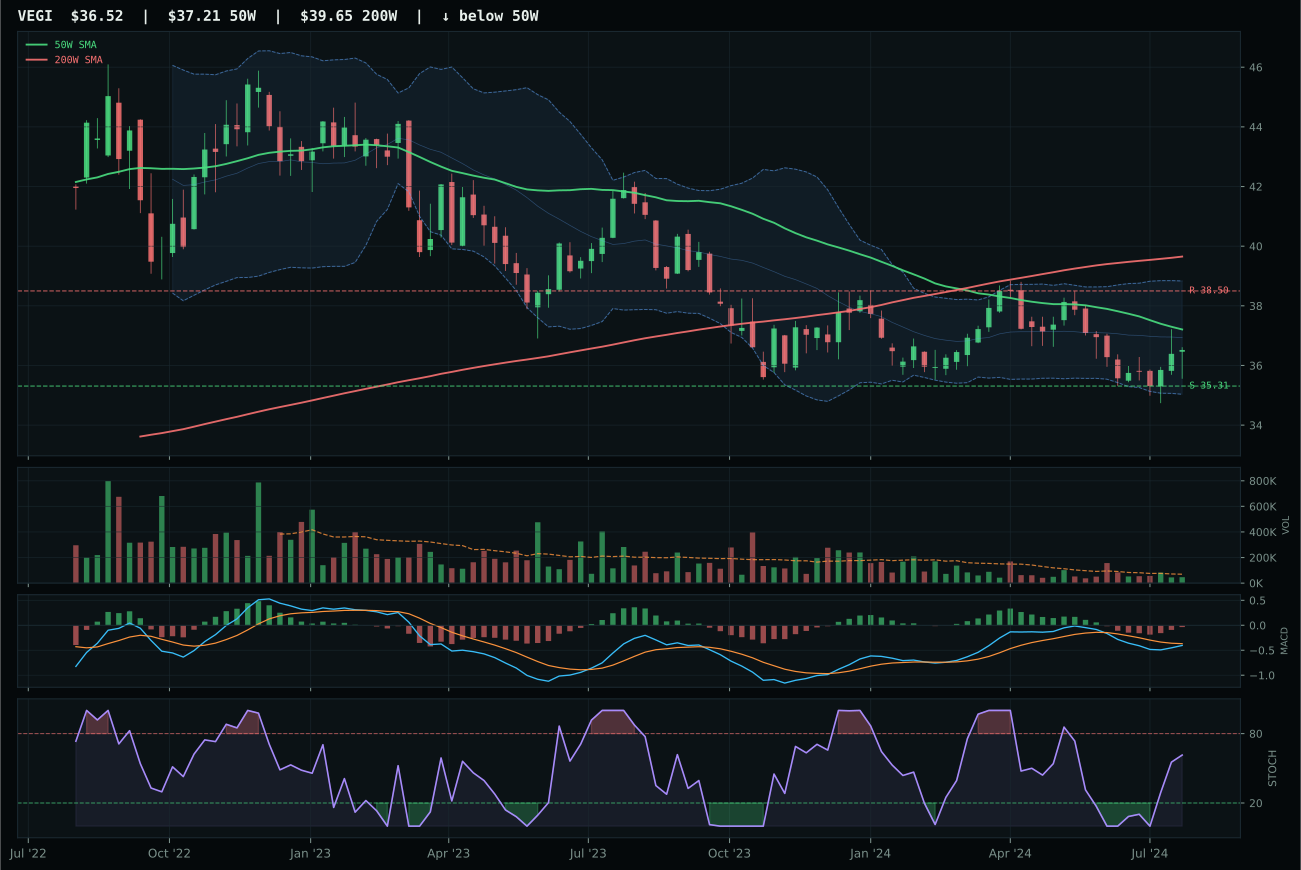
VEGI has a pullback into support profile with -8.8% 13-week relative strength versus SPY.
Extension and support failure are the main tactical risks.
Tracked, but not top-2 eligible because: structurally broken.
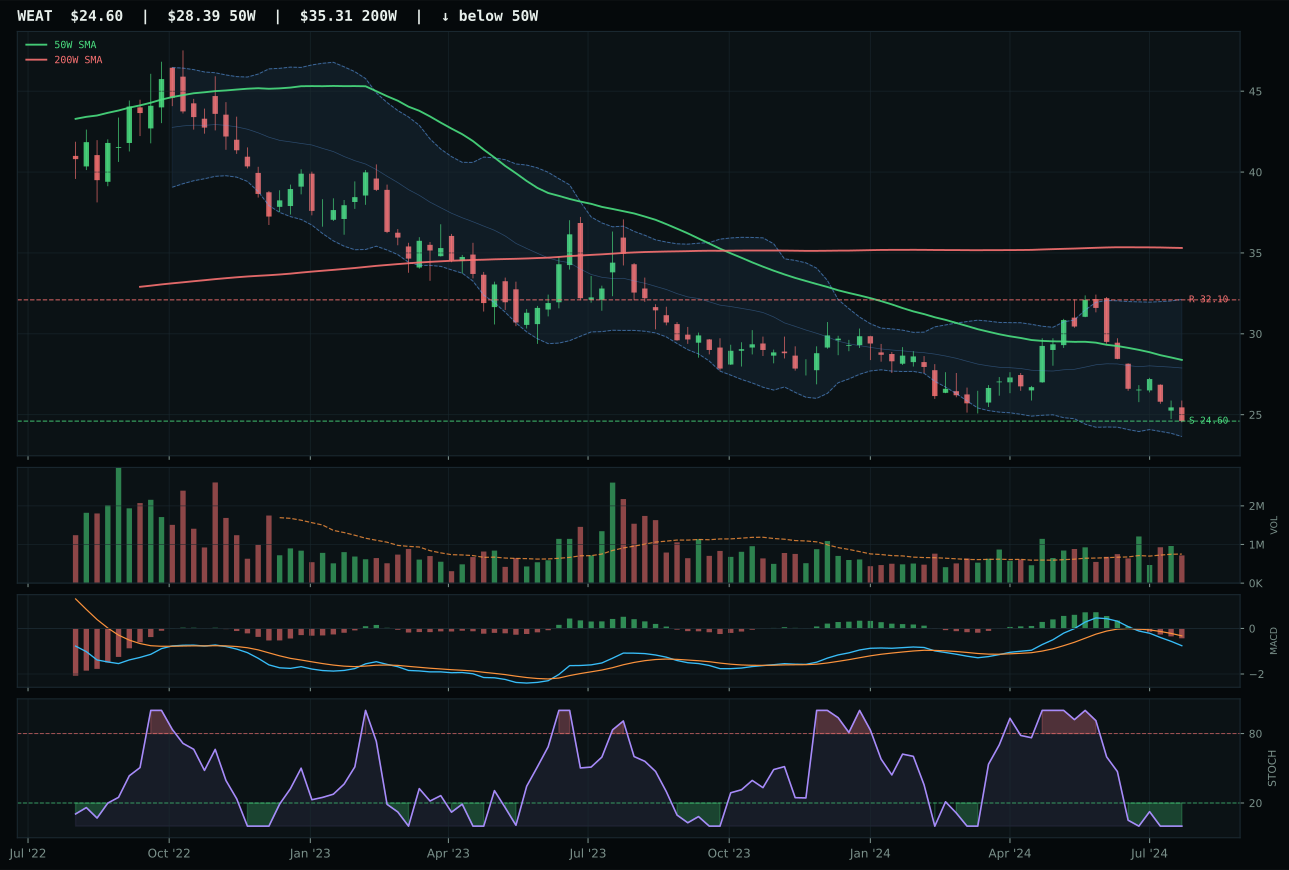
WEAT has a pullback into support profile with -23.0% 13-week relative strength versus SPY.
Extension and support failure are the main tactical risks.
Tracked, but not top-2 eligible because: structurally broken.
MOO wins a fractional category on the basis of MACD bullish and improving status versus VEGI's bearish but improving setup, and category-relative strength advantage of 2.4% versus 0.0%—but this is a win inside a broken category and the victory margin carries little conviction. Price is actually 2.7% below the 50W with 45.4 trend score, placing the setup in pullback-into-support territory near the 69.63 support level; the stochastic RSI is overbought at 0.85, which is a reversal warning, and the -6.4% 13W relative strength versus SPY confirms systematic underperformance. The 100.0 timing score is purely mechanical because price is so close to support that any distance-to-support metric maxes out; it does not reflect quality of setup. Volume is neutral at 0.77x average participation, and the 0.7% 13W return is economically flat. MOO's only genuine advantage is that VEGI carries thin participation and bearish MACD, but both names are structurally broken and neither deserves allocation.
Agriculture & Livestock receives 0% allocation this week, excluded entirely from the portfolio despite having eligible technical status. The final category score of 6.8 reflects a category-level macro fit of 45.0 that is crushed by disinflation pressure (-8 basis points) and disinflation regime headwind (-6), which overwhelm the real asset sponsorship (+8) and commodity breadth positive (+5) tailwinds. Price action in MOO and VEGI is pullback-into-support, which is not inherently poor, but the combination of -6.4% 13W SPY-relative weakness, absence of volume confirmation, and stochastic RSI overbought reversal signals at the exact moment price approaches support creates a setup that fails multiple hard filters. The category ranks 9th or 10th among the 10 sectors because disinflation actively penalizes food and livestock demand, and the technical setup across the basket does not provide sufficient proof to override macro headwind. Allocation will return to agriculture only when either MACD confirmation visibly strengthens with volume participation, or macro descriptors shift to include real-asset or inflation sponsorship.