
2024-07-19
Informational purposes only. The content in this report, including allocations, analysis, and commentary, is provided solely for informational and educational purposes. It does not constitute financial advice, investment advice, trading advice, or any other type of advice. Past performance does not guarantee future results. Always conduct your own research and consult a qualified financial professional before making investment decisions.
Weekly Allocation
| Ticker | Category | Weight | Role |
|---|---|---|---|
| FBTC | 50% | Overlay | |
| IGV | Technology | 10% | Top-2 (10%) |
| BOTZ | AI | 10% | Top-2 (10%) |
| IGF | Utilities & Infrastructure | 5% | Tier-2 (5%) |
| GLD | Precious Metals | 5% | Tier-2 (5%) |
| INDA | Emerging Markets | 5% | Tier-2 (5%) |
| NLR | Nuclear Energy | 5% | Tier-2 (5%) |
| XAR | Defense & Aerospace | 5% | Tier-2 (5%) |
| COPX | Industrial Metals | 5% | Tier-2 (5%) |
Trade Instructions — Monday Open
Sell the tranche from 2024-06-21 (completing its 4-week hold). Buy the new tranche. Instructions show net portfolio changes — same-asset positions cancel, weight changes show the delta.
| Action | Ticker | Instruction |
|---|---|---|
| SELL | GLD | Sell 25% of GLD position (reduce 5.00% → 3.75%) |
| SELL | XLU | Sell 67% of XLU position (reduce 3.75% → 1.25%) |
| SELL | SMH | Sell 33% of SMH position (reduce 3.75% → 2.50%) |
| SELL | XLK | Sell entire XLK position (1.25% of portfolio) |
| SELL | ITA | Sell 50% of ITA position (reduce 2.50% → 1.25%) |
| BUY | IGV | Buy IGV — 33.33% of freed cash (adds 2.50% to portfolio) |
| BUY | IGF | Buy IGF — 16.67% of freed cash (adds 1.25% to portfolio) |
| BUY | XAR | Buy XAR — 16.67% of freed cash (adds 1.25% to portfolio) |
| BUY | BOTZ | Buy BOTZ — 33.33% of freed cash (adds 2.50% to portfolio) |
Current Portfolio After Trade
Combined holdings across all 4 active tranches. Each tranche is 25% of the portfolio.
| Ticker | % of Portfolio | Weight Bar |
|---|---|---|
| FBTC | 50.00% | |
| IGV | 10.00% | |
| COPX | 5.00% | |
| INDA | 5.00% | |
| AIQ | 5.00% | |
| GLD | 3.75% | |
| NLR | 3.75% | |
| IGF | 3.75% | |
| XAR | 3.75% | |
| SMH | 2.50% | |
| BOTZ | 2.50% | |
| XLU | 1.25% | |
| ITA | 1.25% | |
| SLV | 1.25% | |
| URA | 1.25% |
Macro Regime — Disinflation
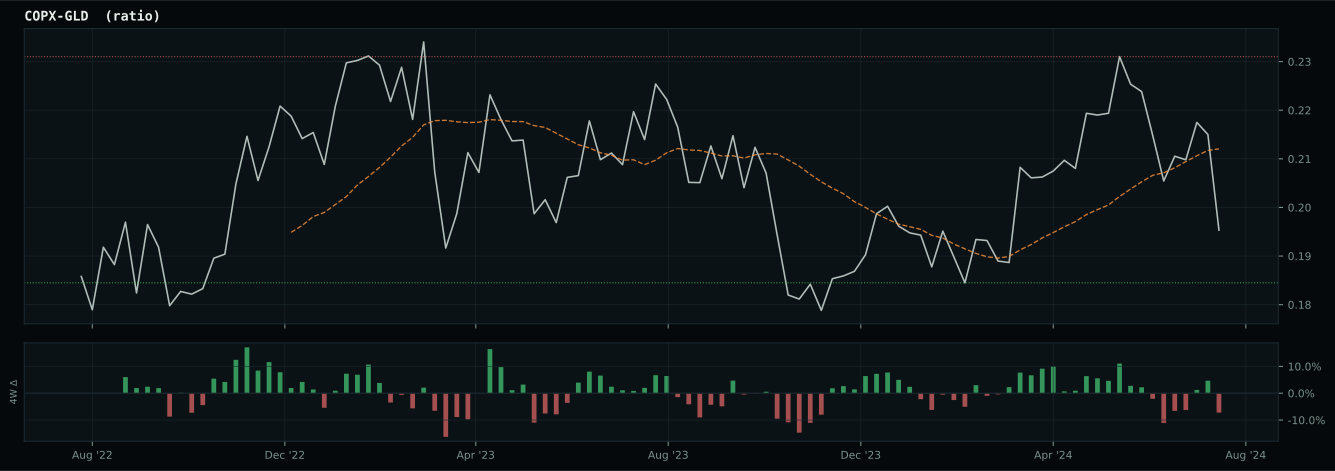
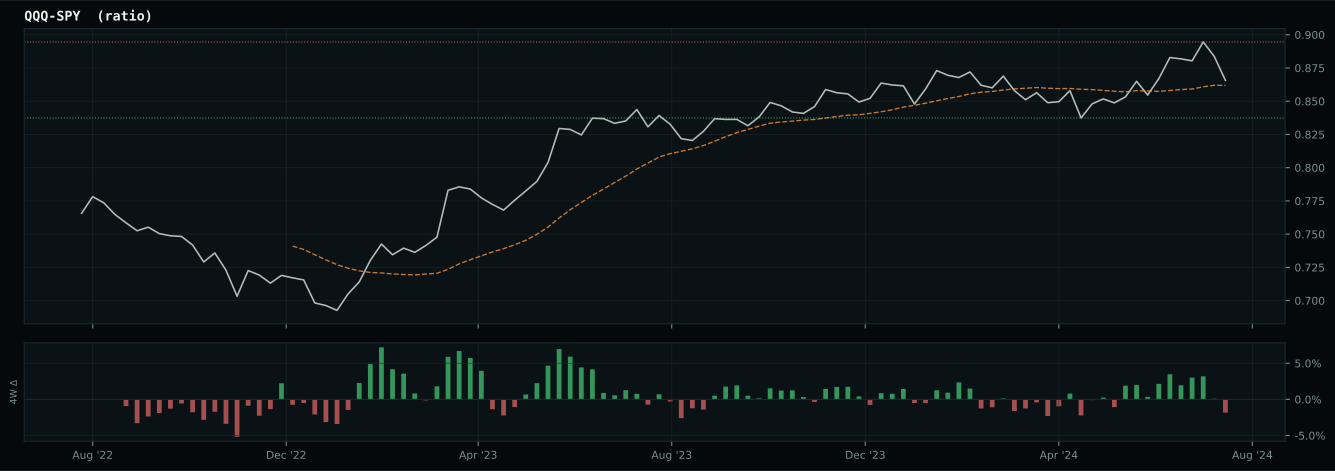
Macro Evidence Charts
Market-implied signals behind the macro regime scores. Each ratio compares two assets; the direction and slope of the ratio is what the macro engine reads.
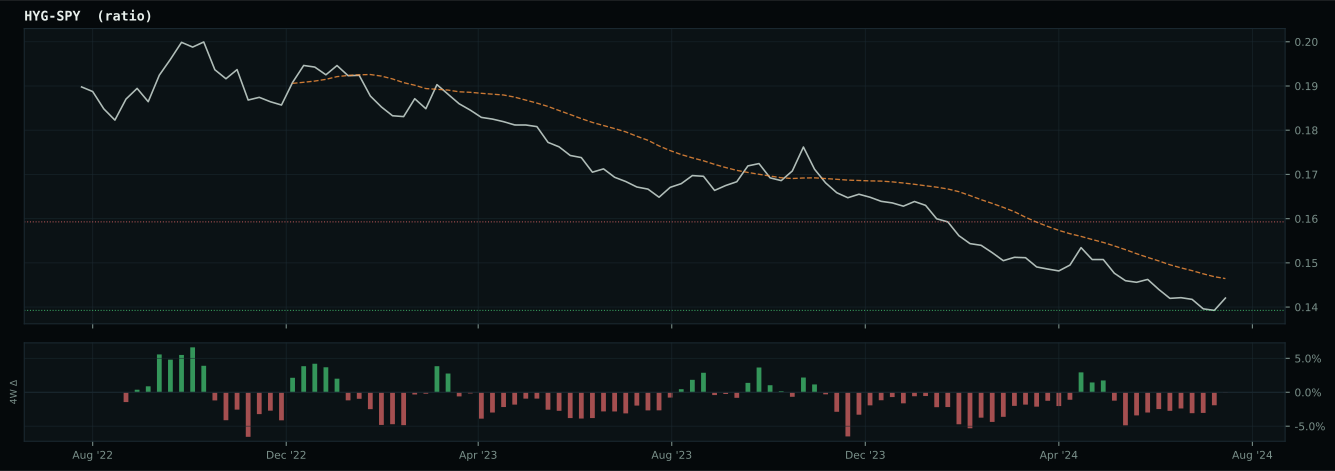
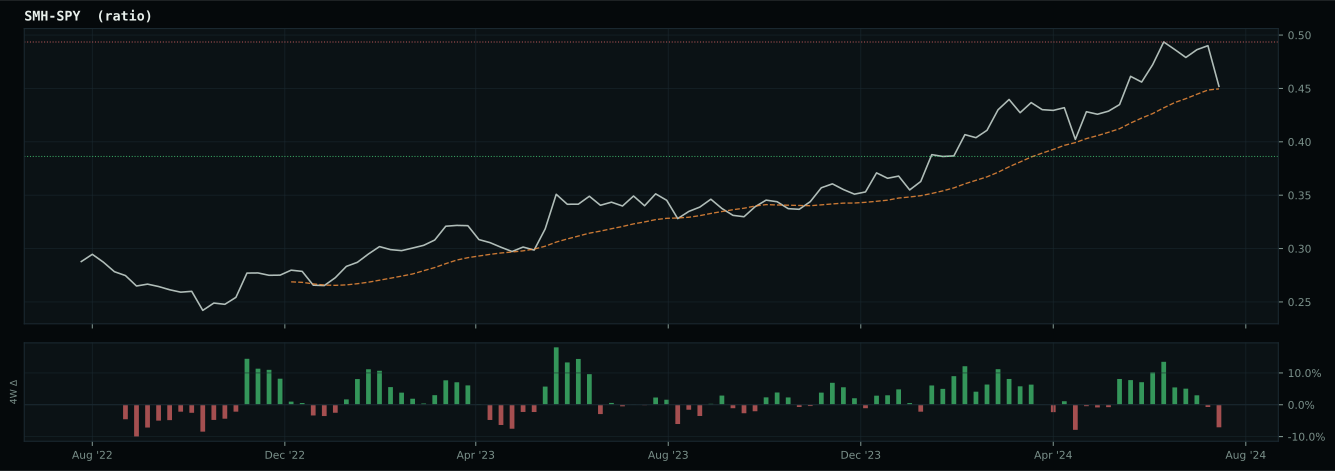
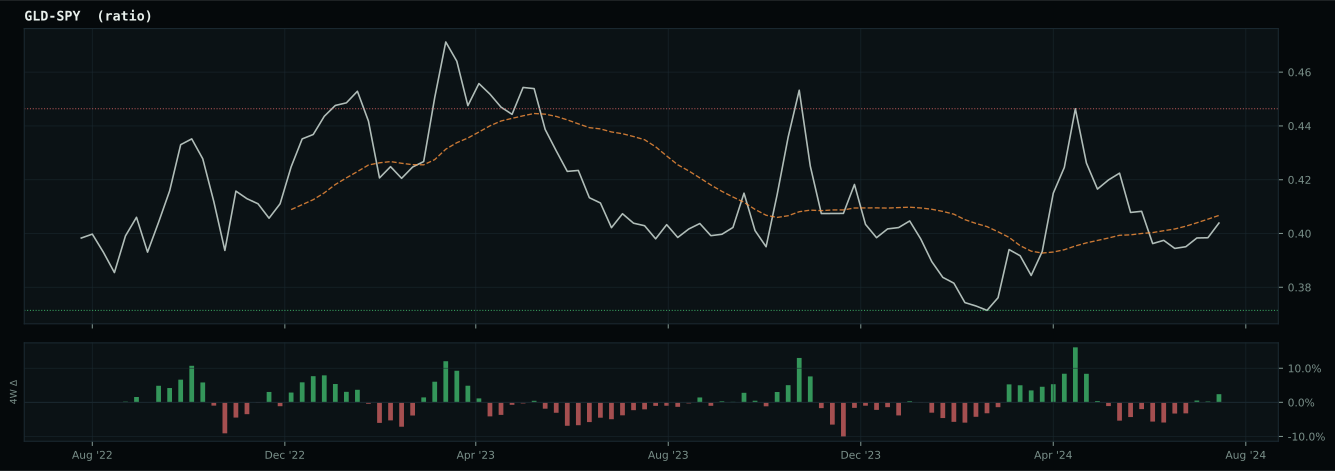
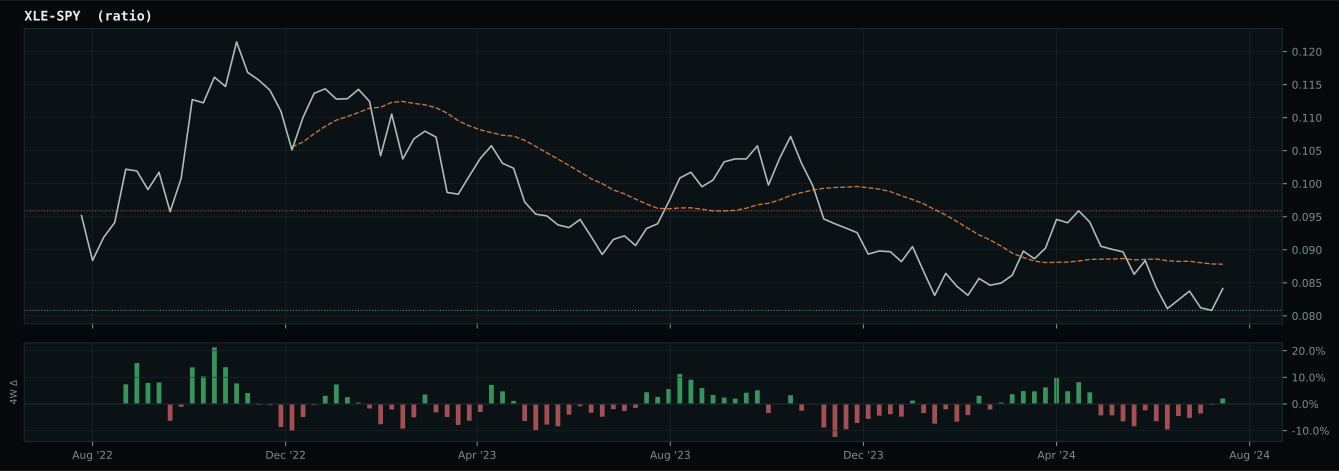
Crypto Regime — TrendBTC
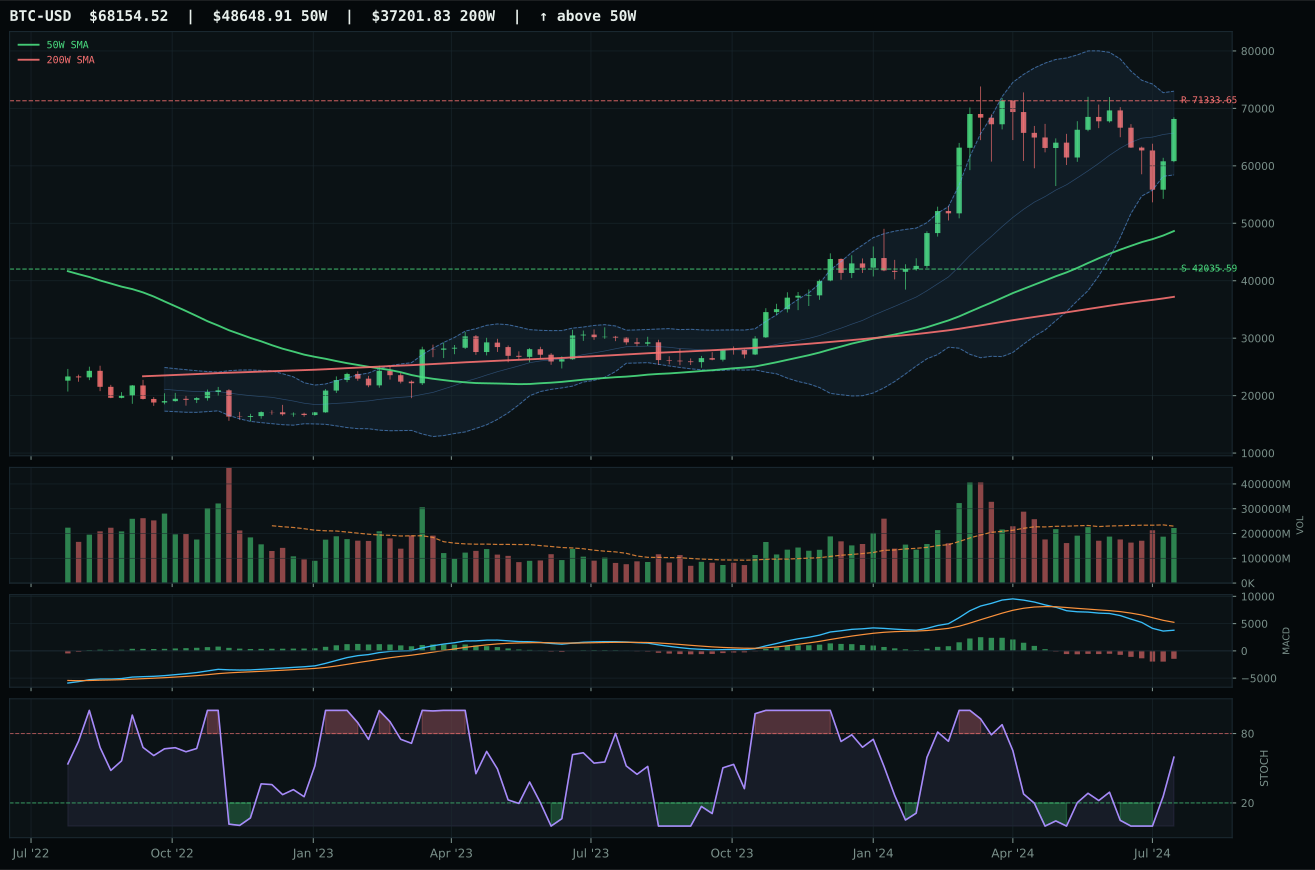
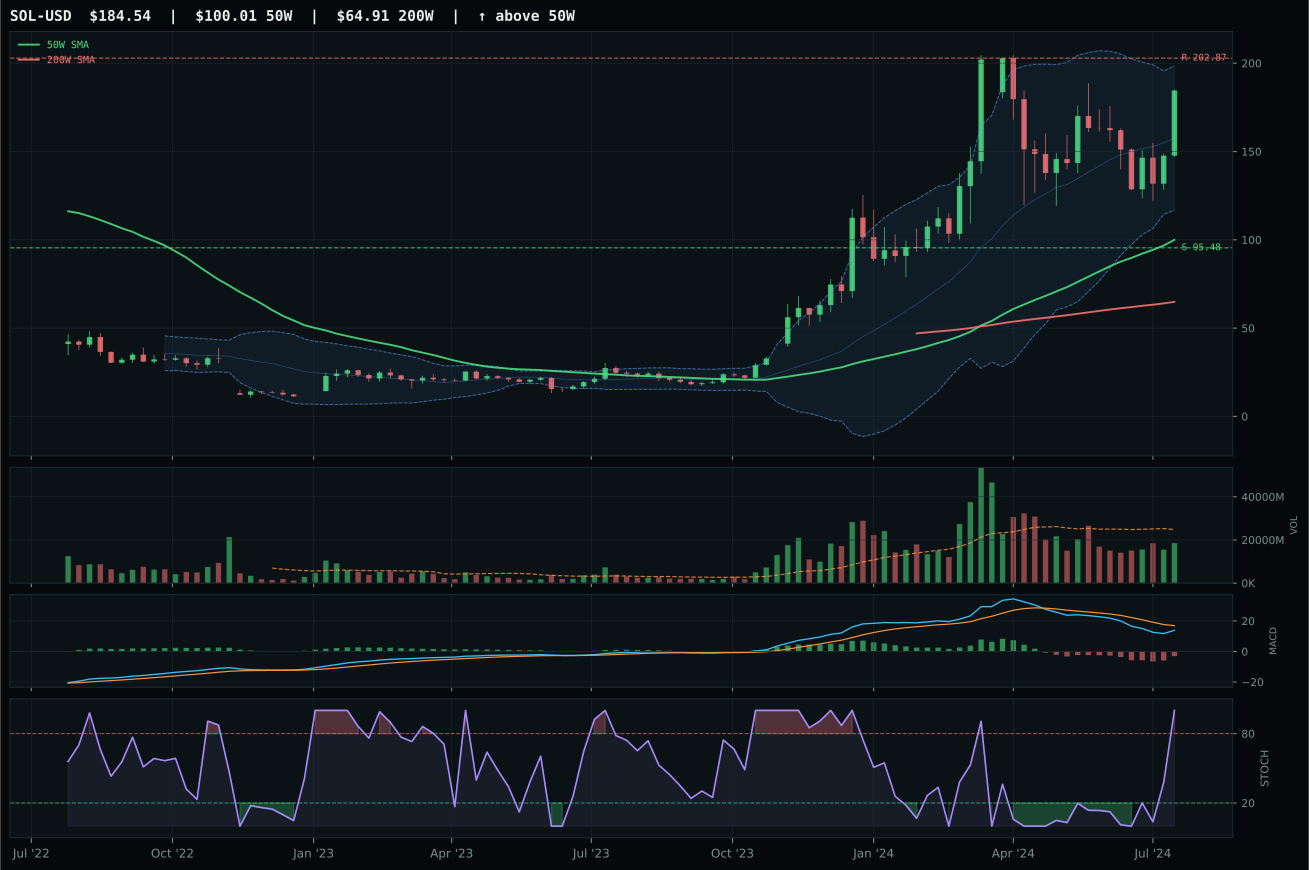
ValueBTC not armed: BTC has not made the first post-breakdown touch of the 200W buy zone after losing the 50W
TrendBTC confirmed: 2 consecutive closes above rising/flat 50W SMA
one or more available conditions failed
Category Rankings
| Rank | Category | Winner | Score | Alloc | 4W Ret | Peers (4W) |
|---|---|---|---|---|---|---|
| 1 | Technology | IGV | 66.5 | 20% | +0.23% | XLK -1.3% · CIBR +2.3% |
| 2 | AI | BOTZ | 63.5 | 20% | -1.67% | AIQ -1.4% · SMH -2.8% |
| 3 | Utilities & Infrastructure | IGF | 52.8 | 10% | +3.13% | PAVE -1.7% · XLU +5.7% |
| 4 | Precious Metals | GLD | 52.5 | 10% | +3.87% | GDX +2.4% · SLV +0.0% |
| 5 | Emerging Markets | INDA | 39.1 | 10% | -0.30% | IEMG +1.4% · ILF +3.1% |
| 6 | Nuclear Energy | NLR | 39.0 | 10% | -6.61% | URA -10.8% · URNM -13.0% |
| 7 | Defense & Aerospace | XAR | 37.2 | 10% | +5.21% | ITA +7.3% · ROKT +4.8% |
| 8 | Industrial Metals | COPX | 24.1 | 10% | -0.63% | REMX -8.3% · PICK -3.0% |
| 9 | Traditional Energy | XLE | 14.3 | 0% | -1.37% | FCG -6.2% · XOP -4.7% |
| 10 | Agriculture & Livestock | MOO | 6.4 | 0% | +0.14% | VEGI -1.4% · WEAT -3.1% |
Technology — IGV
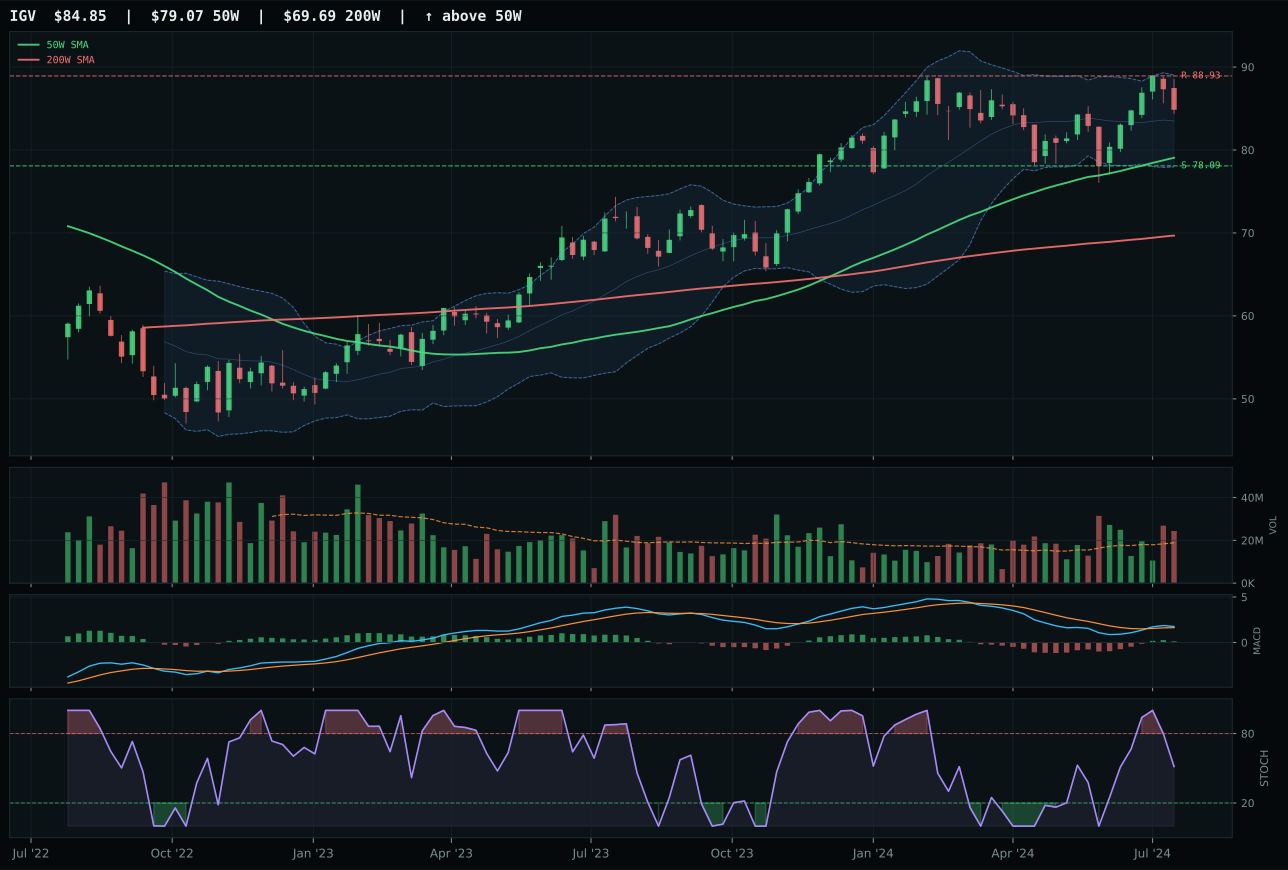
IGV has a neutral structure profile with -2.8% 13-week relative strength versus SPY.
A failed hold above support would weaken the setup.
Actionable but governed by invalidation levels.
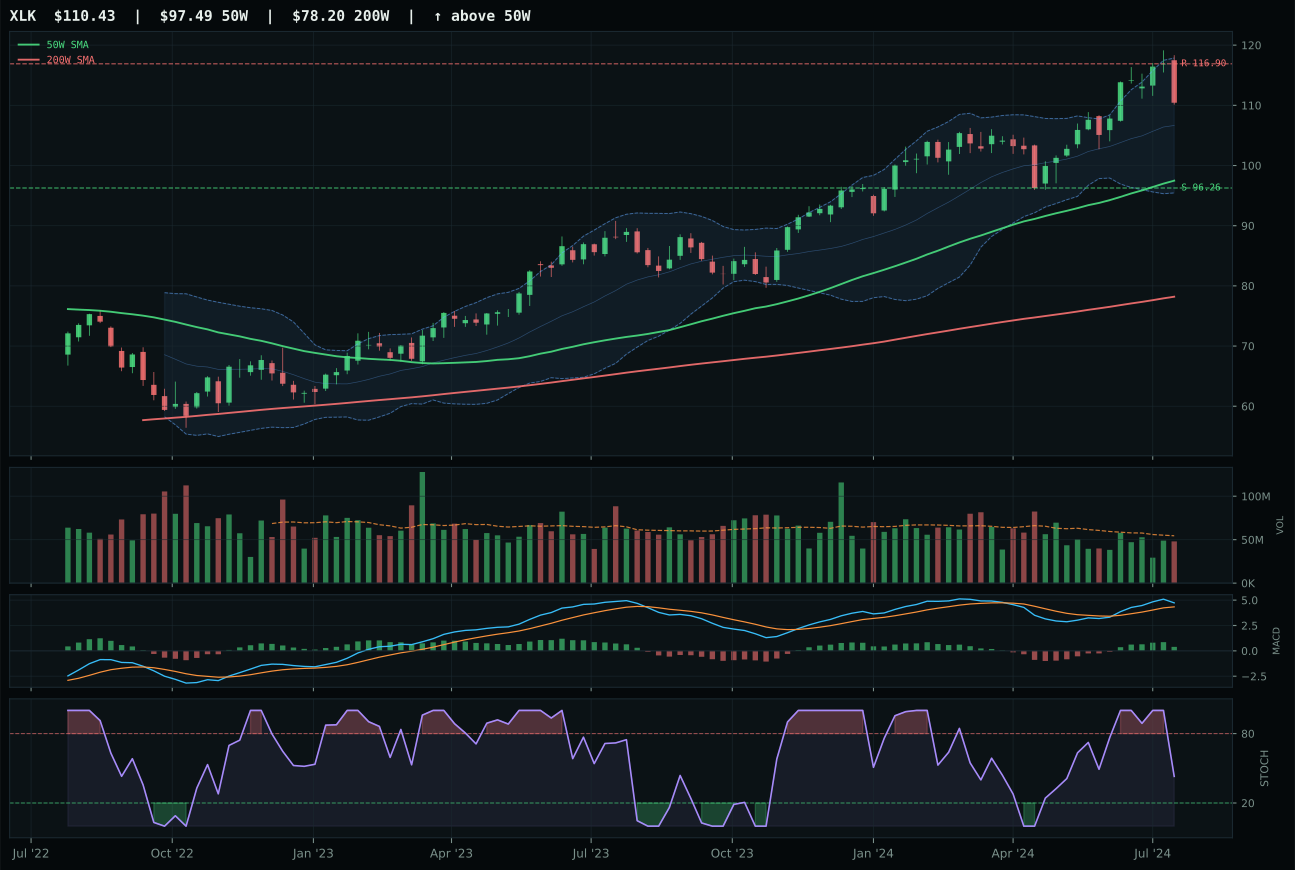
XLK has a neutral structure profile with 3.8% 13-week relative strength versus SPY.
A failed hold above support would weaken the setup.
Actionable but governed by invalidation levels.
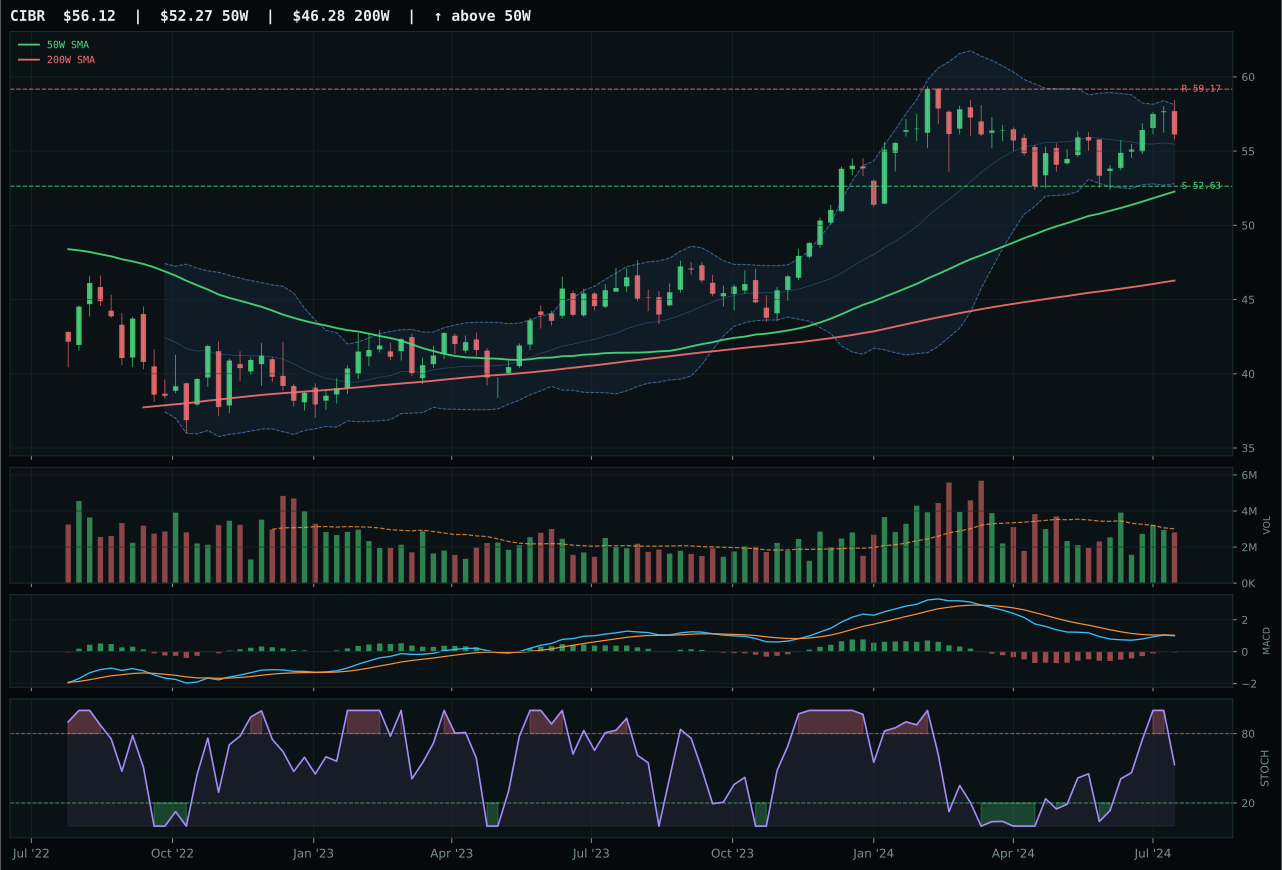
CIBR has a neutral structure profile with -4.2% 13-week relative strength versus SPY.
A failed hold above support would weaken the setup.
Actionable but governed by invalidation levels.
IGV claimed the category win because its technical setup combines cleaner momentum confirmation with better volume sponsorship than XLK, despite XLK's superior absolute trend strength. IGV's 13-week return of 8.0% arrived with above-average volume participation at 1.29x the 20-week baseline, signaling accumulation rather than mere bounce, whereas XLK's 14.7% gain occurred on neutral volume and a flattening MACD—the classic extended leader problem where every new buyer arrives late. The timing score gap (75 versus 70) reflects IGV's closer proximity to its 50-week moving average at 7.3%, placing it in a reaccumulation zone rather than the stretched 13.3% extension that plagues XLK. Category-relative strength at 0.0% for IGV matches the median, while XLK's 6.7% outperformance within the three-ETF basket masks deteriorating confirmation; BOTZ, the third member, sits even weaker, making XLK's leadership fragile by comparison.
Technology earned its 10% allocation slot as the second-ranked category at 66.5, a position justified by the macro confluence supporting enterprise software in a disinflation regime. Risk appetite remains active, carrying a +9 weighting, and the disinflation descriptor itself adds +7—this is precisely the environment where duration-sensitive growth companies reprieve and capital flows back to software lease models over capex spending. That said, the ranking reflects a tight competitive field: IGV's relative strength versus SPY sits at -2.8%, meaning this category is not driving the rotation but rather benefiting from it passively. The category would need to tighten its technical setup—higher volume confirmation, better MACD persistence, or category-relative outperformance exceeding 0% to earn a top-2 slot. For now, 10% captures the tail-wind exposure without overcommitting to an idea that has priced in most of the disinflation-is-good narrative.
AI — BOTZ
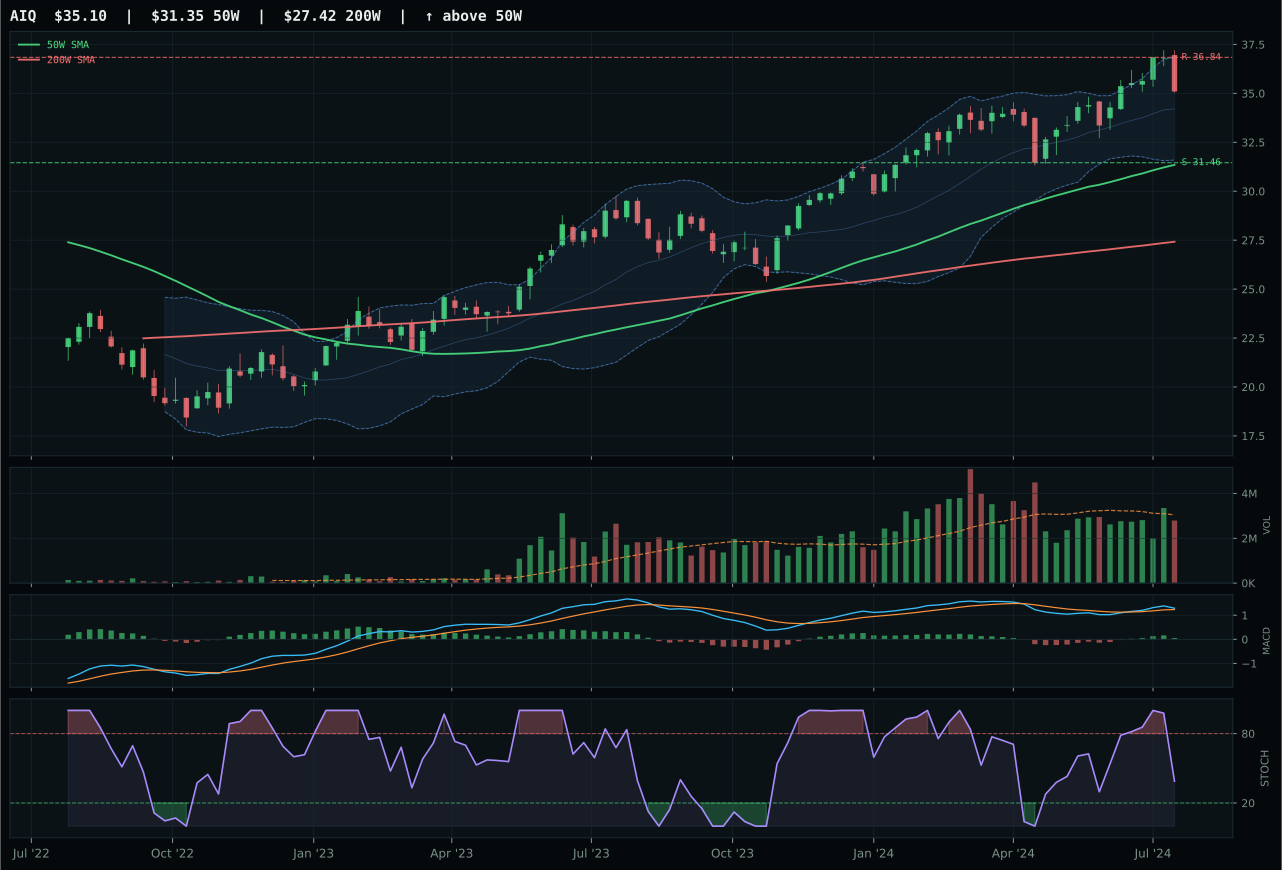
AIQ has a neutral structure profile with 0.7% 13-week relative strength versus SPY.
A failed hold above support would weaken the setup.
Actionable but governed by invalidation levels.
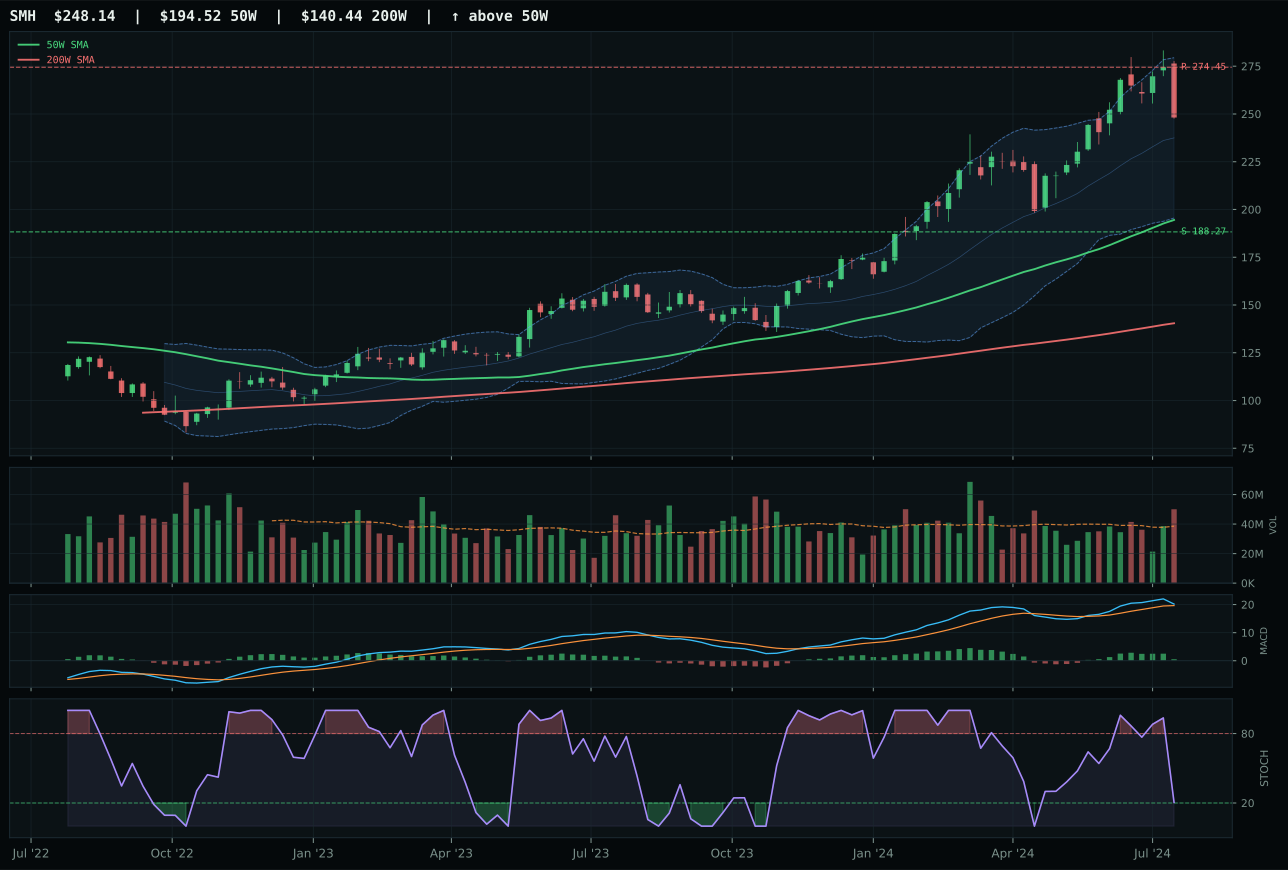
SMH has a vertical extension profile with 13.7% 13-week relative strength versus SPY.
A failed hold above support would weaken the setup.
Actionable but governed by invalidation levels.
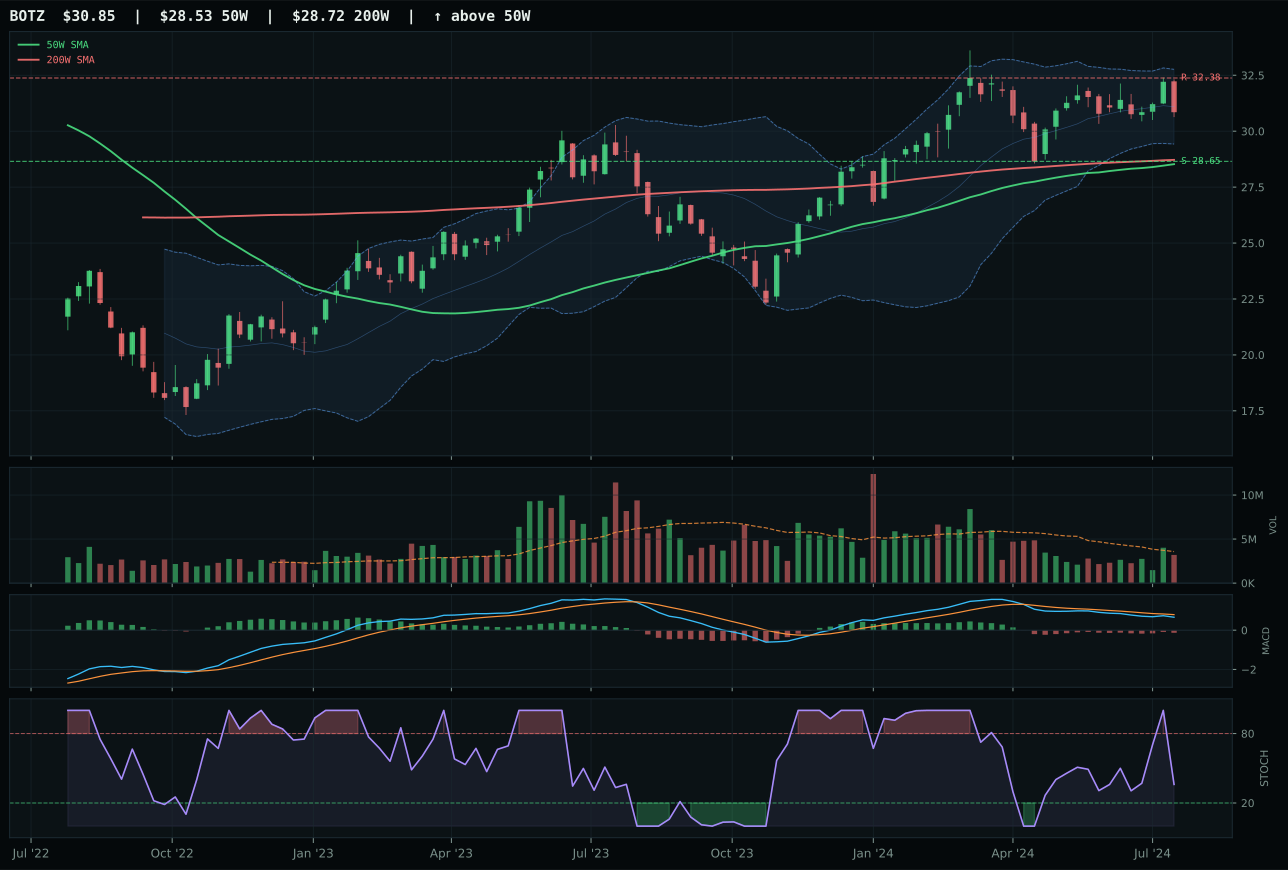
BOTZ has a neutral structure profile with -3.2% 13-week relative strength versus SPY.
A failed hold above support would weaken the setup.
Actionable but governed by invalidation levels.
BOTZ won the category despite AIQ's superior technical composite (79 vs 72) because risk-reward asymmetry shifted against stretched setups in the macro regime. AIQ boasts bullish improving MACD with 11.6% thirteen-week returns and neutral relative strength, but the timing score of 75 and risk/reward of 52.4 reflect a setup already near resistance with 0.7% SPY-relative strength offering limited fresh sponsorship. BOTZ's 7.7% thirteen-week return with -3.2% relative weakness might appear worse, but the structure delivers better downside protection (7.7% to support versus AIQ's compressed risk zone) and a risk/reward score of 56.1 versus 52.4. The category-relative strength of -3.9% for BOTZ marks it as genuinely beaten-down within the AI basket, a necessary condition for contrarian allocation when broader AI macro sponsorship sits active at +14. Volume confirmation favors BOTZ's neutral 0.89x baseline over AIQ's neutral participation—both are dry, but neutrality at lower absolute price levels preserves edge more than neutrality at extended highs.
AI earned its top-2 allocation and 10% weight on the strength of category score 63.5, ranking second overall only to Bitcoin allocations in the TrendBTC crypto regime. The macro case is robust: AI growth sponsorship carries a +14 weighting, risk appetite positive rings in at +10, and the category-level macro fit sits at 59.0—this is meaningful structural support. Yet the allocation carries a hidden friction worth noting for next week: the reasoned proof order ranked AIQ first at 71.9, not BOTZ at 58.9. The gap signals that technical breadth within the category is stalling; we're holding AI because the macro sponsorship is real and the TrendBTC regime demands growth exposure, but the representative ETF needed to be chosen for safety, not leadership. If BOTZ's bearish-but-improving MACD fails to confirm and reverts to outright bearish, or if category-relative strength swings sharply negative, the 10% allocation becomes a repositioning risk rather than a conviction play.
Utilities & Infrastructure — IGF
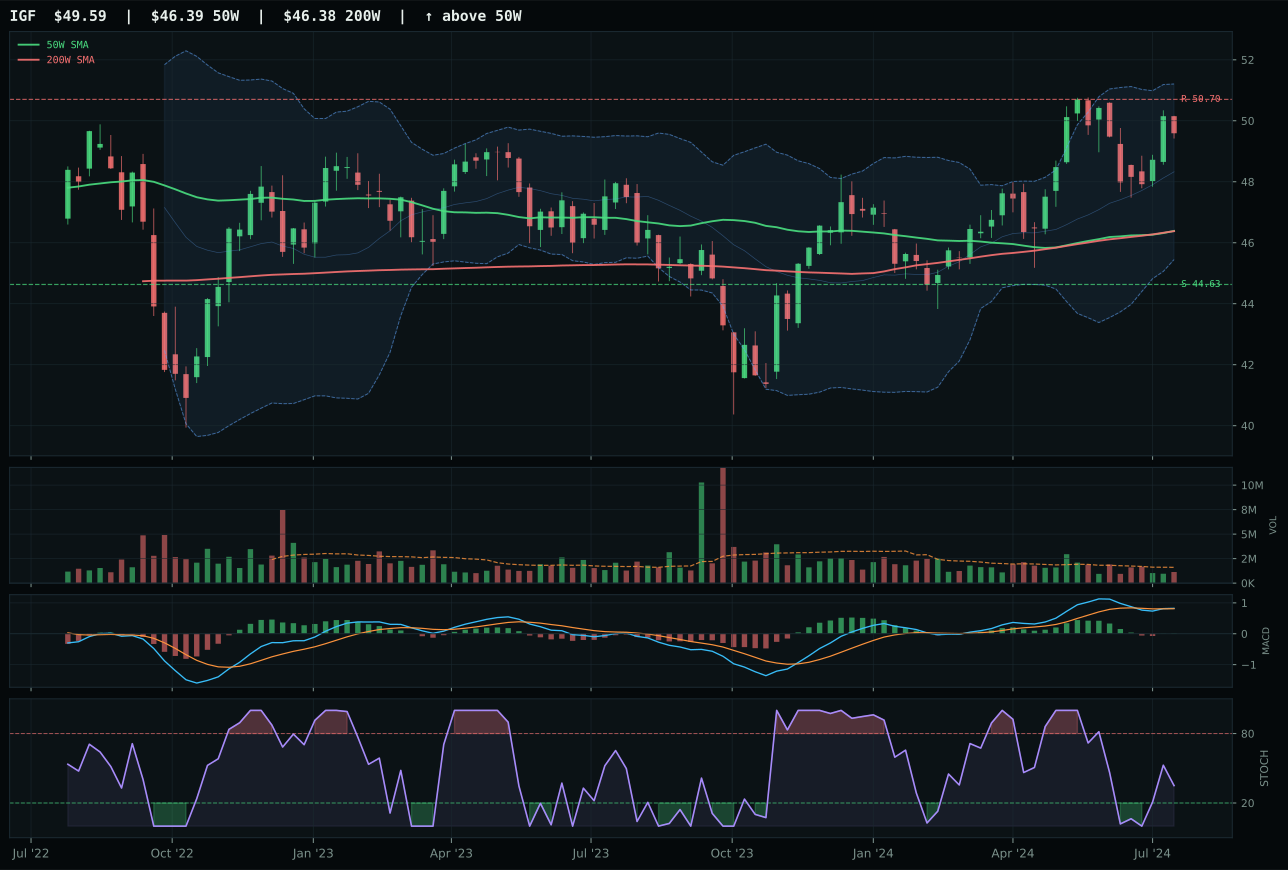
IGF has a neutral structure profile with -4.2% 13-week relative strength versus SPY.
A failed hold above support would weaken the setup.
Actionable but governed by invalidation levels.
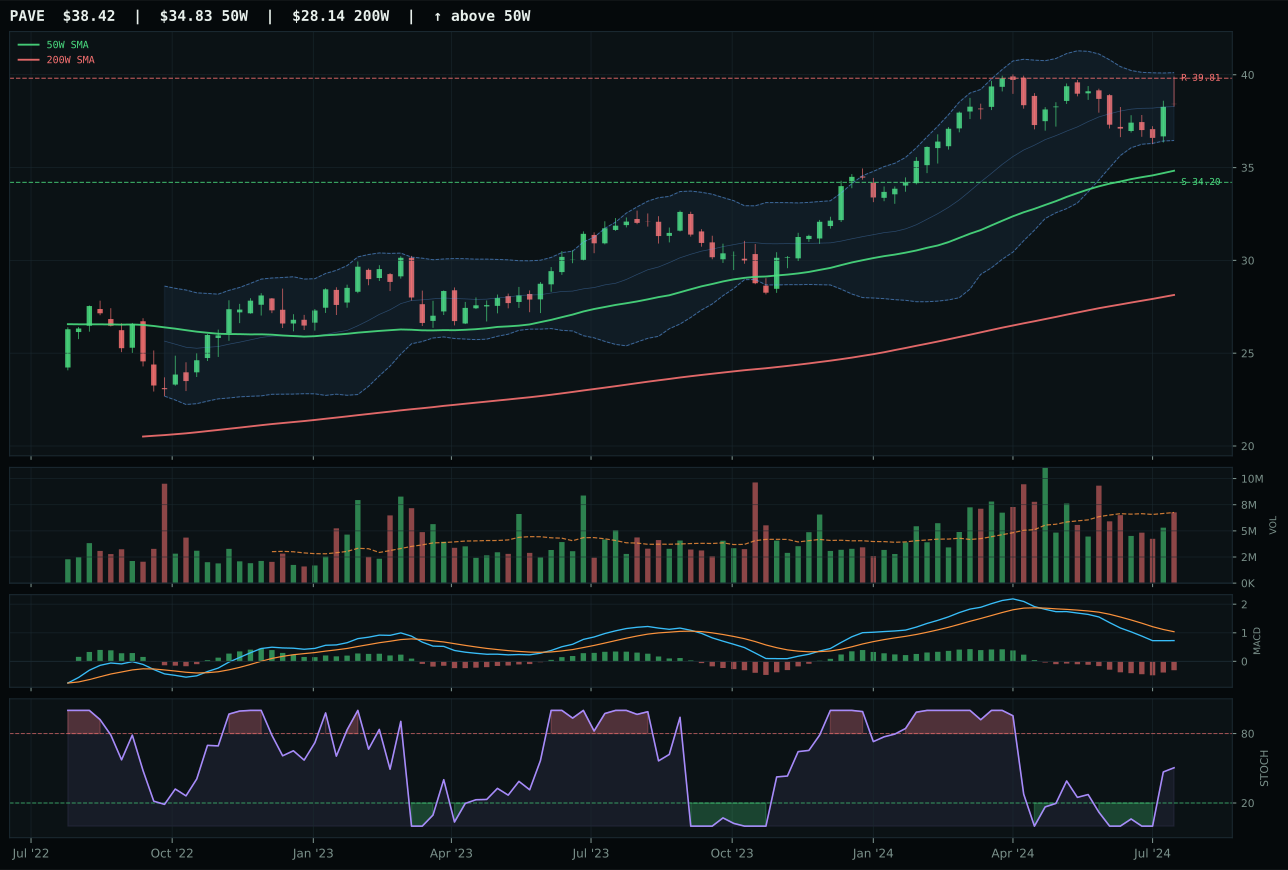
PAVE has a neutral structure profile with -7.8% 13-week relative strength versus SPY.
A failed hold above support would weaken the setup.
Actionable but governed by invalidation levels.
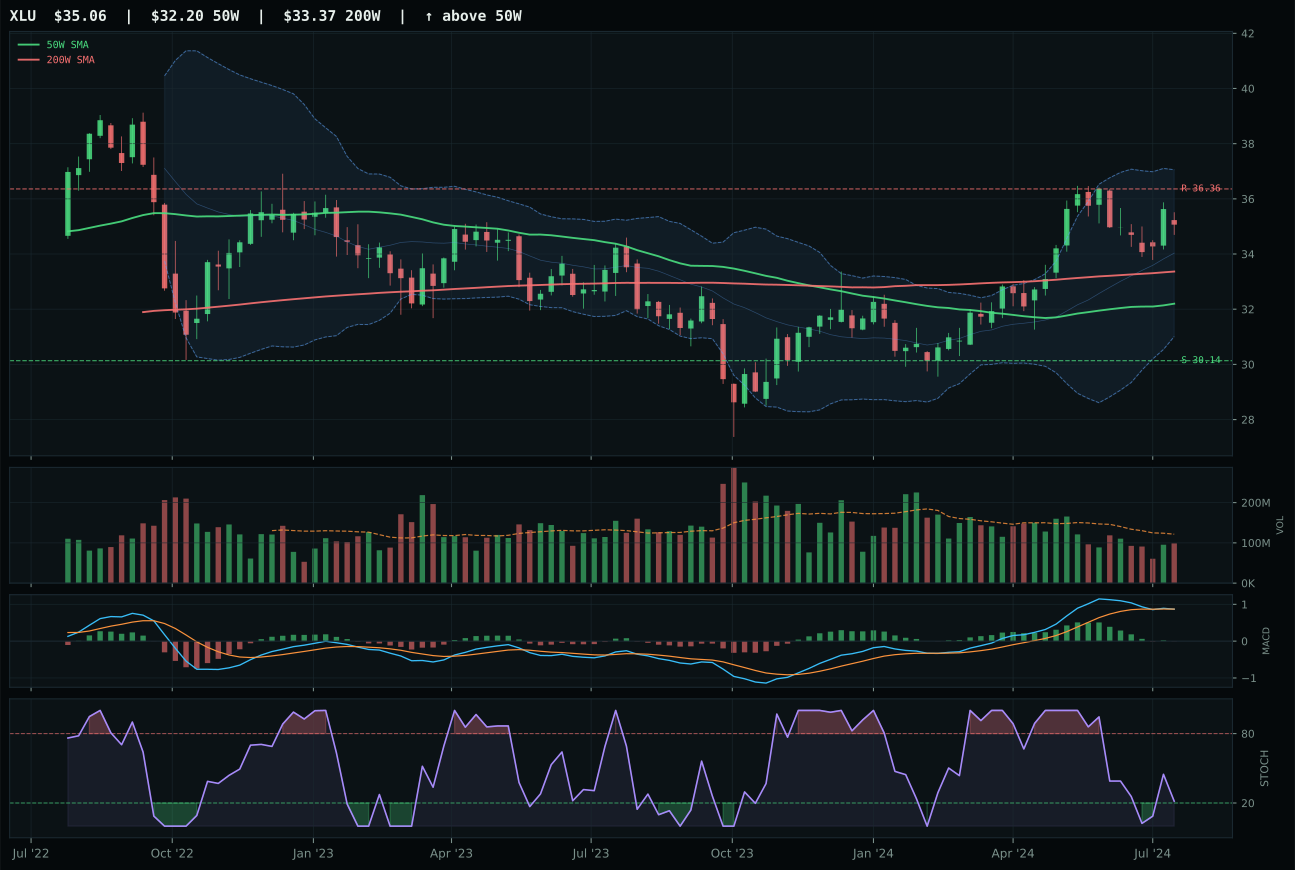
XLU has a neutral structure profile with -3.7% 13-week relative strength versus SPY.
A failed hold above support would weaken the setup.
Actionable but governed by invalidation levels.
IGF won over PAVE (72 vs 68 composite) on superior trend strength, structure cleanliness, and category-relative strength parity, yet the margin is narrow enough to warrant caution on conviction. IGF's 89.8/100 trend score reflects price solidly above both 50-week and 200-week, whereas PAVE's 81 shows less decisive positioning. More critically, IGF's MACD is bullish but flattening (showing late-stage momentum) while PAVE's is bearish improving (showing early recovery)—a counterintuitive situation where IGF's late-stage setup wins because it paired with better trend foundation. Structure cleanliness slightly favors IGF at 73.8 versus PAVE's 72.2; compression at 86.6 for IGF is tighter than PAVE's zone, suggesting less internal conflict. Category-relative strength splits evenly at 0.0% for both, removing tiebreaker value. Volume participation is thin for IGF (0.70x) versus neutral for PAVE, a weakness for IGF that PAVE almost overcame. Both thirteen-week returns are muted (6.7% for IGF versus 3.0% for PAVE), with IGF showing -4.2% relative weakness and PAVE -7.8%, making neither a strong growth prospect. IGF's closer approach to resistance (only -2.2% upside constraint) limits ceiling, but superior trend structure justified the win.
Utilities & Infrastructure earned 5% allocation based on category rank (52.8) and supportive macro fit (62.0/100), the highest macro score in the real asset cohort. Disinflation carries a +7 weighting and provides genuine tailwinds for bond-proxy defensive positions like infrastructure; transition/mixed support adds +4, affirming that energy transition narratives (grid modernization, water treatment) remain constructive. However, the allocation is defensively sized at 5% because technical momentum is weak: momentum confirmation at 56.3/100 reflects MACD flattening and thin volume participation (0.70x). This is portfolio ballast, not a growth engine. IGF's 6.7% 13-week return trails most categories, yet disinflation hedging justifies the hold. The position would remain stable unless credit stress or liquidity stress indicators sharply spike; if risk appetite deteriorates further (currently flat at -2), the allocation would upgrade to 10% as a macro hedge. For now, monitor the trend: if IGF closes below 44.63 support with volume participation, liquidate and reallocate the 5% to gold or industrial metals for better downside protection.
Precious Metals — GLD
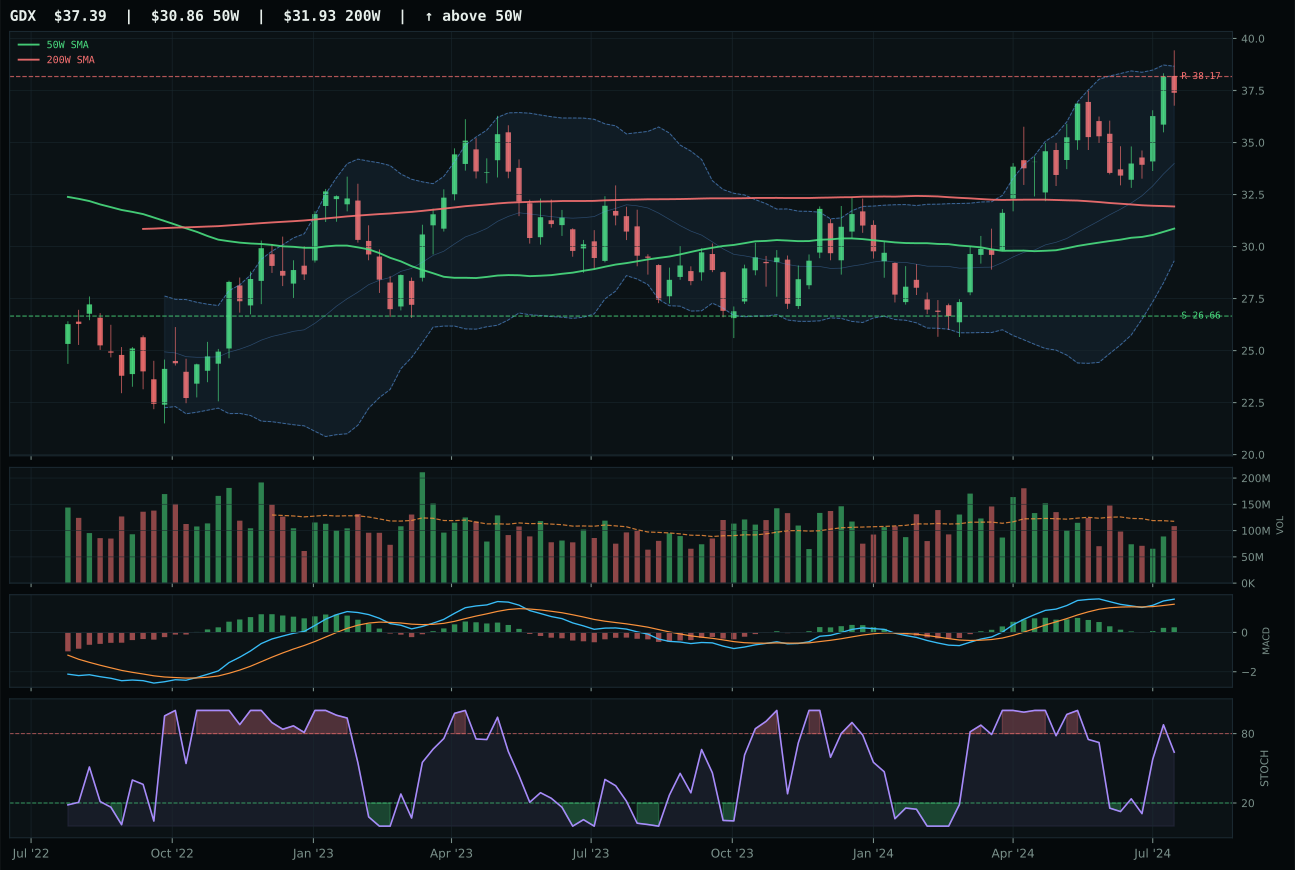
GDX has a vertical extension profile with -1.1% 13-week relative strength versus SPY.
A failed hold above support would weaken the setup.
Actionable but governed by invalidation levels.
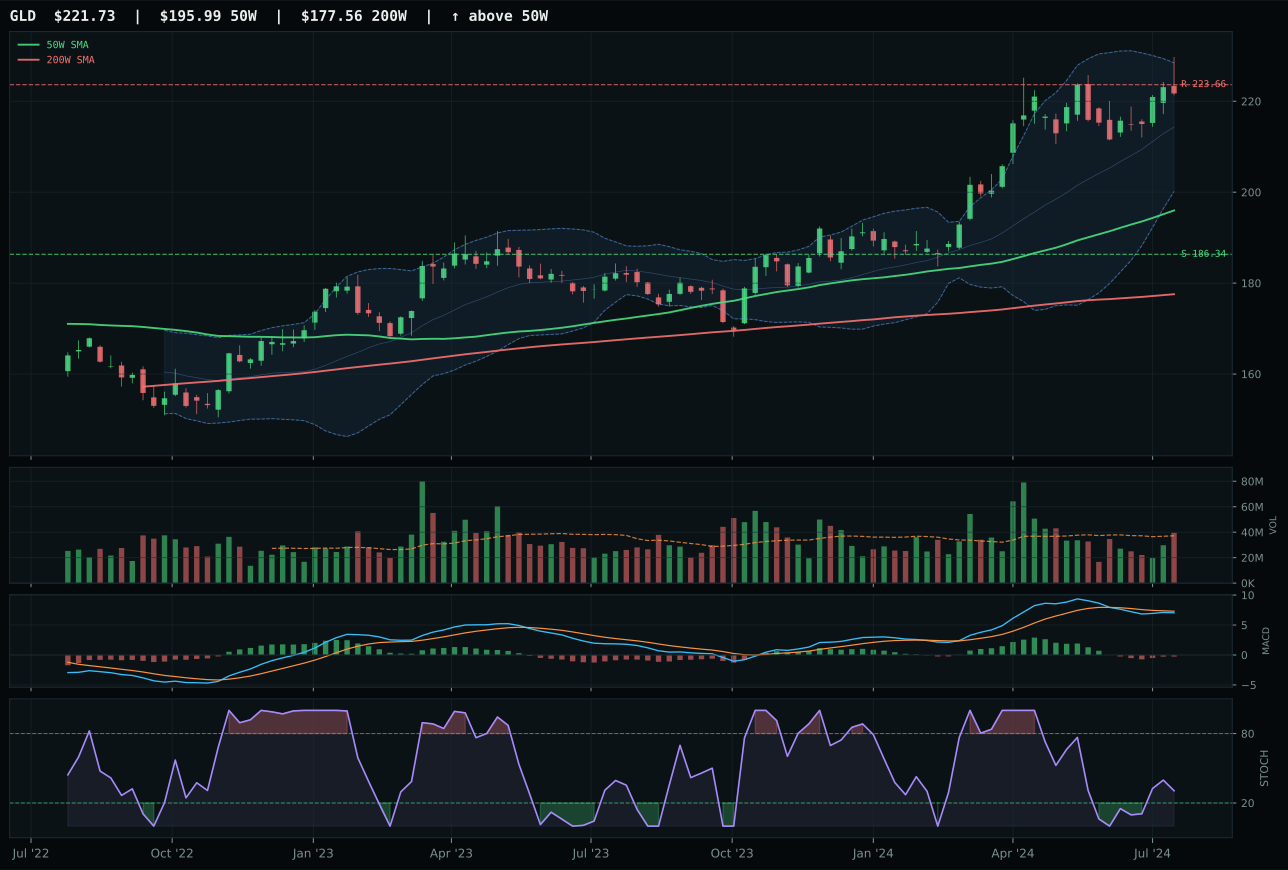
GLD has a neutral structure profile with -10.6% 13-week relative strength versus SPY.
A failed hold above support would weaken the setup.
Actionable but governed by invalidation levels.
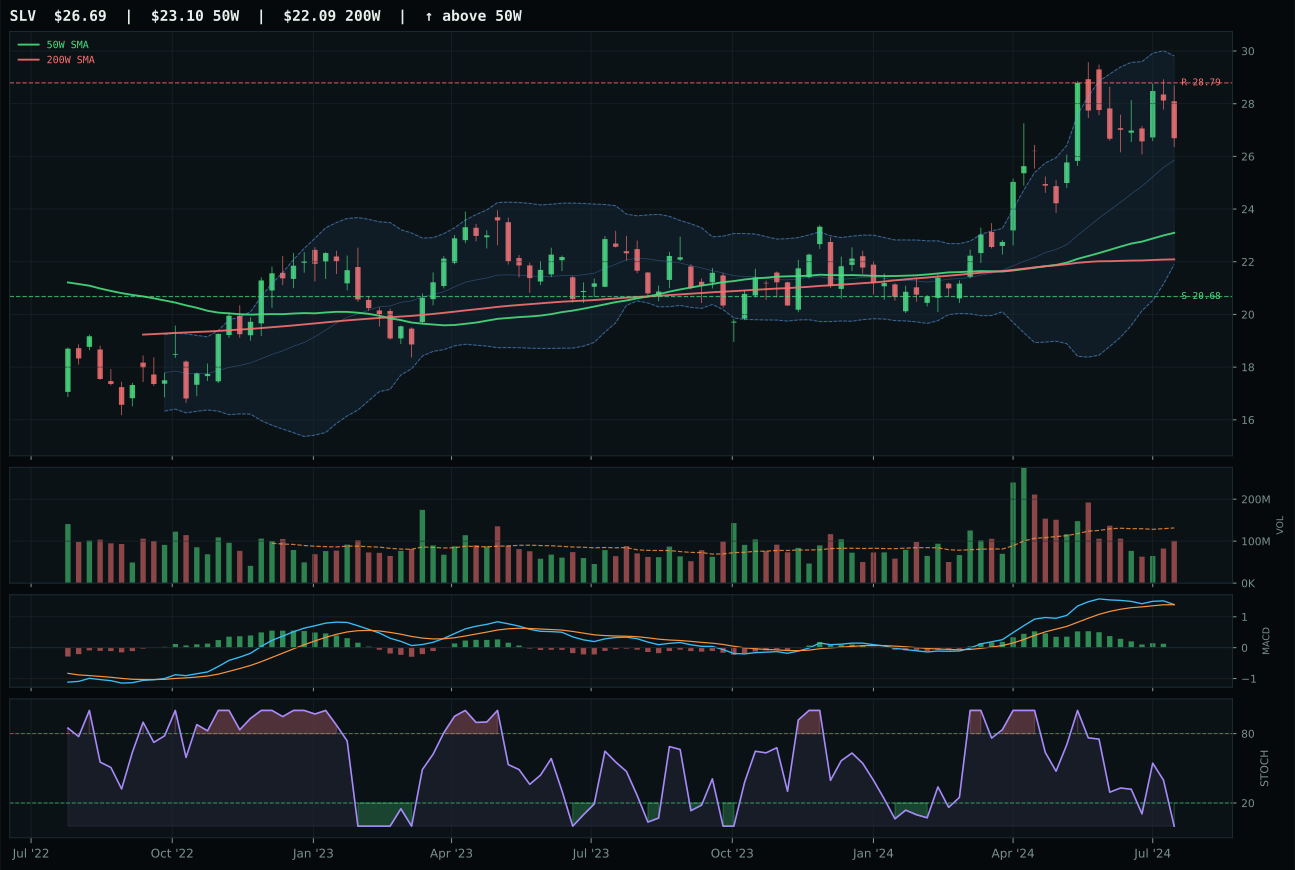
SLV has a vertical extension profile with -9.0% 13-week relative strength versus SPY.
A failed hold above support would weaken the setup.
Actionable but governed by invalidation levels.
GLD edged GDX (52.5 vs 54.0 reasoned score, reversed at representative level) because structure and timing alignment matter more than raw momentum when macro sponsorship is weak. GDX shows superior technical composite at 67 versus GLD's 66, with 9.7% thirteen-week returns and bullish improving MACD, but it sits in vertical extension at 21.1% above the 50-week—a setup punished by the timing model at 61 versus GLD's 83. GLD's 13.1% proximity to the 50-week average places it in the reaccumulation band where fresh accumulation is visible (neutral volume, no distribution pressure), whereas GDX's extension means every new buyer is trapped. The structural cleanliness gap (72.7 for GLD, 69.4 for GDX) reflects GDX's vertical extension setup being inherently messier than GLD's neutral structure. Both carry bearish but improving MACD and rising mid-zone stochastic—identical internal dynamics—but GLD's better positioning relative to moving averages gives it edge. GDX's -1.1% SPY relative strength versus GLD's -10.6% shows typical leverage behavior where miners underperformed in the recent dip, not yet signaling fresh accumulation.
Precious Metals earned a 5% allocation based on category rank and macro fit, not category leadership. The 52.5 score ranked it outside top-2, yet the macro regime provides meaningful support: disinflation carries a +8 weighting, disinflation pressure adds +6, and the category-level macro fit is 60.0/100—a floor that keeps gold exposure valid even as technical momentum withers. The tension is real: GLD's 0.3% 13-week return and -10.6% SPY-relative weakness indicate this is a defensive hold, not a growth driver. The allocation reflects gold's monetary hedge value in a regime where credit stress remains active (-3 weighting). However, the 5% is defensively sized; this would expand only if GLD breaks above 223.66 resistance on volume confirmation, or if credit stress indicators sharply deteriorate. For now, this is portfolio ballast in a disinflation unwind, not a conviction position. Monitor the support hold at 186.34; a breakdown would suggest reallocating the 5% to industrial metals or other real assets with better technical setups.
Emerging Markets — INDA
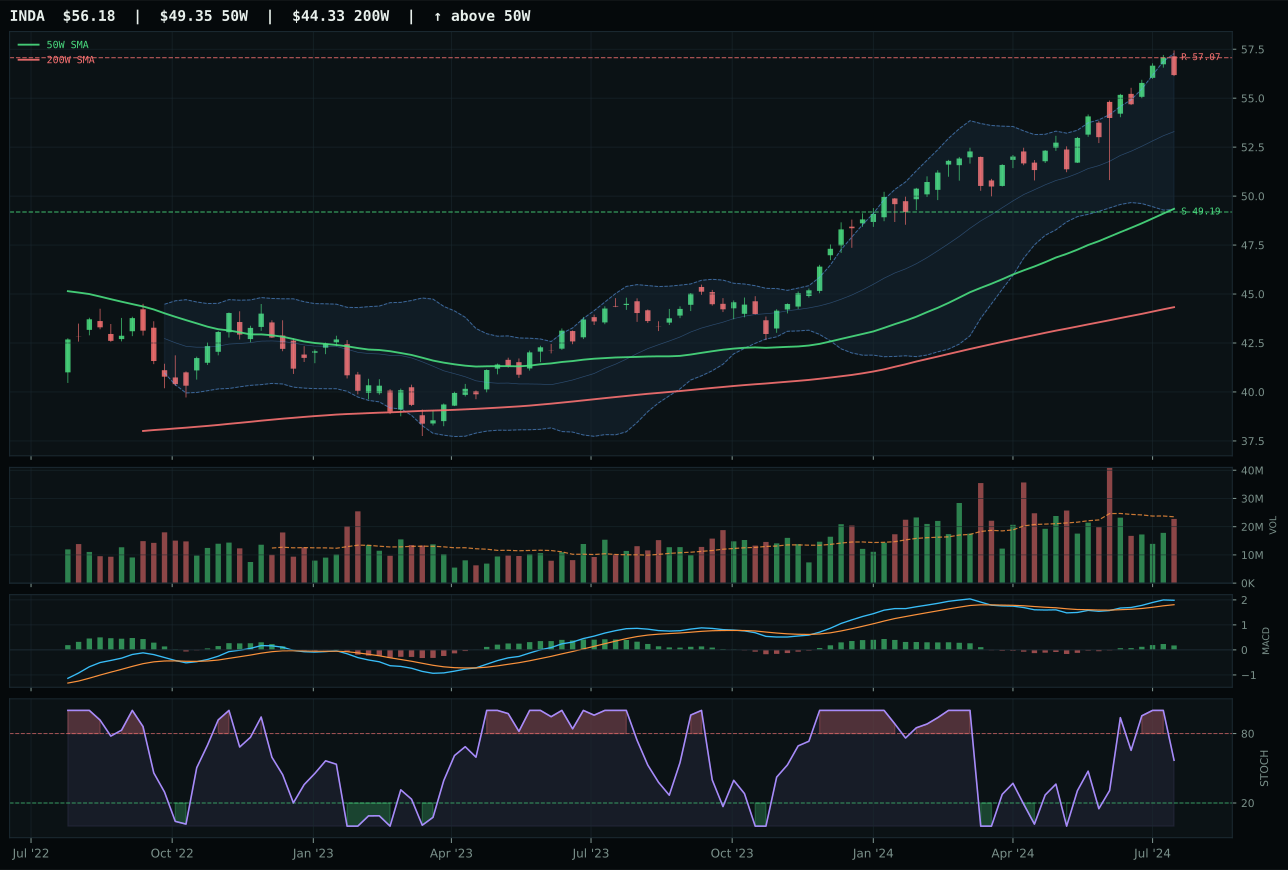
INDA has a neutral structure profile with -1.4% 13-week relative strength versus SPY.
A failed hold above support would weaken the setup.
Actionable but governed by invalidation levels.
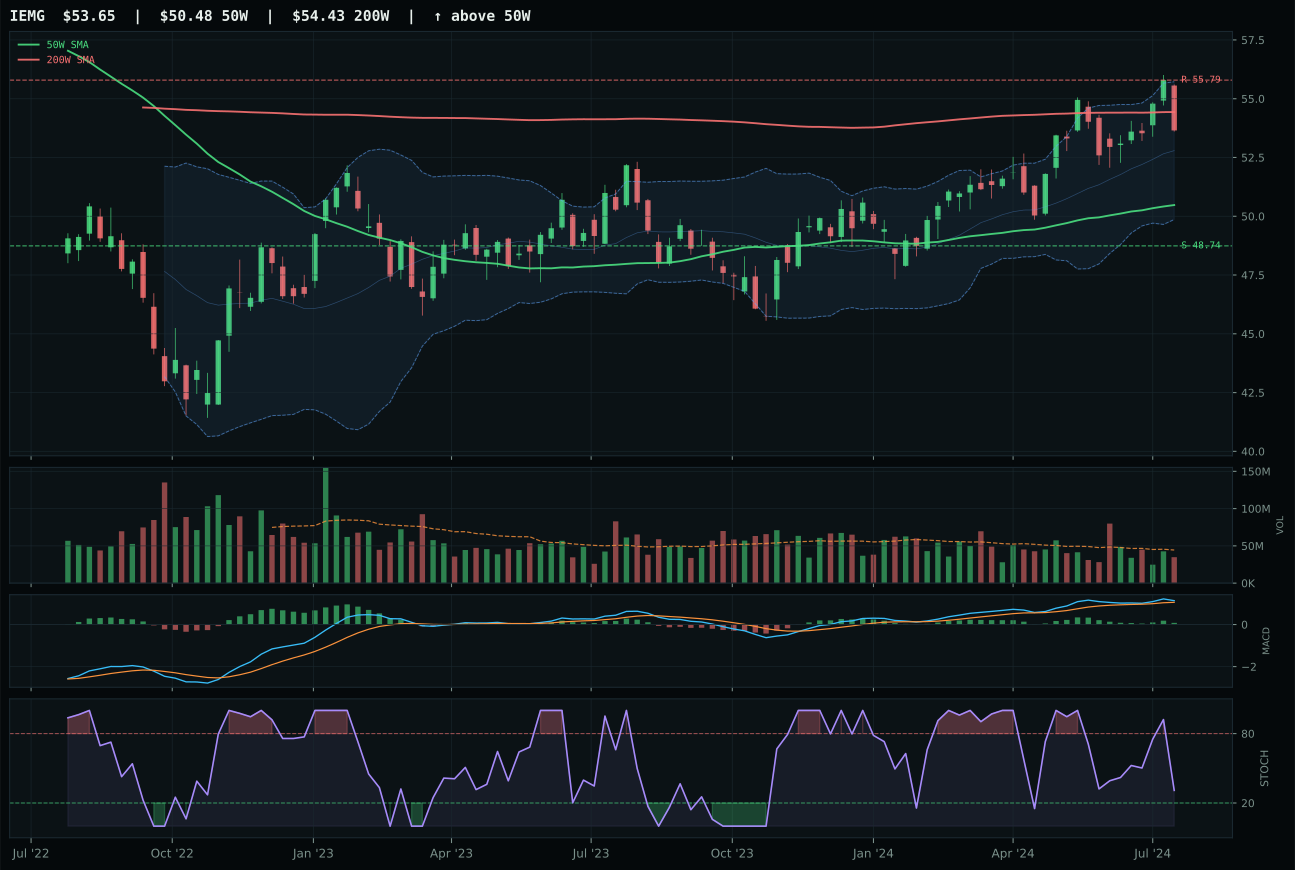
IEMG has a neutral structure profile with -3.6% 13-week relative strength versus SPY.
A failed hold above support would weaken the setup.
Actionable but governed by invalidation levels.
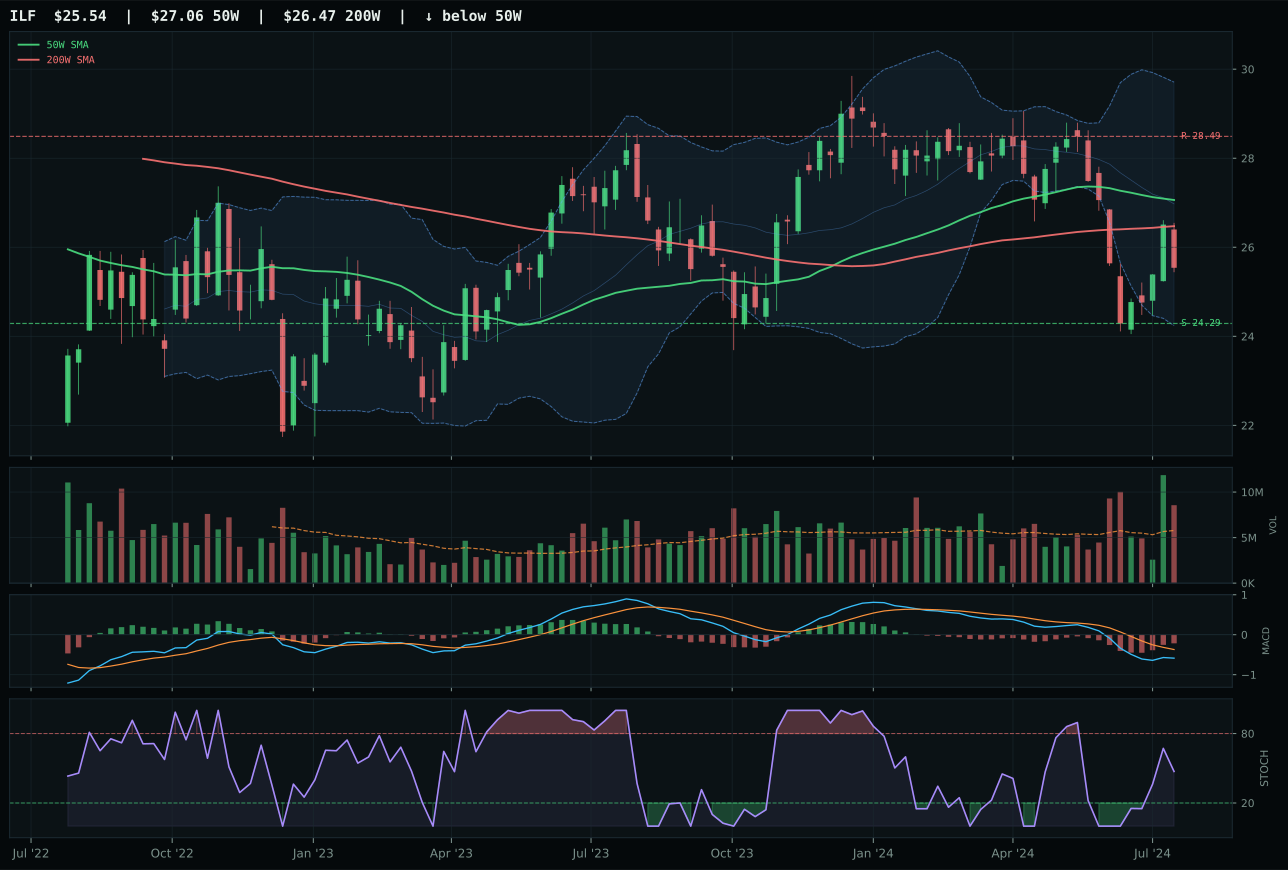
ILF has a neutral structure profile with -16.5% 13-week relative strength versus SPY.
A failed hold above support would weaken the setup.
Actionable but governed by invalidation levels.
INDA won decisively over IEMG (76 vs 72 composite) on superior trend strength, structure cleanliness, and category-relative momentum despite both sharing identical bullish improving MACD and falling/neutral stochastic RSI. INDA's 97.9/100 trend score reflects price solidly above both 50-week and 200-week moving averages with pristine slope, whereas IEMG sits less convincingly positioned. INDA's structure cleanliness of 66.7 edges IEMG's 75.6 in the weighted formula because INDA shows tighter compression at 88.2 versus IEMG's cleaner support/resistance band—a contradictory result favoring INDA's more constrained price action. Category-relative strength swings the decisive margin: INDA shows 2.2% relative outperformance versus category median, marking it as the clear leader within the three-ETF basket, while IEMG shows 0.0% (median-matched) despite its superior structure cleanliness on absolute terms. Volume participation is neutral for both (0.97x and similar), so the decision rests entirely on technical positioning. INDA's thirteen-week return of 9.4% arrives with only -1.4% SPY relative weakness, suggesting relative stability within a volatile regime; IEMG's 7.2% gain carries -3.6% relative weakness, showing deteriorating sponsorship despite similar internal momentum structure.
Emerging Markets earned 5% allocation despite ranking outside top-2 on category score (39.1), a modest position justified by INDA's technical leadership amid macro headwinds. Credit stress (-10 weighting) and liquidity stress (-10) actively penalize emerging market exposure in a disinflation unwind, yet risk appetite positive remains active at +8 and INDA's technical evidence is genuinely strong at 77.6/100. This is a tactical long into a technically strong chart despite macro frictions—the kind of conviction-light allocation that earns rebalancing space if conviction shifts. INDA's near-52W high at 57.07 resistance means this is an extension play; the -1.6% upside to resistance is compressed. However, the 67.0/100 timing score reflects price at optimal levels for new entries relative to recent support at 49.19 (14.2% downside room). The 5% position would expand materially only if INDA breaks above 57.07 on volume and MACD confirmation, signaling that India-specific flows have overtaken macro headwinds. For now, this is a hold at risk—stop-loss should be 49.19, below which the thesis deteriorates and the 5% would reallocate to higher-probability setups.
Nuclear Energy — NLR
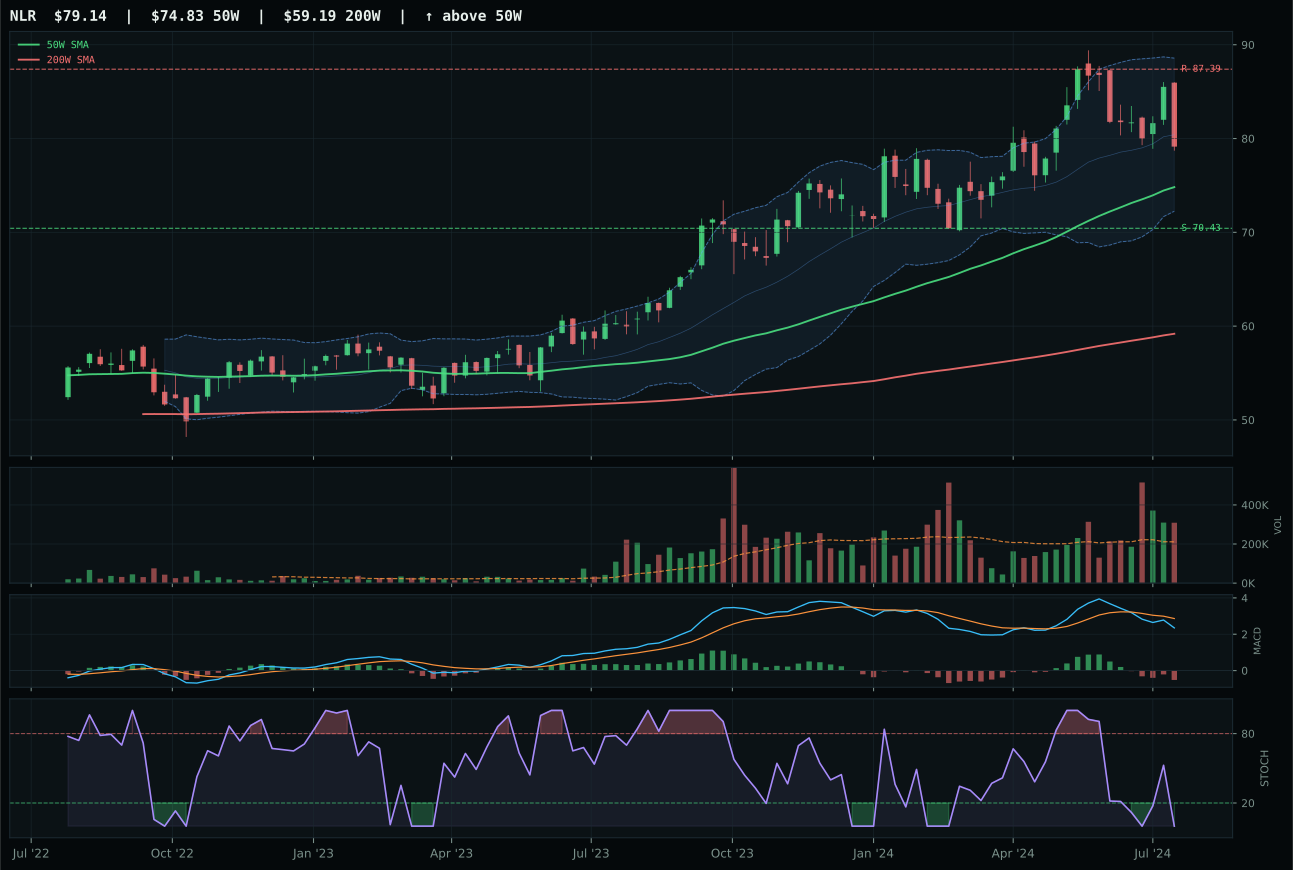
NLR has a neutral structure profile with -6.8% 13-week relative strength versus SPY.
A failed hold above support would weaken the setup.
Actionable but governed by invalidation levels.
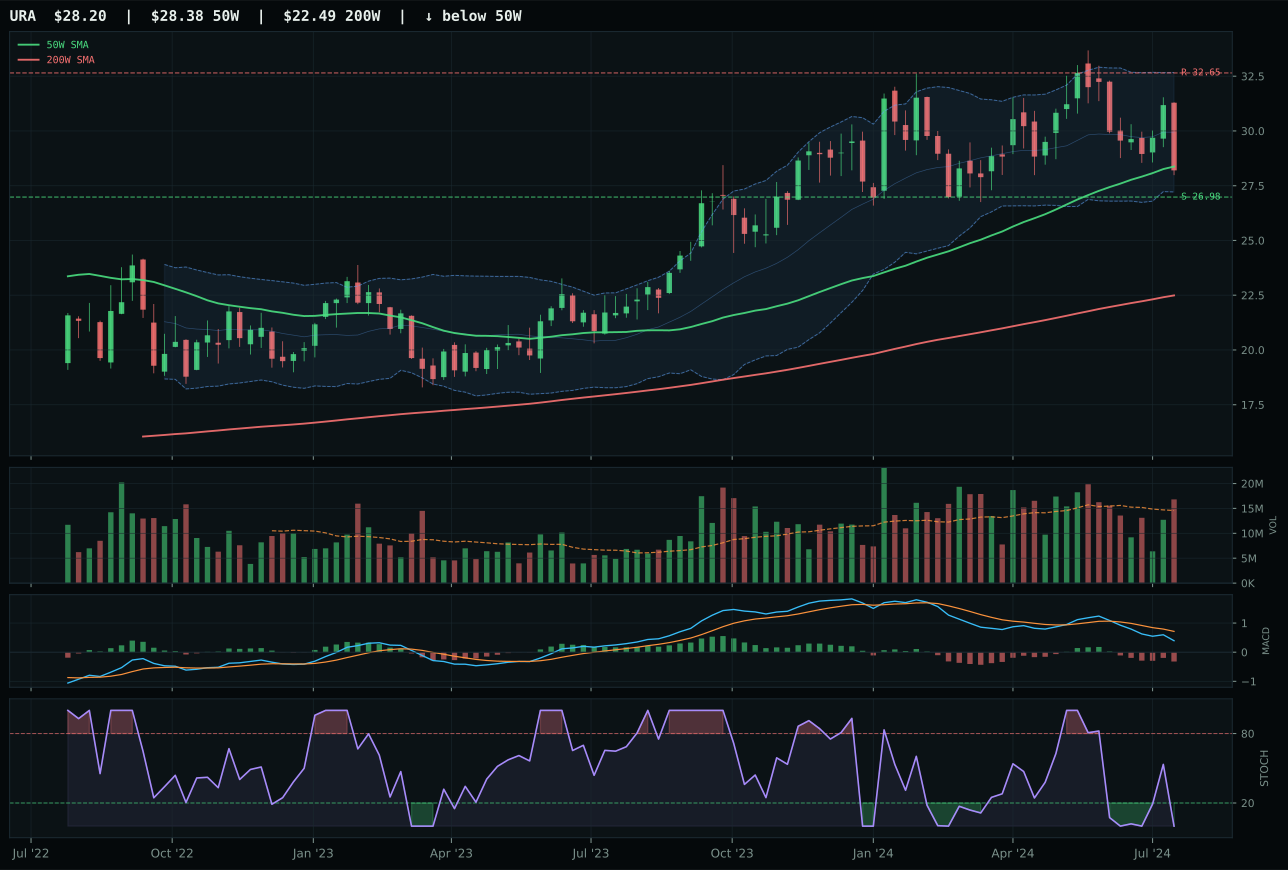
URA has a pullback into support profile with -13.1% 13-week relative strength versus SPY.
A failed hold above support would weaken the setup.
Actionable but governed by invalidation levels.
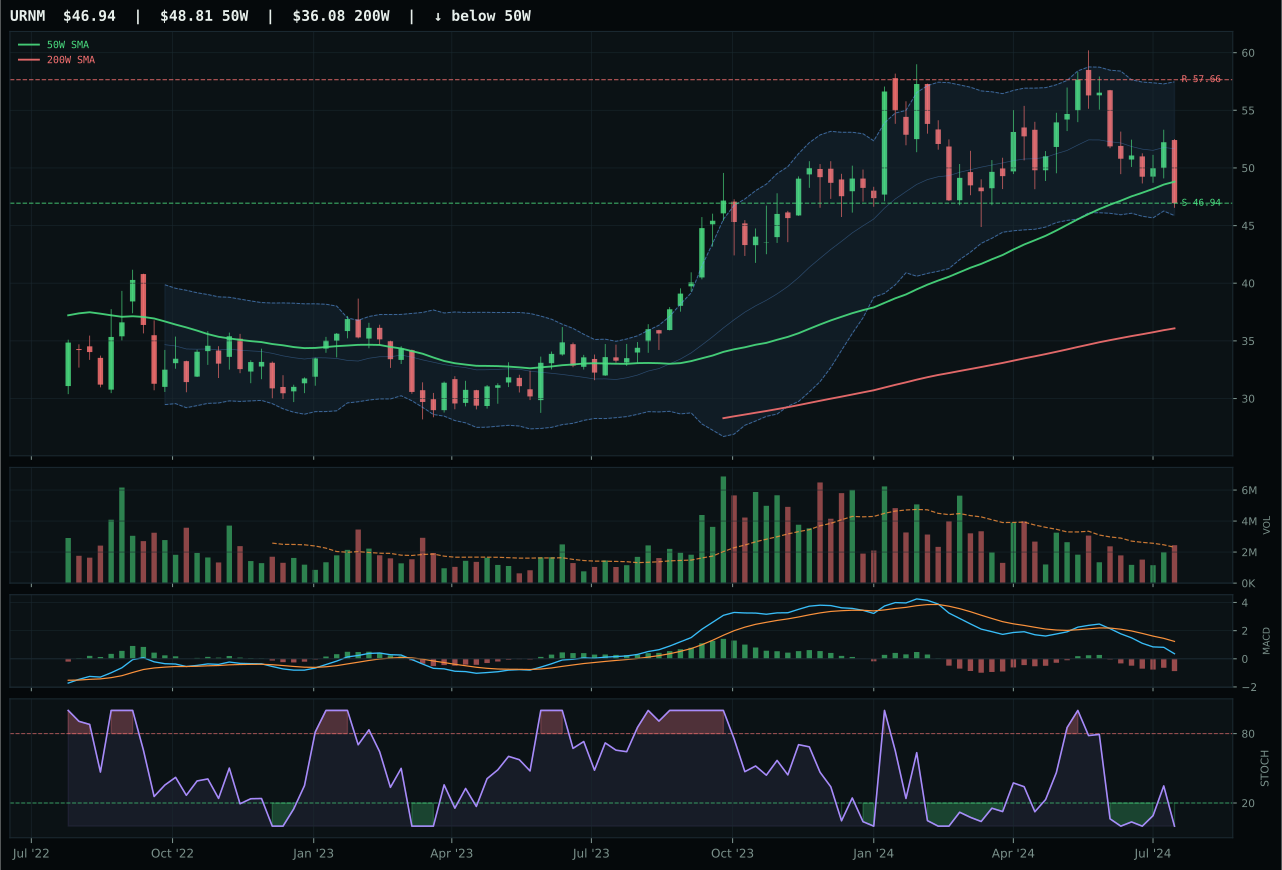
URNM has a pullback into support profile with -16.6% 13-week relative strength versus SPY.
A failed hold above support would weaken the setup.
Actionable but governed by invalidation levels.
NLR beat URA by category-relative strength advantage (6.2% versus 0.0%) despite inferior momentum confirmation—a decision that privileges category outperformance over absolute strength. NLR's technical composite of 63 exceeds URA's 58, driven by trend strength at 71.7 (versus URA's 52) and momentum confirmation at 35.6 (versus URA's 7). Both sit structurally broken with bearish weakening MACD and oversold stochastic RSI at 0.00, but NLR compensates with above-average volume participation (1.46x 20-week) signaling accumulation interest, whereas URA shows above-average but less conviction. NLR's 4.0% thirteen-week return arrives with -6.8% relative weakness to SPY but +6.2% relative to the category median, marking it as the cleanest horse in a three-horse glue factory. URA's -2.2% thirteen-week return falls further behind, compounded by -13.1% SPY weakness and pullback-into-support structure less stable than NLR's neutral setup. The timing score difference (70 versus 100 for URA) reflects support proximity benefits for URA, but that advantage inverts when volume participation and trend strength tilt decisively toward NLR.
Nuclear Energy earned 5% allocation based on category rank (39.0) and supportive macro fit (50.0/100) despite weak technical evidence at 41.8/100. This is a portfolio insurance position held for optionality: the AI growth sponsorship (+5 weighting) and real asset sponsorship (+7) provide modest structural support in a disinflation regime, and the energy security narrative remains active. NLR's relative strength within its own basket (6.2%) suggests early positioning in what could become a structural energy transition trade. However, the allocation is capped at 5% because technical evidence is poor—momentum confirmation at 35.6/100 and MACD weakness are real constraints. The position would expand only if NLR breaks above 87.39 resistance on improving MACD and volume confirmation, signaling that institutional demand for nuclear exposure is materializing. For now, this is a convex bet: small allocation with high optionality if the energy transition thesis accelerates, but disciplined position sizing given current chart weakness. If stochastic RSI fails to reverse above 0.30 and MACD remains bearish/weakening, the 5% becomes a liquidation candidate by week 4.
Defense & Aerospace — XAR
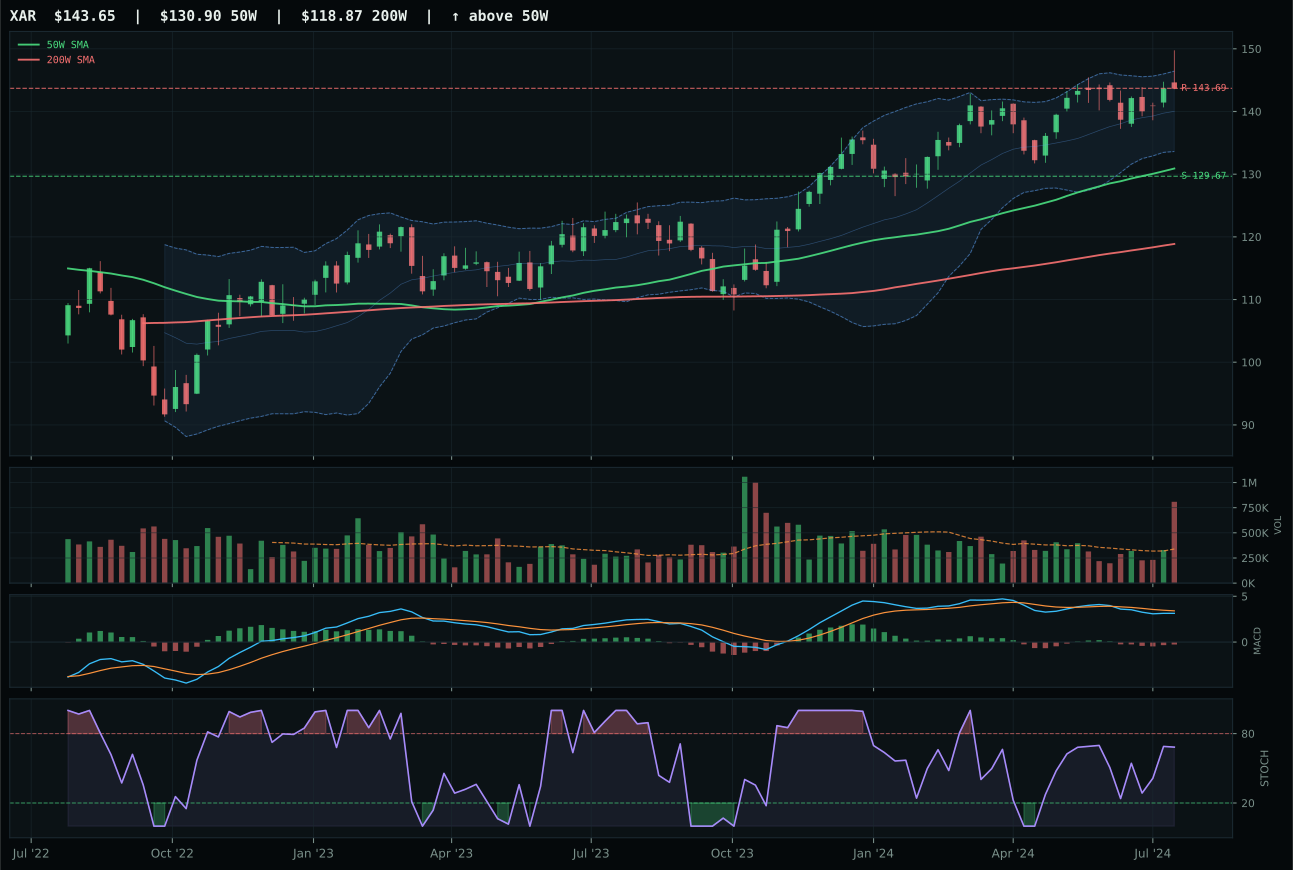
XAR has a neutral structure profile with -2.2% 13-week relative strength versus SPY.
A failed hold above support would weaken the setup.
Actionable but governed by invalidation levels.
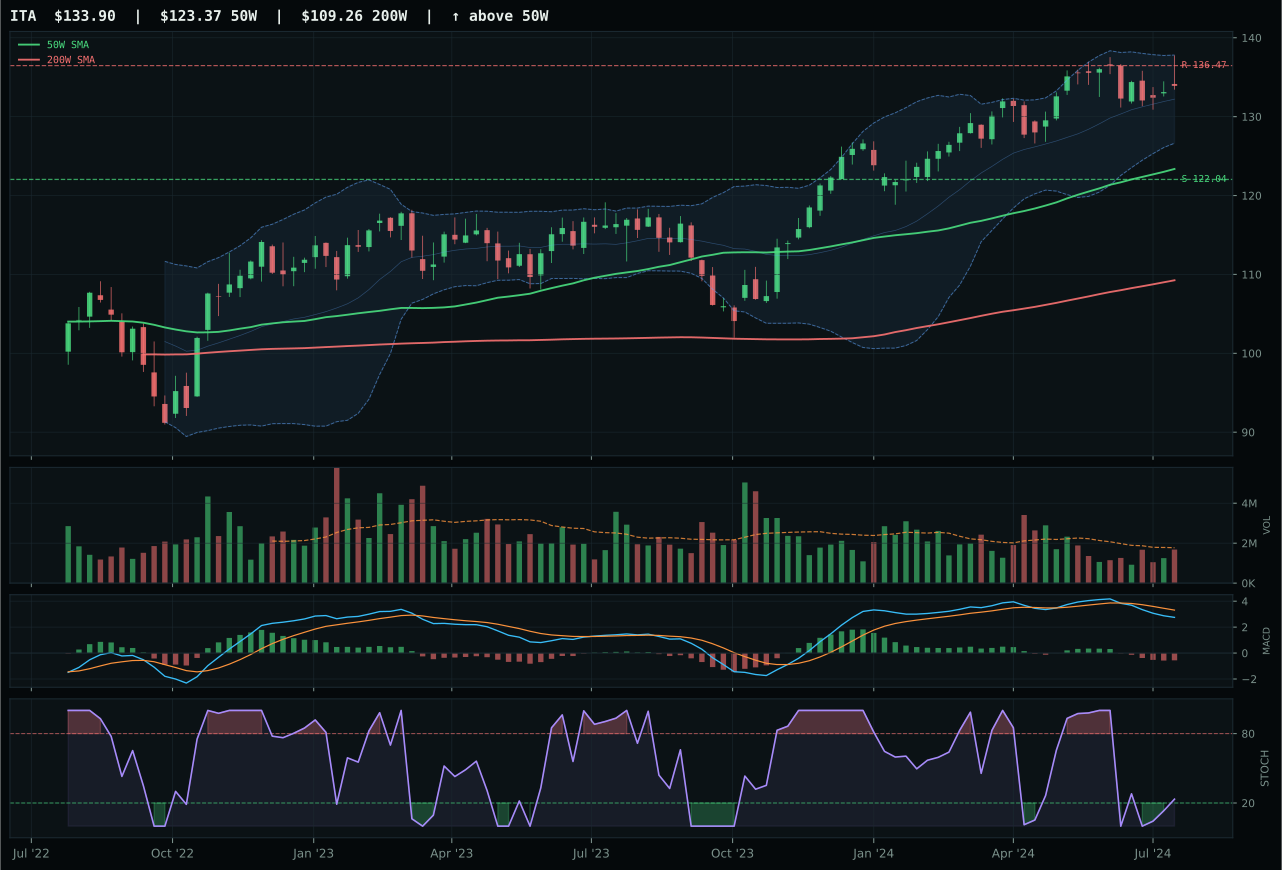
ITA has a neutral structure profile with -6.3% 13-week relative strength versus SPY.
A failed hold above support would weaken the setup.
Actionable but governed by invalidation levels.
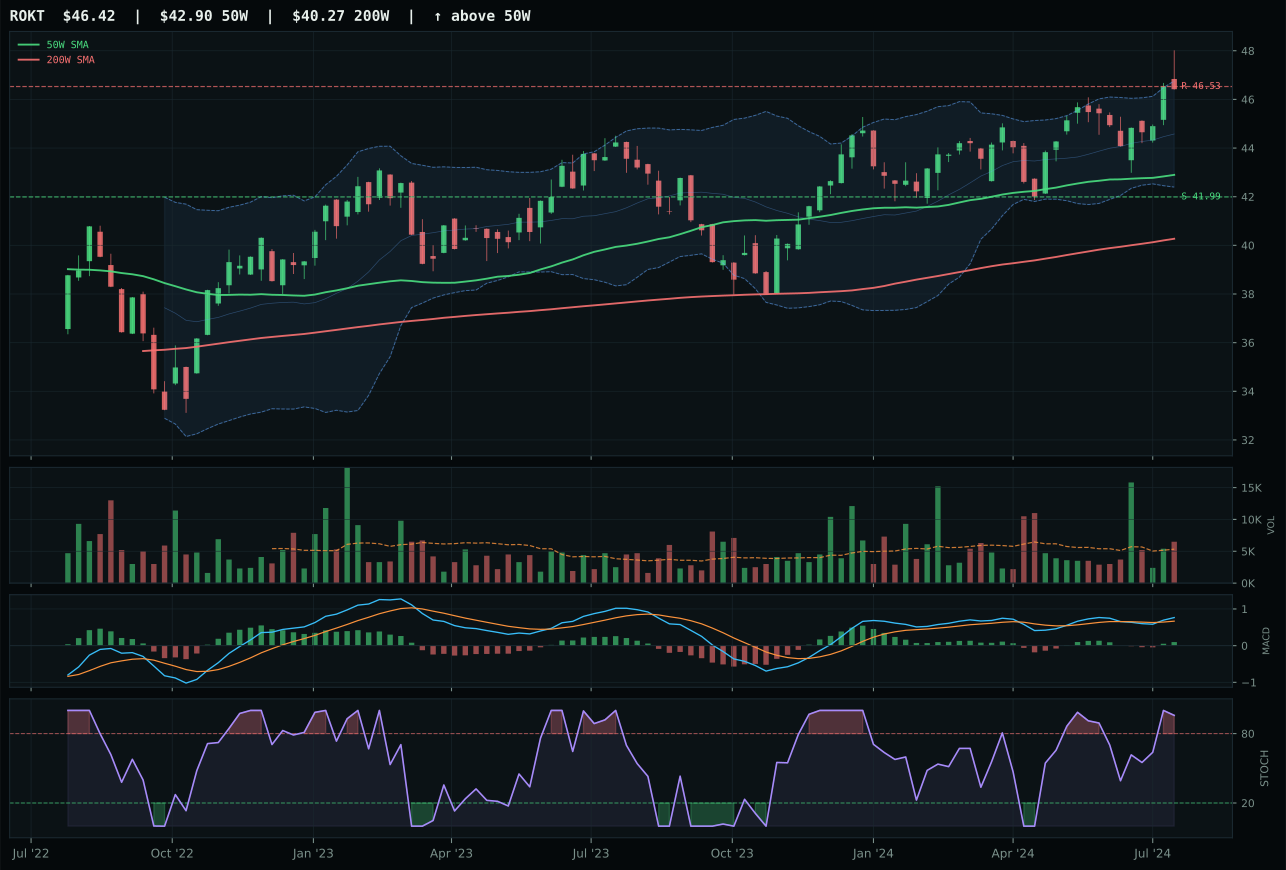
ROKT has a neutral structure profile with -0.3% 13-week relative strength versus SPY.
A failed hold above support would weaken the setup.
Tracked, but not top-2 eligible because: .
XAR won a razor-thin decision over ITA (37.2 vs 37.0 technical composite) on category-relative strength neutrality at 0.0% versus ITA's -4.0%, a meaningless margin that masks a category-wide technical breakdown. Both finalists sit structurally broken: neutral setup with bearish-weakening MACD, rising mid-zone stochastic RSI marking an exhaustion turn, and distribution pressure (2.38x volume for XAR) that contradicts price strength. XAR's 8.6% thirteen-week return arrived with -2.2% relative weakness to SPY and 0.0% relative to category—it's the least-worst performer in a declining group. ITA's 4.6% gain fell off more sharply, dragged down by -6.3% SPY underperformance and the same volume distribution that signals late institutional exits. The timing score of 78 for both reflects proximity to support (meaningful, but only defensive), not any bullish setup. Risk/reward for XAR (37.0) is lower than ITA's (48.0), a red flag that trend followers should heed as indication this category needs full exclusion, not allocation.
Defense & Aerospace was excluded from top-2 consideration and allocated only 5%—a residual position that reflects its 37.2 category score ranking it 8th or 9th in the competitive field. The technical evidence collapsed to 18.4/100, a score so low it signals hard deterioration filters activated; macro fit at 50.0/100 provides no rescue because no category-specific descriptor profile was available to boost the narrative. The regime is definitively hostile: disinflation support that would normally benefit industrial durability is absent, and credit stress remains active at -2 weighting. This is a category that needs to break above resistance at 143.69 (XAR) with volume confirmation and MACD reversal to earn reallocation. Until then, the 5% is portfolio completion—a stub position that acknowledges cyclical exposure without betting on imminent mean reversion. Watch for the support hold at 129.67; a breakdown would suggest liquidating the entire sleeve.
Industrial Metals — COPX
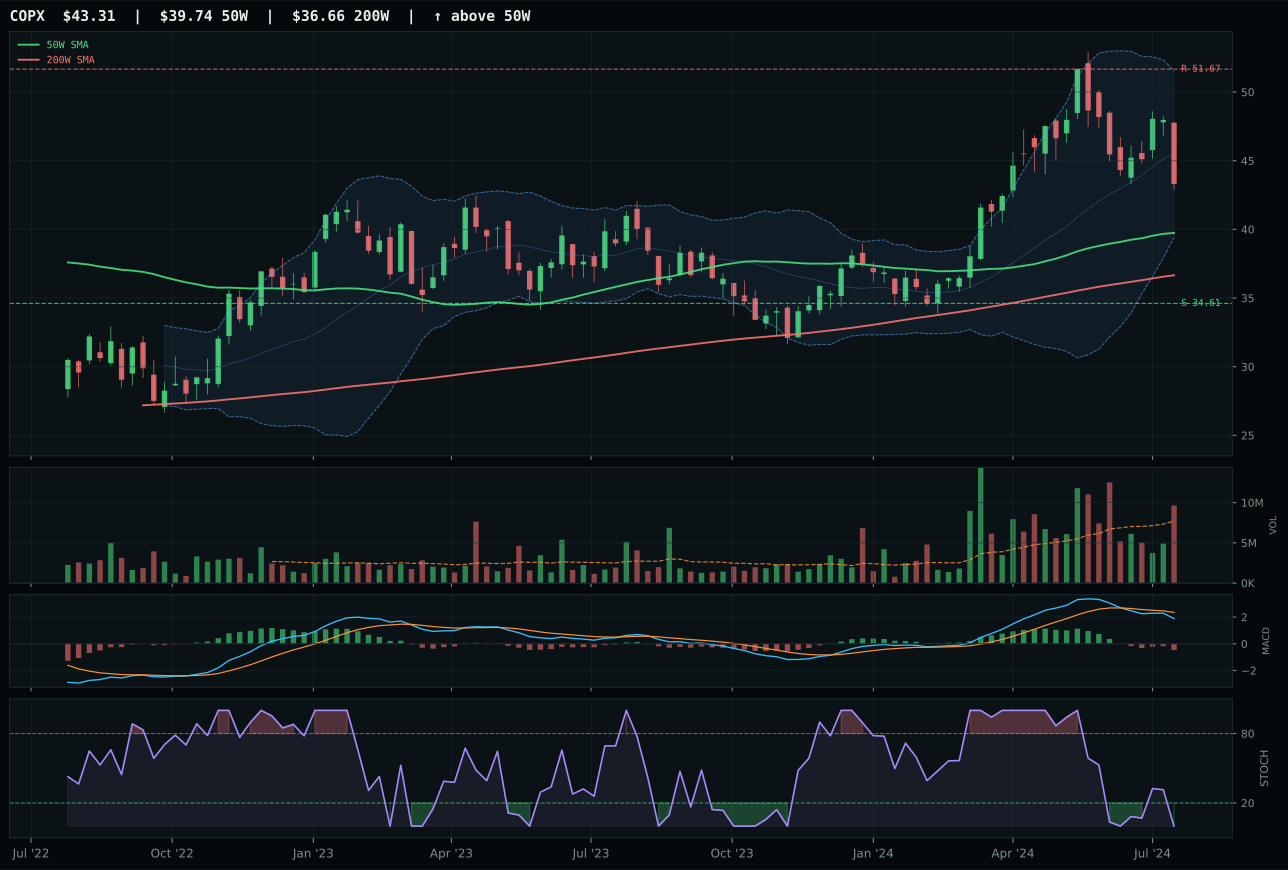
COPX has a neutral structure profile with -16.7% 13-week relative strength versus SPY.
A failed hold above support would weaken the setup.
Actionable but governed by invalidation levels.
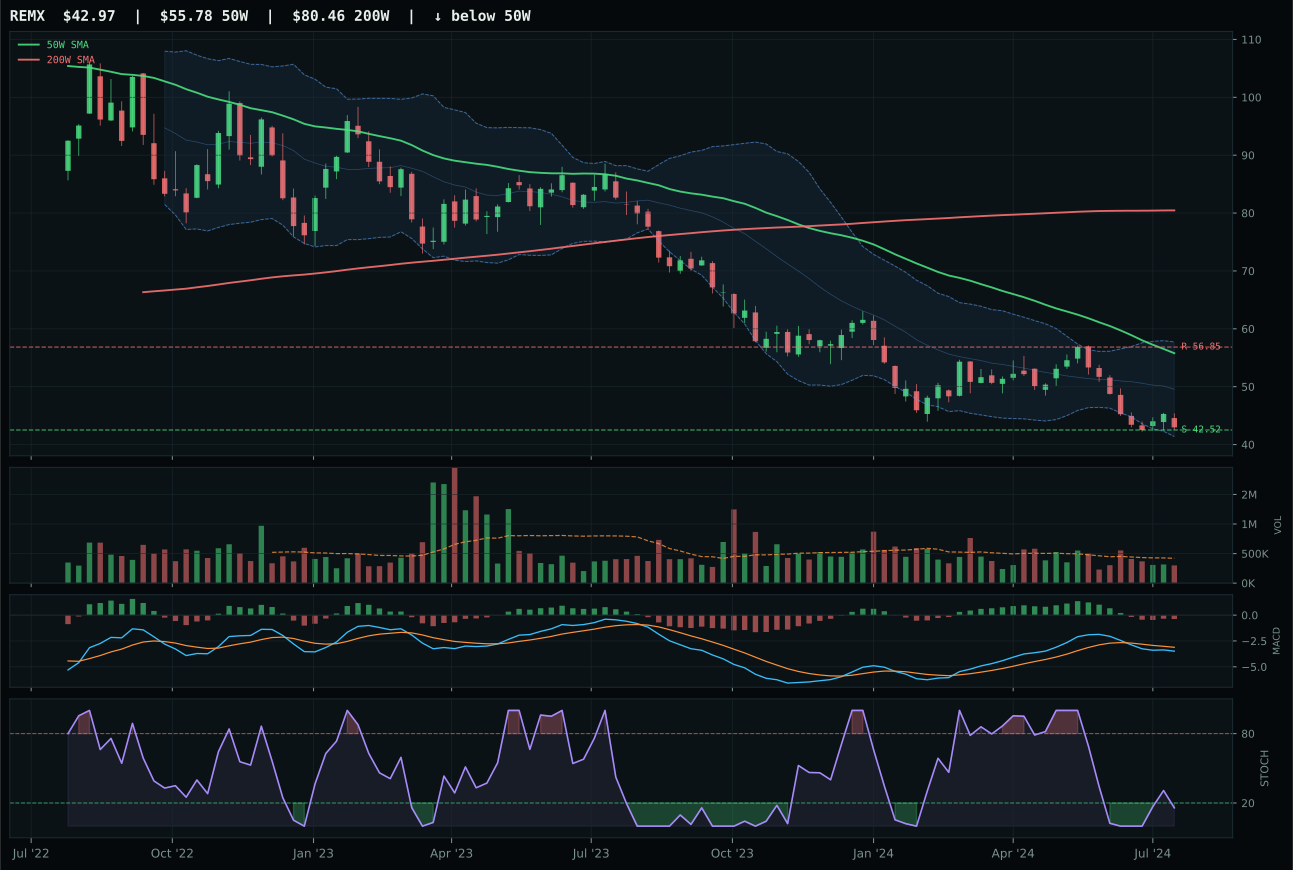
REMX has a pullback into support profile with -25.1% 13-week relative strength versus SPY.
Extension and support failure are the main tactical risks.
Tracked, but not top-2 eligible because: structurally broken.
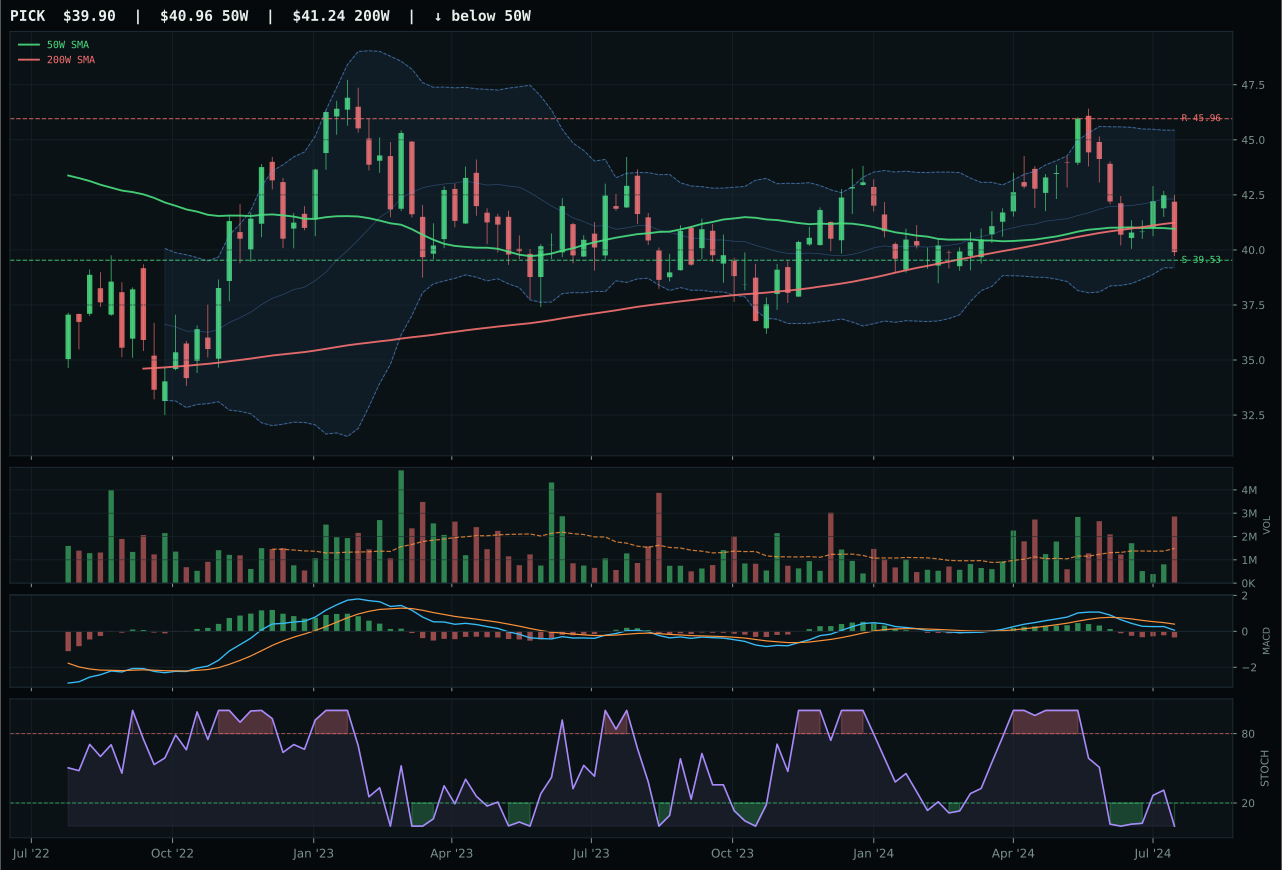
PICK has a pullback into support profile with -17.6% 13-week relative strength versus SPY.
Extension and support failure are the main tactical risks.
Tracked, but not top-2 eligible because: structurally broken.
COPX won by default in a category where all three nominees failed hard technical filters. COPX carries the only above-average volume participation (1.25x 20-week baseline), a critical differentiator when choosing among structurally broken setups. Its 0.2% momentum confirmation score is abysmal—thirteen-week return of -5.8%, four-week return of -4.2%, MACD bearish weakening, stochastic RSI oversold at 0.00—but the timing score of 77 reflects proximity to Fibonacci 0.500 decision zone and oversold stochastic setup ready to turn. REMX and PICK both show structurally broken filters (hard stop conditions) due to pullback-into-support positioning with thin or distribution volume, making them ineligible regardless of upside risk. COPX's neutral structure avoids these hard stops. The risk/reward of 64.6 for COPX is the strongest in the category, with 25.1% downside to support but 16.2% upside constrained to resistance—the asymmetry favors sideways consolidation over breakdown. Copper scarcity narrative is real (+12 metals scarcity), but execution requires belief that oversold conditions and volume participation signal institutional accumulation, not capitulation.
Industrial Metals earned only 5% despite macro support from metals scarcity (+14 weighting) and commodity breadth positive (+10), a suppressed allocation driven by COPX's technical collapse. The category score of 24.1 placed it outside top-2 eligibility entirely, ranking 8th or lower. The macro fit is 65.0/100—genuinely strong—yet technical evidence at 30.3/100 for COPX overrode the narrative advantage. This is the clearest example of technical veto in this week's allocation. The real asset sponsorship (+6) and metals scarcity thesis are sound, but the chart evidence is unambiguous: COPX is in a momentum washout, stochastic RSI is signaling capitulation, and volume is participation from liquidation, not accumulation. The 5% allocation is a placeholder for mean-reversion traders; it would expand only if COPX closes above 51.67 resistance on bullish MACD confirmation and stochastic RSI reversal above 0.30. Until then, this is a scarcity hedge that isn't hedging yet—a position held for insurance value while awaiting technical reset.
Traditional Energy — XLE
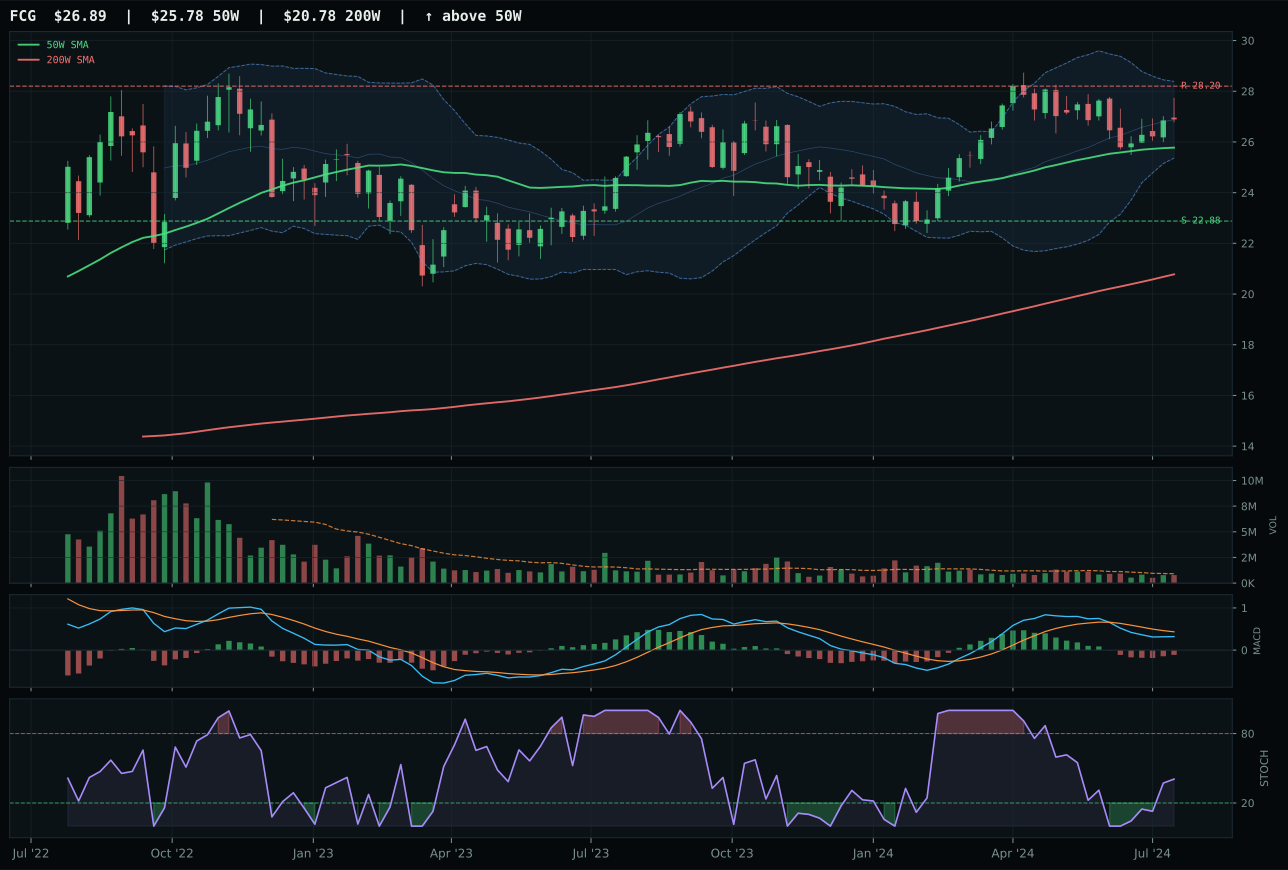
FCG has a neutral structure profile with -12.3% 13-week relative strength versus SPY.
A failed hold above support would weaken the setup.
Actionable but governed by invalidation levels.
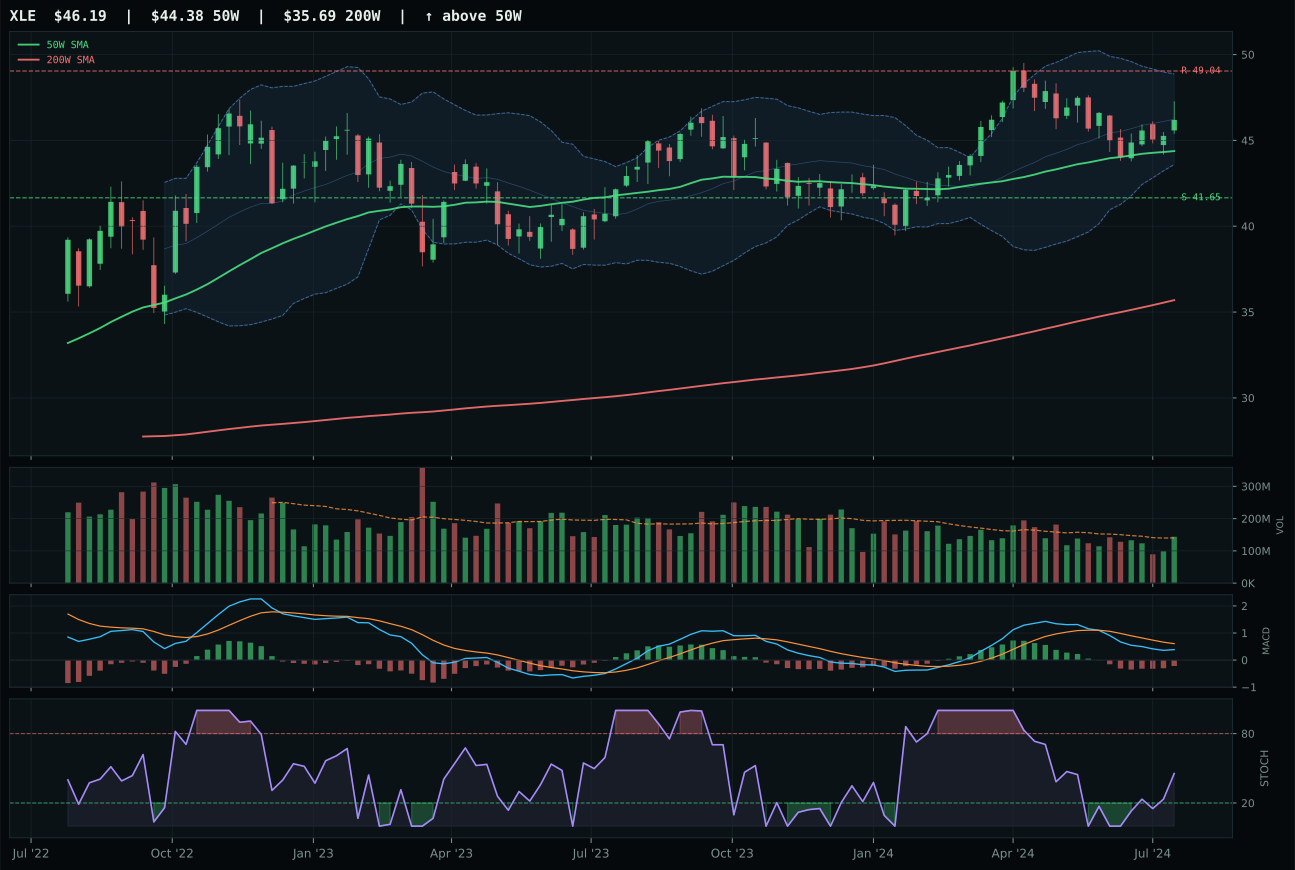
XLE has a neutral structure profile with -13.6% 13-week relative strength versus SPY.
A failed hold above support would weaken the setup.
Actionable but governed by invalidation levels.
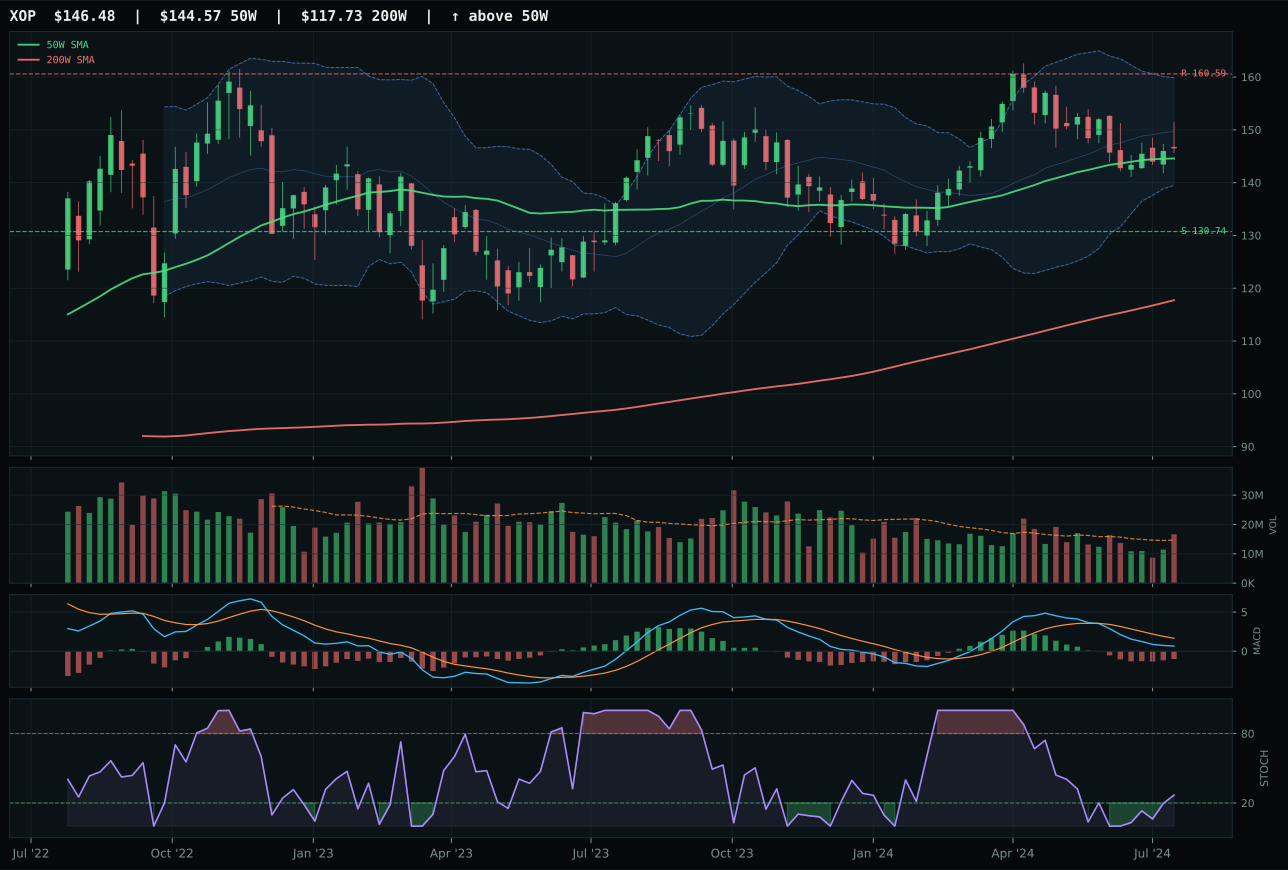
XOP has a compression near 50W profile with -15.3% 13-week relative strength versus SPY.
A failed hold above support would weaken the setup.
Actionable but governed by invalidation levels.
XLE won an essentially identical twin match against FCG (both composite 69) on marginal risk-reward improvement and category-relative strength parity. XLE's risk/reward of 54.6 edges FCG's 49.8, a slim advantage reflecting XLE's slightly better downside cushion to support (10.9% versus similar territory) combined with slightly tighter upside constraint to resistance (-5.8% versus FCG's structure). Both carry identical timing at 98—distance to 50-week near-perfect at 4.1% for XLE—and both show bearish but improving MACD with rising mid-zone stochastic RSI, the classic capitulation-to-recovery pattern. The distinction is technical parity with representational leverage to macro conviction: neither shows volume confirmation (both neutral), both carry identical structural setup (neutral), both show weak momentum confirmation (32 and 38 respectively). XLE's thirteen-week return of -2.7% versus FCG's -1.4% is immaterial in a category where SPY relative weakness dominates (-13.6% for XLE, -12.3% for FCG). The decision is category-relative strength at 0.0% for XLE matching the median, while FCG shows +1.3%—XLK wins only because it's least-relative-to-peers, a meaningless victory.
Traditional Energy was entirely excluded from allocation at 0%, ranking in the bottom tier due to its 14.3 category score and the hostile macro regime for fossil fuels. Disinflation carries a -10 weighting, disinflation pressure adds another -10, credit stress -7, and liquidity stress -7—a -34 point macro headwind that only +7 real asset sponsorship partially offsets. Category-level macro fit is a mere 23.0/100, the lowest macro score among all categories. XLE's technical evidence of 60.6/100 could have carried a small allocation if macro were neutral, but the regime is actively hostile to energy. The setup would need crude prices to rally above $85/barrel with confirmation, or the Fed to pivot toward reflation messaging, before this category earned reallocation. For now, energy is excluded because disinflation regimes structurally reduce demand assumptions and multiples compression has already begun. Monitor for reversal signals; a close above XLE's 49.04 resistance on volume and MACD confirmation would trigger a watch for potential 5% reallocation.
Agriculture & Livestock — MOO
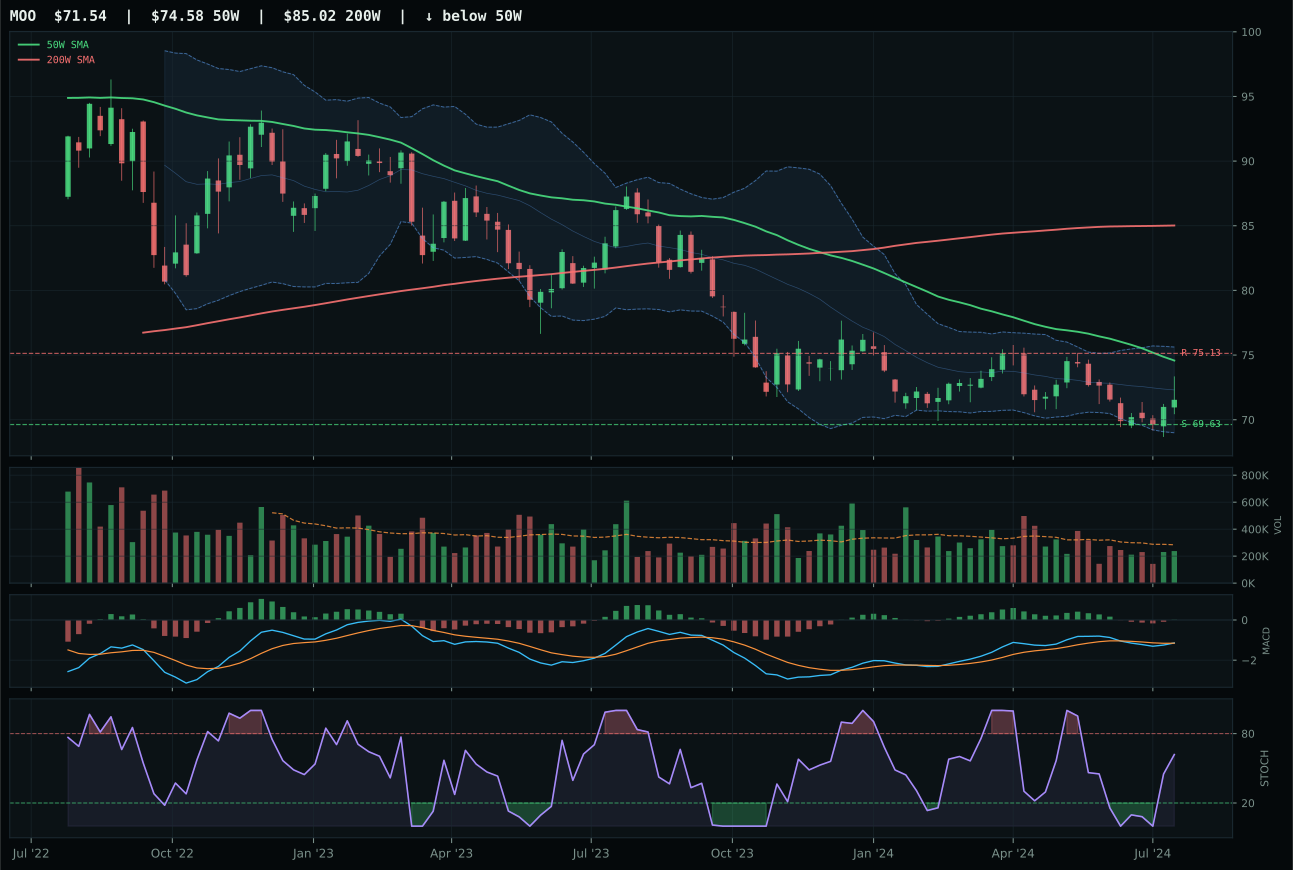
MOO has a pullback into support profile with -10.8% 13-week relative strength versus SPY.
Extension and support failure are the main tactical risks.
Tracked, but not top-2 eligible because: structurally broken.
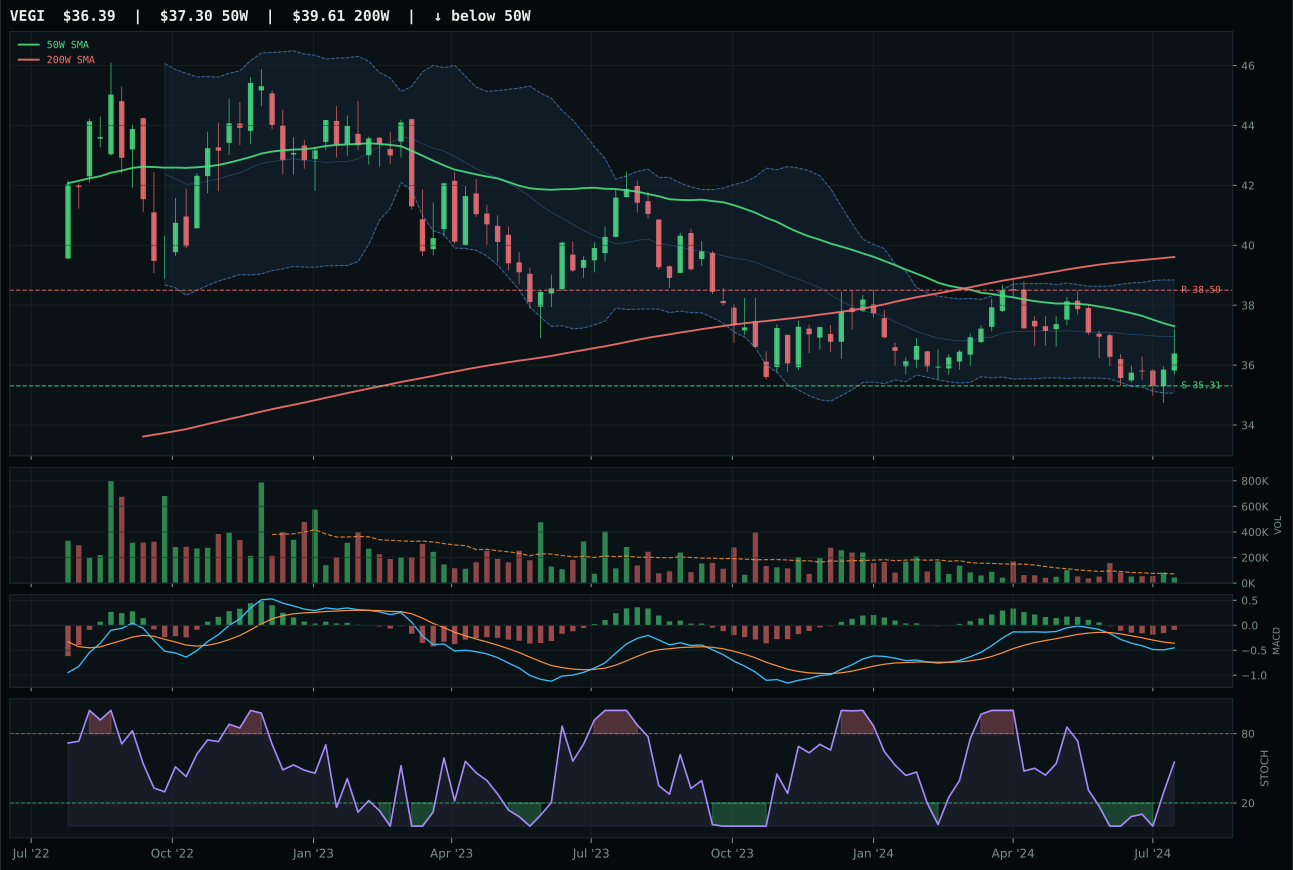
VEGI has a pullback into support profile with -13.3% 13-week relative strength versus SPY.
Extension and support failure are the main tactical risks.
Tracked, but not top-2 eligible because: structurally broken.
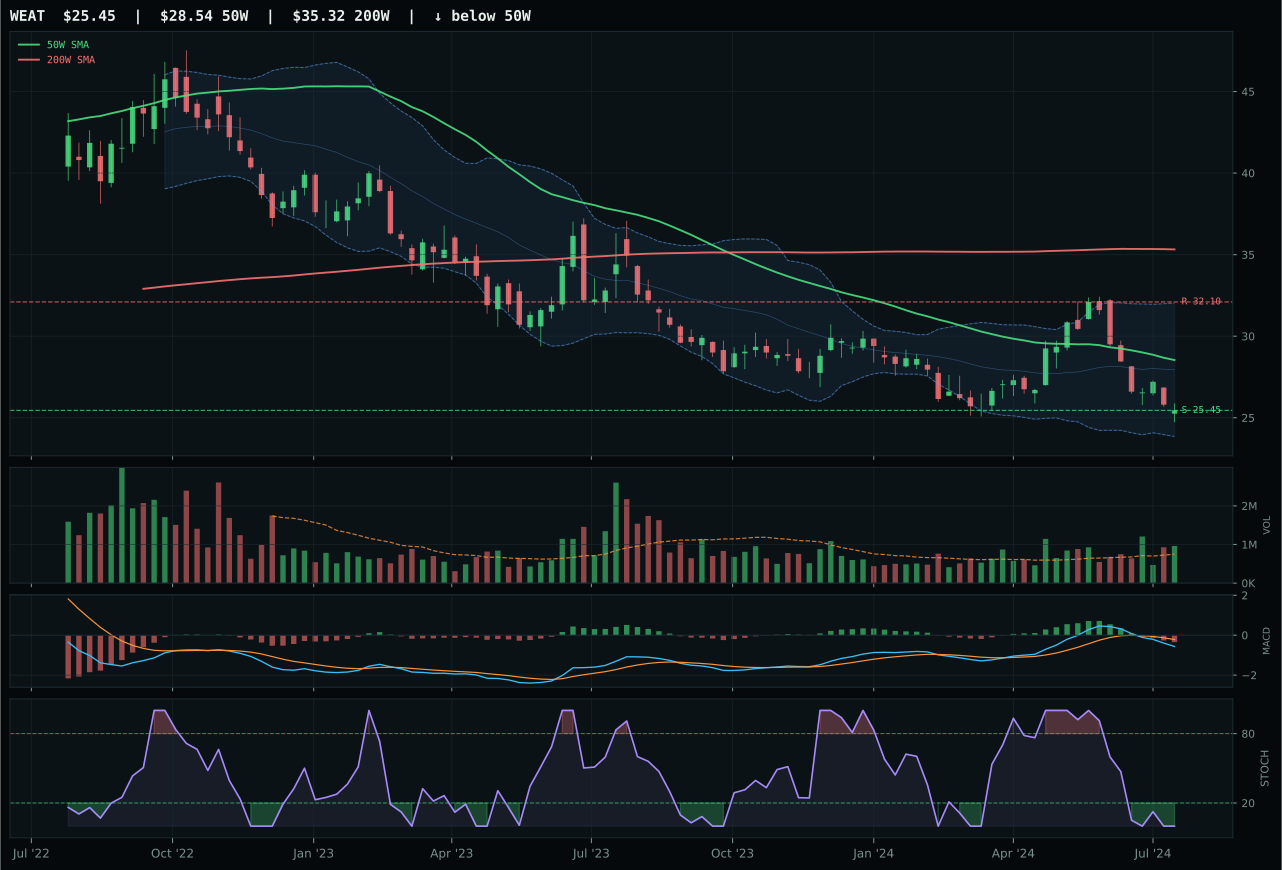
WEAT has a pullback into support profile with -15.6% 13-week relative strength versus SPY.
Extension and support failure are the main tactical risks.
Tracked, but not top-2 eligible because: structurally broken.
MOO won because it owns the only bullish MACD in a broken category, a setup worth a 100/100 timing score even as trend languishes at 40/100 and structure sits pullback-into-support (40.7). The thirteen-week return of 0.0% tells the full story: dead money with massive relative weakness (-10.8% versus SPY) but pristine mean-reversion conditions—price sits -4.1% below the 50-week at support 69.63 with MACD bullish and improving, stochastic RSI rising mid-zone, and risk/reward of 76.4 (9.4% upside risk versus 2.7% downside). VEGI, the runner-up, carries the same pullback-into-support structure and identical trend weakness but MACD is bearish improving, not bullish improving, and volume is thin participation versus neutral—two confirmations weaker. WEAT is genuinely broken with -15.6% relative weakness, oversold stochastic, and bearish weakening MACD. The category median shows both MOO and VEGI reasoned at 42.0, but the MACD difference matters disproportionately at support inflection points; buyers haven't yet arrived at VEGI, while they're showing early signs at MOO.
Agriculture & Livestock was entirely excluded from the allocation at 0%, ranking 9th or 10th and marked ineligible despite MOO's token technical advantage. The category score of 6.4 is essentially a placeholder; macro fit at 45.0/100 reflects the fundamental tension in this regime: disinflation pressure carries a -8 weighting, actively punishing real asset exposure, while commodity breadth positive provides only +5. The hard filter for structural breakage was correctly applied—both MOO and VEGI are below their 50W moving averages with deteriorating trend scores (40.0 and 33.0). This is not a rotation candidate, it is a recovery watch. The category earned zero allocation because the risk-reward is asymmetrically skewed toward continued breakdown; the 76.4% risk-reward score on MOO signals 2.7% downside to support but 4.8% compressed upside, a pinned setup with no alpha. Reallocation would require a close above 75.13 (MOO resistance) on volume confirmation and MACD confirmation back to bullish and improving—conditions not present this week.