
2024-07-12
Informational purposes only. The content in this report, including allocations, analysis, and commentary, is provided solely for informational and educational purposes. It does not constitute financial advice, investment advice, trading advice, or any other type of advice. Past performance does not guarantee future results. Always conduct your own research and consult a qualified financial professional before making investment decisions.
Weekly Allocation
| Ticker | Category | Weight | Role |
|---|---|---|---|
| FBTC | 50% | Overlay | |
| IGV | Technology | 10% | Top-2 (10%) |
| AIQ | AI | 10% | Top-2 (10%) |
| IGF | Utilities & Infrastructure | 5% | Tier-2 (5%) |
| GLD | Precious Metals | 5% | Tier-2 (5%) |
| URA | Nuclear Energy | 5% | Tier-2 (5%) |
| XAR | Defense & Aerospace | 5% | Tier-2 (5%) |
| INDA | Emerging Markets | 5% | Tier-2 (5%) |
| COPX | Industrial Metals | 5% | Tier-2 (5%) |
Trade Instructions — Monday Open
Sell the tranche from 2024-06-14 (completing its 4-week hold). Buy the new tranche. Instructions show net portfolio changes — same-asset positions cancel, weight changes show the delta.
| Action | Ticker | Instruction |
|---|---|---|
| SELL | XLU | Sell 40% of XLU position (reduce 6.25% → 3.75%) |
| SELL | GLD | Sell 20% of GLD position (reduce 6.25% → 5.00%) |
| SELL | XLK | Sell 50% of XLK position (reduce 2.50% → 1.25%) |
| SELL | SMH | Sell 25% of SMH position (reduce 5.00% → 3.75%) |
| SELL | NLR | Sell 25% of NLR position (reduce 5.00% → 3.75%) |
| SELL | ITA | Sell 33% of ITA position (reduce 3.75% → 2.50%) |
| BUY | IGV | Buy IGV — 28.57% of freed cash (adds 2.50% to portfolio) |
| BUY | AIQ | Buy AIQ — 28.57% of freed cash (adds 2.50% to portfolio) |
| BUY | IGF | Buy IGF — 14.29% of freed cash (adds 1.25% to portfolio) |
| BUY | XAR | Buy XAR — 14.29% of freed cash (adds 1.25% to portfolio) |
| BUY | URA | Buy URA — 14.29% of freed cash (adds 1.25% to portfolio) |
Current Portfolio After Trade
Combined holdings across all 4 active tranches. Each tranche is 25% of the portfolio.
| Ticker | % of Portfolio | Weight Bar |
|---|---|---|
| FBTC | 50.00% | |
| IGV | 7.50% | |
| GLD | 5.00% | |
| COPX | 5.00% | |
| INDA | 5.00% | |
| AIQ | 5.00% | |
| SMH | 3.75% | |
| NLR | 3.75% | |
| XLU | 3.75% | |
| ITA | 2.50% | |
| IGF | 2.50% | |
| XAR | 2.50% | |
| XLK | 1.25% | |
| SLV | 1.25% | |
| URA | 1.25% |
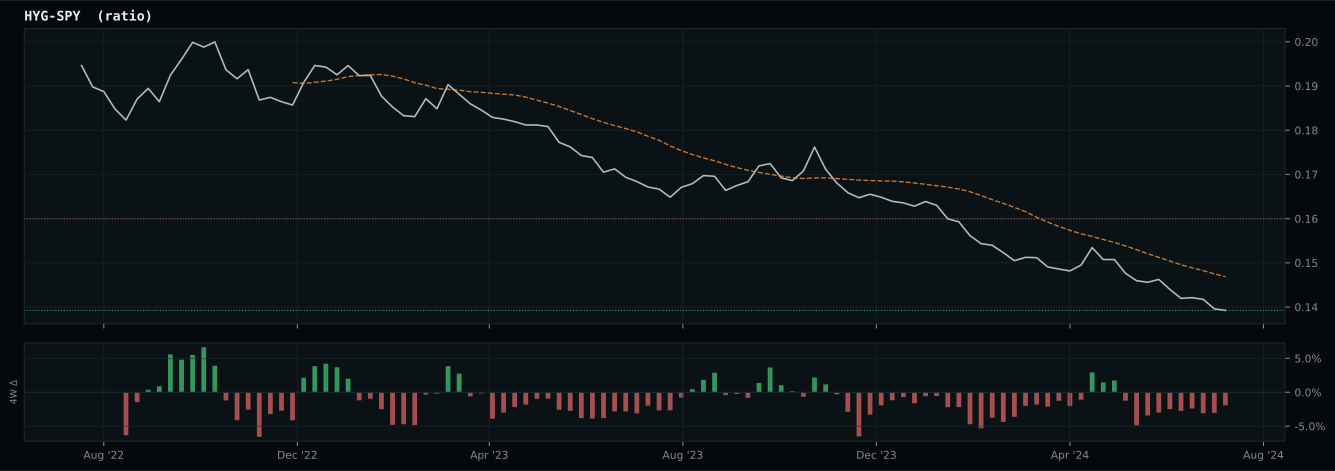
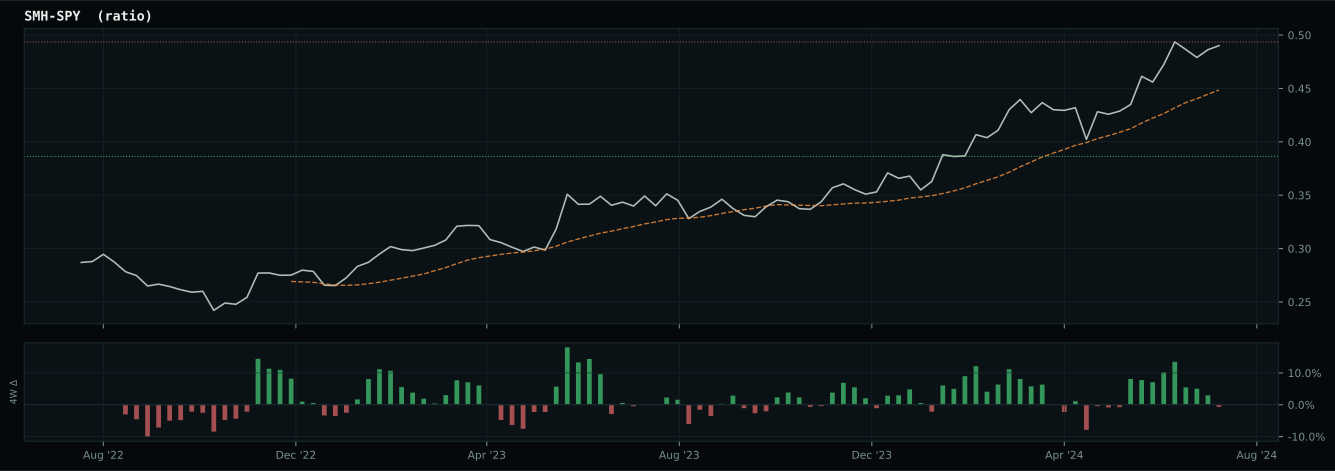
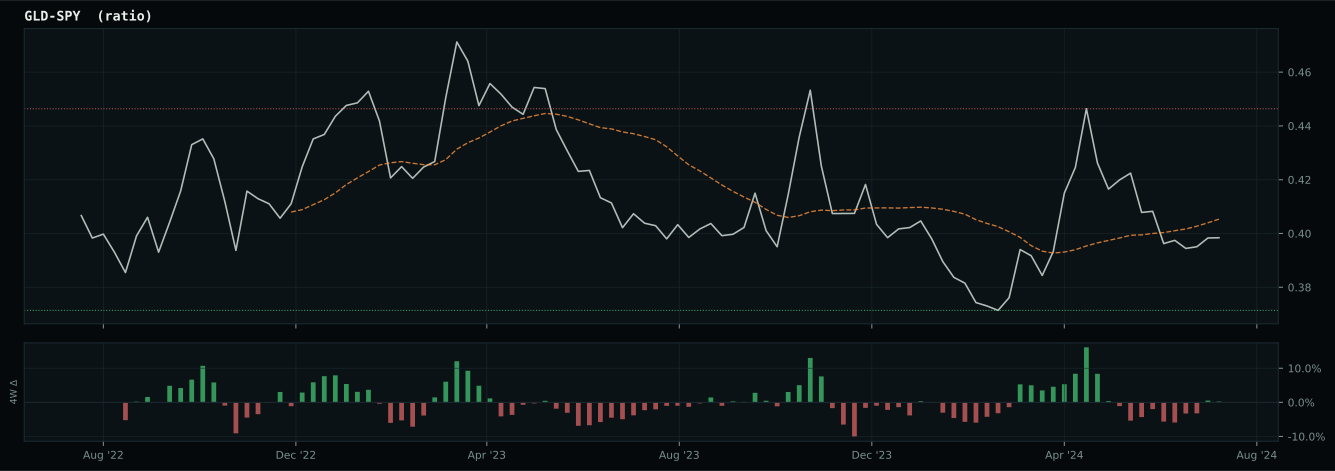
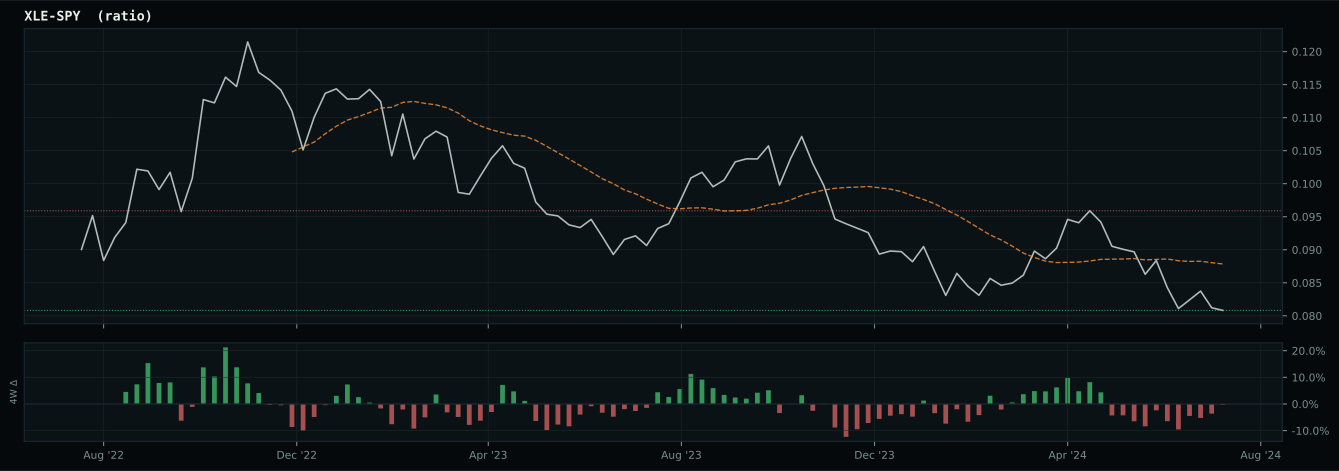
Macro Regime — Disinflation
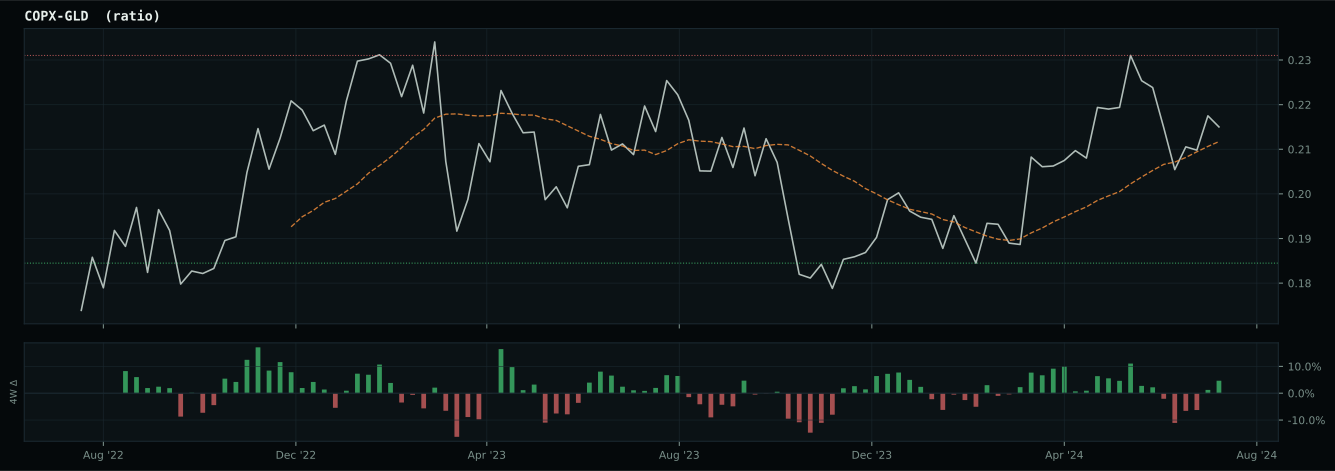
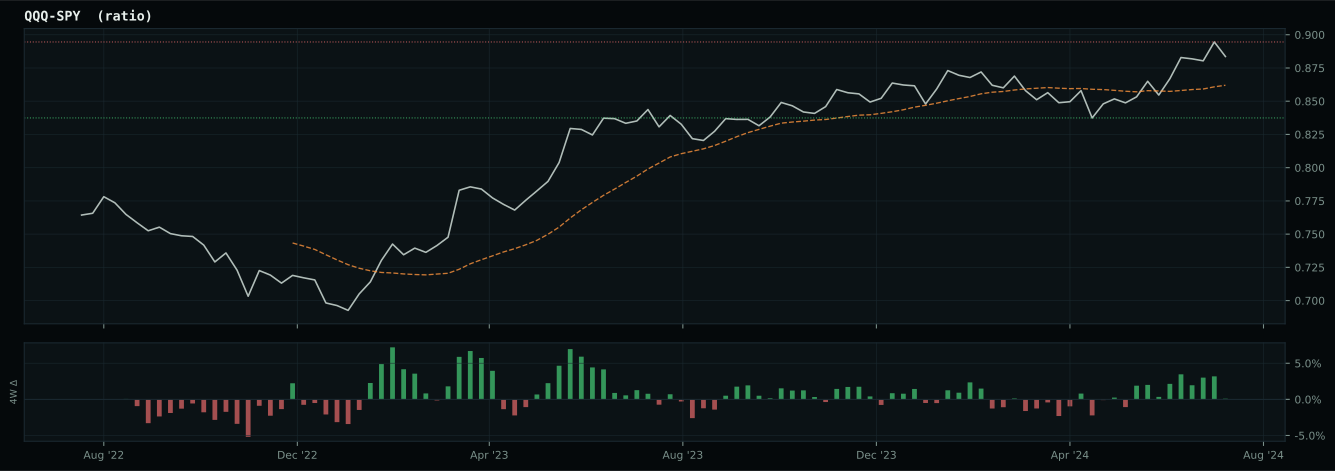
Macro Evidence Charts
Market-implied signals behind the macro regime scores. Each ratio compares two assets; the direction and slope of the ratio is what the macro engine reads.
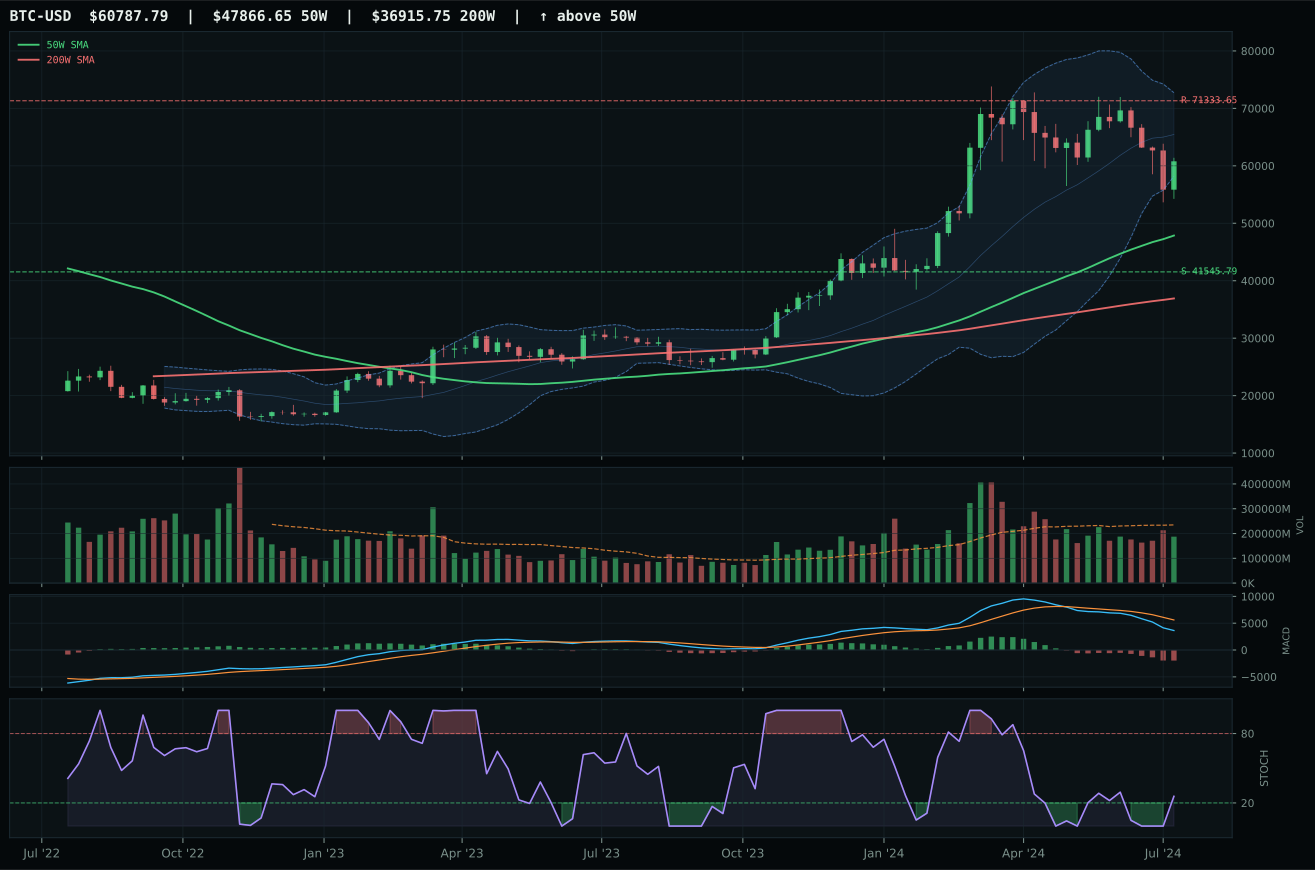
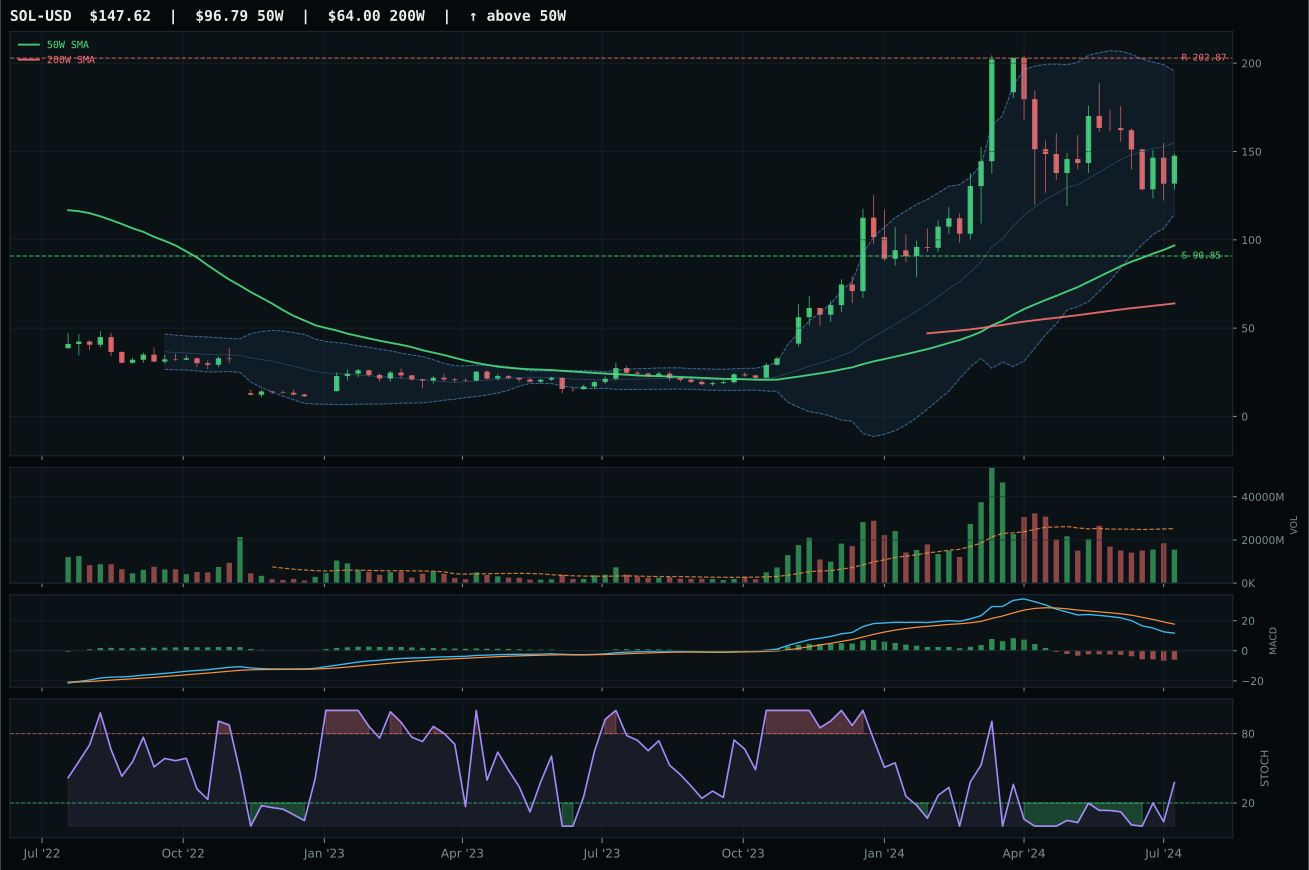
Crypto Regime — TrendBTC
ValueBTC not armed: BTC has not made the first post-breakdown touch of the 200W buy zone after losing the 50W
TrendBTC confirmed: 2 consecutive closes above rising/flat 50W SMA
one or more available conditions failed
Category Rankings
| Rank | Category | Winner | Score | Alloc | 4W Ret | Peers (4W) |
|---|---|---|---|---|---|---|
| 1 | Technology | IGV | 66.7 | 20% | -5.61% | XLK -12.2% · CIBR -4.1% |
| 2 | AI | AIQ | 62.5 | 20% | -9.55% | SMH -18.5% · BOTZ -9.9% |
| 3 | Utilities & Infrastructure | IGF | 58.1 | 10% | -0.26% | XLU +4.5% · PAVE -2.7% |
| 4 | Precious Metals | GLD | 49.6 | 10% | +1.23% | GDX -5.4% · SLV -9.6% |
| 5 | Nuclear Energy | URA | 47.5 | 10% | -20.71% | NLR -14.7% · URNM -22.9% |
| 6 | Defense & Aerospace | XAR | 43.9 | 10% | +1.75% | ITA +5.0% · ROKT +0.3% |
| 7 | Emerging Markets | INDA | 40.4 | 10% | -2.38% | IEMG -4.8% · ILF -3.6% |
| 8 | Industrial Metals | COPX | 36.0 | 10% | -15.24% | PICK -10.4% · REMX -13.4% |
| 9 | Traditional Energy | XLE | 6.8 | 0% | -1.35% | FCG -8.0% · XOP -6.5% |
| 10 | Agriculture & Livestock | MOO | 2.3 | 0% | -1.56% | VEGI -3.1% · WEAT -1.0% |
Technology — IGV
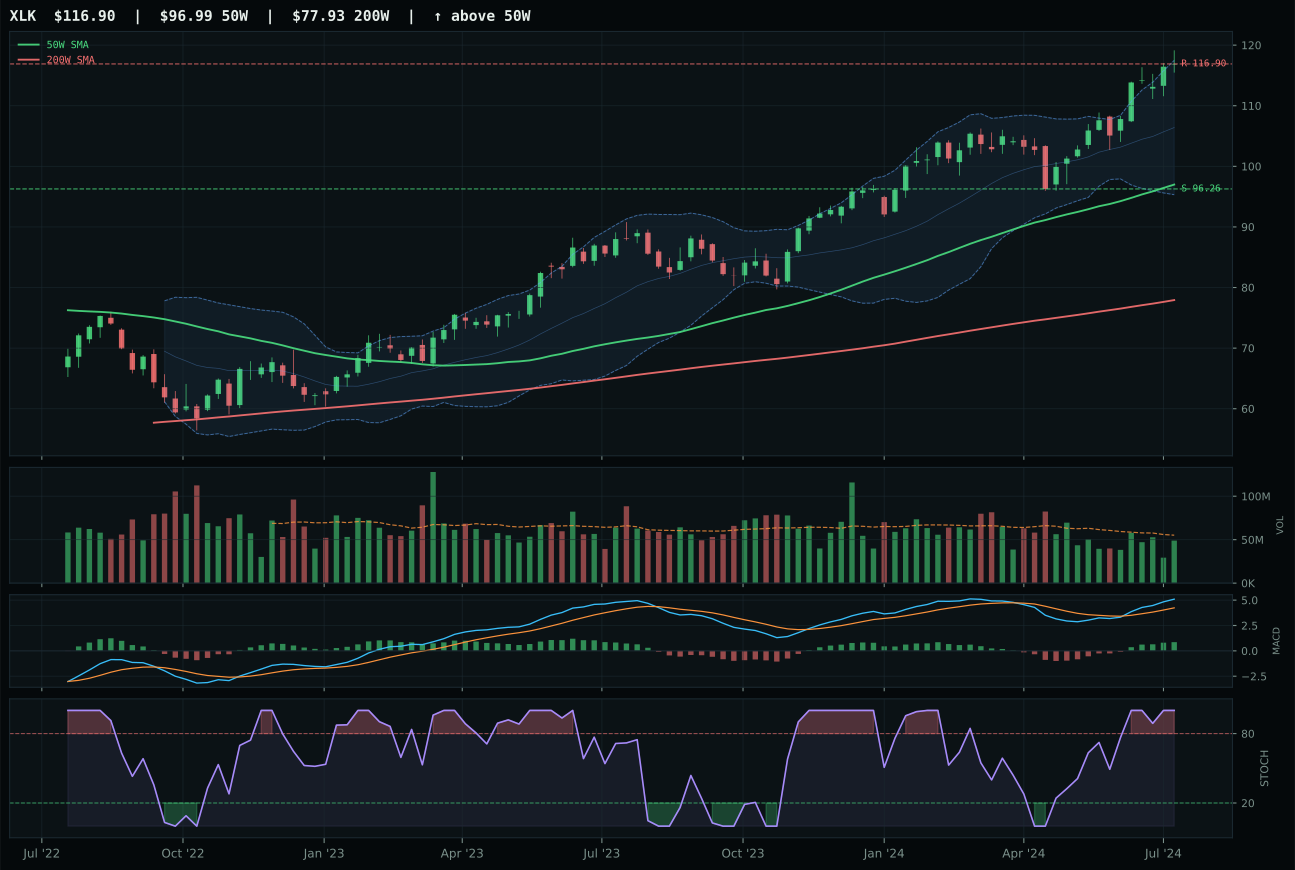
XLK has a vertical extension profile with 4.2% 13-week relative strength versus SPY.
A failed hold above support would weaken the setup.
Actionable but governed by invalidation levels.
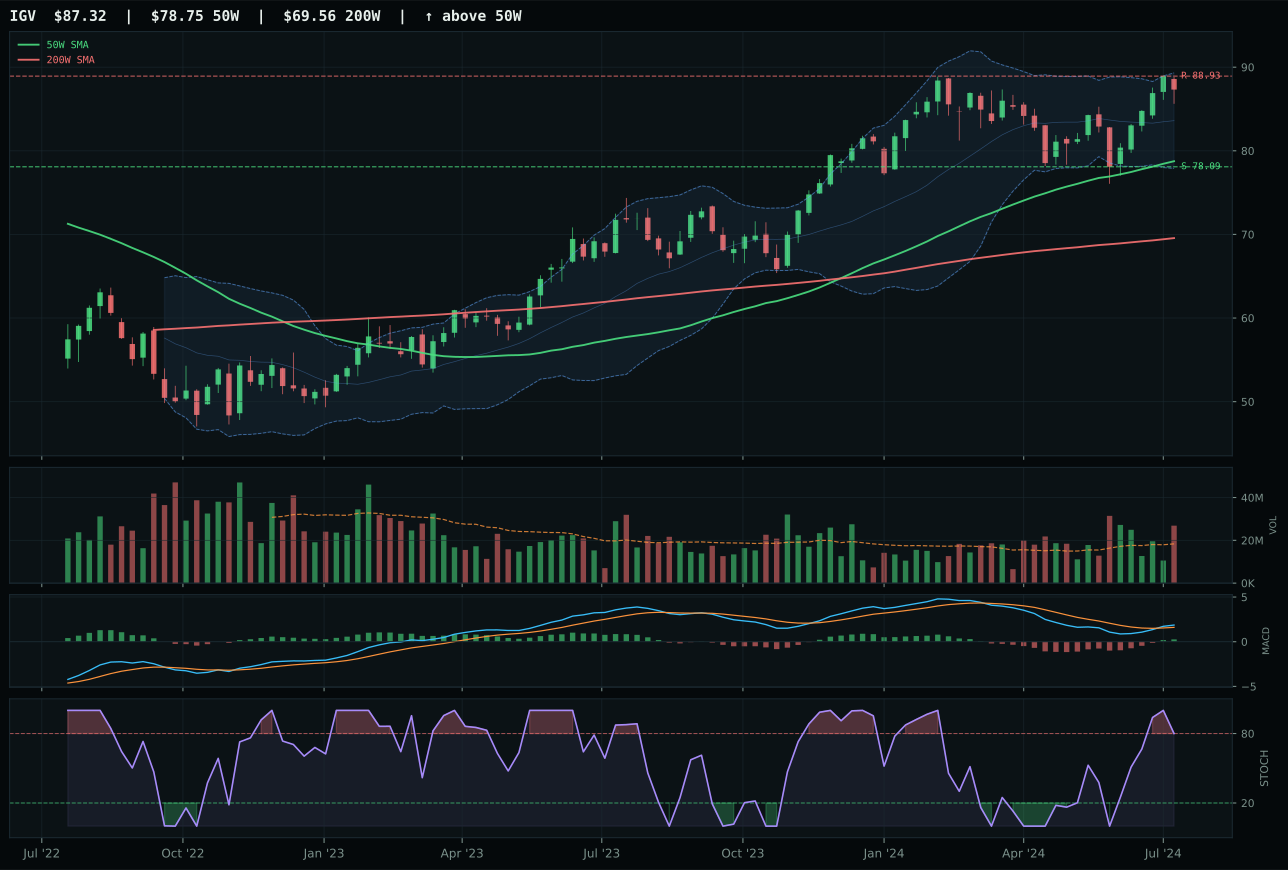
IGV has a neutral structure profile with -4.1% 13-week relative strength versus SPY.
A failed hold above support would weaken the setup.
Actionable but governed by invalidation levels.
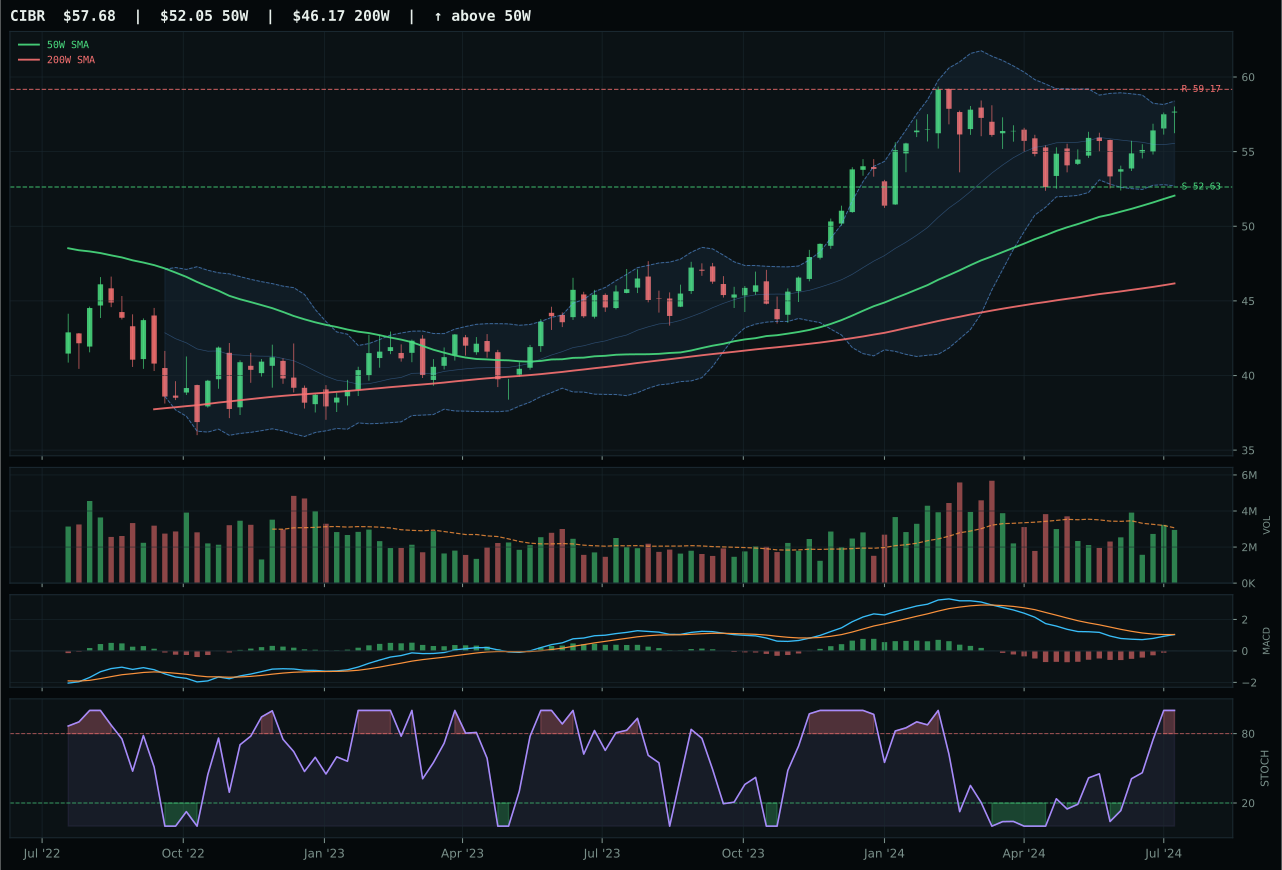
CIBR has a neutral structure profile with -4.5% 13-week relative strength versus SPY.
A failed hold above support would weaken the setup.
Actionable but governed by invalidation levels.
IGV wins the category because it commands a cleaner entry setup than XLK despite facing more stretched price action. Price sits 10.9% above the 50-week moving average with above-average volume participation at 1.46x the 20-week average, giving the breakout real liquidity sponsorship rather than thin confirmation. XLK's 20.5% extension from the 50W creates asymmetric risk: every new buyer arrives late, and the 37.0 timing score versus IGV's 59.0 reflects that compression into support favors IGV's neutral structure over vertical extension. MACD is bullish and improving in both, but the 13-week return spread (5.5% versus 13.8%) masks the relative strength story—IGV's flat category RS and above-average accumulation signal institutional conviction, while XLK's positive RS versus SPY masks deteriorating volume confirmation as price stretched further into exhaustion.
Technology earns 10% allocation as a top-2 category, justified by disinflation's +7 macro benefit and active positive risk appetite. The portfolio is overlaid 50%, so this tier-1 sleeve carries meaningful weight in absolute capital terms. Disinflation pressure removes duration risk from growth multiples just as credit stress and liquidity headwinds tempt traders to de-risk; IGV's neutral setup and calm accumulation structure provide the exact opposite of panic selling. The category's 66.7 final score ranks among the two highest eligible baskets, and that composite reflects both IGV's technical leadership and the macro regime's favorable tilt toward profitable, capital-light software exposure. Risk appetite positive (+9) and AI growth sponsorship (+6) are the active tailwinds here, and they matter more in a disinflation path where growth optionality expands.
AI — AIQ
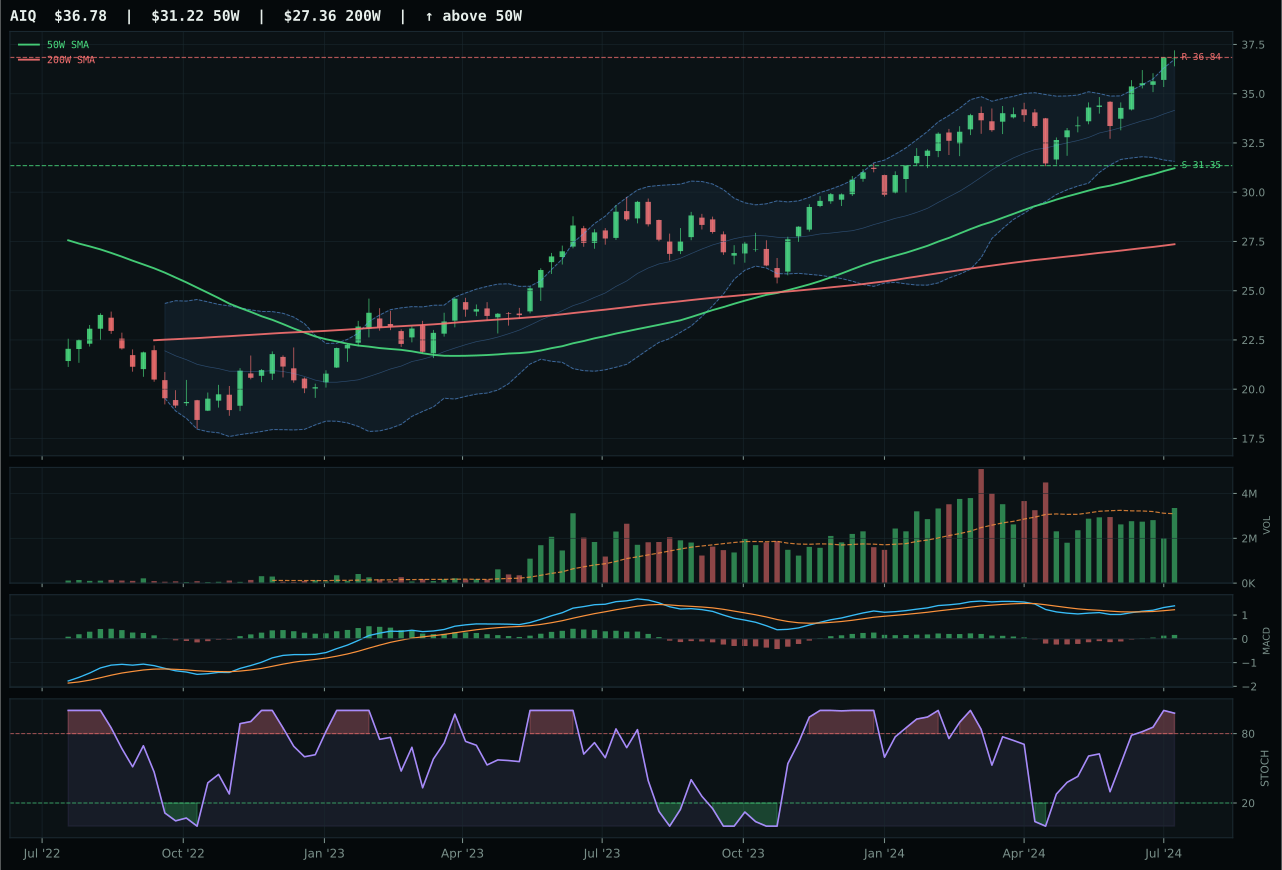
AIQ has a vertical extension profile with 0.6% 13-week relative strength versus SPY.
A failed hold above support would weaken the setup.
Actionable but governed by invalidation levels.
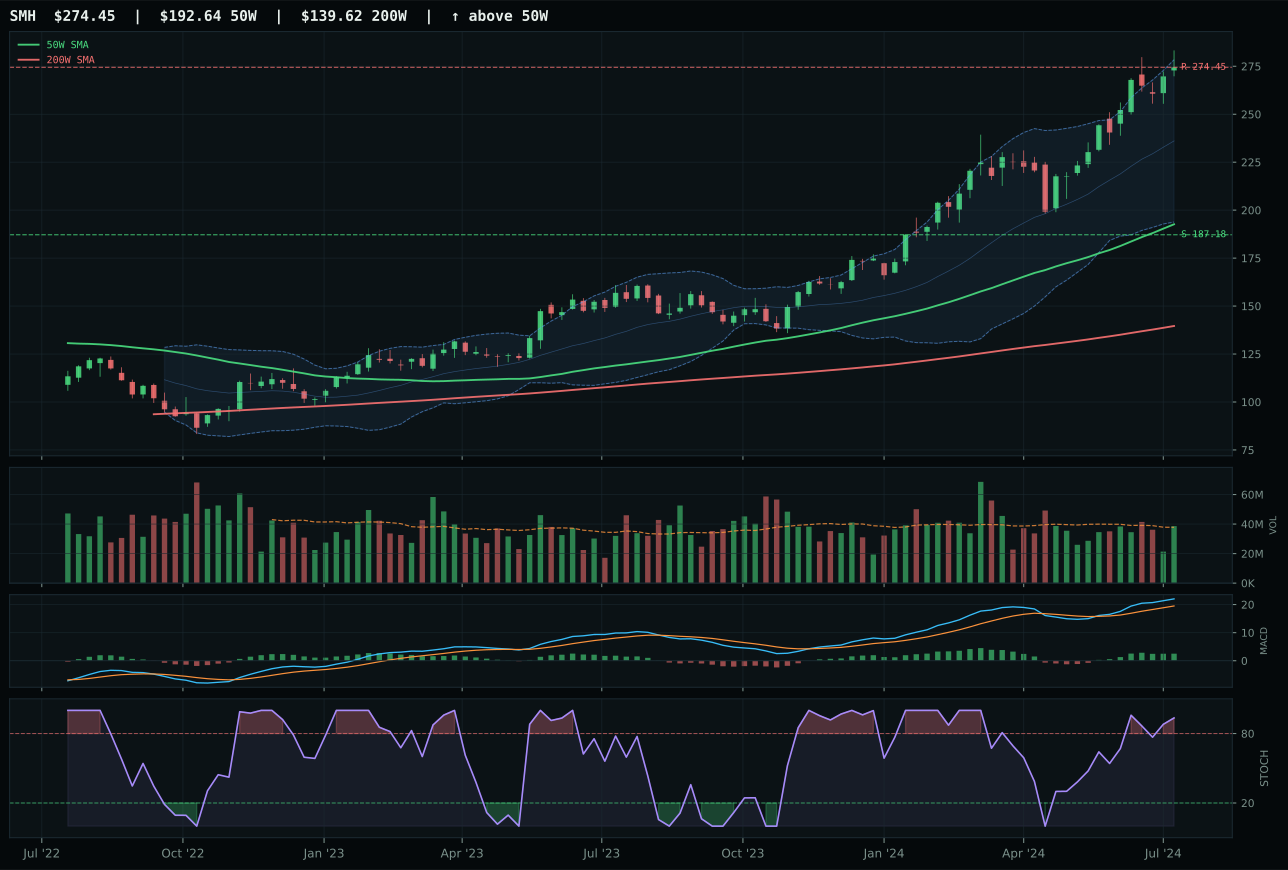
SMH has a vertical extension profile with 14.7% 13-week relative strength versus SPY.
A failed hold above support would weaken the setup.
Actionable but governed by invalidation levels.
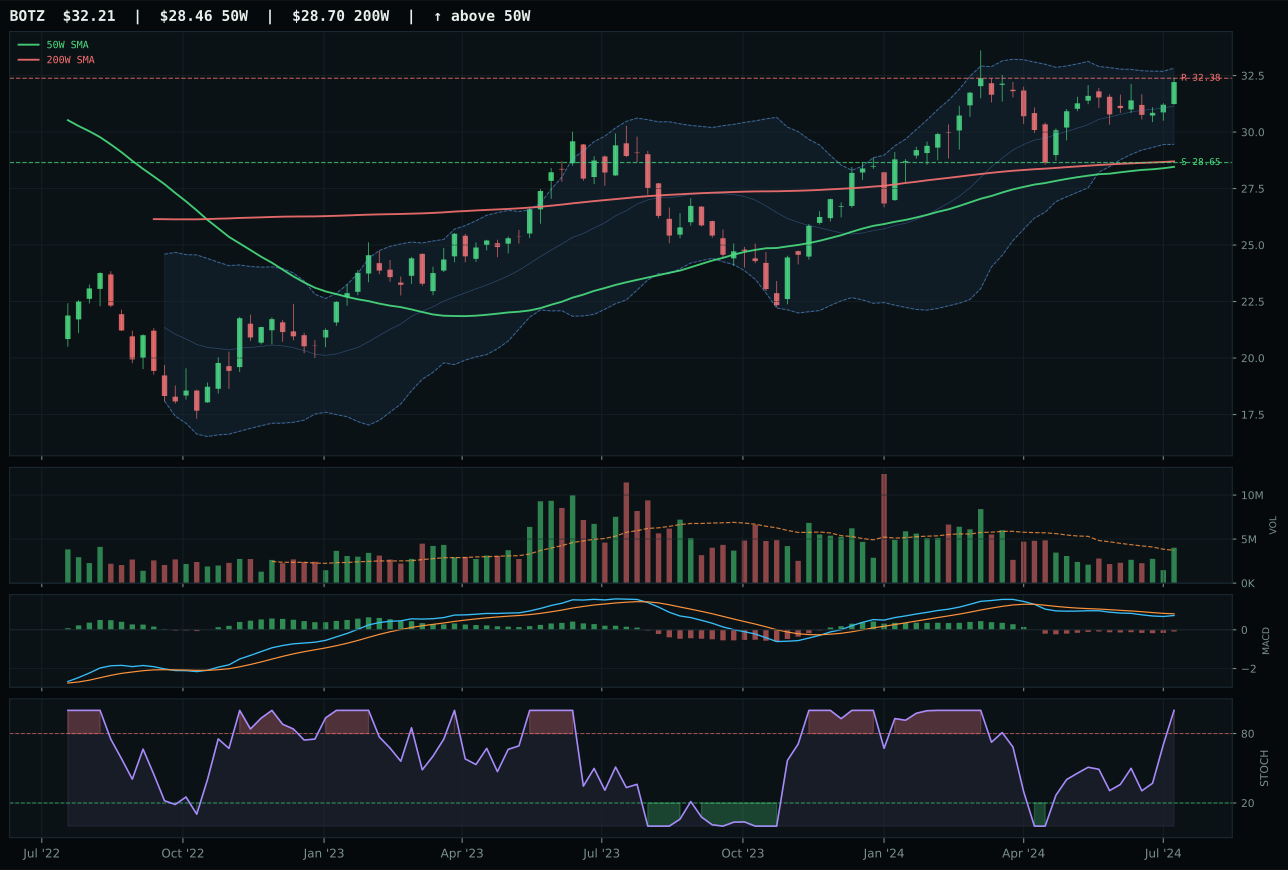
BOTZ has a neutral structure profile with -2.6% 13-week relative strength versus SPY.
A failed hold above support would weaken the setup.
Actionable but governed by invalidation levels.
AIQ wins by holding a perfect trend score (100/100) while penalizing entry risk aggressively, a trade-off that makes sense when an extended setup has to compete with SMH's even more stretched alternative. Price is 17.8% above the 50-week average—extended, yes, but the 37.0 timing score reflects overbought momentum without the volume decay that would signal distribution. SMH's 42.5% extension and bullish-but-flattening MACD tell a different story: momentum is rolling over even as price remains near the 52-week high, and that divergence between breadth and impulse is the technical red flag. Category RS of 0.0% versus the median means AIQ is the cleanest of three crowded names, and neutral volume (1.08x 20W) avoids the false comfort of thin participation.
AI earns 10% allocation as a top-2 category, paired with Technology to anchor the growth sleeve under a disinflation regime. The final 62.5 category score ranks second among all eligible baskets, driven by AI growth sponsorship active at +14, the strongest descriptor signal in the portfolio. That narrative is real: disinflation removes inflation expectations that would otherwise cap valuation multiples on compute and model training. However, AIQ's own timing score (37.0) warns that entry is stretched, and the category-level 59.0 macro fit score is soft compared to pure momentum plays. The portfolio is treating this as a structural long, not a tactical trade—the 10% stake reflects high conviction in the multi-year AI capex cycle, but the extended price action means this allocation must absorb short-term volatility without panic.
Utilities & Infrastructure — IGF
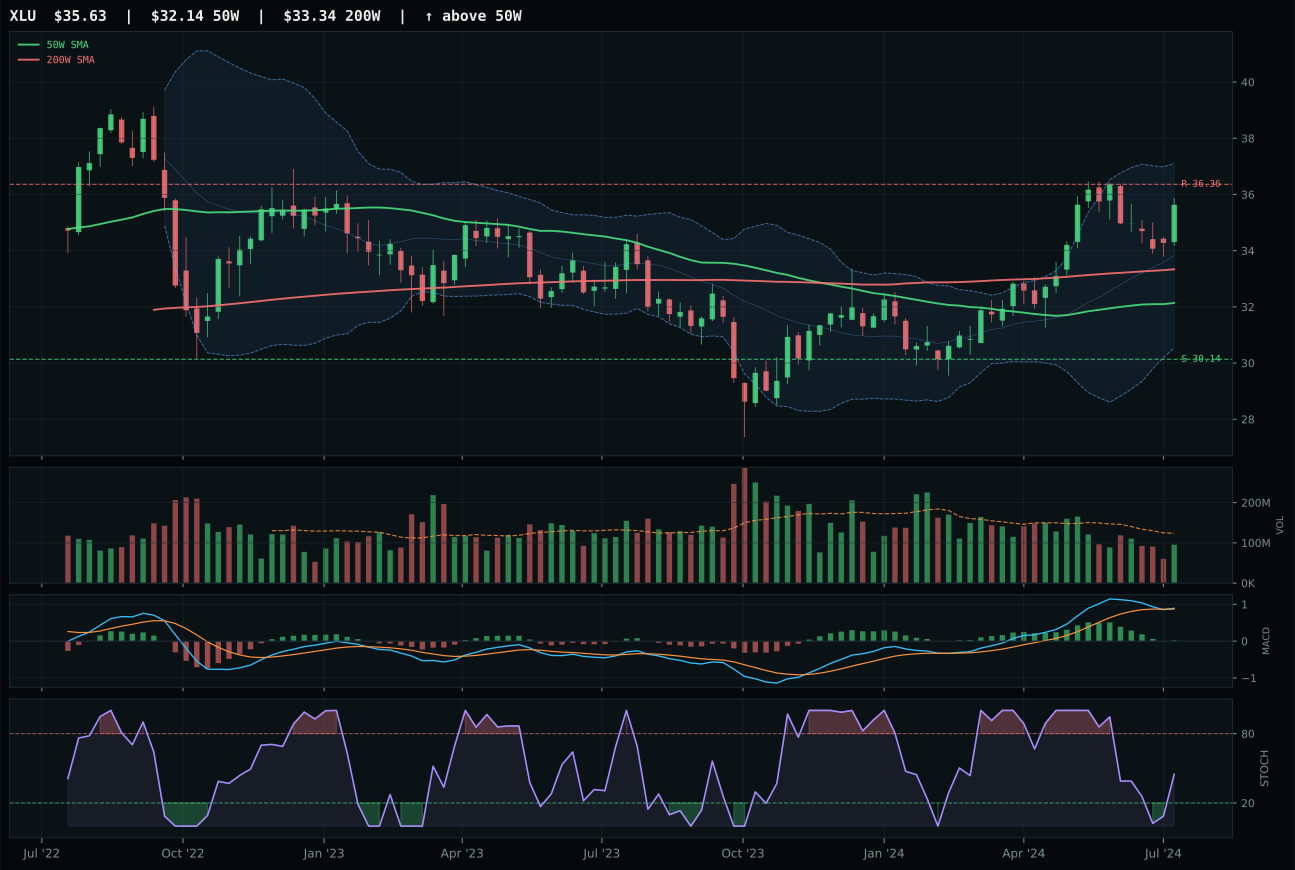
XLU has a neutral structure profile with 1.4% 13-week relative strength versus SPY.
A failed hold above support would weaken the setup.
Actionable but governed by invalidation levels.
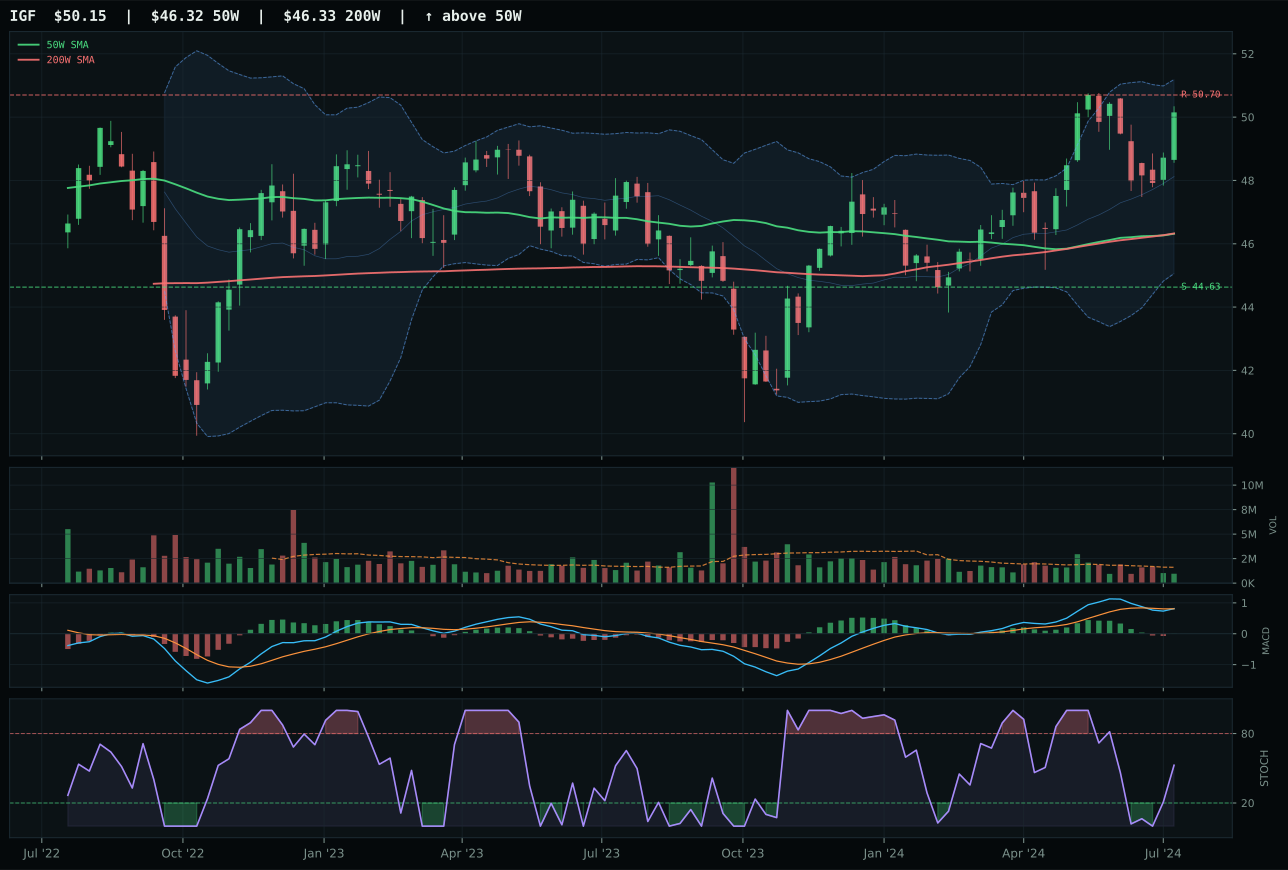
IGF has a neutral structure profile with -1.4% 13-week relative strength versus SPY.
A failed hold above support would weaken the setup.
Actionable but governed by invalidation levels.
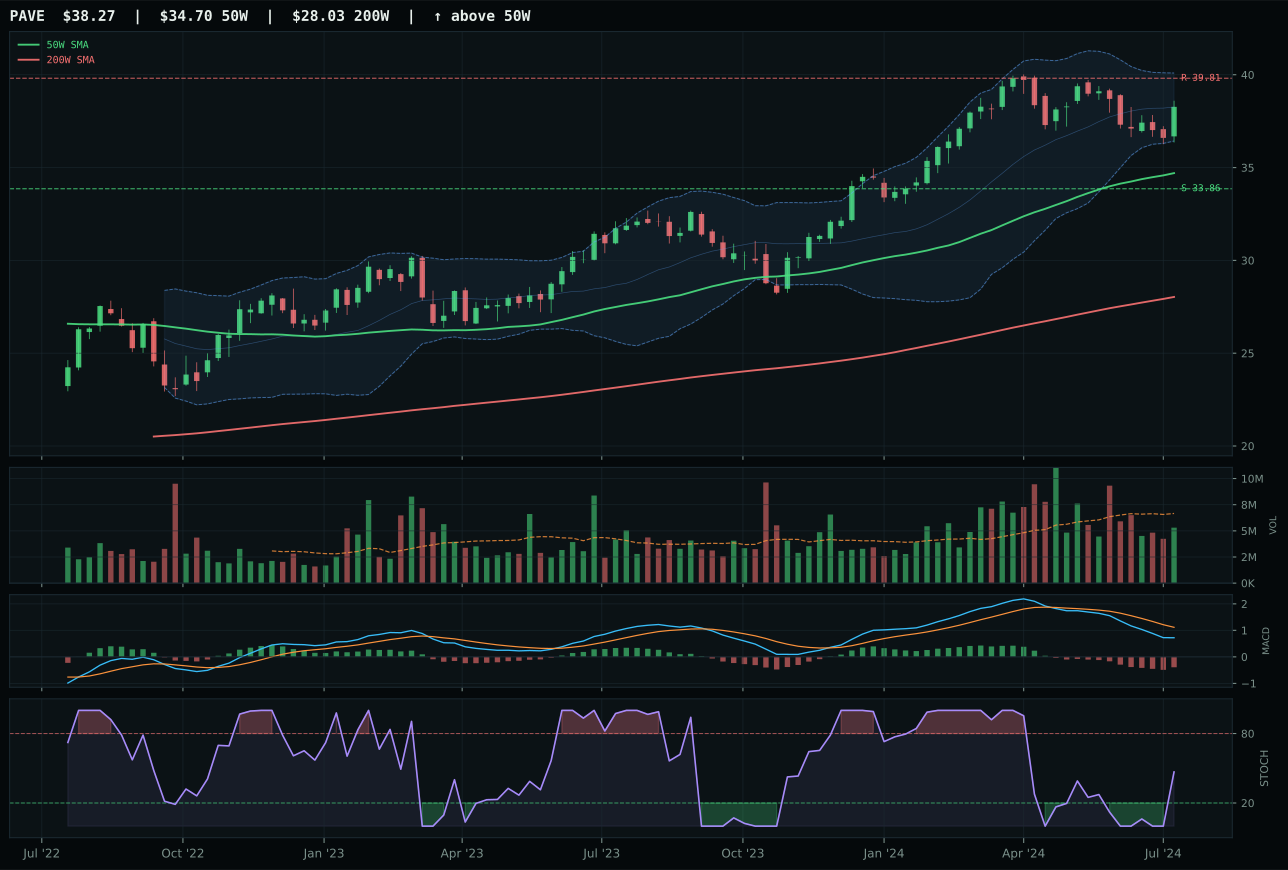
PAVE has a neutral structure profile with -9.9% 13-week relative strength versus SPY.
A failed hold above support would weaken the setup.
Actionable but governed by invalidation levels.
IGF wins a tight, technically strong category by holding superior timing (78.0 versus XLU's 70.0) despite XLU's higher momentum score (77 versus 65). Price is 8.3% above the 50W in neutral structure with bullish-but-flattening MACD and rising mid-zone stochastic RSI, the definition of orderly entry without excitement. XLU posts 11.0% 13W return versus IGF's 8.2%, but that strength is paired with 1.4% positive RS versus SPY, signaling late-stage outperformance and stretched valuation. IGF's global infrastructure focus and -1.4% RS tell a different story: steady accumulation without euphoria. Thin participation (0.59x 20W average) is the shared weakness, but IGF's neutral relative momentum confirms the move is being absorbed calmly rather than chased.
Utilities & Infrastructure earns 5% allocation as a tier-2 category with a 58.1 final score, a solid mid-rank that reflects strong technical quality backed by reliable macro support. Disinflation helps this exposure (+7), disinflation pressure is active (+6), and transition/mixed macro state is favorable (+4), creating a 62.0 category macro fit—one of the strongest in the portfolio. IGF's 62.6 technical evidence and bullish-but-flattening MACD confirm utilities are not breaking out but rather consolidating into the next leg higher. The duration benefit of falling rates and the income stability during disinflation create a structural case for this allocation; price is not extended, volume is defensible, and the 38.6 upside-to-downside risk ratio is balanced. This is a conviction hold rather than a tactical trade, and the position should grow if price breaks above 50.70 resistance with volume participation improving.
Precious Metals — GLD
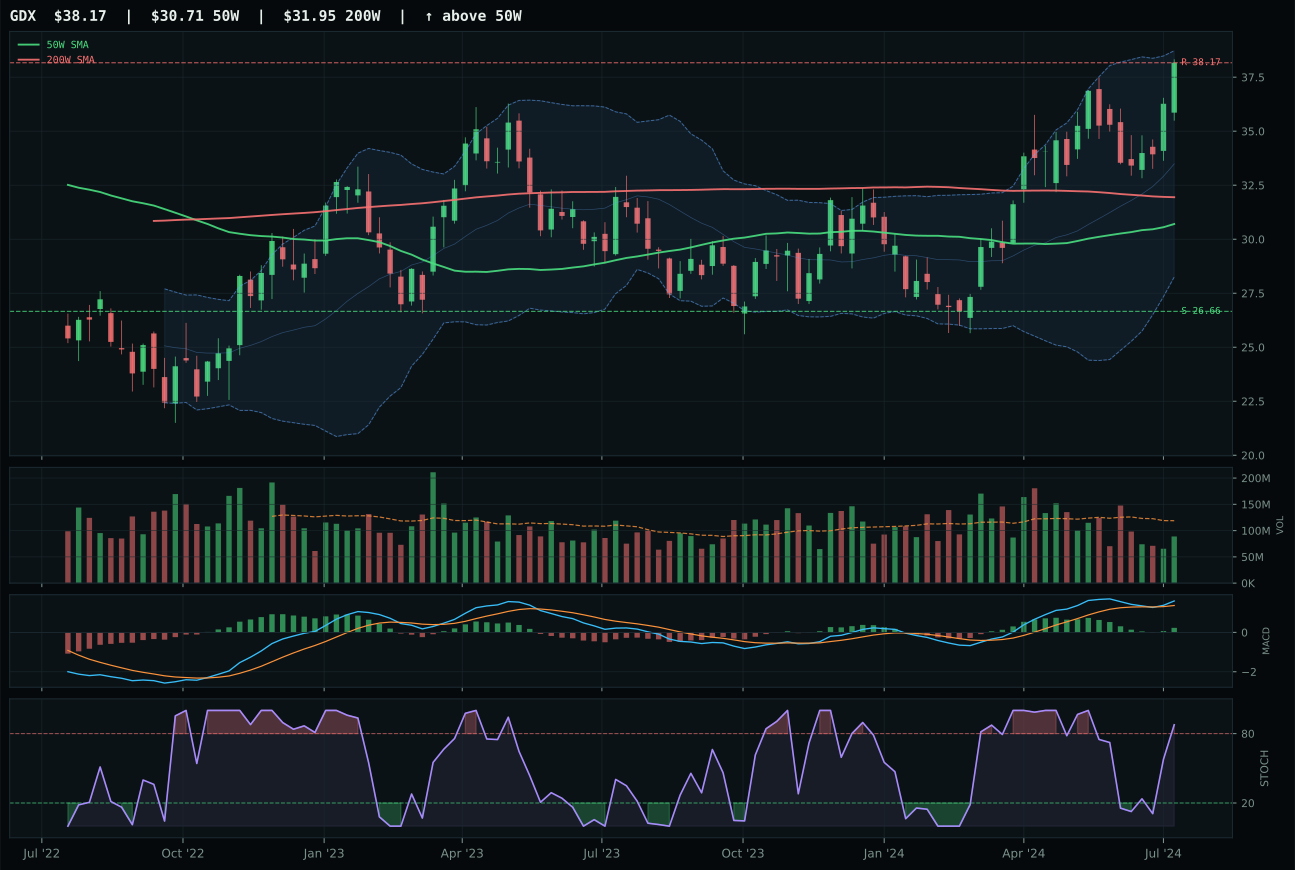
GDX has a vertical extension profile with 3.4% 13-week relative strength versus SPY.
A failed hold above support would weaken the setup.
Actionable but governed by invalidation levels.
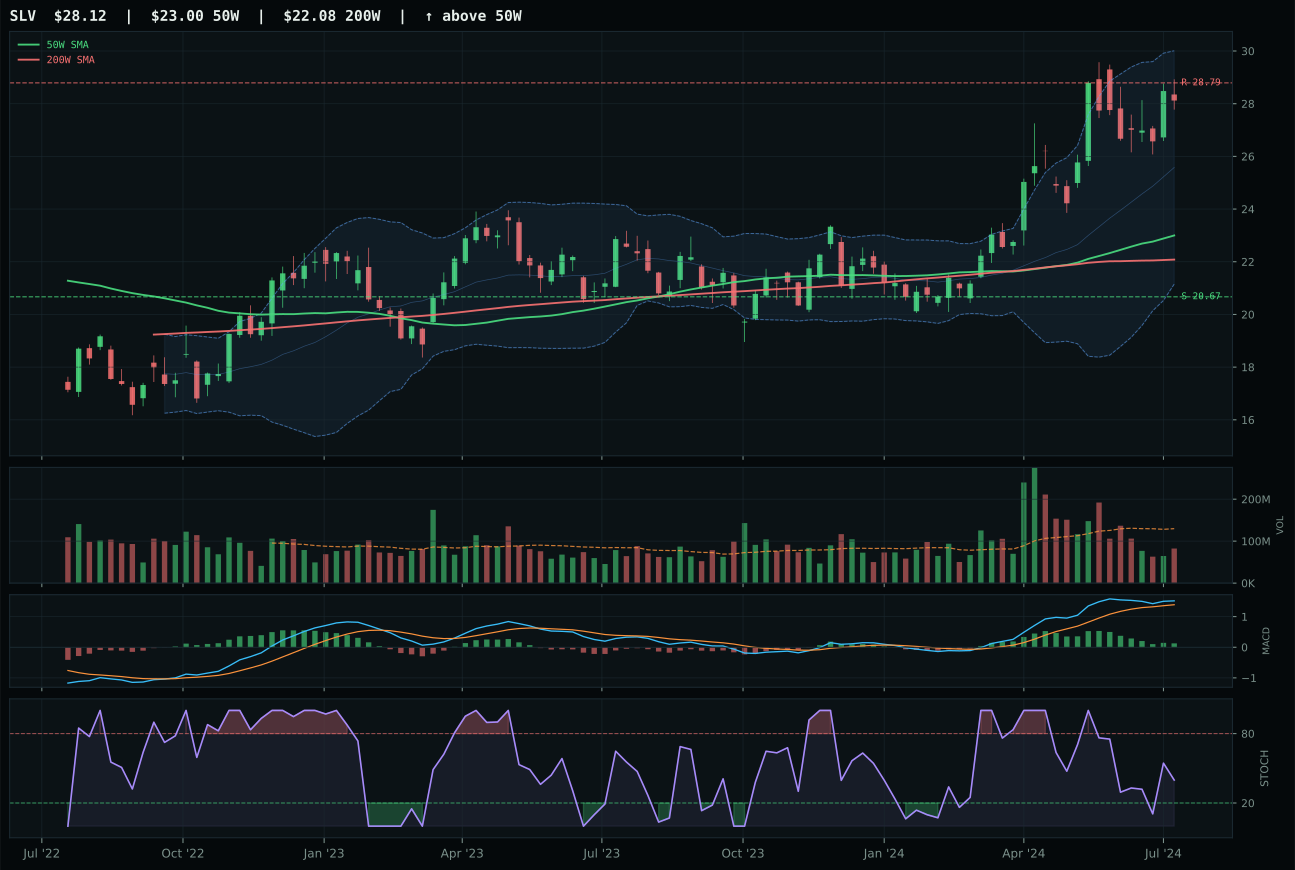
SLV has a vertical extension profile with 0.1% 13-week relative strength versus SPY.
A failed hold above support would weaken the setup.
Actionable but governed by invalidation levels.
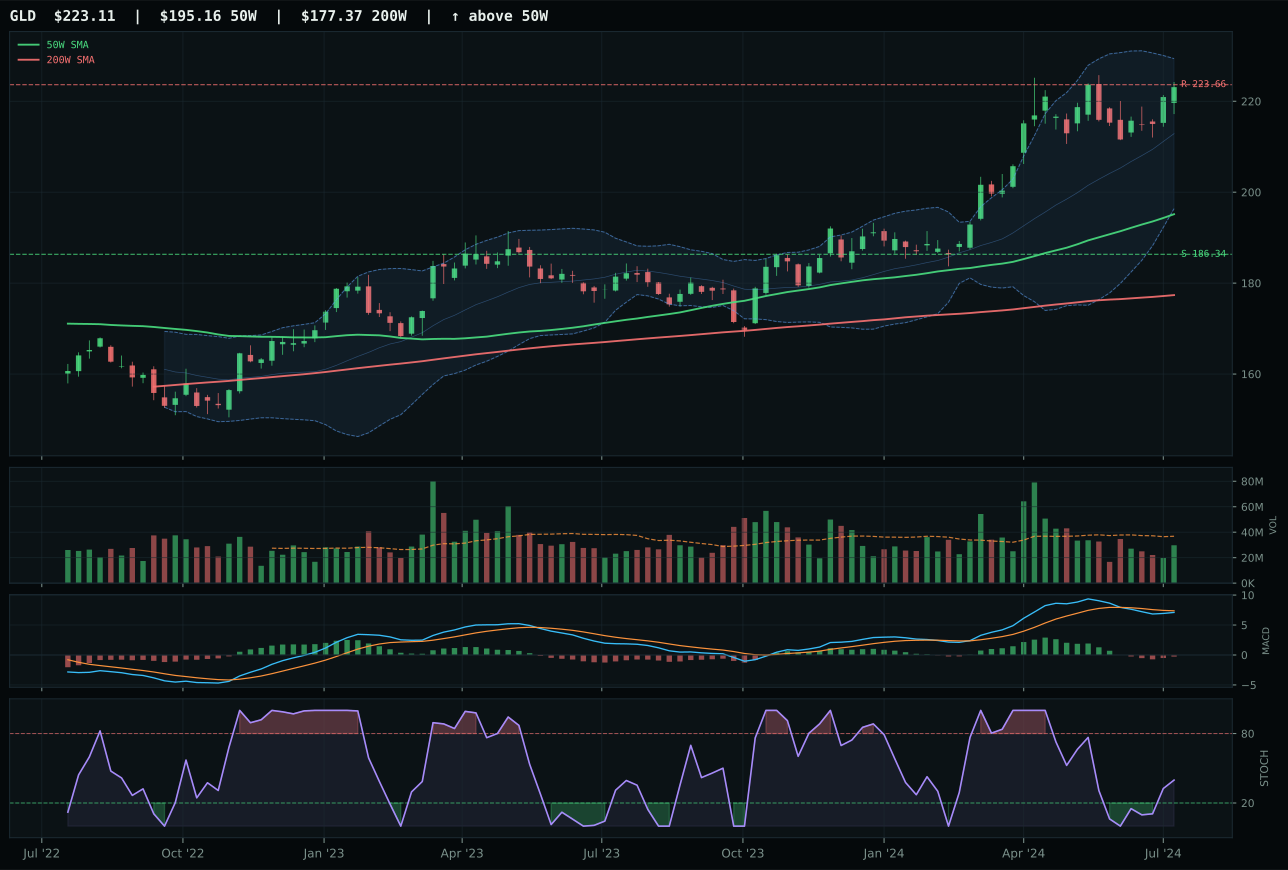
GLD has a neutral structure profile with -6.8% 13-week relative strength versus SPY.
A failed hold above support would weaken the setup.
Actionable but governed by invalidation levels.
GLD wins a three-way tie between broken technical setups by offering the calmest entry angle and the most stable macro narrative. Price is 14.3% extended from the 50W, but neutral structure and cleanliness of 50.0 reflect an orderly, sideways consolidation rather than vertical explosion. GDX's 24.3% extension and overbought momentum (stochastic RSI 1.00) alongside bullish-but-improving MACD reads as momentum climax, not accumulation. GLD's 70.0 timing score versus GDX's 37.0 is the decisive technical edge: distance from the 50W is deeper, yes, but stochastic RSI at 0.40 (rising mid-zone) and bearish-weakening MACD signal GLD is coiling for the next move rather than exhausting into it. Category RS of -6.8% hurts all three, but GLD's selection reflects disinflation pressure (+8) favoring duration and safety over leverage.
Precious Metals earns 5% allocation as a tier-2 category with a 49.6 final score, a soft rank that reflects macro headwinds offsetting technical resilience. Disinflation is a +8 tailwind for gold because it removes inflation hedging urgency and locks in real yields, but risk appetite positive (-4 descriptor) works against the trade—equity markets are bid, so gold's insurance value is academically interesting but capital is flowing elsewhere. The GLD/GDX spread reveals this tension: GDX's leverage to mining earnings (bullish MACD, 13.1% 13W return, 3.4% RS) tempts spec traders, but GLD's monetary hedge story (disinflation pressure, -6.8% RS, muted momentum) is the structural case. The 5% slot holds this position as a macro anchor rather than a trading vehicle; if credit stress or liquidity stress materially worsens, GLD's defensive positioning will be vindicated, but the current regime offers no urgency.
Nuclear Energy — URA
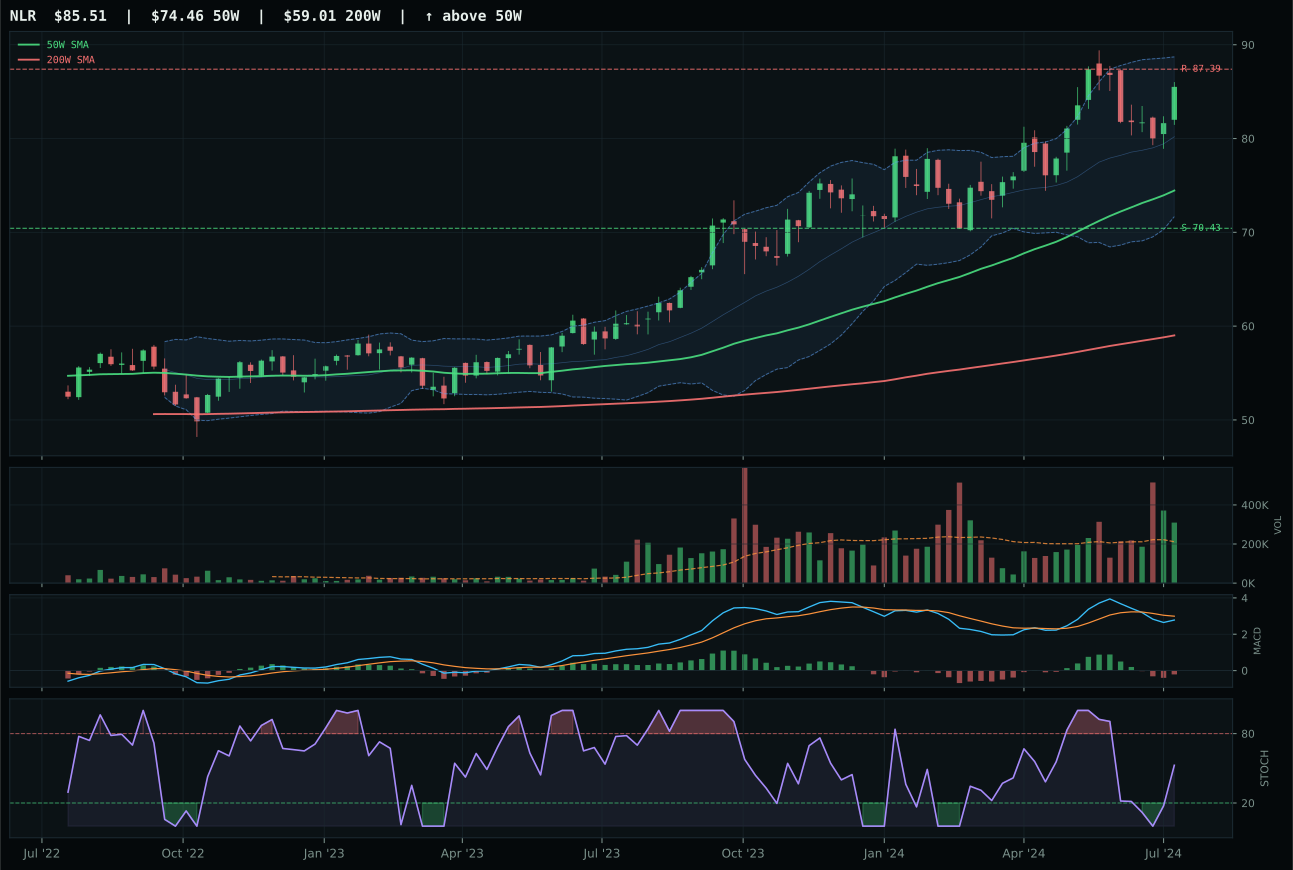
NLR has a neutral structure profile with -0.8% 13-week relative strength versus SPY.
A failed hold above support would weaken the setup.
Actionable but governed by invalidation levels.
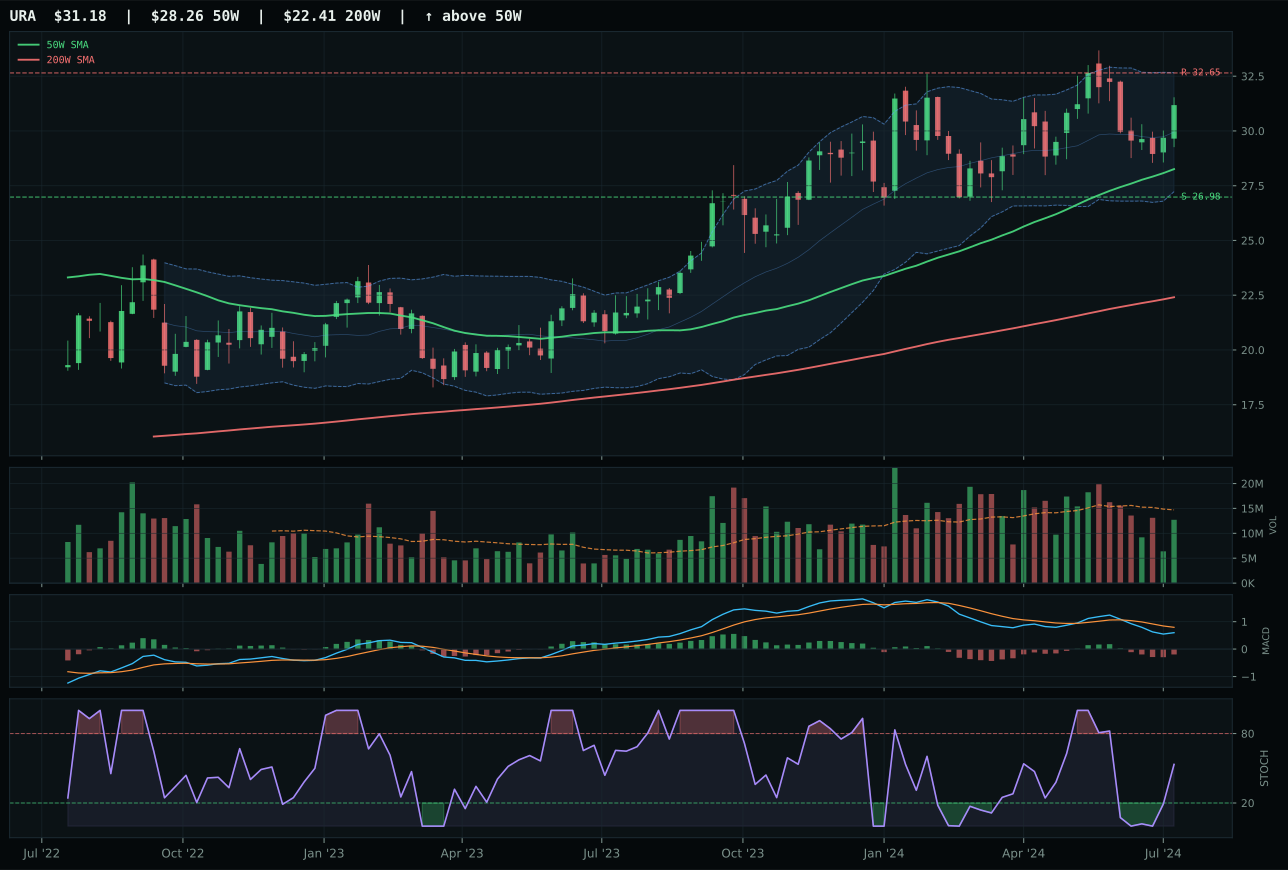
URA has a neutral structure profile with -6.4% 13-week relative strength versus SPY.
A failed hold above support would weaken the setup.
Actionable but governed by invalidation levels.
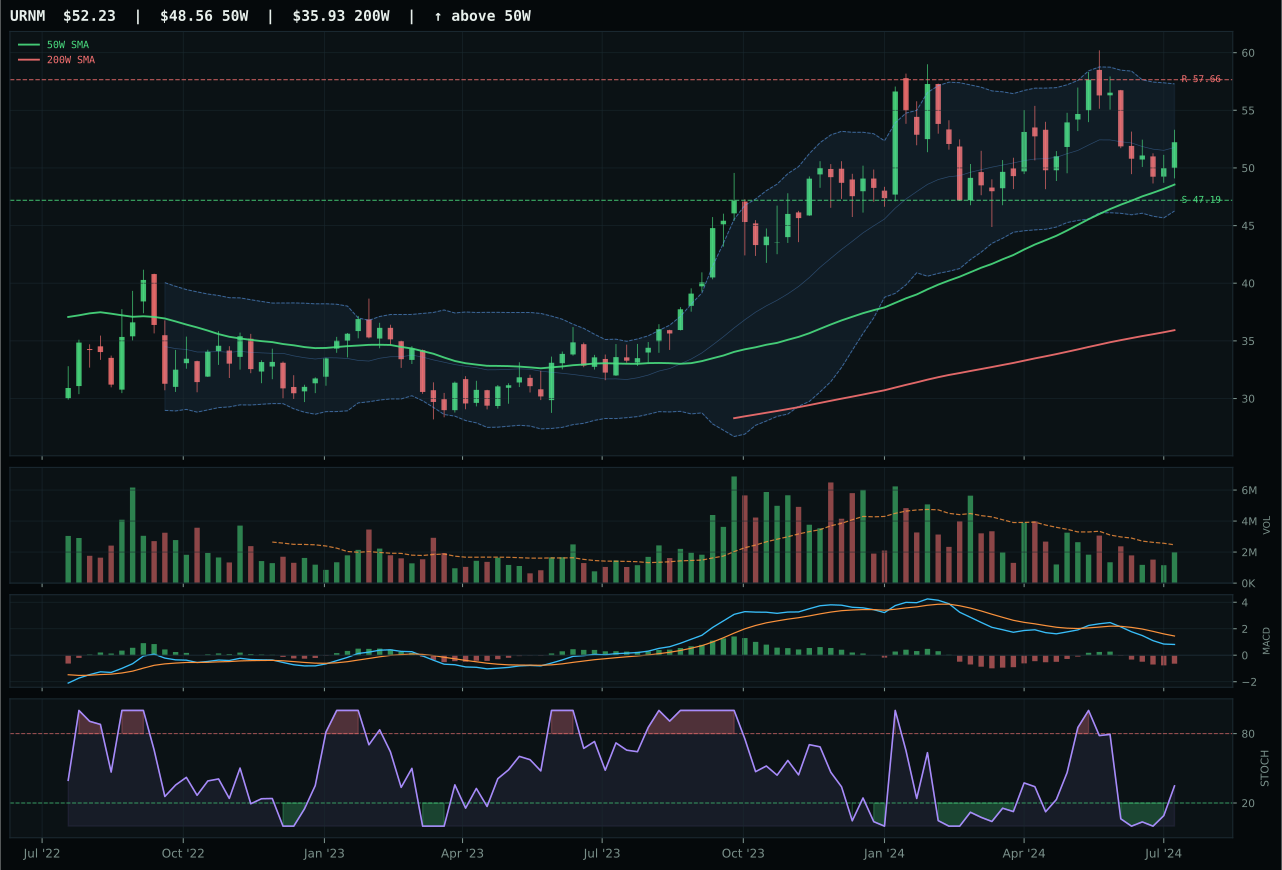
URNM has a neutral structure profile with -10.6% 13-week relative strength versus SPY.
A failed hold above support would weaken the setup.
Actionable but governed by invalidation levels.
URA wins a tight race against NLR by posting superior risk/reward (50.2 versus 46.8) despite NLR's stronger absolute technical evidence (60.5 versus 44.9). Price is 10.3% above the 50W in neutral structure with rising mid-zone stochastic RSI (0.53) and bearish-weakening MACD, neither exciting nor broken. NLR posts higher momentum (63 versus 38) and above-average volume participation, but that strength translates to less attractive upside-to-downside asymmetry: more extended means more risk for incremental returns. The 78.0 timing score favors URA's middle ground over NLR's higher absolute technical signals; category RS is flat for both (0.0%), so the tie-breaker is entry quality rather than structural advantage.
Nuclear Energy earns 5% allocation as a tier-2 category with a 47.5 final score, a middle-rank hold justified by modest macro tailwinds and a defensible technical setup. Real asset sponsorship (+7) and AI growth sponsorship (+5) reflect dual narratives: nuclear as baseload renewable power and as the only reliable energy source for data center build-outs. However, liquidity stress (-7) and credit stress (-5) are active headwinds, and the 50.0 category-level macro fit shows structural support is modest. URA's 44.9 technical evidence confirms this is not a momentum play; the 5% allocation reflects thesis strength more than setup conviction. The nuclear thesis—energy scarcity, AI power demands, and decarbonization trends—is real, but execution risk is high. This is a position sized for patience; price would need to break above resistance at 32.65 with volume confirmation before increasing the allocation.
Defense & Aerospace — XAR
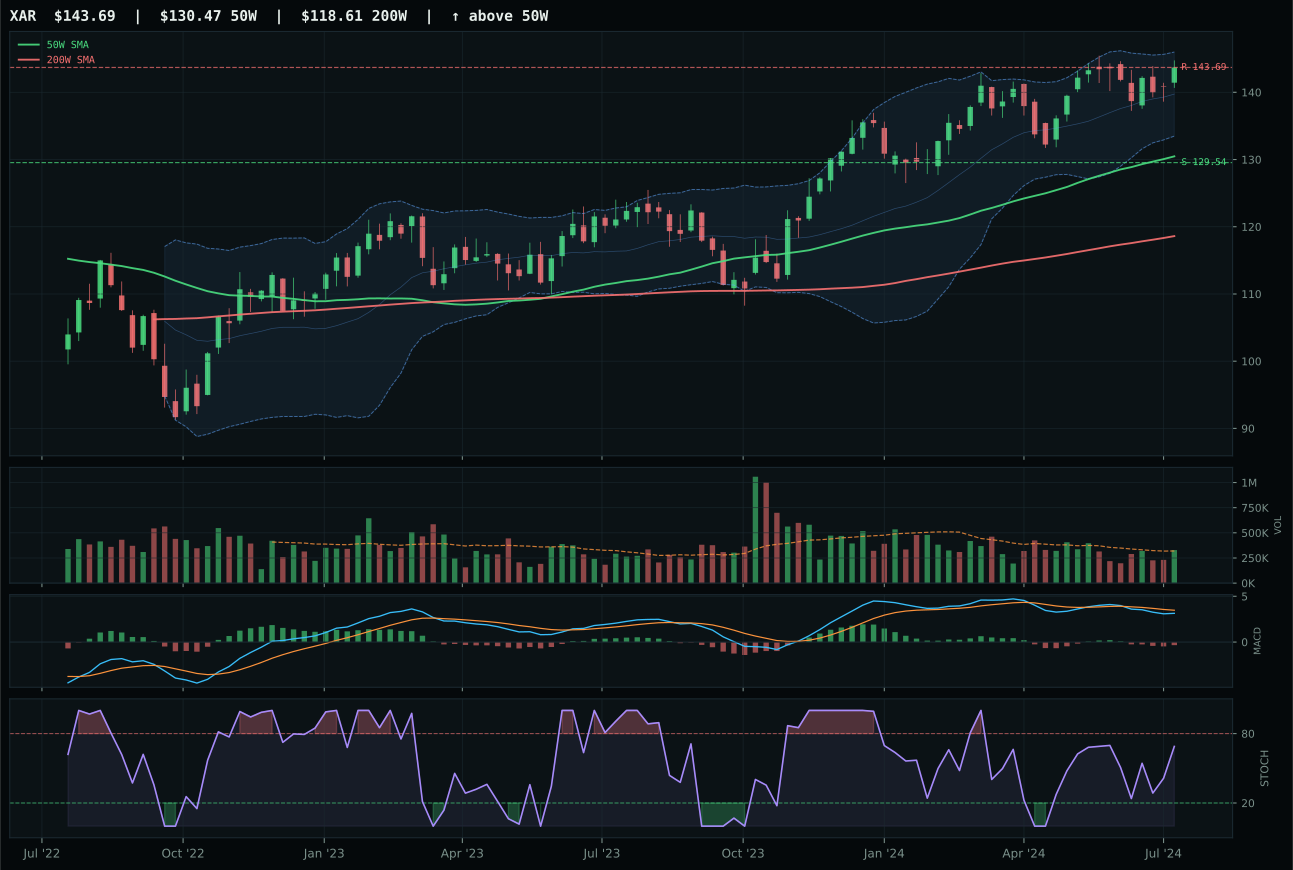
XAR has a neutral structure profile with -2.2% 13-week relative strength versus SPY.
A failed hold above support would weaken the setup.
Actionable but governed by invalidation levels.
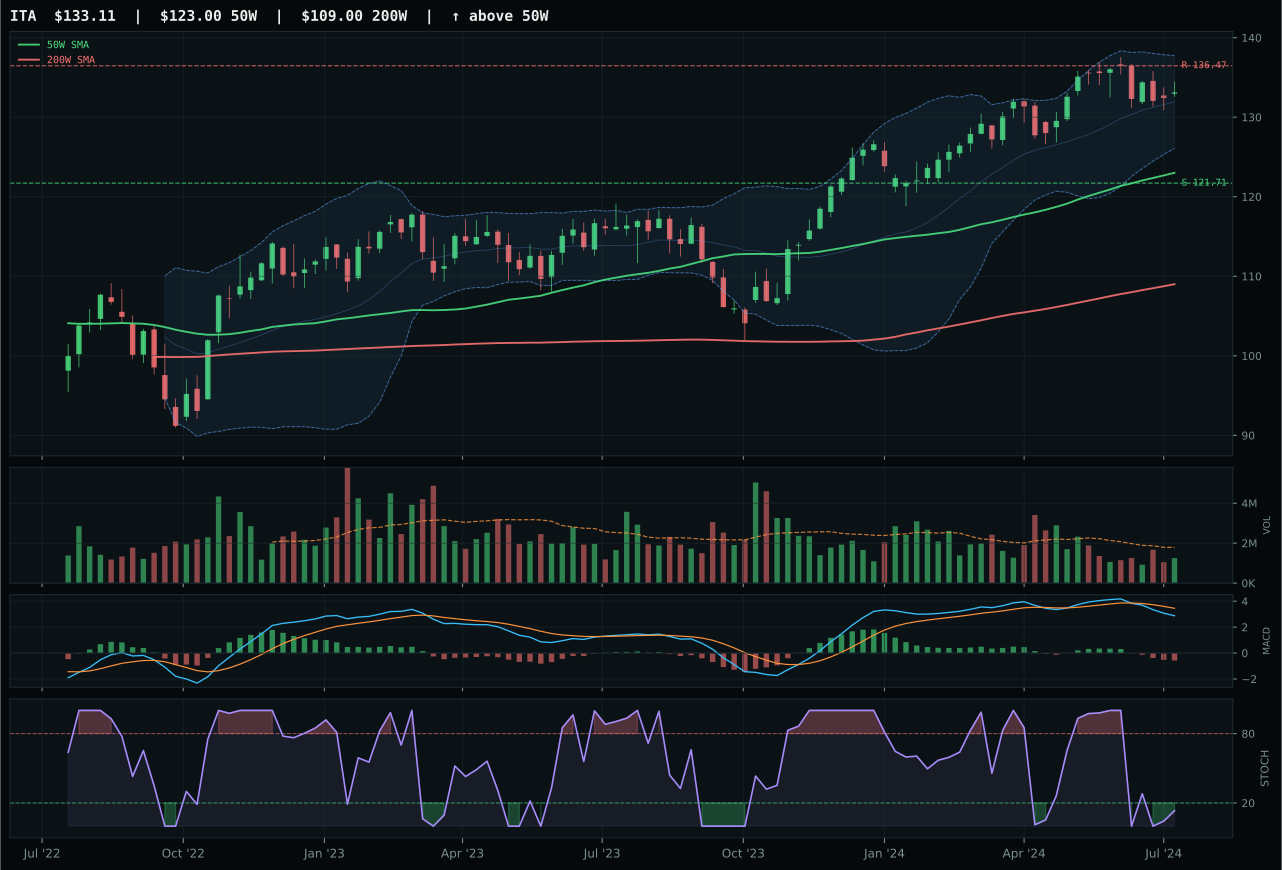
ITA has a neutral structure profile with -5.4% 13-week relative strength versus SPY.
A failed hold above support would weaken the setup.
Actionable but governed by invalidation levels.
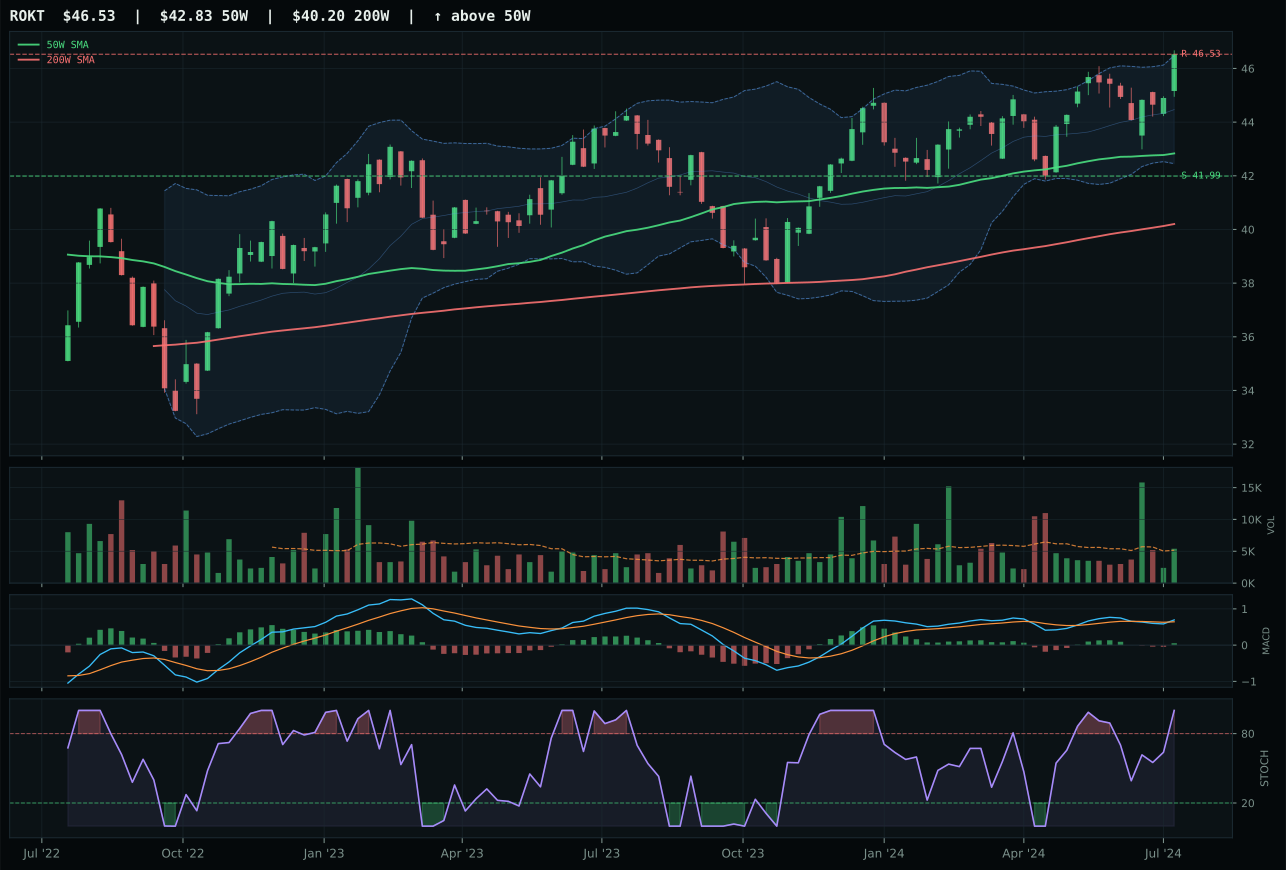
ROKT has a neutral structure profile with -0.4% 13-week relative strength versus SPY.
A failed hold above support would weaken the setup.
Tracked, but not top-2 eligible because: .
XAR wins a weak category by posting the cleanest risk-reward among three broken charts. Price is 10.1% above the 50-week moving average with neutral structure and a bearish-weakening MACD, but stochastic RSI is rising mid-zone (0.69) rather than oversold or overbought, creating a setup that can either compress and explode or roll over gracefully if buyers flee. XLK and ITA both scored lower because they added either timing deterioration (ITA's oversold RSI lacked confirmation) or relative weakness (ITA's -5.4% RS versus SPY versus XAR's -2.2%). The 10.1% distance from the 50W is far enough to avoid the trap of oversold bounce-chase, yet close enough to suggest support is actually being tested rather than casually held.
Defense & Aerospace receives 5% allocation as a tier-2 category, reflecting its 43.9 final score—a middle-of-the-pack rank that earns a seat but not a priority. The category's macro fit is genuinely neutral; no descriptor profile favored this exposure, and the 51.0 macro/narrative score confirms disinflation and risk appetite offer neither tailwind nor headwind. XAR's 49.1 technical evidence is also pedestrian, neither broken nor clean. What justifies the 5% hold is momentum persistence and the absence of a better use case for that capital. This is a patience allocation: the setup is defensible, the risk/reward at 50.2 is balanced, and the category could surprise if geopolitical risk appetite suddenly re-emerges. Until then, it sits as a dry powder hedge against equity rotation rather than a conviction play.
Emerging Markets — INDA
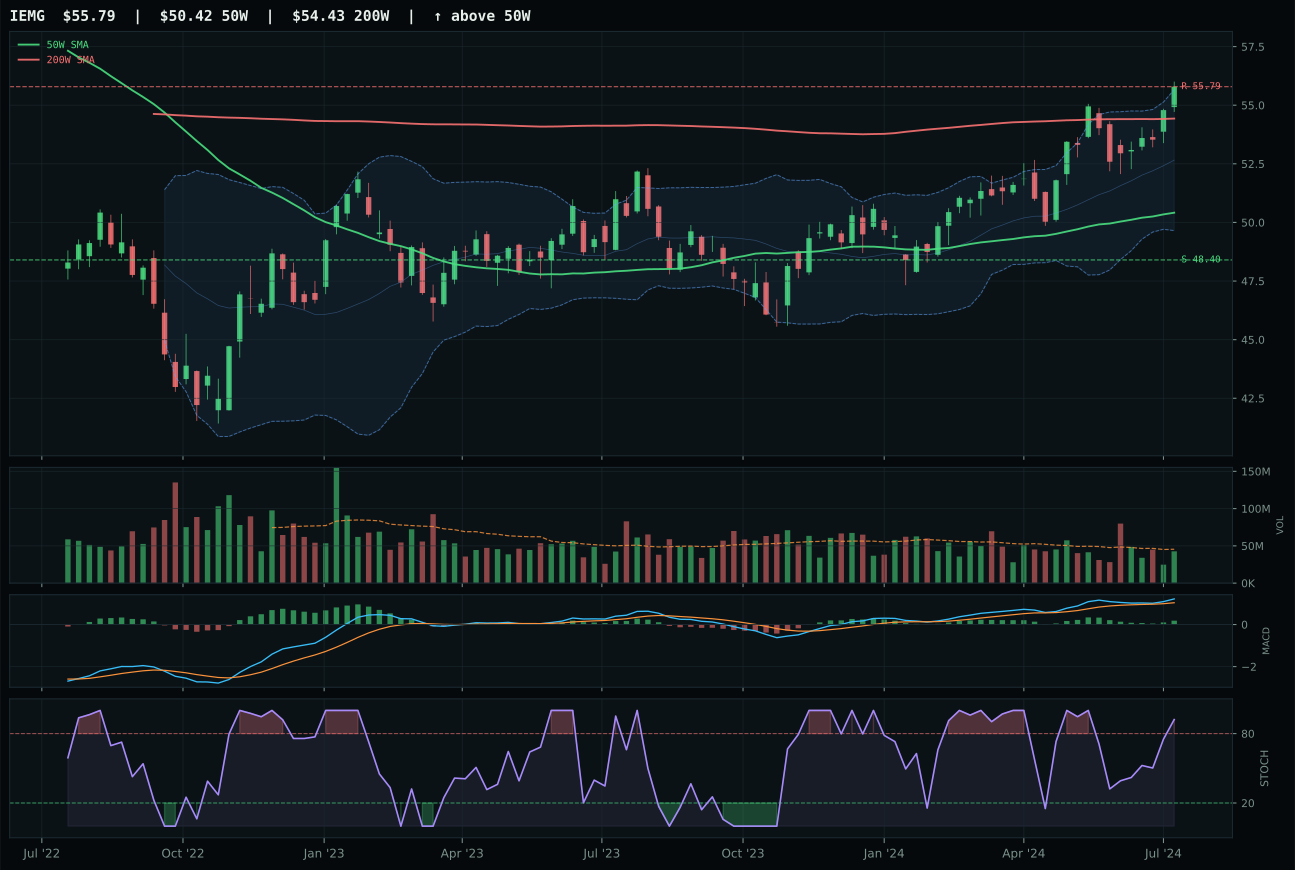
IEMG has a neutral structure profile with -0.2% 13-week relative strength versus SPY.
A failed hold above support would weaken the setup.
Actionable but governed by invalidation levels.
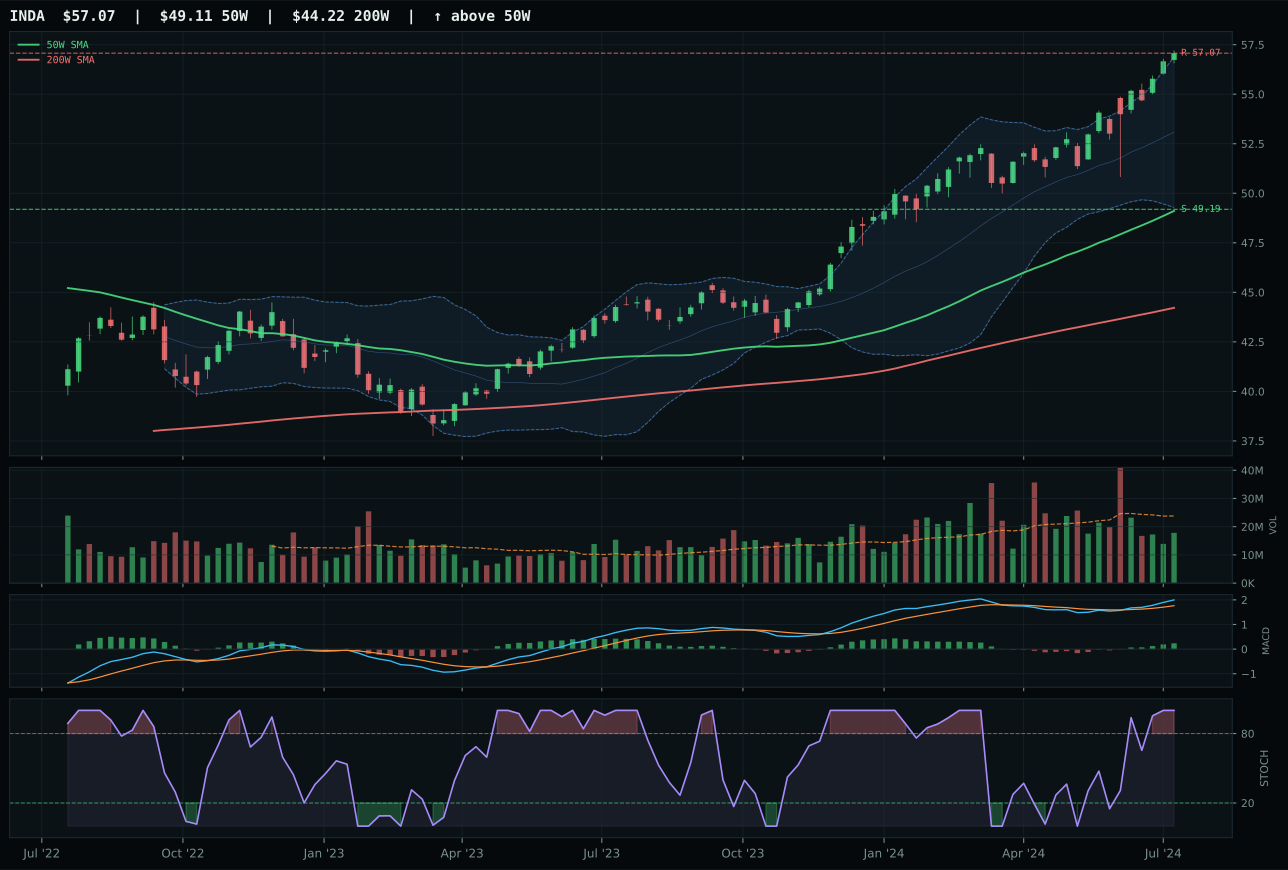
INDA has a vertical extension profile with 0.8% 13-week relative strength versus SPY.
A failed hold above support would weaken the setup.
Actionable but governed by invalidation levels.
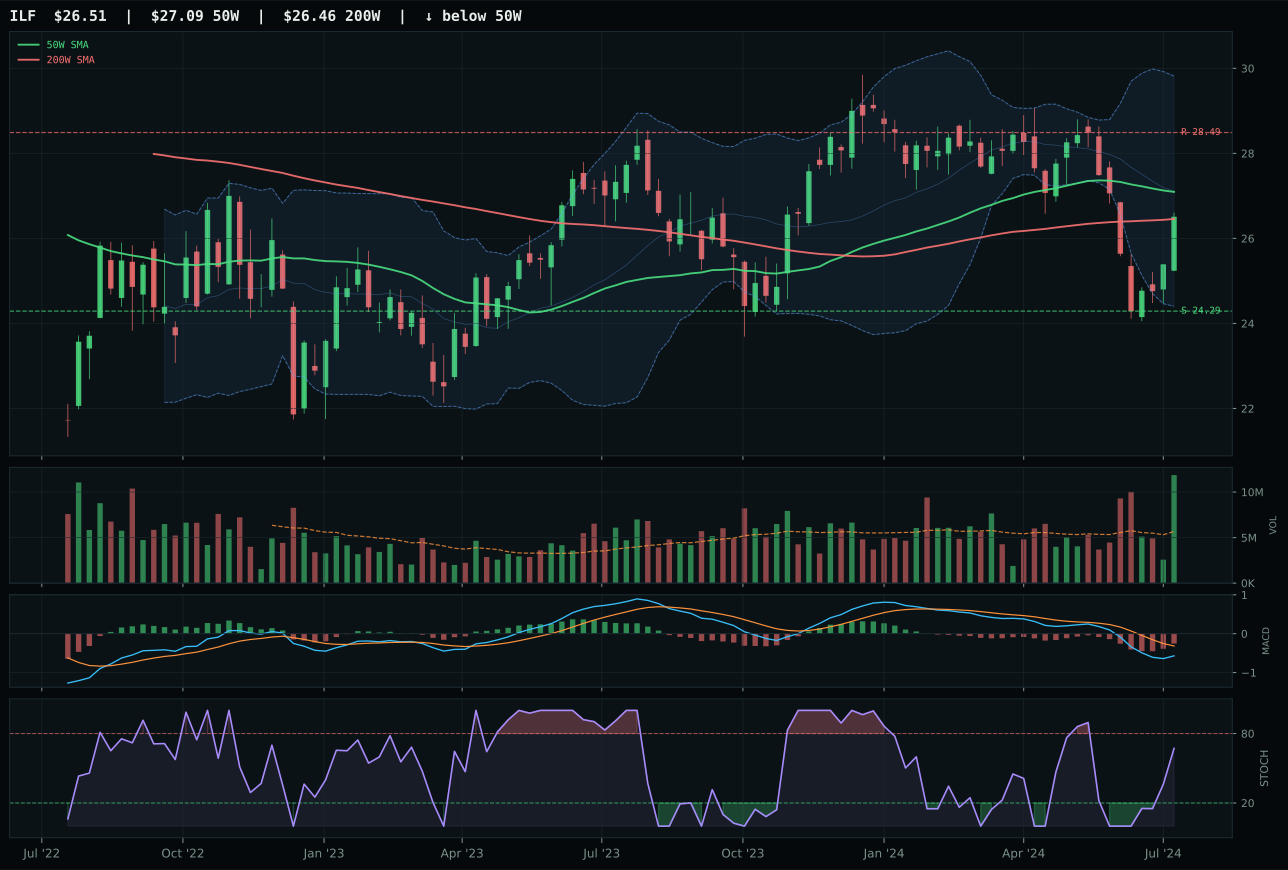
ILF has a compression near 50W profile with -13.7% 13-week relative strength versus SPY.
A failed hold above support would weaken the setup.
Actionable but governed by invalidation levels.
INDA wins by maximizing category-relative strength (+1.1%) and posting the cleanest category momentum (75.6%) despite an extended price setup. Price is 16.2% above the 50W in vertical extension with stochastic RSI at overbought 1.00, traditionally a bearish warning, but INDA's 13W return of 10.5% with RS of 0.8% versus SPY confirms this is early-stage outperformance, not late-stage distribution. IEMG's 59.0 timing score and neutral structure appear technically superior, but IEMG's weaker category RS (0.0%) and macro fit (40.0 versus INDA's mixed setup) reveal IEMG is the broader, slower vehicle. Thin participation (0.75x 20W average) is the weakness both share, but INDA's bullish-and-improving MACD endorses accumulation rather than rejects it.
Emerging Markets earns 5% allocation as a tier-2 category with a 40.4 final score, a low-confidence hold driven almost entirely by India's relative strength narrative. Risk appetite positive (+8) is the only macro descriptor with real weight, and it is active; credit stress (-10) and liquidity stress (-10) actively suppress the category. INDA's 66.3 technical evidence is respectable, but the 48.0 macro/narrative fit is soft—the portfolio is essentially betting on India's structural growth and international equity rotation, not on the current technical setup. IEMG's superior 77.6 technical evidence was overridden by weaker macro fit and category RS, a decision that prioritizes tactical India outperformance over broad EM diversification. This 5% slot is a levered bet on EM rerating if risk appetite stabilizes; if credit stress or liquidity stress worsens, INDA would be a candidate for reduction in favor of zero.
Industrial Metals — COPX
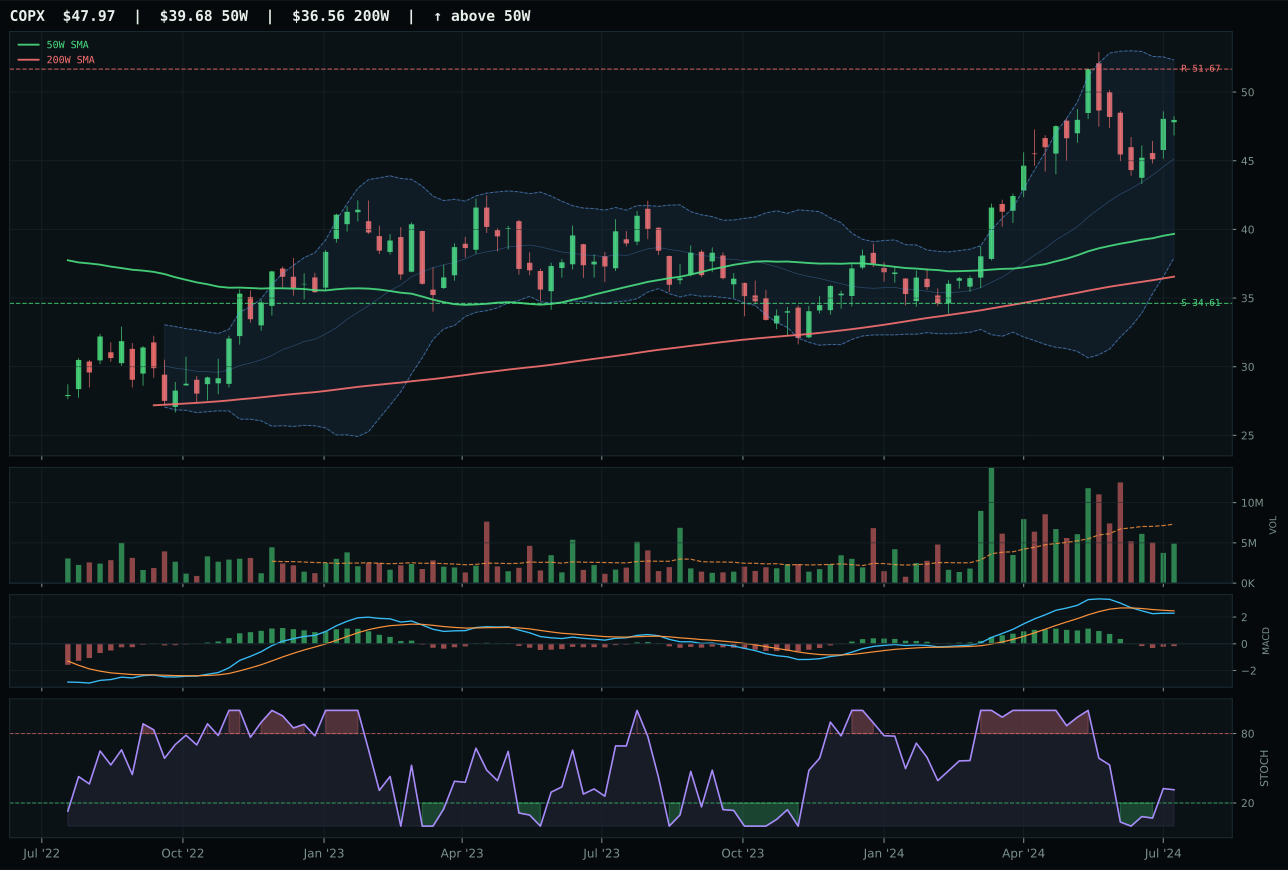
COPX has a vertical extension profile with -4.1% 13-week relative strength versus SPY.
A failed hold above support would weaken the setup.
Actionable but governed by invalidation levels.
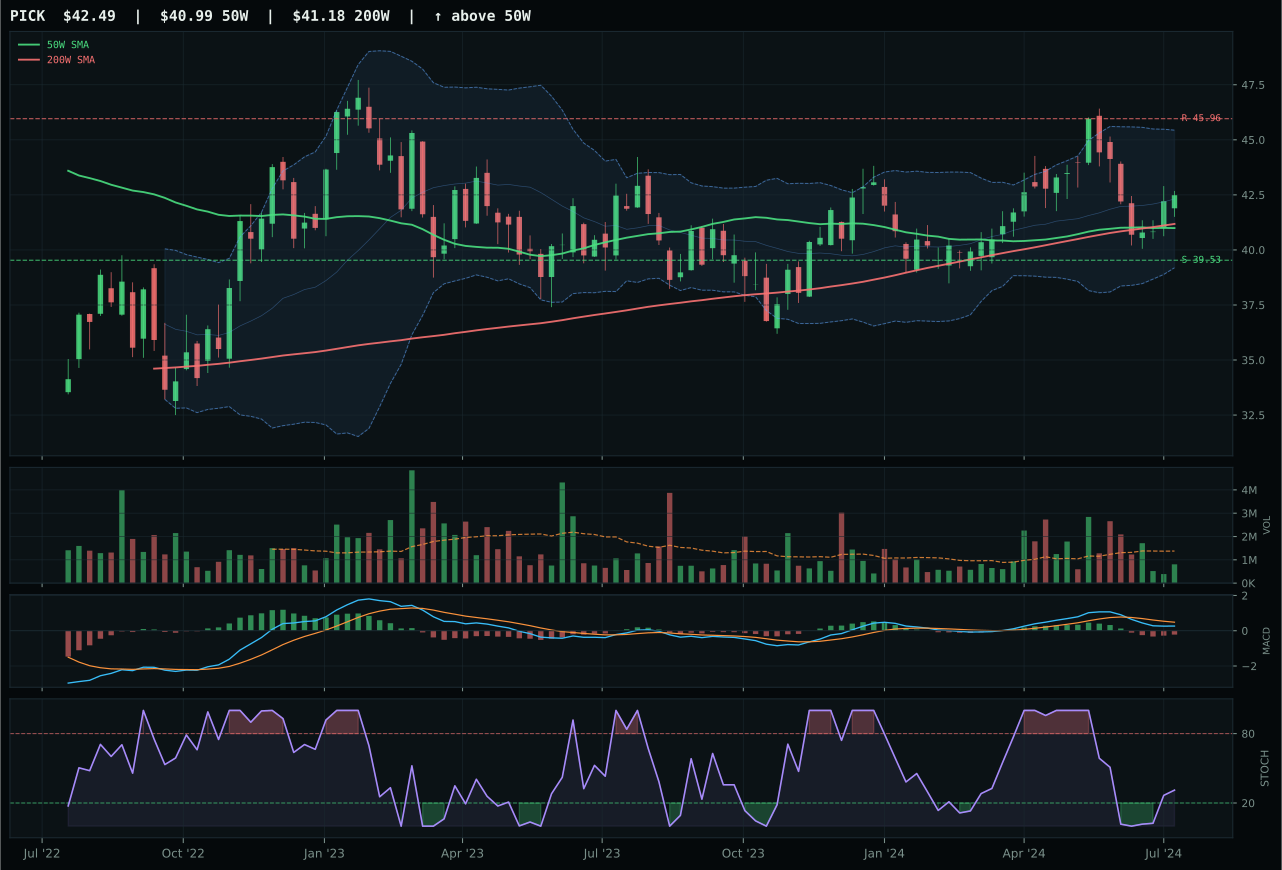
PICK has a neutral structure profile with -10.5% 13-week relative strength versus SPY.
A failed hold above support would weaken the setup.
Actionable but governed by invalidation levels.
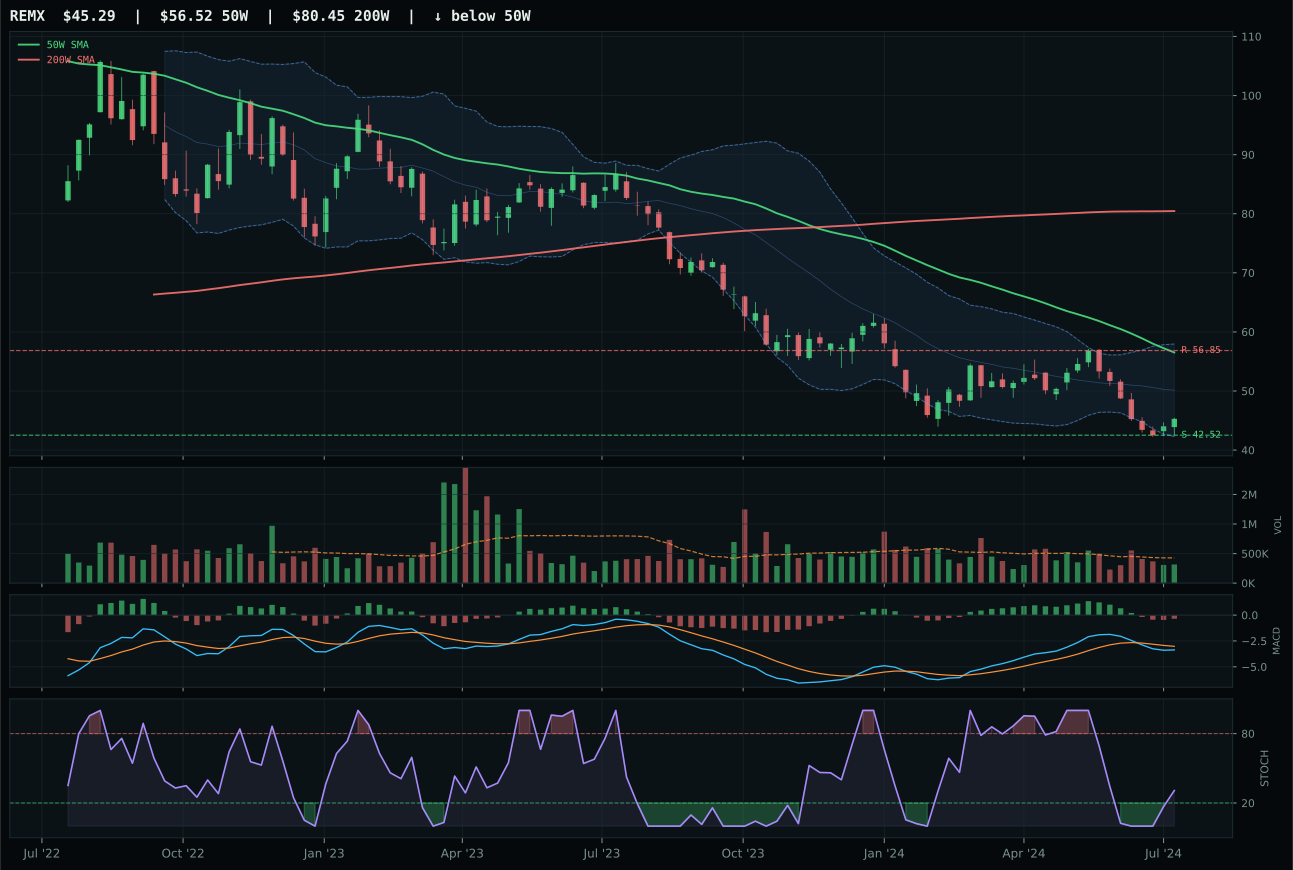
REMX has a neutral structure profile with -22.8% 13-week relative strength versus SPY.
Extension and support failure are the main tactical risks.
Tracked, but not top-2 eligible because: structurally broken.
COPX wins a weak category by posting the strongest category-relative strength (+6.4%) despite absolute weakness across the board. Price is 20.9% extended from the 50W in vertical extension structure, and the 56.0 timing score penalizes that aggressively, but COPX's 13W return of 5.5% with positive RS versus the median signals this name is outperforming its peers in a crumbling complex. PICK's neutral structure and superior risk/reward (71 upside/downside versus COPX's 48.3) appear more attractive on a standalone basis, but PICK posted 0.0% category RS and a 13W return of -0.9%, confirming it is leadership in a dead-money sector. The 62.0 macro/narrative fit is the category's strongest element, driven by metals scarcity (+12) and commodity breadth positive (+7), but without volume participation (0.67x 20W average) and MACD confirmation, this is a macro opinion, not a technical setup.
Industrial Metals earns 5% allocation as a tier-2 category with a 36.0 final score, the weakest justified category hold in the portfolio. Metals scarcity (+14) and commodity breadth positive (+10) are the real tailwinds, reflecting structural demand for copper in energy transition and AI infrastructure build-out. However, the 30.1% technical evidence score reveals the setup is broken: price is extended, MACD is bearish/weakening, volume is thin participation, and timing is compromised. This is a macro allocation fighting against technicals, not a setup driven by confluence. The 5% slot reflects conviction that scarcity narratives will eventually force a re-rating, but the portfolio is essentially betting on thesis strength rather than entry quality. Any further extension above resistance or MACD deterioration should trigger a review; this position survives only on the macro descriptor tailwinds and the opportunity cost of leaving it at zero.
Traditional Energy — XLE
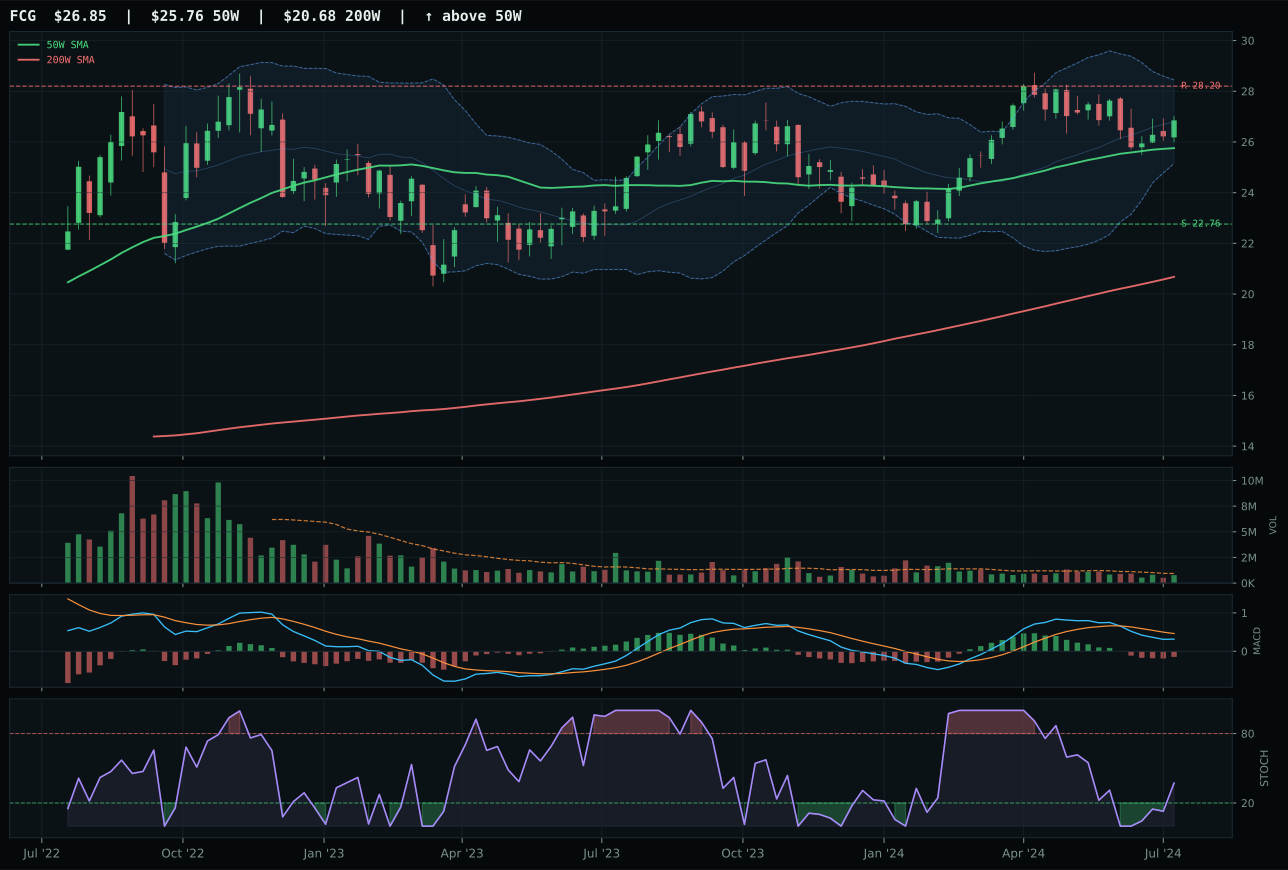
FCG has a neutral structure profile with -13.2% 13-week relative strength versus SPY.
A failed hold above support would weaken the setup.
Actionable but governed by invalidation levels.
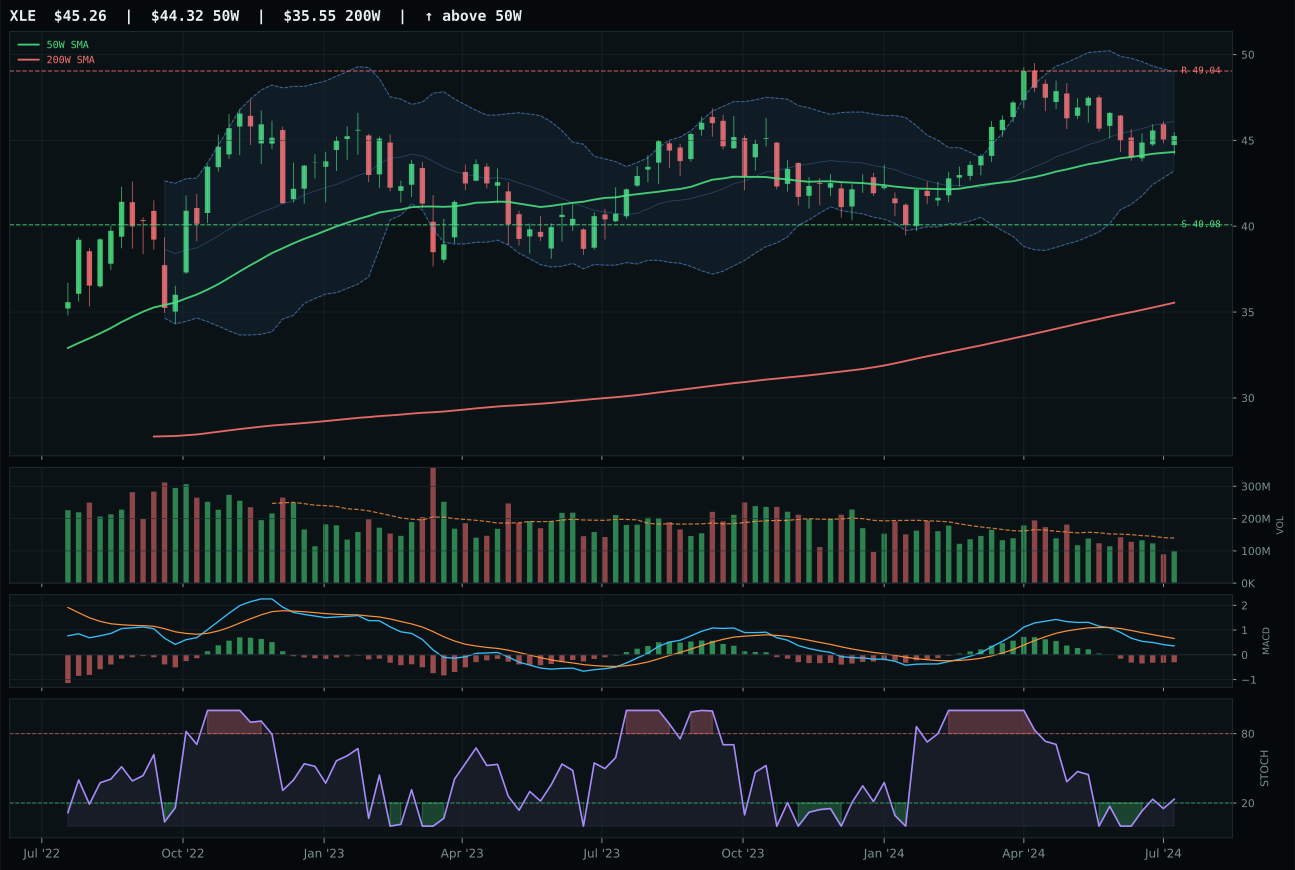
XLE has a compression near 50W profile with -15.5% 13-week relative strength versus SPY.
A failed hold above support would weaken the setup.
Actionable but governed by invalidation levels.
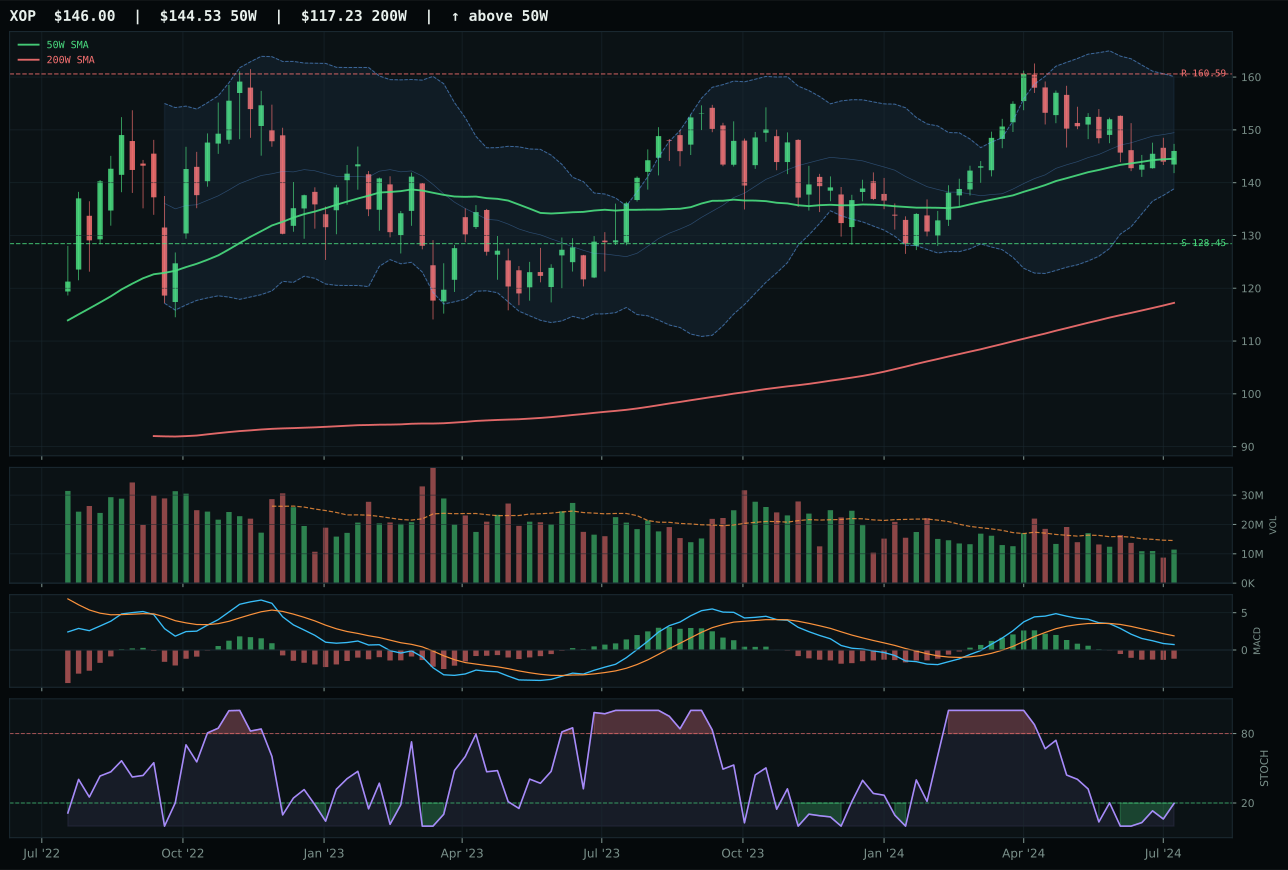
XOP has a compression near 50W profile with -17.2% 13-week relative strength versus SPY.
A failed hold above support would weaken the setup.
Actionable but governed by invalidation levels.
XLE wins by virtue of perfect timing (100.0 score) despite all three ETFs posting negative momentum and RS weakness. Price is 2.1% above the 50W in compression structure near support, and that proximity to the mean is the operative advantage: XLE is coiling for expansion if buyers defend the level, while FCG and XOP are coiling for breakdown below support. The 63.8 risk/reward reflects tight downside (12.9% to support) against moderate upside (-7.7% to resistance), a defined-risk setup that beats FCG's equivalent 49.8 score through superior positioning. MACD is bearish but improving versus FCG's bearish/weakening deterioration, another subtle but meaningful technical difference. The real story here is that all three are broken; XLE merely breaks less violently.
Traditional Energy earns 0% allocation this week, ranked 9th or 10th among categories and failed eligibility screening. The final 6.8 score reflects disinflation actively hurting this exposure (-10) and category-level macro fit of only 23.0—the worst in the portfolio. Energy benefits from real asset sponsorship (+7), but that pales against disinflation pressure (-10), credit stress (-7), and liquidity stress (-7) actively pushing capital away. XLE's own technical evidence (58.1) is respectable on a relative basis, but the macro regime is a headwind not a tailwind. This allocation returns only if the macro state shifts toward inflation concerns or real asset sponsorship suddenly dominates; neither is present. The category sits at zero because capital in a disinflation regime should flow toward duration-sensitive growth and defensive income, not cyclical commodities with negative momentum and poor relative strength.
Agriculture & Livestock — MOO
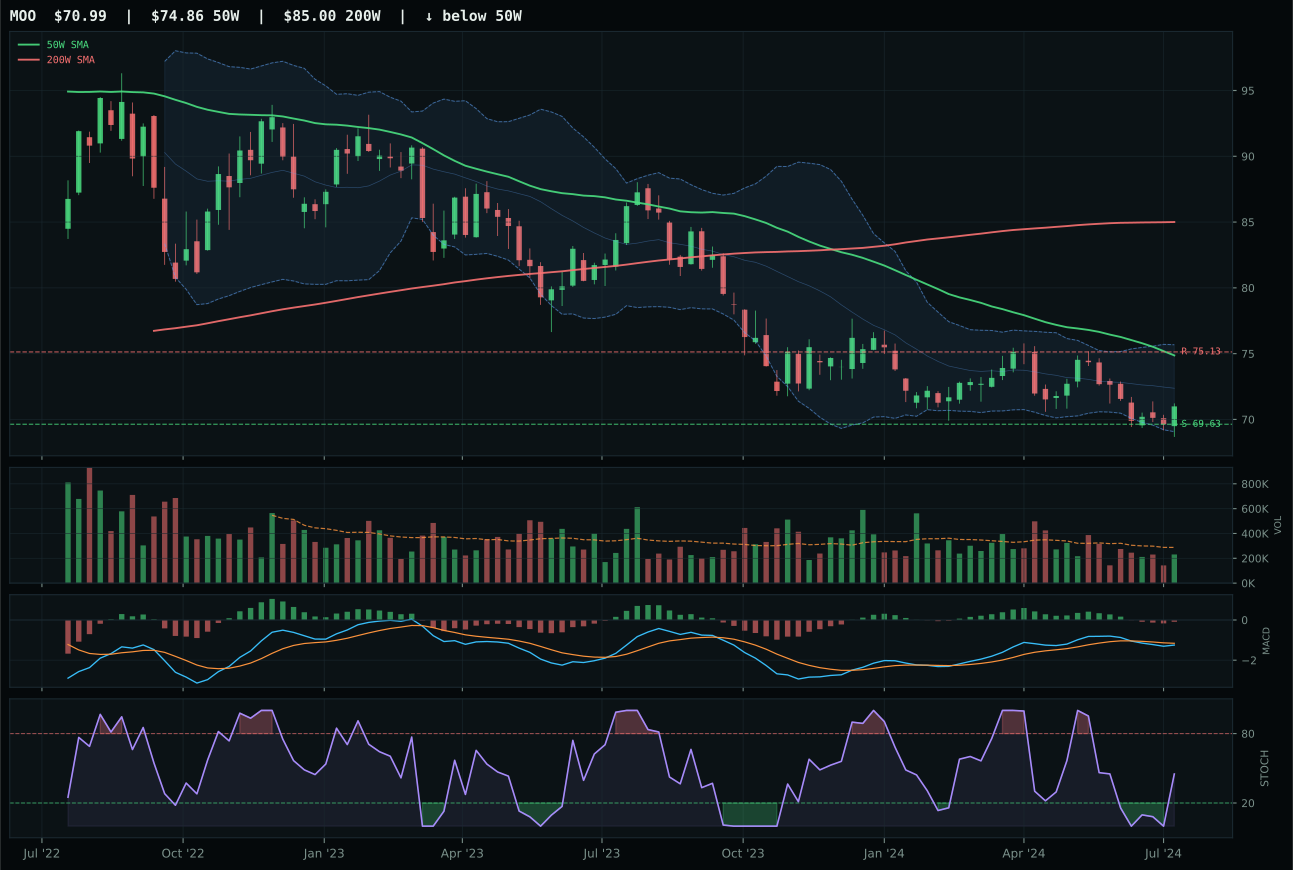
MOO has a pullback into support profile with -11.0% 13-week relative strength versus SPY.
Extension and support failure are the main tactical risks.
Tracked, but not top-2 eligible because: structurally broken.
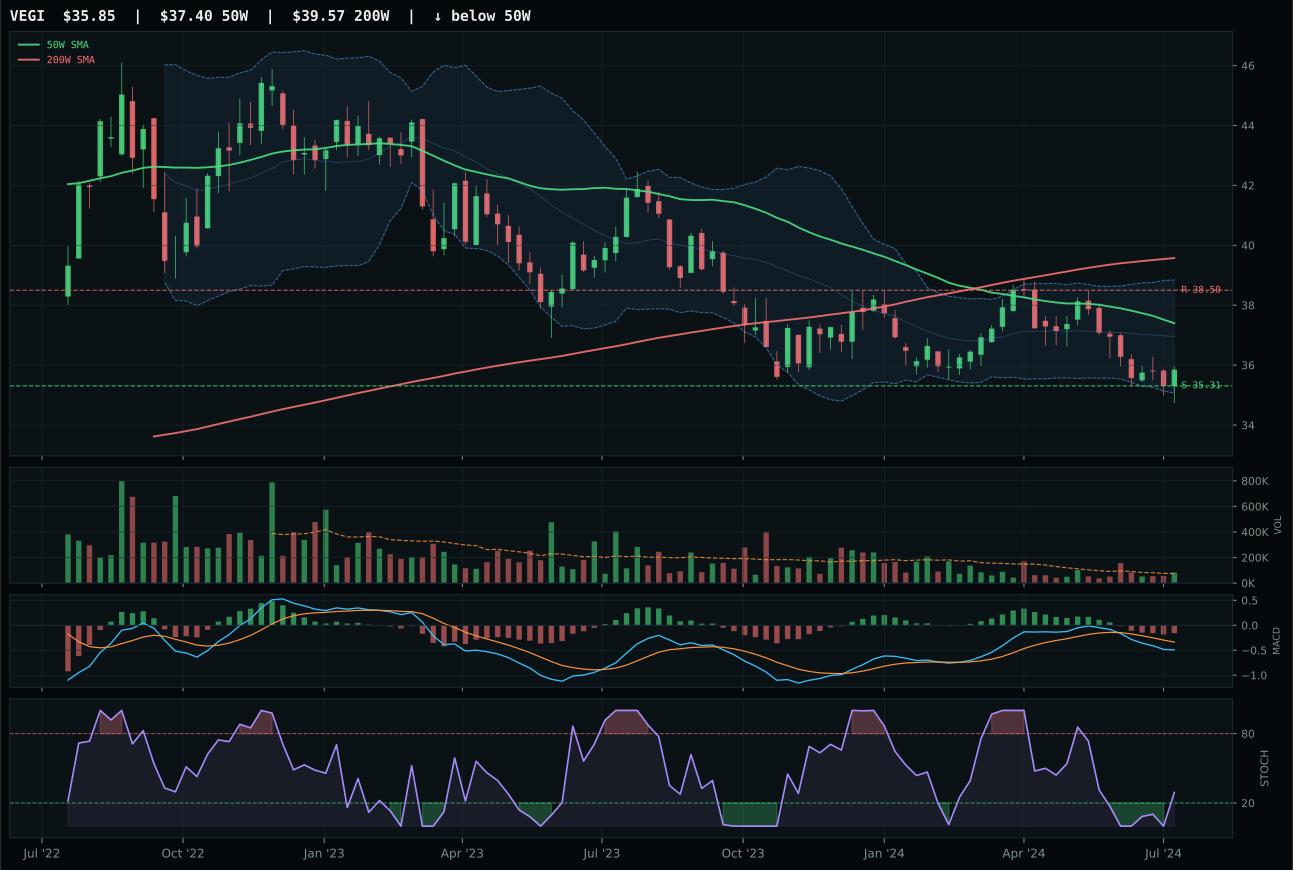
VEGI has a pullback into support profile with -13.3% 13-week relative strength versus SPY.
Extension and support failure are the main tactical risks.
Tracked, but not top-2 eligible because: structurally broken.
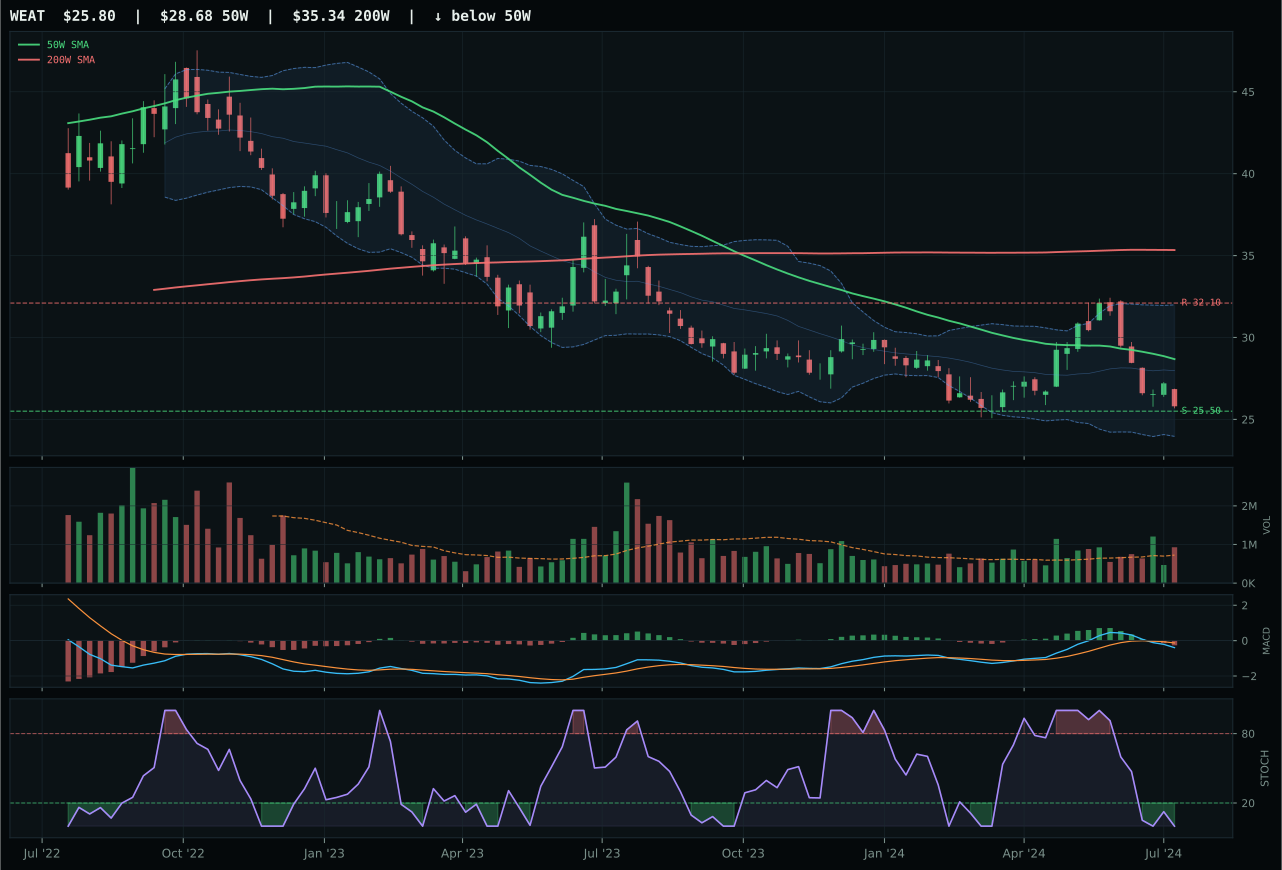
WEAT has a pullback into support profile with -13.2% 13-week relative strength versus SPY.
Extension and support failure are the main tactical risks.
Tracked, but not top-2 eligible because: structurally broken.
MOO wins by being the least broken of three structurally damaged charts, a distinction without merit. Price is 5.2% below the 50-week moving average—below the trend line—and the 22.0 trend score confirms collapse. The one thing MOO does better than VEGI and WEAT is hold a positive category RS of 2.2% while those peers posted negative prints, a tiny margin that nonetheless reflects relative supply-demand balance in agribusiness equity versus commodity complex weakness. The 88.0 timing score and 90.0 risk/reward look attractive at first glance, but they reflect capitulation: there is little downside left because selling has already occurred. Rising mid-zone stochastic RSI signals eventual oversold bounce potential, but the absence of upside to resistance (-5.5% to the resistance zone) means any recovery trades a 2% downside for a 5.5% cap.
Agriculture & Livestock earns 0% allocation this week, ranked 9th or 10th among categories and failed eligibility screening. The final 2.2 score came after the reasoner applied hard filters; the 29.8 3/2/1 basket score collapsed to 2.2 when structurally broken setups were penalized against macro and leadership. Disinflation actively hurts this category (-6), because softer demand and falling commodity prices erode top-line growth. Real asset sponsorship (+8) and commodity breadth positive (+5) are present but insufficient to offset the structural break: price below the 50W, MACD bearish, and category-relative weakness signal the setup is in repair mode, not accumulation. This allocation will return only if price closes above the 50W with improving MACD confirmation and volume participation strengthens above the 20-week average—none of which is present.