
2024-07-05
Informational purposes only. The content in this report, including allocations, analysis, and commentary, is provided solely for informational and educational purposes. It does not constitute financial advice, investment advice, trading advice, or any other type of advice. Past performance does not guarantee future results. Always conduct your own research and consult a qualified financial professional before making investment decisions.
Weekly Allocation
| Ticker | Category | Weight | Role |
|---|---|---|---|
| FBTC | 50% | Overlay | |
| IGV | Technology | 10% | Top-2 (10%) |
| AIQ | AI | 10% | Top-2 (10%) |
| SLV | Precious Metals | 5% | Tier-2 (5%) |
| NLR | Nuclear Energy | 5% | Tier-2 (5%) |
| IGF | Utilities & Infrastructure | 5% | Tier-2 (5%) |
| XAR | Defense & Aerospace | 5% | Tier-2 (5%) |
| COPX | Industrial Metals | 5% | Tier-2 (5%) |
| INDA | Emerging Markets | 5% | Tier-2 (5%) |
Trade Instructions — Monday Open
Sell the tranche from 2024-06-07 (completing its 4-week hold). Buy the new tranche. Instructions show net portfolio changes — same-asset positions cancel, weight changes show the delta.
| Action | Ticker | Instruction |
|---|---|---|
| SELL | NLR | Sell 20% of NLR position (reduce 6.25% → 5.00%) |
| SELL | GLD | Sell 29% of GLD position (reduce 8.75% → 6.25%) |
| SELL | ITA | Sell 25% of ITA position (reduce 5.00% → 3.75%) |
| SELL | XLE | Sell entire XLE position (1.25% of portfolio) |
| SELL | PICK | Sell entire PICK position (1.25% of portfolio) |
| SELL | SMH | Sell 20% of SMH position (reduce 6.25% → 5.00%) |
| SELL | WEAT | Sell entire WEAT position (1.25% of portfolio) |
| BUY | COPX | Buy COPX — 12.50% of freed cash (adds 1.25% to portfolio) |
| BUY | INDA | Buy INDA — 12.50% of freed cash (adds 1.25% to portfolio) |
| BUY | IGV | Buy IGV — 25.00% of freed cash (adds 2.50% to portfolio) |
| BUY | AIQ | Buy AIQ — 25.00% of freed cash (adds 2.50% to portfolio) |
| BUY | SLV | Buy SLV — 12.50% of freed cash (adds 1.25% to portfolio) |
| BUY | XAR | Buy XAR — 12.50% of freed cash (adds 1.25% to portfolio) |
Current Portfolio After Trade
Combined holdings across all 4 active tranches. Each tranche is 25% of the portfolio.
| Ticker | % of Portfolio | Weight Bar |
|---|---|---|
| FBTC | 50.00% | |
| GLD | 6.25% | |
| XLU | 6.25% | |
| NLR | 5.00% | |
| SMH | 5.00% | |
| COPX | 5.00% | |
| INDA | 5.00% | |
| IGV | 5.00% | |
| ITA | 3.75% | |
| XLK | 2.50% | |
| AIQ | 2.50% | |
| SLV | 1.25% | |
| IGF | 1.25% | |
| XAR | 1.25% |
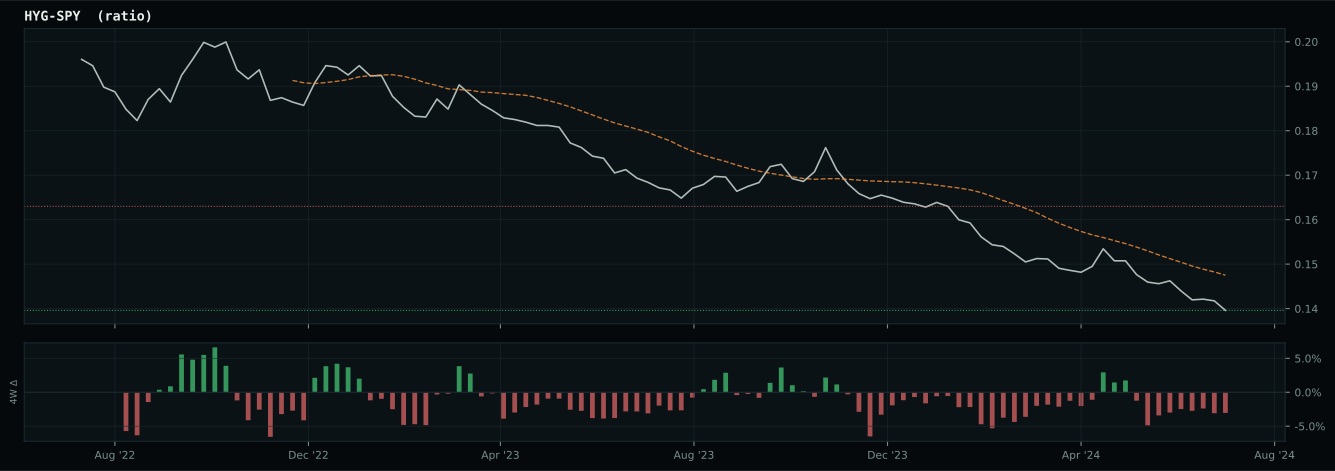
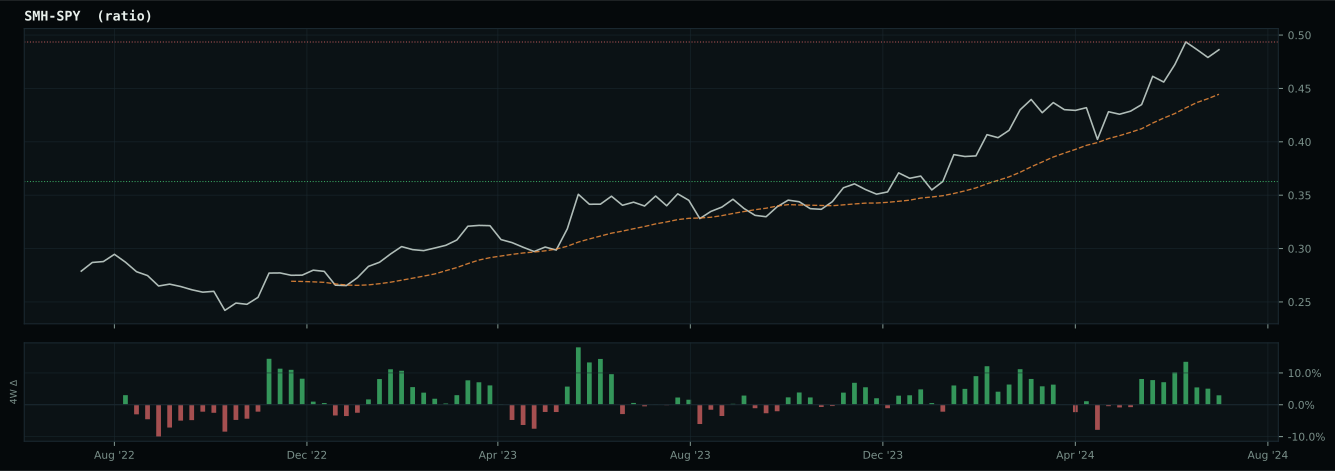
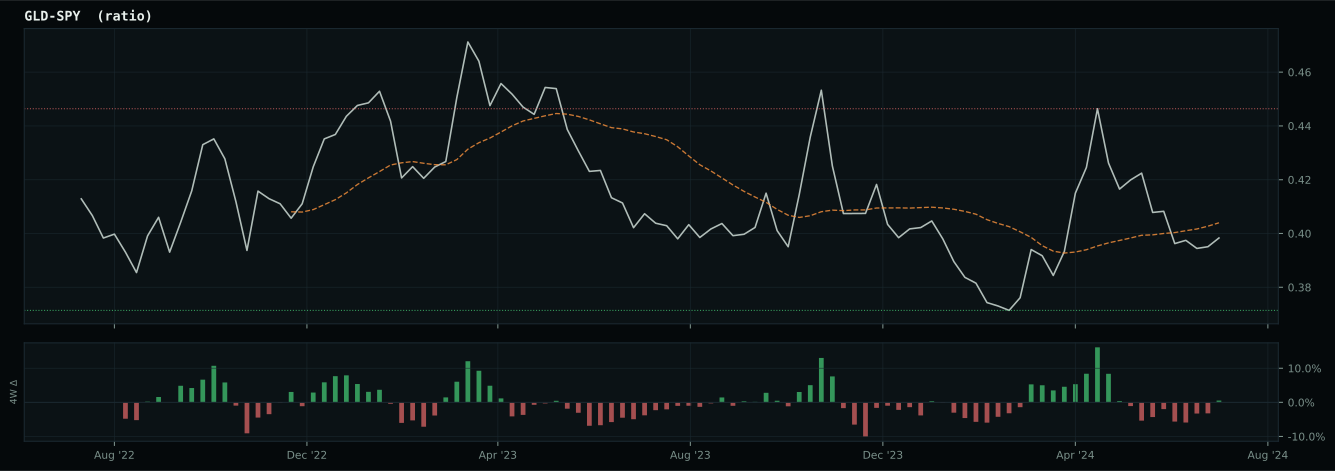
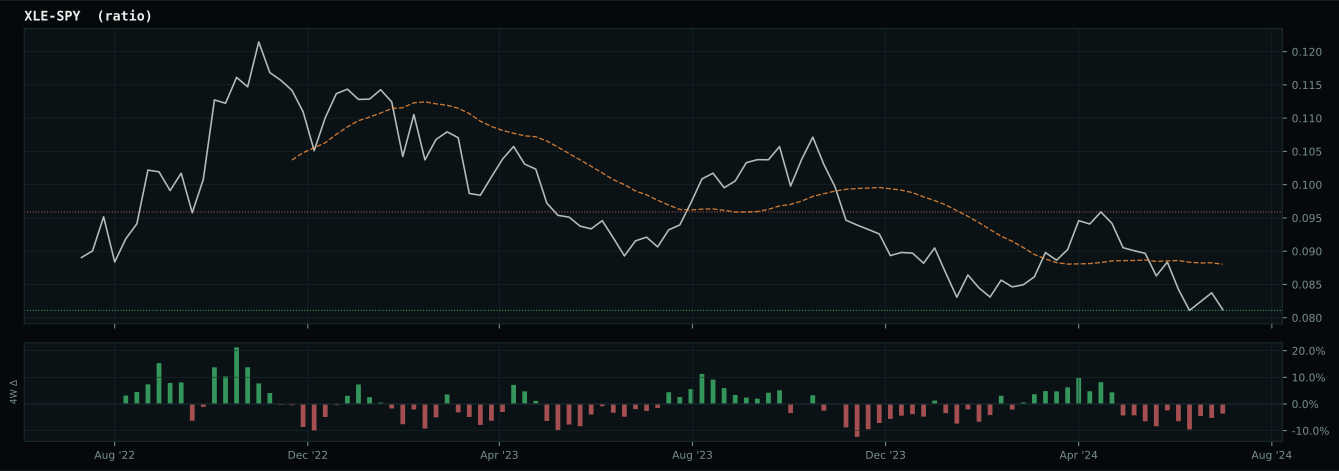
Macro Regime — Disinflation
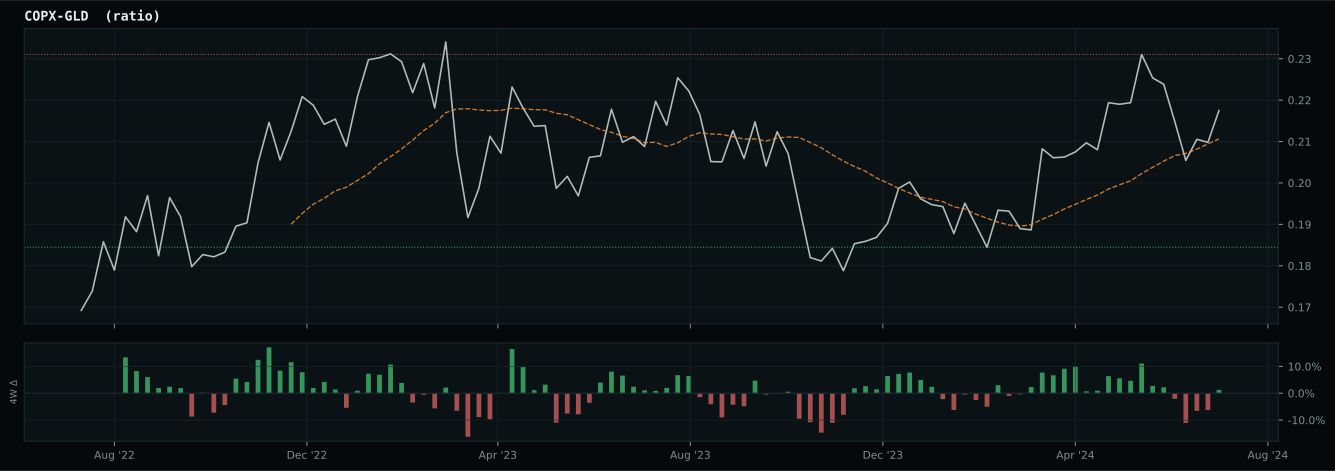
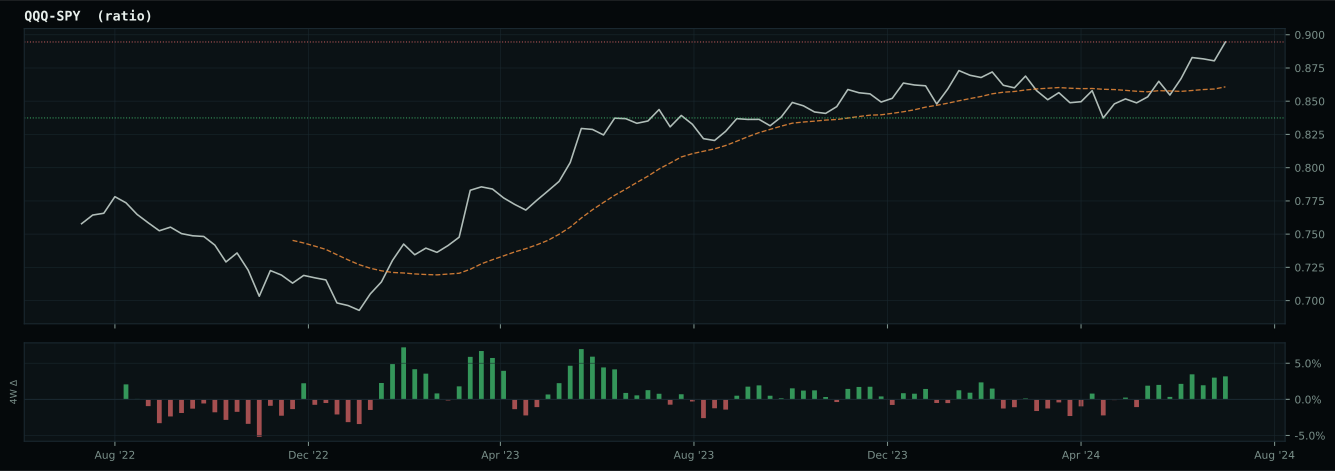
Macro Evidence Charts
Market-implied signals behind the macro regime scores. Each ratio compares two assets; the direction and slope of the ratio is what the macro engine reads.
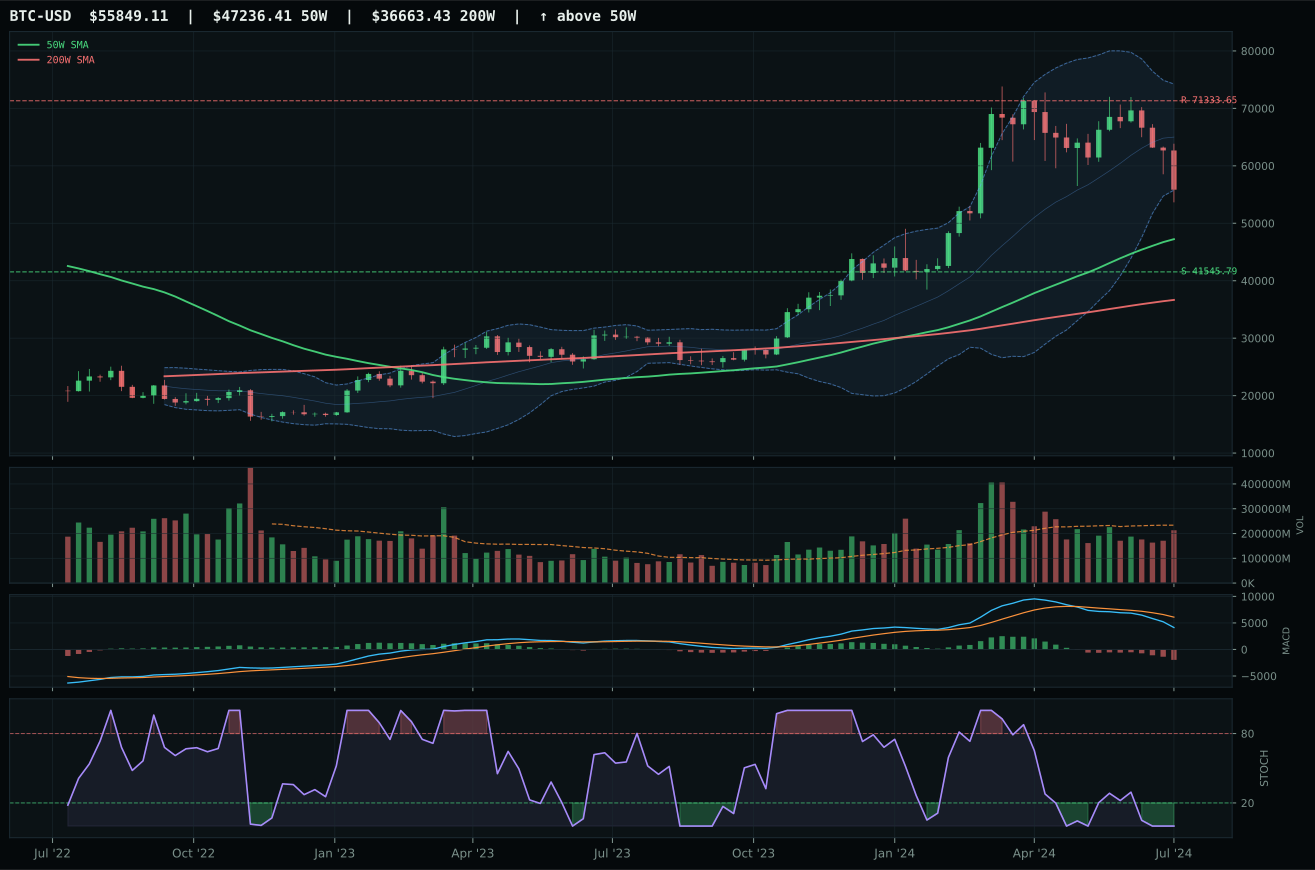
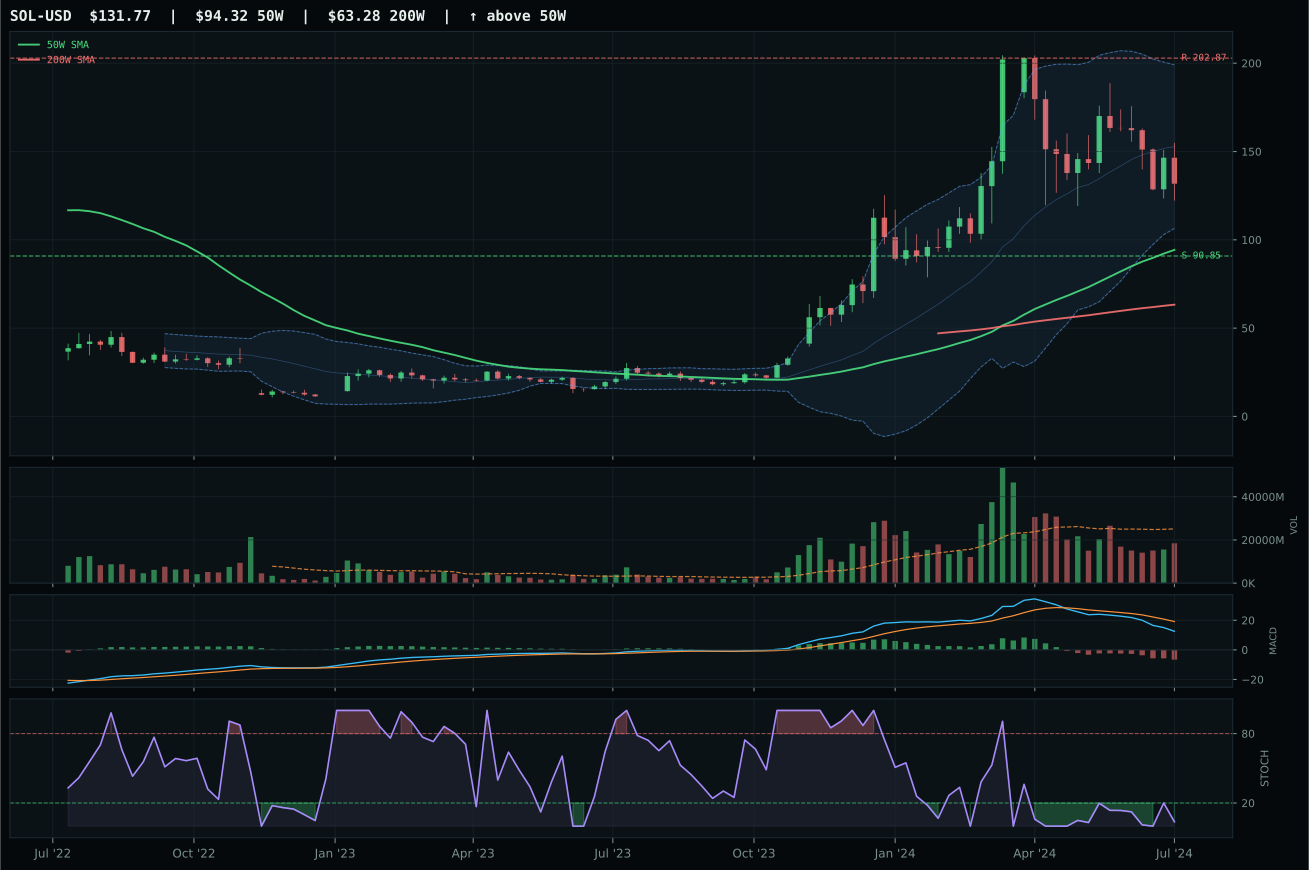
Crypto Regime — TrendBTC
ValueBTC not armed: BTC has not made the first post-breakdown touch of the 200W buy zone after losing the 50W
TrendBTC confirmed: 2 consecutive closes above rising/flat 50W SMA
one or more available conditions failed
Category Rankings
| Rank | Category | Winner | Score | Alloc | 4W Ret | Peers (4W) |
|---|---|---|---|---|---|---|
| 1 | Technology | IGV | 61.4 | 20% | -14.26% | XLK -17.9% · CIBR -12.0% |
| 2 | AI | AIQ | 50.1 | 20% | -15.81% | SMH -26.3% · BOTZ -14.2% |
| 3 | Precious Metals | SLV | 49.7 | 10% | -13.12% | GDX -4.4% · GLD +0.4% |
| 4 | Nuclear Energy | NLR | 44.3 | 10% | -15.82% | URA -22.8% · URNM -24.2% |
| 5 | Utilities & Infrastructure | IGF | 44.0 | 10% | +0.35% | XLU +8.7% · PAVE -1.4% |
| 6 | Defense & Aerospace | XAR | 41.5 | 10% | -1.85% | ITA -0.3% · ROKT -1.0% |
| 7 | Industrial Metals | COPX | 38.2 | 10% | -19.81% | PICK -13.2% · REMX -14.1% |
| 8 | Emerging Markets | INDA | 24.0 | 10% | -3.98% | IEMG -9.9% · ILF -10.8% |
| 9 | Agriculture & Livestock | MOO | 1.3 | 0% | -1.73% | VEGI -3.6% · WEAT -8.4% |
| 10 | Traditional Energy | XLE | 0.8 | 0% | -3.30% | FCG -10.6% · XOP -9.3% |
Technology — IGV
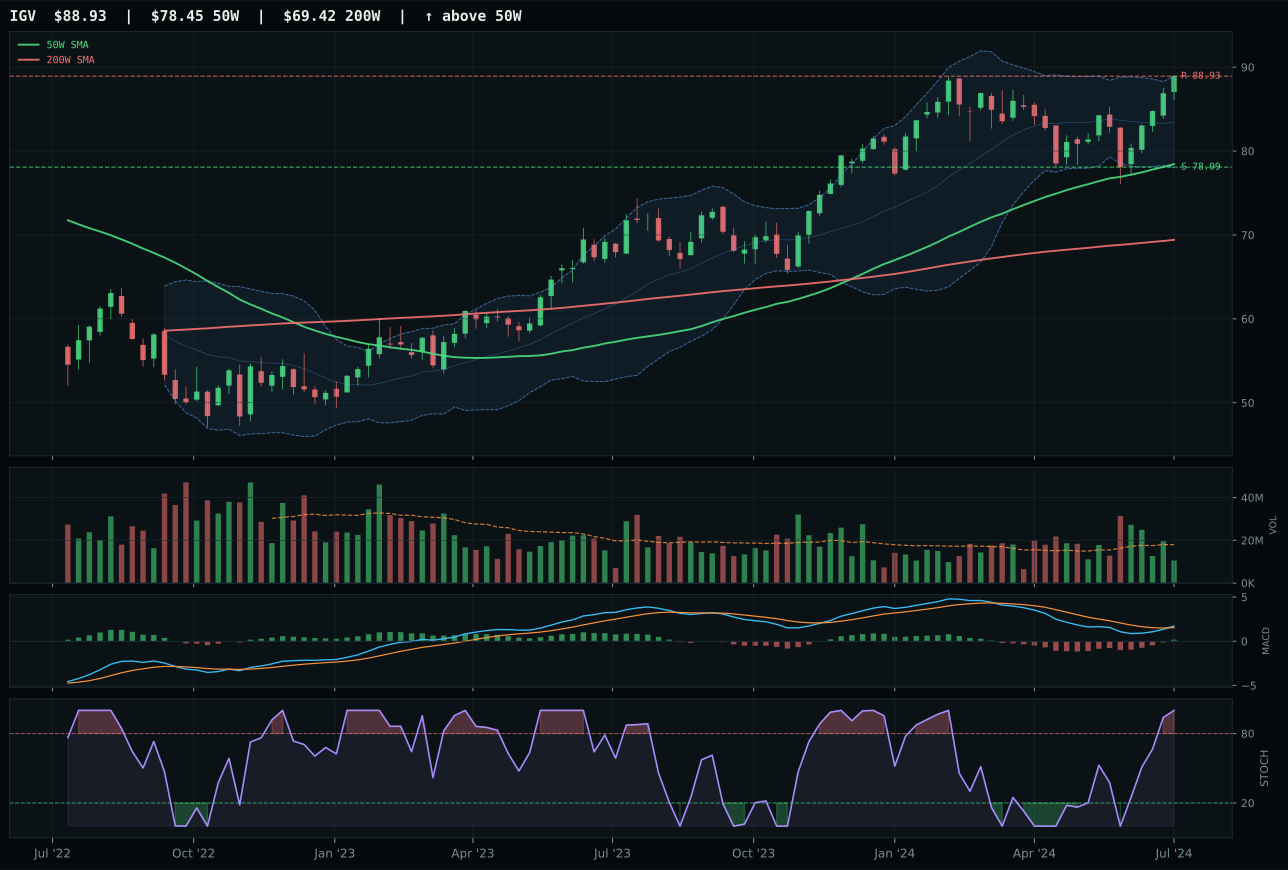
IGV has a neutral structure profile with -1.3% 13-week relative strength versus SPY.
A failed hold above support would weaken the setup.
Actionable but governed by invalidation levels.
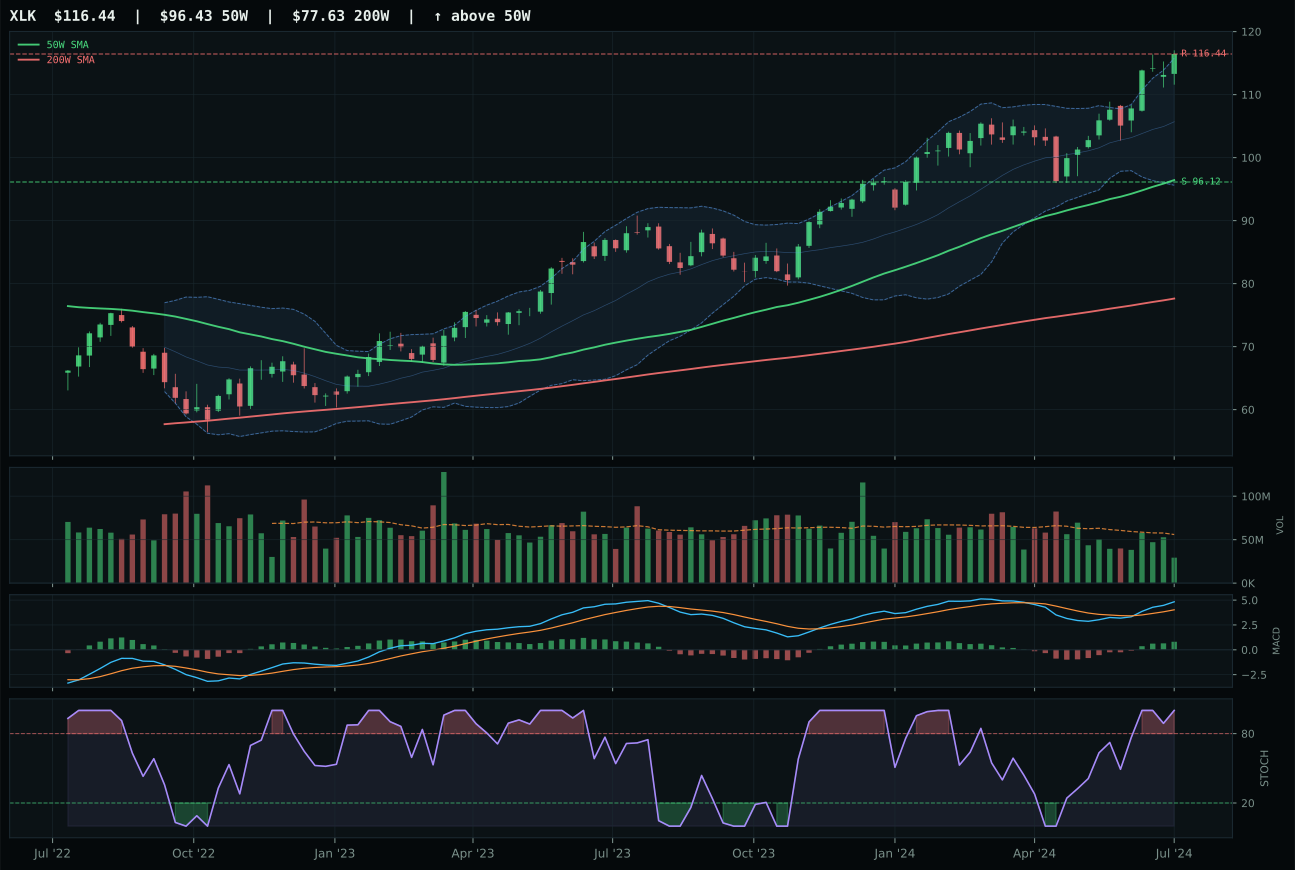
XLK has a vertical extension profile with 5.8% 13-week relative strength versus SPY.
A failed hold above support would weaken the setup.
Actionable but governed by invalidation levels.
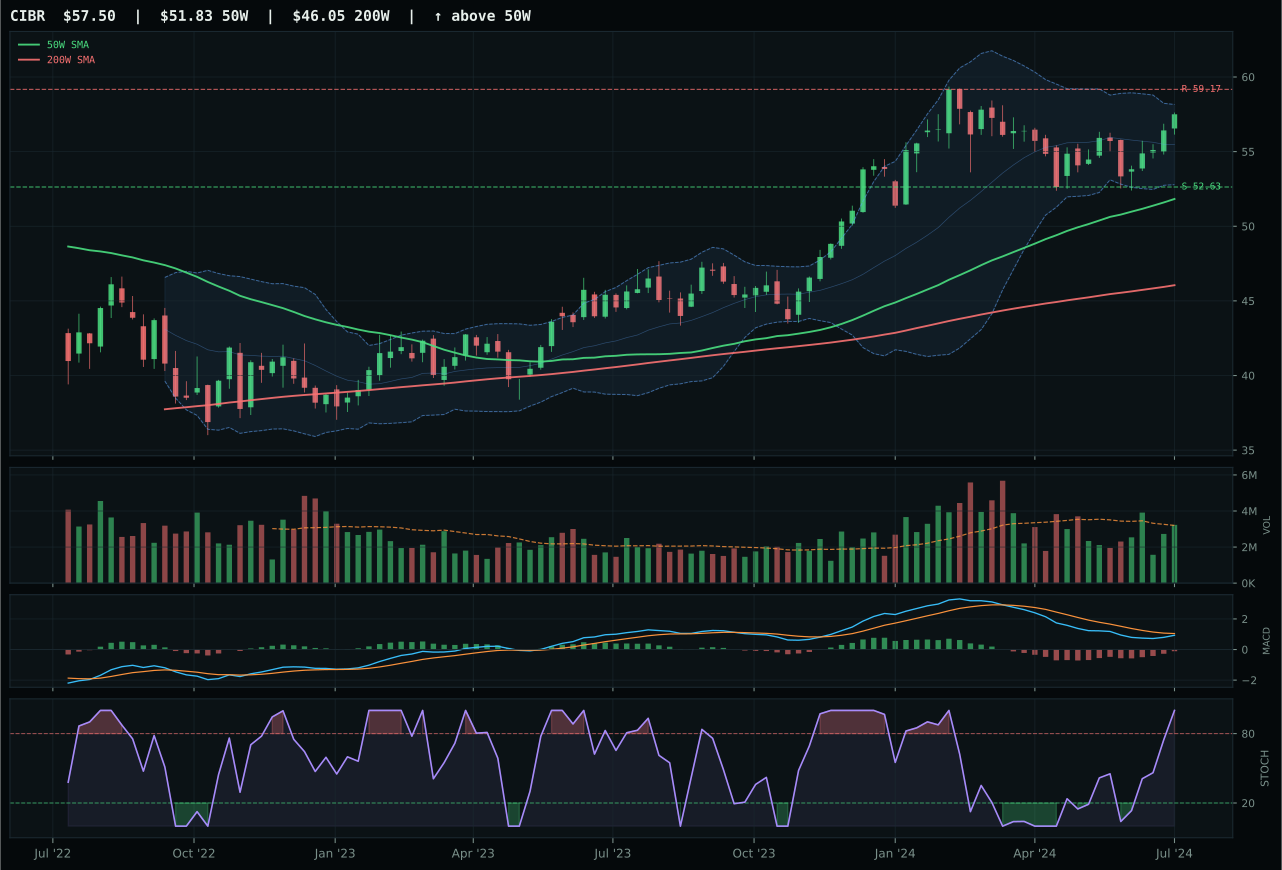
CIBR has a neutral structure profile with -3.8% 13-week relative strength versus SPY.
A failed hold above support would weaken the setup.
Actionable but governed by invalidation levels.
IGV wins the category because it trades at a modest 13.4% extension above its 50-week moving average while maintaining a clean neutral structure, giving it room to breathe without the vertical exhaustion that punishes XLK. The 3.8-point score gap reflects IGV's superior timing advantage: XLK is stretched 20.7% from its 50W and sits in a vertical extension setup, which signals late-stage participation rather than orderly accumulation. Both carry bullish and improving MACD profiles with overbought stochastic RSI readings, but IGV's category-relative strength sits flat (0.0%) while XLK's relative strength versus SPY (5.8%) masks the fact that it's running faster into resistance at 116.44 with no room to run higher. Volume confirmation is thin across both names, but IGV's neutral structure means the next buyer isn't fighting against a wall of supply; XLK's vertical setup means every new participant is arriving late.
Technology earns its 10% slot as the second-highest category score at 61.4, ranking alongside AI in the top-two tier despite neither reaching the pristine 65+ threshold. Disinflation (+7) and active risk-appetite sponsorship (+9) provide genuine macro tailwinds, yet liquidity stress (-10) and credit headwinds (-9) temper the enthusiasm—this is a category living in the tension between strong technical evidence (62% weighting) and a macro fit that lags pure momentum plays. IGV's setup quality (neutral, clean, organized), combined with persistence above its trend lines and MACD improvement, justifies holding the position as a barbell against growth stagnation if equities re-rate lower on duration. The category would ascend to top-2 allocation only if macro descriptors shift decisively toward financial stability or if IGV's compressed 0.59x volume inflates into genuine institutional accumulation; currently, it remains a 10% core holding that captures software's cyclicality without betting the portfolio on AI growth alone.
AI — AIQ
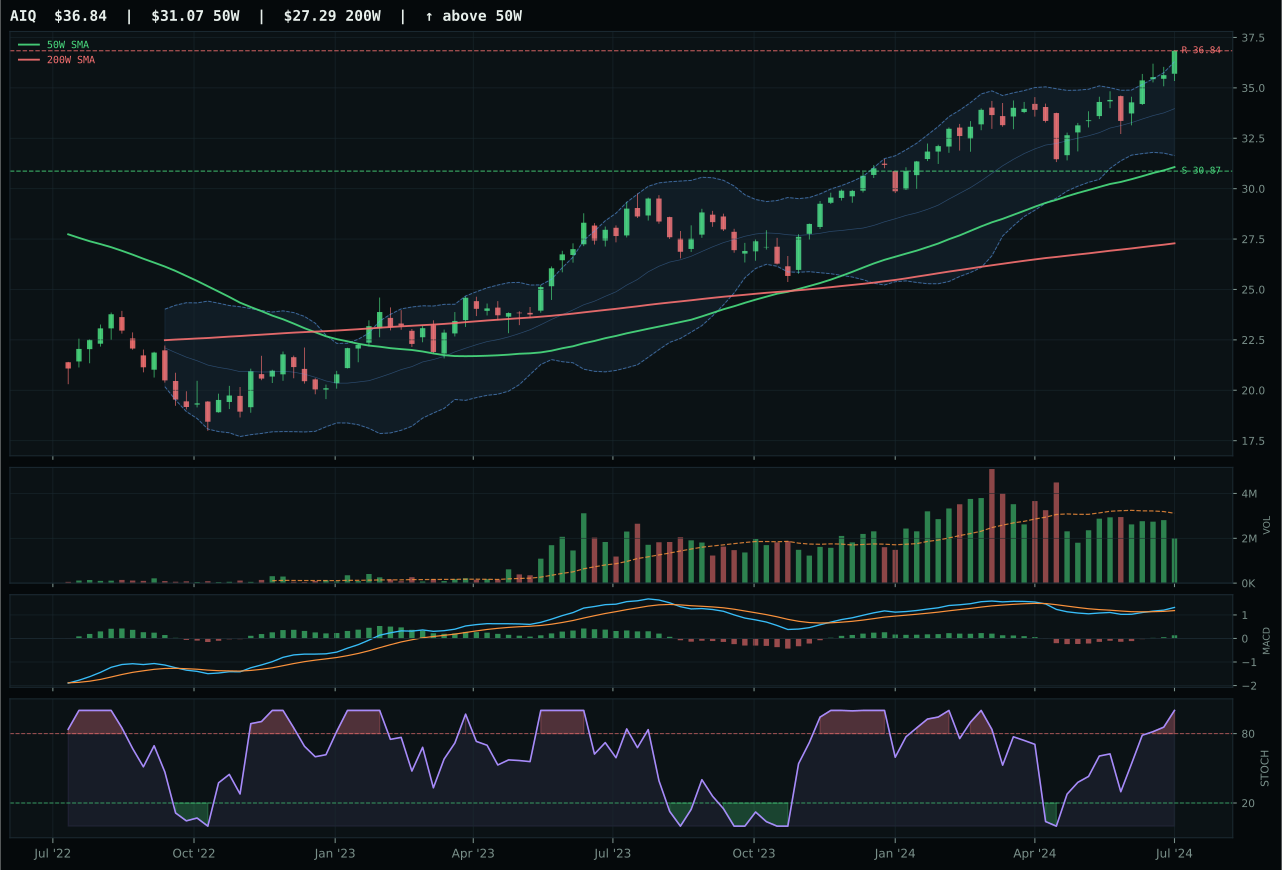
AIQ has a vertical extension profile with 1.7% 13-week relative strength versus SPY.
A failed hold above support would weaken the setup.
Actionable but governed by invalidation levels.
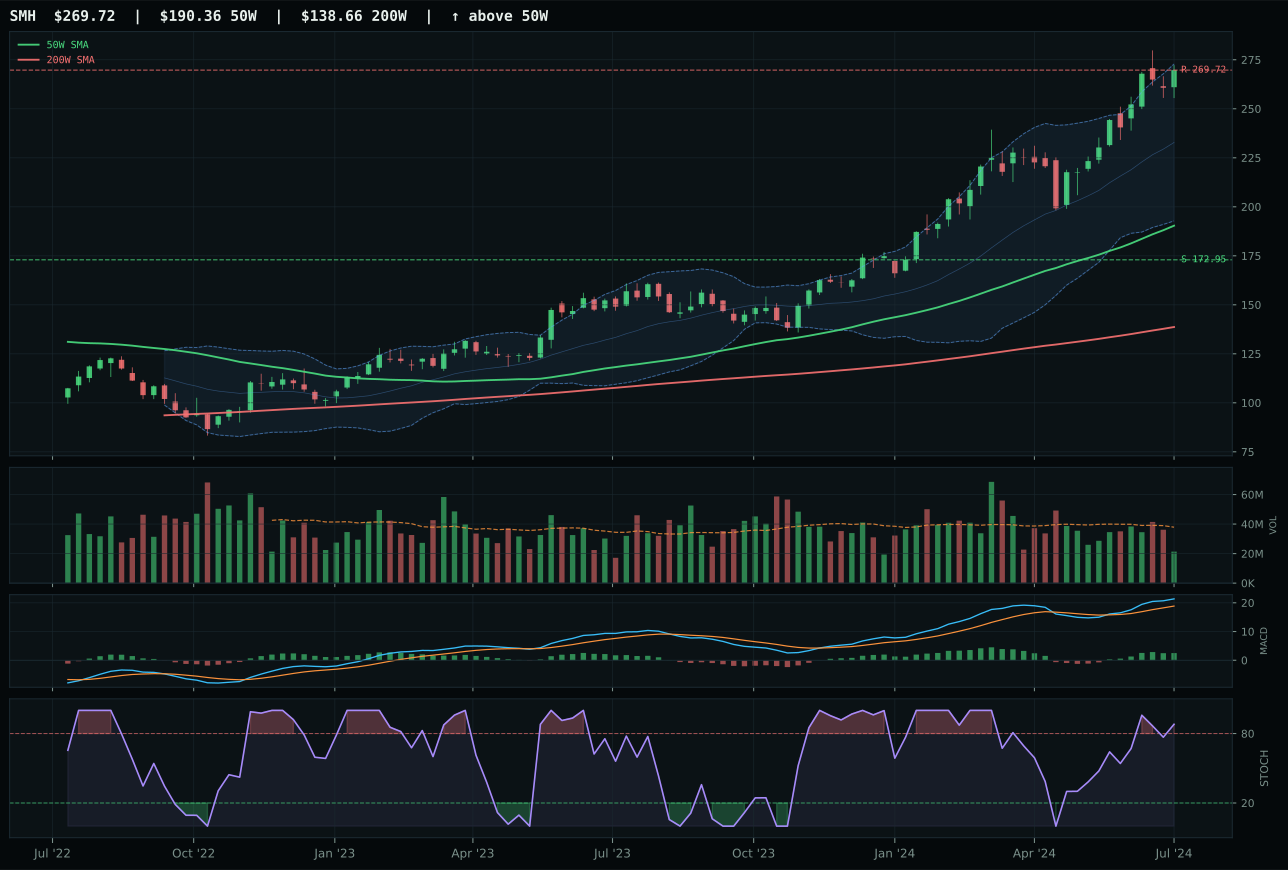
SMH has a vertical extension profile with 14.2% 13-week relative strength versus SPY.
A failed hold above support would weaken the setup.
Actionable but governed by invalidation levels.
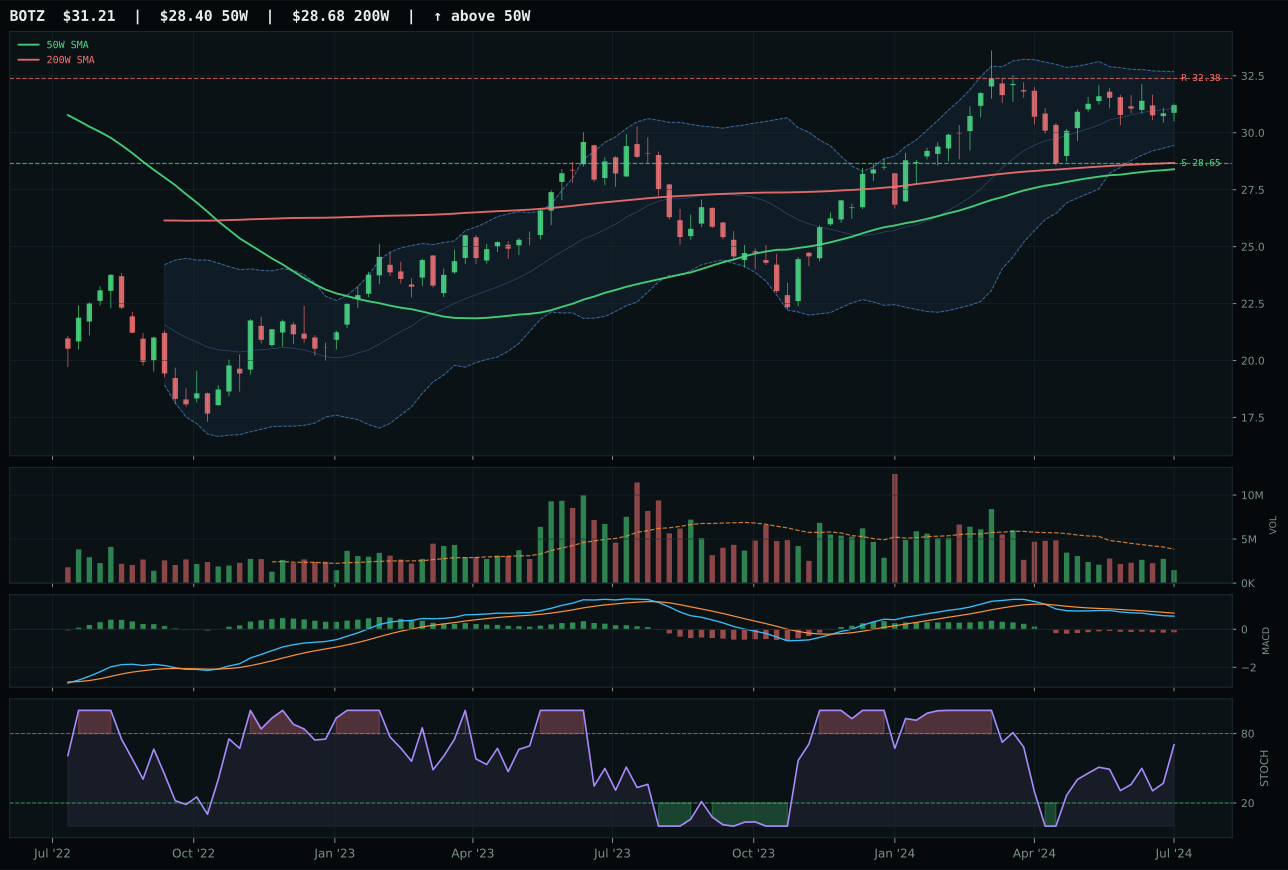
BOTZ has a neutral structure profile with -5.3% 13-week relative strength versus SPY.
A failed hold above support would weaken the setup.
Actionable but governed by invalidation levels.
AIQ wins by being the only name in the category that isn't overextended to the point of structural danger, despite an 8.6% thirteen-week return that still trails SMH's 21.1%. The vertical extension setup is real at 18.6% above the 50W, but AIQ's cleanliness score of 83.3 and compression of 82.8 signal a chart that's been built methodically rather than ripped higher in a single move. SMH's 41.7% stretch from its 50W tells the entire cautionary tale: it generated a 100/100 trend score and 100/100 momentum reading but earned only a 27/100 timing score because there's nowhere left to go without a pullback or consolidation. Volume confirmation across both is thin, but AIQ's category-relative strength holds flat at 0.0% while SMH trails at 12.5% relative strength, meaning SMH's outperformance is running into headwinds. BOTZ's complete deterioration—bearish and weakening MACD with zero momentum—eliminates it entirely from contention.
AI ranks second among all categories at 50.1 and secures a top-2 allocation slot by virtue of combining strong technical fabric (AIQ's 67 composite) with genuine macro sponsorship: AI growth descriptors are firing (+14), risk appetite is positive (+10), and disinflation structurally supports growth valuations (+5). The 38% macro-fit weighting (versus 62% technical) prevents this category from overheating despite the hype cycle; liquidity stress (-12) and credit stress (-8) remain live headwinds that could reverse the trade on volatility shocks. This is not a pure conviction play—it's a macro-aligned tactical position that benefits from the current interest-rate environment while momentum remains unbroken. The category would lose its top-2 status immediately if stochastic RSI confirms rollover or if thirteen-week momentum crosses below zero; until then, the 10% allocation reflects the narrow window where AI exposure remains asymmetrically favorable.
Precious Metals — SLV
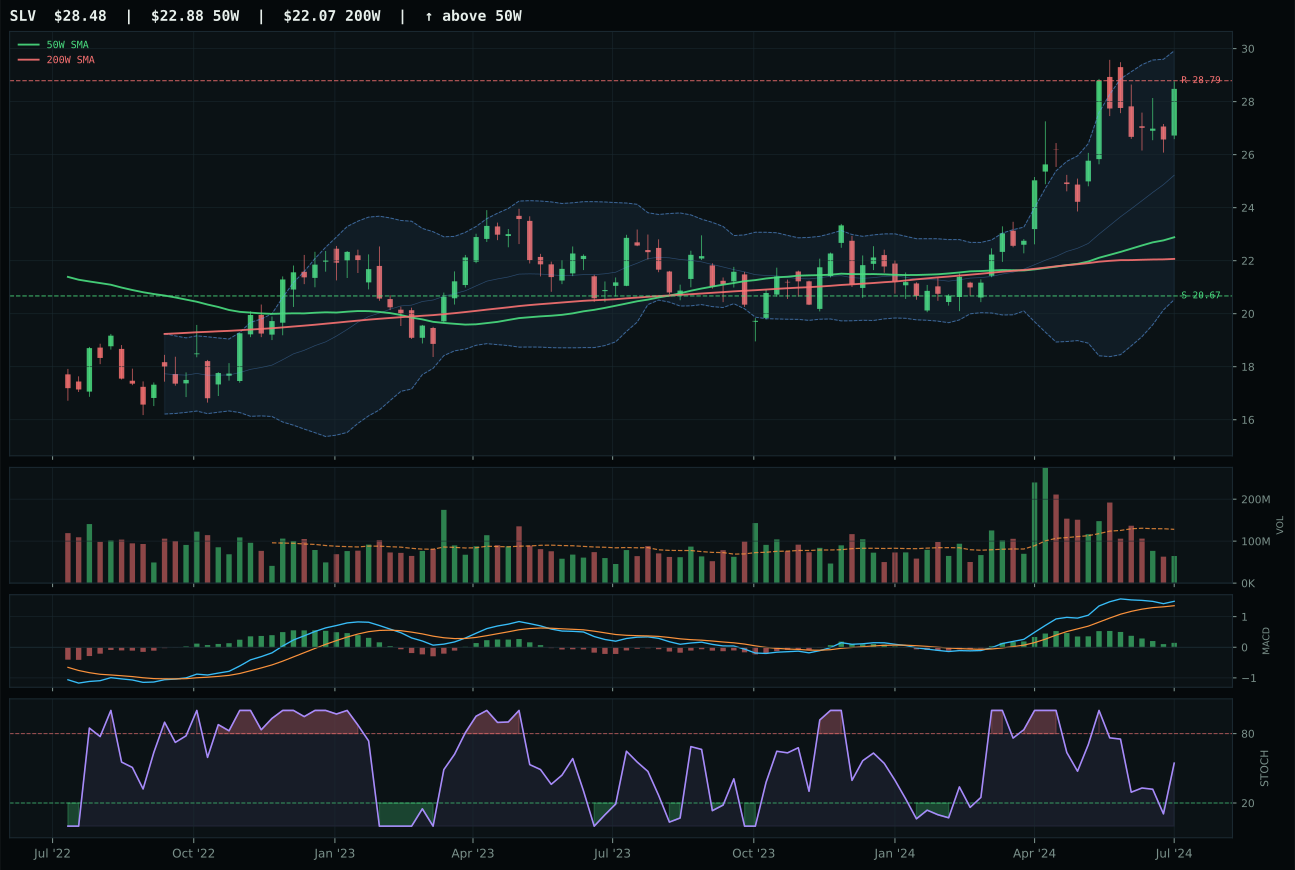
SLV has a vertical extension profile with 6.8% 13-week relative strength versus SPY.
A failed hold above support would weaken the setup.
Actionable but governed by invalidation levels.
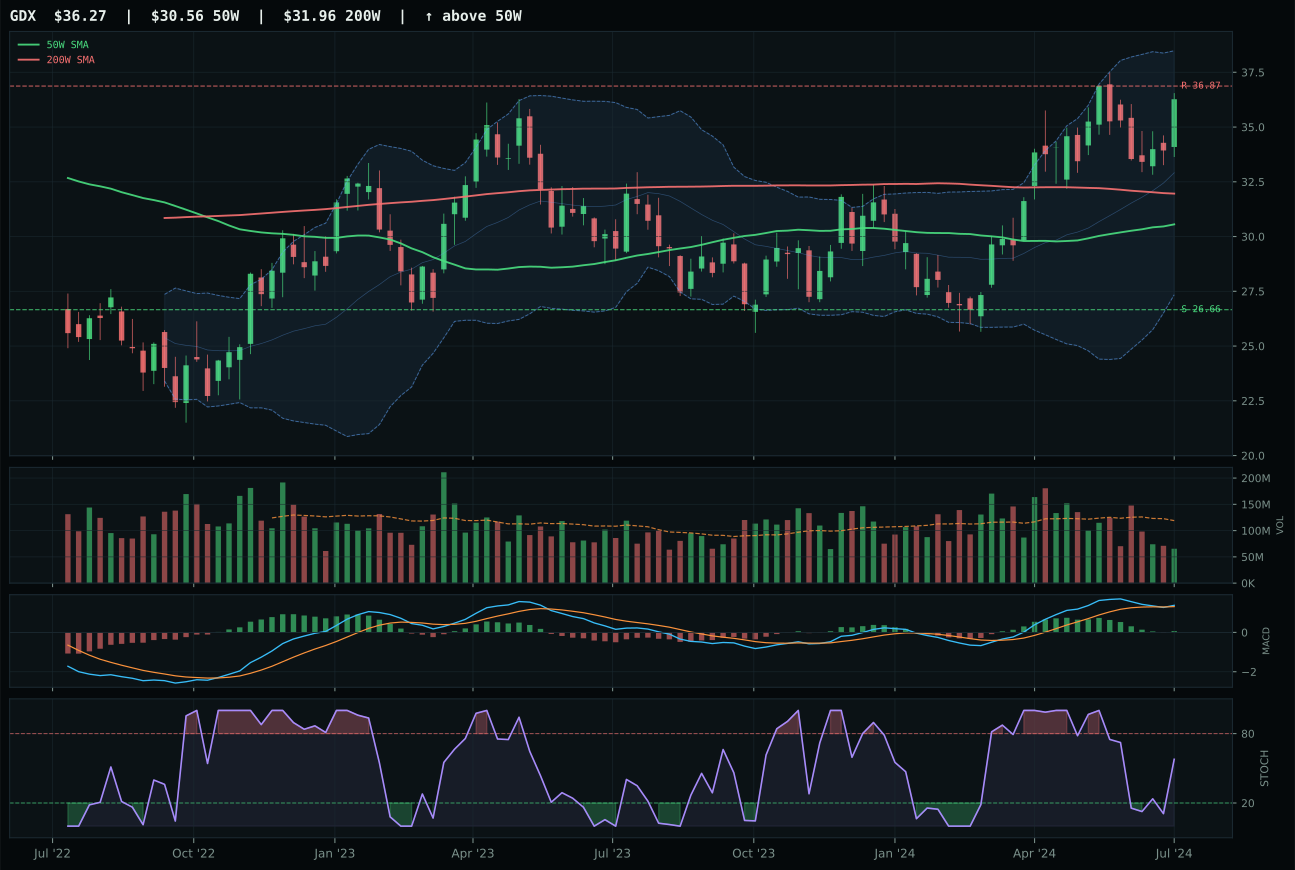
GDX has a vertical extension profile with 0.2% 13-week relative strength versus SPY.
A failed hold above support would weaken the setup.
Actionable but governed by invalidation levels.
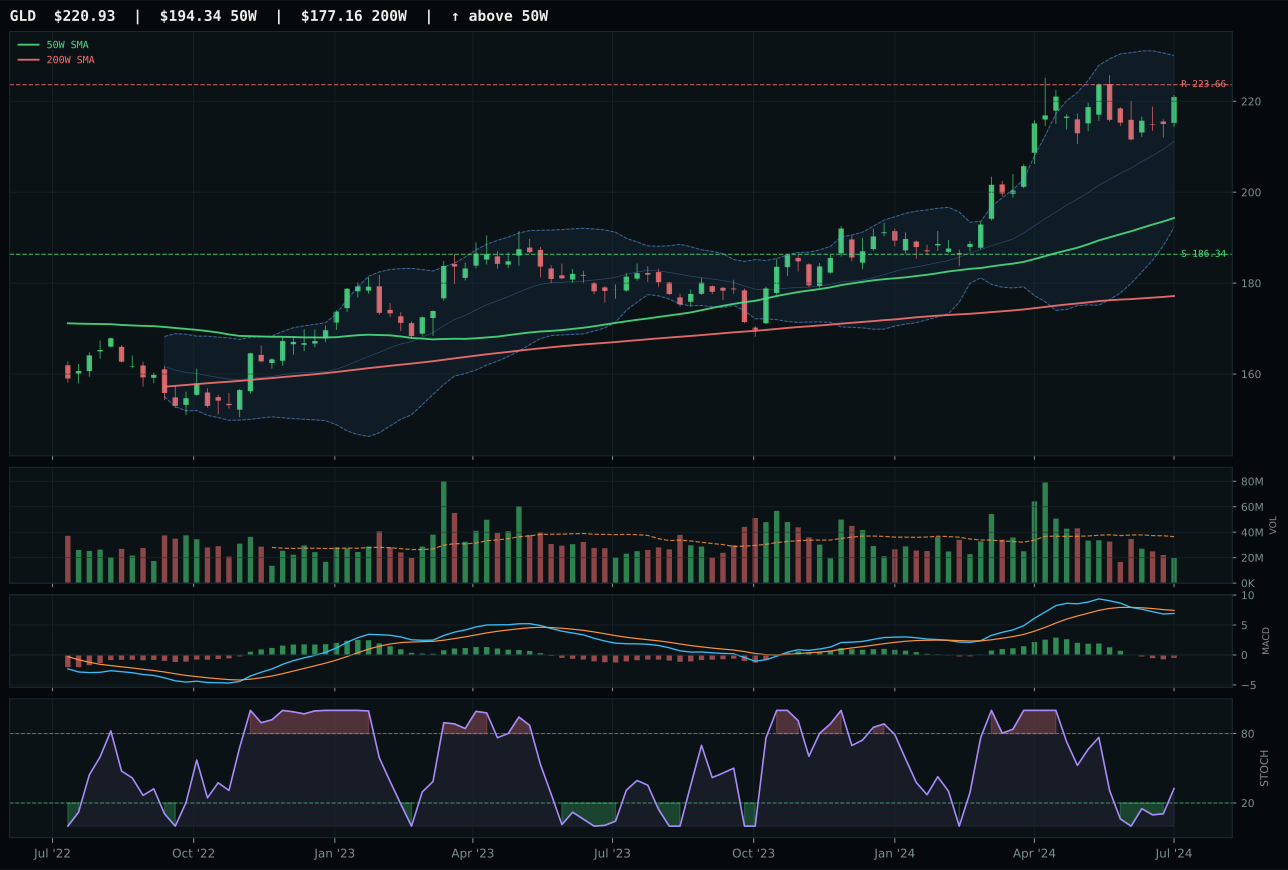
GLD has a neutral structure profile with -4.3% 13-week relative strength versus SPY.
A failed hold above support would weaken the setup.
Actionable but governed by invalidation levels.
SLV wins with a decisive 9.4-point score gap over GDX because it carries meaningful category-relative strength of 6.6% alongside outright outperformance versus SPY at 6.8%, while GDX sits flat at 0.0% relative strength despite a 7.2% thirteen-week return. Silver's structural setup is vertical extension at 24.5% above the 50W, which normally would be punished, but the momentum confirmation score of 98.1/100 tells the real story—silver is being accumulated aggressively, with four-week returns of 6.8% and thirteen-week of 13.8% signaling sustained buyer engagement. GDX's 86/100 trend score and 73/100 momentum confirmation mask a fatal flaw: its category-relative strength gap reveals it's lagging peers despite the bullish and flattening MACD. Volume is thin across both, but SLV's persistence of 71.9/100 suggests the move has legs; GDX's 62/100 persistence signals exhaustion brewing beneath the surface.
Precious Metals ranks fifth at 49.7 and earns a 5% allocation based on clean macro alignment with the disinflation regime: metals scarcity is active (+7), disinflation pressure is positive (+6 support for real assets), and macro fit scores 60.0 at the category level. SLV's extended entry price (24.5% above the fifty-week) would normally disqualify a position, but the persistent thirteen-week and thirty-week returns prove institutional accumulation is real, not speculative fomo. This is a 5% core holding that hedges duration risk if rates extend lower and also captures physical scarcity premiums in a disinflationary regime. The category would earn 10% only if volume participation jumped to 1.0x-plus (currently 0.50x), if MACD transitioned from flattening to improving, or if GDX's miners began to lead SLV on relative strength. Current allocation reflects appropriate risk-sizing for a real-asset hedge in the current macro.
Nuclear Energy — NLR
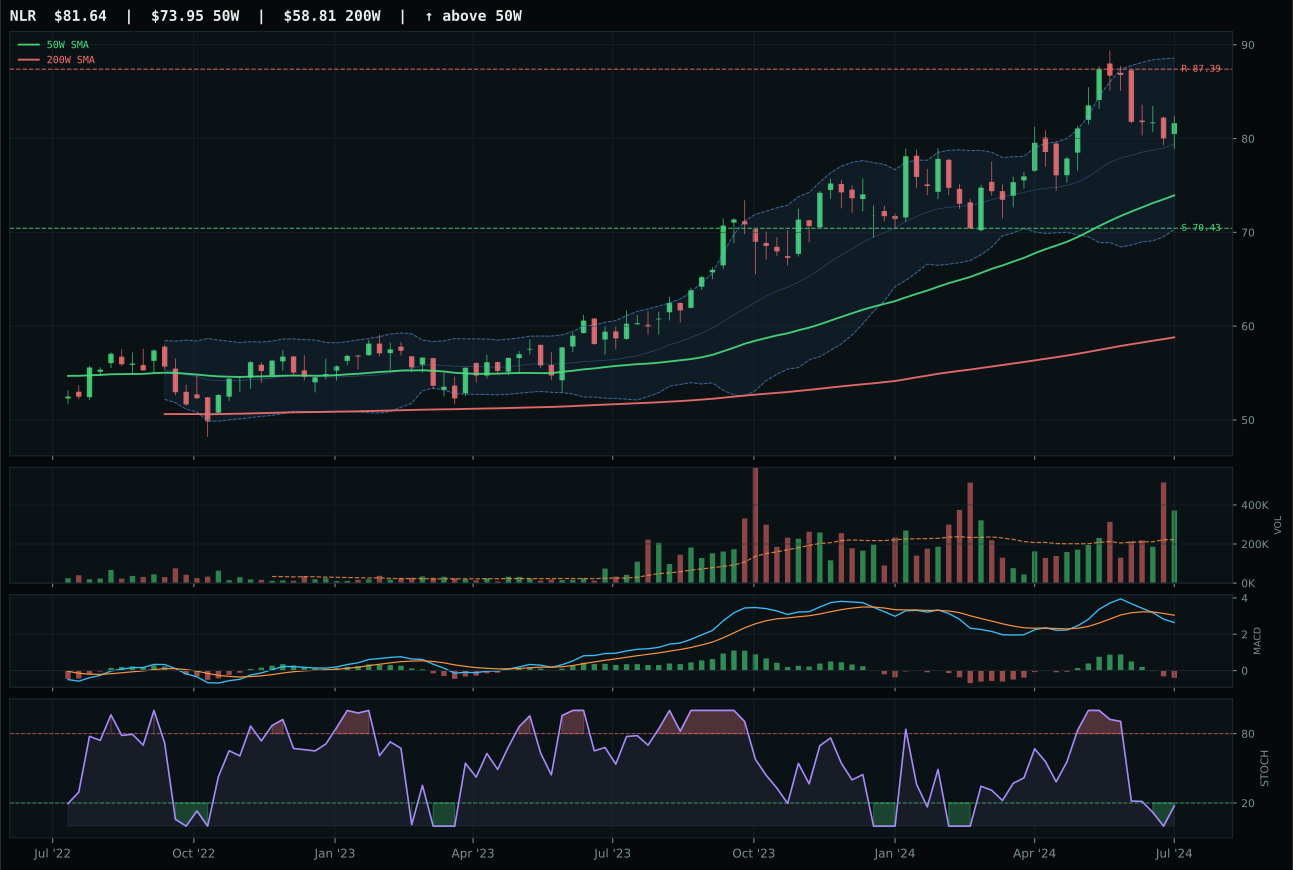
NLR has a neutral structure profile with -4.4% 13-week relative strength versus SPY.
A failed hold above support would weaken the setup.
Actionable but governed by invalidation levels.
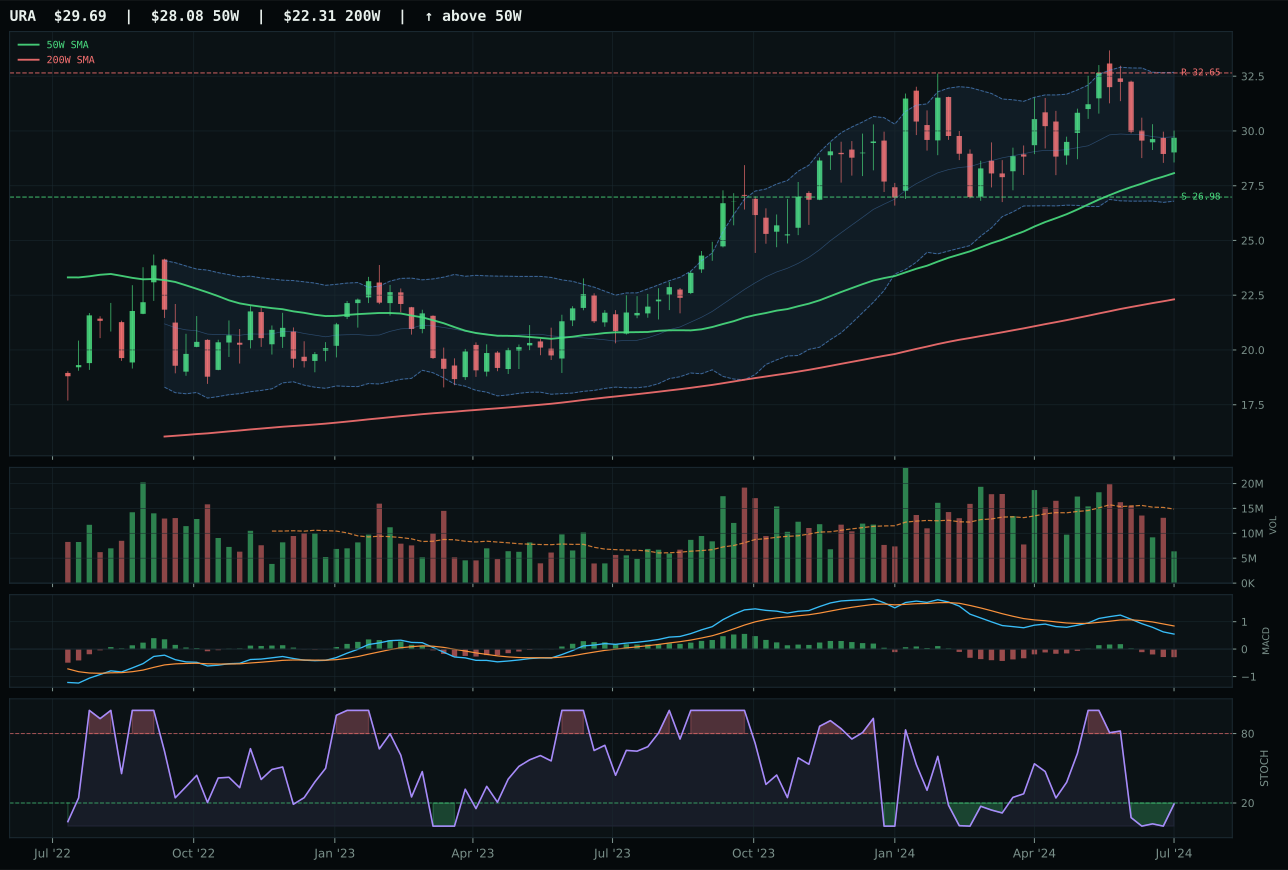
URA has a neutral structure profile with -9.8% 13-week relative strength versus SPY.
A failed hold above support would weaken the setup.
Actionable but governed by invalidation levels.
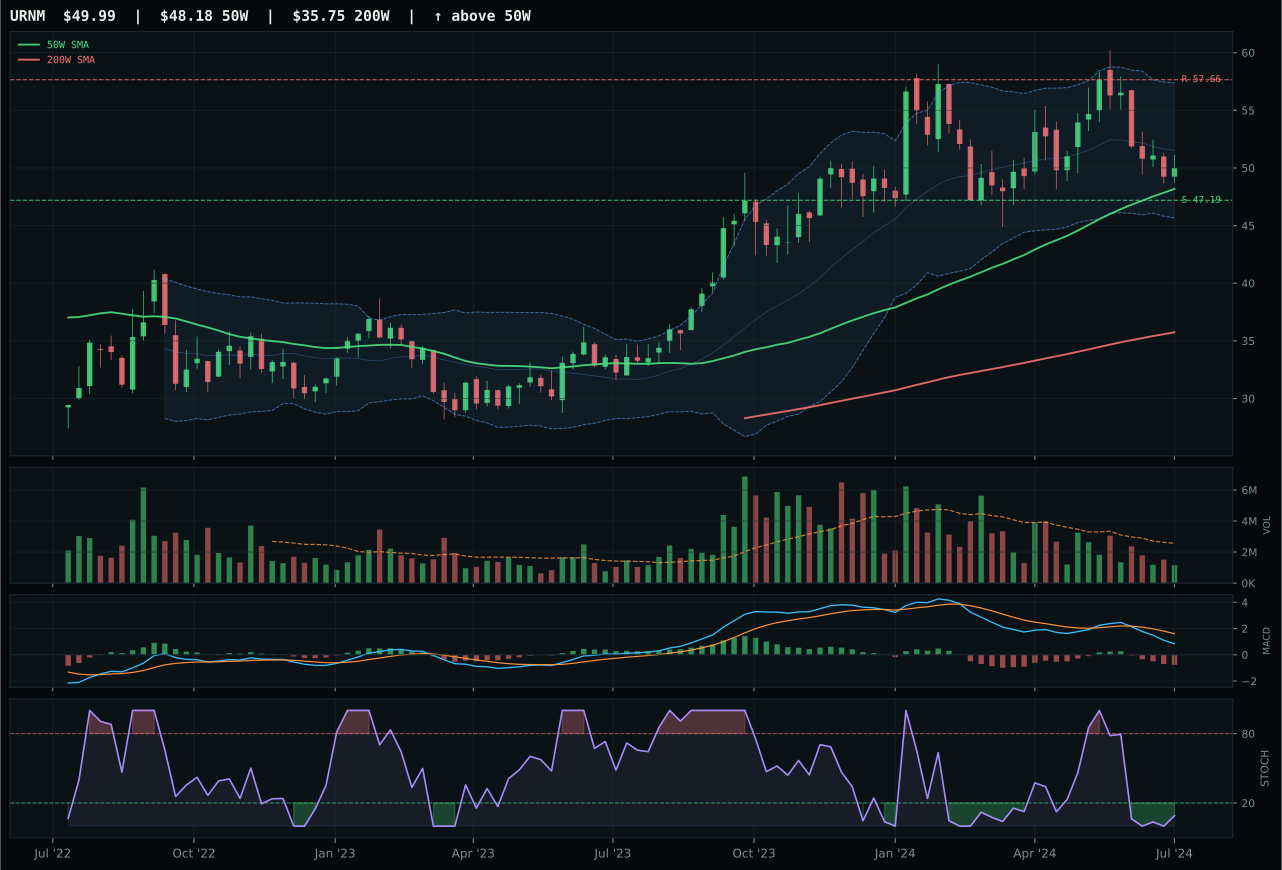
URNM has a neutral structure profile with -12.9% 13-week relative strength versus SPY.
A failed hold above support would weaken the setup.
Actionable but governed by invalidation levels.
NLR wins with a 6.0-point score gap over URA because it's the only name in the category with meaningful volume confirmation at 1.67x its twenty-week average (accumulation), signaling institutional participation, while URA sits at thin participation. Both trade in neutral structures above their 50W moving averages with bearish and weakening MACD, but NLR's category-relative strength of 5.4% tells the story: it's outperforming peers despite identical technical setups. NLR's stochastic RSI sits oversold at 0.18, offering potential for expansion if buyers defend support, while URA's oversold turn-up is a weaker configuration that suggests the reversal is already being priced in. Momentum confirmation favors NLR at 46.8/100 versus URA's near-zero, and persistence at 60.8/100 suggests the move has staying power. URNM is eliminated by oversold turn-up stochastic without accompanying volume—a failed reversal signal.
Nuclear Energy ranks eighth at 44.3 and earns 5% allocation as a diversified energy basket receiving modest macro support: real-asset sponsorship (+7), AI-growth descriptors (+5 from data-center power demand), and risk-appetite positioning provide gentle tailwinds against -7 liquidity-stress and -5 credit-stress headwinds. NLR's volume participation at 1.67x the twenty-week average is the category's critical advantage, proving institutional conviction in energy-security positioning; this differentiates nuclear from the broken traditional-energy category entirely. The allocation is tactical rather than strategic—it captures the intersection of disinflation support (utilities benefit from lower rates) and structural power-demand upside from AI infrastructure buildouts. The position would upgrade to 10% only if NLR's momentum confirmation accelerated above 50 (currently at 46.8) or if its thirteen-week return inflected decisively positive. Current 5% sizing reflects appropriate conviction for a low-turnover, high-volume infrastructure position in a disinflationary regime.
Utilities & Infrastructure — IGF
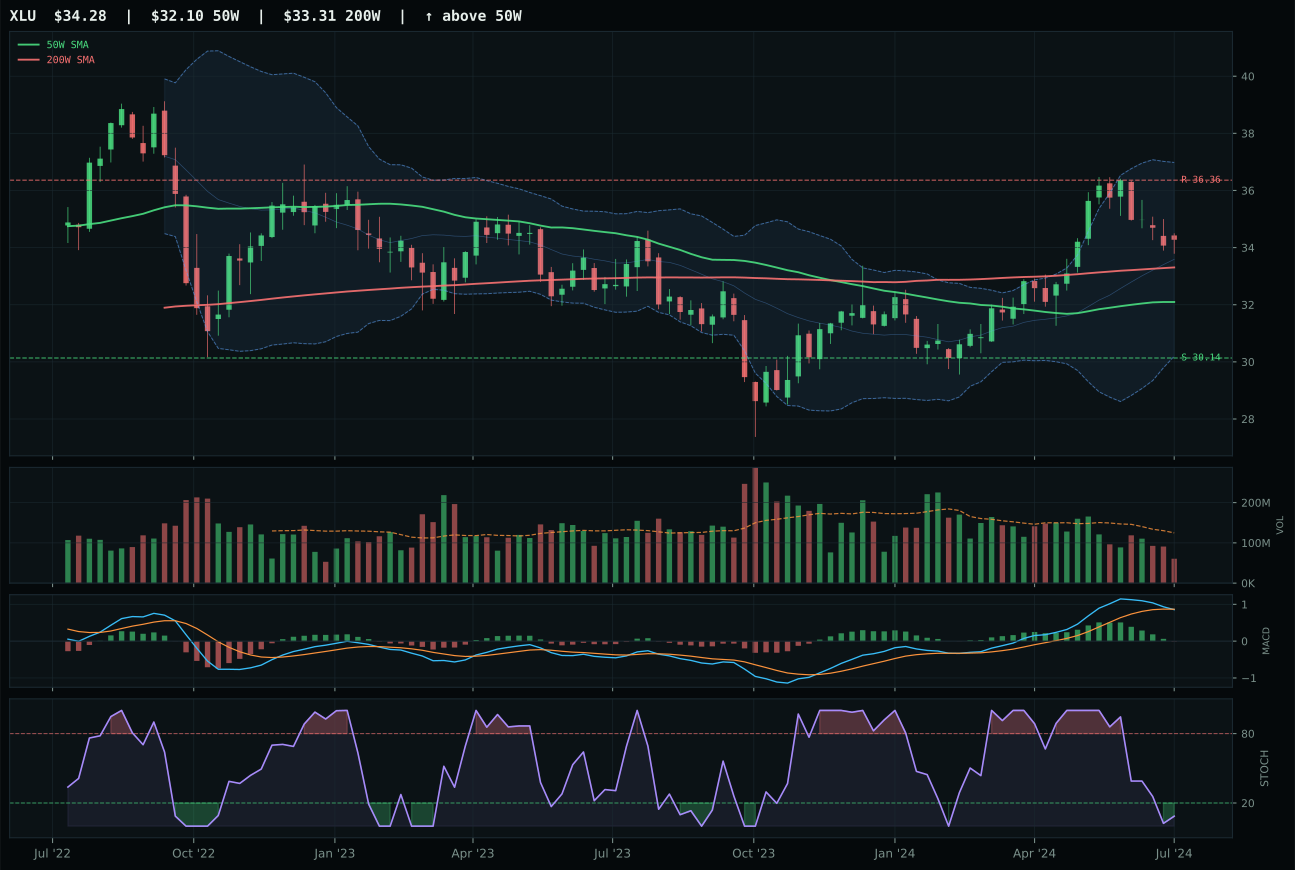
XLU has a neutral structure profile with -1.8% 13-week relative strength versus SPY.
A failed hold above support would weaken the setup.
Actionable but governed by invalidation levels.
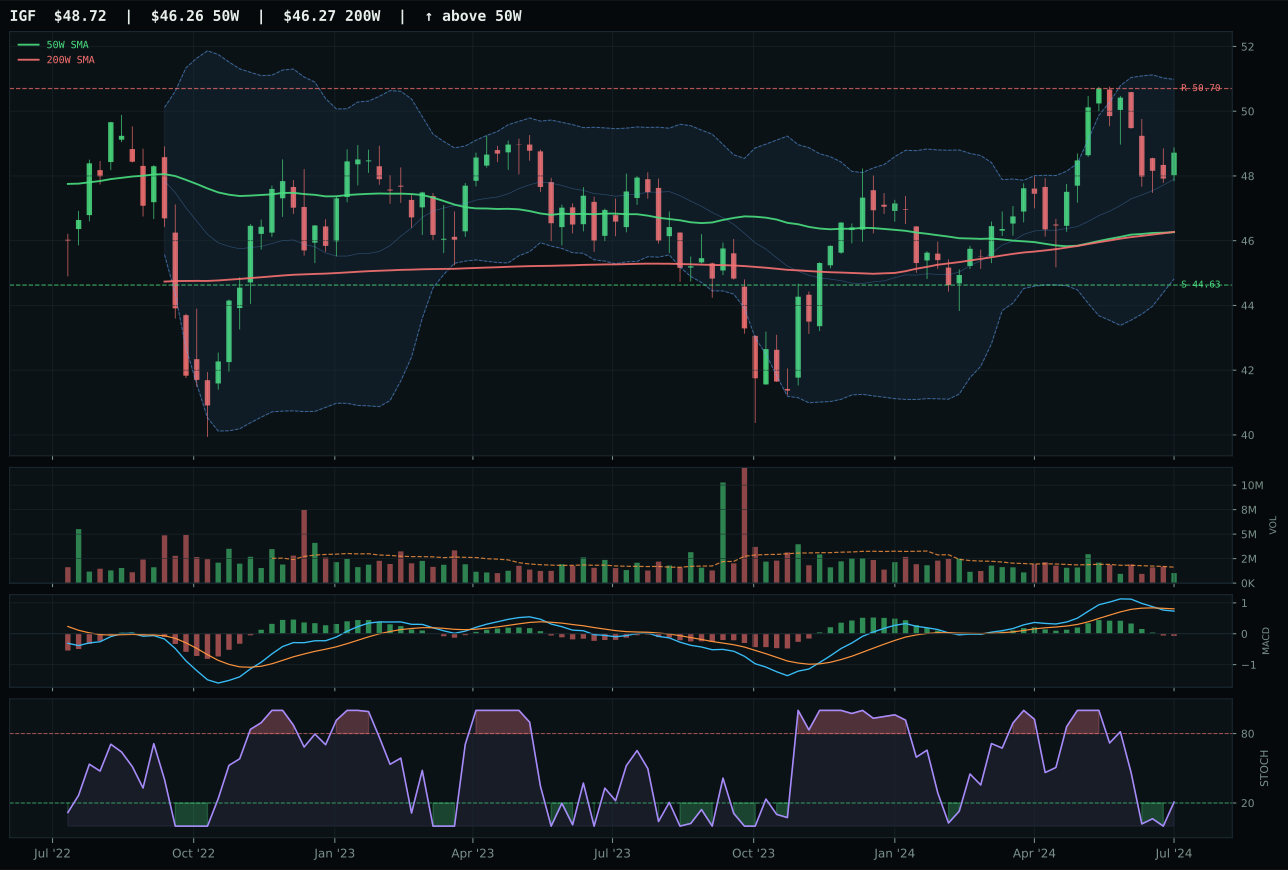
IGF has a neutral structure profile with -4.3% 13-week relative strength versus SPY.
A failed hold above support would weaken the setup.
Actionable but governed by invalidation levels.
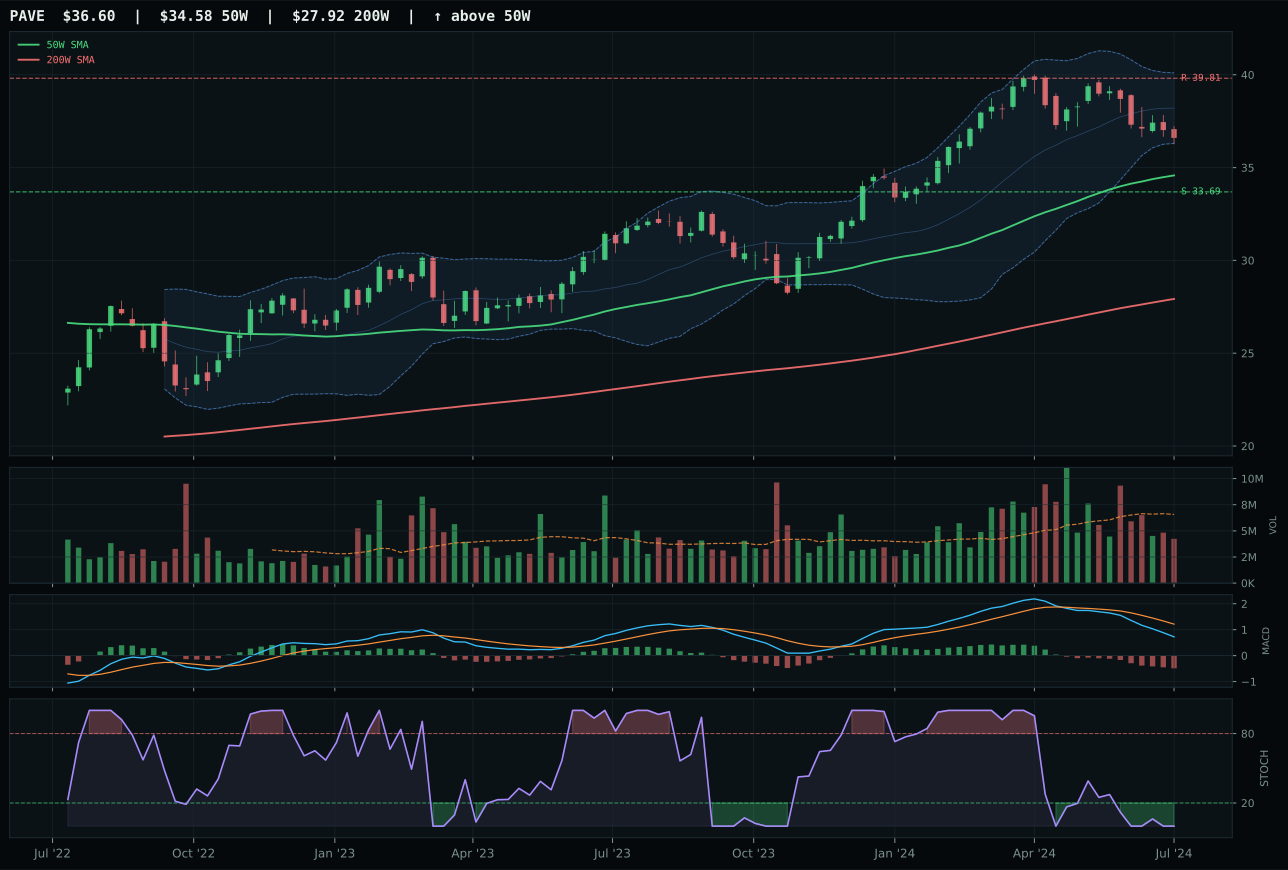
PAVE has a neutral structure profile with -14.8% 13-week relative strength versus SPY.
A failed hold above support would weaken the setup.
Actionable but governed by invalidation levels.
IGF wins a razor-thin category decision (0.3 points over XLU) because its stochastic RSI sits rising mid-zone at 0.21, offering upside potential if buying accelerates, while XLU's oversold stochastic suggests the reversal is already baked in. Both trade in neutral structures well above their 50W moving averages with bearish and weakening MACD, making this a category where every signal is marginal. IGF's timing of 78/100 edges XLU's 70/100 because of better Fibonacci positioning in the upper retracement zone; both offer nearly identical risk-reward around 52-53/100. The thirteen-week return gap favors XLU at 5.2% versus IGF's 2.7%, but category-relative strength sits flat for IGF at 0.0% versus XLU's positive 2.5%, indicating XLU is the relative performer that loses the decision because the category selection mechanism prioritizes fresh momentum signals over backward-looking returns. PAVE is eliminated by its negative 14.8% relative strength and broken momentum profile.
Utilities & Infrastructure ranks tied-seventh at 44.0 and earns 5% allocation almost entirely on macro sponsorship: disinflation helps this exposure (+7), transition/mixed descriptors support it (+4), and disinflation pressure is specifically positive (+6), creating a sixty-two-point category macro fit. IGF's thirteen-week return of 2.7% and -4.3% relative weakness to SPY would normally disqualify any position, yet the utilities category's structural role as a duration-hedging and income-generating sleeve justifies the allocation in a declining-rate environment. This is a defensive positioning—not a conviction growth bet—that benefits from the very rate compression that pressures equities. The allocation would upgrade to 10% only if IGF's momentum confirmation jumped above 40 or if thirteen-week returns turned positive; neither is in evidence, so 5% reflects appropriate sizing for a macro-driven, technically weak holding. The position serves as a stabilizer and income generator rather than a growth driver.
Defense & Aerospace — XAR
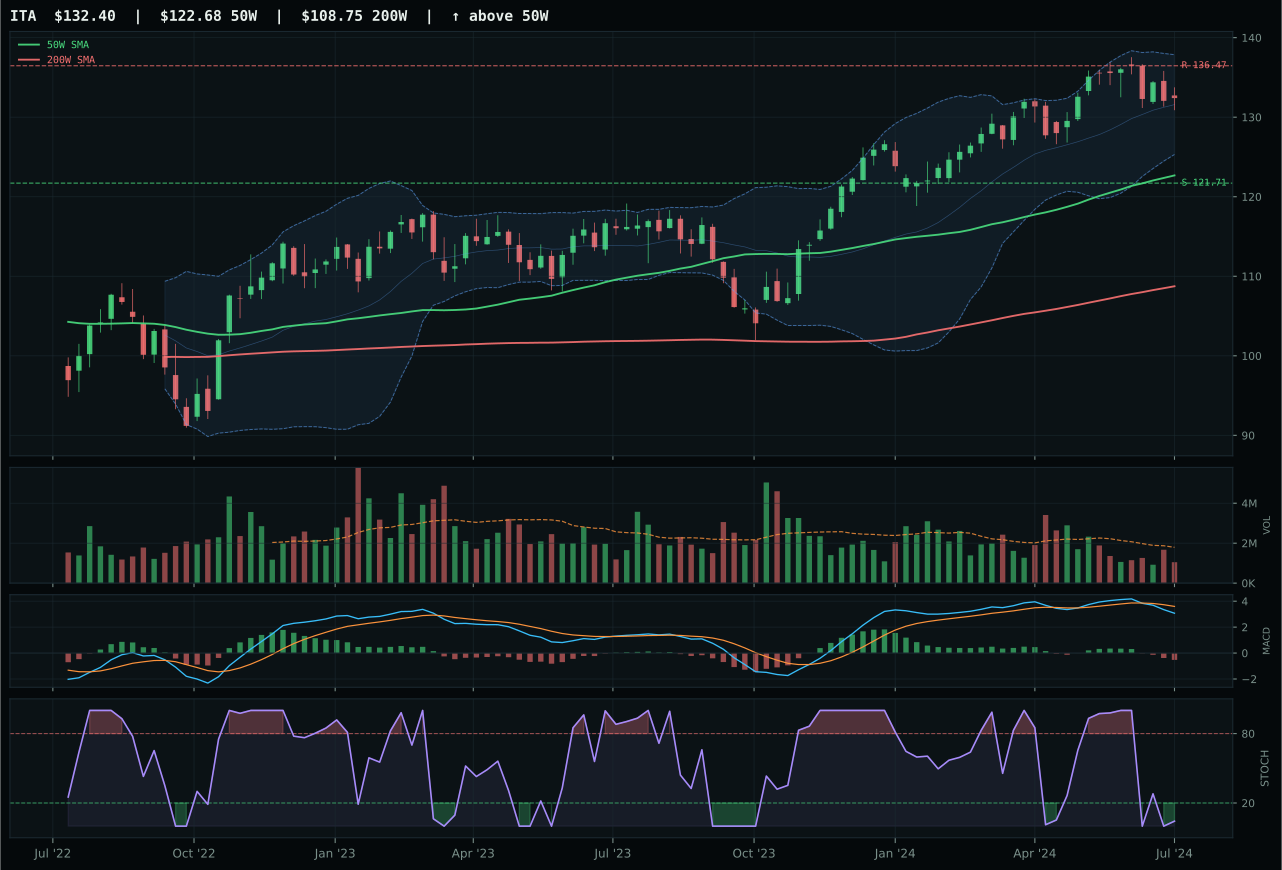
ITA has a neutral structure profile with -6.2% 13-week relative strength versus SPY.
A failed hold above support would weaken the setup.
Actionable but governed by invalidation levels.
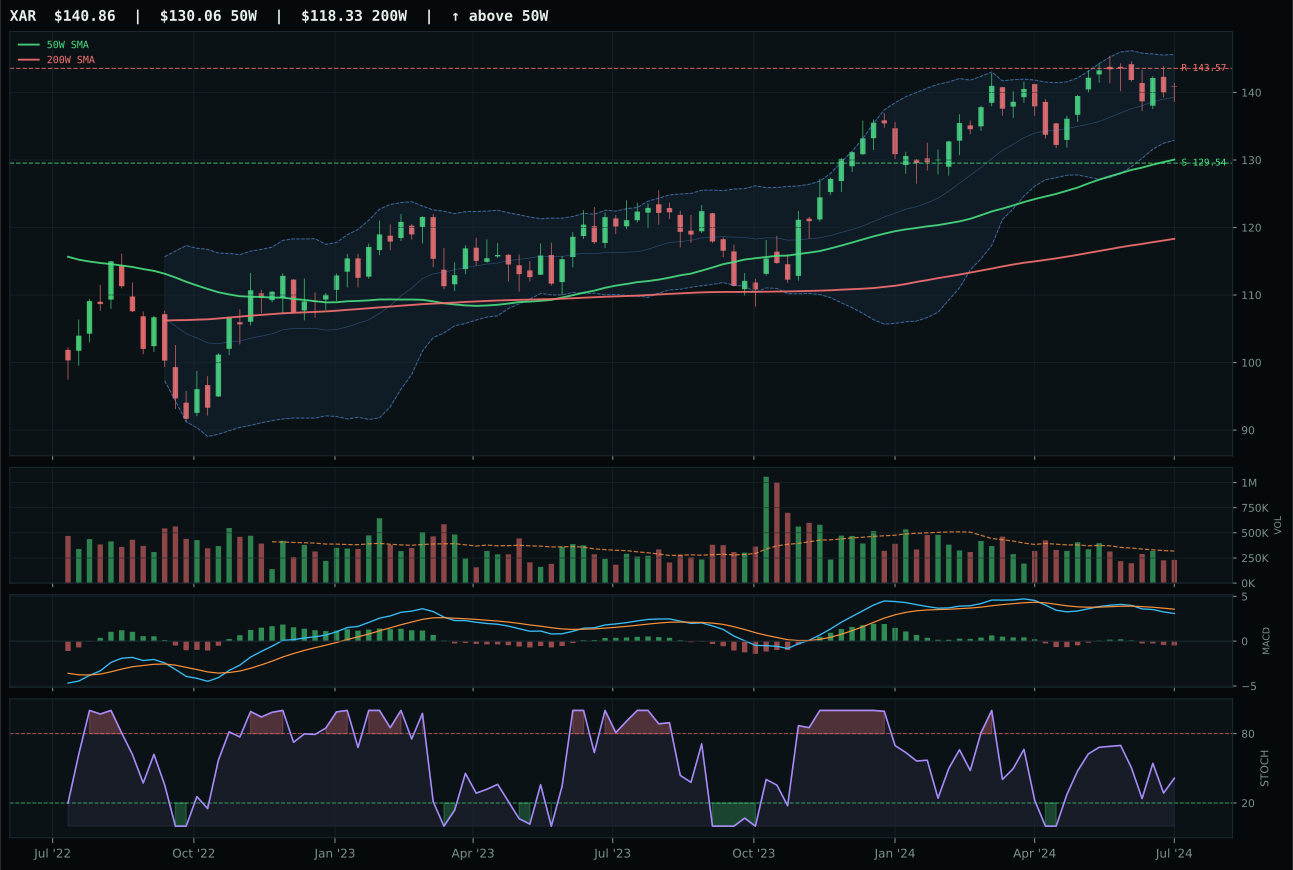
XAR has a neutral structure profile with -4.9% 13-week relative strength versus SPY.
A failed hold above support would weaken the setup.
Actionable but governed by invalidation levels.
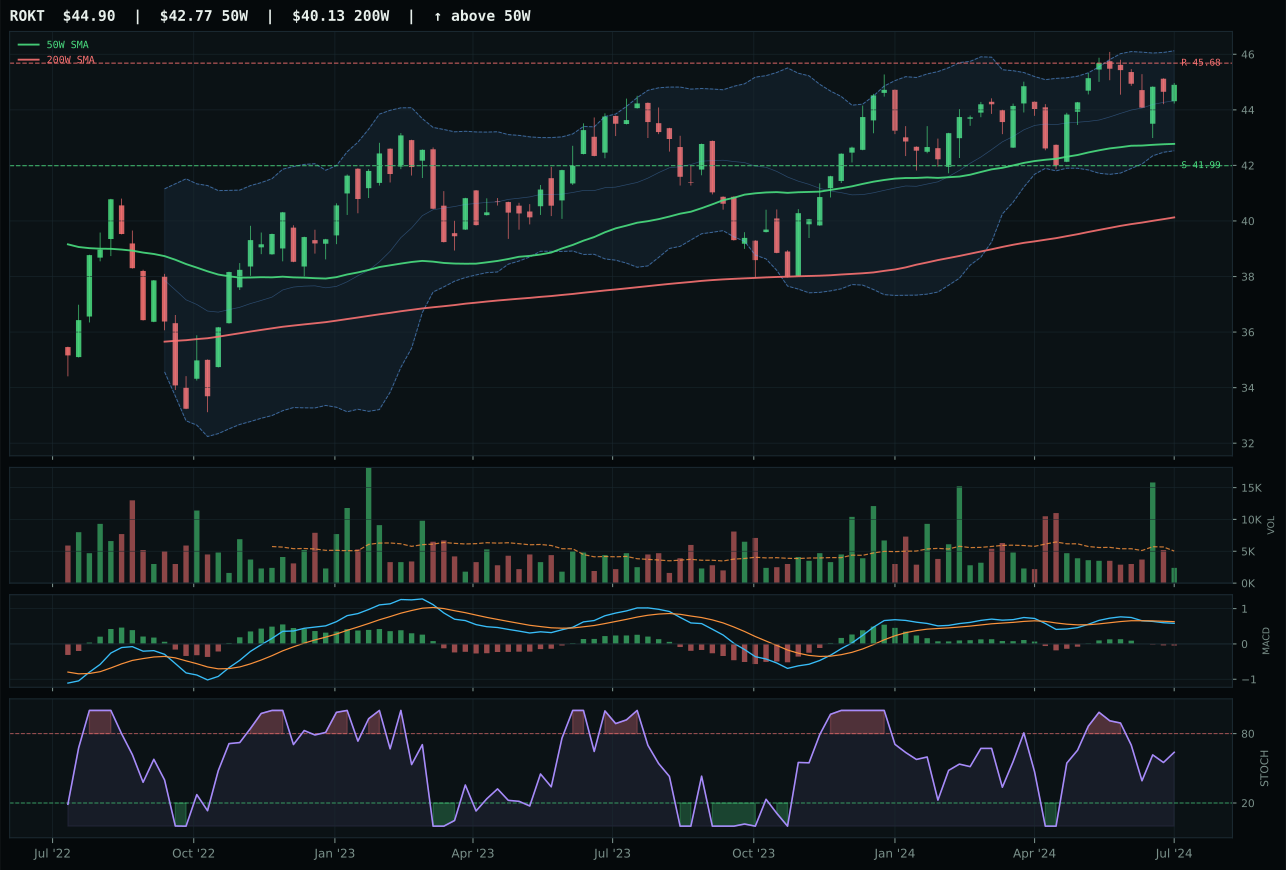
ROKT has a neutral structure profile with -5.0% 13-week relative strength versus SPY.
A failed hold above support would weaken the setup.
Tracked, but not top-2 eligible because: .
XAR wins a close category decision—the score gap versus ITA is just 0.9 points—because its stochastic RSI is rising from the mid-zone at 0.41, offering potential for expansion if buyers step in, whereas ITA's stochastic is oversold turn up, which is a weaker technical setup despite looking attractive on paper. Both names trade in neutral structures near their 50-week moving averages with bearish and weakening MACD, making this a binary bet on whether the sector can find support and consolidate. XAR's 2.1% thirteen-week return barely beats zero, and its category-relative strength advantage of 0.1% versus ITA is negligible—this is a category decision built on microscopic technical edges rather than conviction. ROKT rounds out the trio with nearly identical technicals to XAR but sits slightly lower in the reasoned proof order, making XAR the representative by elimination rather than dominance.
Defense & Aerospace ranks seventh overall at 41.5 and receives only 5% allocation weight as a structural underweight within the equity sleeve. The macro environment offers no tailwind—there is no category-specific descriptor profile advantage, no liquidity support, and modest credit-stress headwinds (-4)—leaving the category dependent entirely on technical evidence that scores a pedestrian 43.1 for the winner. This is a 5% placeholder for defense cyclicality if geopolitical risk or industrial spending suddenly accelerates; without such a trigger, the category ranks below commodities, precious metals, and emerging-market beta on risk-adjusted appeal. XAR's momentum confirmation of 23.6 is among the weakest in the portfolio, signaling dormant accumulation rather than conviction. The allocation would upgrade to 10% only if credit stress reversed to positive, if military-industrial commentary improved materially, or if XAR's volume participation jumped above 1.0x the twenty-week average—none of which are in evidence.
Industrial Metals — COPX
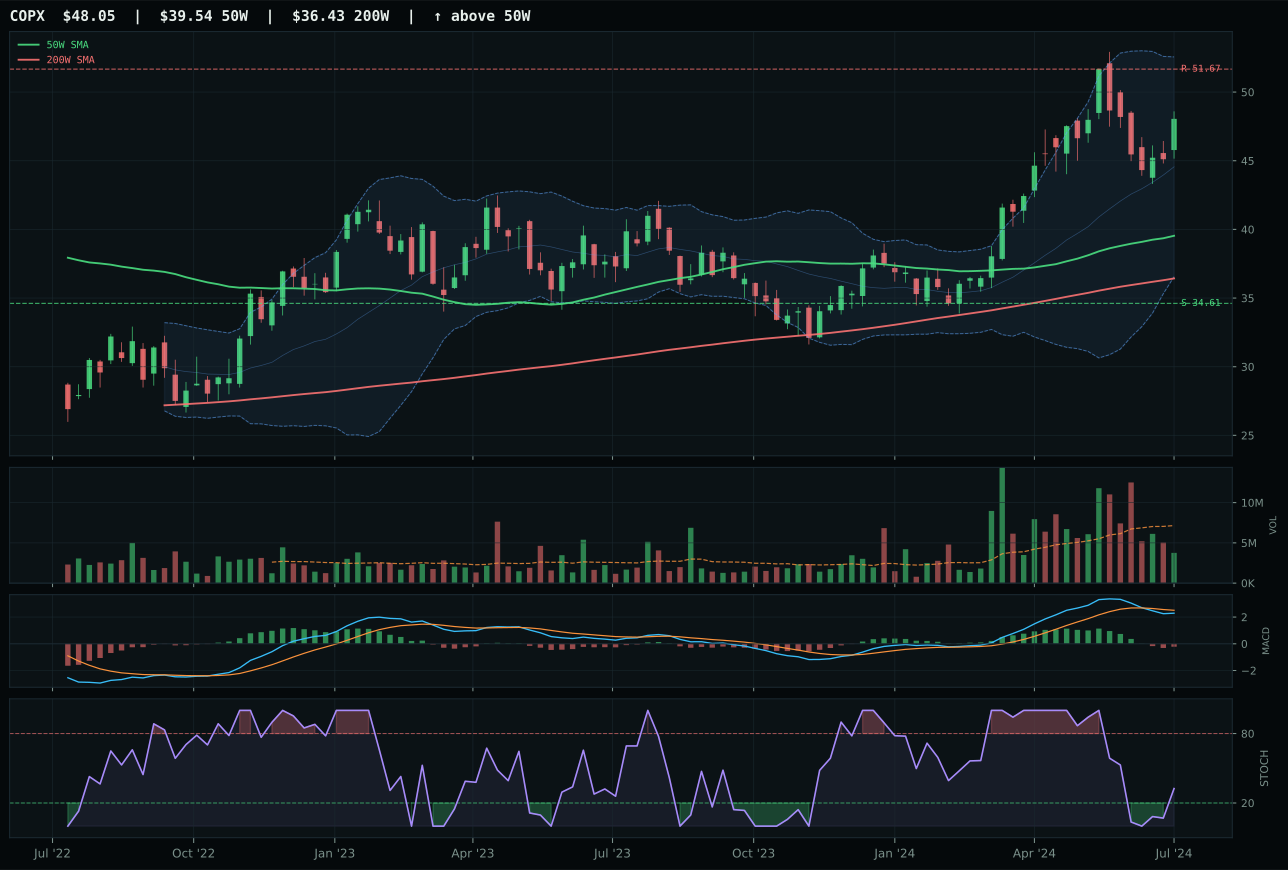
COPX has a vertical extension profile with 0.7% 13-week relative strength versus SPY.
A failed hold above support would weaken the setup.
Actionable but governed by invalidation levels.
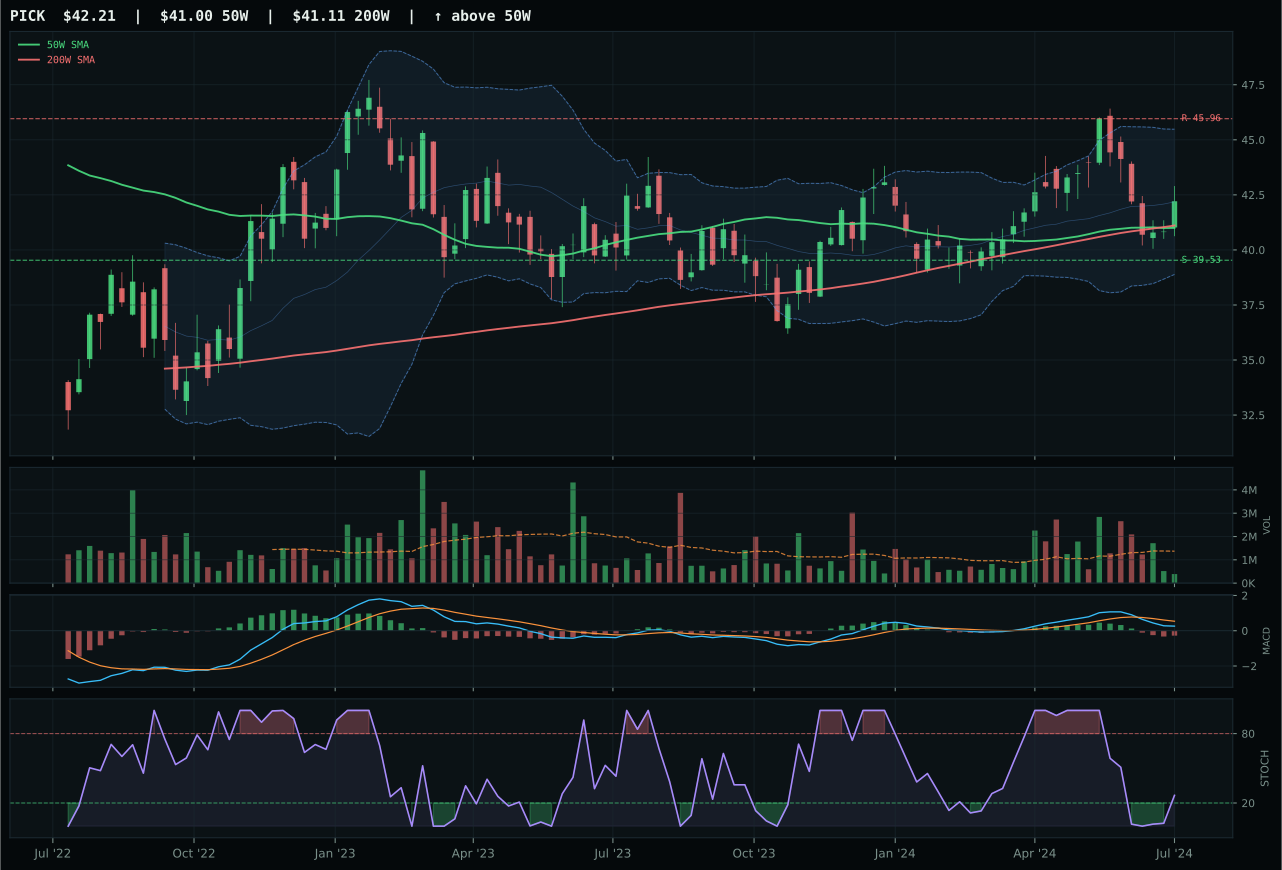
PICK has a compression near 50W profile with -7.9% 13-week relative strength versus SPY.
A failed hold above support would weaken the setup.
Actionable but governed by invalidation levels.
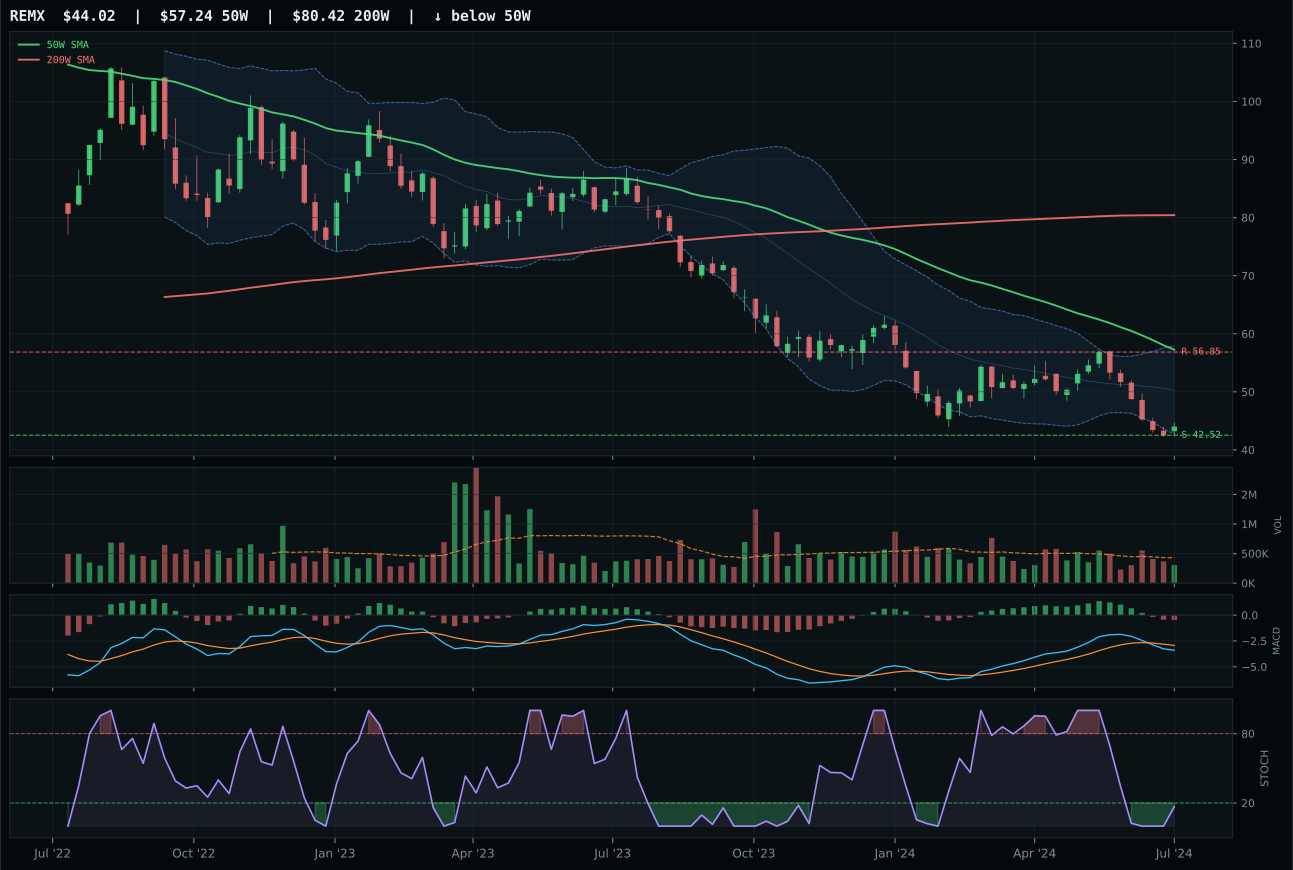
REMX has a pullback into support profile with -22.7% 13-week relative strength versus SPY.
Extension and support failure are the main tactical risks.
Tracked, but not top-2 eligible because: structurally broken.
COPX wins despite a 13.0-point score gap versus PICK because it carries category-relative strength of 8.6%, which means it's performing measurably better than its peer median, while PICK sits flat at 0.0% despite having superior timing (100/100 versus COPX's 56/100). The gap reveals COPX's real advantage: PICK is perfectly timed near 50W support and compression with excellent risk-reward (75/100 versus COPX's 48.2/100), but that timing precision means PICK is a short-term trade, not a category expression. COPX trades at a 21.5% extension above the 50W in vertical extension setup with bearish and weakening MACD, yet its momentum confirmation of 62.1/100 and category-relative strength of 8.6% signal that it's the actual momentum leader. REMX is eliminated entirely—pullback into support with oversold stochastic and zero momentum indicates it's waiting for a reversal signal that may never come.
Industrial Metals ranks sixth at 38.2 and earns 5% allocation through strong macro sponsorship: metals scarcity is firing (+14), commodity breadth is positive (+10), and real-asset sponsorship is active (+6), creating a sixty-five-point category macro fit. These macro drivers offset COPX's soft technical evidence (36.5 composite) by providing structural tailwinds independent of price momentum. The disinflation regime supports industrial-metal demand through capex cycles (infrastructure, electrification) while rate compression benefits both miners and commodity cycles. This is not a momentum play; it is a macro-structure bet that outweighs COPX's extended entry. The allocation would expand to 10% only if PICK regained category-relative leadership (currently 0.0%) or if COPX's MACD shifted from bearish-weakening to bullish-improving. Current 5% sizing balances genuine macro tailwinds against soft technical confirmation and extended price positioning.
Emerging Markets — INDA
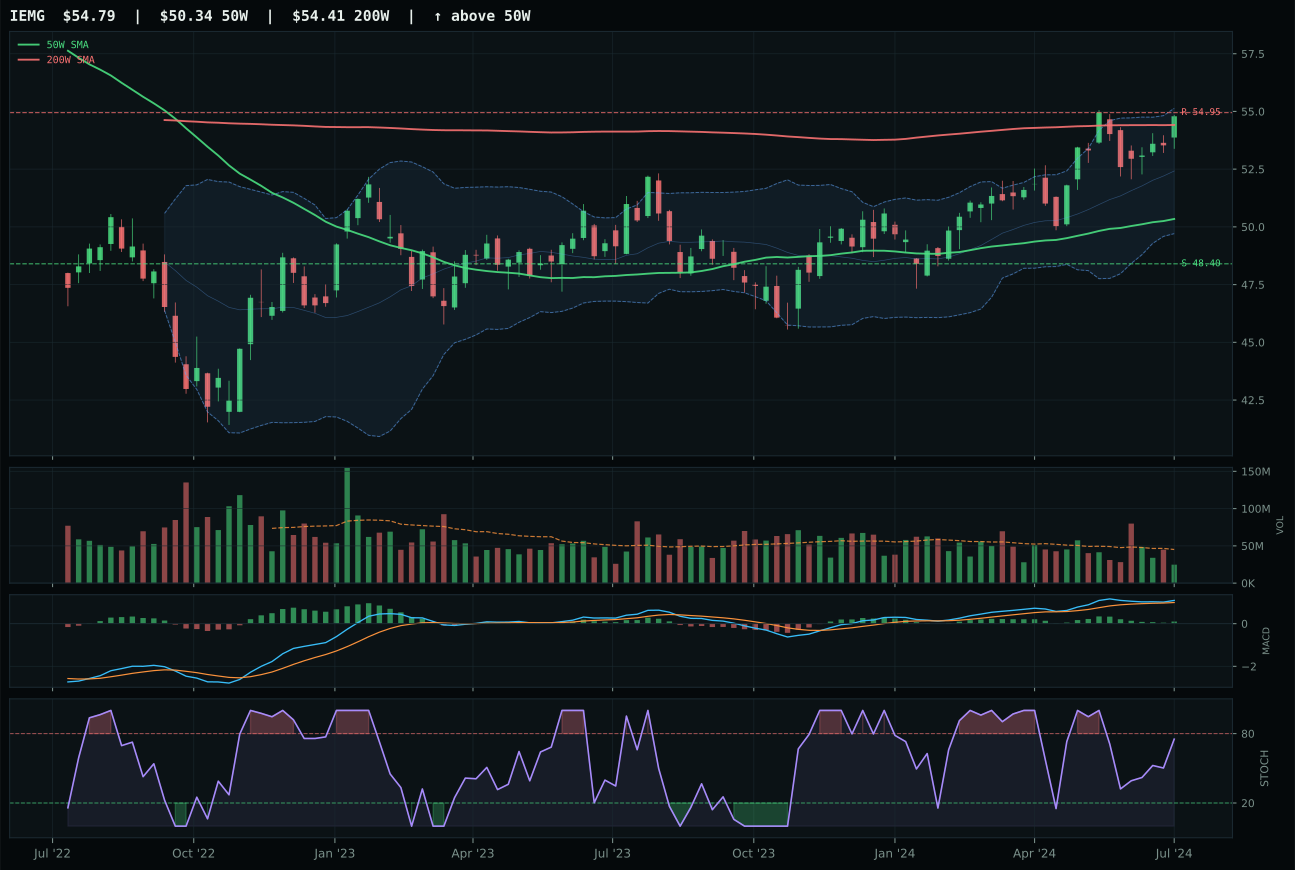
IEMG has a neutral structure profile with -1.3% 13-week relative strength versus SPY.
A failed hold above support would weaken the setup.
Actionable but governed by invalidation levels.
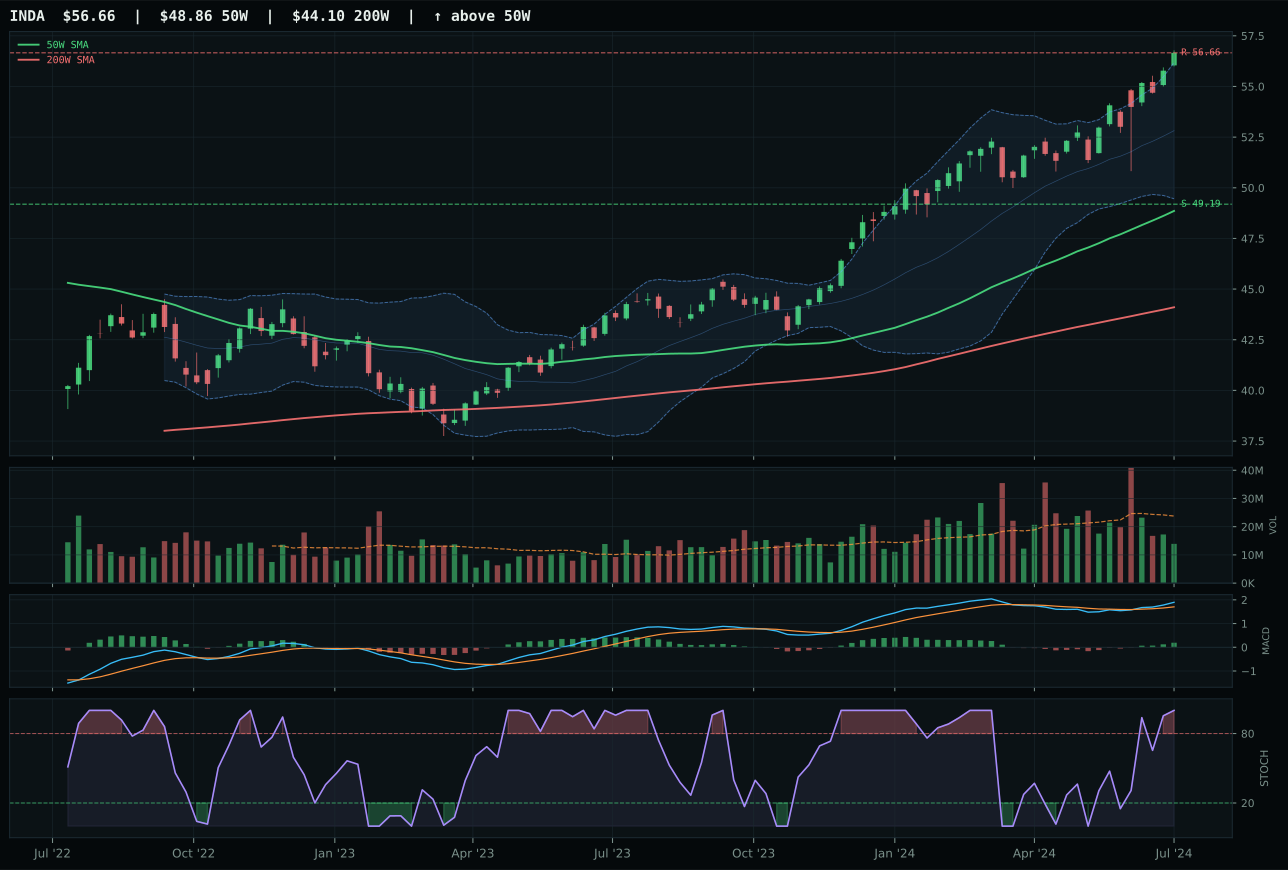
INDA has a vertical extension profile with 1.9% 13-week relative strength versus SPY.
A failed hold above support would weaken the setup.
Actionable but governed by invalidation levels.
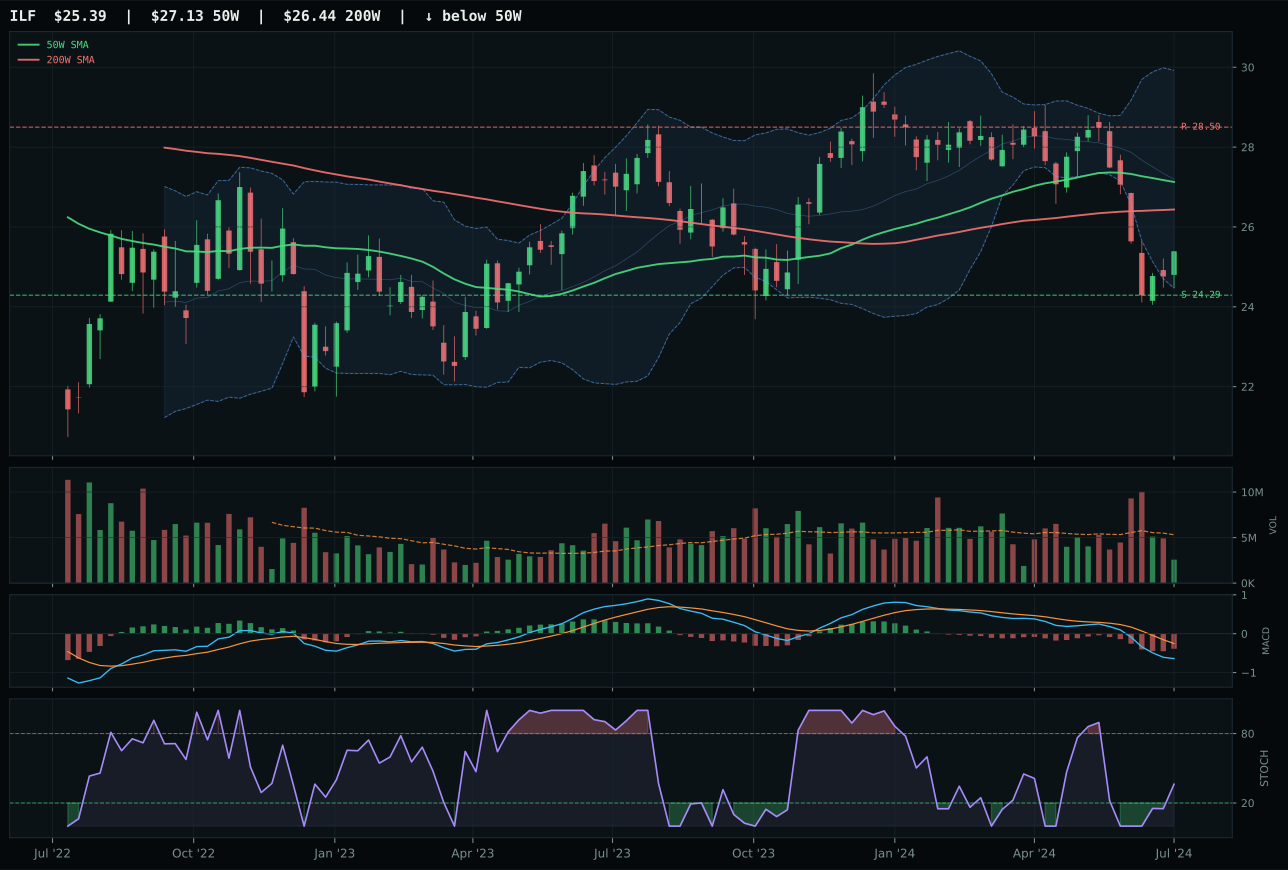
ILF has a pullback into support profile with -17.2% 13-week relative strength versus SPY.
A failed hold above support would weaken the setup.
Actionable but governed by invalidation levels.
INDA wins the category despite IEMG's superior technical evidence score (69.5/100 versus INDA's 60.5/100) because of decisive category-relative strength of 3.3% that IEMG cannot match at 0.0%, combined with MACD that's bullish and improving (versus IEMG's bullish but flattening). Both names trade in extension above their 50W—INDA at 16.0%, IEMG at a less punished level—with INDA's momentum confirmation of 82.1/100 eclipsing IEMG's 61/100. INDA's stochastic RSI sits at overbought momentum 1.00 while IEMG's is merely rising mid-zone, meaning INDA's extension is being confirmed by active buying rather than technical complacency. Risk-reward tilts toward INDA at 46.5/100 versus IEMG's 37.4/100, reflecting better entry construction despite both names being extended. The thirteen-week return gap of 8.9% versus 5.6% confirms INDA's superior relative strength.
Emerging Markets ranks ninth at 24.0 and earns a 5% allocation primarily on directional positioning rather than technical conviction, as this category displays genuinely weak macro fit (38.0 at the category level). Risk appetite is positive (+8), yet credit stress (-10) and liquidity stress (-10) create structural headwinds that leave little margin for error. INDA's selection represents a tactical bet that India's earnings power can decouple from broad emerging-market credit stress and that AI-powered productivity gains support valuations independent of rate cycles. The allocation would upgrade to 10% only if INDA's momentum confirmation surged above 85, if relative strength extended above 5%, or if macro descriptors shifted decisively toward favorable credit conditions. Current 5% sizing reflects the tension between strong technical leadership (INDA's 100 trend, 82 momentum) and structurally challenging macro (low category fit, credit and liquidity headwinds). This is a positions-of-strength play, not a macro conviction.
Agriculture & Livestock — MOO
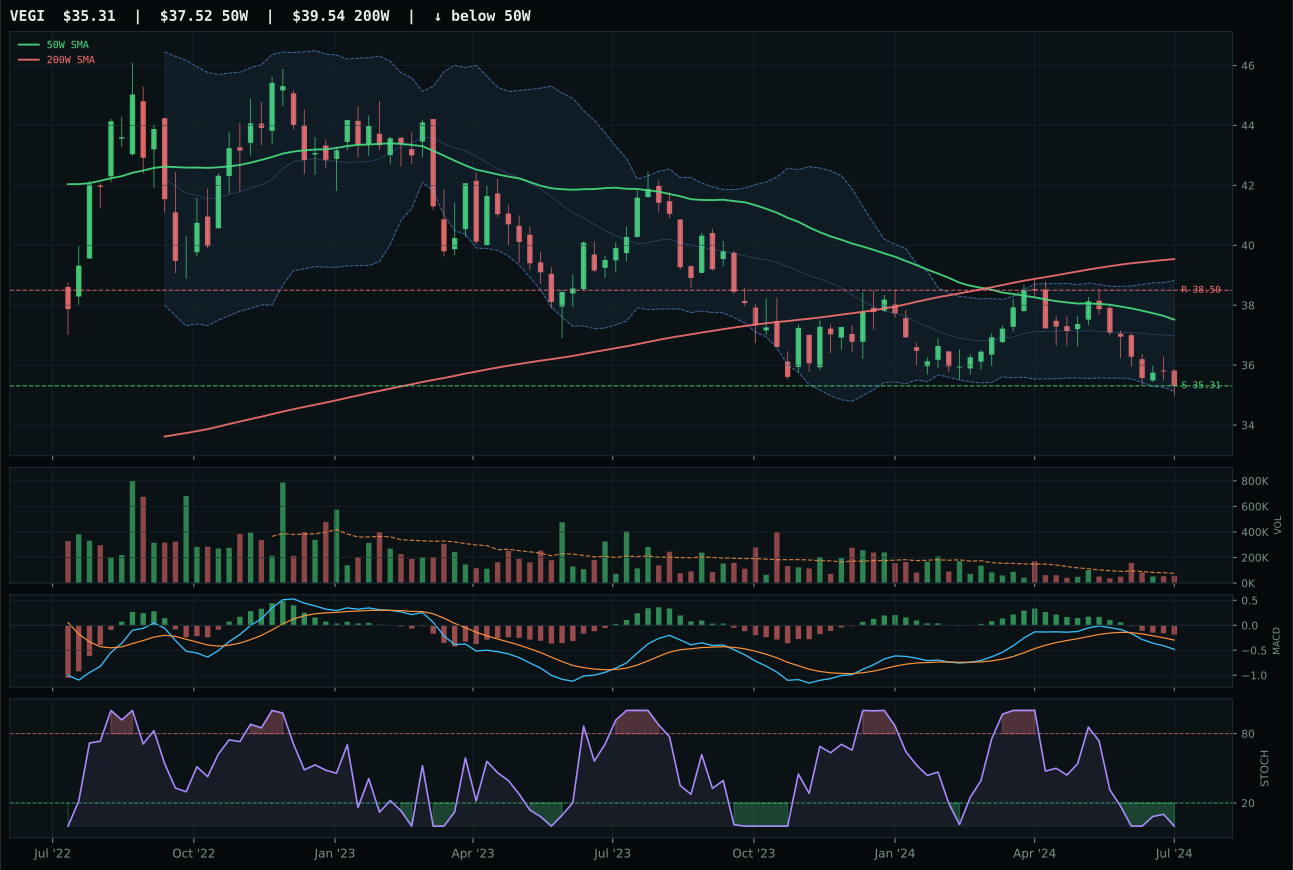
VEGI has a pullback into support profile with -15.3% 13-week relative strength versus SPY.
Extension and support failure are the main tactical risks.
Tracked, but not top-2 eligible because: structurally broken.
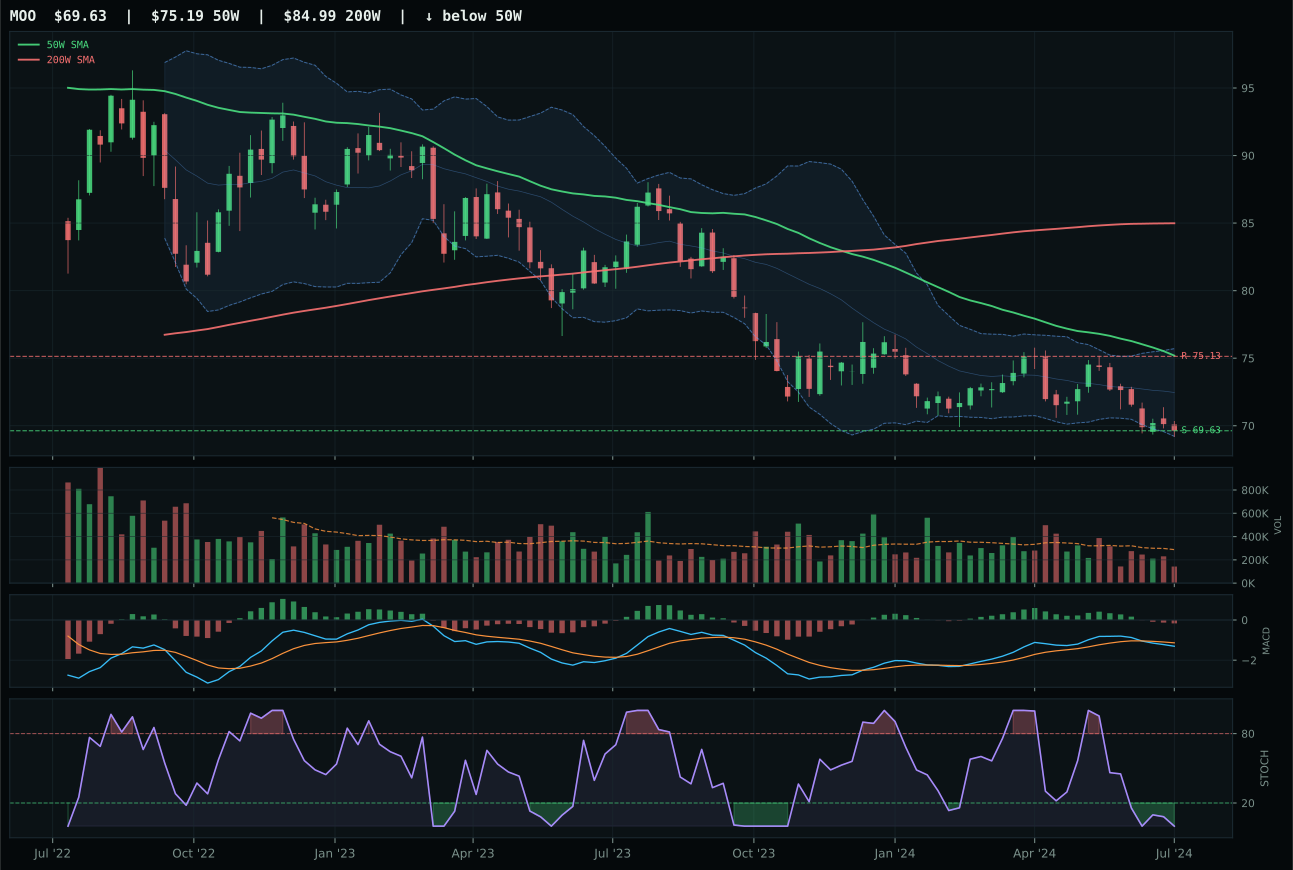
MOO has a pullback into support profile with -14.3% 13-week relative strength versus SPY.
Extension and support failure are the main tactical risks.
Tracked, but not top-2 eligible because: structurally broken.
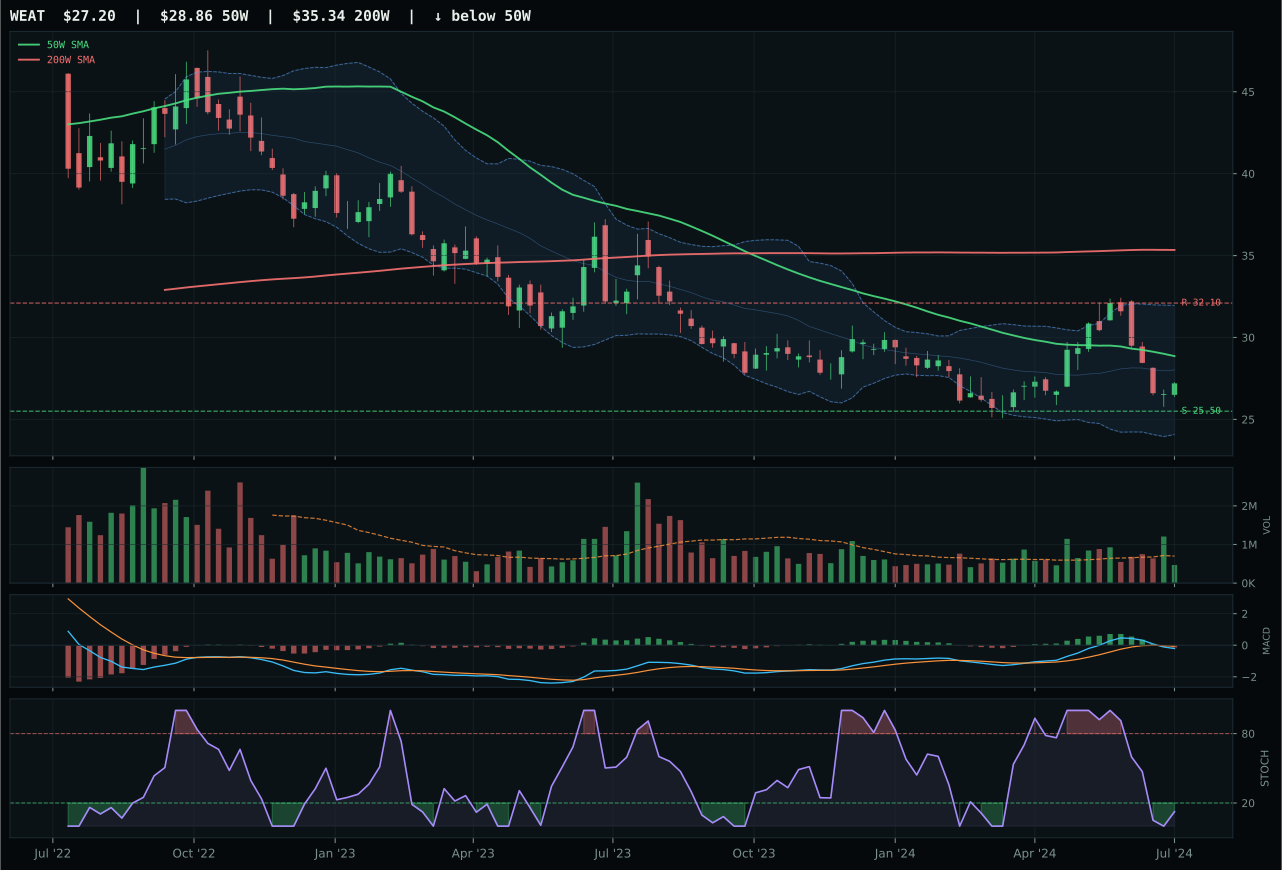
WEAT has a neutral structure profile with -7.4% 13-week relative strength versus SPY.
Extension and support failure are the main tactical risks.
Tracked, but not top-2 eligible because: structurally broken.
MOO wins by default rather than merit—it scores 26.9 in the reasoned ETF proof order versus VEGI's 13.8, but both names are structurally broken and ineligible for top-2 consideration. MOO trades below both its 50-week and 200-week moving averages with a -14.3% relative strength headwind against SPY, and its bearish and weakening MACD confirmed by oversold stochastic RSI at 0.00 signals capitulation rather than opportunity. The only reason to hold MOO at all is the defined invalidation area at support 69.63—if that level holds, the risk-reward tilts favorable (61.5/100) because downside is capped while upside offers relief. VEGI is even worse, with zero momentum contribution and structurally broken hard filters that eliminate it entirely. WEAT at 31.5 reasoned score trails both and represents the category's actual relative strength leader, but it's rejected here because the category scoring mechanism penalizes it for outperforming when the regime doesn't favor real assets.
Agriculture & Livestock ranks last at 1.3 and earns zero allocation—the category failed eligibility checks and does not merit a position at any portfolio size under current conditions. Disinflation is actively bearish for real assets (-6 macro hit, -8 disinflation-pressure penalty), liquidity stress is active (-4), and the technical evidence is catastrophic: MOO's eighteen-point technical score ranks it among the lowest composite setups in the entire universe. This is not a defensive hold or a cyclical trade; it is a broken category awaiting either a reset lower to clear fresh support or a complete macro pivot toward inflation and commodity scarcity. The position would earn even a 5% allocation only if: price rebounds above the fifty-week moving average with volume confirmation, stochastic RSI rises above 0.50, MACD turns bullish, and macro descriptors flip (commodity breadth and metals scarcity must outweigh disinflation pressure). None of these conditions are present, making this an exclusion, not a position.
Traditional Energy — XLE
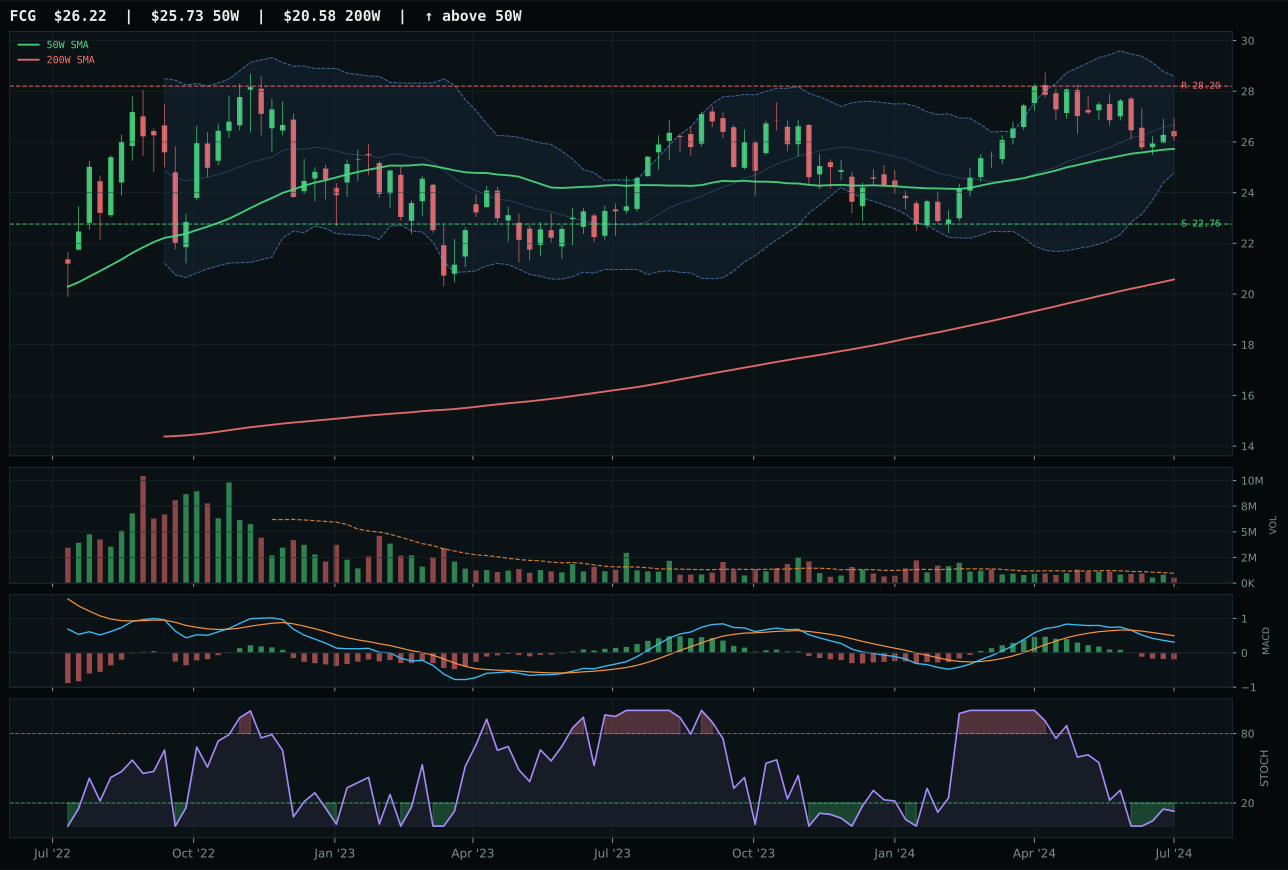
FCG has a compression near 50W profile with -14.0% 13-week relative strength versus SPY.
A failed hold above support would weaken the setup.
Actionable but governed by invalidation levels.
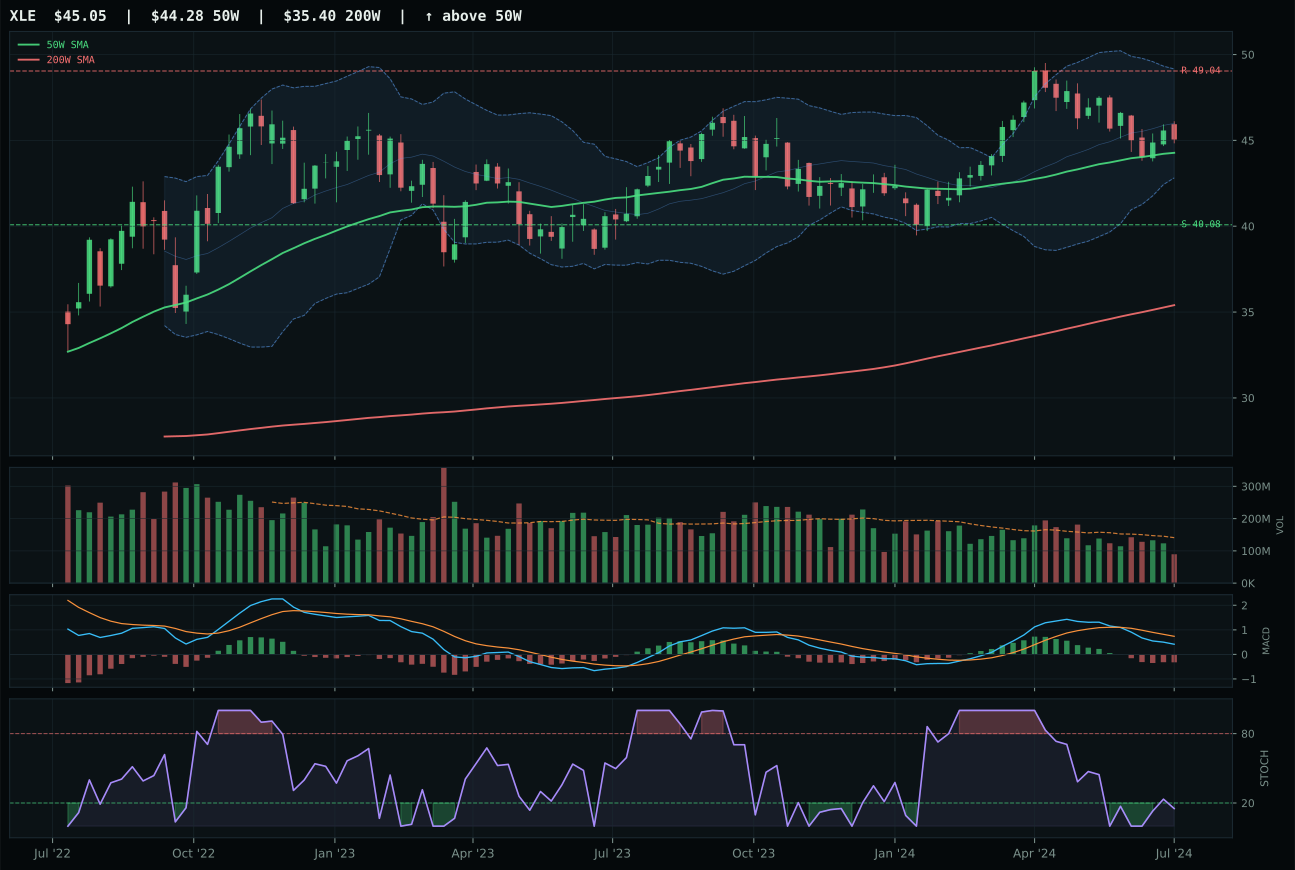
XLE has a compression near 50W profile with -15.1% 13-week relative strength versus SPY.
A failed hold above support would weaken the setup.
Actionable but governed by invalidation levels.
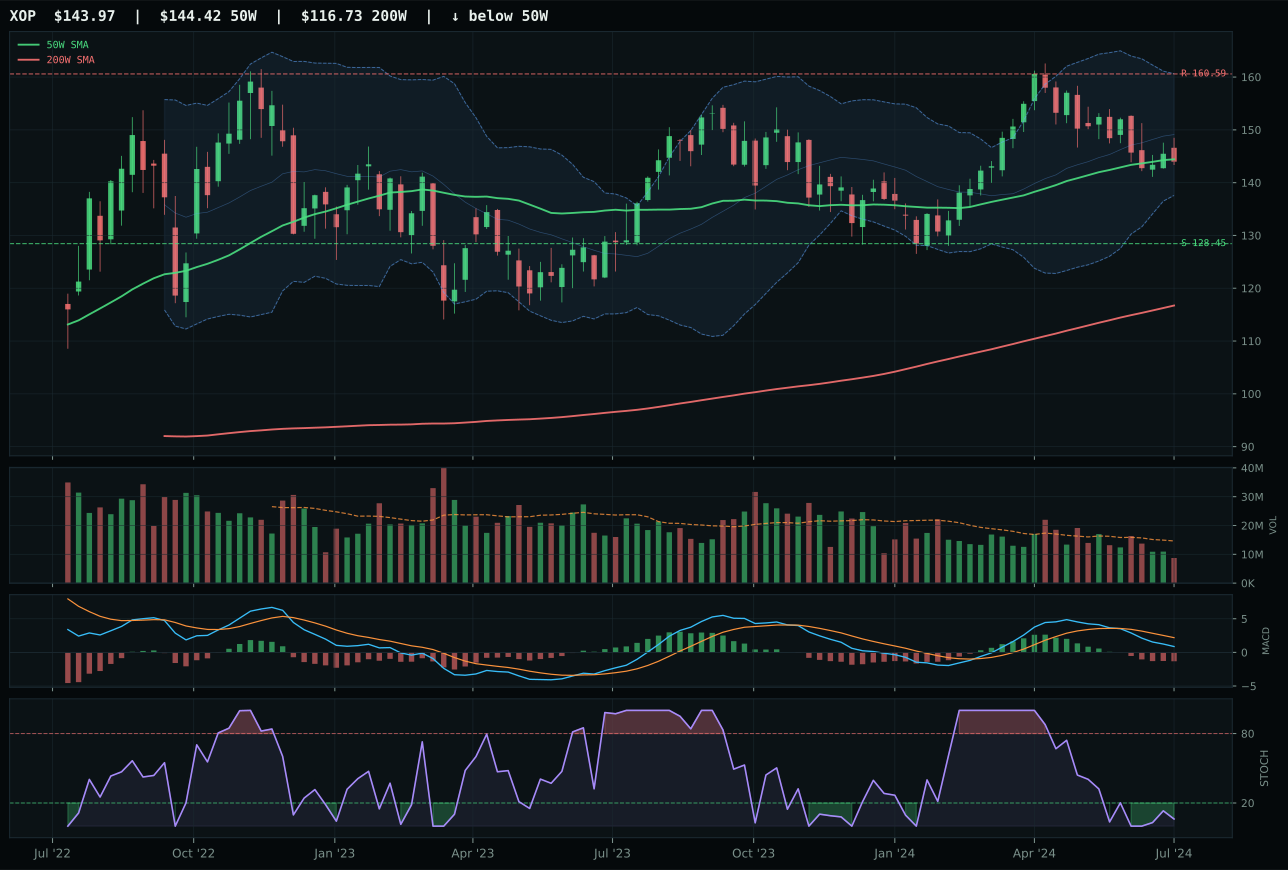
XOP has a compression near 50W profile with -17.3% 13-week relative strength versus SPY.
A failed hold above support would weaken the setup.
Actionable but governed by invalidation levels.
XLE wins by the narrowest margin (0.2 points over FCG) in a category where both names are essentially broken, trading in compression near their 50W with bearish and weakening MACD and near-zero momentum. XLE's 100/100 timing score reflects its proximity to 50W support at 40.08, giving it the classic mean-reversion setup that appeals to oversold traders, but the thirteen-week return of negative 8.1% and category-relative strength of 0.0% tell you there's no directional sponsorship. FCG's 39.3/100 technical evidence versus XLE's 33.3/100 should favor FCG, but XLE's risk-reward of 64.8/100 edges FCG's 61.3/100, and structure is marginally cleaner at 70.0/100 versus 69.6/100. Both carry negative 15% relative strength headwinds against SPY, indicating systematic selling pressure. COPX sits at 12.1 in the reasoned proof order, nearly irrelevant to this decision.
Traditional Energy ranks last (tied at 10th) with a score of just 0.8 and earns zero allocation—this category failed eligibility entirely and does not merit a position under any conditions this week. Disinflation is a direct headwind (-10 macro penalty), disinflation pressure is active (-10), and the technical fabric is broken: XLE's momentum confirmation of 3.2 is among the lowest in the portfolio, volume-price confirmation is weak at 29.4, and thirteen-week returns are negative across the board. The category's macro fit of 23.0 is the lowest on the scorecard, and there is no scenario in which energy re-rates higher in a disinflation regime without a simultaneous geopolitical shock or sudden supply disruption. This position would earn a 5% allocation only if: XLE breaks above its resistance at 49.04 on volume exceeding 1.0x the twenty-week average, MACD turns bullish, and macro descriptors flip toward real-asset sponsorship. None of these conditions are met.