
2024-06-28
Informational purposes only. The content in this report, including allocations, analysis, and commentary, is provided solely for informational and educational purposes. It does not constitute financial advice, investment advice, trading advice, or any other type of advice. Past performance does not guarantee future results. Always conduct your own research and consult a qualified financial professional before making investment decisions.
Weekly Allocation
| Ticker | Category | Weight | Role |
|---|---|---|---|
| FBTC | 50% | Overlay | |
| IGV | Technology | 10% | Top-2 (10%) |
| SMH | AI | 10% | Top-2 (10%) |
| GLD | Precious Metals | 5% | Tier-2 (5%) |
| XLU | Utilities & Infrastructure | 5% | Tier-2 (5%) |
| NLR | Nuclear Energy | 5% | Tier-2 (5%) |
| ITA | Defense & Aerospace | 5% | Tier-2 (5%) |
| INDA | Emerging Markets | 5% | Tier-2 (5%) |
| COPX | Industrial Metals | 5% | Tier-2 (5%) |
Trade Instructions — Monday Open
Sell the tranche from 2024-05-31 (completing its 4-week hold). Buy the new tranche. Instructions show net portfolio changes — same-asset positions cancel, weight changes show the delta.
| Action | Ticker | Instruction |
|---|---|---|
| SELL | SLV | Sell entire SLV position (2.50% of portfolio) |
| SELL | NLR | Sell 17% of NLR position (reduce 7.50% → 6.25%) |
| SELL | XLE | Sell 50% of XLE position (reduce 2.50% → 1.25%) |
| SELL | XAR | Sell entire XAR position (1.25% of portfolio) |
| SELL | WEAT | Sell 50% of WEAT position (reduce 2.50% → 1.25%) |
| BUY | SMH | Buy SMH — 16.67% of freed cash (adds 1.25% to portfolio) |
| BUY | GLD | Buy GLD — 16.67% of freed cash (adds 1.25% to portfolio) |
| BUY | ITA | Buy ITA — 16.67% of freed cash (adds 1.25% to portfolio) |
| BUY | INDA | Buy INDA — 16.67% of freed cash (adds 1.25% to portfolio) |
| BUY | IGV | Buy IGV — 33.33% of freed cash (adds 2.50% to portfolio) |
Current Portfolio After Trade
Combined holdings across all 4 active tranches. Each tranche is 25% of the portfolio.
| Ticker | % of Portfolio | Weight Bar |
|---|---|---|
| FBTC | 50.00% | |
| GLD | 8.75% | |
| NLR | 6.25% | |
| SMH | 6.25% | |
| XLU | 6.25% | |
| ITA | 5.00% | |
| COPX | 3.75% | |
| INDA | 3.75% | |
| XLK | 2.50% | |
| IGV | 2.50% | |
| XLE | 1.25% | |
| WEAT | 1.25% | |
| IGF | 1.25% | |
| PICK | 1.25% |
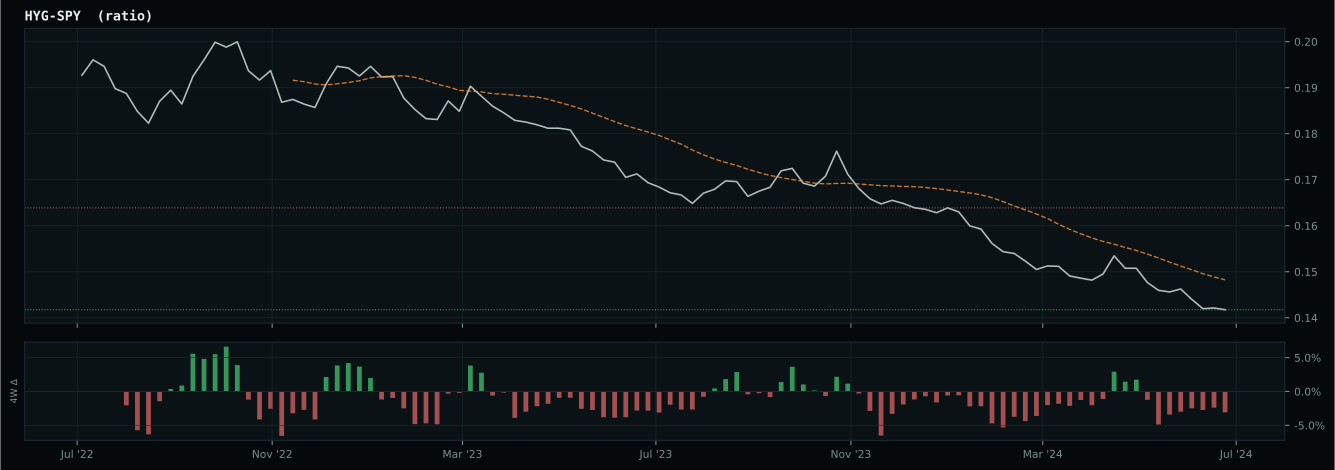
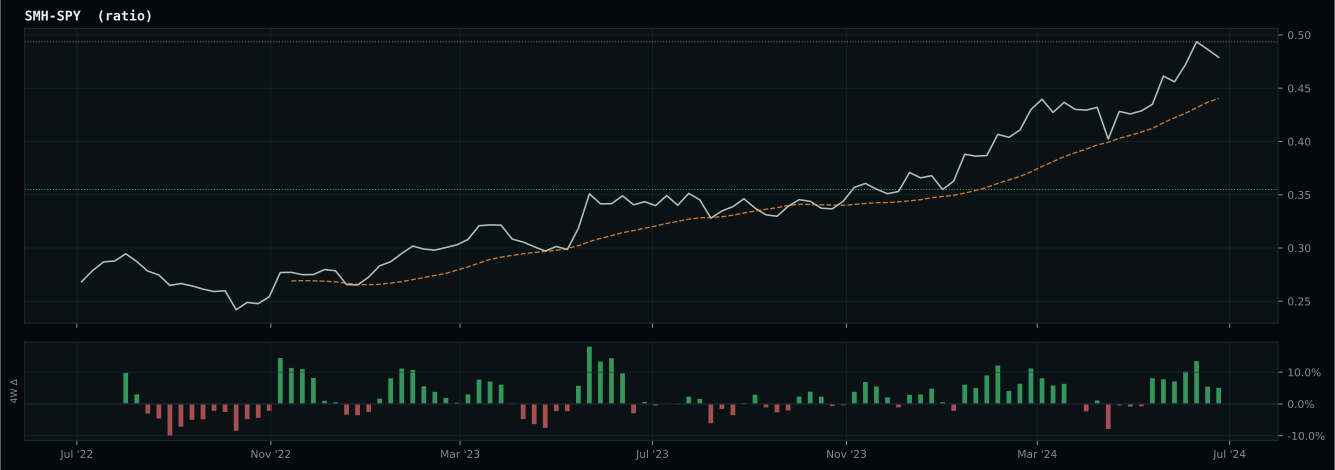
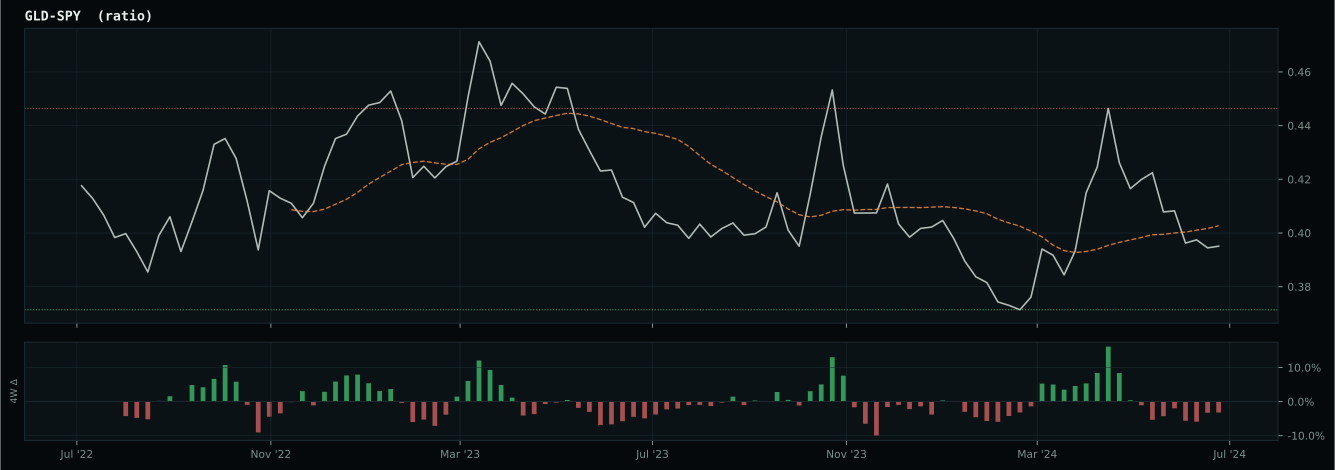
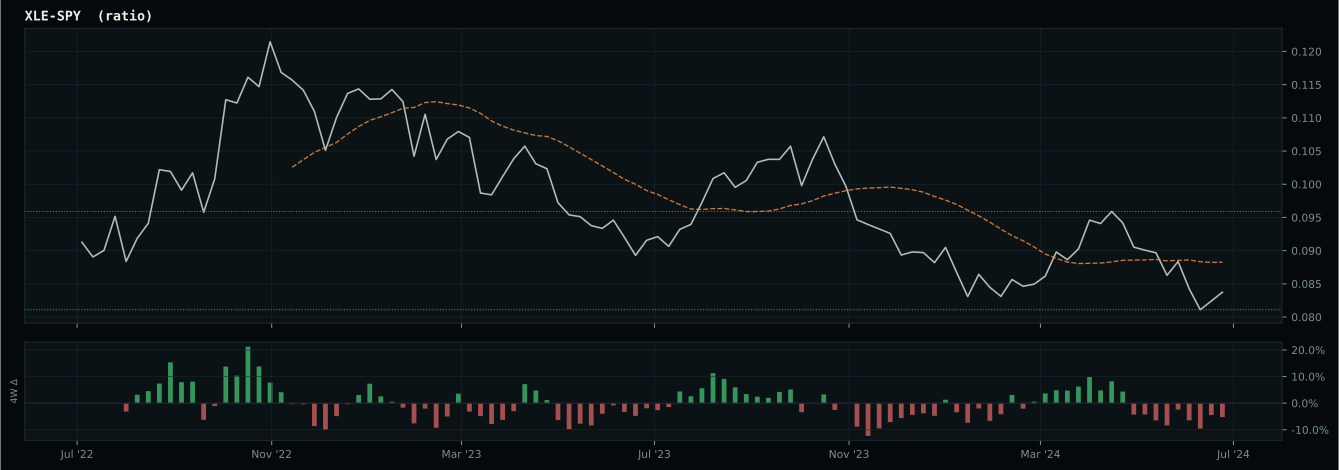
Macro Regime — Disinflation
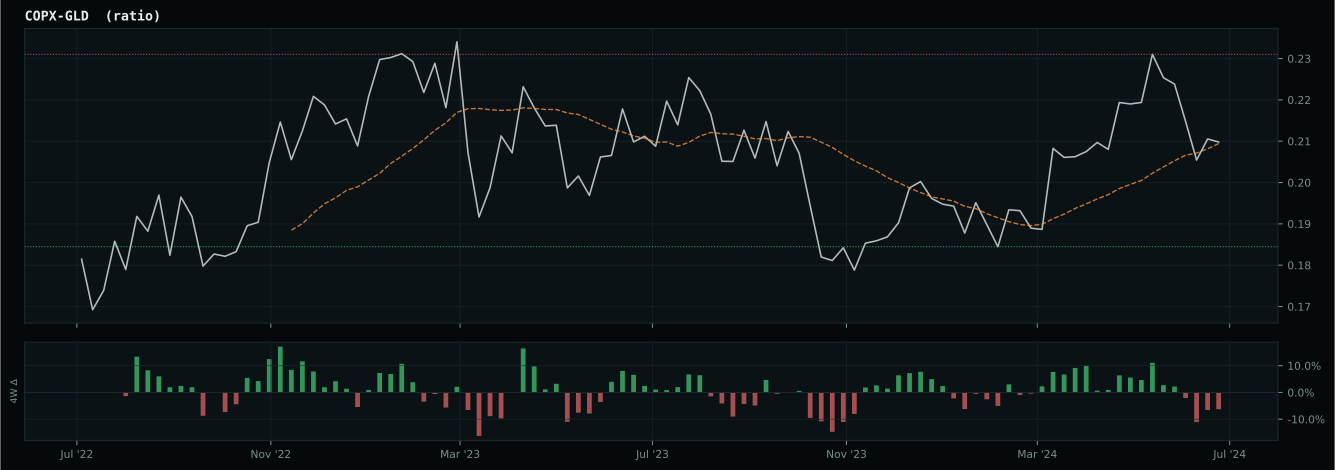
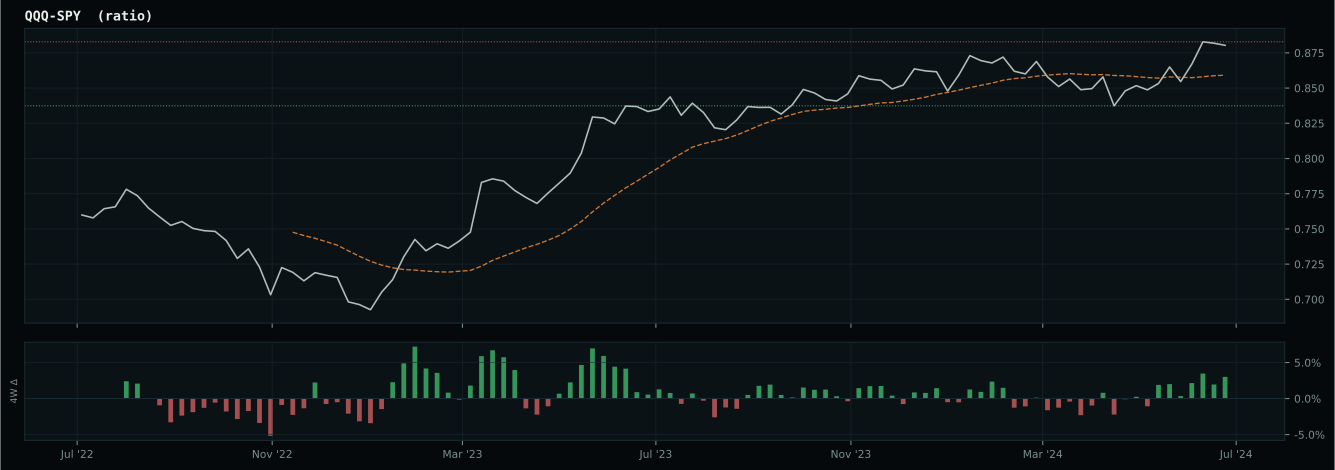
Macro Evidence Charts
Market-implied signals behind the macro regime scores. Each ratio compares two assets; the direction and slope of the ratio is what the macro engine reads.
Crypto Regime — TrendBTC
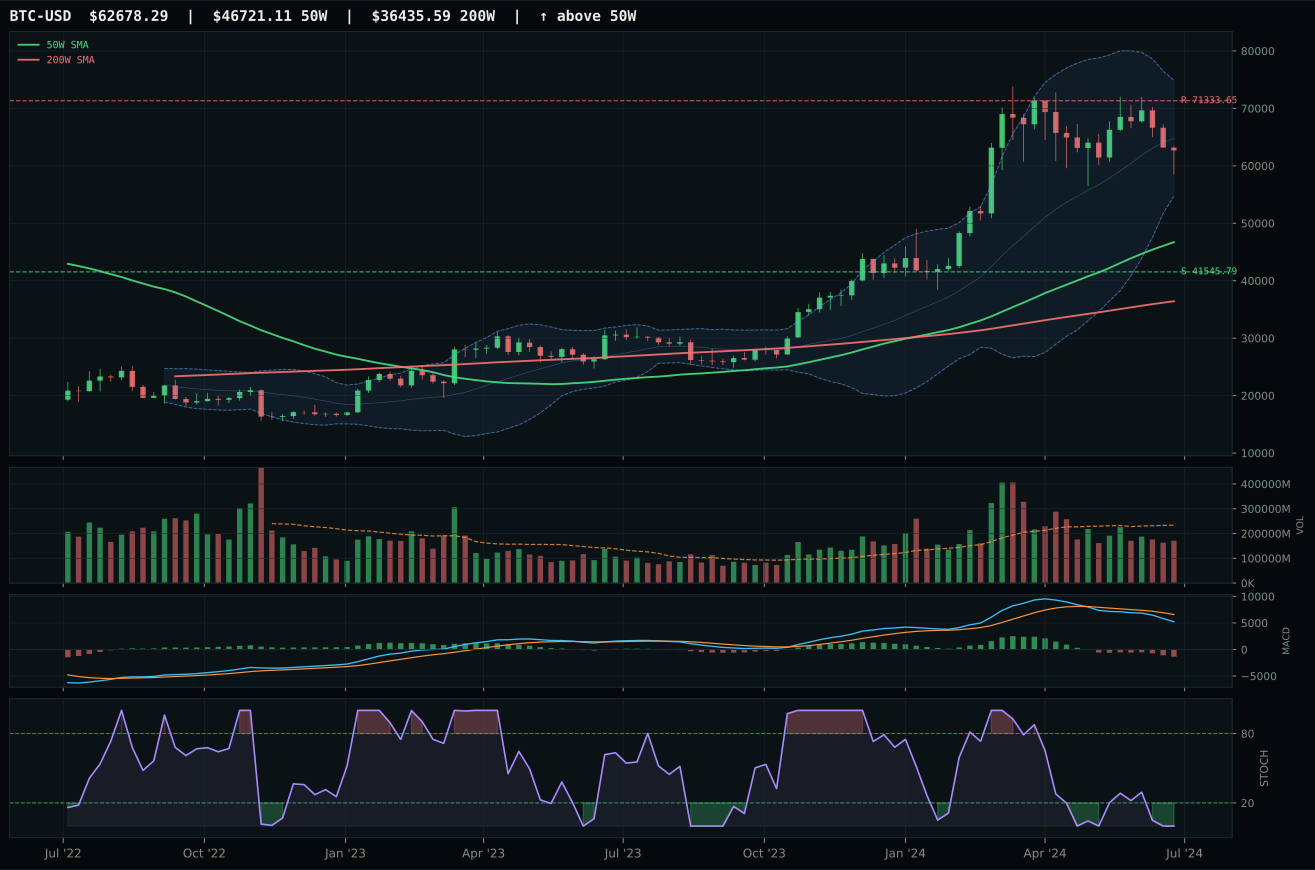
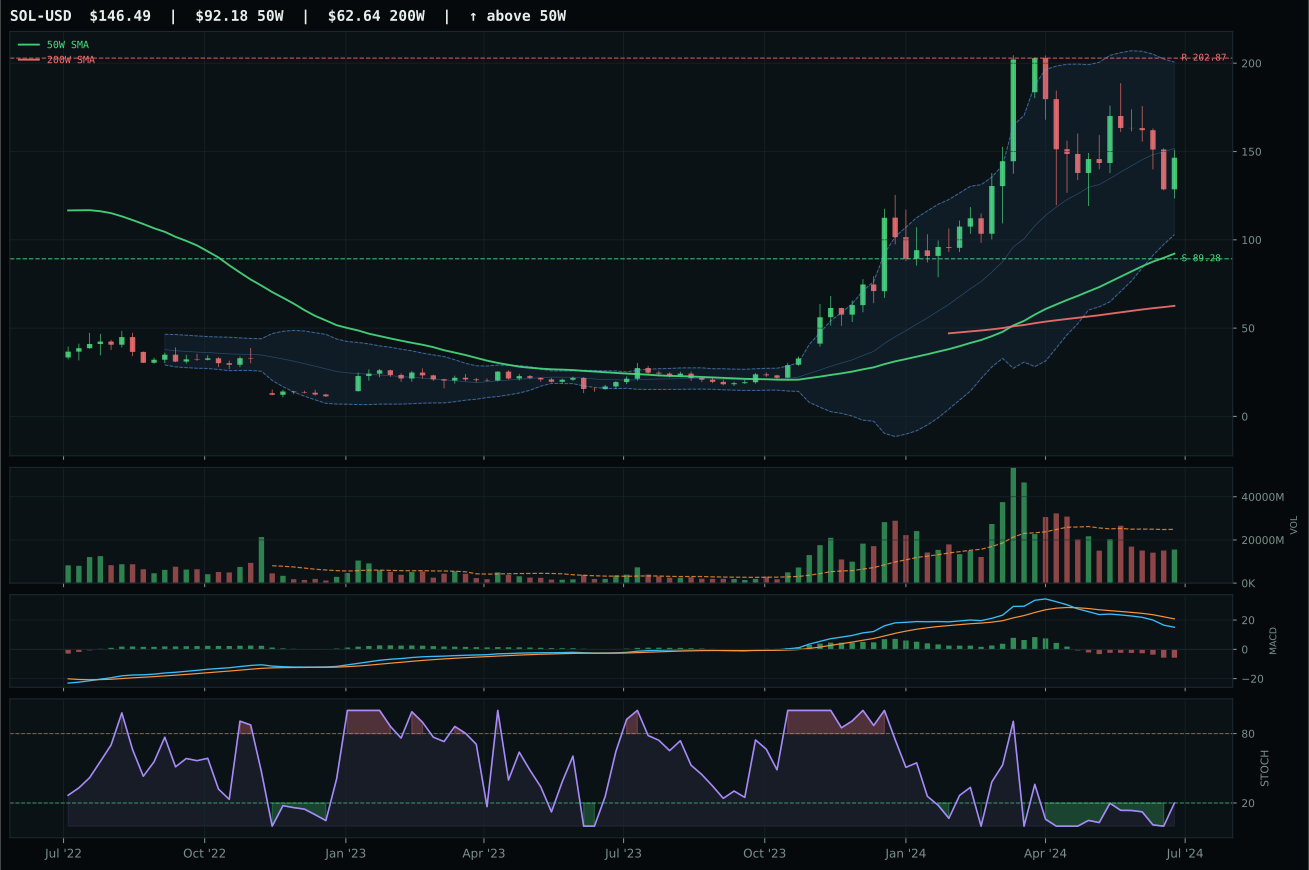
ValueBTC not armed: BTC has not made the first post-breakdown touch of the 200W buy zone after losing the 50W
TrendBTC confirmed: 2 consecutive closes above rising/flat 50W SMA
one or more available conditions failed
Category Rankings
| Rank | Category | Winner | Score | Alloc | 4W Ret | Peers (4W) |
|---|---|---|---|---|---|---|
| 1 | Technology | IGV | 62.1 | 20% | -2.23% | XLK -3.8% · CIBR -1.5% |
| 2 | AI | SMH | 58.7 | 20% | -7.11% | AIQ -2.9% · BOTZ -1.3% |
| 3 | Precious Metals | GLD | 49.5 | 10% | +2.79% | SLV -4.4% · GDX +7.4% |
| 4 | Utilities & Infrastructure | XLU | 46.4 | 10% | +3.76% | IGF +3.6% · PAVE +6.5% |
| 5 | Nuclear Energy | NLR | 42.0 | 10% | -3.76% | URA -5.2% · URNM -7.6% |
| 6 | Defense & Aerospace | ITA | 40.9 | 10% | +6.58% | XAR +6.0% · ROKT +9.9% |
| 7 | Emerging Markets | INDA | 35.8 | 10% | +1.59% | IEMG -1.3% · ILF +0.5% |
| 8 | Industrial Metals | COPX | 33.5 | 10% | -7.95% | PICK -3.2% · REMX -3.7% |
| 9 | Traditional Energy | XLE | 5.5 | 0% | +0.35% | FCG -0.9% · XOP -0.9% |
| 10 | Agriculture & Livestock | MOO | — | 0% | +3.22% | VEGI +2.2% · WEAT -7.9% |
Technology — IGV
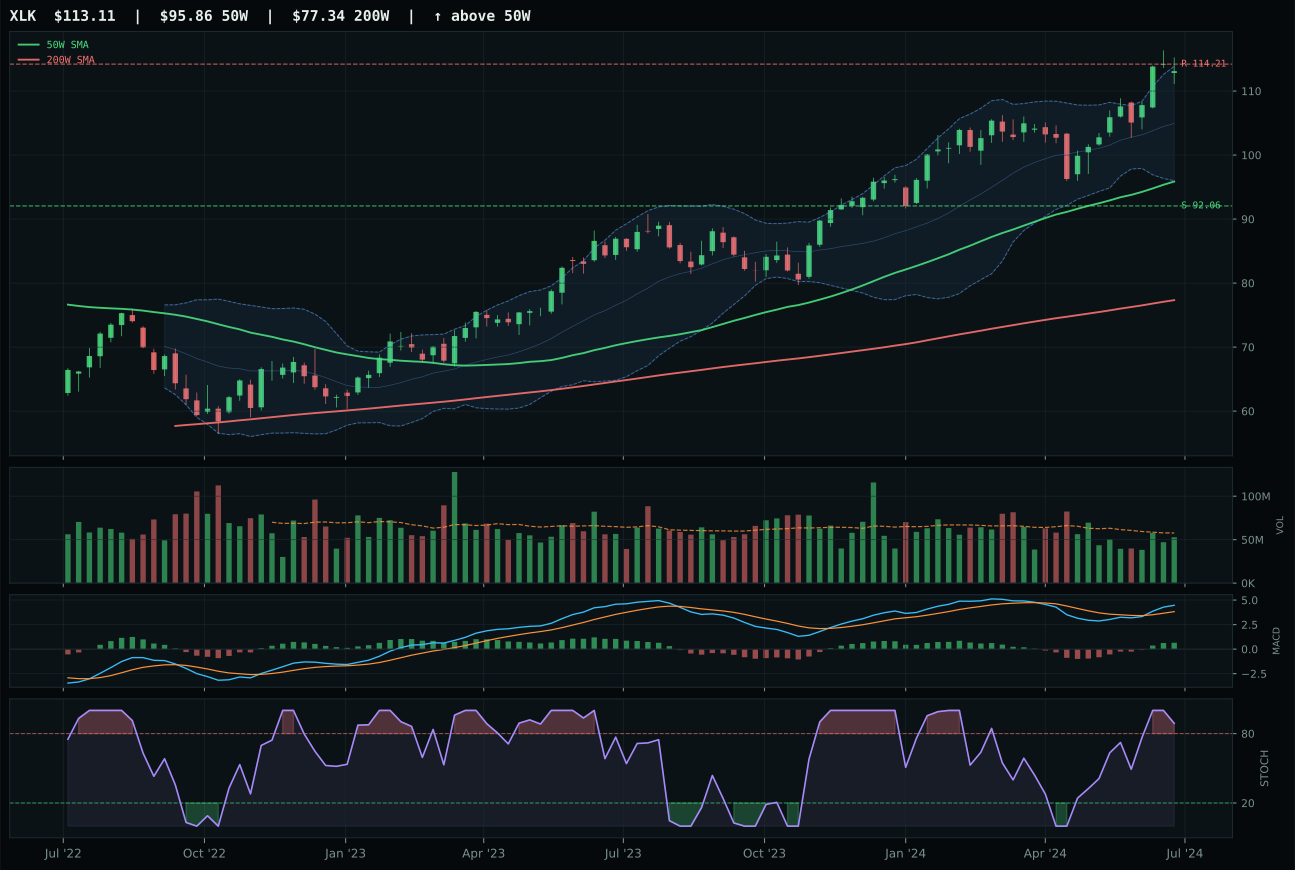
XLK has a vertical extension profile with 4.6% 13-week relative strength versus SPY.
A failed hold above support would weaken the setup.
Actionable but governed by invalidation levels.
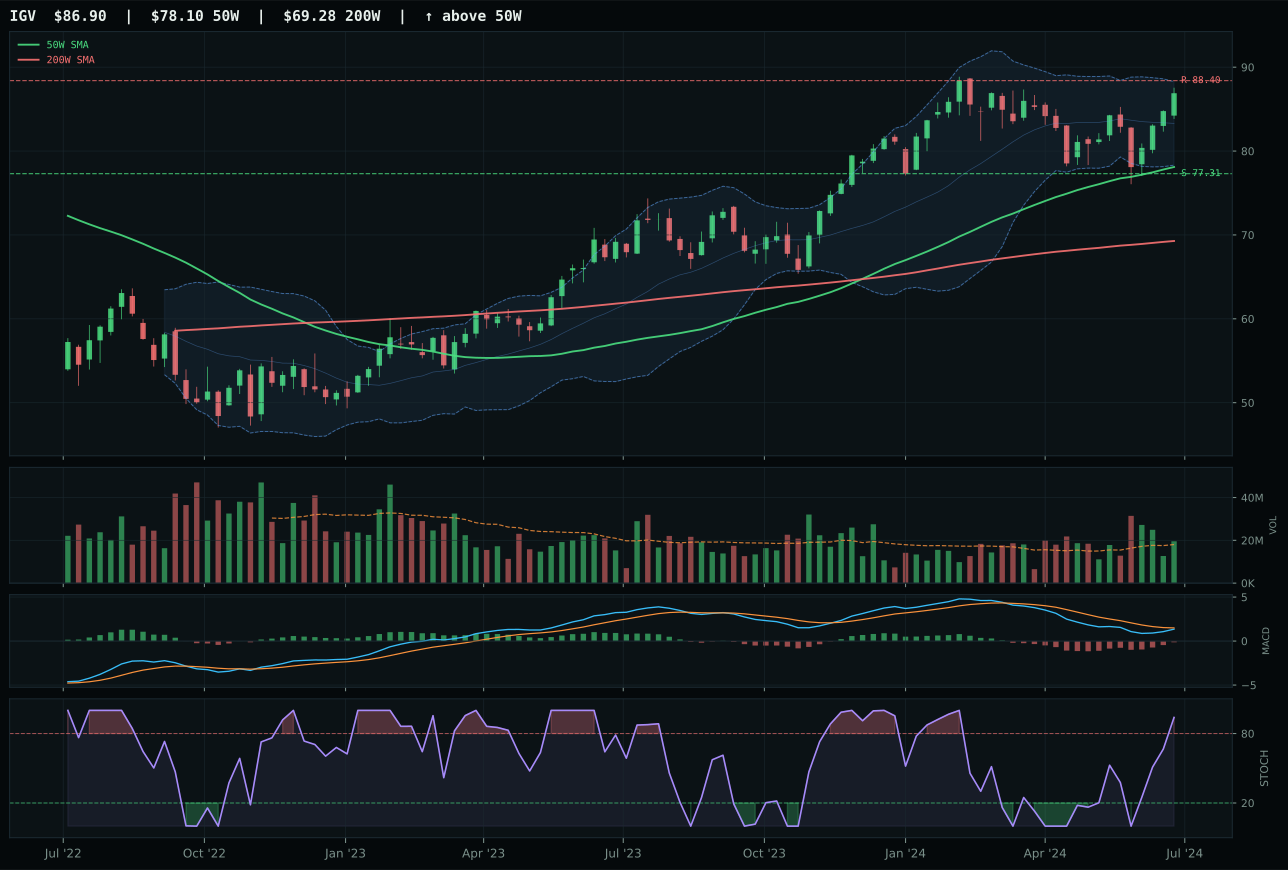
IGV has a neutral structure profile with -2.1% 13-week relative strength versus SPY.
A failed hold above support would weaken the setup.
Actionable but governed by invalidation levels.
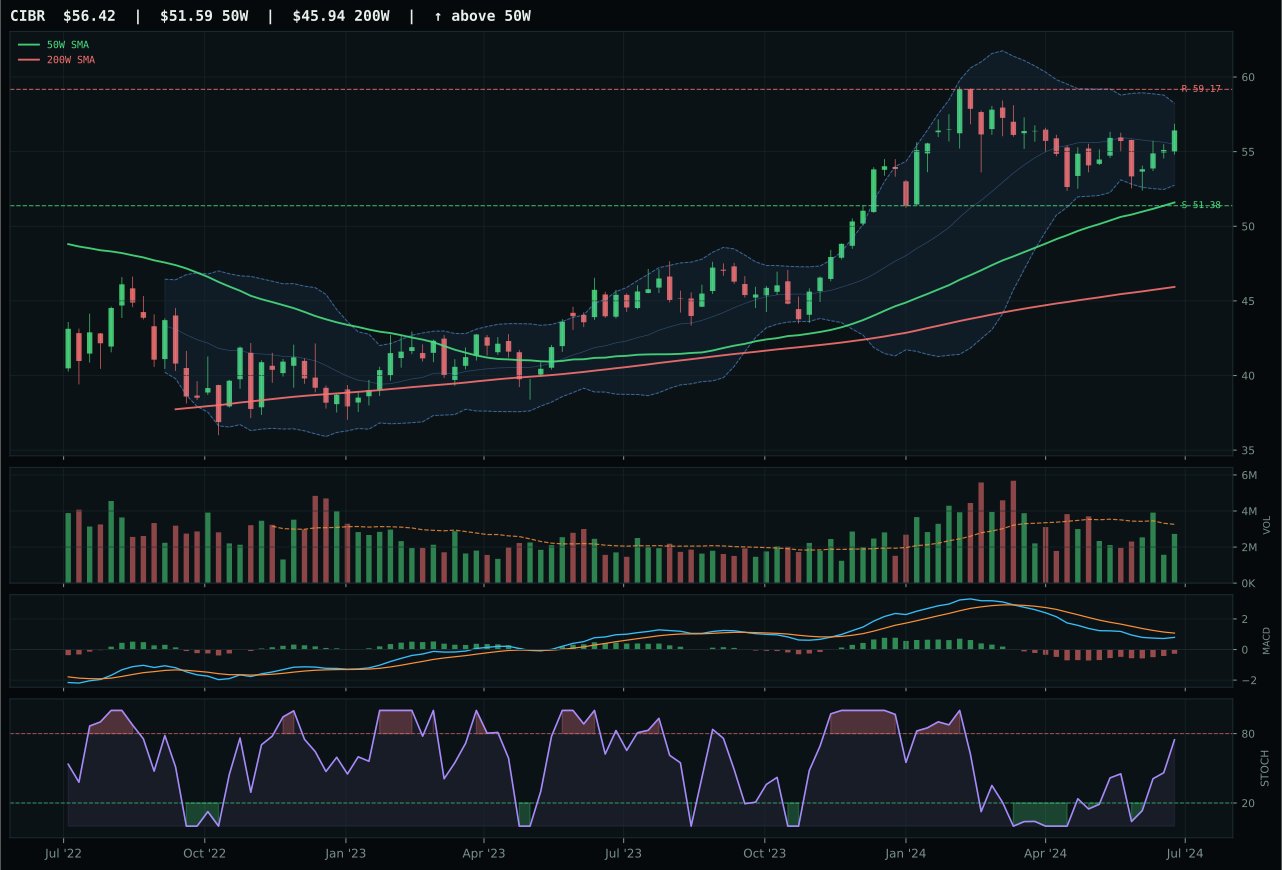
CIBR has a neutral structure profile with -4.0% 13-week relative strength versus SPY.
A failed hold above support would weaken the setup.
Actionable but governed by invalidation levels.
IGV wins the category because it delivers cleaner timing and better risk-adjusted entry than XLK's vertical extension setup. While XLK is stretched 18.0% above its 50-week moving average with bullish MACD confirmation, IGV sits only 11.3% extended with a bearish-but-improving MACD and neutral structure—a more defensible technical position in a disinflation regime. IGV's category-relative strength of 0.0% versus XLK's 6.7% means IGV isn't yet being abandoned relative to its peer group, while XLK's 4.6% SPY-relative outperformance suggests late-stage rotation money. The decision hinges on timing: XLK's timing score of 37.0 reflects how far it has traveled already, while IGV's 59.0 acknowledges the distance remaining to resistance. Volume is neutral in both cases, so the edge goes to the setup that hasn't yet consumed its upside cushion.
Technology earns a top-2 overweight at 10% allocation because it ranked second among all eligible categories with a 62.1 composite score. The disinflation environment explicitly supports duration-sensitive growth, with the macro descriptor checklist showing risk appetite positive at +9 and AI growth sponsorship at +6, offsetting liquidity stress at -10. The setup hinges on a subtle technical argument: IGV's neutral structure with improving MACD keeps the door open for new accumulation without requiring investors to chase an already-extended move. Against this, credit stress at -9 and liquidity stress at -10 create real constraints—this allocation assumes those headwinds flatten but don't reverse. If either intensifies, Technology would slip to tier-2; if risk appetite momentum accelerates, IGV could run from here, but current evidence suggests the category has earned its seat through balance rather than dominance.
AI — SMH
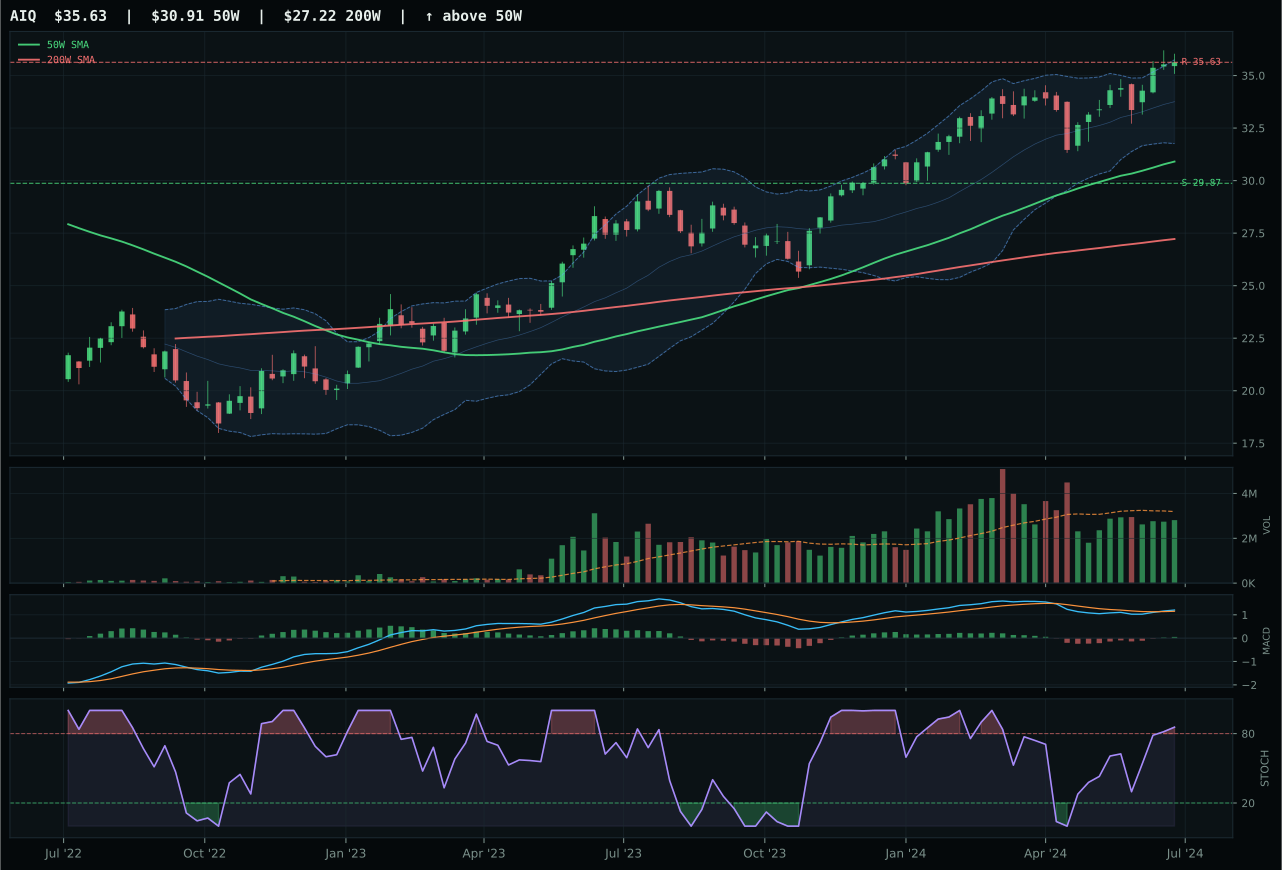
AIQ has a vertical extension profile with 0.9% 13-week relative strength versus SPY.
A failed hold above support would weaken the setup.
Actionable but governed by invalidation levels.
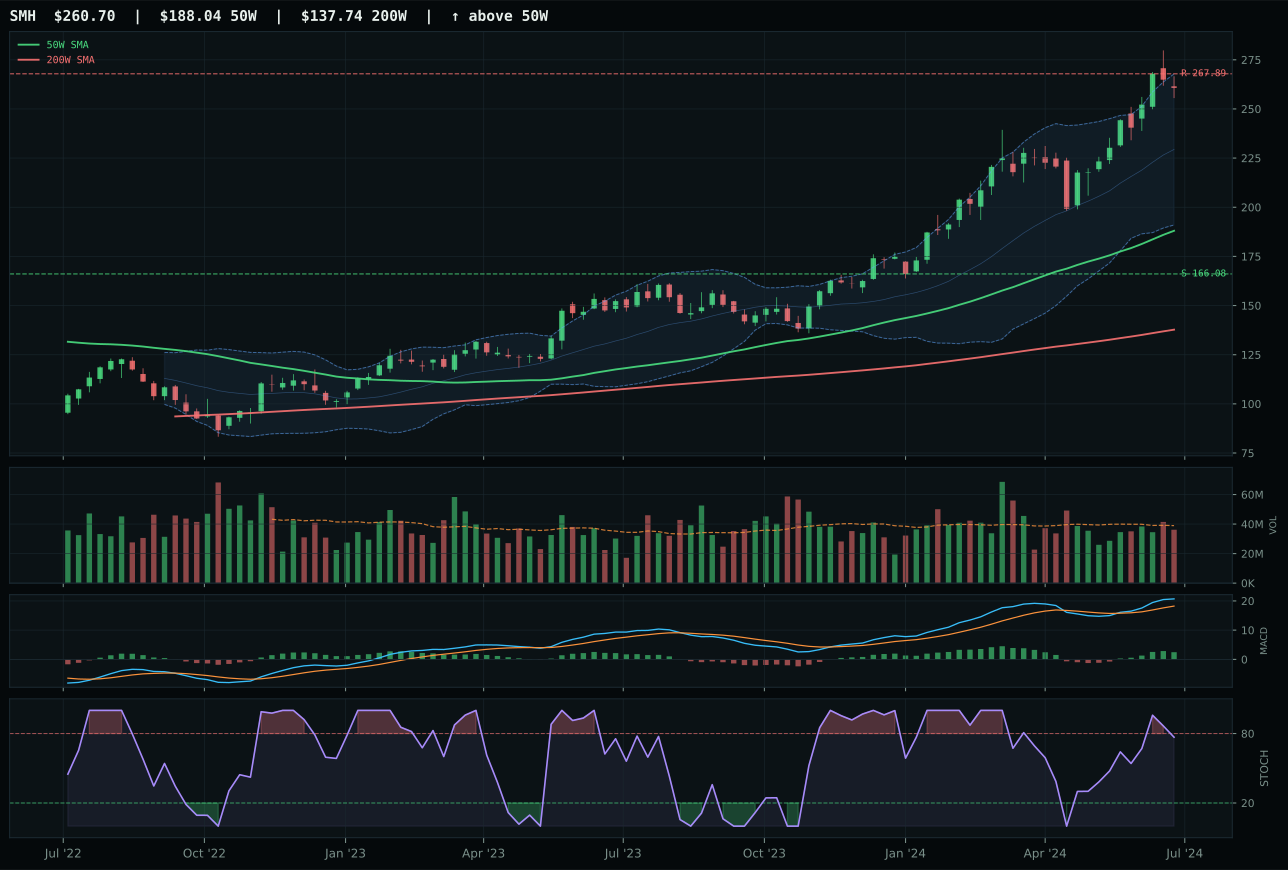
SMH has a vertical extension profile with 11.8% 13-week relative strength versus SPY.
A failed hold above support would weaken the setup.
Actionable but governed by invalidation levels.
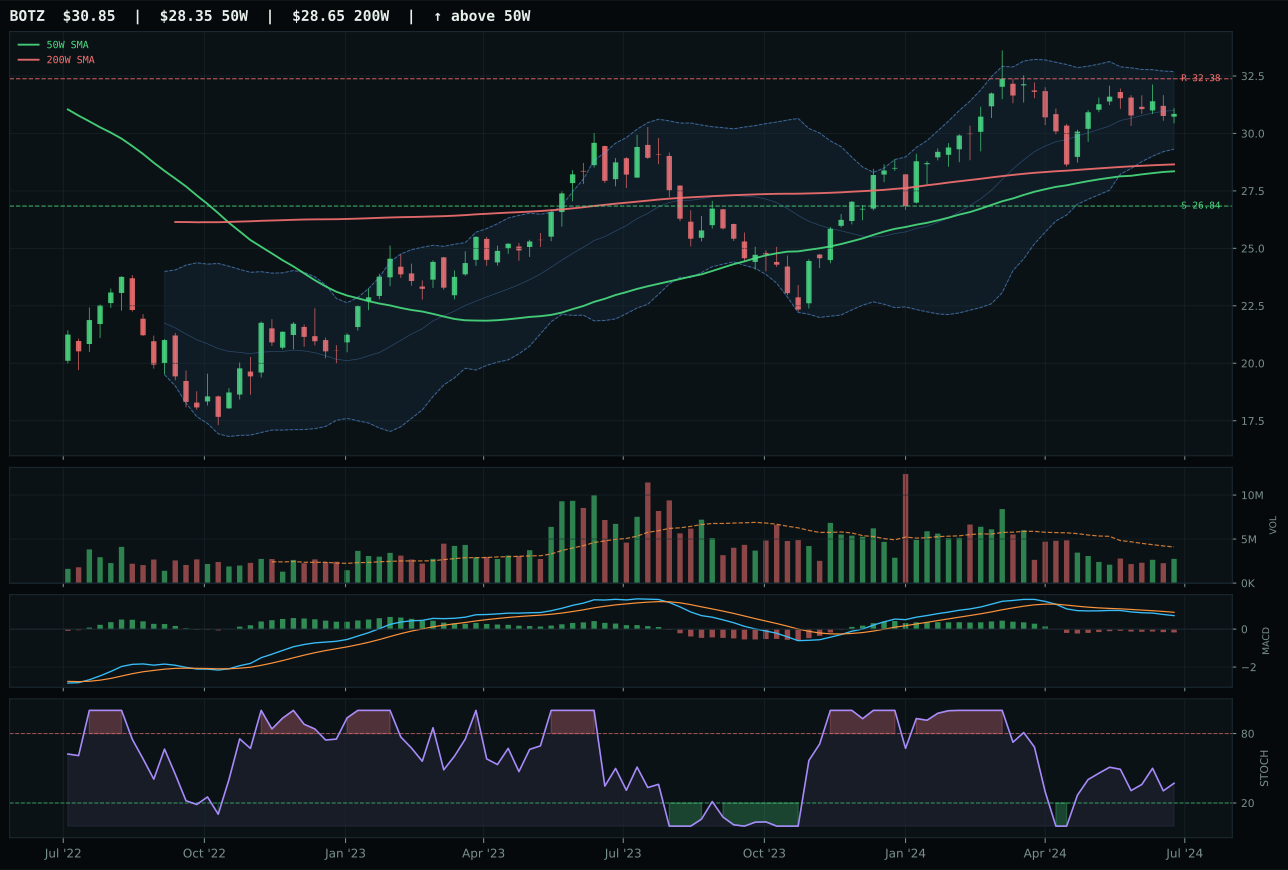
BOTZ has a neutral structure profile with -7.1% 13-week relative strength versus SPY.
A failed hold above support would weaken the setup.
Actionable but governed by invalidation levels.
SMH wins by delivering superior momentum confirmation and category-relative strength that AIQ cannot match. Both are in vertical extension, both have bullish MACD, but SMH's 11.8% SPY-relative strength versus AIQ's 0.9% tells the real story: semiconductor compute is being accumulated while AI software is stalling. SMH's 13-week return of 15.9% combined with a rising mid-zone stochastic RSI at 0.77 proves the move is still being sponsored; AIQ's identical 4.9% 13-week return with overbought stochastic momentum at 0.94 means the setup is exhausted. The timing score of 61.0 versus 37.0 reflects this precisely—SMH is extended but not yet in the rejection zone, while AIQ has already spent its momentum. Volume-price confirmation swings 76.8 to 62.0 in SMH's favor, meaning accumulation is happening on the semiconductor side while distribution pressure builds on the broader AI software basket.
AI ranks into the top-2 tier at 10% allocation on a final score of 58.7, earned through a 3/2/1 weighted basket where SMH's 72.2 technical score dominates AIQ's 63.5. The macro case is muscular: AI growth sponsorship at +14 and risk appetite positive at +10 provide strong tailwinds, though liquidity stress at -12 and credit stress at -8 introduce real friction. The disinflation regime helps this category by supporting multiple expansion for high-growth names, but the technical case is what clinches the top-2 seat—SMH's vertical extension setup with rising mid-zone momentum is cleaner than most alternatives facing the same macro squeeze. If liquidity conditions deteriorate or risk appetite rolls over, this category would drop to tier-2 immediately; the allocation assumes current conditions hold but does not presume further multiple expansion.
Precious Metals — GLD
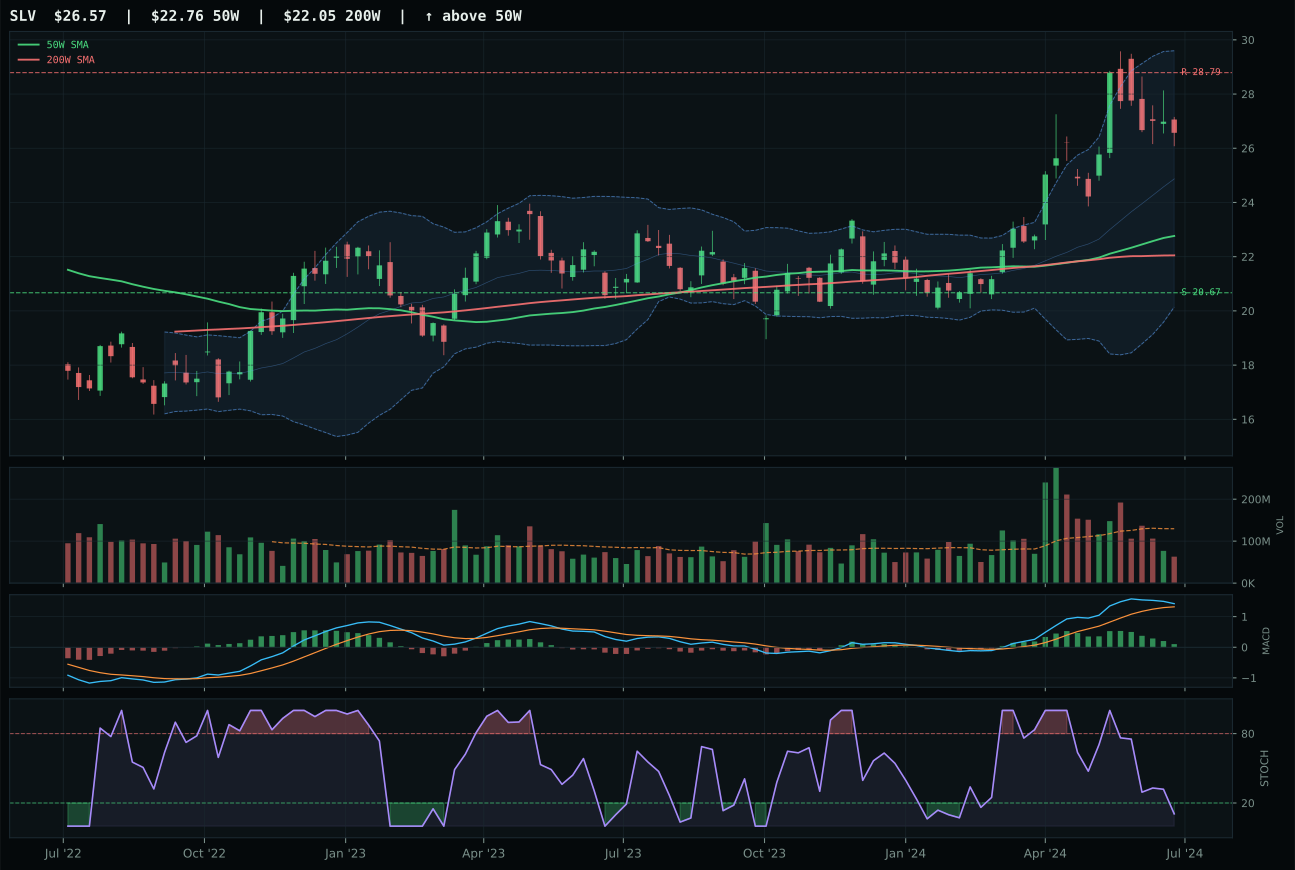
SLV has a vertical extension profile with 12.7% 13-week relative strength versus SPY.
A failed hold above support would weaken the setup.
Actionable but governed by invalidation levels.
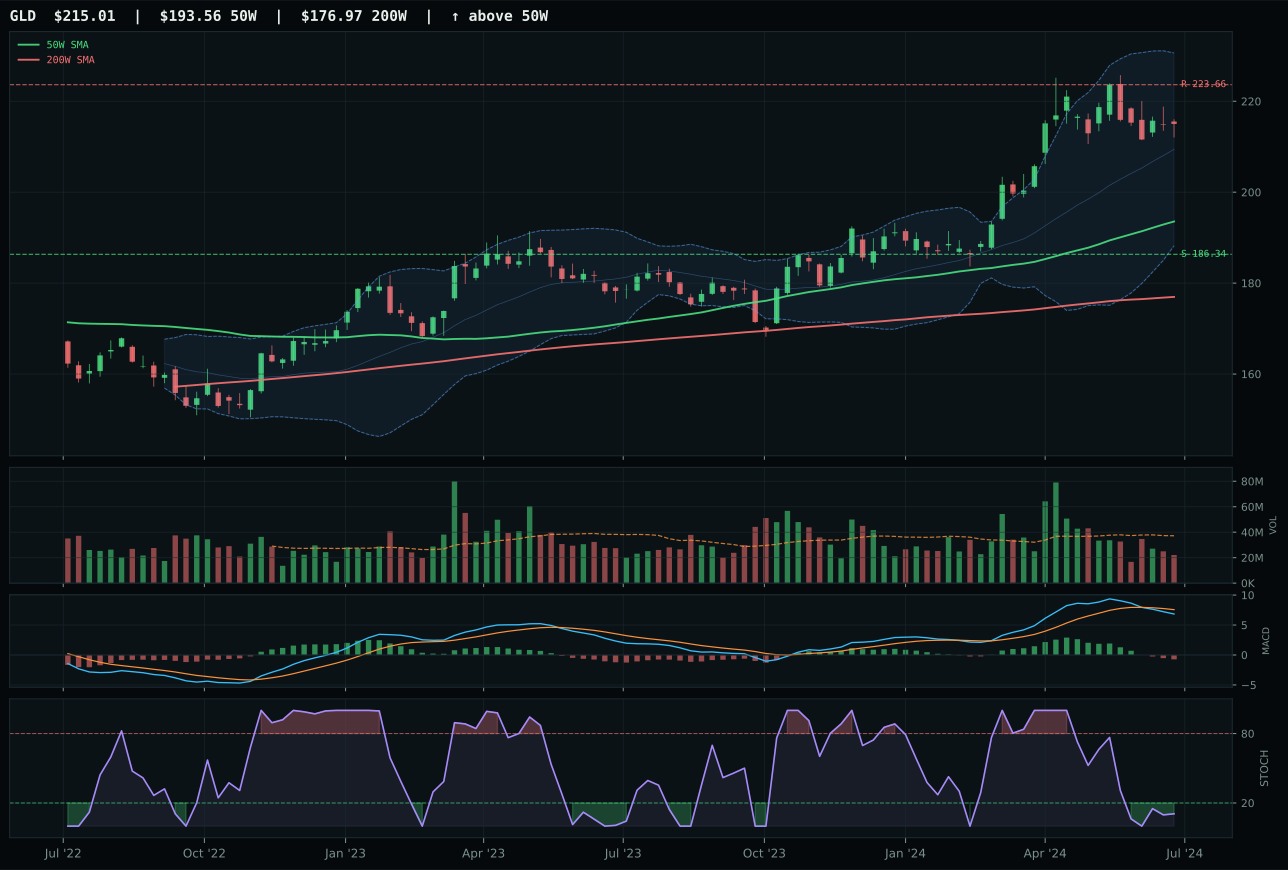
GLD has a neutral structure profile with 0.5% 13-week relative strength versus SPY.
A failed hold above support would weaken the setup.
Actionable but governed by invalidation levels.
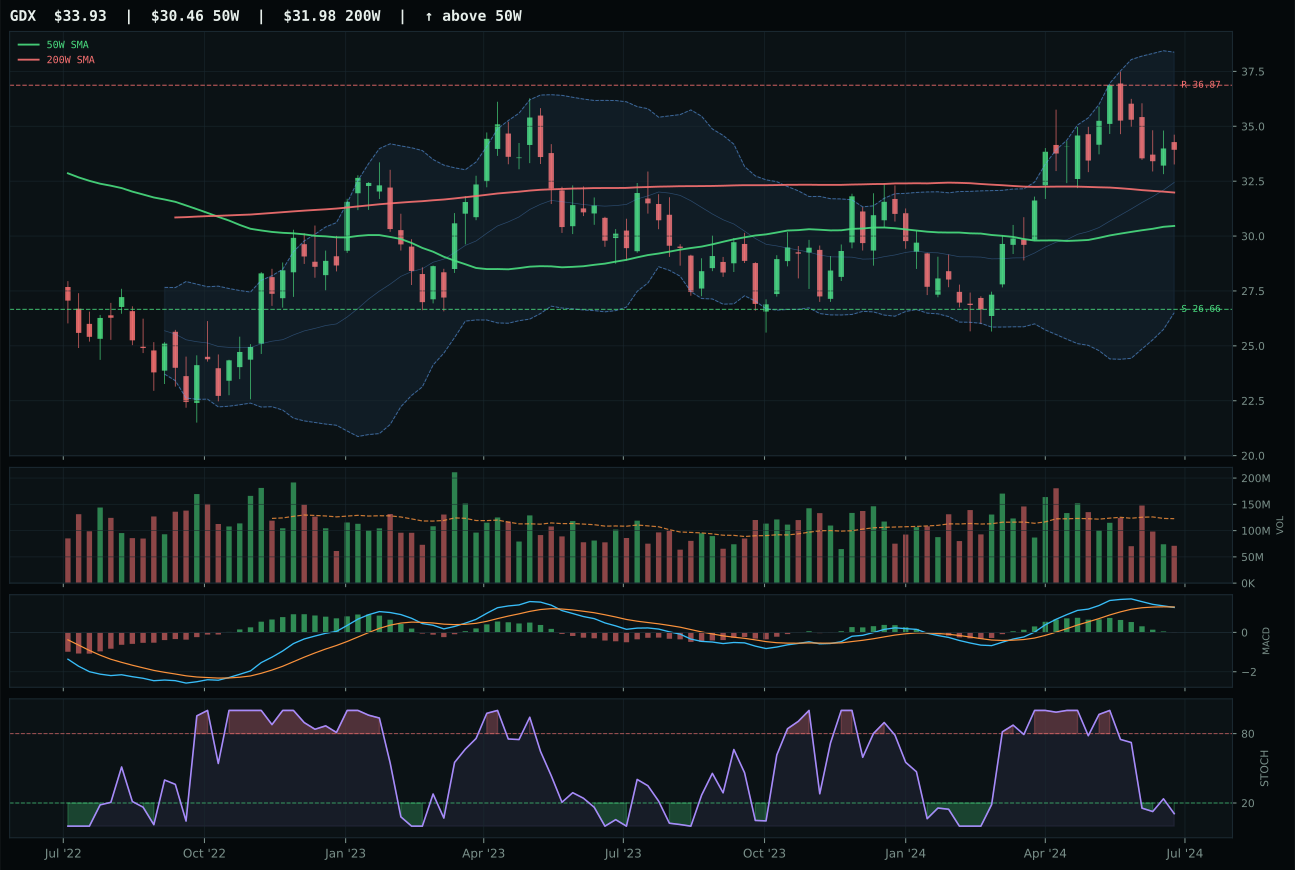
GDX has a neutral structure profile with 3.3% 13-week relative strength versus SPY.
A failed hold above support would weaken the setup.
Actionable but governed by invalidation levels.
GLD wins the metals category despite trailing SLV's technical evidence score, because timing architecture is fundamentally different. SLV is 16.7% extended from the 50-week with overbought stochastic momentum, a setup that has already signaled extended entry risk; GLD sits 11.1% extended with an oversold-turn-up stochastic at 0.11, offering the early warning that fresh accumulation may begin. SLV's bullish-but-flattening MACD compared to GLD's bearish-but-improving pattern reveals the hidden setup difference: GLD's histogram is turning positive while SLV's is rolling over. The category-relative strength gap is 12.2 points in favor of SLV's 9.5%, but that very strength is the warning sign—SLV has already done the heavy lifting while GLD remains relatively ignored. Volume is thin in both, but GLD's timing score of 84.0 versus SLV's 48.0 proves the entry quality: GLD offers the beginning of a move, not the end.
Precious Metals receives a tier-2 allocation of 5%, earned through GLD's 44.7 technical score in a 3/2/1 basket led by SLV at 65.5. The macro case is constructive: disinflation at +8 and disinflation pressure at +6 support safe-haven demand, though risk appetite positive at -4 creates a natural friction. The category scored 49.5 overall, placing it firmly in the middle tiers alongside Industrial Metals and Nuclear Energy. GLD's neutral structure and improving MACD provide portfolio insurance mechanics rather than tactical return—the real argument is that gold's negative equity correlation strengthens as duration risk rises, a benefit that pays off in any recession scenario. Allocation stays at 5% as long as GLD holds above the 186.34 support level; if that breaks and MACD rolls back to bearish-weakening, the position downgrades to 0% as a pure hedging position becomes inadequate.
Utilities & Infrastructure — XLU
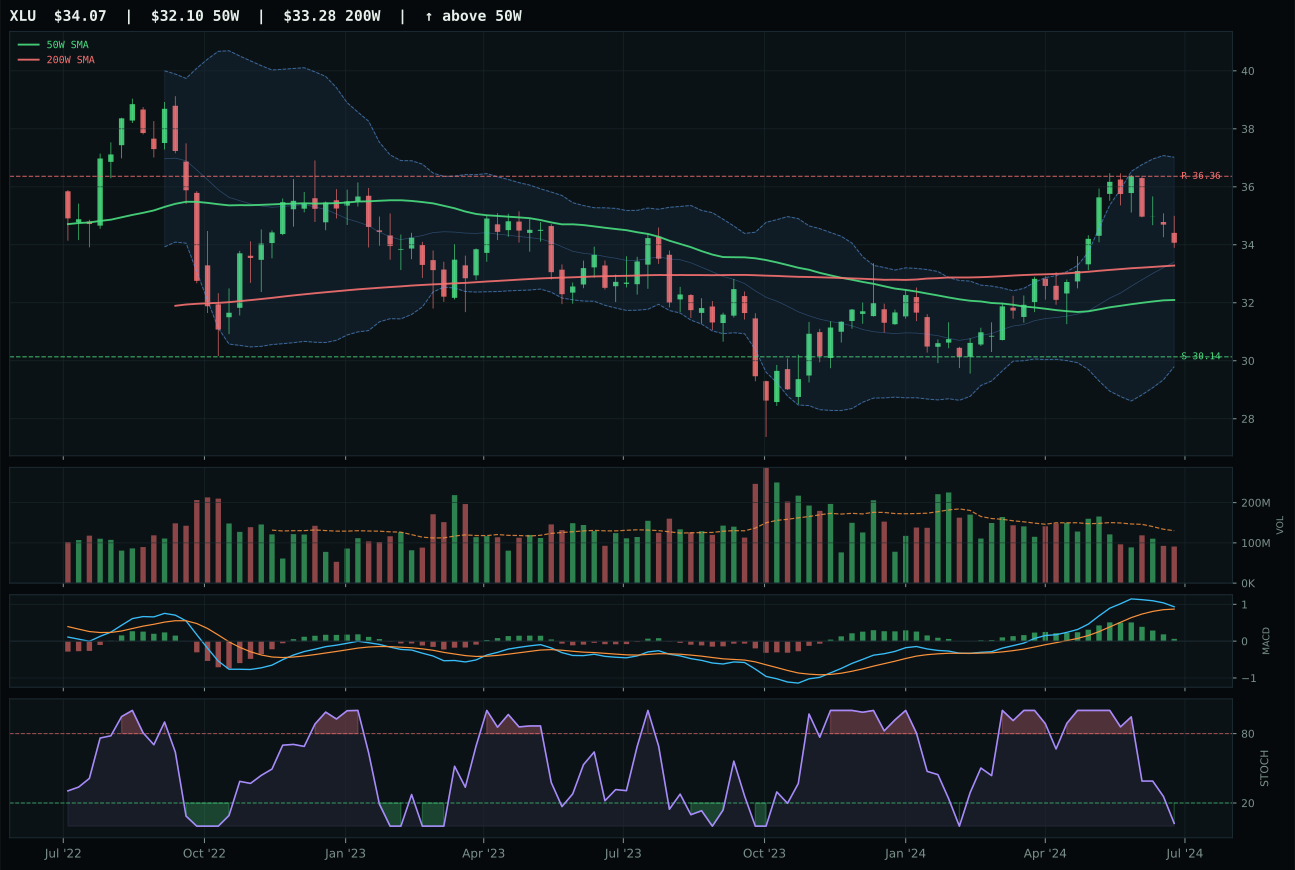
XLU has a neutral structure profile with -0.3% 13-week relative strength versus SPY.
A failed hold above support would weaken the setup.
Actionable but governed by invalidation levels.
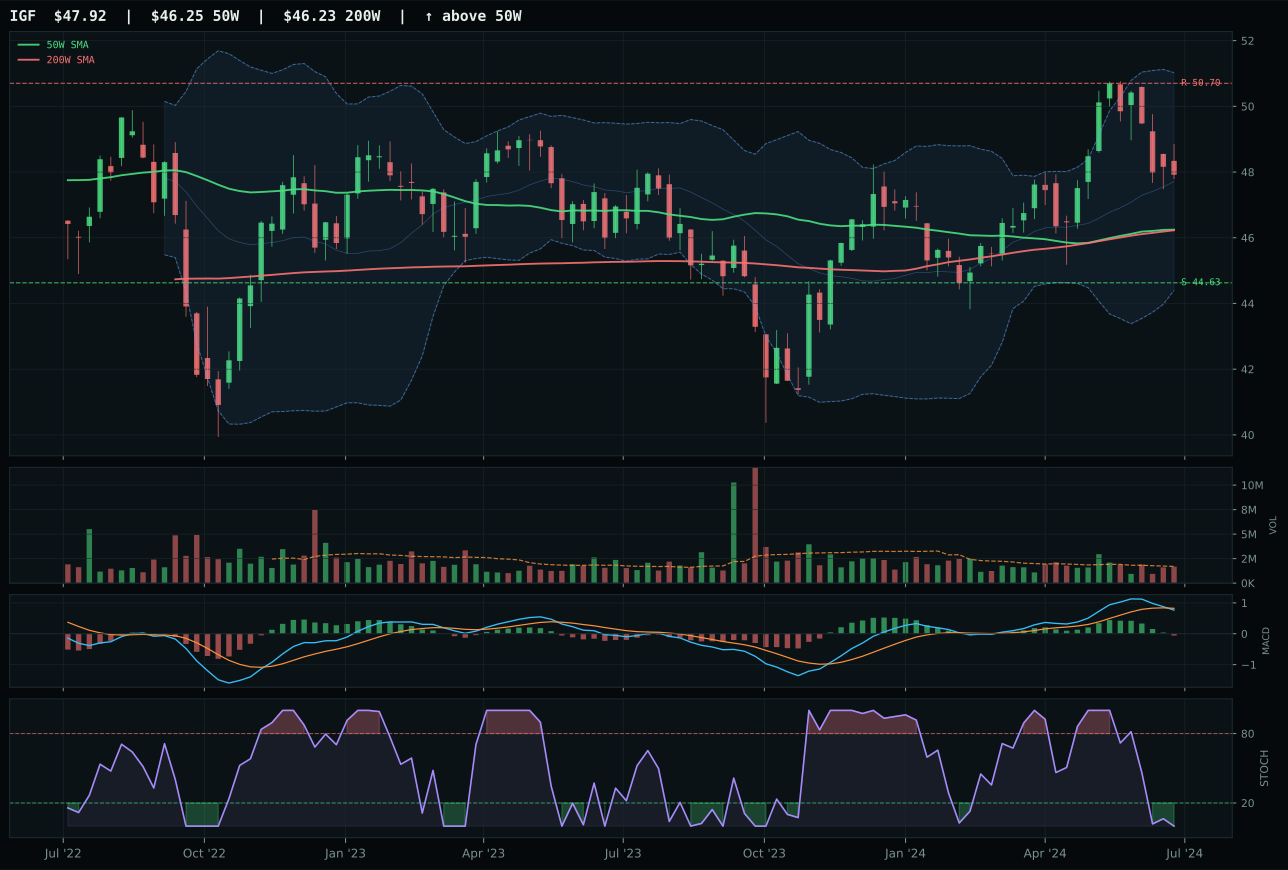
IGF has a neutral structure profile with -3.4% 13-week relative strength versus SPY.
A failed hold above support would weaken the setup.
Actionable but governed by invalidation levels.
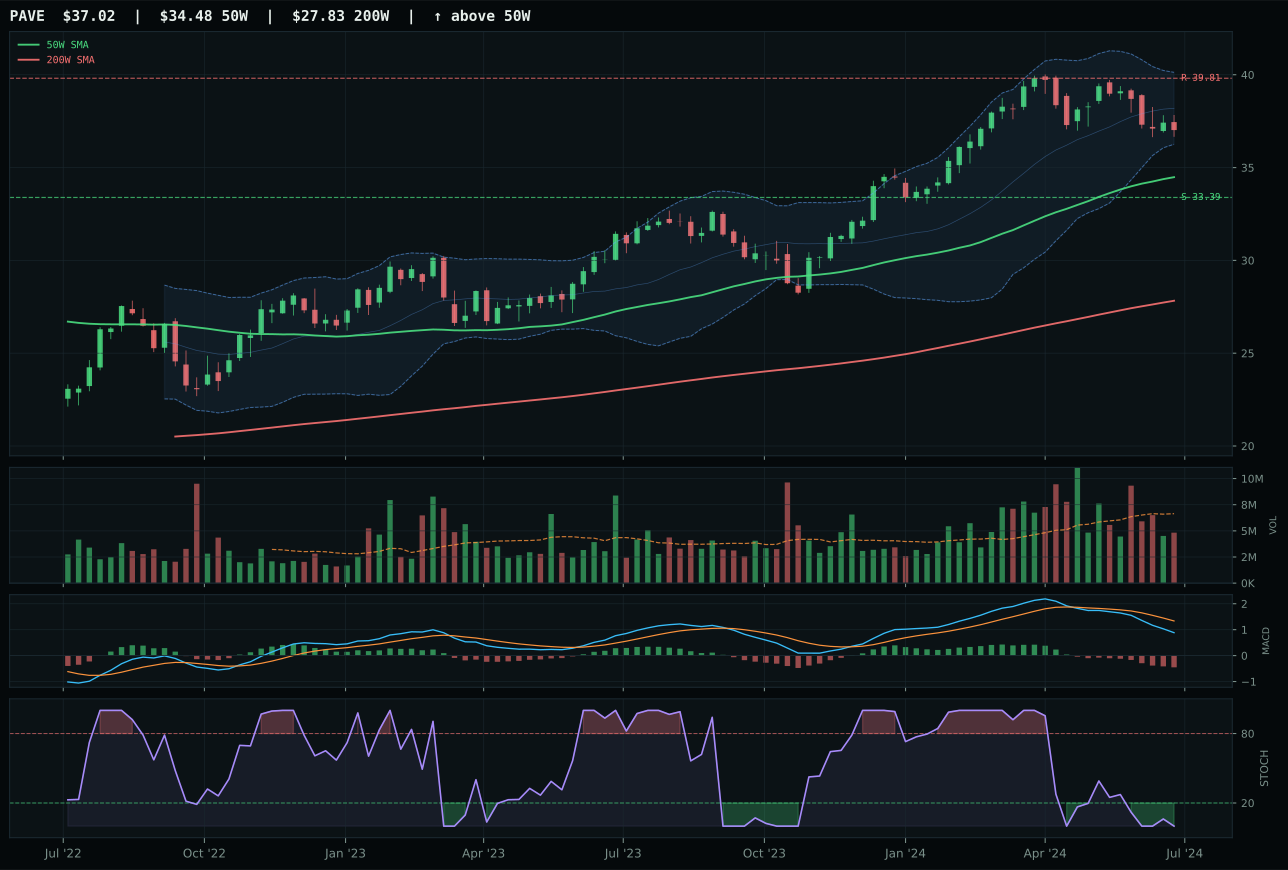
PAVE has a neutral structure profile with -11.1% 13-week relative strength versus SPY.
A failed hold above support would weaken the setup.
Actionable but governed by invalidation levels.
XLU wins the Utilities category in a near-even matchup against IGF by virtue of MACD confirmation and category-relative strength that IGF lacks. Both sit near 6% extended from the 50-week in neutral structure, but XLU's bullish-but-flattening MACD versus IGF's bearish-weakening pattern reveals where momentum lives. XLU's category-relative strength of 3.2% versus IGF's 0.0% confirms that regulated utilities are not being rotated out while infrastructure stalls. The timing setup is nearly identical, but XLU's oversold stochastic at 0.02 combined with bullish MACD provides a tighter entry window than IGF's pure oversold reading. Both show thin participation volume, but XLU's 13-week return of 3.8% versus IGF's 0.6% shows durability in a sector where multi-year trends matter more than weekly price action. The decision margin is narrow—only 0.4 points separates them—but XLU's MACD structure and relative strength tip it.
Utilities & Infrastructure receives a tier-2 allocation of 5% on a category score of 46.4, a respectable middle-tier ranking driven by explicit macro support: disinflation at +7, disinflation pressure at +6, and transition/mixed environment at +4 create a 17-basis-point tailwind. The 62.0 category-level macro fit is the highest among tier-2 allocations, meaning this sector benefits materially from the current regime. XLU's 95.6 trend score is the highest in its peer set, and the 62.7 technical evidence from the reasoner reflects genuine durability in regulated utility technicals. The allocation assumes that rate-cut dynamics will support utility valuations and that infrastructure multiples remain sticky in a disinflation environment. Allocation holds at 5% as long as XLU stays above 30.14 support with MACD remaining in the bullish zone; if rates stop falling or credit stress accelerates, the category downgrades to 0% as the macro tailwind evaporates.
Nuclear Energy — NLR
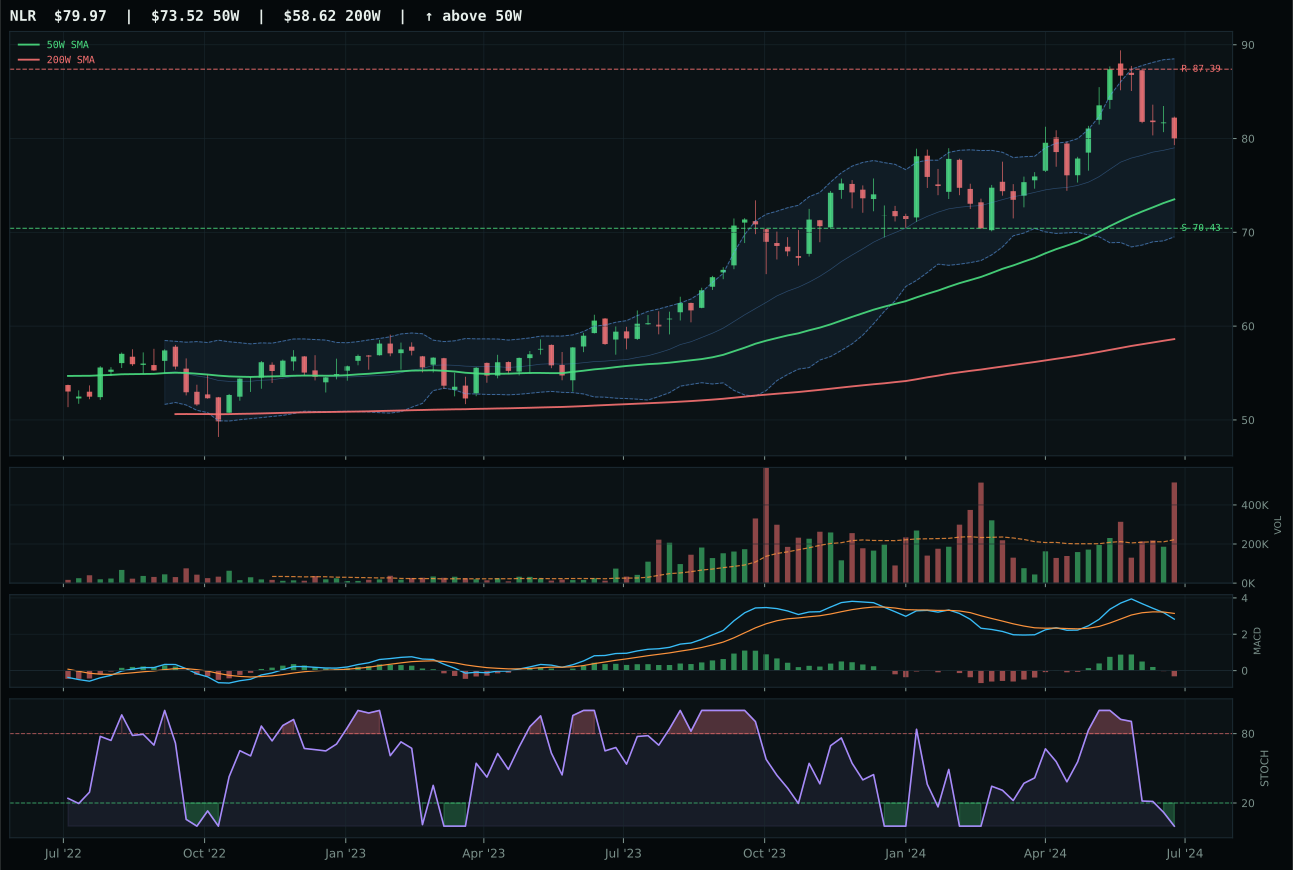
NLR has a neutral structure profile with 1.2% 13-week relative strength versus SPY.
A failed hold above support would weaken the setup.
Actionable but governed by invalidation levels.
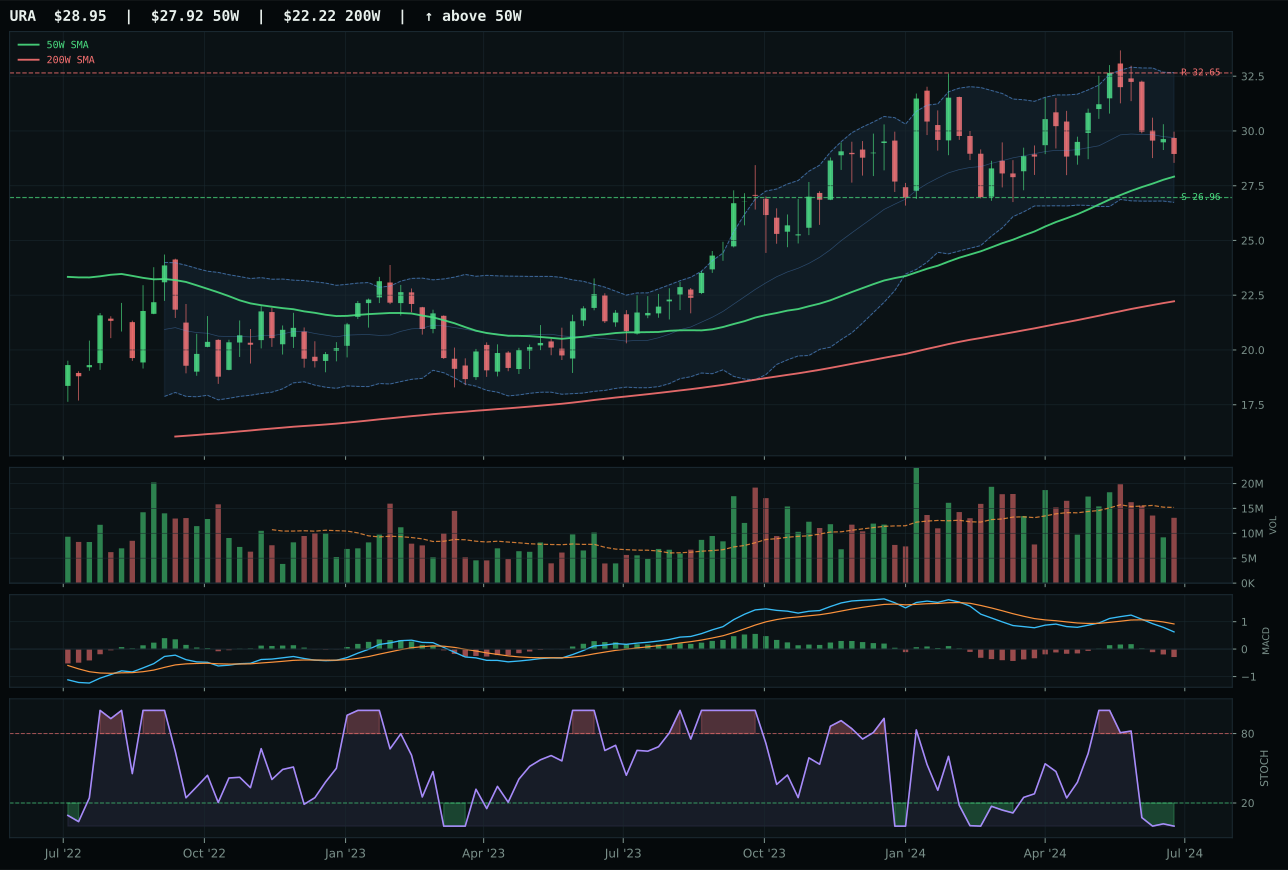
URA has a neutral structure profile with -3.6% 13-week relative strength versus SPY.
A failed hold above support would weaken the setup.
Actionable but governed by invalidation levels.
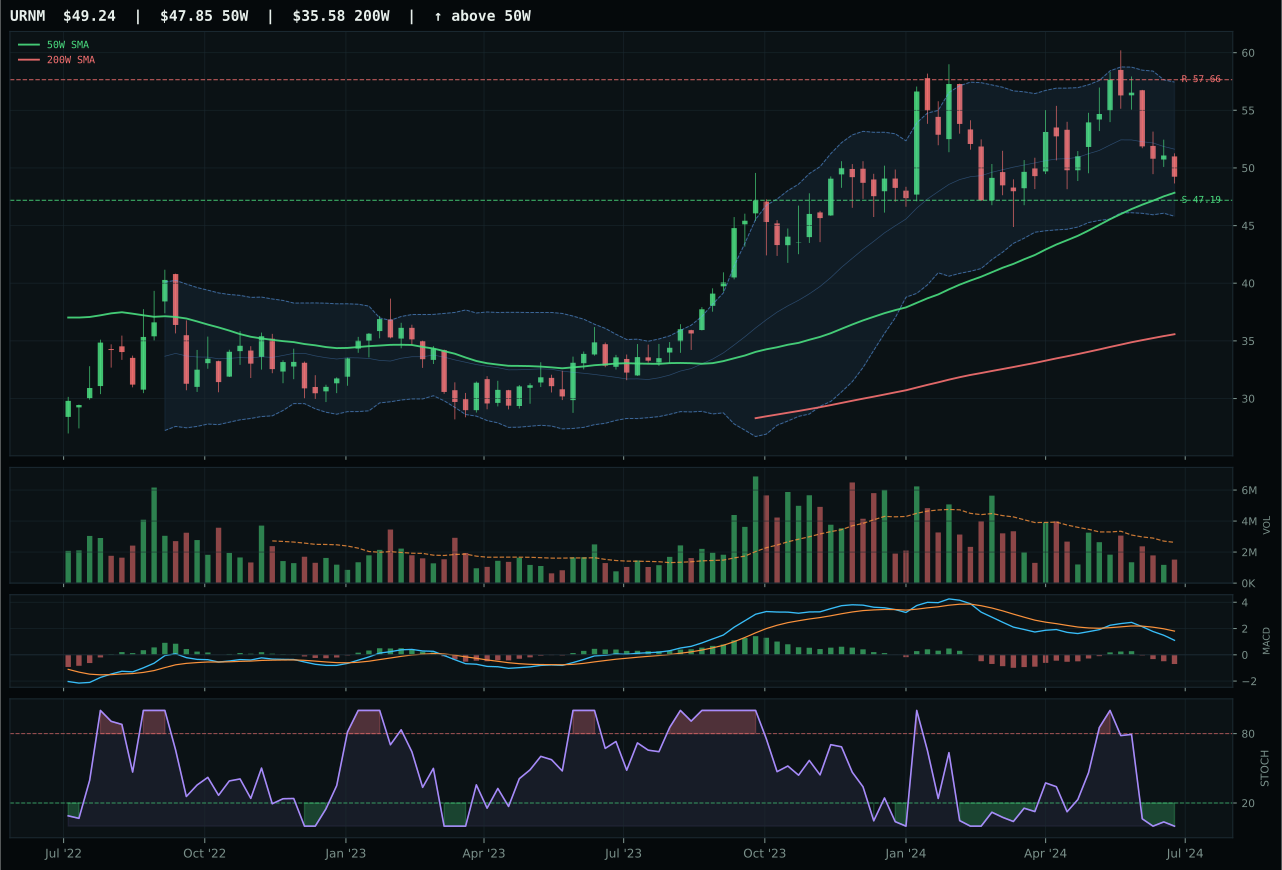
URNM has a pullback into support profile with -4.1% 13-week relative strength versus SPY.
A failed hold above support would weaken the setup.
Actionable but governed by invalidation levels.
NLR wins Nuclear Energy despite a 25.7 technical evidence score that trails URA's 42.2 because category-relative strength of 4.9% versus URA's 0.0% proves relative accumulation. Both face a bearish-weakening MACD and oversold stochastic readings, but NLR's 13-week return of 5.3% versus URA's 0.4% shows NLR is being accumulated while URA stalls. The critical difference is volume participation: NLR shows distribution pressure at 2.32x 20-week average, meaning aggressive sellers are being met with equally aggressive buyers (net neutral for momentum but positive for capitulation risk). URA's neutral volume lacks that sponsorship signal. Both are near oversold, both sit 8-9% above the 50-week, but NLR's position within the peer set—the only name with positive category-relative strength—gives it the edge in a category where all technicals are weak.
Nuclear Energy receives a tier-2 allocation of 5% on a category score of 42.0, a middle-tier ranking that reflects macro support combined with weak technicals. The macro case is genuine: real asset sponsorship at +7 and AI growth sponsorship at +5 provide constructive descriptors in a disinflation regime, and the 50.0 category-level macro fit is respectable. NLR's distribution pressure volume combined with positive category-relative strength suggests that energy-security-focused capital is rotating into the space even as technicals remain oversold. This is a conviction play on energy transition demand, not a technical reversal. Allocation holds at 5% as long as NLR maintains its category-relative strength advantage and stays above 70.43 support; if URA's technical evidence catches up and NLR's relative leadership fades, the category downgrades to 0% and the position is closed.
Defense & Aerospace — ITA
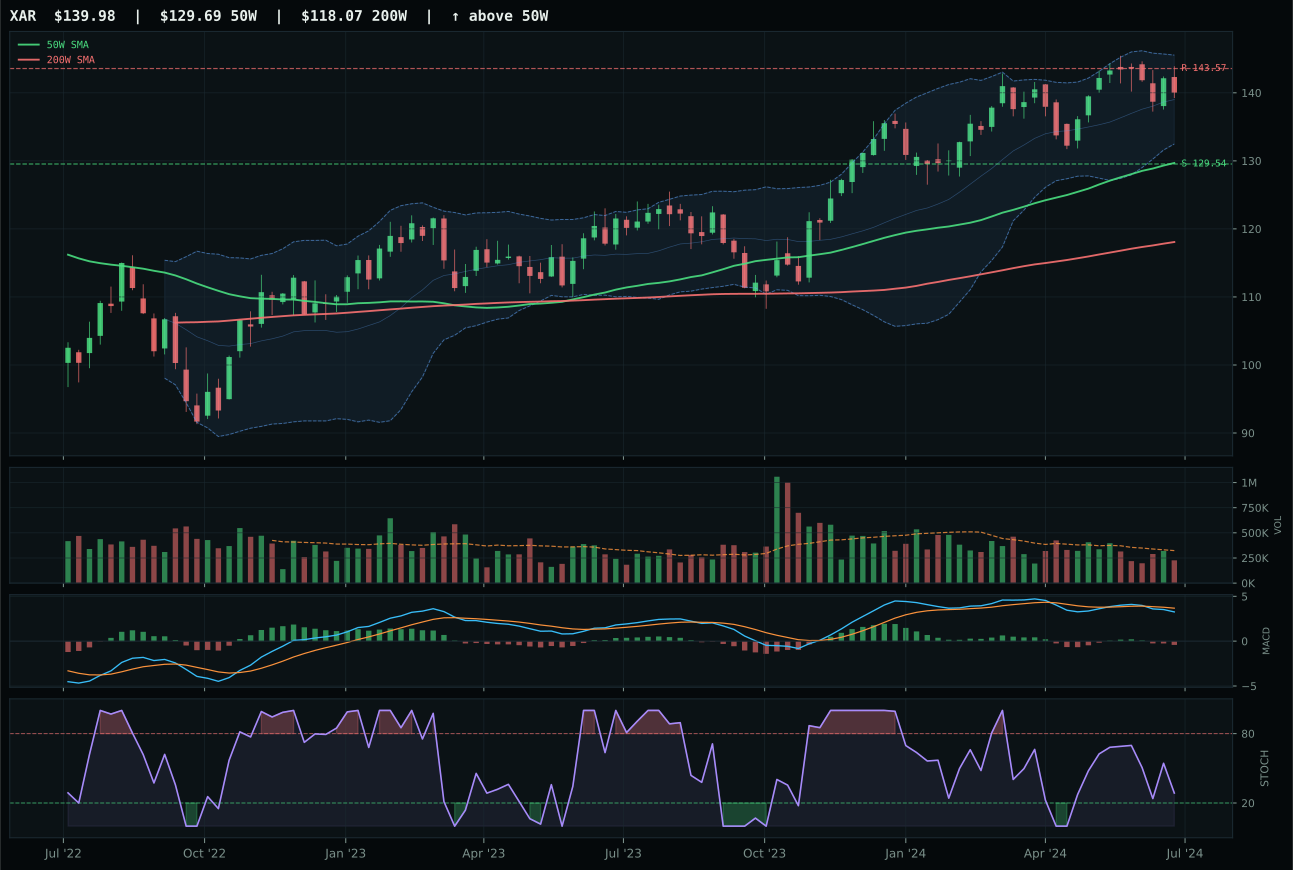
XAR has a neutral structure profile with -4.4% 13-week relative strength versus SPY.
A failed hold above support would weaken the setup.
Actionable but governed by invalidation levels.
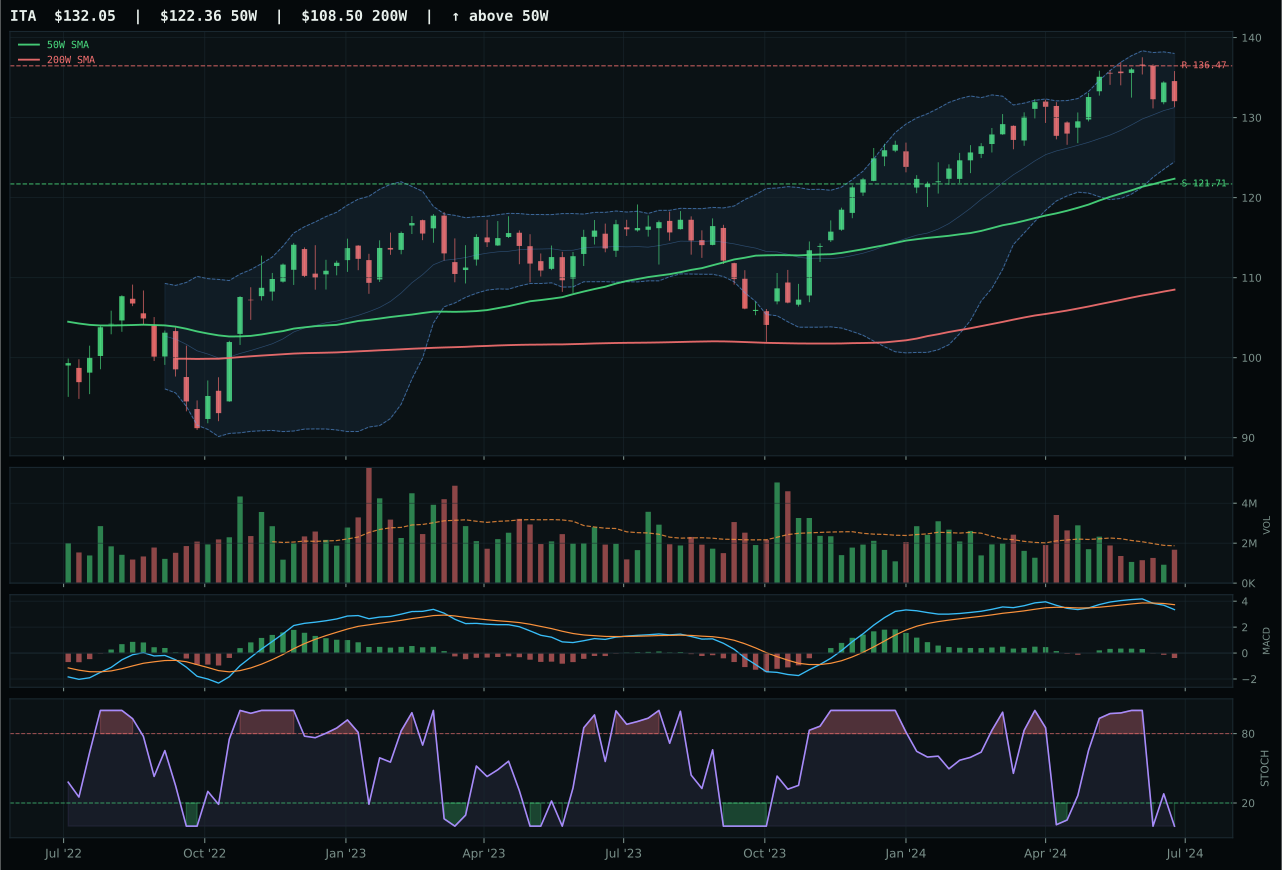
ITA has a neutral structure profile with -4.0% 13-week relative strength versus SPY.
A failed hold above support would weaken the setup.
Actionable but governed by invalidation levels.
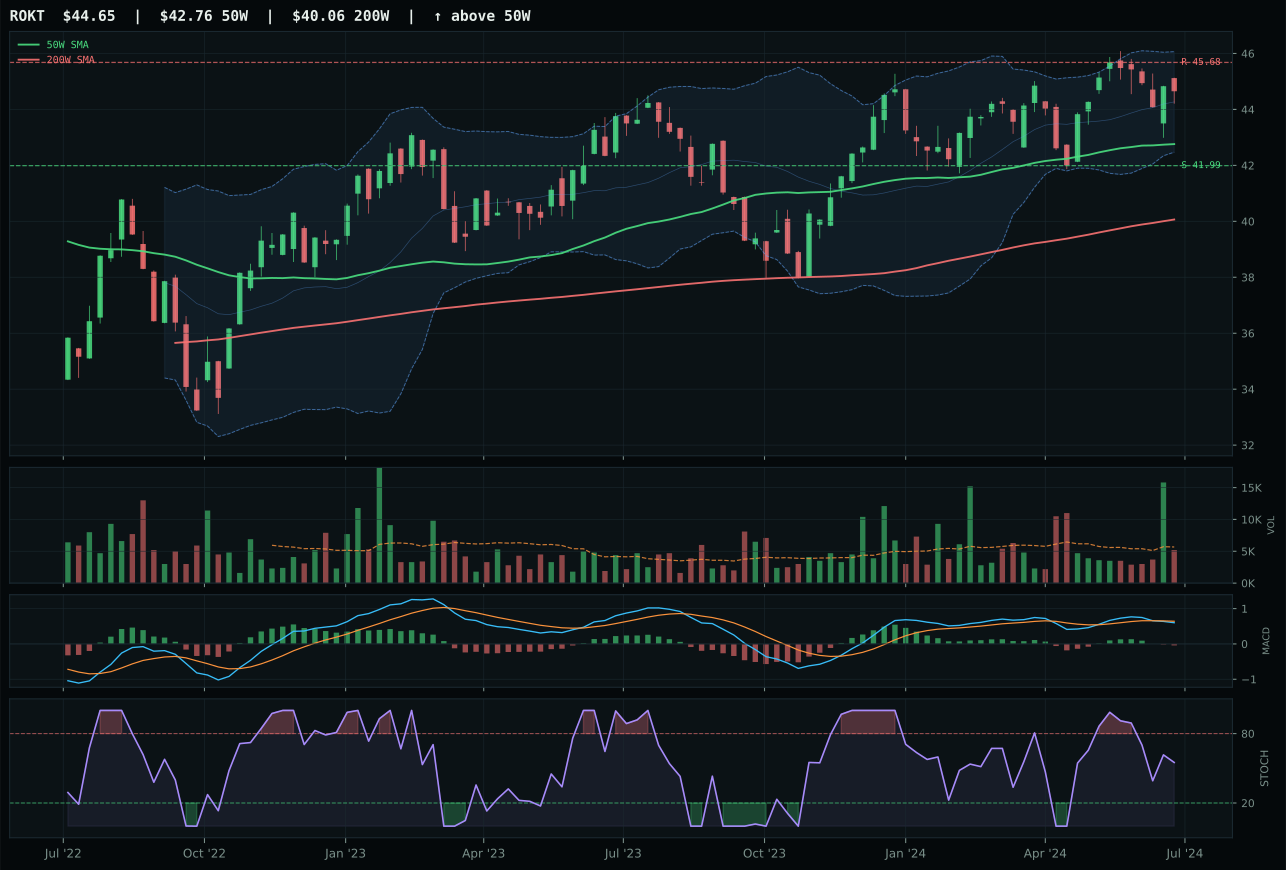
ROKT has a neutral structure profile with -4.5% 13-week relative strength versus SPY.
A failed hold above support would weaken the setup.
Tracked, but not top-2 eligible because: .
ITA wins a narrow decision over XAR by holding structure quality and volume confirmation where XAR shows stress. Both trade near neutral setups with bearish MACD and oversold readings, but ITA's cleanliness score of 75.0 versus XAR's 73.4 reveals the difference: ITA's compression is tighter and more organized, suggesting less internal confusion. More critically, ITA carries neutral volume at 0.89x 20-week average while XAR shows thin participation, a material difference when momentum is already weak. Both names are struggling—13-week returns near flat, negative SPY-relative strength—but ITA's category-relative strength of 0.5% versus XAR's 0.0% indicates it is not being actively abandoned within its peer set. The risk/reward advantage to ITA is marginal (51.9 vs 50.6), but structural cleanliness combined with neutral volume participation gives ITA the edge in a sector that is clearly under pressure.
Defense & Aerospace receives a tier-2 allocation of 5% despite a low absolute score of 40.9, which ranks it squarely in the middle tiers. This sector is a macro mismatch in disinflation: credit stress shows a +2 (actually constructive for defense), but liquidity stress at -4 and the overall macro fit of 51.0 reflect that defense equities do not offer the growth multiple relief that risk-on environments demand. The allocator carries this position not for its technical strength but for portfolio balance—it provides non-correlated exposure to geopolitical risk premia and durable cash flows when other categories crowd toward growth. ITA's oversold stochastic RSI at 0.00 combined with neutral structure suggests a coiled setup, not a broken one; this allocation will hold at 5% as long as ITA maintains structural integrity. A drop below support at 121.71 or further MACD deterioration would force a 0% assignment.
Emerging Markets — INDA
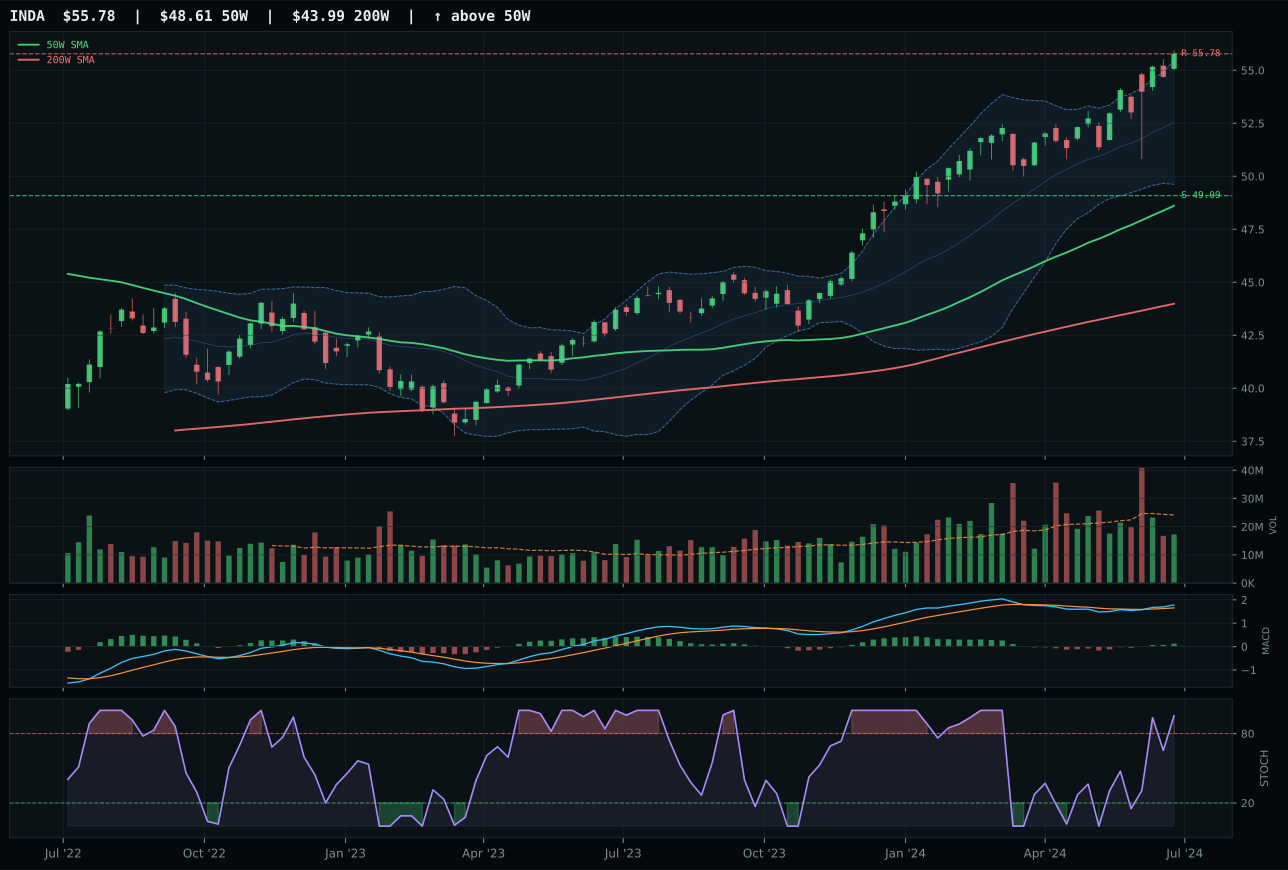
INDA has a neutral structure profile with 4.1% 13-week relative strength versus SPY.
A failed hold above support would weaken the setup.
Actionable but governed by invalidation levels.
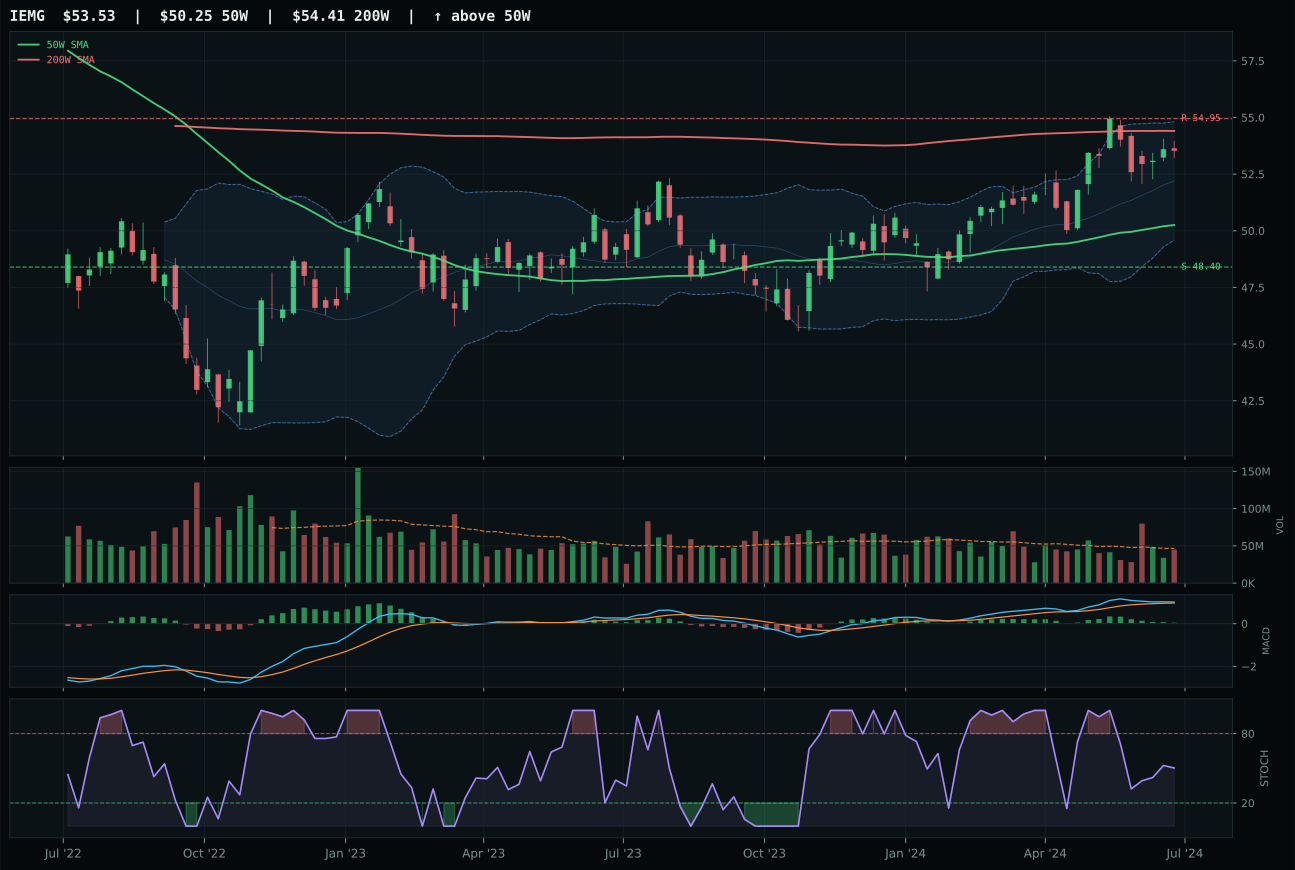
IEMG has a neutral structure profile with -0.3% 13-week relative strength versus SPY.
A failed hold above support would weaken the setup.
Actionable but governed by invalidation levels.
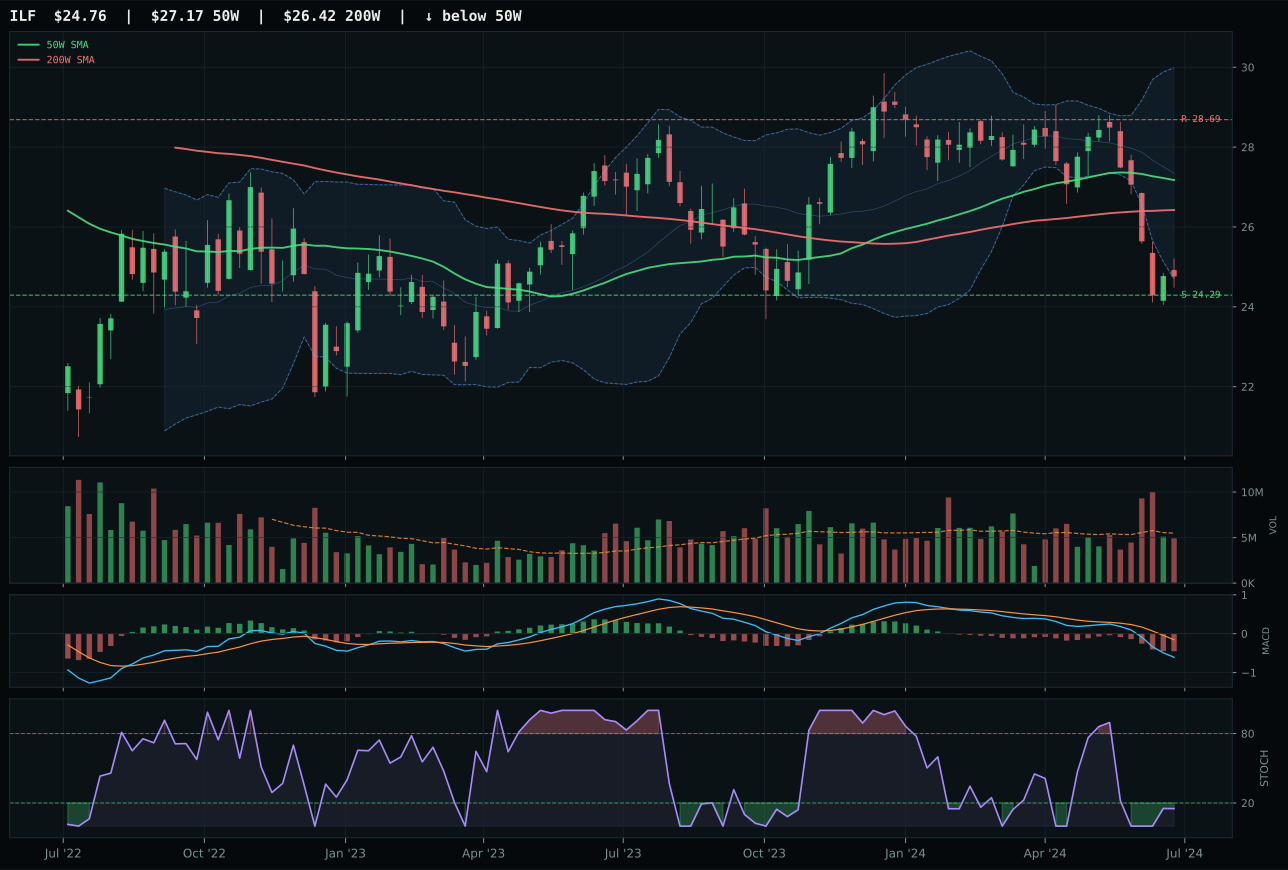
ILF has a pullback into support profile with -17.0% 13-week relative strength versus SPY.
A failed hold above support would weaken the setup.
Actionable but governed by invalidation levels.
INDA wins Emerging Markets decisively through superior momentum and category-relative strength that separates it from IEMG. Both trade in neutral structure near new highs, both show bullish MACD, but INDA's 13-week return of 8.1% versus IEMG's 3.7% and category-relative strength of 4.4% versus 0.0% prove that India-specific growth is being accumulated while broad emerging-market beta lags. INDA's overbought stochastic momentum at 0.95 versus IEMG's rising mid-zone is a timing distinction: INDA is more extended but more sponsored, a trade-off that favors the higher-conviction name in emerging markets. Both carry thin participation volume, but INDA's persistence score of 71.2 versus IEMG's lower reading shows that momentum is sticking. The setup is not clean—entry risk is real at 14.7% extended—but the proof order and category-relative conviction are unmistakable.
Emerging Markets receives a tier-2 allocation of 5% on a category score of 35.8, the lowest score among all tier-2 allocations, which reflects genuine macro headwinds offset by tactical technical strength. Risk appetite positive at +8 provides support, but credit stress at -10 and liquidity stress at -10 create a -12 net macro drag. The 38.0 category-level macro fit is the second-lowest in the entire portfolio, suggesting this allocation is a technical contrarian bet against weak macro positioning. INDA's 100.0 trend score and 87.2 momentum confirmation are carrying the category, not macro. Allocation holds at 5% as long as INDA remains above 49.09 support and maintains category-relative strength; any deterioration in either metric forces an immediate 0% assignment. This category is the most macro-sensitive in the portfolio—a rollover in risk appetite would trigger simultaneous deterioration across all three expressions and likely end the position within days.
Industrial Metals — COPX
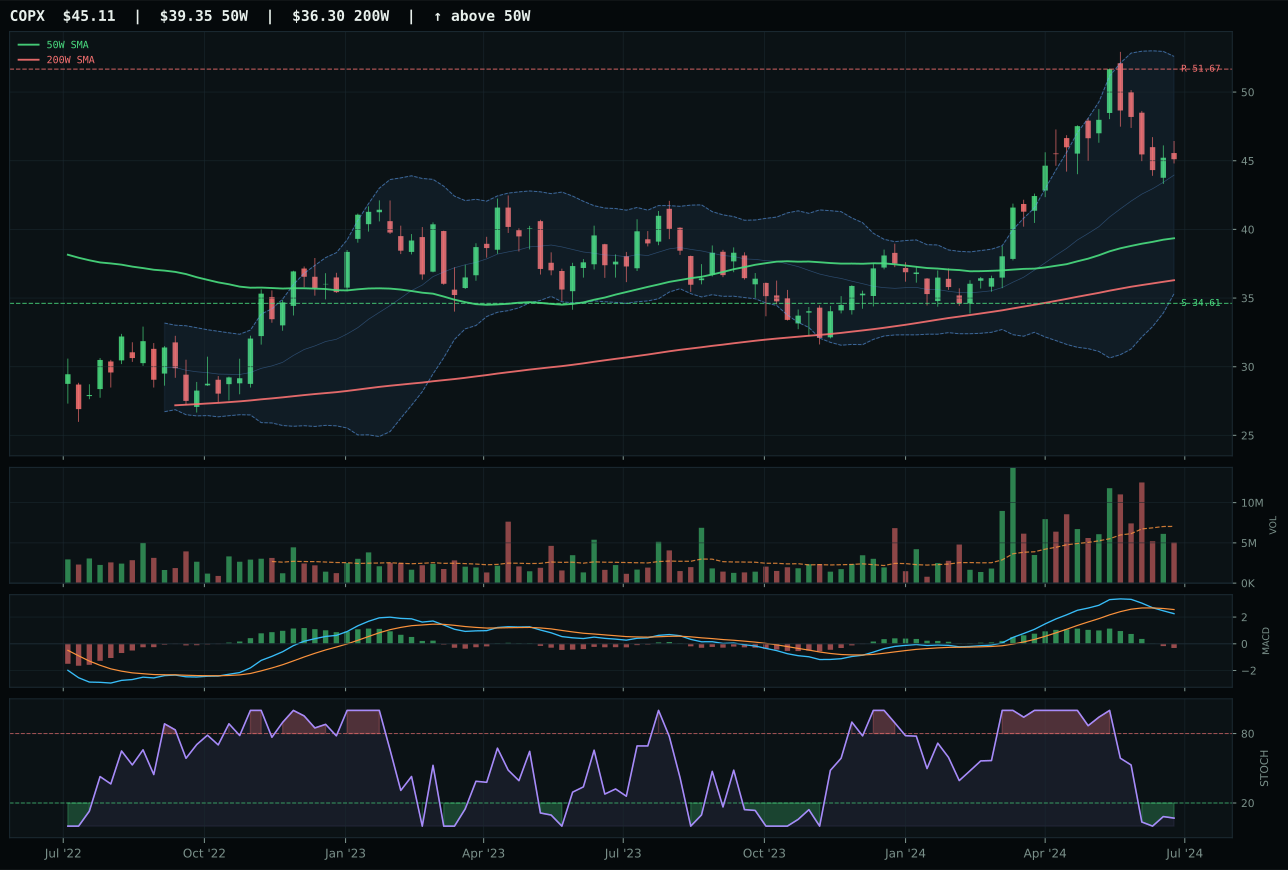
COPX has a neutral structure profile with 2.3% 13-week relative strength versus SPY.
A failed hold above support would weaken the setup.
Actionable but governed by invalidation levels.
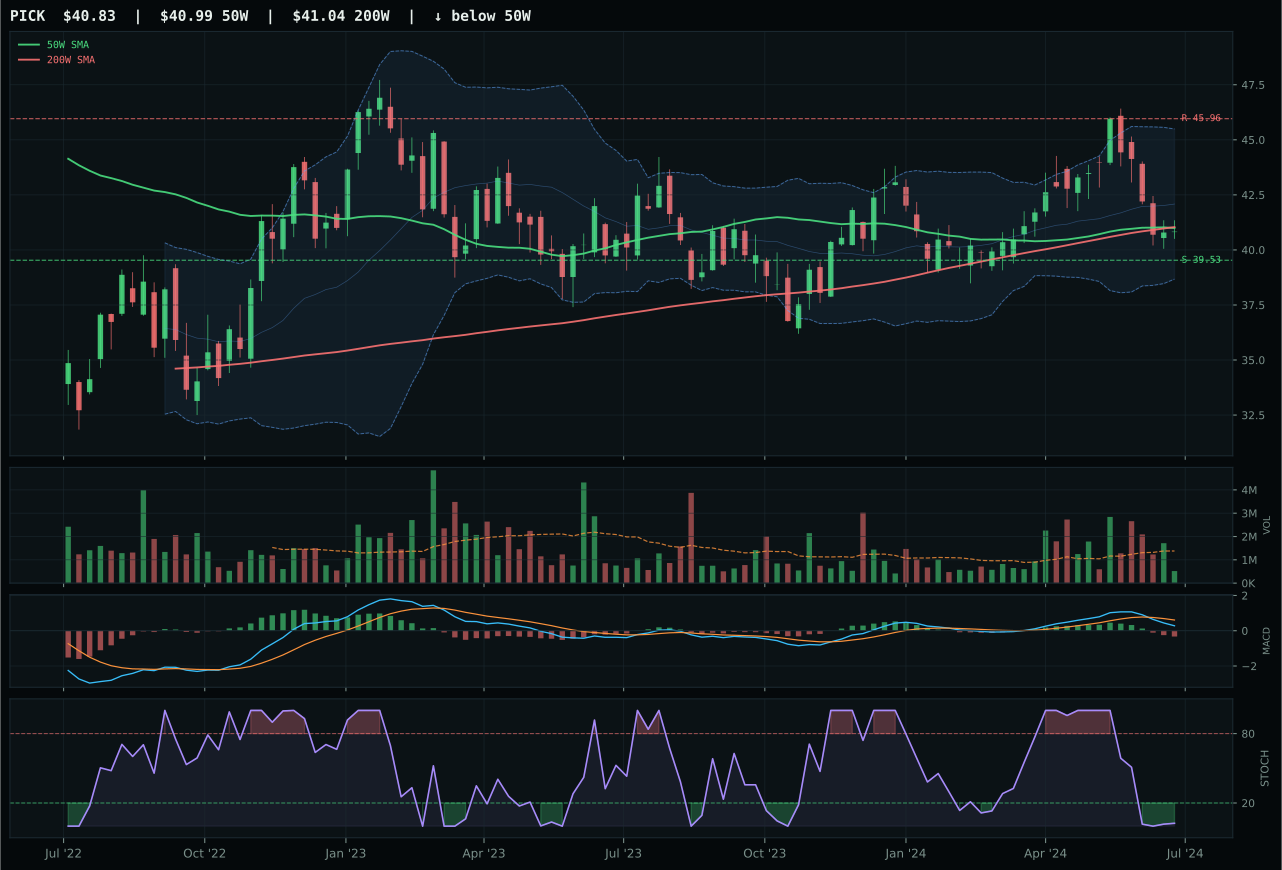
PICK has a pullback into support profile with -6.1% 13-week relative strength versus SPY.
Extension and support failure are the main tactical risks.
Tracked, but not top-2 eligible because: structurally broken.
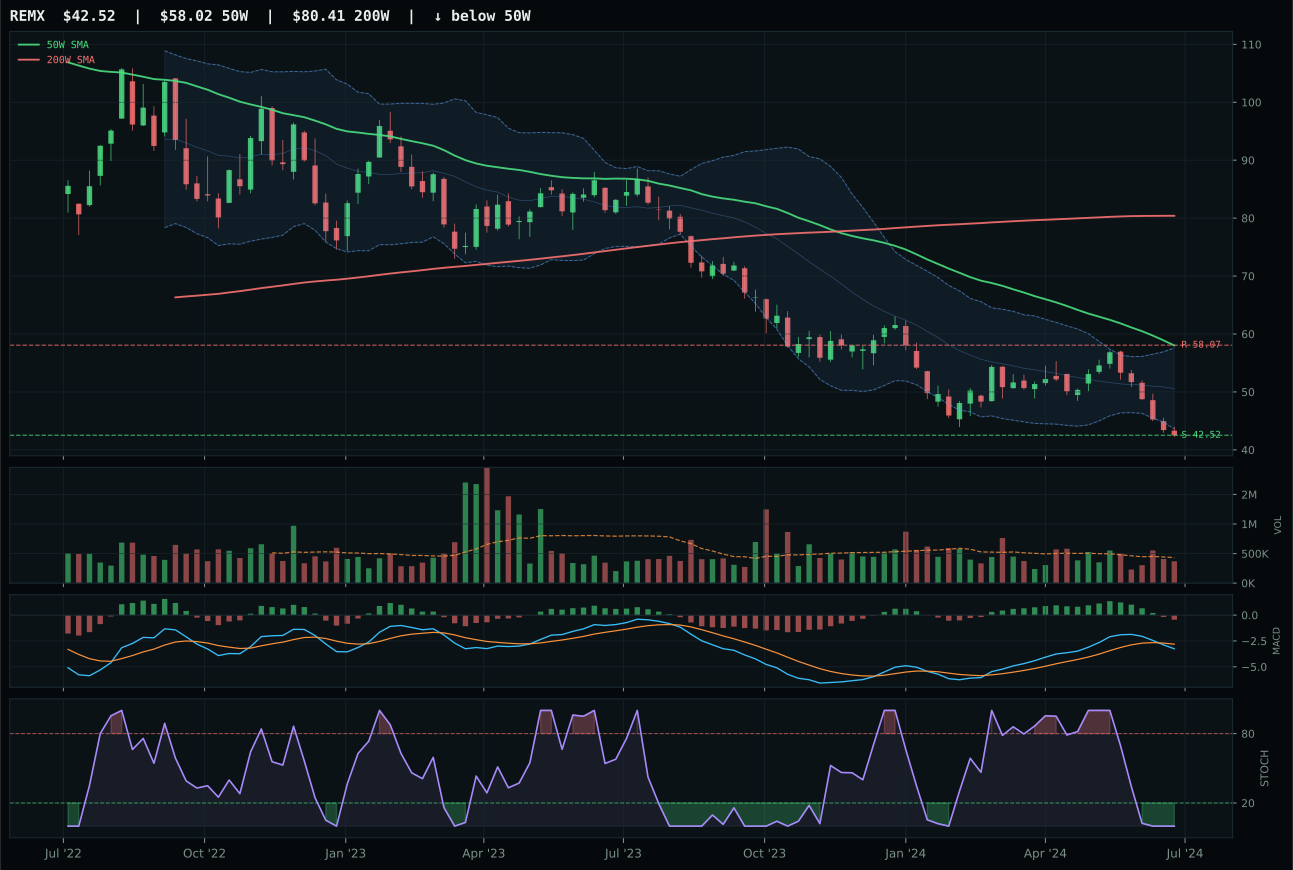
REMX has a pullback into support profile with -21.3% 13-week relative strength versus SPY.
Extension and support failure are the main tactical risks.
Tracked, but not top-2 eligible because: structurally broken.
COPX wins decisively because it is the only option showing acceptable technical structure in a category where PICK is broken and REMX is defunct. COPX sits 14.6% extended from the 50-week with a neutral structure and cleanliness of 50.0, meaning the chart is neither compressing nor expanding in dangerous ways. Its oversold-turn-up stochastic at 0.07 combined with bearish-but-improving MACD creates a classic reset-and-resume setup. PICK's pullback into support at 39.53 looks similar on surface, but the structure score of 42.0 versus COPX's 66.9 reveals the difference: PICK shows internal deterioration and was flagged with a hard-filter structural break, making it ineligible for allocation. COPX's 8.4% category-relative strength versus PICK's 0.0% shows that copper leadership is not being abandoned even though both face thin participation. The decision reflects survival, not brilliance.
Industrial Metals receives a tier-2 allocation of 5% on a category score of 33.5, driven by an unusually strong macro tailwind: metals scarcity at +14 and commodity breadth positive at +10 provide 24 basis points of momentum in a disinflation regime. COPX's technical evidence of 50.5 is respectable but not dominant; the category wins on macro alignment rather than technical excellence. The allocator carries this position because the scarcity narrative—EV demand, renewable infrastructure buildout, ESG-driven mine permitting friction—is structural, not cyclical. COPX's thin participation volume at 0.72x 20-week average is a real constraint; if volume remains sparse, the upside move will stall. Allocation holds at 5% as long as COPX remains above 34.61 support with improving MACD; deterioration to PICK's broken structure would trigger an immediate downgrade to 0%.
Traditional Energy — XLE
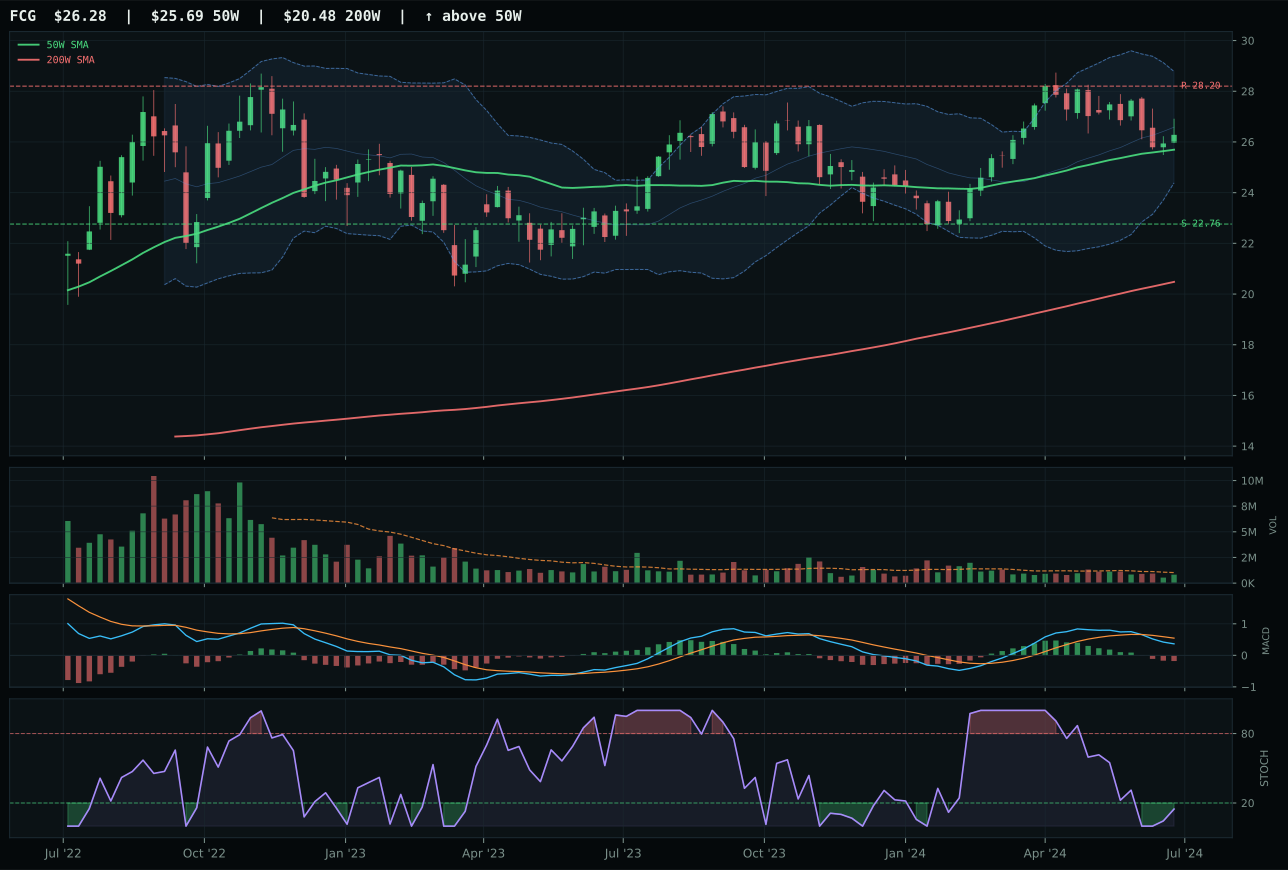
FCG has a compression near 50W profile with -8.3% 13-week relative strength versus SPY.
A failed hold above support would weaken the setup.
Actionable but governed by invalidation levels.
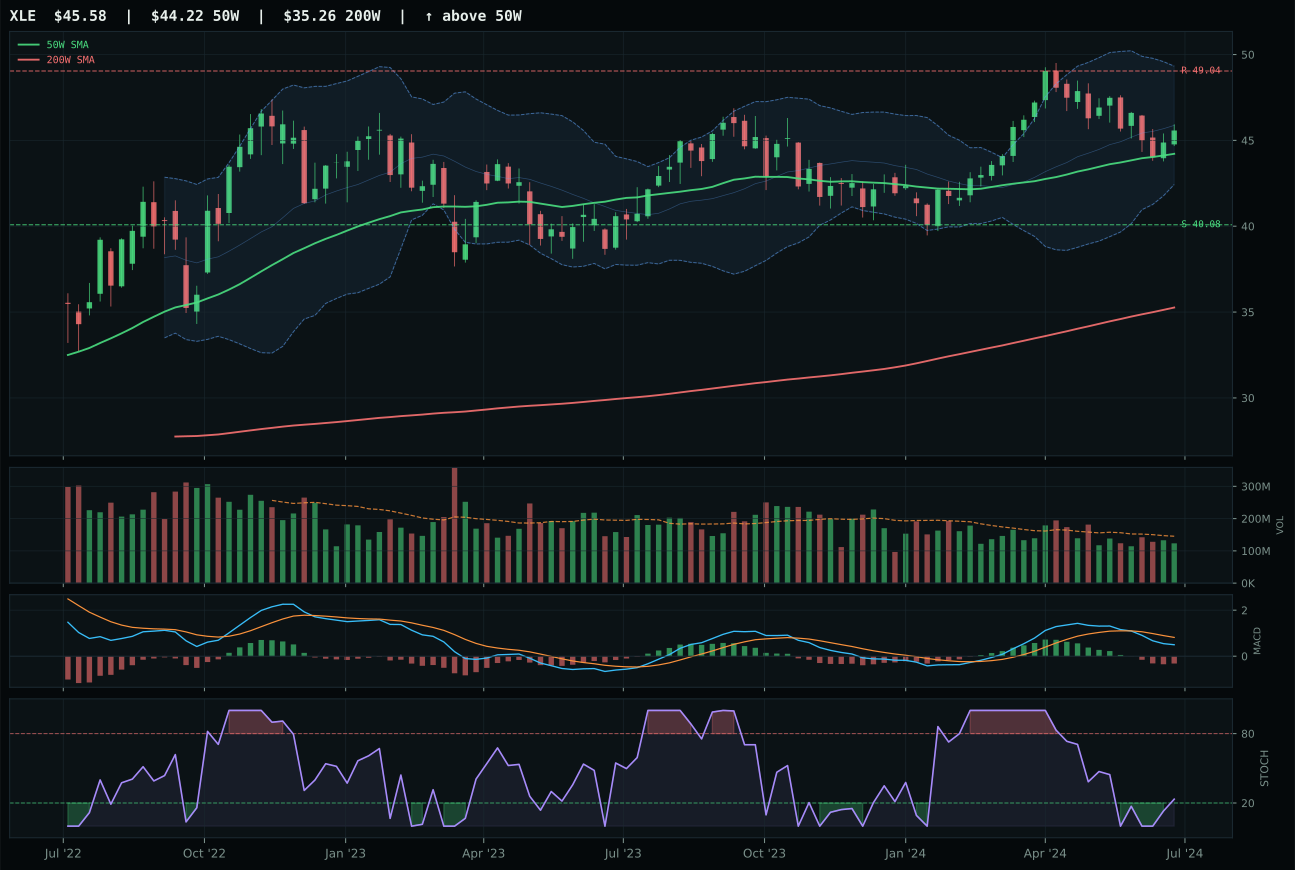
XLE has a neutral structure profile with -7.5% 13-week relative strength versus SPY.
A failed hold above support would weaken the setup.
Actionable but governed by invalidation levels.
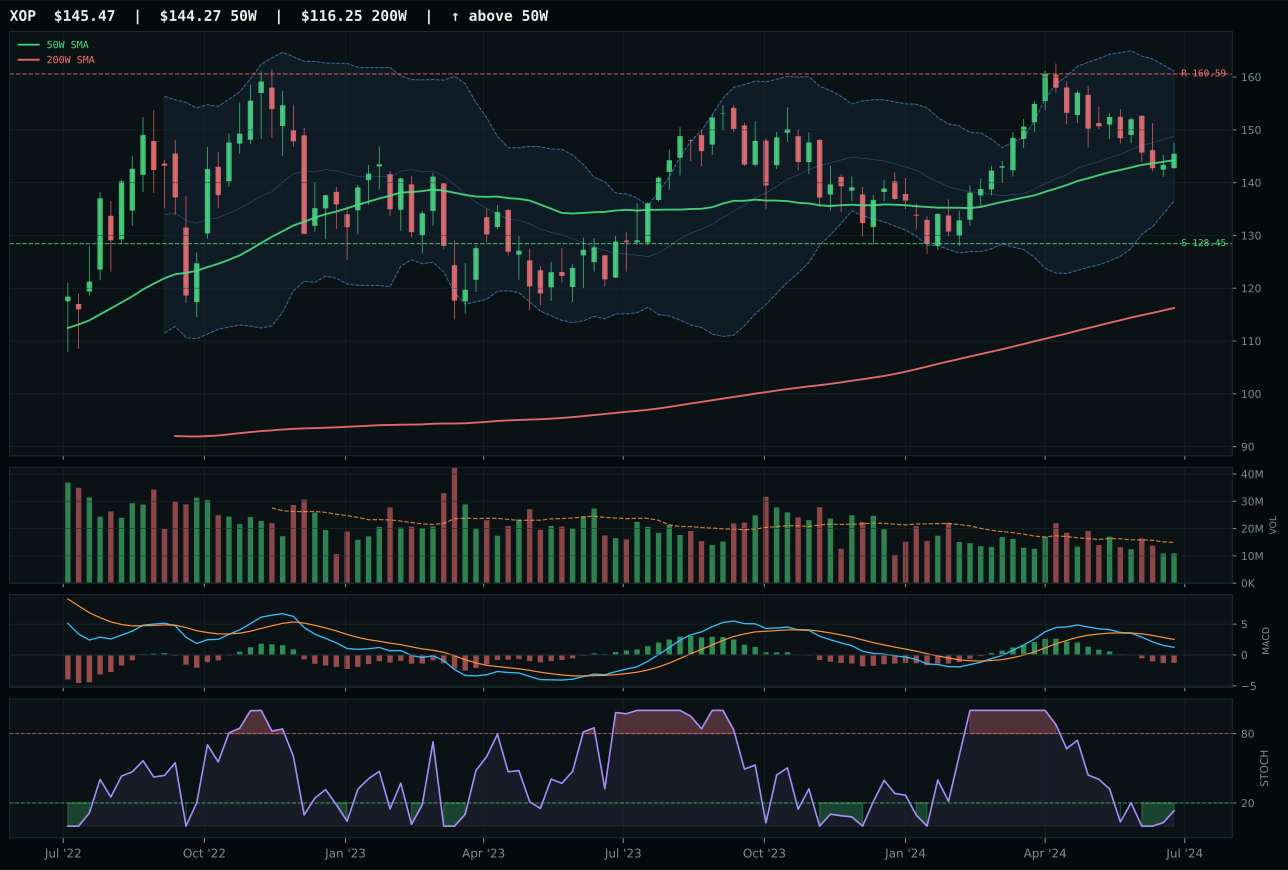
XOP has a compression near 50W profile with -10.1% 13-week relative strength versus SPY.
A failed hold above support would weaken the setup.
Actionable but governed by invalidation levels.
XLE wins the energy category by being the least damaged option in a sector where all three ETFs are effectively broken. XLE trades above both key moving averages with a 70.8 trend score and neutral structure, but the 13-week return of -3.5% and -7.5% SPY-relative underperformance reveal the underlying rot. XLE's only technical edge is timing: at 3.1% from the 50-week with a rising mid-zone stochastic, it at least sits in a position where oversold support could matter. FCG and XOP both show the same bearish MACD and oversold conditions, but FCG's compression near the 50-week (less distance to work with) and XOP's -10.1% SPY-relative strength make them inferior expressions of the same broken thesis. The category-level technical evidence of 42.2 across XLE reveals the verdict: energy is not broken enough to reverse yet, but not strong enough to compound gains.
Traditional Energy is allocated 0% this week and excluded from the portfolio entirely. The category score of 5.5 is the lowest among all non-excluded tiers, and the eligibility flag remains True only because XLE has not technically broken its support levels. However, the macro case is unambiguously negative: disinflation at -10 and disinflation pressure at -10 create a -20 headwind that no amount of real asset sponsorship at +7 can overcome. Credit stress at -7 and liquidity stress at -7 pile on additional pressure. The 23.0 category-level macro fit is the lowest in the allocation universe, and the technical evidence at 42.2 cannot carry that weight. This allocation will remain at 0% until either (1) the macro regime flips toward inflation, or (2) energy prices break to new highs with improving relative strength—neither of which is present in the disinflation environment. XLE would need to close above 49.04 resistance with expanding volume to earn reconsideration.
Agriculture & Livestock — MOO
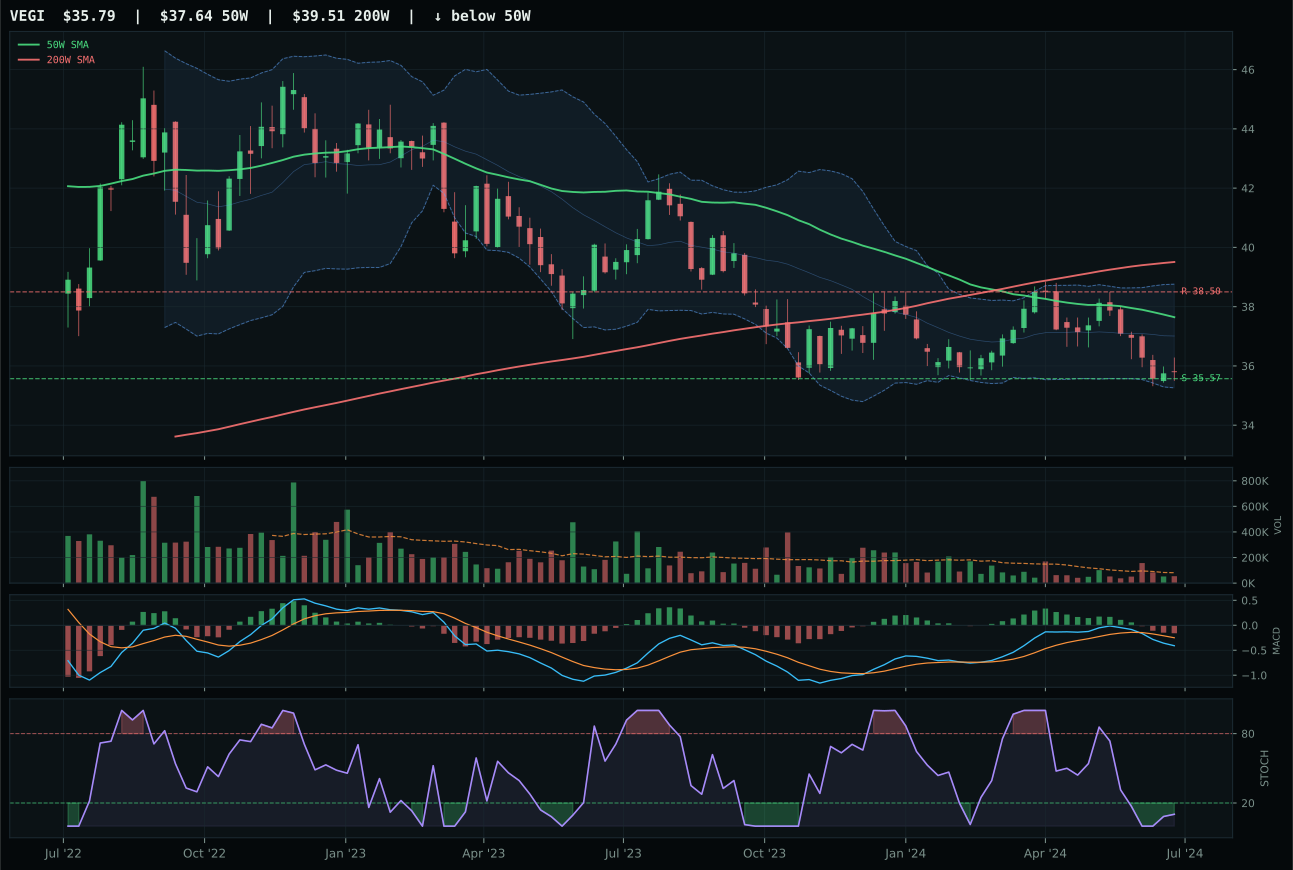
VEGI has a pullback into support profile with -11.1% 13-week relative strength versus SPY.
Extension and support failure are the main tactical risks.
Tracked, but not top-2 eligible because: structurally broken.
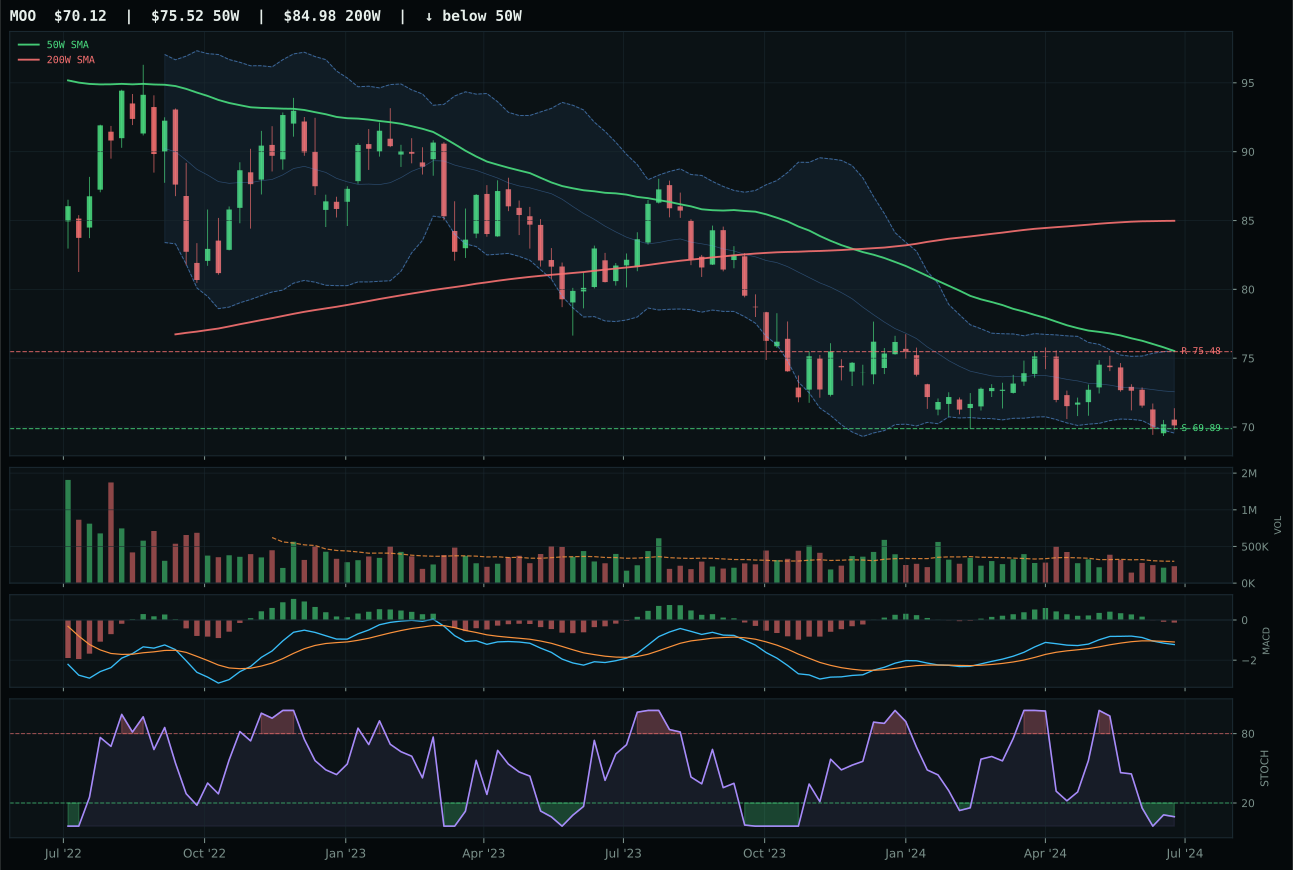
MOO has a pullback into support profile with -10.7% 13-week relative strength versus SPY.
Extension and support failure are the main tactical risks.
Tracked, but not top-2 eligible because: structurally broken.
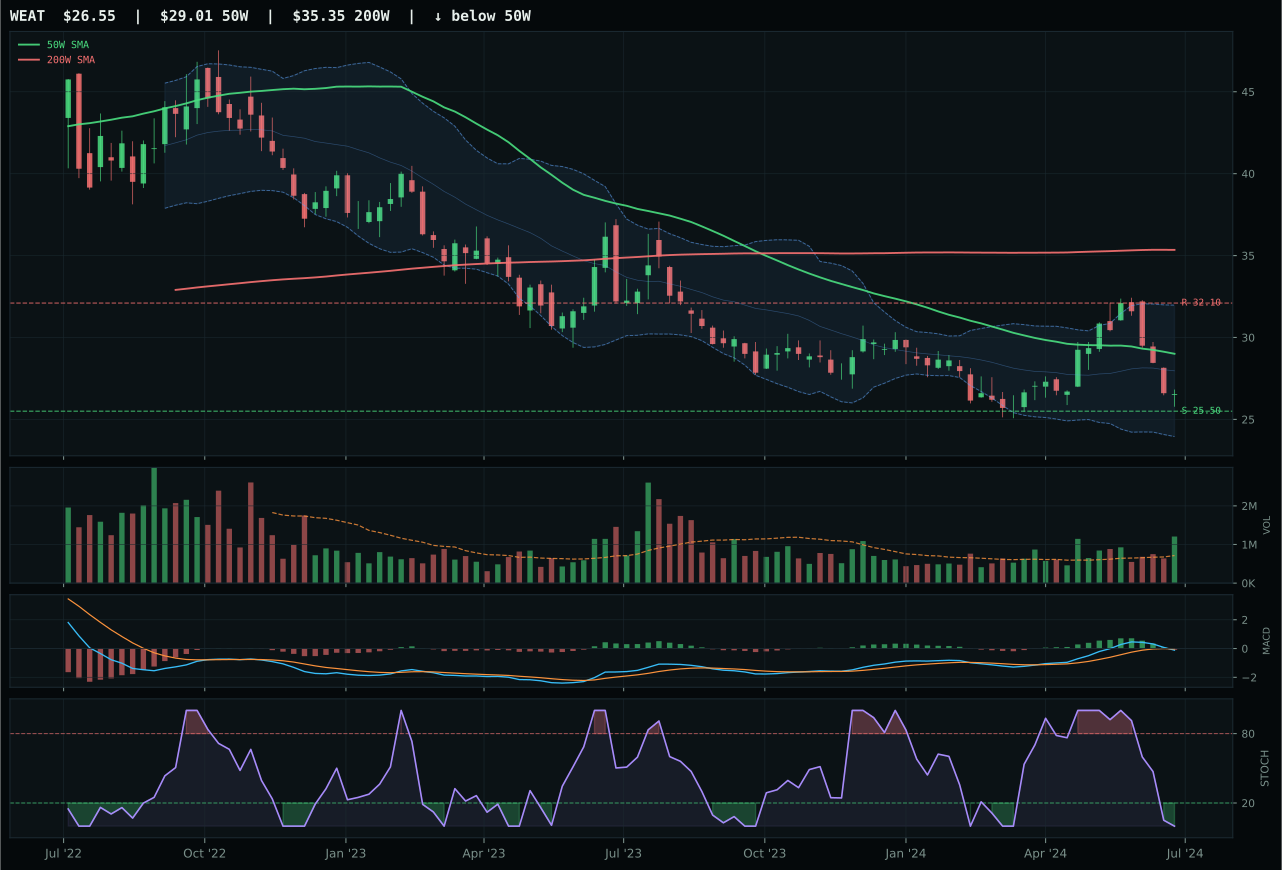
WEAT has a pullback into support profile with -5.9% 13-week relative strength versus SPY.
Extension and support failure are the main tactical risks.
Tracked, but not top-2 eligible because: structurally broken.
MOO wins by default in a category where all options are structurally broken. The entire sector is trading below its 50-week and 200-week moving averages with negative SPY-relative strength of -10.7%, 13-week returns of -6.7%, and oversold readings that offer only tactical rebound risk, not thematic conviction. MOO's thin edge over VEGI stems entirely from volume participation: MOO shows neutral volume at 0.77x 20-week average while VEGI shows thin participation, a detail that matters in distressed technicals because neutral volume allows for at least the possibility of accumulation into weakness. The Fibonacci zone at 0.786 suggests deep repair work is still underway. MOO's risk/reward of 90.0 and timing score of 80.0 are technically favorable because support is so close, but those metrics mask the fundamental problem: the category lacks sponsorship, lacks relative strength, and lacks momentum.
Agriculture & Livestock is allocated 0% this week and is explicitly excluded from the portfolio. The category received an eligibility flag of False after scoring 0.0 on the reasoner matrix, ranking it 9th or 10th among the allocation universe. Disinflation actively hurts real assets at -6, and while commodity breadth positive and real asset sponsorship offer some +8 and +5 support respectively, the 21.8 technical evidence score for MOO is too weak to carry the weight. The sector shows MOO at -6.7% 13-week return versus category median, and every alternative exhibits outright deterioration with MOO leading only because it is the least broken. This is a zero-allocation call until two conditions change: (1) MOO closes above its 50-week moving average with improving MACD, or (2) the macro regime shifts away from disinflation toward inflation/stagflation premia. Currently, neither is present.