
2024-06-21
Informational purposes only. The content in this report, including allocations, analysis, and commentary, is provided solely for informational and educational purposes. It does not constitute financial advice, investment advice, trading advice, or any other type of advice. Past performance does not guarantee future results. Always conduct your own research and consult a qualified financial professional before making investment decisions.
Weekly Allocation
| Ticker | Category | Weight | Role |
|---|---|---|---|
| FBTC | 50% | Overlay | |
| GLD | Precious Metals | 10% | Top-2 (10%) |
| XLU | Utilities & Infrastructure | 10% | Top-2 (10%) |
| SMH | AI | 5% | Tier-2 (5%) |
| XLK | Technology | 5% | Tier-2 (5%) |
| NLR | Nuclear Energy | 5% | Tier-2 (5%) |
| ITA | Defense & Aerospace | 5% | Tier-2 (5%) |
| COPX | Industrial Metals | 5% | Tier-2 (5%) |
| INDA | Emerging Markets | 5% | Tier-2 (5%) |
Trade Instructions — Monday Open
Sell the tranche from 2024-05-24 (completing its 4-week hold). Buy the new tranche. Instructions show net portfolio changes — same-asset positions cancel, weight changes show the delta.
| Action | Ticker | Instruction |
|---|---|---|
| SELL | NLR | Sell 14% of NLR position (reduce 8.75% → 7.50%) |
| SELL | XLE | Sell 50% of XLE position (reduce 5.00% → 2.50%) |
| SELL | SLV | Sell 33% of SLV position (reduce 3.75% → 2.50%) |
| SELL | XAR | Sell 50% of XAR position (reduce 2.50% → 1.25%) |
| SELL | PICK | Sell 50% of PICK position (reduce 2.50% → 1.25%) |
| SELL | WEAT | Sell 33% of WEAT position (reduce 3.75% → 2.50%) |
| BUY | XLU | Buy XLU — 14.29% of freed cash (adds 1.25% to portfolio) |
| BUY | COPX | Buy COPX — 14.29% of freed cash (adds 1.25% to portfolio) |
| BUY | GLD | Buy GLD — 28.57% of freed cash (adds 2.50% to portfolio) |
| BUY | ITA | Buy ITA — 14.29% of freed cash (adds 1.25% to portfolio) |
| BUY | XLK | Buy XLK — 14.29% of freed cash (adds 1.25% to portfolio) |
| BUY | INDA | Buy INDA — 14.29% of freed cash (adds 1.25% to portfolio) |
Current Portfolio After Trade
Combined holdings across all 4 active tranches. Each tranche is 25% of the portfolio.
| Ticker | % of Portfolio | Weight Bar |
|---|---|---|
| FBTC | 50.00% | |
| GLD | 7.50% | |
| NLR | 7.50% | |
| XLU | 6.25% | |
| SMH | 5.00% | |
| COPX | 3.75% | |
| ITA | 3.75% | |
| SLV | 2.50% | |
| WEAT | 2.50% | |
| XLE | 2.50% | |
| XLK | 2.50% | |
| INDA | 2.50% | |
| XAR | 1.25% | |
| PICK | 1.25% | |
| IGF | 1.25% |
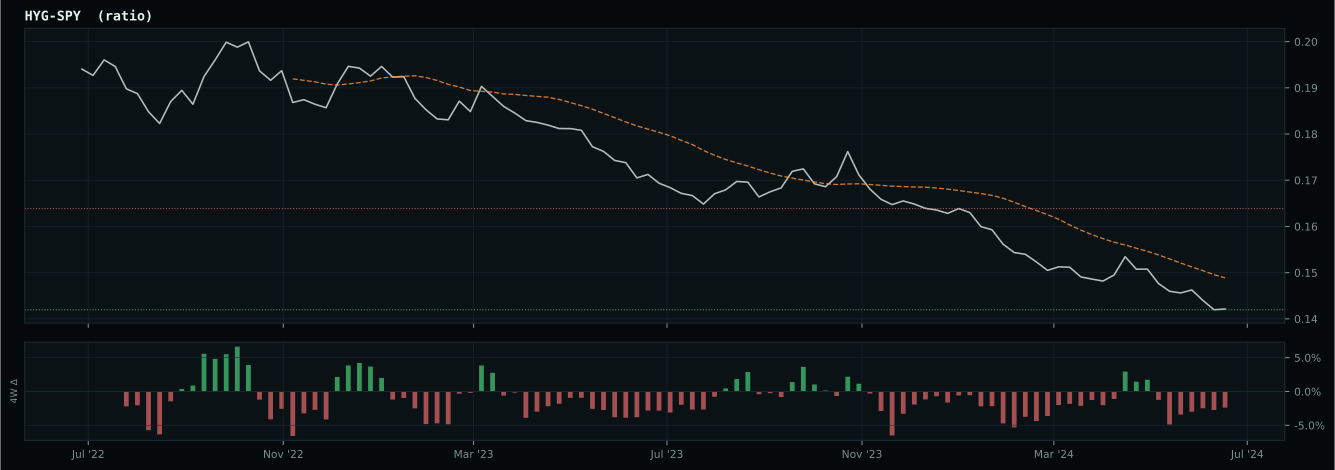
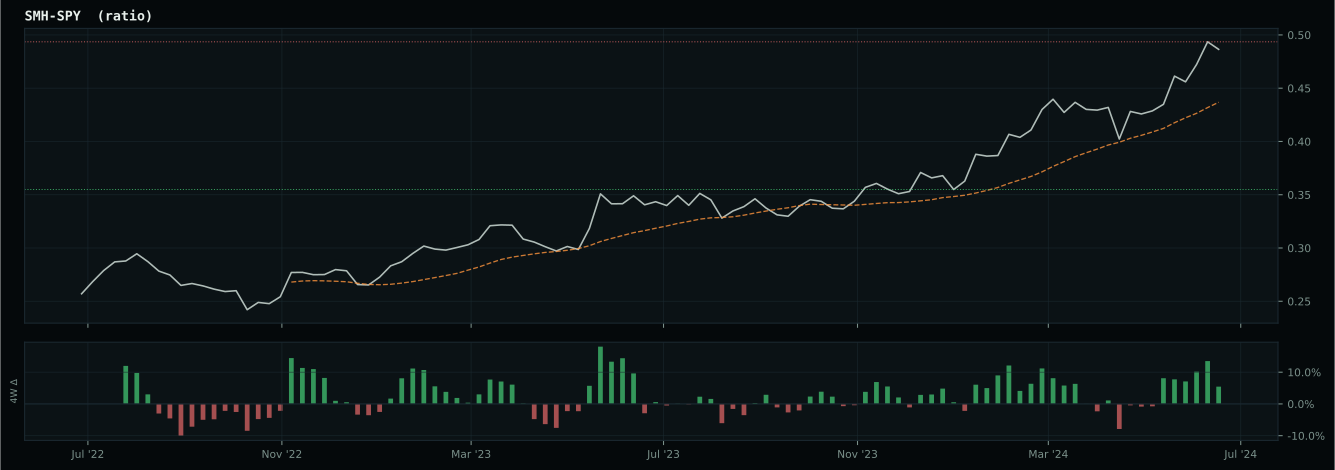
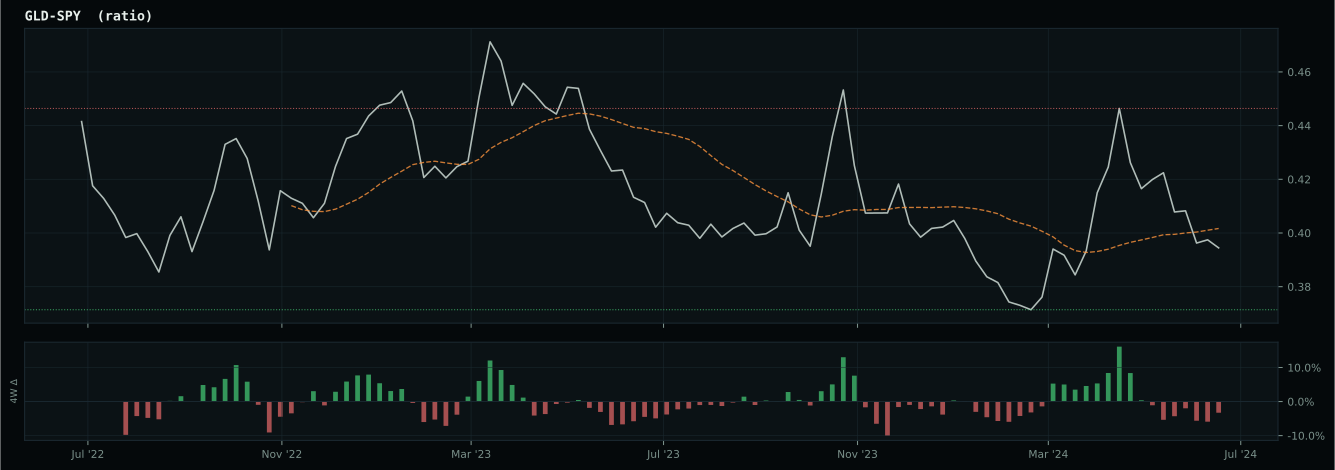
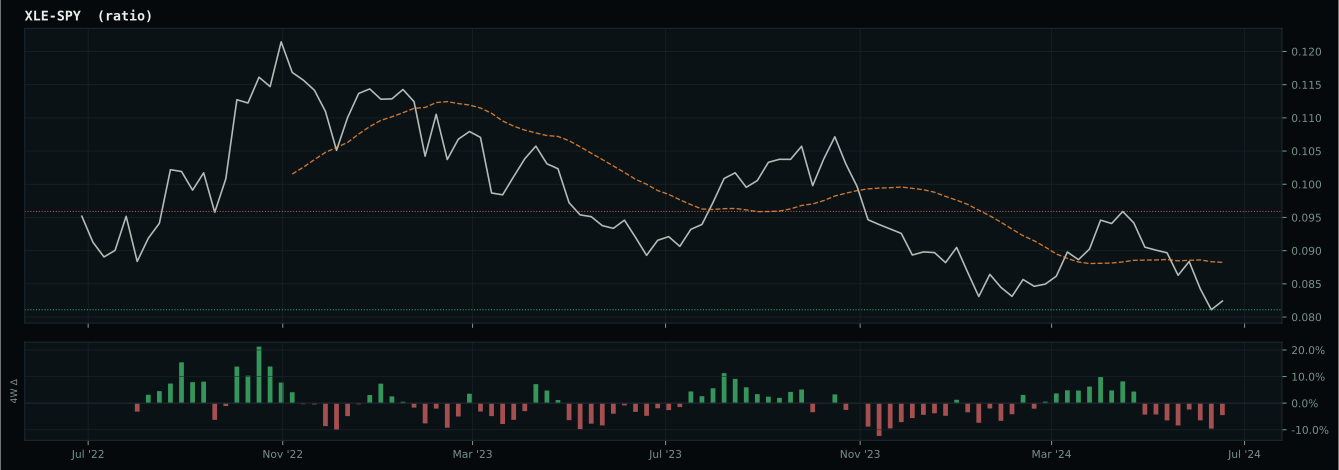
Macro Regime — Disinflation
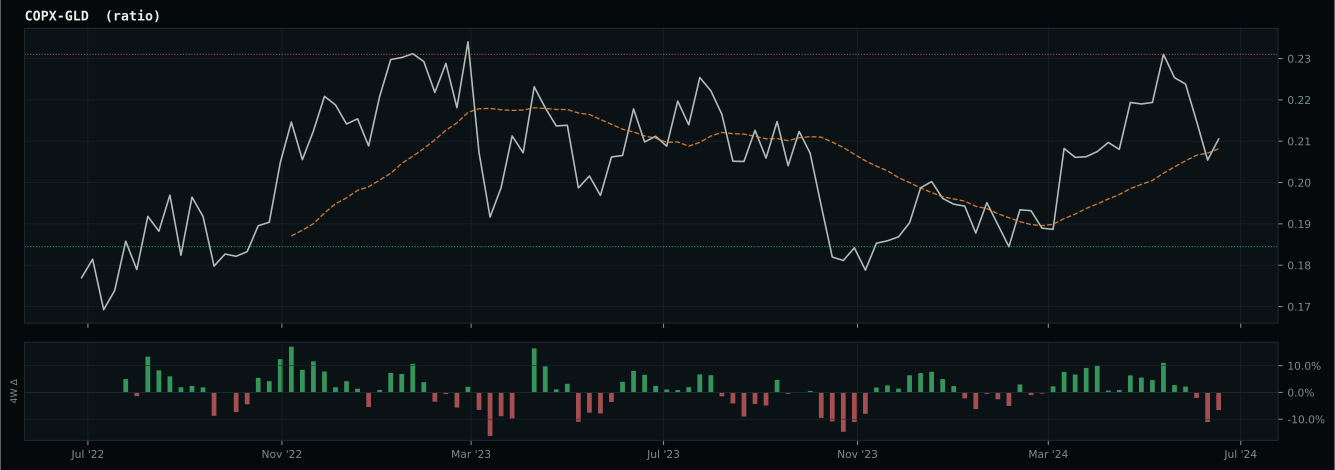
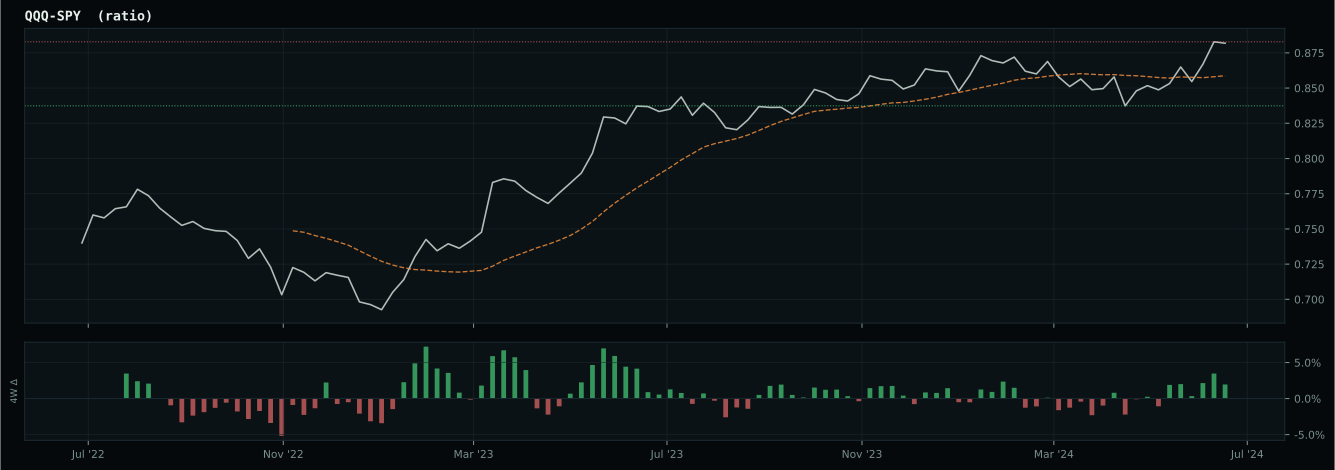
Macro Evidence Charts
Market-implied signals behind the macro regime scores. Each ratio compares two assets; the direction and slope of the ratio is what the macro engine reads.
Crypto Regime — TrendBTC
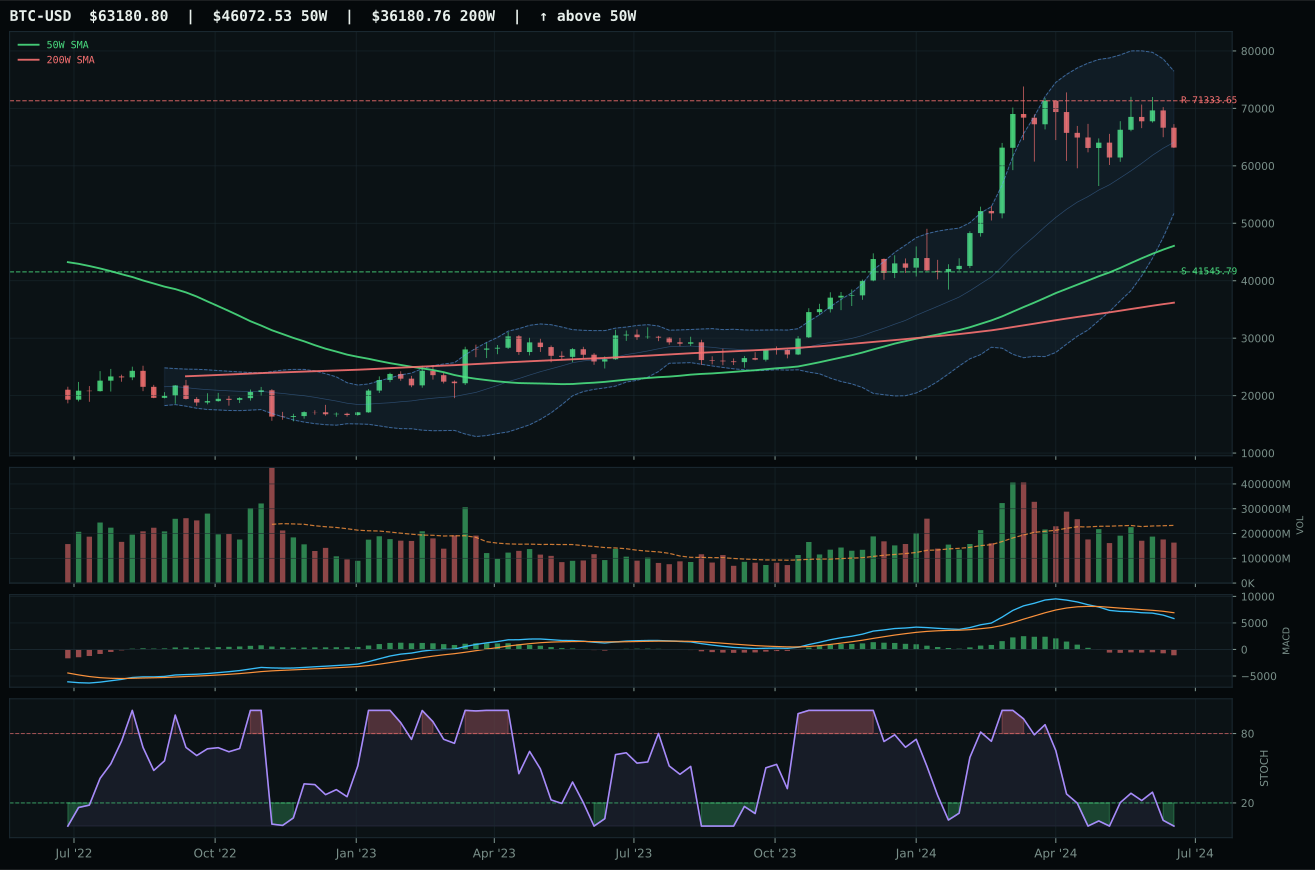
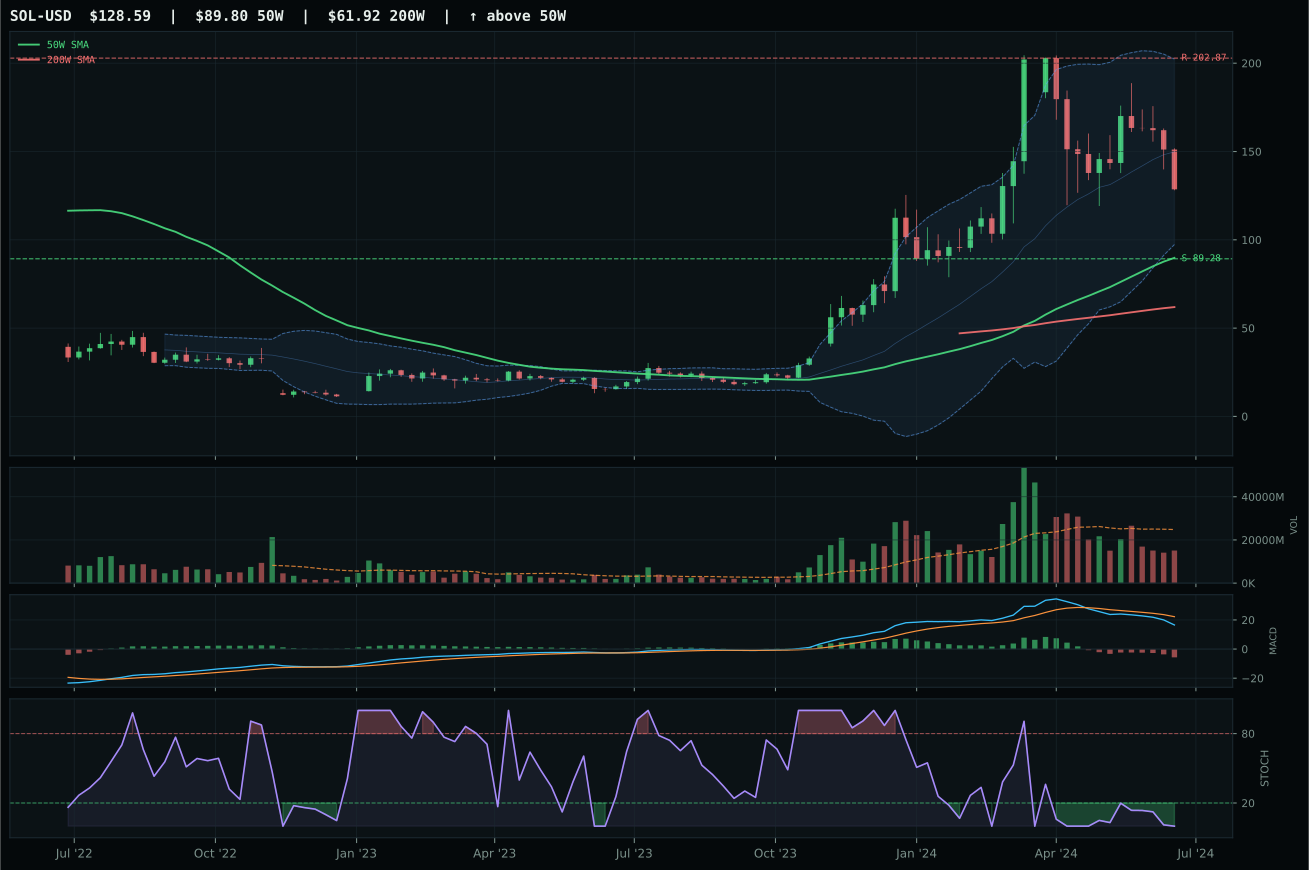
ValueBTC not armed: BTC has not made the first post-breakdown touch of the 200W buy zone after losing the 50W
TrendBTC confirmed: 2 consecutive closes above rising/flat 50W SMA
one or more available conditions failed
Category Rankings
| Rank | Category | Winner | Score | Alloc | 4W Ret | Peers (4W) |
|---|---|---|---|---|---|---|
| 1 | Precious Metals | GLD | 71.0 | 20% | +2.80% | SLV -2.3% · GDX +8.8% |
| 2 | Utilities & Infrastructure | XLU | 62.8 | 20% | +2.44% | IGF +3.1% · PAVE +3.4% |
| 3 | AI | SMH | 57.2 | 10% | -3.25% | AIQ +0.5% · BOTZ +1.1% |
| 4 | Technology | XLK | 54.7 | 10% | -0.82% | IGV +1.3% · CIBR +3.0% |
| 5 | Nuclear Energy | NLR | 46.5 | 10% | -3.25% | URA -4.5% · URNM -7.5% |
| 6 | Defense & Aerospace | ITA | 41.8 | 10% | -0.13% | XAR +1.5% · ROKT +3.1% |
| 7 | Industrial Metals | COPX | 38.1 | 10% | -5.42% | PICK -2.3% · REMX -1.3% |
| 8 | Emerging Markets | INDA | 36.4 | 10% | +2.80% | IEMG +0.7% · ILF +2.7% |
| 9 | Agriculture & Livestock | MOO | 4.0 | 0% | +2.11% | VEGI +1.8% · WEAT -4.0% |
| 10 | Traditional Energy | XLE | 3.8 | 0% | +2.62% | FCG +3.6% · XOP +2.4% |
Precious Metals — GLD
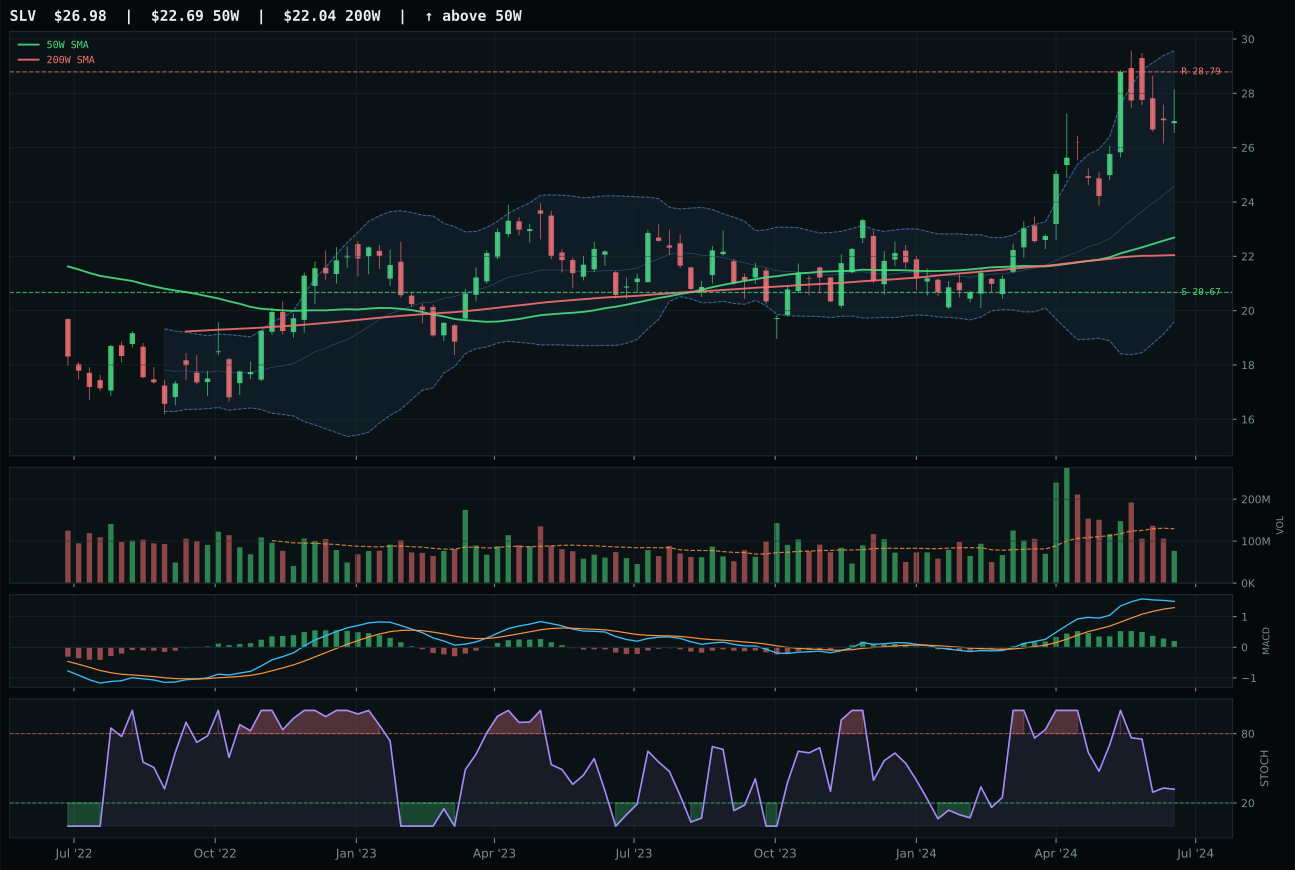
SLV has a vertical extension profile with 15.1% 13-week relative strength versus SPY.
A failed hold above support would weaken the setup.
Actionable but governed by invalidation levels.
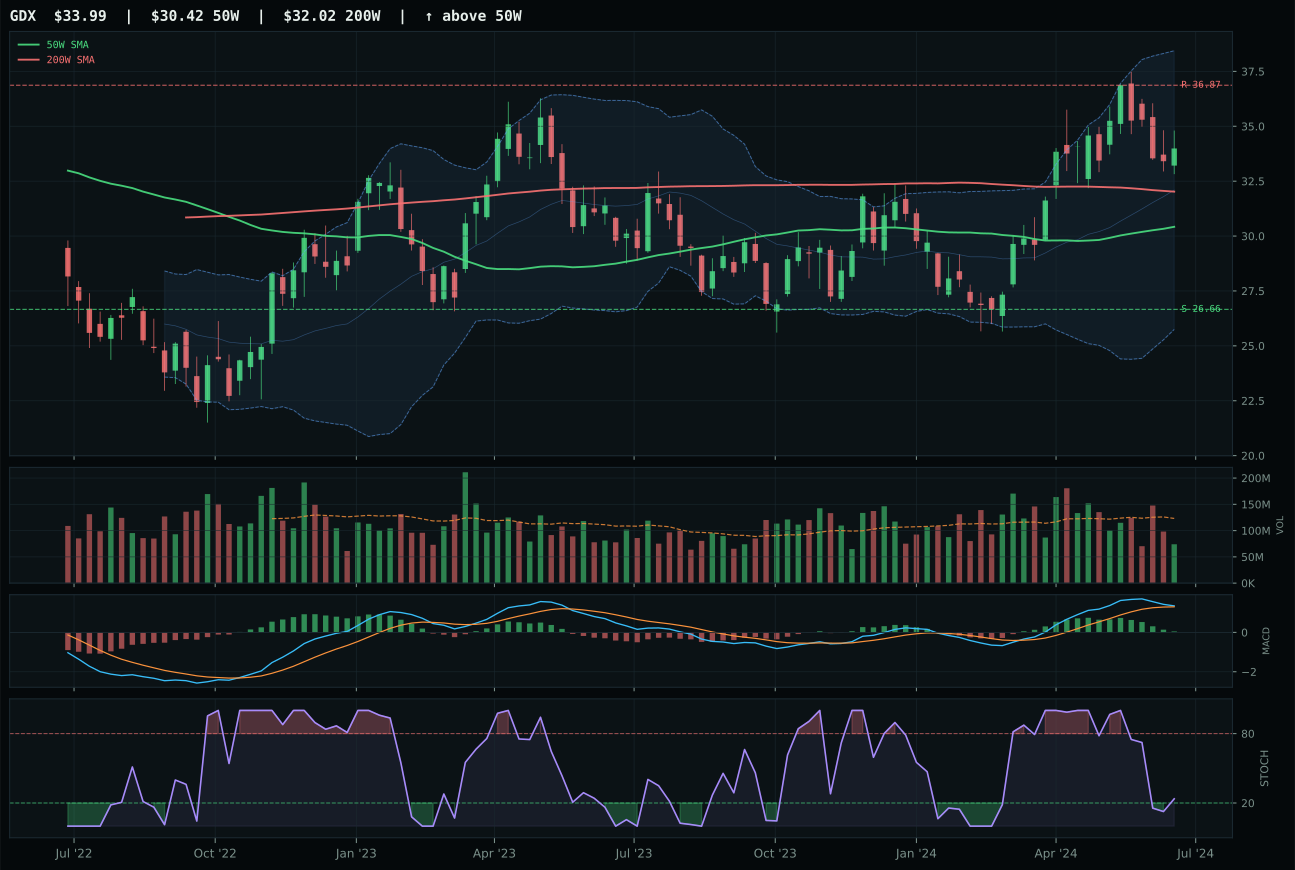
GDX has a neutral structure profile with 10.4% 13-week relative strength versus SPY.
A failed hold above support would weaken the setup.
Actionable but governed by invalidation levels.
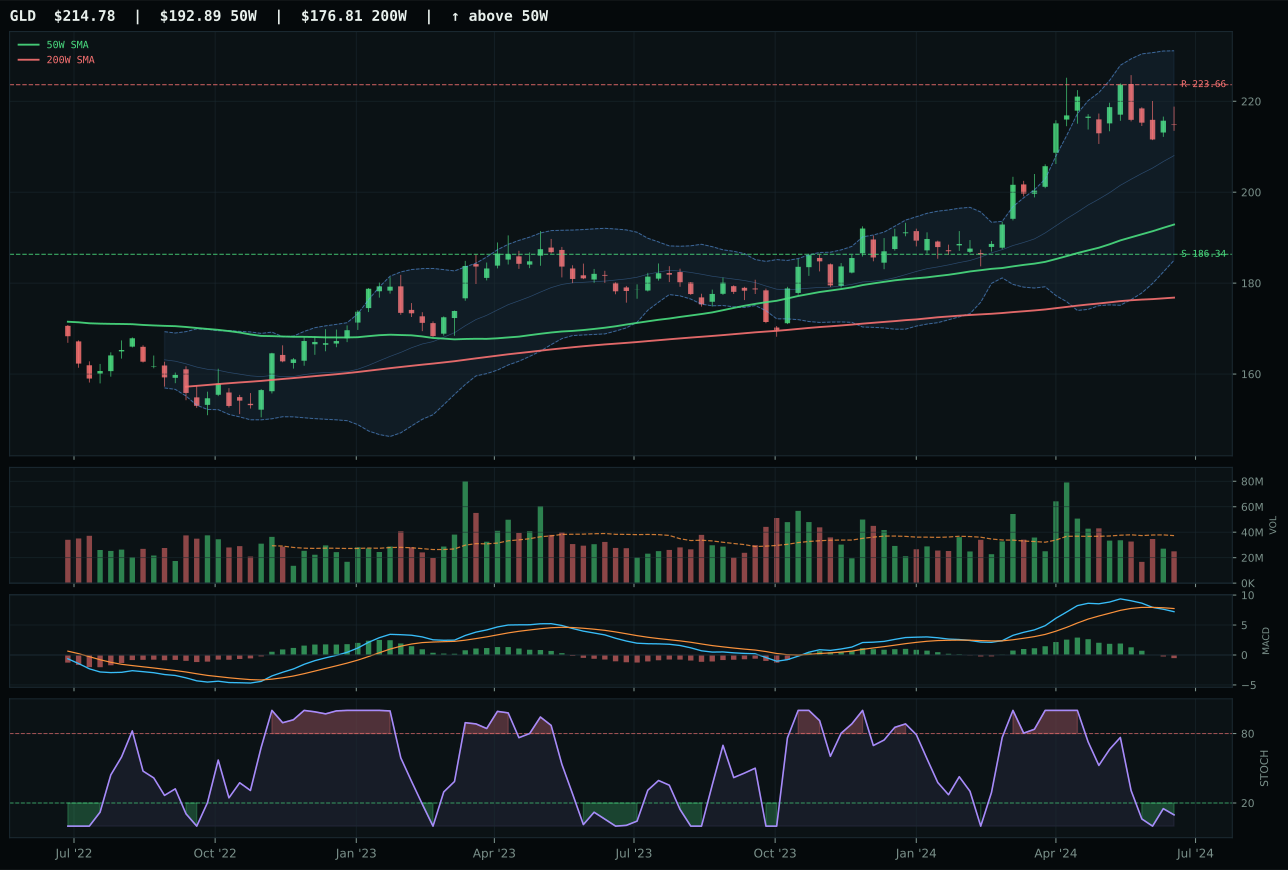
GLD has a neutral structure profile with 2.7% 13-week relative strength versus SPY.
A failed hold above support would weaken the setup.
Actionable but governed by invalidation levels.
GLD clinched top-2 status by displaying superior timing wisdom over SLV, despite SLV's more impressive absolute momentum: SLV's 19.6% thirteen-week return and 15.1% SPY-relative strength scream extended, while GLD's 7.2% and 2.7% whisper patience. The critical technical difference lies in stochastic RSI positioning—GLD sits at oversold turn-up (0.10), meaning it has room to run from a lower-risk entry zone, while SLV at falling/neutral (0.26) signals a worn-out move. GLD's timing score of 84.0 versus SLV's 48.0 captures this asymmetry perfectly. Both post neutral structure, but GLD is 11.3% from the 50W versus SLV's 18.9%, giving GLD room to extend while SLV has already paid the price of admission. SLV's relative strength at 4.8% in category terms versus GLD's -7.6% reflects exactly this: SLV is the tired leader, GLD is the fresh challenger with better macro sponsorship.
Precious Metals earned the second 10% allocation slot with a 71.0 category score, reflecting disinflation regime support (+8 on the descriptor checklist) and an active monetary-hedge-bid descriptor (+14) that pushes category macro fit to 81.0/100. The metals category benefits from defensive rotation (+7) and disinflation pressure (+6), creating a rare confluence where multiple macro vectors align in favor of gold and silver holdings. GLD's oversold-turn-up stochastic and bearish-weakening MACD may seem contradictory, but they actually signal that the immediate panic sell-off is complete and institutional buyers are re-entering—the timing score of 84.0 confirms this narrative. The thin participation (0.67x volume) means that further moves will carry momentum if the setup holds. GLD's lower relative strength versus SPY (2.7%) is a feature, not a bug, in a disinflation regime where non-correlated assets outperform; the 15.3% downside buffer to support provides real risk management.
Utilities & Infrastructure — XLU
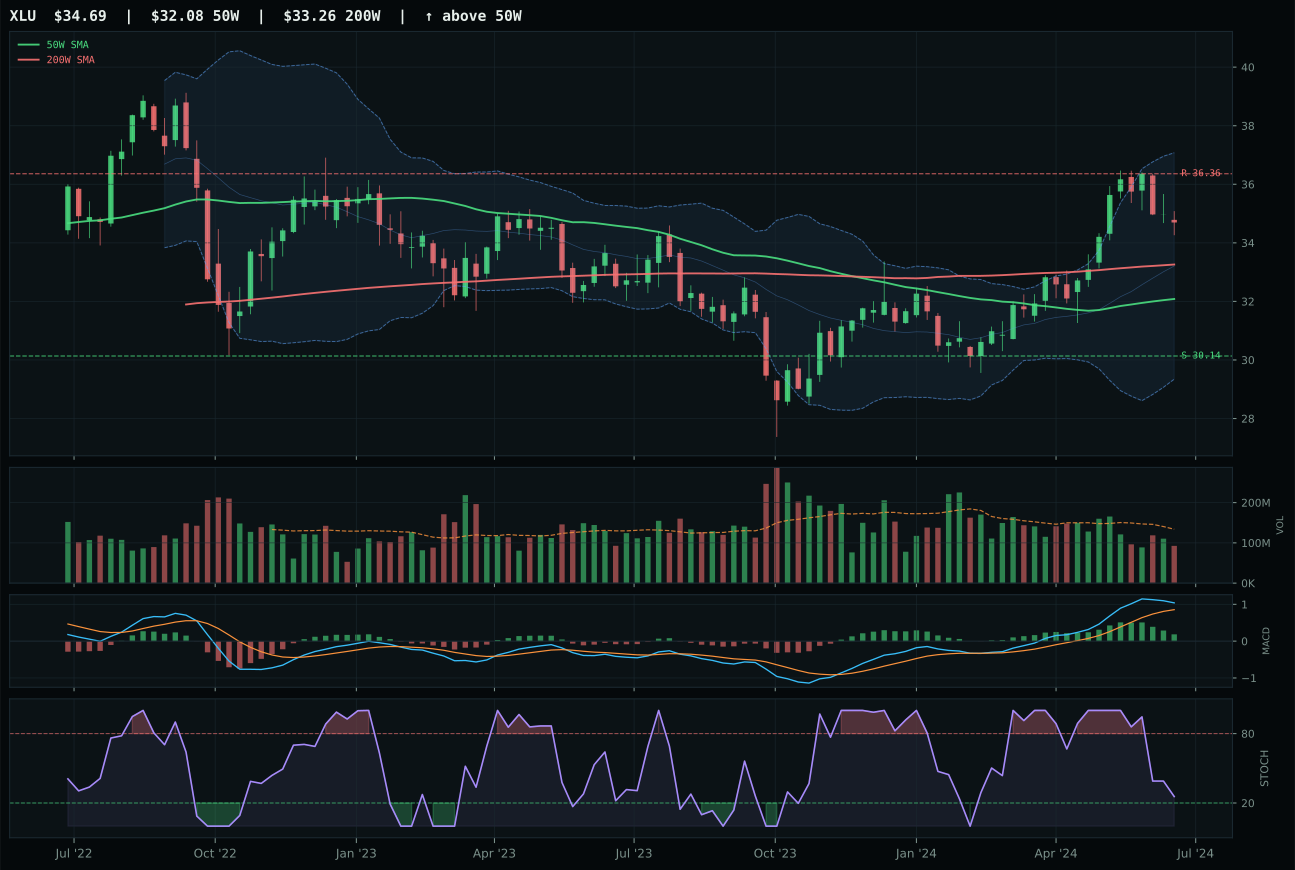
XLU has a neutral structure profile with 4.2% 13-week relative strength versus SPY.
A failed hold above support would weaken the setup.
Actionable but governed by invalidation levels.
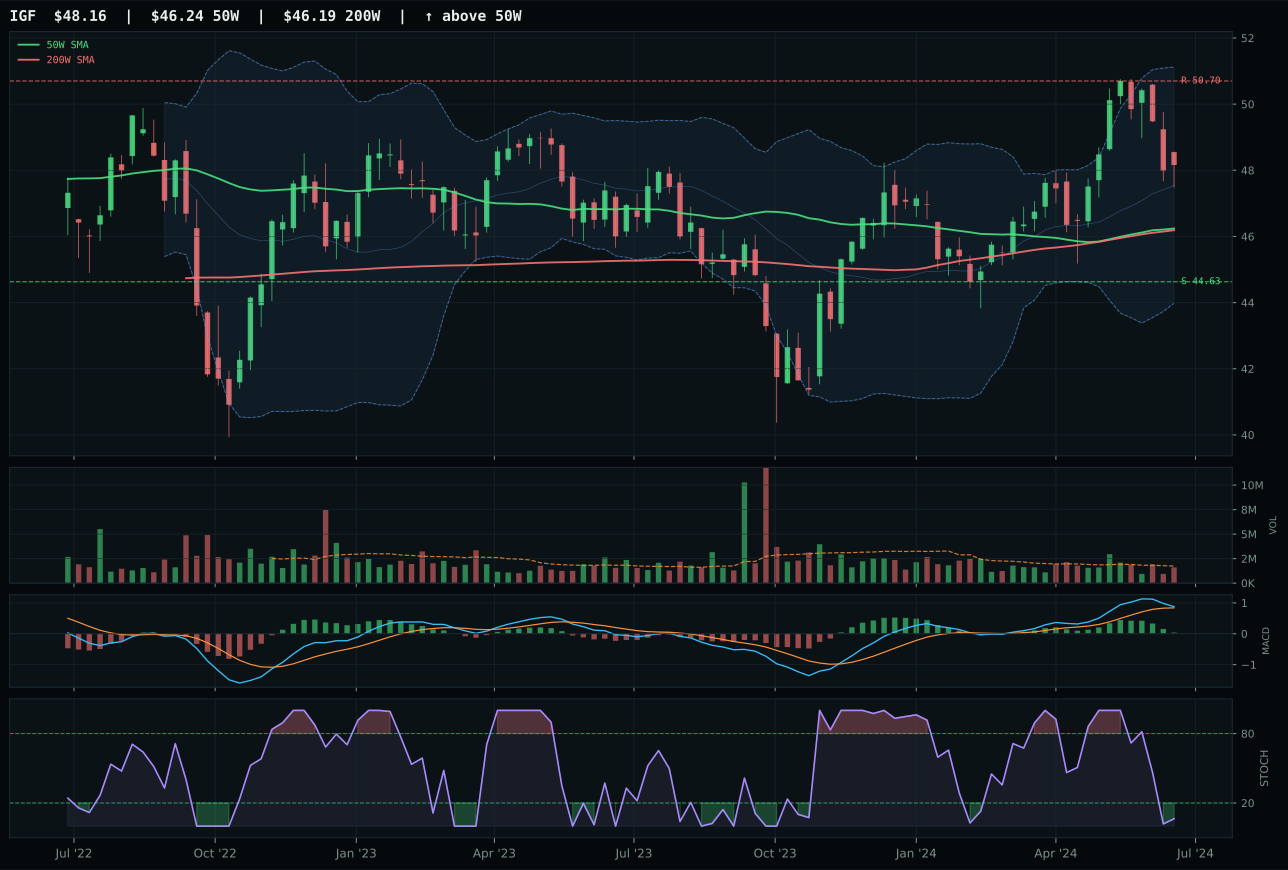
IGF has a neutral structure profile with -1.5% 13-week relative strength versus SPY.
A failed hold above support would weaken the setup.
Actionable but governed by invalidation levels.
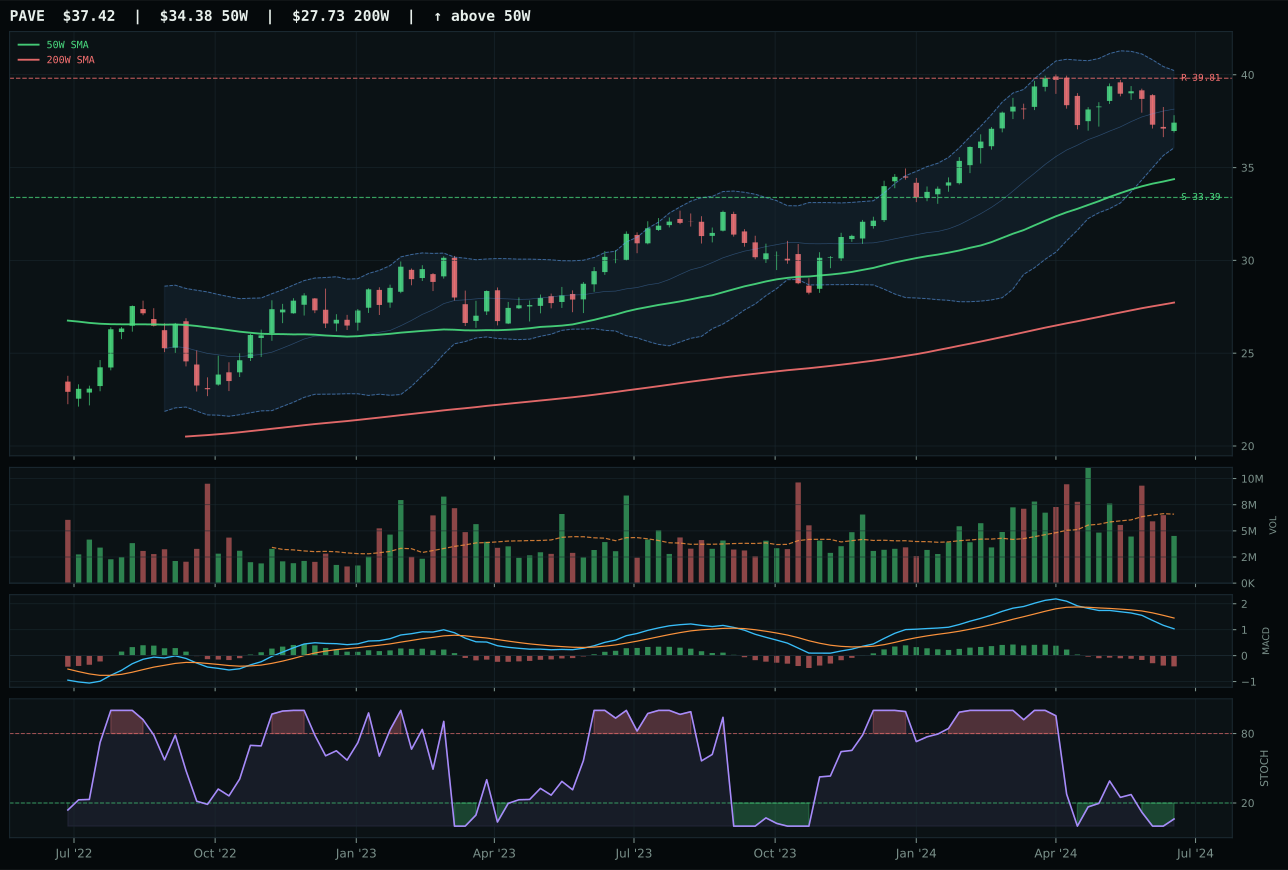
PAVE has a neutral structure profile with -9.4% 13-week relative strength versus SPY.
A failed hold above support would weaken the setup.
Actionable but governed by invalidation levels.
XLU secured top-2 status by delivering the cleanest defensive setup in a disinflation environment: perfect 100.0 trend score with price above both moving averages and 0.1% 50W slope stability, combined with 70.0 timing score that reflects 8.1% distance to the 50W and bullish-but-flattening MACD with falling RSI at 0.26. Category-relative strength at 5.6% versus IGF's 0.0% confirms the market selected regulated utilities over broad infrastructure, a preference that makes sense when rates are falling and long-duration cash flows become premium assets. Structure at 73.1 narrowly bests IGF at 71.0, but volume participation at 69.1 confirmation versus 60.0 means XLU's accumulation is fresher and more deliberate. The 2.0-point gap reflects XLU's superior positioning at the inflection point where disinflation benefits utilities most—rising relative value as duration plays when risk appetite stalls.
Utilities & Infrastructure earned the first 10% allocation slot with a 62.8 category score, ranking second only to Precious Metals. The category macro fit of 74.0/100 reflects powerful defensive-rotation tailwind (+12 points), disinflation pressure (+6), and Transition/Mixed macro regime support (+4)—a rare convergence where rates, sentiment, and infrastructure narratives align. XLU's 70.0/100 timing score and non-extended positioning (only 8.1% above the 50W) mean entry risk is minimal compared to growth sectors struggling with stretched valuations. The 50.5 risk-reward (4.6% upside, 15.1% downside) offers the defensive positioning the portfolio needs without giving up all return potential. Near-term momentum may be flattening (bullish-but-flattening MACD), but the structurally low rates environment, corporate dividend resilience, and disinflation tailwinds all support a 10% allocation as a core defensive anchor. A close below 30.14 support would suggest defensive flows have exhausted themselves; above 36.36 resistance would warrant holding through momentum confirmation.
AI — SMH
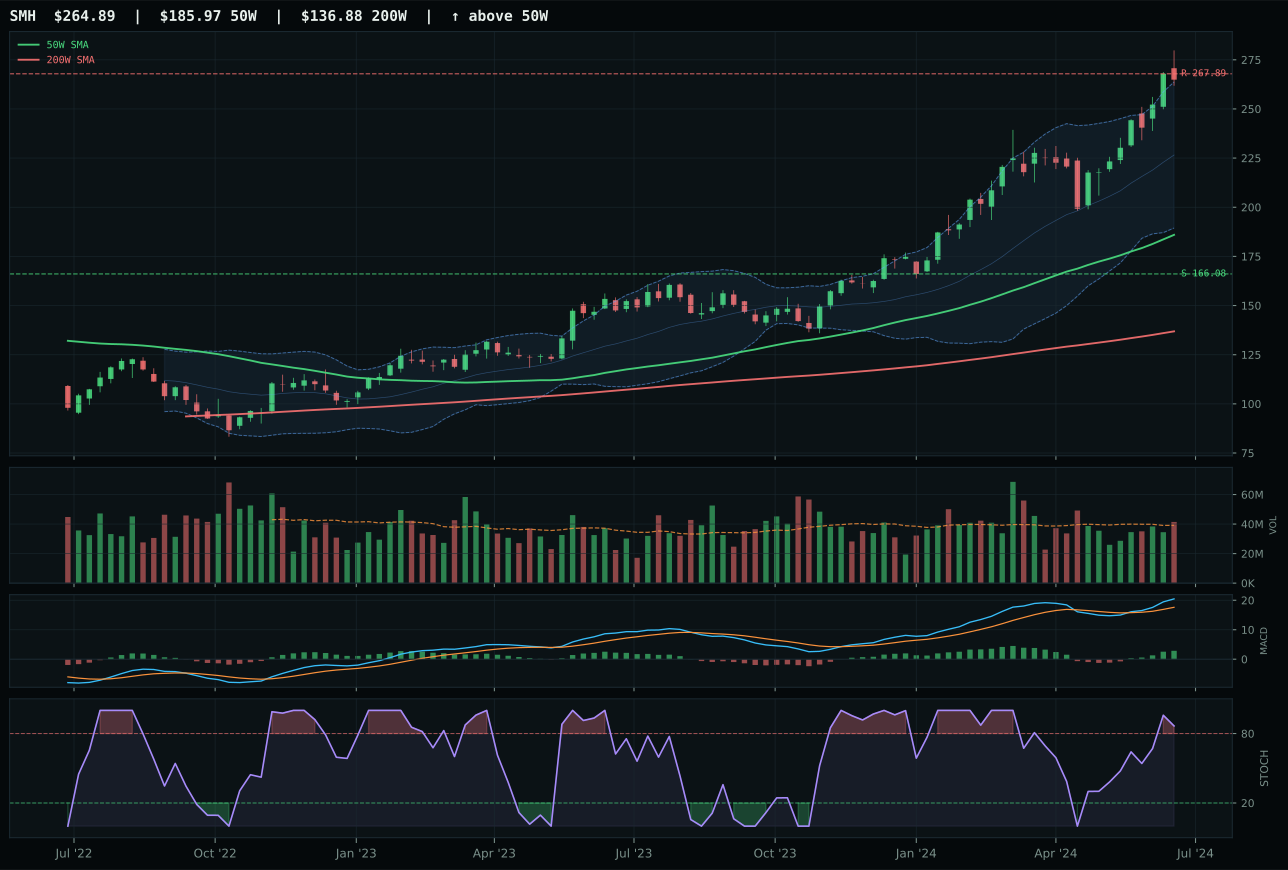
SMH has a vertical extension profile with 11.9% 13-week relative strength versus SPY.
A failed hold above support would weaken the setup.
Actionable but governed by invalidation levels.
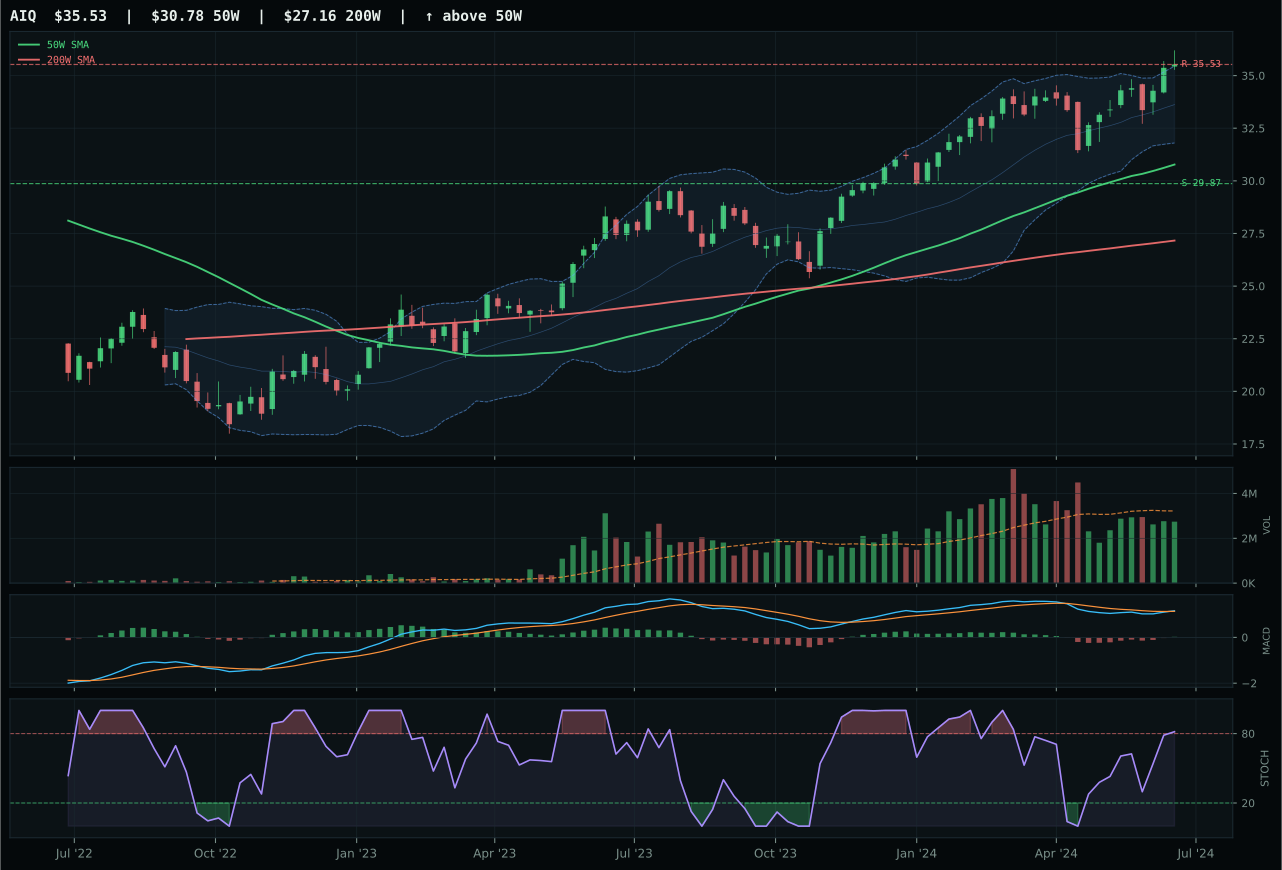
AIQ has a vertical extension profile with -0.0% 13-week relative strength versus SPY.
A failed hold above support would weaken the setup.
Actionable but governed by invalidation levels.
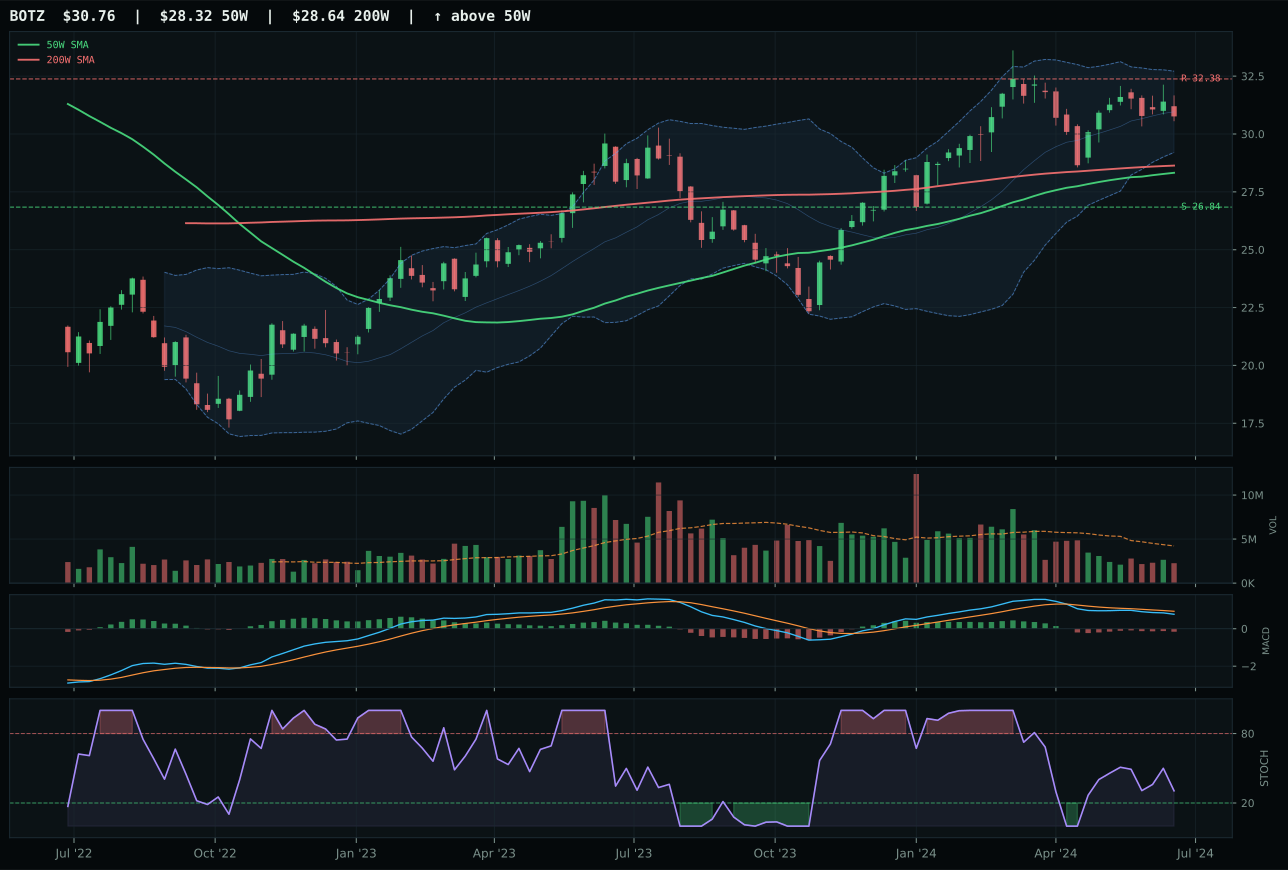
BOTZ has a neutral structure profile with -8.8% 13-week relative strength versus SPY.
A failed hold above support would weaken the setup.
Actionable but governed by invalidation levels.
SMH dominates through the pure force of category-relative leadership: 11.9% RS versus the median and 11.9% RS versus SPY, matched by 16.4% thirteen-week returns that far exceed AIQ's 4.5%. The semiconductor compute narrative is crystallized in the numbers—AIQ's failure was a timing score of 37.0 versus SMH's 45.0, meaning SMH sits in a cleaner Fibonacci zone with better risk/reward setup despite being 42.4% extended from the 50W. Volume is neutral on both, MACD bullish on both, but SMH's stochastic at 0.87 versus AIQ's identical overbought state means SMH has fresher momentum; AIQ's category-relative strength at 0.0% says the market chose the semiconductor play, not the software one. The 0.8-point final score gap masks a clean technical victory.
AI's 57.2 score placed it fourth in the rankings, behind top-2 categories and both Industrial Metals and Nuclear Energy, earning a modest 5% slot. The disinflation regime actually helps AI technicals at the margin (macro fit 59.0/100)—lower rates ease growth-stock financing costs—but the active AI-growth-sponsorship descriptor (+14 points) can't offset the macro tensions from liquidity stress (-12) and credit stress (-8) that suppress risk appetite broadly. SMH's 42.4% extension above the 50W and negative risk-reward profile (upside -1.1% to resistance, downside 59.5% to support) create an asymmetric bet against the portfolio's core volatility budget. The position holds at 5% because semiconductor productivity gains are real and MACD confirmation is improving, but this is a tactical allocation, not a structural conviction. A pullback to the 50W compression zone (around 166.08) or a break above 267.89 resistance would be the test.
Technology — XLK
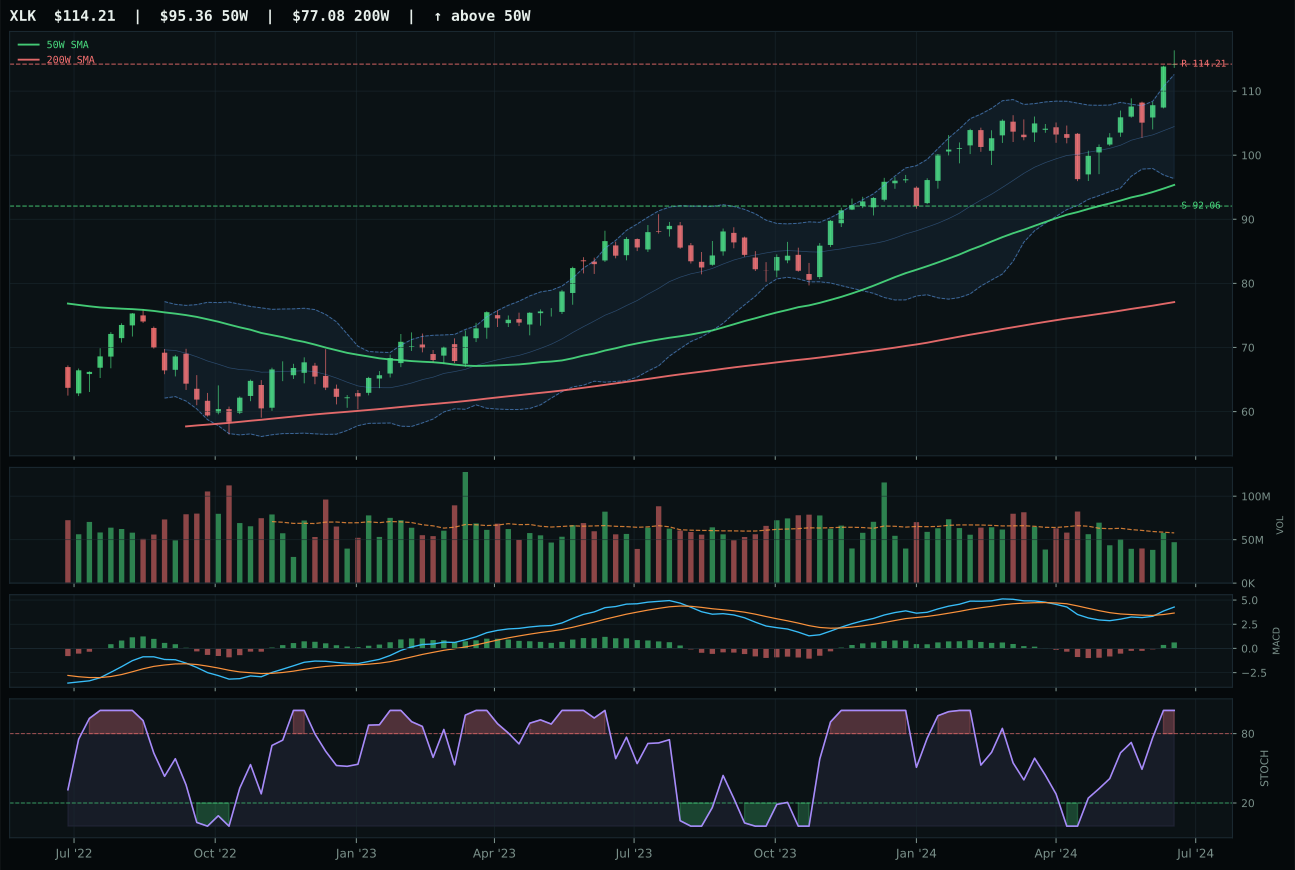
XLK has a vertical extension profile with 4.3% 13-week relative strength versus SPY.
A failed hold above support would weaken the setup.
Actionable but governed by invalidation levels.
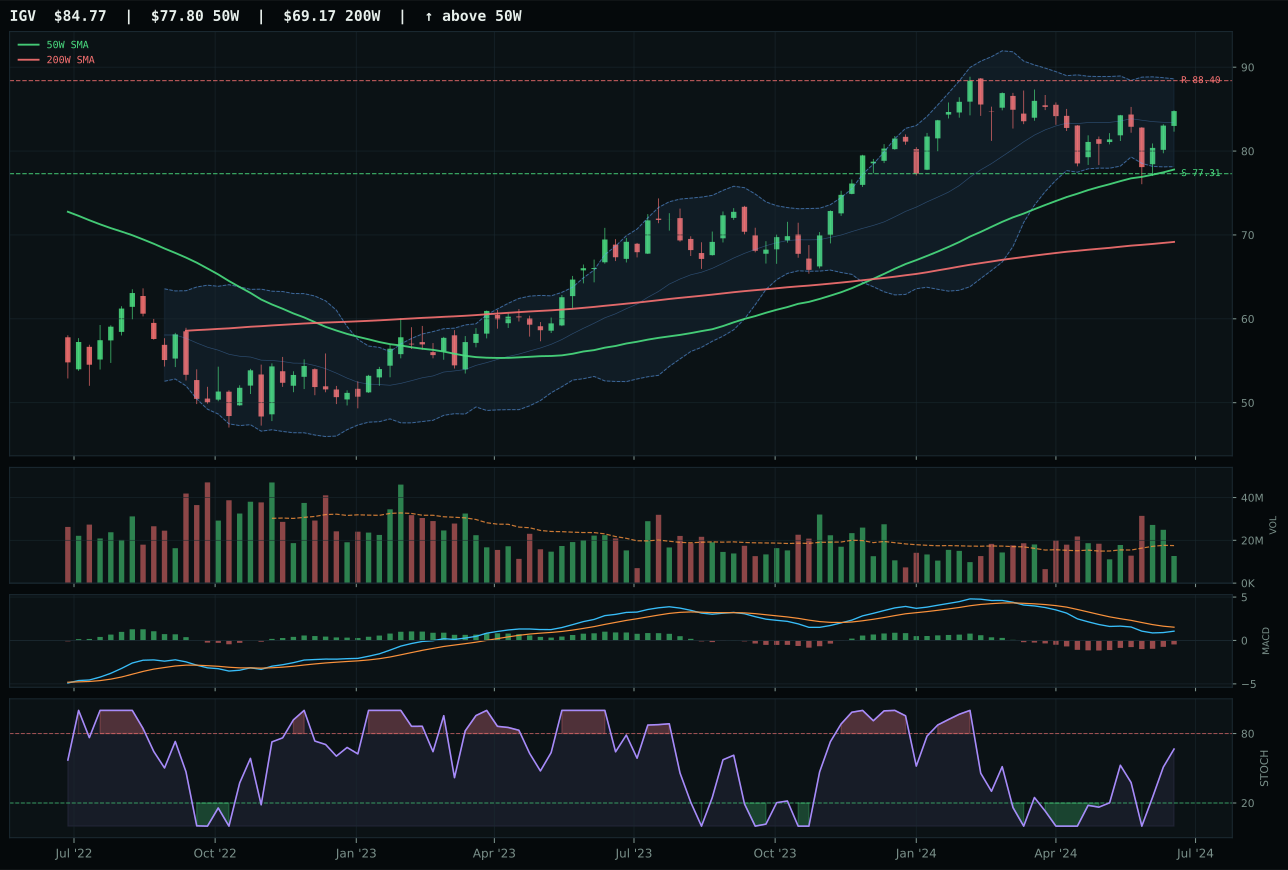
IGV has a neutral structure profile with -5.9% 13-week relative strength versus SPY.
A failed hold above support would weaken the setup.
Actionable but governed by invalidation levels.
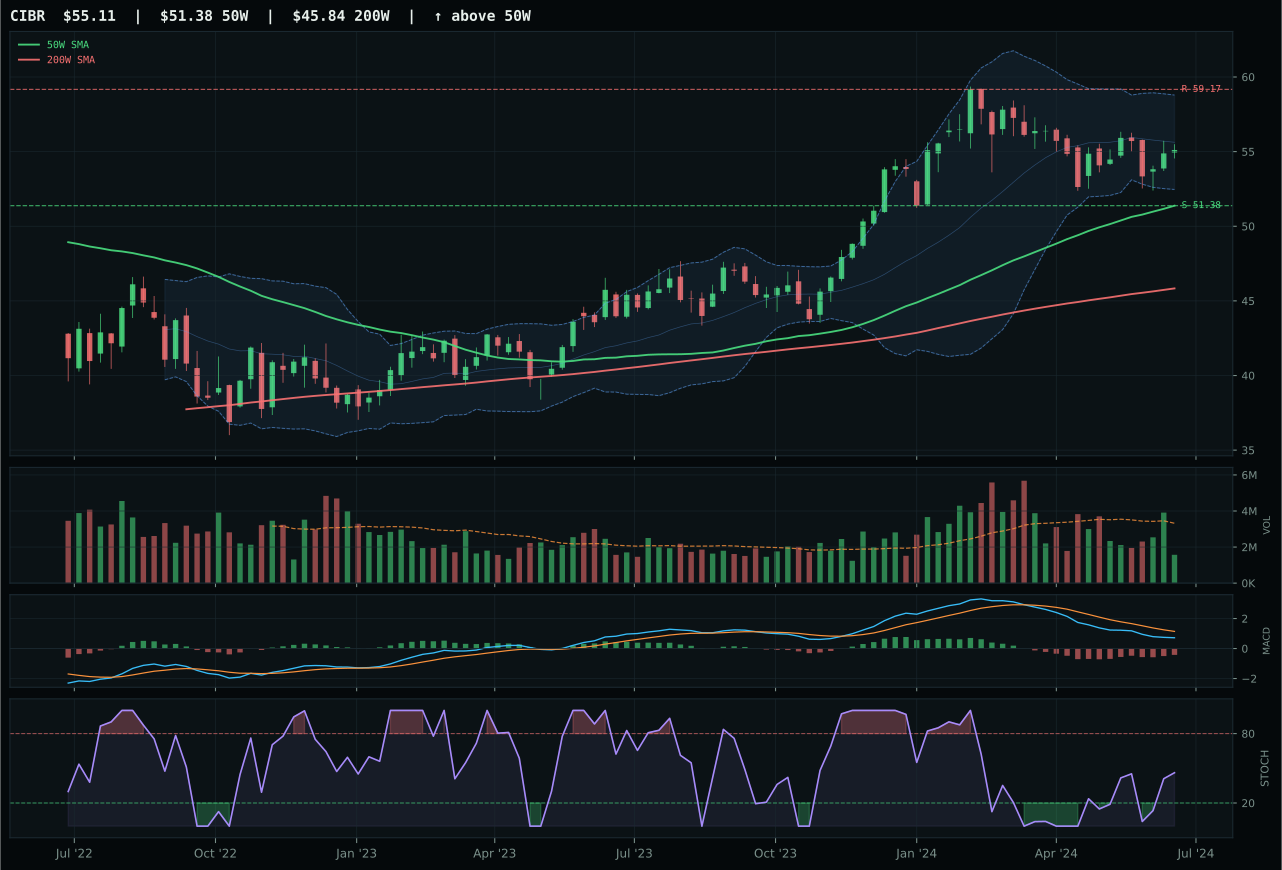
CIBR has a neutral structure profile with -6.7% 13-week relative strength versus SPY.
A failed hold above support would weaken the setup.
Actionable but governed by invalidation levels.
XLK seized the category by combining price strength above both moving averages with neutral volume confirmation, a setup that typically rewards early accumulation. The 10.2% relative strength advantage over IGV reflects buyers willing to chase the name despite XLK sitting 19.8% extended from its 50-week line—a penalty that cuts both ways, as it shows demand is real even at stretched valuations. MACD bullish and improving versus IGV's bearish posture, coupled with XLK's 8.8% thirteen-week return against IGV's -1.4%, makes the winner's technical case obvious: this is profitable technology leadership with legs, not a late-cycle bounce. The 2.1-point score gap leaves no ambiguity.
Technology earned just 5% despite XLK's solid setup because the category's 54.7 final score ranked third among eligible opportunities this week, well behind Precious Metals (71.0) and Utilities (62.8). The macro tailwind from active risk-appetite-positive and AI-growth-sponsorship descriptors helped—Technology's category-level macro fit reached 60.0/100—but disinflation actually penalizes duration-sensitive growth stocks and the liquidity stress backdrop (-10 points) remains a structural headwind. Entry timing also matters: at 19.8% above the 50W, XLK's extension means every new buyer from here is paying for past performance, not accumulating weakness. Holding the position makes sense because relative strength remains positive and the allocator already committed to tech exposure through the crypto sleeve; moving to zero would be reactive. Watch for XLK to either consolidate back toward the 50W or accelerate above 107.67 resistance to justify a higher allocation.
Nuclear Energy — NLR
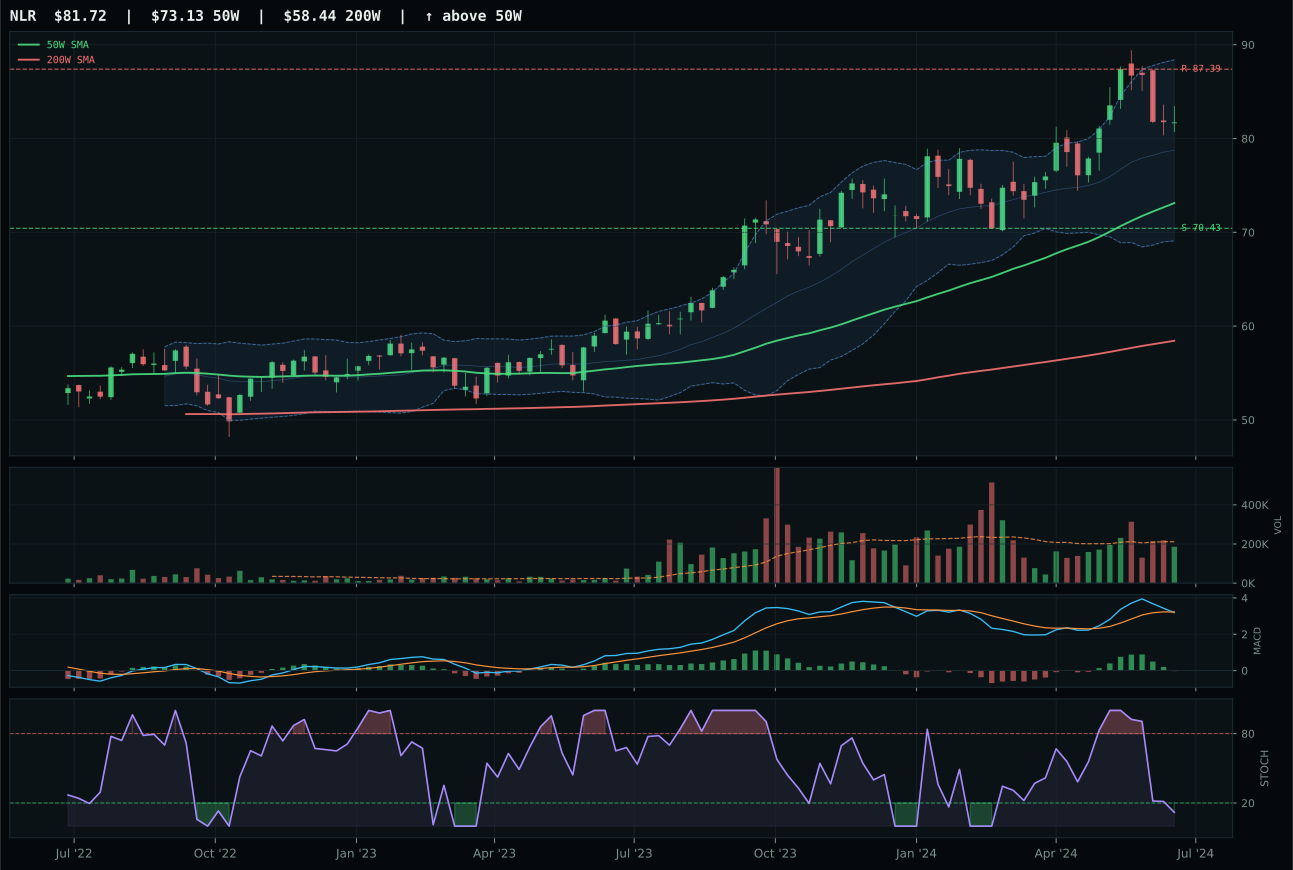
NLR has a neutral structure profile with 4.0% 13-week relative strength versus SPY.
A failed hold above support would weaken the setup.
Actionable but governed by invalidation levels.
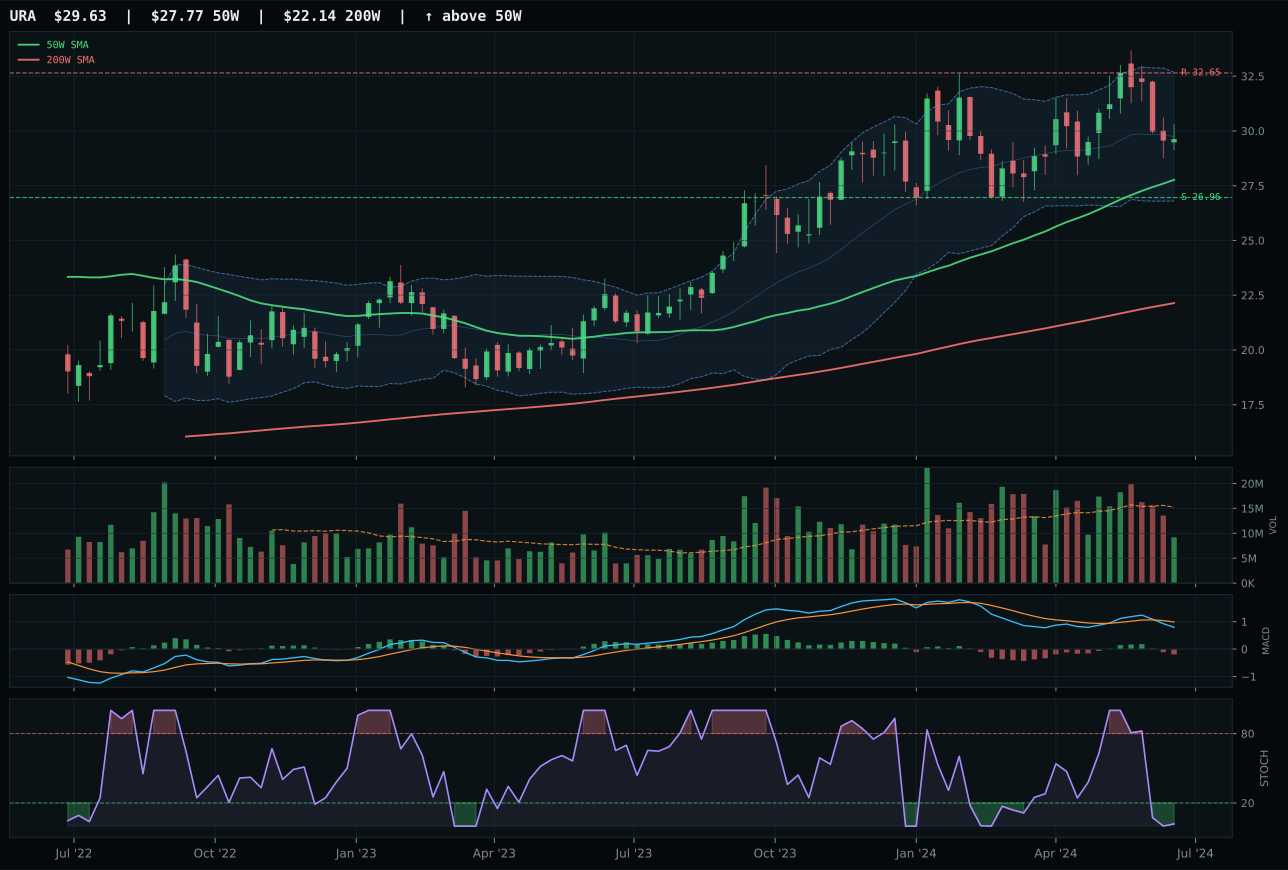
URA has a neutral structure profile with -1.8% 13-week relative strength versus SPY.
A failed hold above support would weaken the setup.
Actionable but governed by invalidation levels.
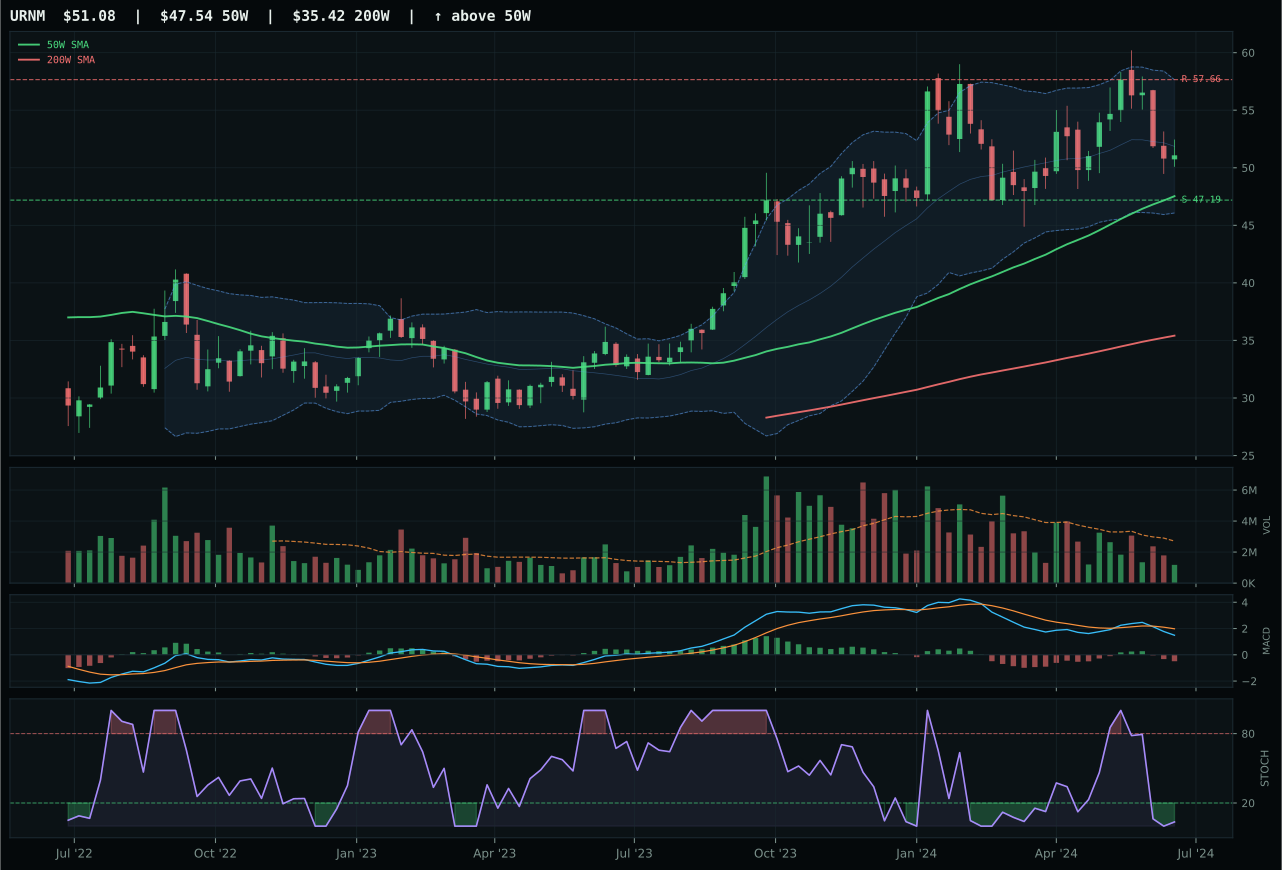
URNM has a neutral structure profile with -1.6% 13-week relative strength versus SPY.
A failed hold above support would weaken the setup.
Actionable but governed by invalidation levels.
NLR won by combining superior category-relative strength (5.6% vs URA's -0.2%) with 8.5% thirteen-week returns that tripled URA's 2.7%. Structure at 70.8 beat URA's 69.3, cleanliness identical at 50.0 but NLR's neutral volume at 0.88x versus URA's thin participation (0.67x) meant accumulation was more genuine. Both charts post bearish MACD and oversold RSI at 0.12 and 0.09 respectively—repair setups with no momentum confirmation—yet NLR's trend score of 88.0 versus URA's 79.0 reveals NLR is above both moving averages with superior slope, while URA's lagging RS score reflects relative weakness. The 13.4-point final score gap (46.5 vs 33.1) masks a near-identical technical setup; NLR's edge is pure relative strength sustainability within the category, signaling market confidence in nuclear utilities over broad uranium.
Nuclear Energy earned 5% with a 46.5 score, ranking fifth among ten categories. The category macro fit of 50.0/100 is neutral because real-asset-sponsorship descriptors (+7) barely offset liquidity stress (-7) and credit stress (-5), leaving NLR dependent on technicals alone. However, the defensive-rotation narrative (+6) and AI-growth-sponsorship (+5) combine to justify holding exposure: utilities benefit from both disinflation tailwinds and the power-consumption explosion from AI infrastructure. NLR's 52.3 risk-reward (6.5% upside to resistance, 16.0% downside to support) offers reasonable asymmetry if the defensive-rotation theme persists. The bearish-weakening MACD is a caution flag; a break below 70.43 support would warrant exiting, while sustained closes above 87.39 resistance would signal momentum shift. For now, 5% is appropriate tactical positioning in a regime where quality and predictability outweigh growth.
Defense & Aerospace — ITA
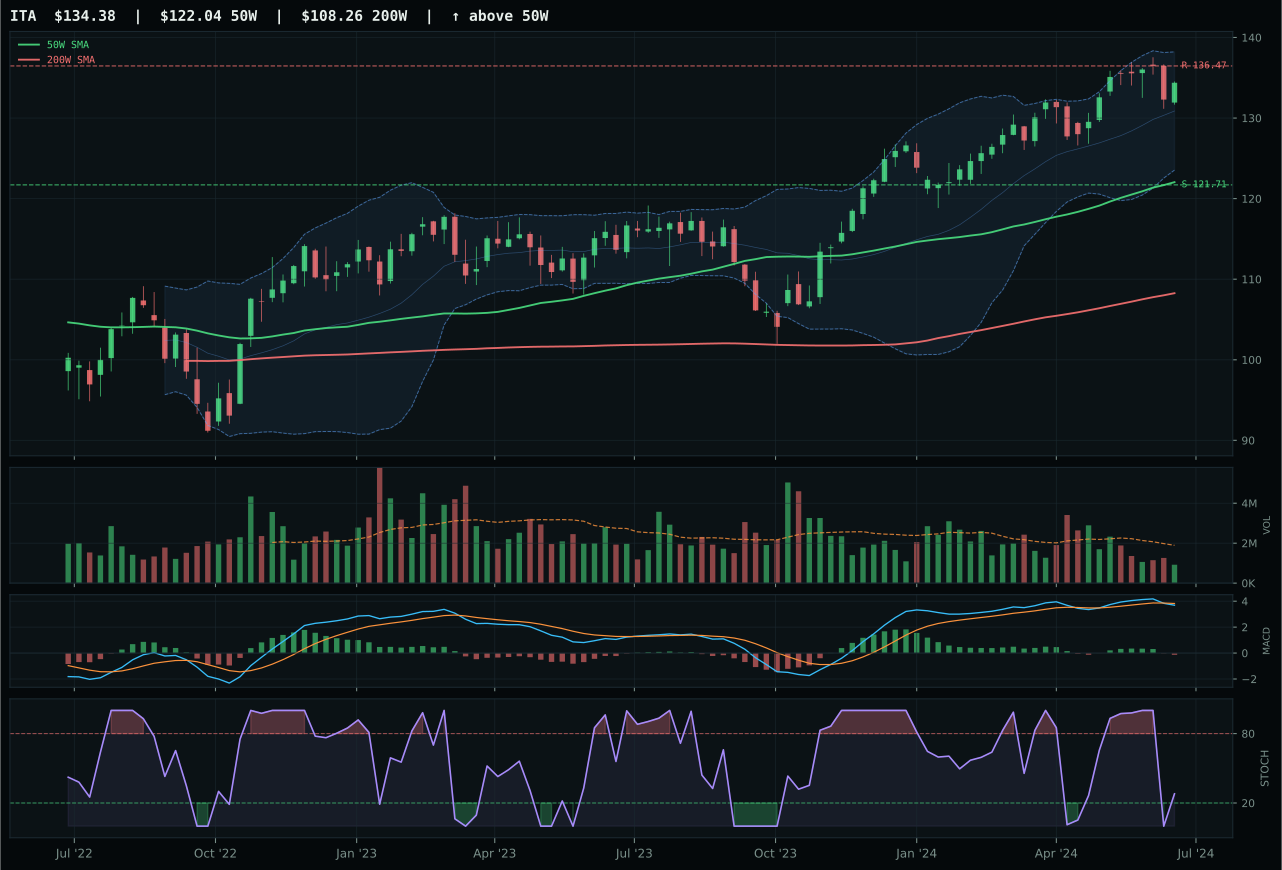
ITA has a neutral structure profile with -1.2% 13-week relative strength versus SPY.
A failed hold above support would weaken the setup.
Actionable but governed by invalidation levels.
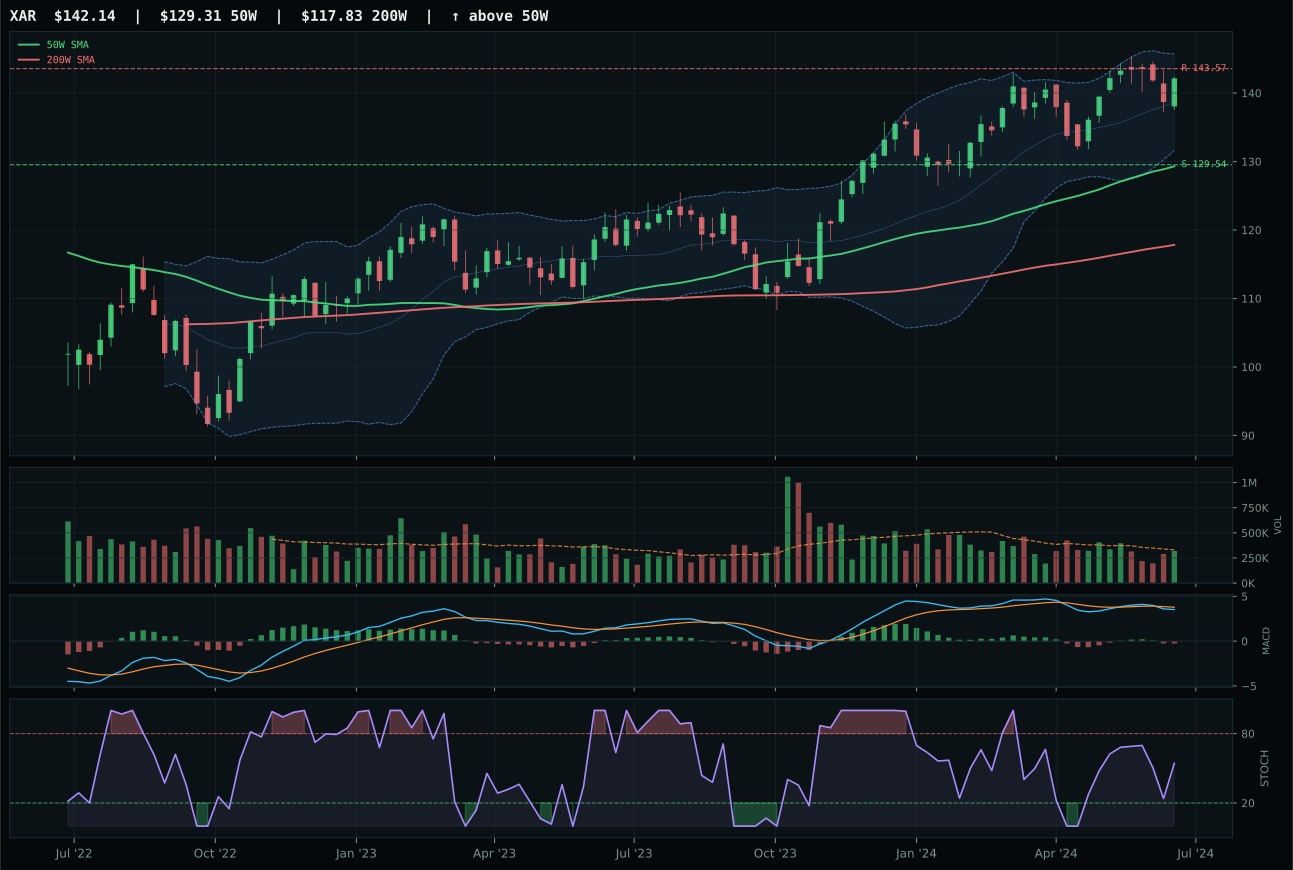
XAR has a neutral structure profile with -1.9% 13-week relative strength versus SPY.
A failed hold above support would weaken the setup.
Actionable but governed by invalidation levels.
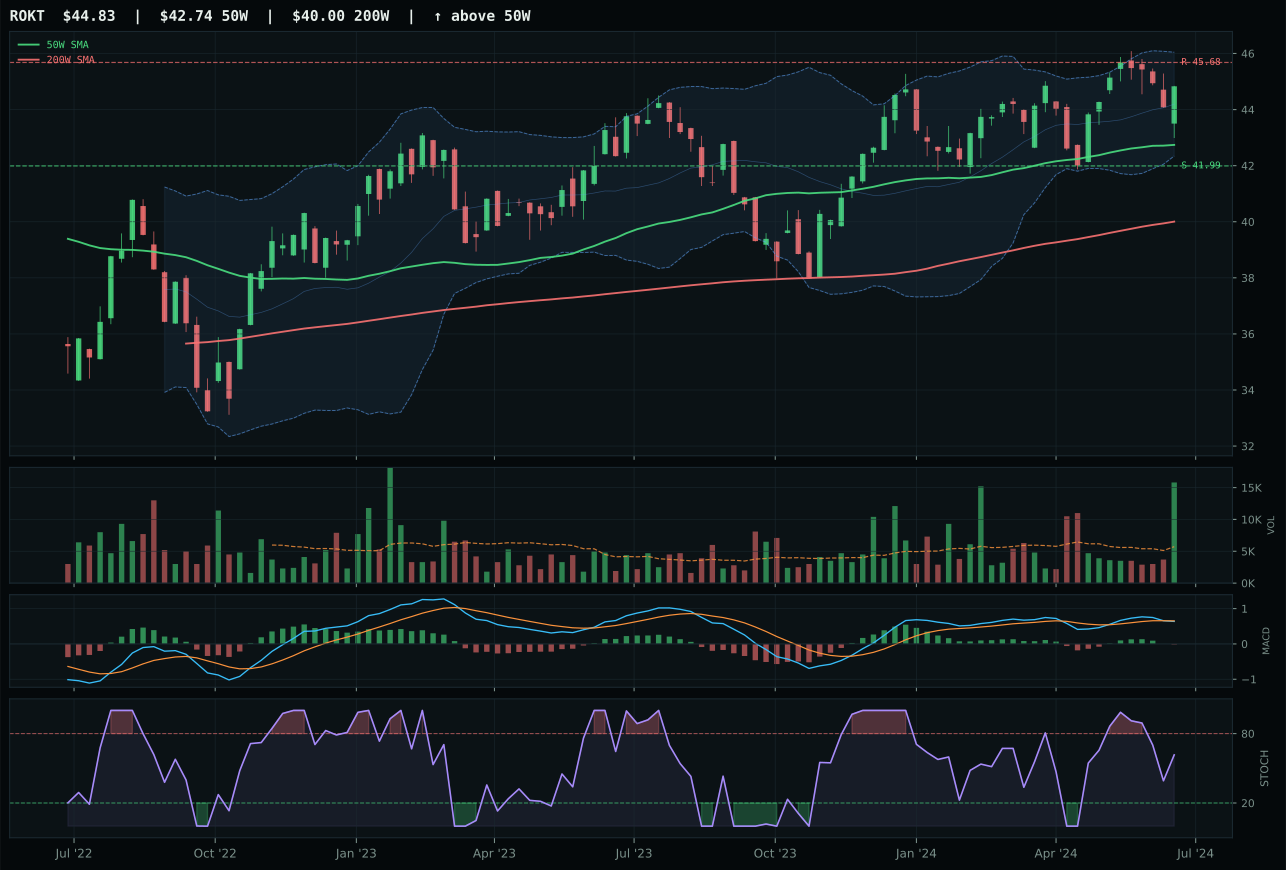
ROKT has a neutral structure profile with -2.9% 13-week relative strength versus SPY.
A failed hold above support would weaken the setup.
Tracked, but not top-2 eligible because: .
ITA won a tight race by posting 39.6 on risk/reward versus XAR's 38.8 and neutral structure with 75.0 cleanliness score that edged XAR's 75.3. Neither setup excites; both sit in compression near support with bearish MACD and falling RSI, but ITA's 0.8% category-relative strength and 3.3% thirteen-week return gave it the nod over XAR at 2.5% and 0.0% relative strength. This is not a clean category decision—the 0.3-point gap reveals how weak the entire Defense & Aerospace complex has become. Volume confirmation is thin at 0.49x for ITA, MACD is weakening, and the stochastic RSI sitting at 0.28 signals repair, not momentum. XAR's neutral volume at least matched ITA's price action more honestly, but category-relative strength in disinflation is the tiebreaker when trend has already departed.
Defense & Aerospace ranked seventh with a 41.8 final score, earning 5% allocation purely on relative merit within a weak field. The category macro fit of 59.0/100 masks real structural problems: disinflation pressure (-8 on the descriptor scale) works against defense spending narratives, and while defensive-rotation sentiment is live (+8), it cannot offset the technical reality that both ITA and XAR sit near resistance with deteriorating momentum. The thin participation and weak breadth suggest institutional attention is elsewhere. Holding 5% is appropriate because the technical setup offers defined risk into support at 121.71, and macro uncertainty could still spur defensive flows; however, this is a placeholder position. Any break below 121.71 support would justify trimming to 0%, and conversely, a sustained close above 136.47 resistance paired with volume confirmation would warrant rotating capital into the position.
Industrial Metals — COPX
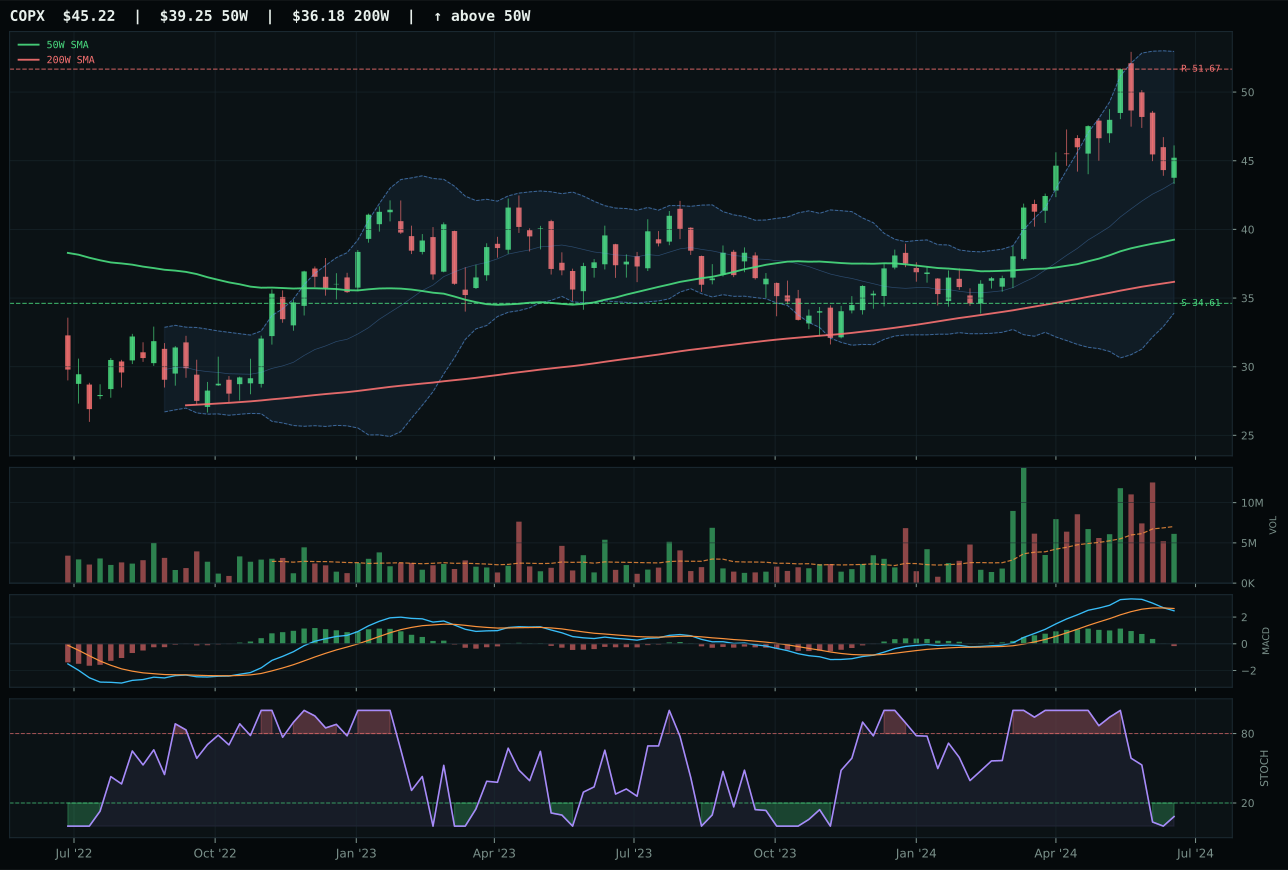
COPX has a vertical extension profile with 5.0% 13-week relative strength versus SPY.
A failed hold above support would weaken the setup.
Actionable but governed by invalidation levels.
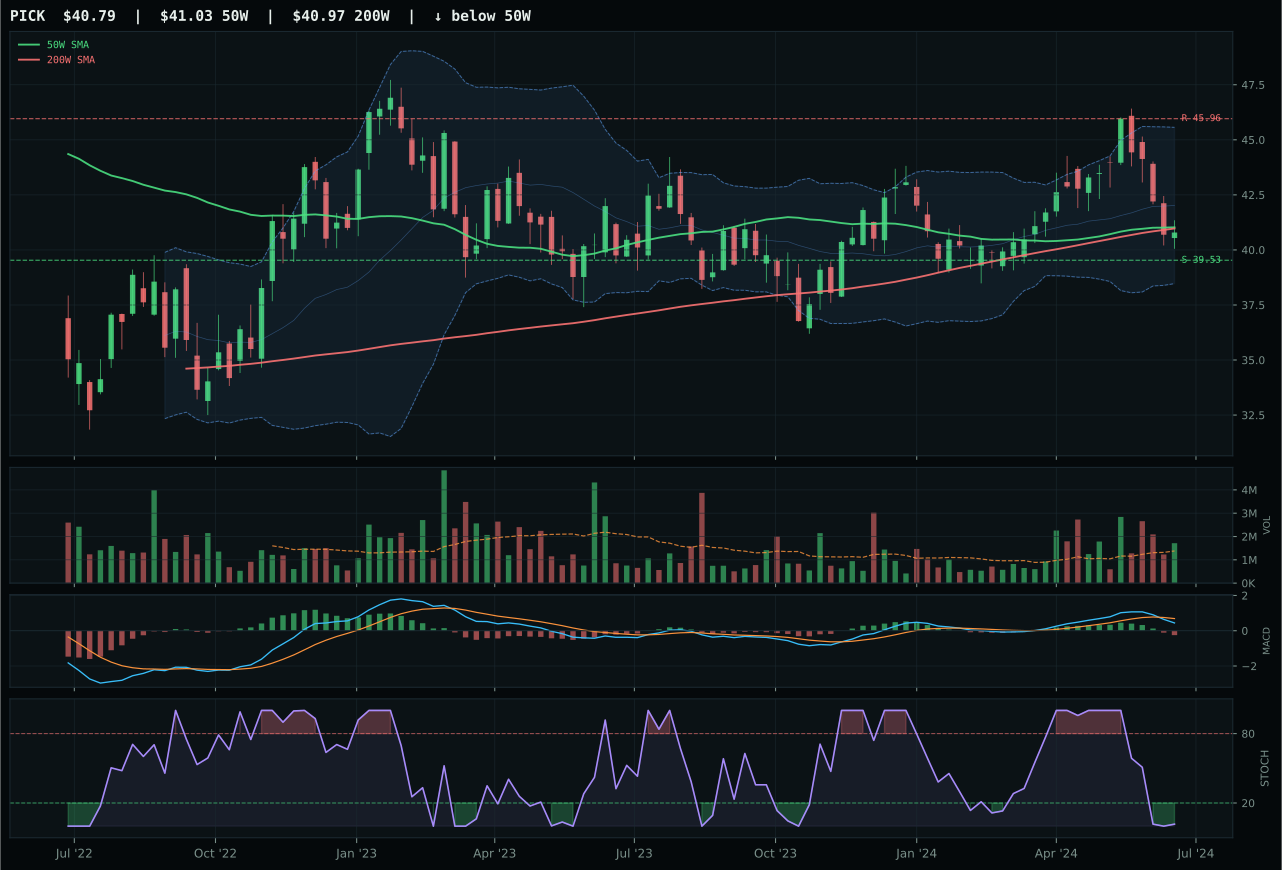
PICK has a pullback into support profile with -5.2% 13-week relative strength versus SPY.
A failed hold above support would weaken the setup.
Actionable but governed by invalidation levels.
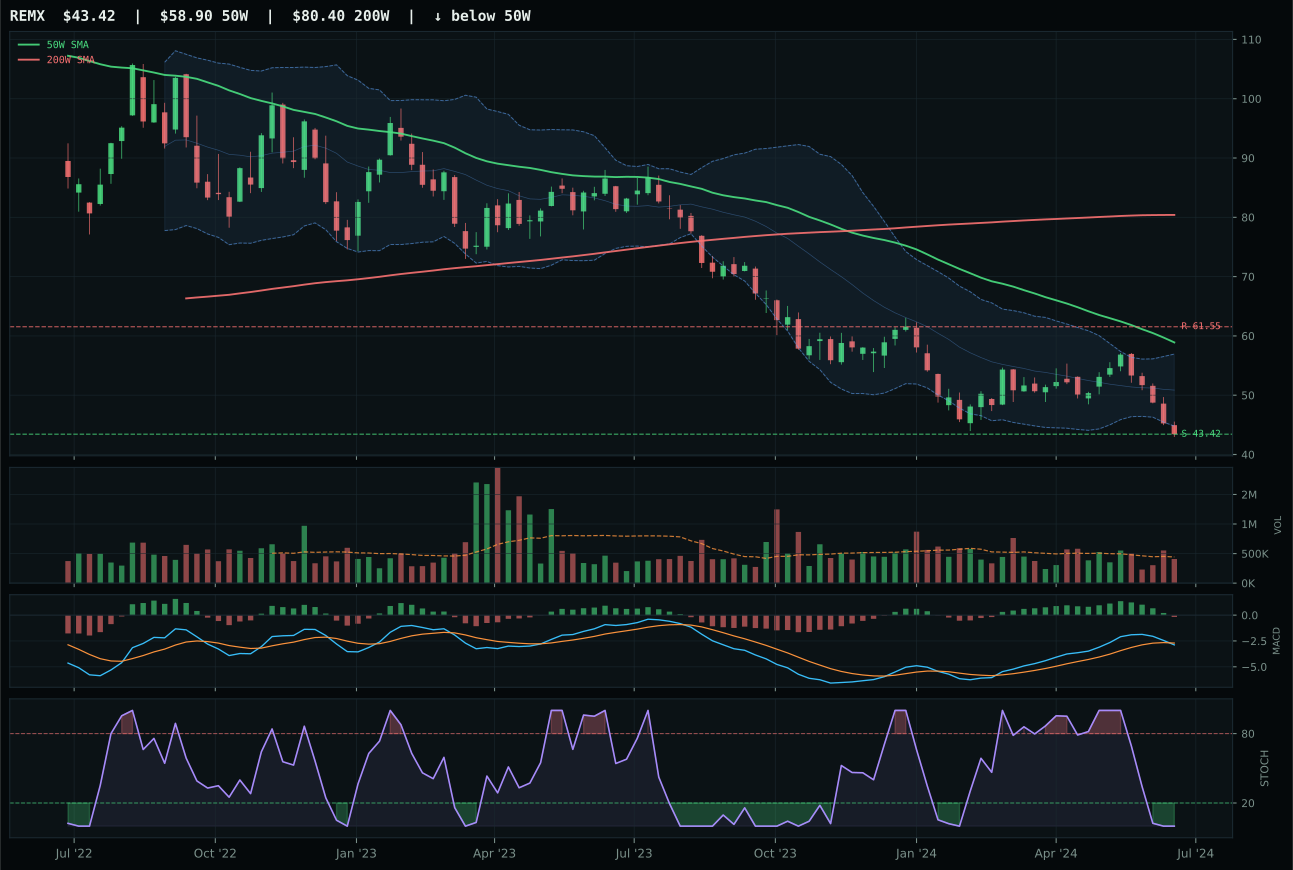
REMX has a pullback into support profile with -18.8% 13-week relative strength versus SPY.
Extension and support failure are the main tactical risks.
Tracked, but not top-2 eligible because: structurally broken.
COPX won through category-relative strength dominance: 10.2% RS within the industrial metals basket versus PICK's 0.0%, combined with 9.5% thirteen-week returns and 5.0% SPY-relative strength that proved the copper/scarcity thesis was actually working. PICK at -5.2% SPY-relative strength and -0.7% thirteen-week returns reveals broad mining weakness, while COPX's vertical extension at 15.2% above the 50W shows concentrated capital chasing copper specifically. MACD is bearish/weakening on both, RSI oversold on both, yet COPX's neutral volume at 0.87x versus PICK's above-average participation suggests COPX accumulation is cleaner and less desperate. Timing at 48.0 for COPX versus a much stronger 95.0 for PICK illustrates the trade-off: PICK is closer to mean reversion from a retracement standpoint, but COPX owns the relative momentum that makes it the category representative.
Industrial Metals scored 38.1 and earned 5% allocation, ranking sixth among the ten categories. Metals-scarcity descriptors are live (+14 at the category level) and commodity-breadth positive delivers +10 points, creating a 65.0/100 macro fit that justifies holding exposure despite weak technicals. Disinflation normally hurts industrial commodities, but the active scarcity narrative—particularly around copper for AI infrastructure buildout—offsets some directional headwind. COPX's 52.3 risk-reward profile (12.5% downside to support against 30.7% upside from current levels) offers asymmetric value if the scarcity story holds. However, the bearish-weakening MACD and thin 4W return (-7.1%) suggest near-term consolidation risk; this is a position to hold but not add into. A close below 34.61 support would trigger a reassessment, while a break above 51.67 resistance with MACD bullish cross would justify a rotation upward.
Emerging Markets — INDA
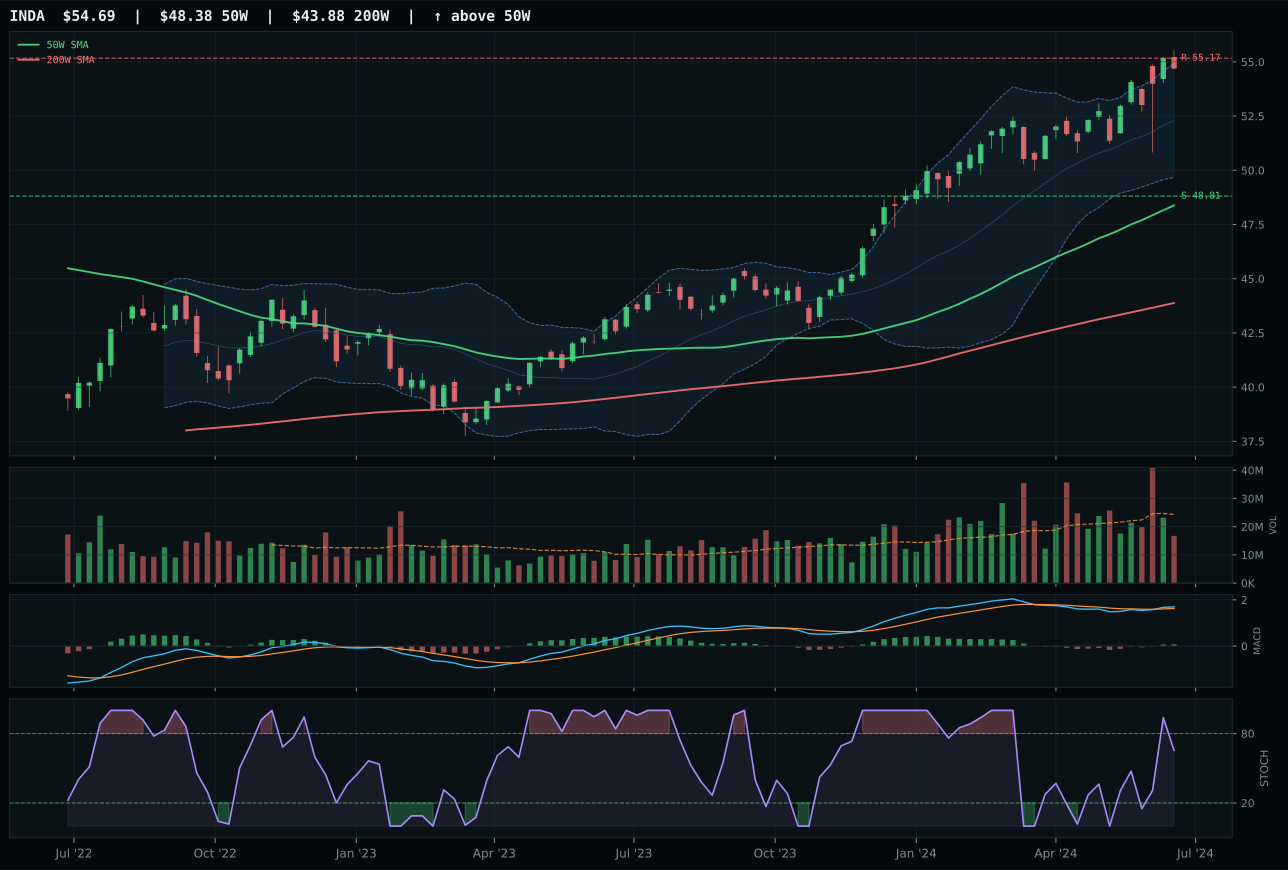
INDA has a neutral structure profile with 3.8% 13-week relative strength versus SPY.
A failed hold above support would weaken the setup.
Actionable but governed by invalidation levels.
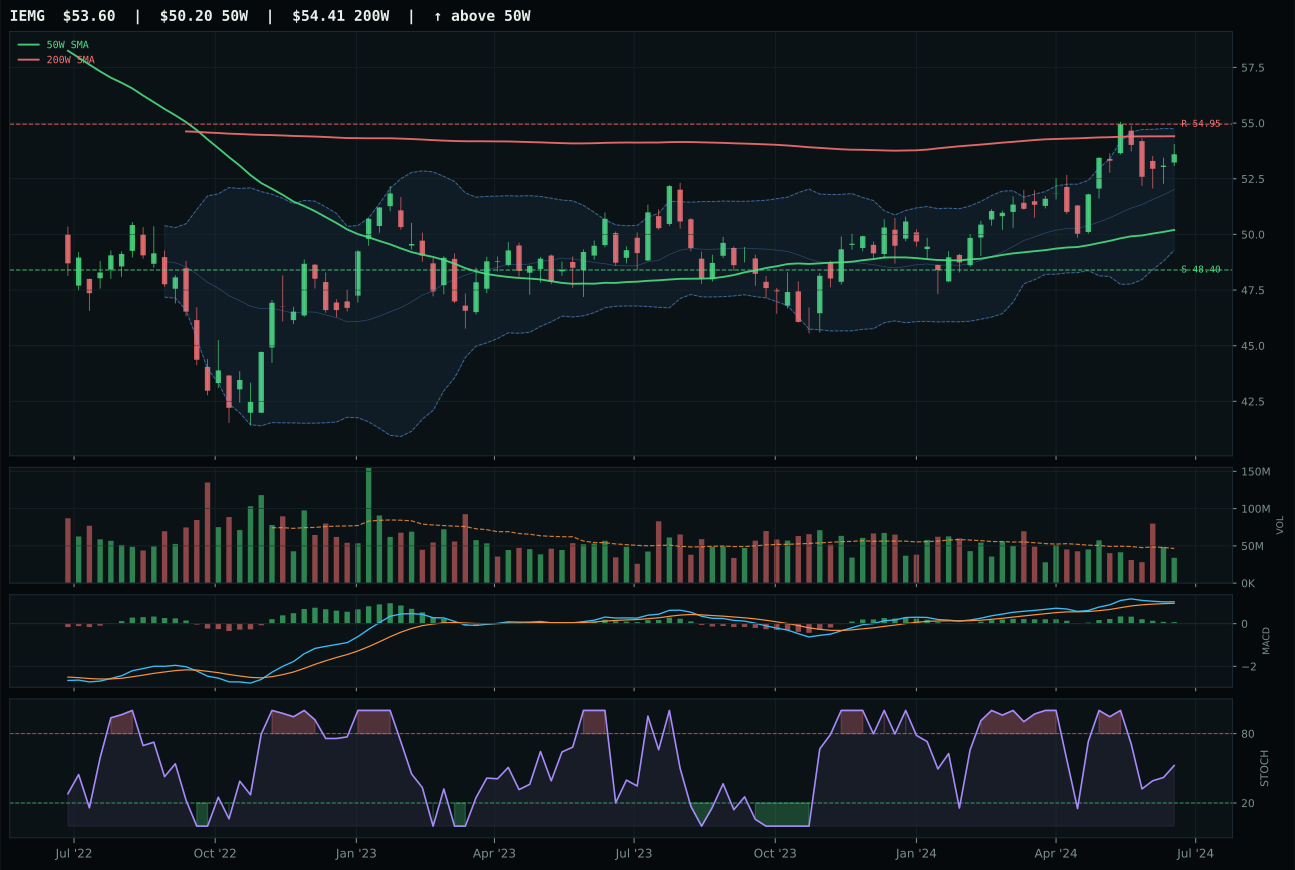
IEMG has a neutral structure profile with -0.0% 13-week relative strength versus SPY.
A failed hold above support would weaken the setup.
Actionable but governed by invalidation levels.
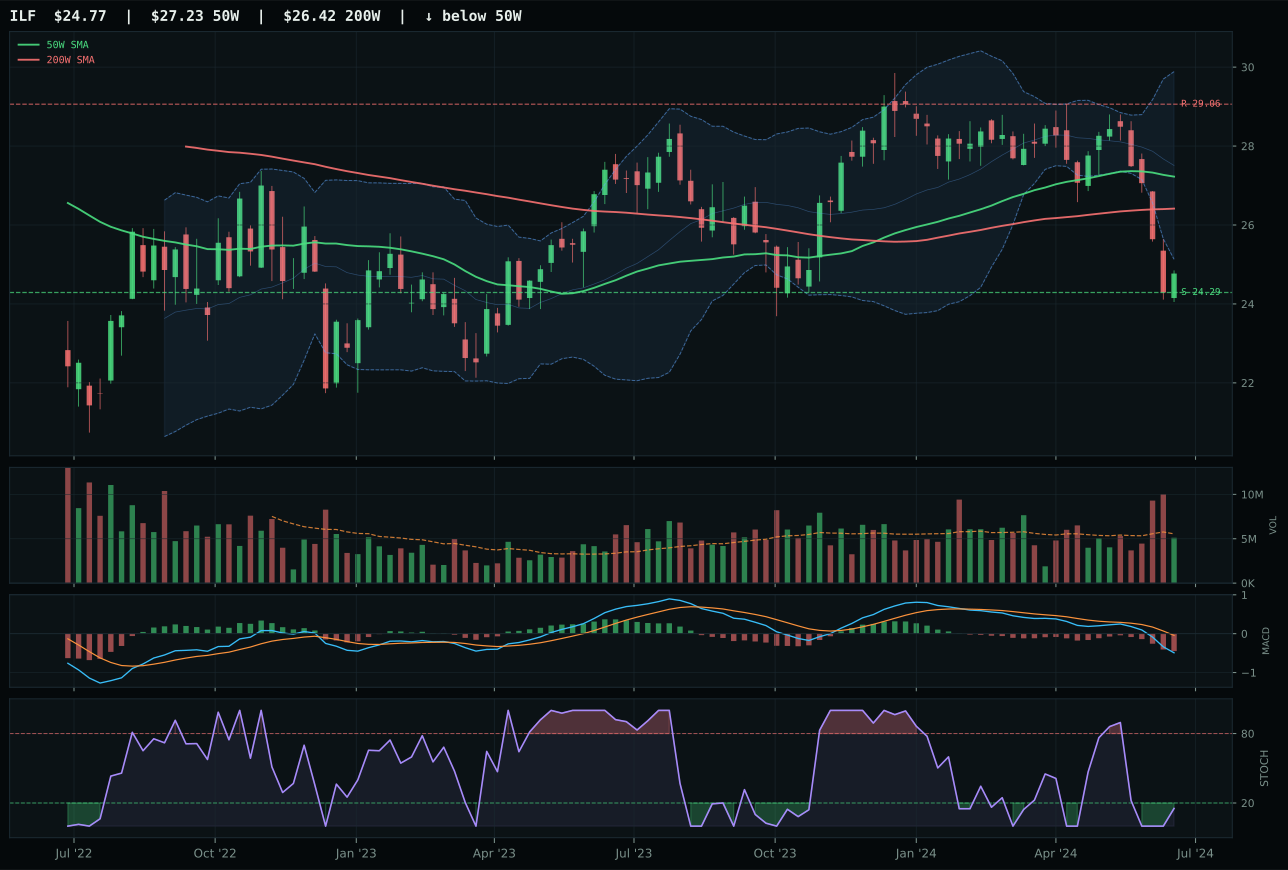
ILF has a pullback into support profile with -16.2% 13-week relative strength versus SPY.
A failed hold above support would weaken the setup.
Actionable but governed by invalidation levels.
INDA crushed IEMG through four technical vectors: trend score 100.0 versus 86.0 (perfect price alignment above both moving averages); momentum confirmation at 78.9 versus IEMG's 54.0 (driven by MACD bullish and improving versus bullish but flattening); category-relative strength at 3.9% versus 0.0%; and 8.3% thirteen-week returns versus 4.4%. Structure is virtually identical at 74.1 versus 73.9, but INDA's MACD upgrade status—improving versus flattening—signals fresh sponsorship, not exhaustion. Volume confirmation favors INDA at 71.5 versus 58.0 despite both showing thin participation, reflecting superior accumulation quality. The 8.0-point score gap (36.4 vs 28.4) reveals a category where India-focused quality exposure decisively outpaces broad emerging-market beta in a macro environment that privileges growth selectivity.
Emerging Markets scored 36.4 and earned 5% allocation, ranking eighth among ten categories. Category macro fit of only 38.0/100 reflects that credit stress (-10) and liquidity stress (-10) outweigh the modest risk-appetite-positive boost (+8), leaving the category dependent on technicals to justify positioning. INDA's 100.0 trend score and 78.9 momentum confirmation are standouts that overcame macro headwinds, but the 38.3 risk-reward (0.9% upside versus 12.0% downside) exposes the setup as extended into resistance. The active credit-stress descriptor suggests emerging-market credit spreads remain wide, which could reprice EM risk lower if any stress event occurs. Hold the 5% position because INDA's relative strength is genuine and the technicals remain constructive, but recognize this is a tactical play, not a structural conviction. A break below 48.81 support would justify trimming; conversely, sustained closes above 55.17 resistance would warrant a modest rotation upward if the macro environment stabilizes.
Agriculture & Livestock — MOO
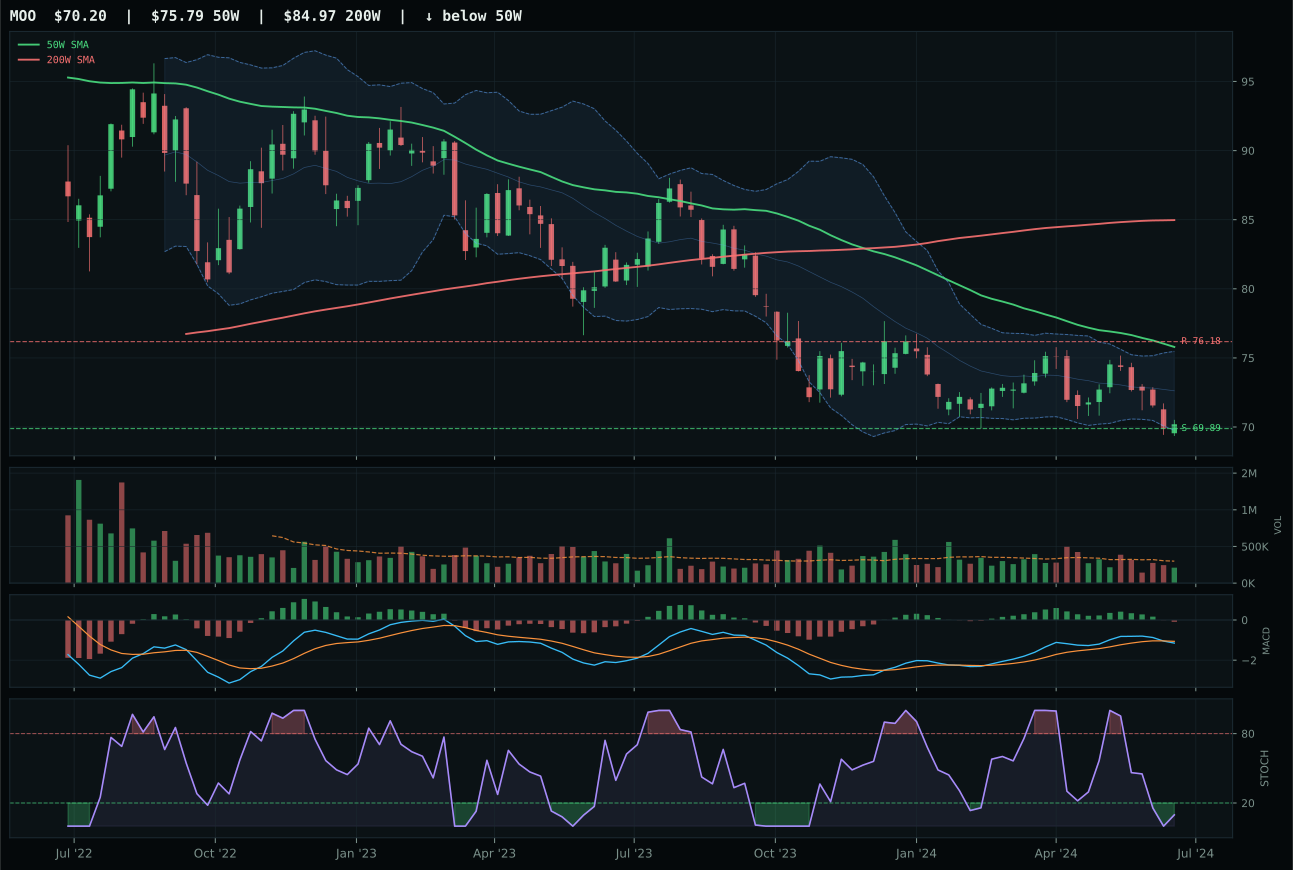
MOO has a pullback into support profile with -9.5% 13-week relative strength versus SPY.
Extension and support failure are the main tactical risks.
Tracked, but not top-2 eligible because: structurally broken.
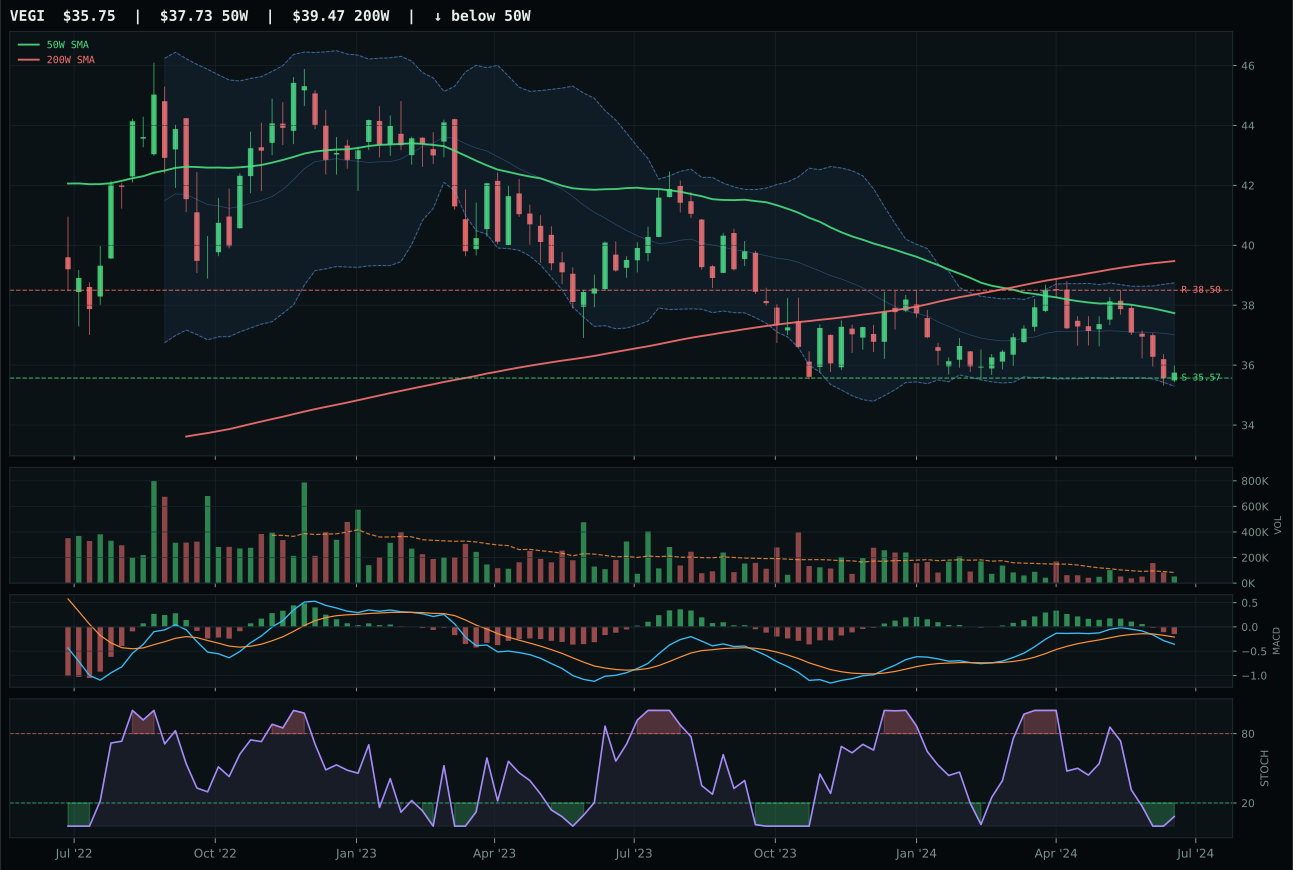
VEGI has a pullback into support profile with -10.2% 13-week relative strength versus SPY.
Extension and support failure are the main tactical risks.
Tracked, but not top-2 eligible because: structurally broken.
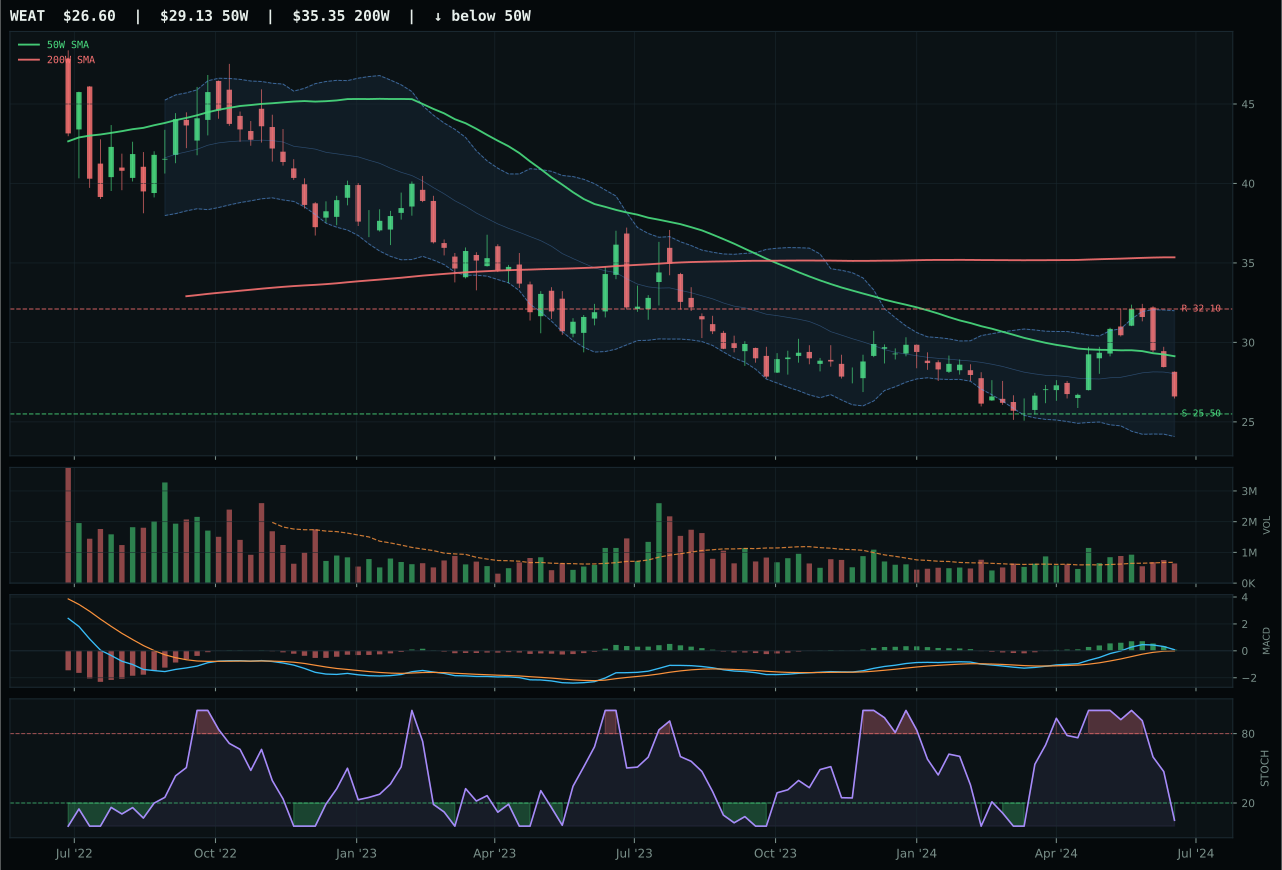
WEAT has a pullback into support profile with -4.7% 13-week relative strength versus SPY.
Extension and support failure are the main tactical risks.
Tracked, but not top-2 eligible because: structurally broken.
MOO won by default in a broken category: its structurally weak setup—pullback into support at 69.89 with oversold RSI at 0.10 and bearish MACD—beat VEGI's identical structure because MOO posted 0.0% category-relative strength versus VEGI's -0.7%. The 13W returns of -5.0% versus -5.7% further separated them. This is not a victory worth celebrating; MOO's 21.6 technical evidence score and VEGI's failed hard filter tell the full story. Risk/reward at 90.0 is the only bright spot, offering 0.4% downside to support versus -7.8% upside to resistance—a setup that only works if support holds and mean reversion begins. The category itself is ineligible for top-2 consideration, marked by a 4.0 final score that reflects disinflation pressure at -8 basis points overwhelming the +5 from real asset sponsorship.
Agriculture & Aerospace ranks 9th with a final score of only 4.0, earning 0% allocation because the representative (MOO) failed eligibility filters despite posting the highest reasoned score. Disinflation pressure (-8 points) directly undercuts agricultural commodity sponsorship; real-asset interest (+8) provides minimal offset when macro headwinds are this directional. MOO's technical setup—pullback into support near Fibonacci 0.786—offers value as a bounce candidate, but the category's commodity-breadth tailwind has deteriorated and liquidity remains thin (0.70x 20-week volume). Allocating to this category would mean buying weakness in a disinflation regime without conviction in either technicals or fundamentals. Reverse the situation: if MOO broke above 76.18 resistance with volume expansion and MACD bullish cross, the category score could climb materially and earn reconsideration. Until then, capital is better deployed where macro and technicals align.
Traditional Energy — XLE
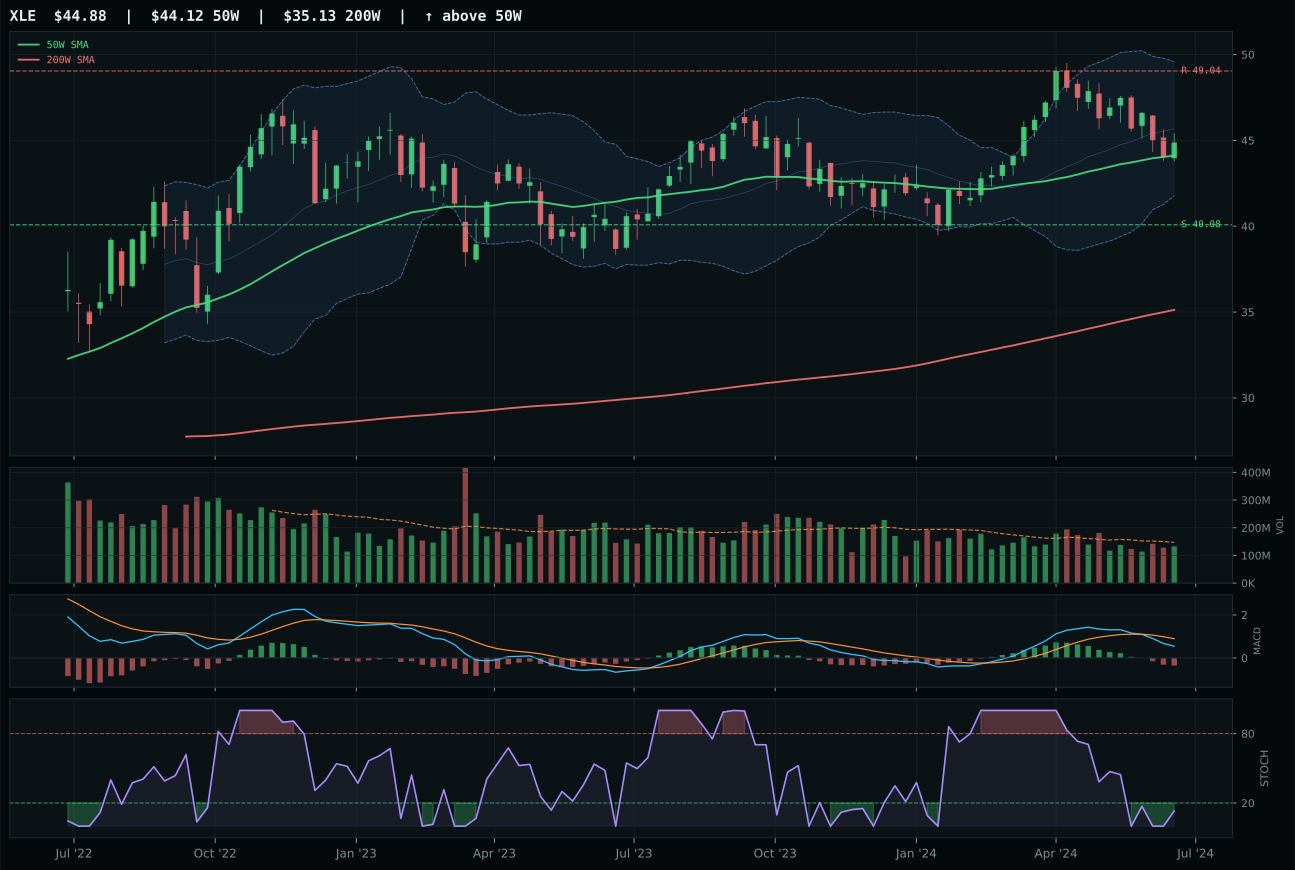
XLE has a compression near 50W profile with -7.3% 13-week relative strength versus SPY.
A failed hold above support would weaken the setup.
Actionable but governed by invalidation levels.
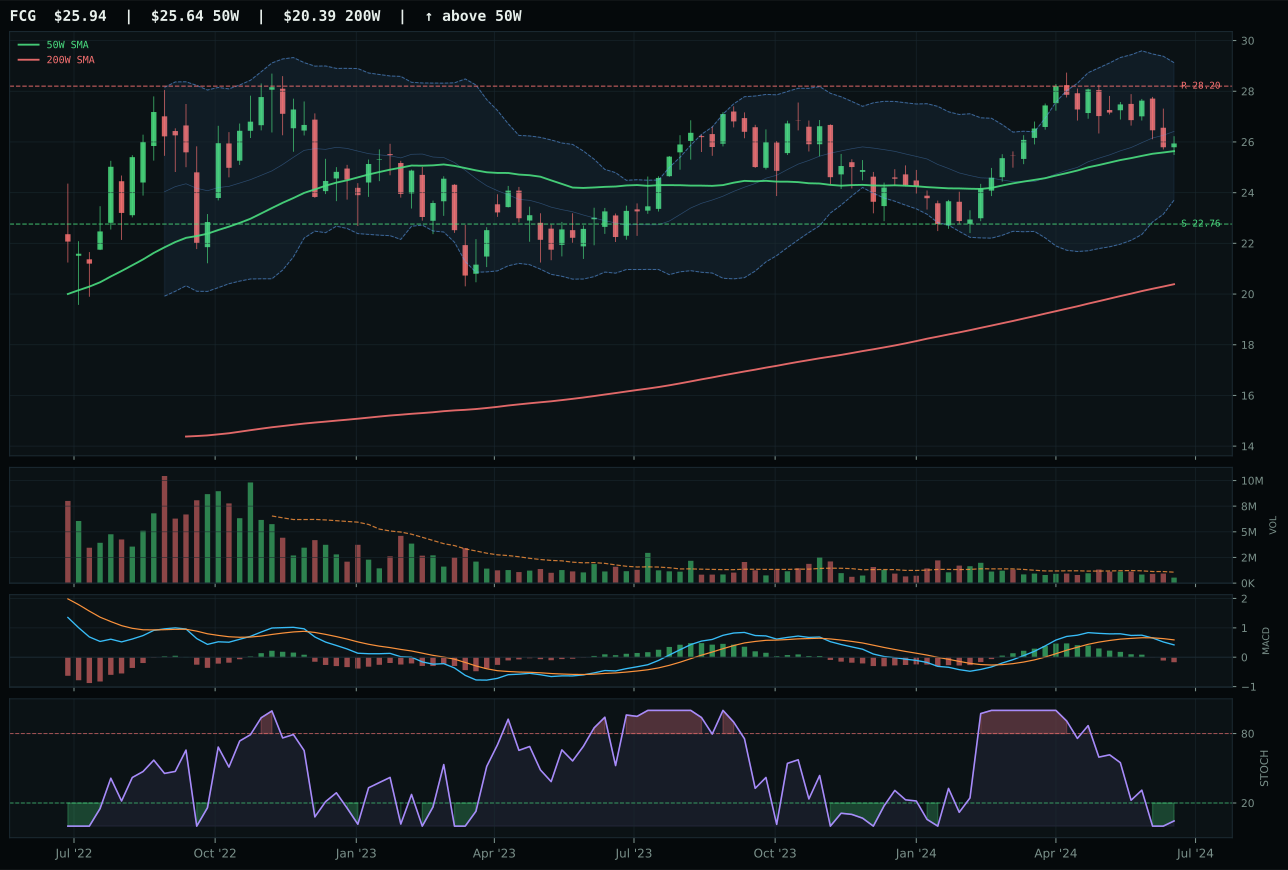
FCG has a compression near 50W profile with -6.7% 13-week relative strength versus SPY.
A failed hold above support would weaken the setup.
Actionable but governed by invalidation levels.
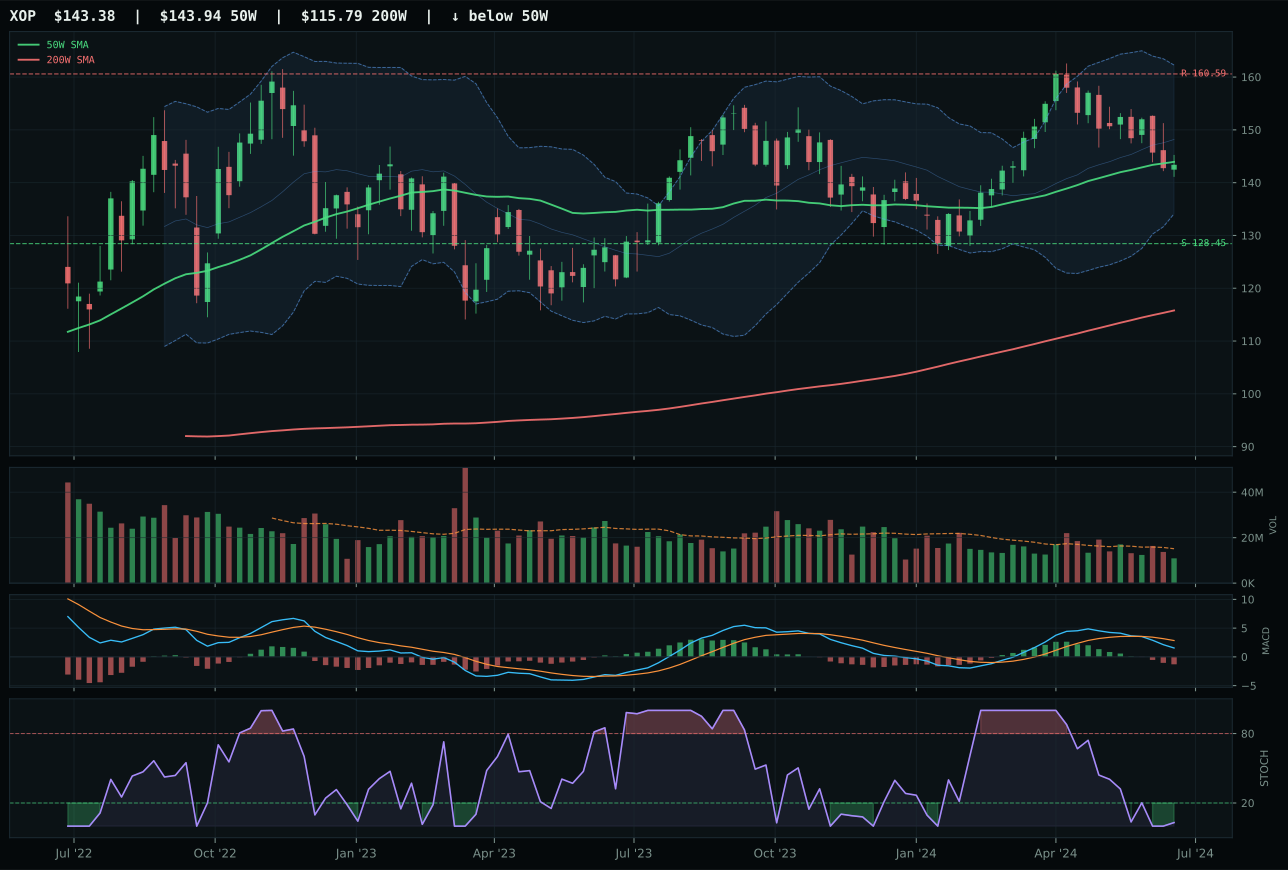
XOP has a compression near 50W profile with -9.3% 13-week relative strength versus SPY.
A failed hold above support would weaken the setup.
Actionable but governed by invalidation levels.
XLE won the weakest category by posting superior timing setup: its perfect 100.0 timing score stems from sitting just 1.7% from the 50W with oversold RSI (0.13) in the middle retracement zone, offering the cleanest invalidation framework. FCG matched this precision on timing at 100.0 but lost on risk/reward (63.3 vs 65.8) and structure (69.5 vs 71.8 cleanliness), plus volume confirmation disadvantage on thin participation versus neutral. XLE's compression near the 50W with neutral volume creates the highest-probability reversal setup—either buyers defend and rally, or support cracks with defined risk. Both names show 13W weakness (-2.9% and -2.2% respectively), negative SPY-relative strength, and bearish MACD, confirming this category is structurally weak. XLE's marginal edge is positioning: it's closest to a reversion point with the most neutral volume sponsorship.
Traditional Energy ranks dead last at 10th with a 3.8 final score, earning 0% allocation because disinflation regime dynamics are fundamentally hostile to energy. Disinflation pressure contributes -10 points to the category descriptor mix while real-asset sponsorship adds only +5; the net macro fit of 23.0/100 is the weakest among all ten categories. XLE's compression setup offers tactical bounce potential if oversold conditions trigger mean reversion, but the -7.3% relative strength to SPY and -2.9% 13-week return confirm that institutional capital is redirecting away from energy into metals and utilities. The category doesn't qualify for any allocation this week. To reconsider energy, the allocator would need to see either (1) MACD bullish cross with volume expansion, (2) a break above 49.04 resistance sustaining for multiple weeks, or (3) a macro shift away from disinflation narratives—none of which are visible currently.