
2024-06-14
Informational purposes only. The content in this report, including allocations, analysis, and commentary, is provided solely for informational and educational purposes. It does not constitute financial advice, investment advice, trading advice, or any other type of advice. Past performance does not guarantee future results. Always conduct your own research and consult a qualified financial professional before making investment decisions.
Weekly Allocation
| Ticker | Category | Weight | Role |
|---|---|---|---|
| FBTC | 50% | Overlay | |
| XLU | Utilities & Infrastructure | 10% | Top-2 (10%) |
| GLD | Precious Metals | 10% | Top-2 (10%) |
| XLK | Technology | 5% | Tier-2 (5%) |
| SMH | AI | 5% | Tier-2 (5%) |
| NLR | Nuclear Energy | 5% | Tier-2 (5%) |
| ITA | Defense & Aerospace | 5% | Tier-2 (5%) |
| COPX | Industrial Metals | 5% | Tier-2 (5%) |
| INDA | Emerging Markets | 5% | Tier-2 (5%) |
Trade Instructions — Monday Open
Sell the tranche from 2024-05-17 (completing its 4-week hold). Buy the new tranche. Instructions show net portfolio changes — same-asset positions cancel, weight changes show the delta.
| Action | Ticker | Instruction |
|---|---|---|
| SELL | XLE | Sell 33% of XLE position (reduce 7.50% → 5.00%) |
| SELL | COPX | Sell 33% of COPX position (reduce 3.75% → 2.50%) |
| SELL | SLV | Sell 25% of SLV position (reduce 5.00% → 3.75%) |
| SELL | URNM | Sell entire URNM position (1.25% of portfolio) |
| SELL | XAR | Sell 33% of XAR position (reduce 3.75% → 2.50%) |
| SELL | WEAT | Sell 25% of WEAT position (reduce 5.00% → 3.75%) |
| BUY | XLU | Buy XLU — 14.29% of freed cash (adds 1.25% to portfolio) |
| BUY | NLR | Buy NLR — 14.29% of freed cash (adds 1.25% to portfolio) |
| BUY | GLD | Buy GLD — 28.57% of freed cash (adds 2.50% to portfolio) |
| BUY | ITA | Buy ITA — 14.29% of freed cash (adds 1.25% to portfolio) |
| BUY | XLK | Buy XLK — 14.29% of freed cash (adds 1.25% to portfolio) |
| BUY | INDA | Buy INDA — 14.29% of freed cash (adds 1.25% to portfolio) |
Current Portfolio After Trade
Combined holdings across all 4 active tranches. Each tranche is 25% of the portfolio.
| Ticker | % of Portfolio | Weight Bar |
|---|---|---|
| FBTC | 50.00% | |
| NLR | 8.75% | |
| XLU | 5.00% | |
| SMH | 5.00% | |
| GLD | 5.00% | |
| XLE | 5.00% | |
| SLV | 3.75% | |
| WEAT | 3.75% | |
| COPX | 2.50% | |
| XAR | 2.50% | |
| PICK | 2.50% | |
| ITA | 2.50% | |
| IGF | 1.25% | |
| XLK | 1.25% | |
| INDA | 1.25% |
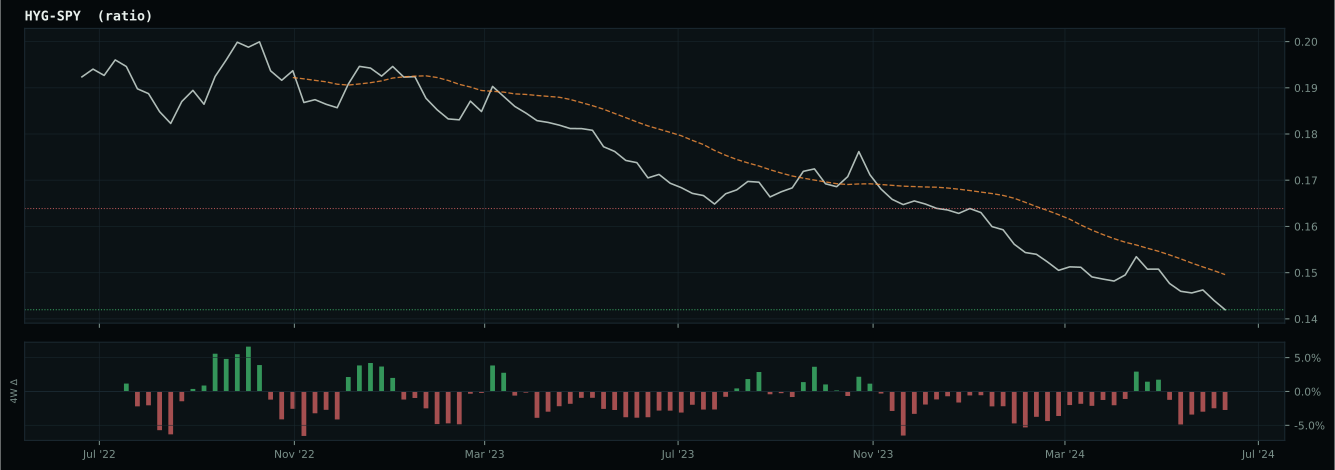
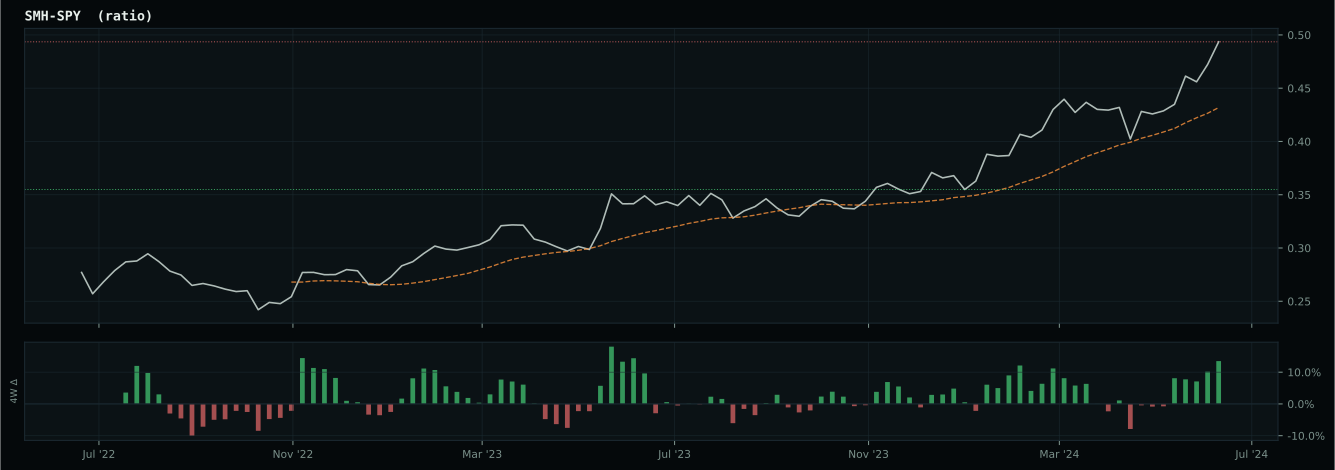
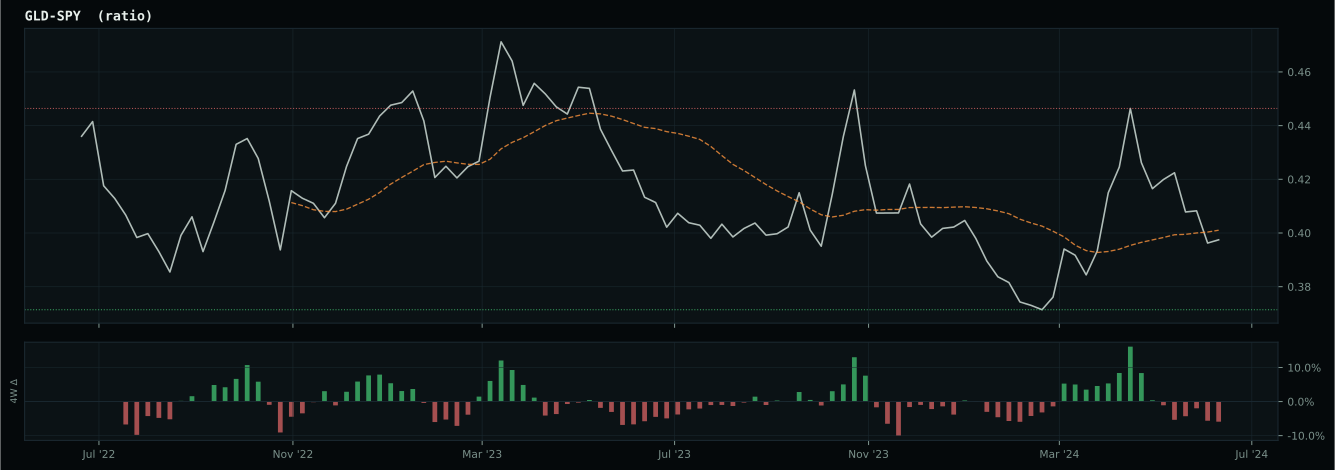
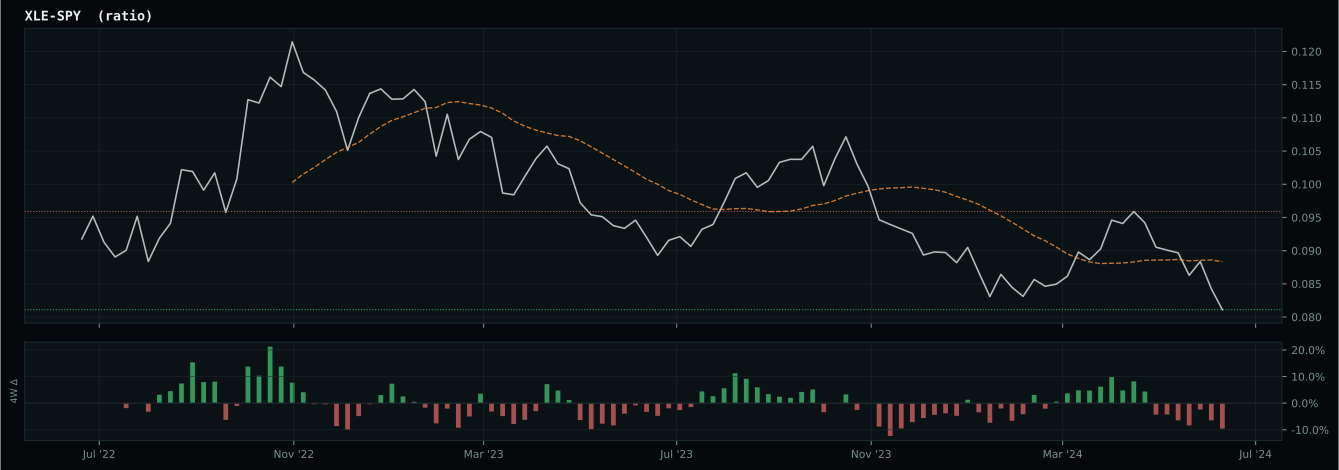
Macro Regime — Disinflation
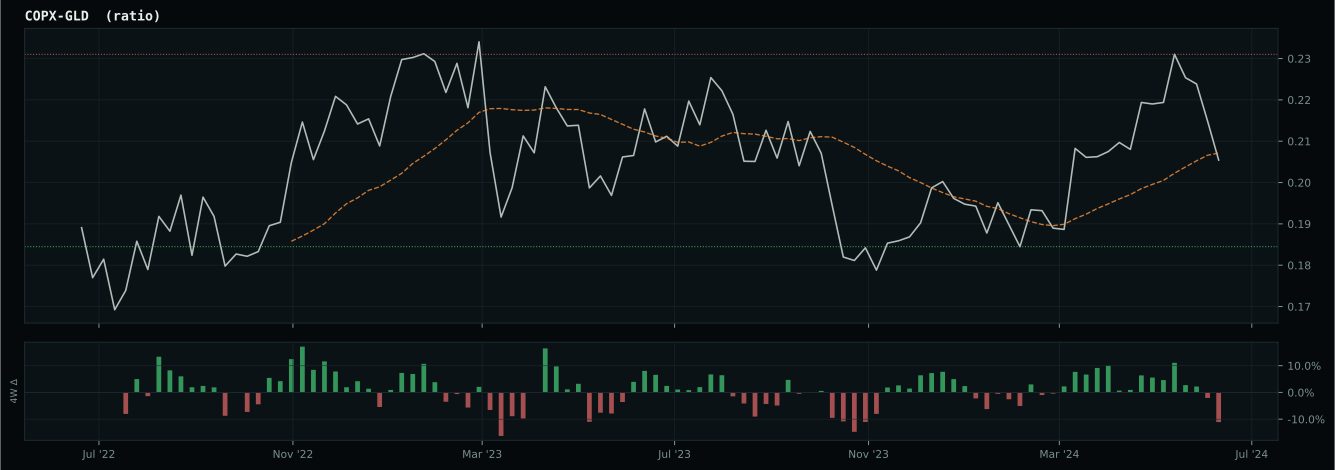
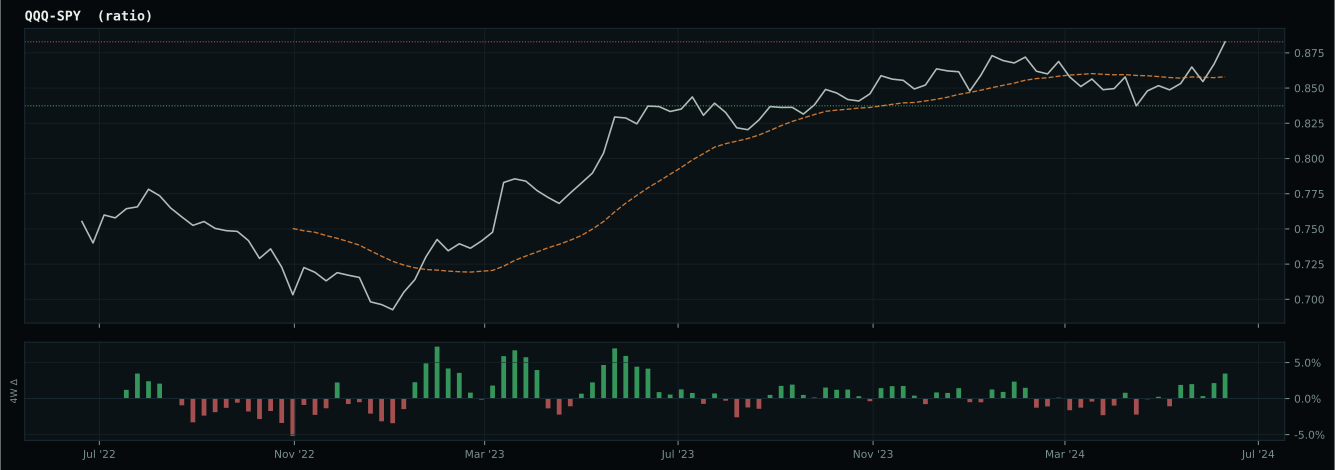
Macro Evidence Charts
Market-implied signals behind the macro regime scores. Each ratio compares two assets; the direction and slope of the ratio is what the macro engine reads.
Crypto Regime — TrendBTC
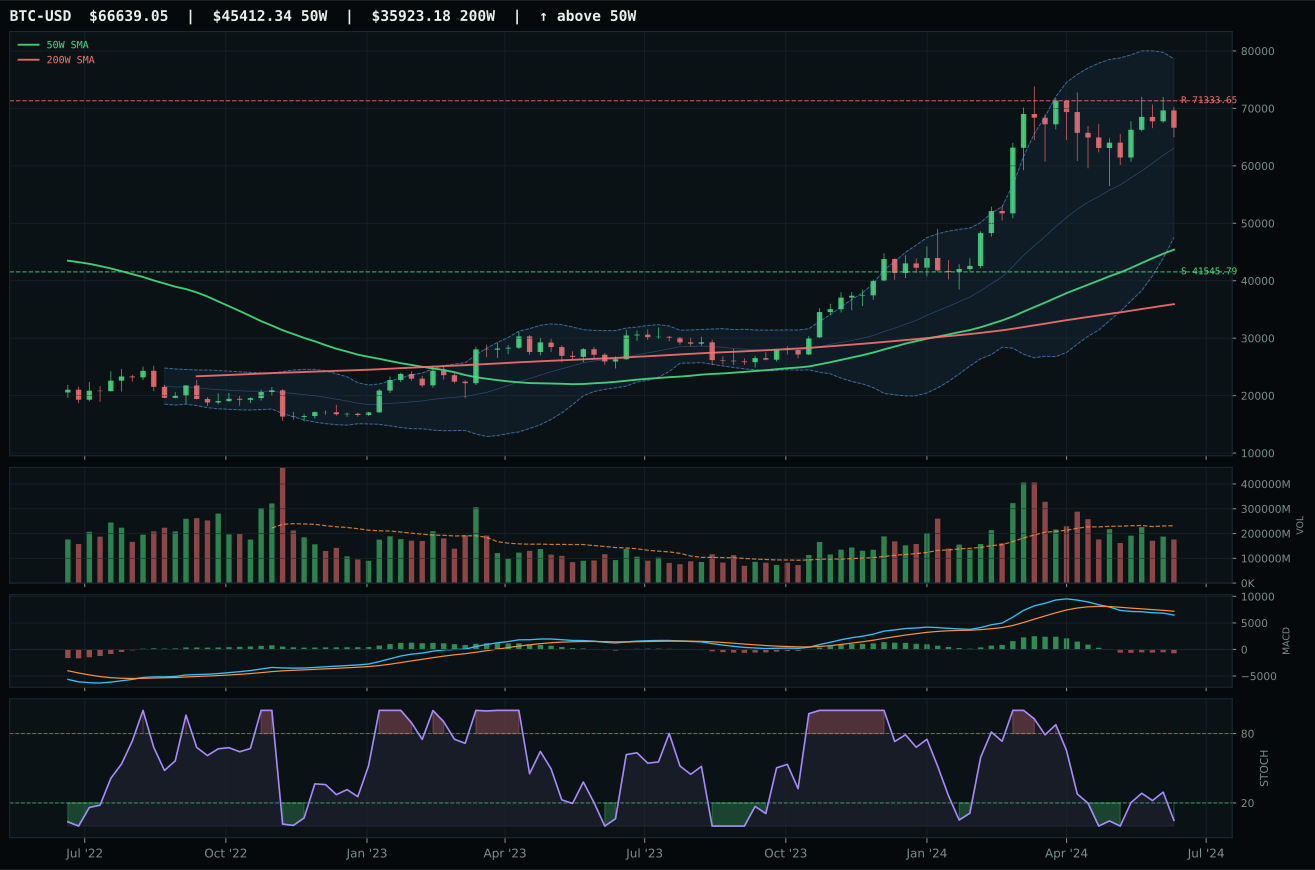
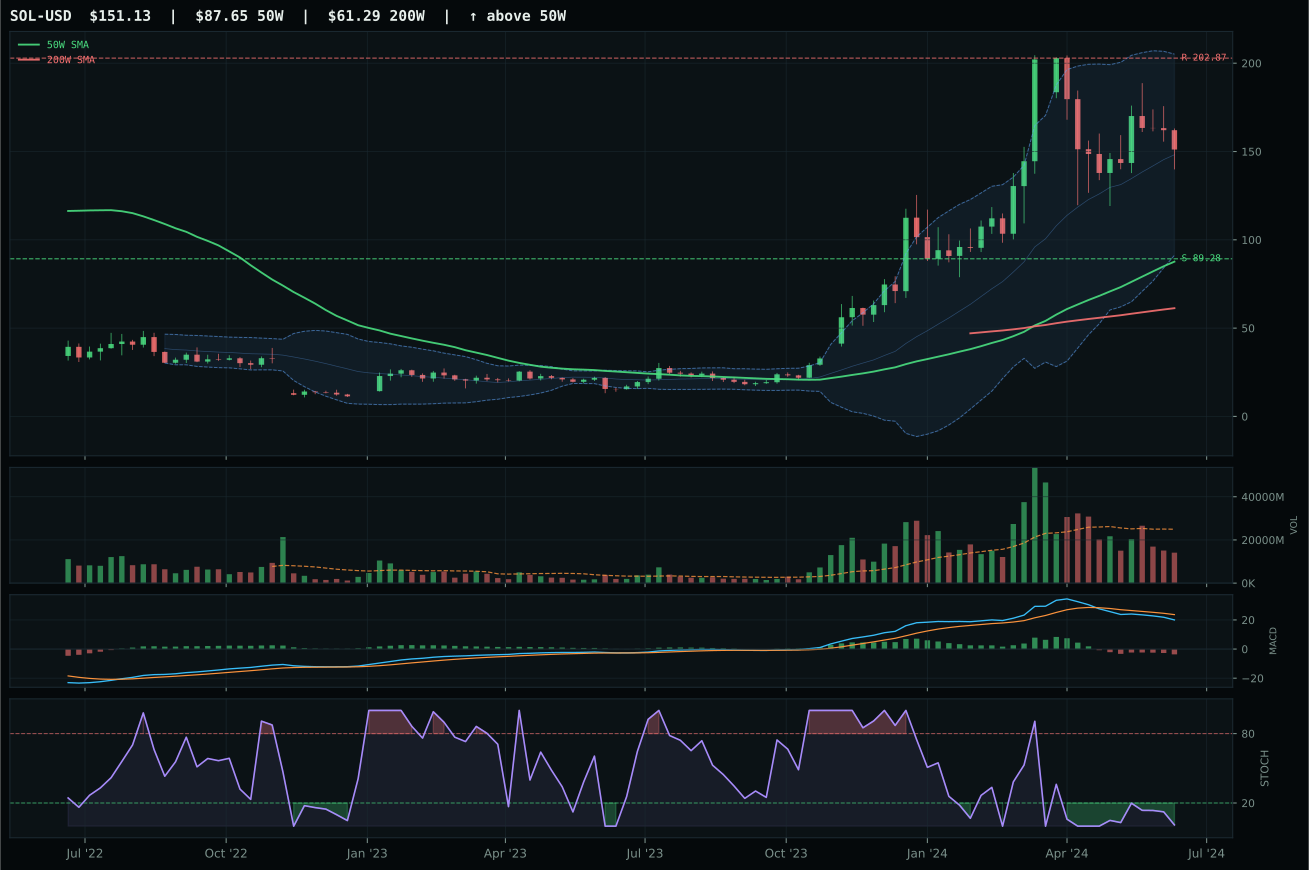
ValueBTC not armed: BTC has not made the first post-breakdown touch of the 200W buy zone after losing the 50W
TrendBTC confirmed: 2 consecutive closes above rising/flat 50W SMA
one or more available conditions failed
Category Rankings
| Rank | Category | Winner | Score | Alloc | 4W Ret | Peers (4W) |
|---|---|---|---|---|---|---|
| 1 | Utilities & Infrastructure | XLU | 64.3 | 20% | +1.28% | IGF +3.3% · PAVE +3.9% |
| 2 | Precious Metals | GLD | 63.9 | 20% | +3.95% | SLV +4.4% · GDX +15.0% |
| 3 | Technology | XLK | 56.6 | 10% | +2.96% | IGV +5.4% · CIBR +5.0% |
| 4 | AI | SMH | 52.2 | 10% | +2.11% | AIQ +4.3% · BOTZ +3.3% |
| 5 | Nuclear Energy | NLR | 47.8 | 10% | +5.30% | URA +6.1% · URNM +3.3% |
| 6 | Defense & Aerospace | ITA | 44.4 | 10% | +1.68% | XAR +4.8% · ROKT +7.7% |
| 7 | Industrial Metals | COPX | 35.5 | 10% | +9.16% | PICK +4.1% · REMX -0.8% |
| 8 | Emerging Markets | INDA | 14.1 | 10% | +3.48% | IEMG +4.4% · ILF +9.3% |
| 9 | Agriculture & Livestock | MOO | 5.3 | 0% | +2.01% | VEGI +0.9% · WEAT -10.3% |
| 10 | Traditional Energy | FCG | 2.5 | 0% | +4.54% | XOP +3.0% · XLE +3.7% |
Utilities & Infrastructure — XLU
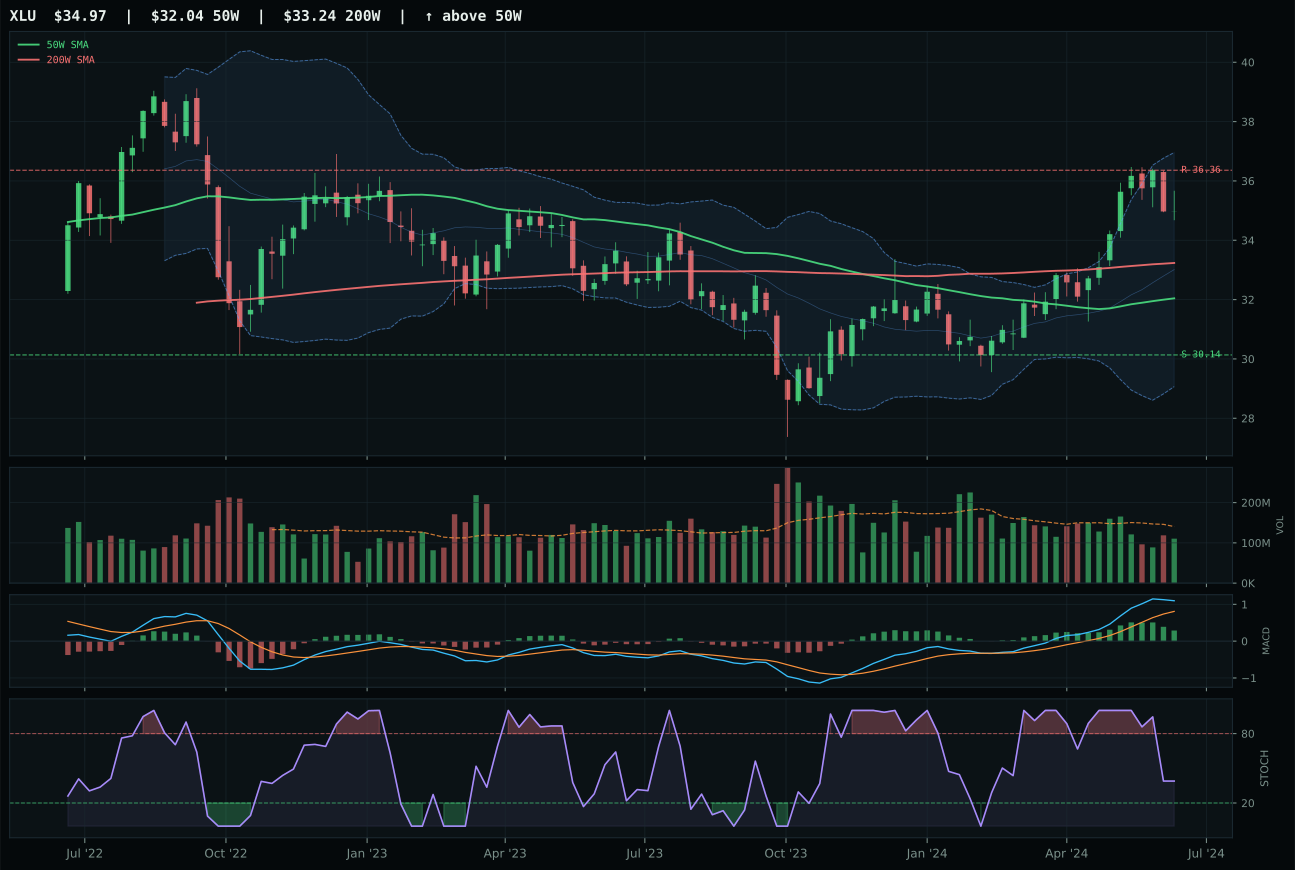
XLU has a neutral structure profile with 3.7% 13-week relative strength versus SPY.
A failed hold above support would weaken the setup.
Actionable but governed by invalidation levels.
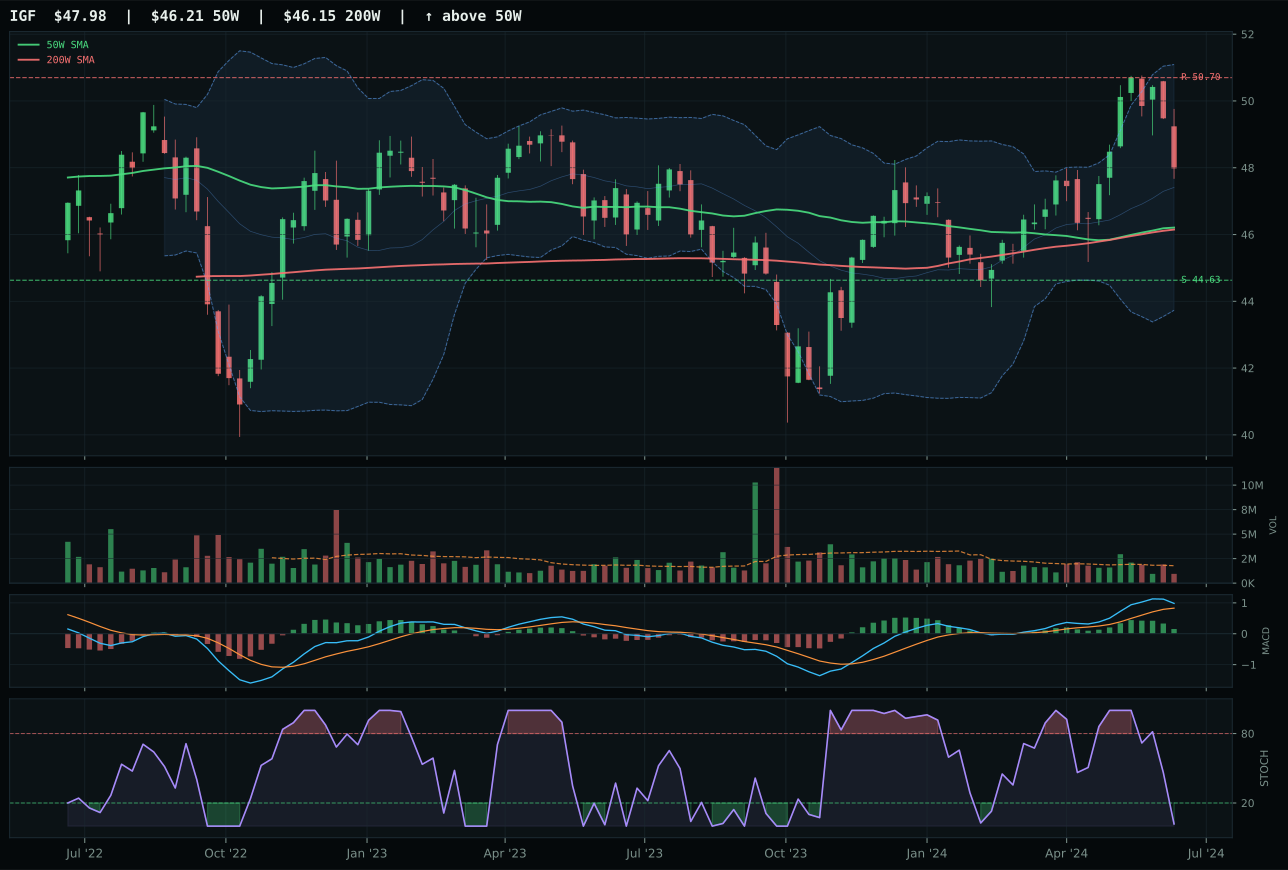
IGF has a neutral structure profile with -3.0% 13-week relative strength versus SPY.
A failed hold above support would weaken the setup.
Actionable but governed by invalidation levels.
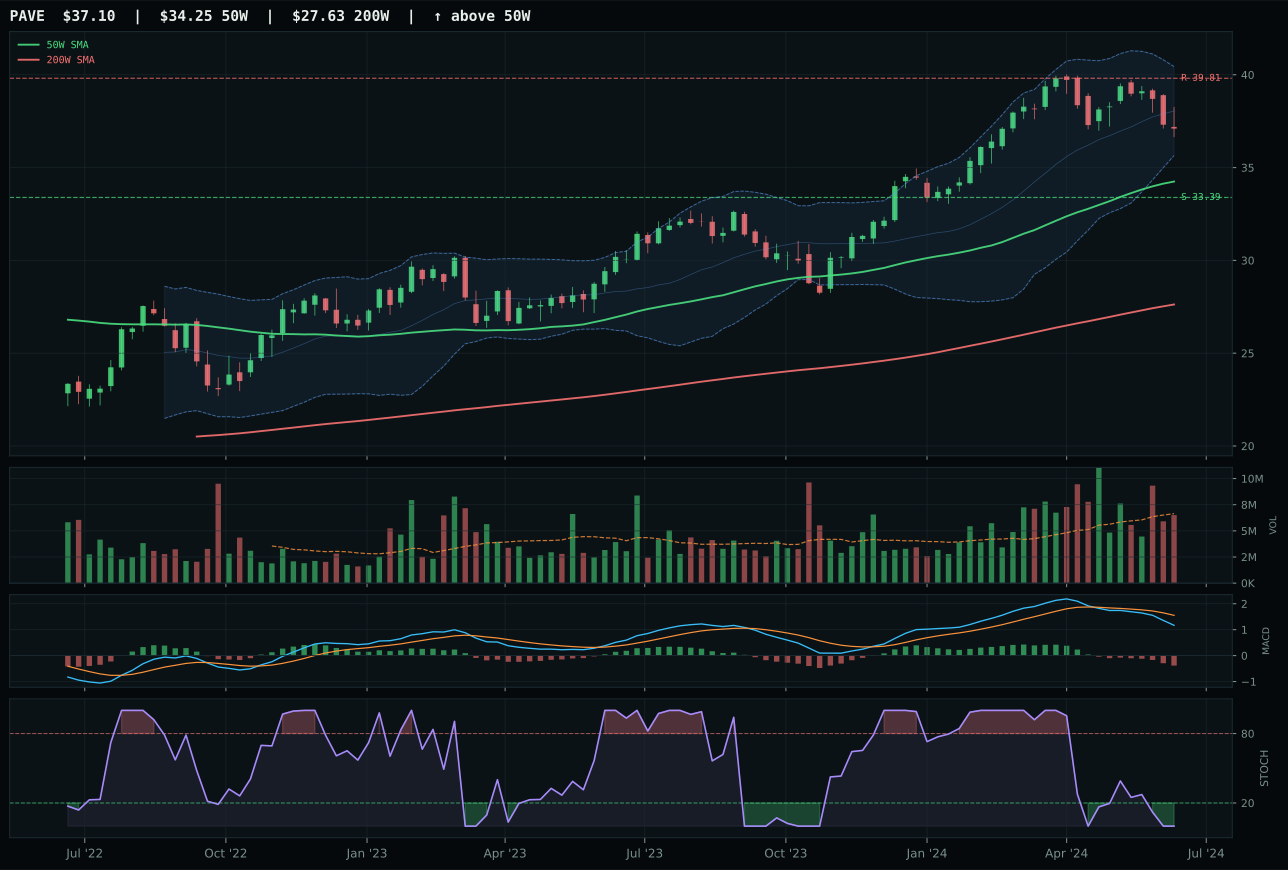
PAVE has a neutral structure profile with -9.2% 13-week relative strength versus SPY.
A failed hold above support would weaken the setup.
Actionable but governed by invalidation levels.
XLU won utilities by posting a perfect hundred-point trend score and a 6.7% category-relative strength advantage that made IGF's competing case structurally inferior. XLU's bullish-but-flattening MACD and falling-neutral stochastic RSI at 0.39 created divergence potential; IGF's stochastic RSI oversold at a lower level suggested more fundamental momentum loss. The separating variable was volume sponsorship: XLU's neutral volume confirmation at 0.79x the twenty-week average indicated patient accumulation, while IGF's thin-participation volume revealed distribution pressure. Both sit at similar distances from the fifty-week moving average (9.1% versus comparable levels), but XLU's seventy-seven-point structure score and 74.3 technical evidence reflected cleaner mechanics. The 12.8-point gap between XLU and IGF in the reasoned proof order reflects genuine leadership, not marginal timing.
Utilities & Infrastructure earned its 10% top-2 allocation because the category's 64.3 final score ranked among the two highest-eligible buckets and macro fit is extraordinarily strong at 78.0/100. Disinflation helps (+7), defensive rotation is active at +12 (the highest across all categories), disinflation pressure adds +6, and broad market bear contributes +4—combining for the most cohesive macro narrative in the portfolio this week. Technical evidence of 74.3/100 on XLU is genuinely solid: perfect trend, strong momentum confirmation, and neutral volume sponsorship. The allocation strategy is explicit: Utilities & Infrastructure replaces Technology as the second top-2 slot because defensive rotation descriptors are actively sponsoring the category, whereas tech is being penalized by the exact same macro headwinds (liquidity stress, credit stress). XLU's conservative proximity to the 50W (9.1%) also makes it lower-risk entry than SMH's 45.9% extension, even though momentum is less explosive. Allocation should remain 10% as long as defensive-rotation descriptors stay active; if they flip to neutral or if risk appetite suddenly reverses, the position should be trimmed to 5% immediately given XLU's mechanical dependence on that single macro driver.
Precious Metals — GLD
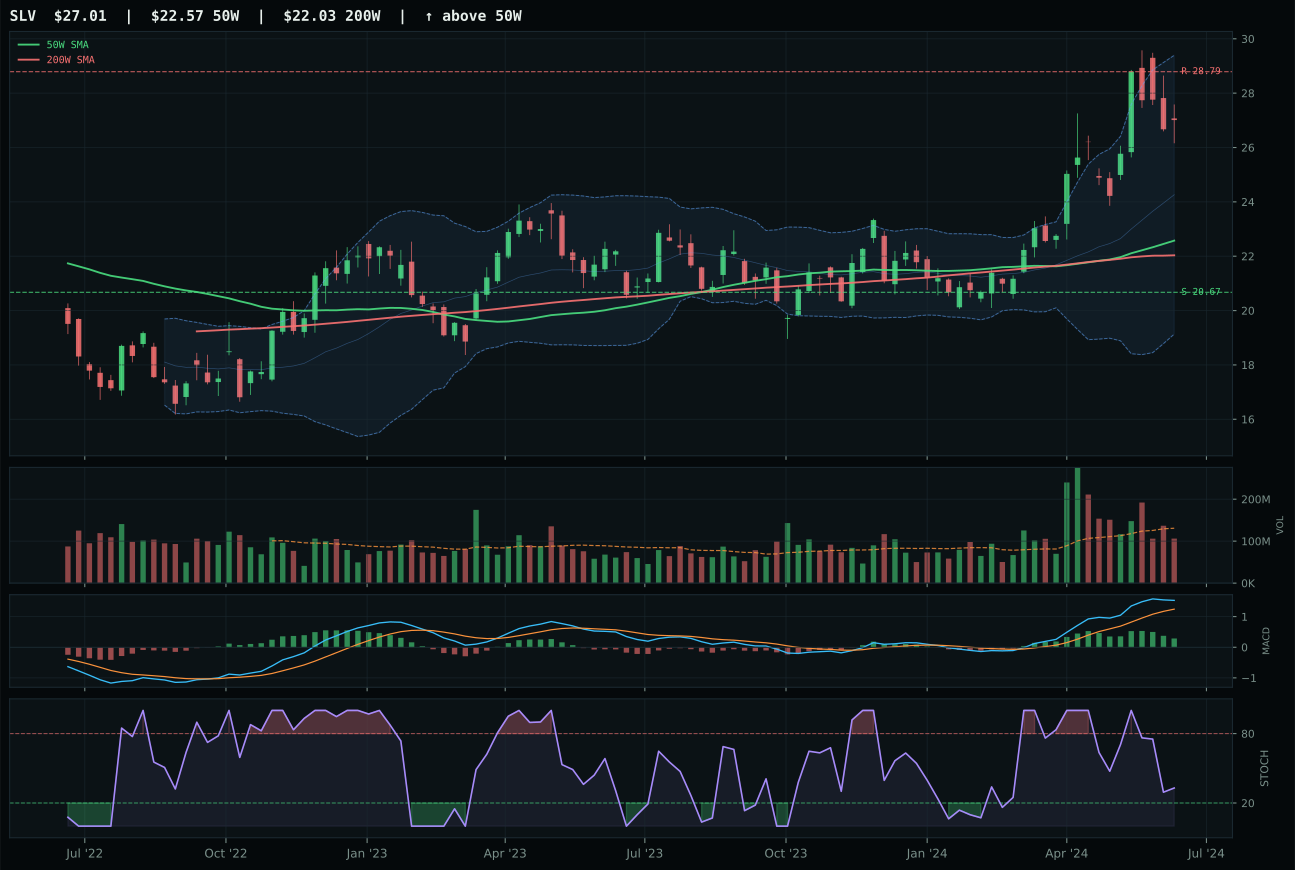
SLV has a vertical extension profile with 10.8% 13-week relative strength versus SPY.
A failed hold above support would weaken the setup.
Actionable but governed by invalidation levels.
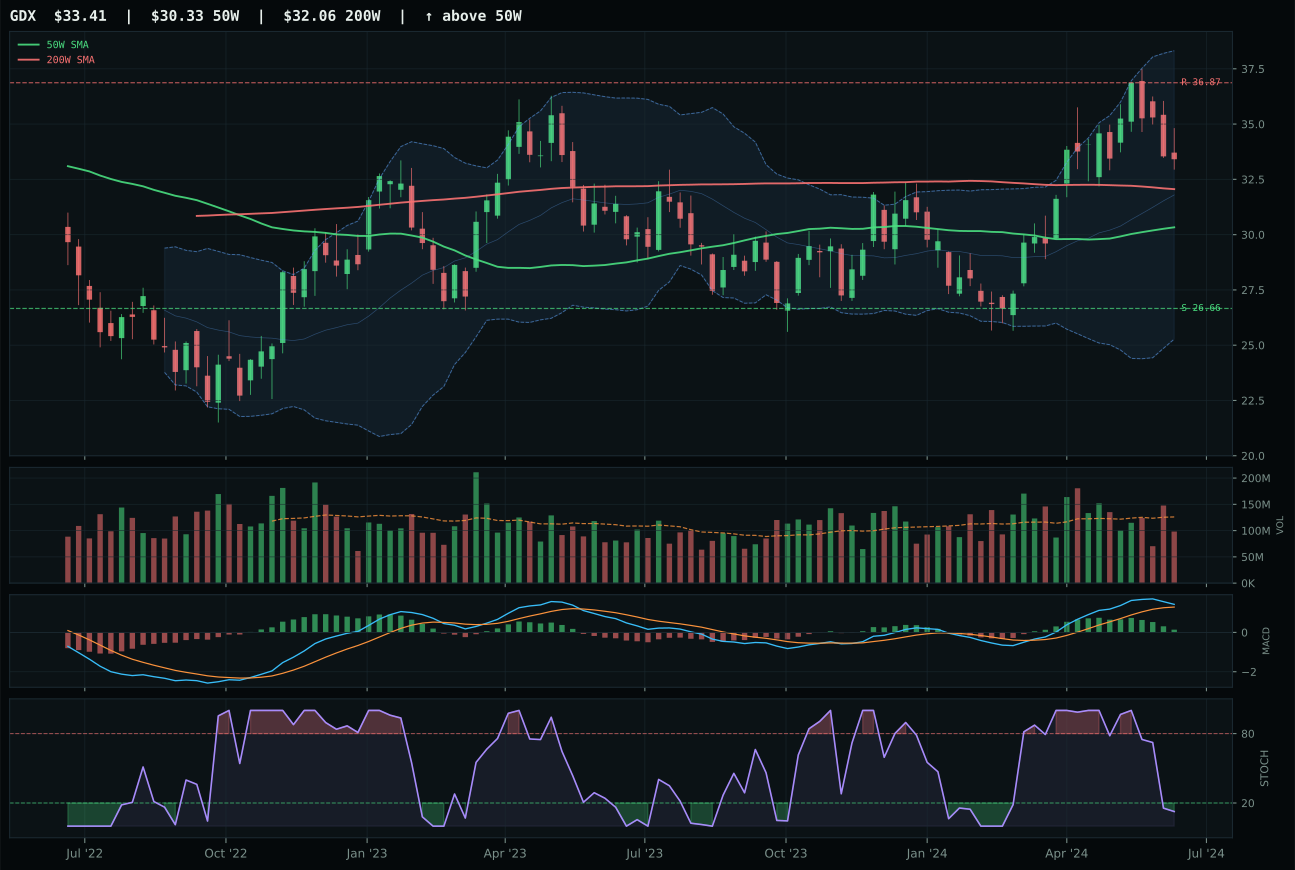
GDX has a neutral structure profile with 5.3% 13-week relative strength versus SPY.
A failed hold above support would weaken the setup.
Actionable but governed by invalidation levels.
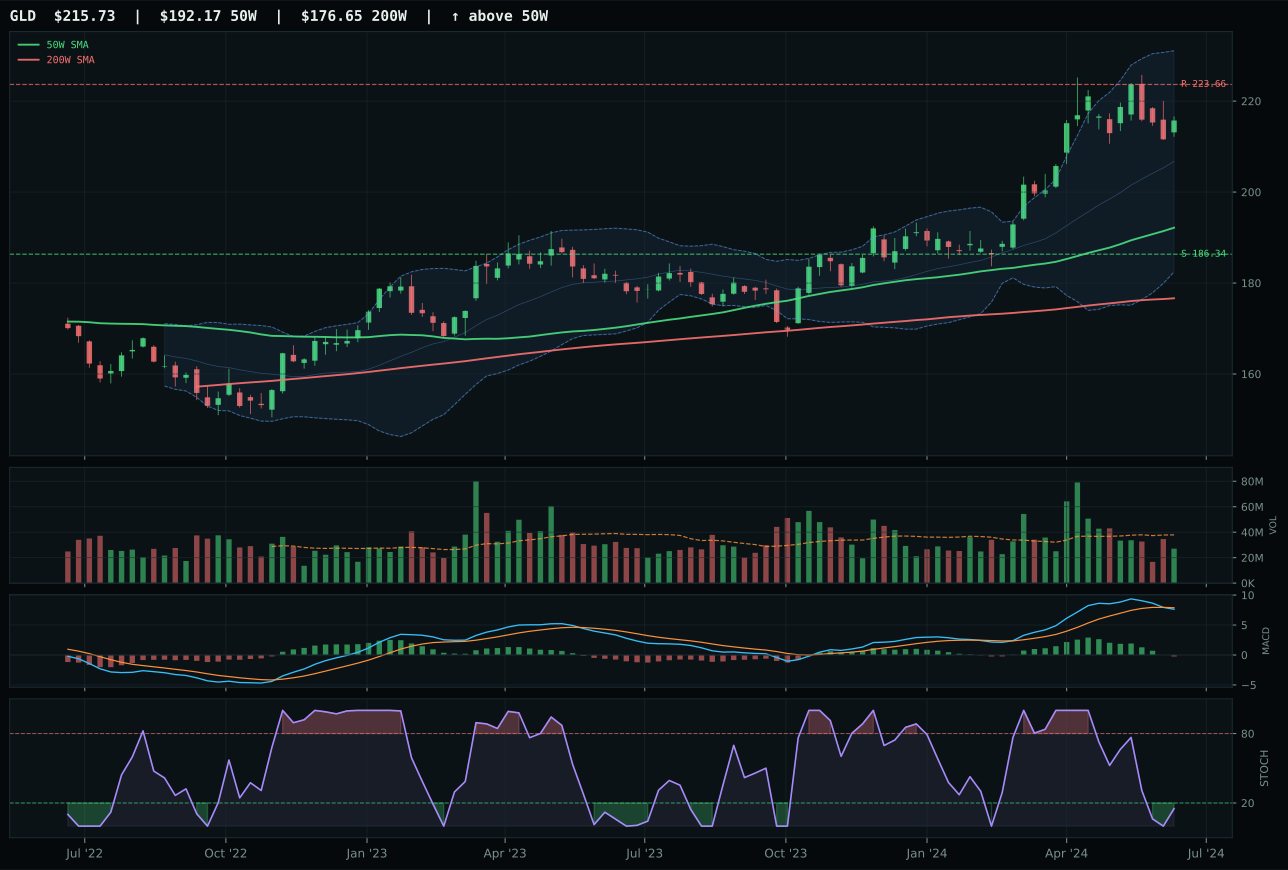
GLD has a neutral structure profile with 1.6% 13-week relative strength versus SPY.
A failed hold above support would weaken the setup.
Actionable but governed by invalidation levels.
GLD won the precious-metals category as the defensive anchor because gold's one-point-six SPY-relative strength provided the clearest monetary hedge narrative, even though SLV posted stronger absolute momentum with a seventeen-point-three thirteen-week return and ten-point-eight SPY outperformance. The separating factor was timing: GLD's twelve-point-three distance from the fifty-week moving average offered cleaner entry than SLV's nineteen-point-six extension, and GLD's oversold stochastic RSI at 0.15 versus SLV's falling-neutral signal at 0.39 told a reversion story. SLV's bullish-but-flattening MACD suggested momentum fatigue, while GLD's bearish-and-weakening MACD created a divergence opportunity if support holds. The price structure is neutral for both, but GLD's five-point-six higher final category score reflects the system's preference for defensive positioning over momentum extension.
Precious Metals earned its 10% top-2 allocation because the category's 63.9 final score ranked as one of the two highest-eligible buckets this week, driven by a 70.0/100 macro fit that is the strongest across all ten categories. Disinflation helps (+8), defensive rotation is active (+7), and disinflation pressure descriptors add +6, combining to make this category a natural anchor for a portfolio in a macro regime tilting toward rate stability and risk-off. However, the technical evidence for GLD itself is only 36.6/100—weak momentum confirmation at 28.9/100, thin volume participation at 0.71x 20W average, and a -3.5% near-term return creating negative-carry feel on the trade. The allocation is justified not because gold is a compelling near-term chart, but because macro conviction on defensive rotation is strong enough to overweight the category even with a mediocre technical setup. The tension is intentional: GLD is allocated for what it represents (monetary hedge, portfolio ballast, disinflation protection) rather than for a confirmed uptrend. If disinflation descriptors flip to neutral or if risk appetite reverses sharply, the 10% slot should compress to 5% or zero despite gold's structural appeal.
Technology — XLK
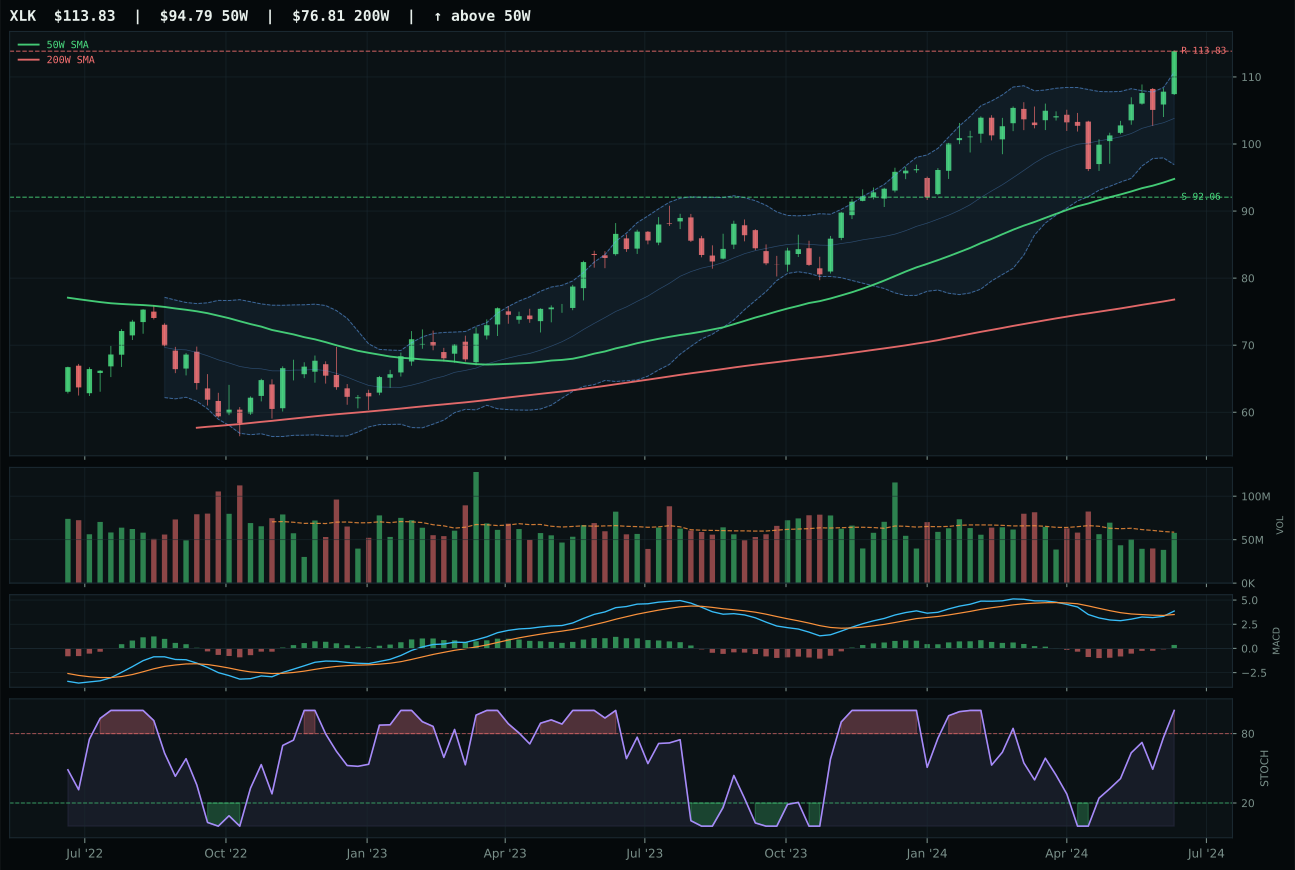
XLK has a vertical extension profile with 4.3% 13-week relative strength versus SPY.
A failed hold above support would weaken the setup.
Actionable but governed by invalidation levels.
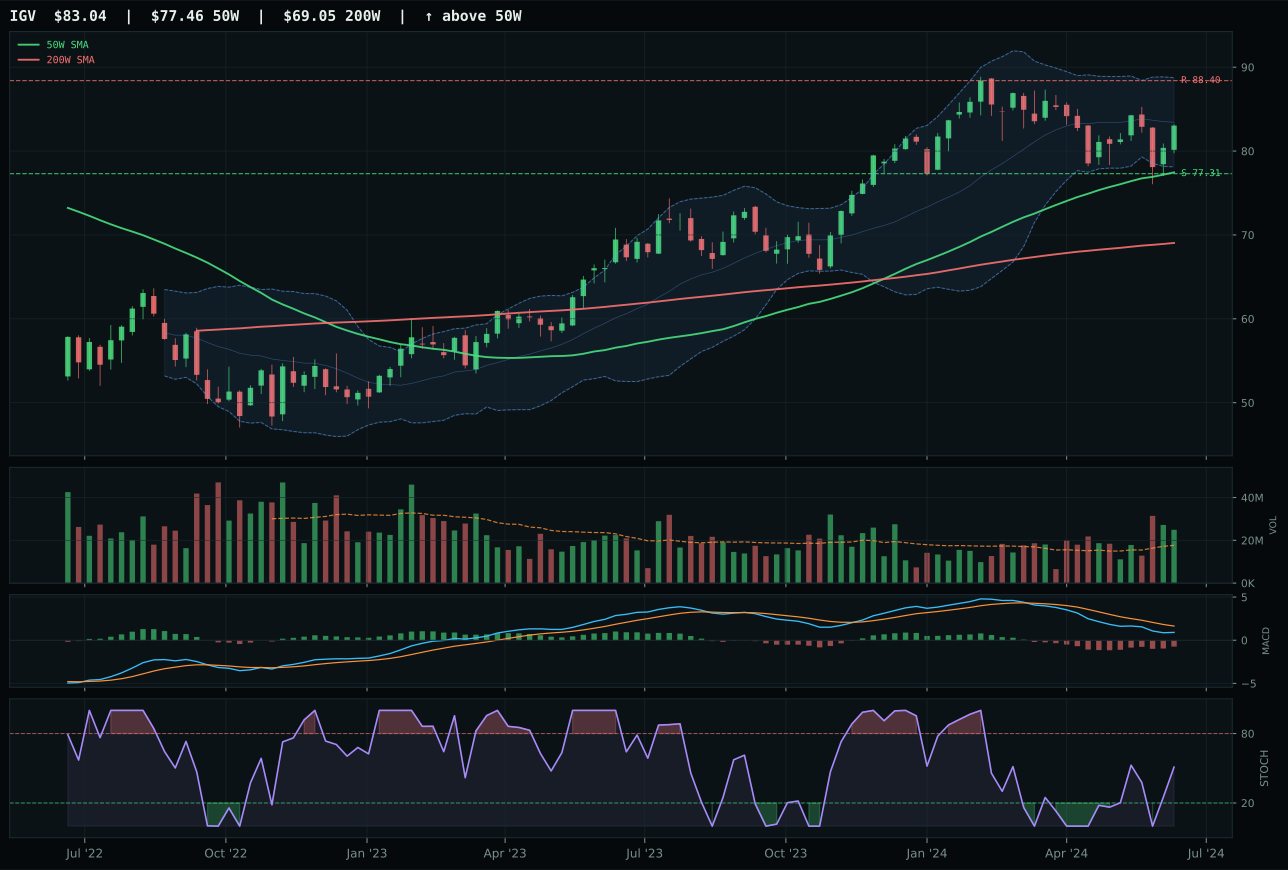
IGV has a neutral structure profile with -7.1% 13-week relative strength versus SPY.
A failed hold above support would weaken the setup.
Actionable but governed by invalidation levels.
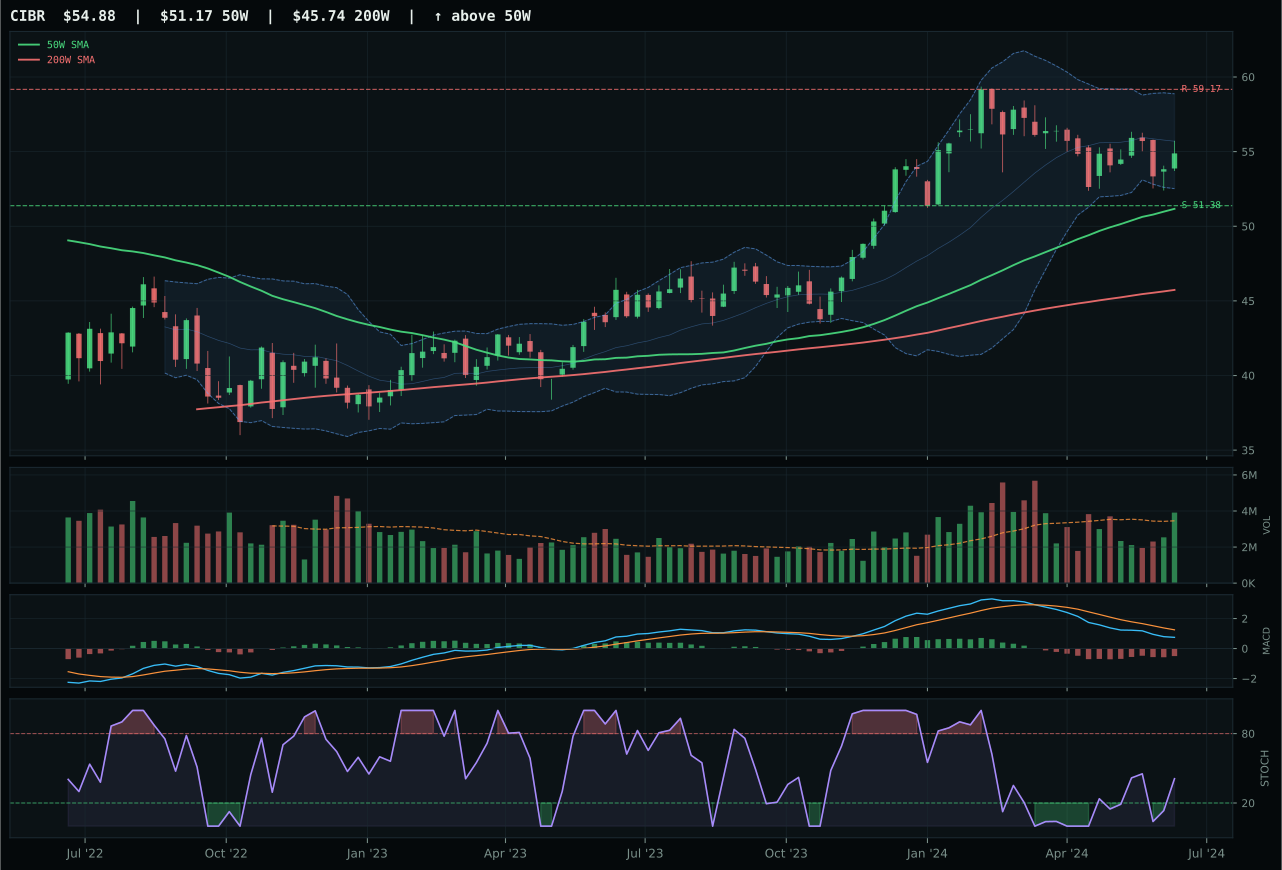
CIBR has a neutral structure profile with -8.7% 13-week relative strength versus SPY.
A failed hold above support would weaken the setup.
Actionable but governed by invalidation levels.
XLK captured the category because its 11.3% relative strength within the technology basket combined with a clean bullish MACD divergence and neutral volume sponsorship created a composition of leadership that IGV could not match. IGV's bearish-but-improving MACD and zero category-relative strength left it trailing by 0.7 points—a narrow margin that reflects timing risk, not structural weakness. The real separating factor was momentum confirmation: XLK's 10.7% thirteen-week return and 4.3% SPY outperformance showed accumulation, while IGV's negative thirteen-week return betrayed software duration drag in a disinflation regime. At 20.1% above the fifty-week moving average, XLK is extended, but the stochastic RSI overbought signal merely warns that new buyers pay a premium—it does not invalidate the trend.
Technology earned its 5% sleeve because it ranked outside the top two at 56.6, trailing both Precious Metals and Utilities on final category scores. The category's technical evidence of 75.0/100 is legitimate—XLK's momentum confirmation and trend setup are sound—but macro fit at 48.0/100 drags the entire bucket lower in a disinflation regime. Liquidity stress carries a -9 weight and credit stress a -6, both headwinds for extended growth multiples even in sectors with positive relative strength. Risk appetite is active, which helps, but the category cannot overcome timing risk: 20.1% extension above the 50W means entry for new capital requires conviction that the breakout has room to run, and that conviction is hard to build when two safer defensive alternatives have already claimed the top two slots. For allocation to return to 10%, either XLK would need to compress back into the 50W without breaking trend, or broader macro descriptors would need to shift away from liquidity/credit concern and toward pure risk-on sponsorship.
AI — SMH
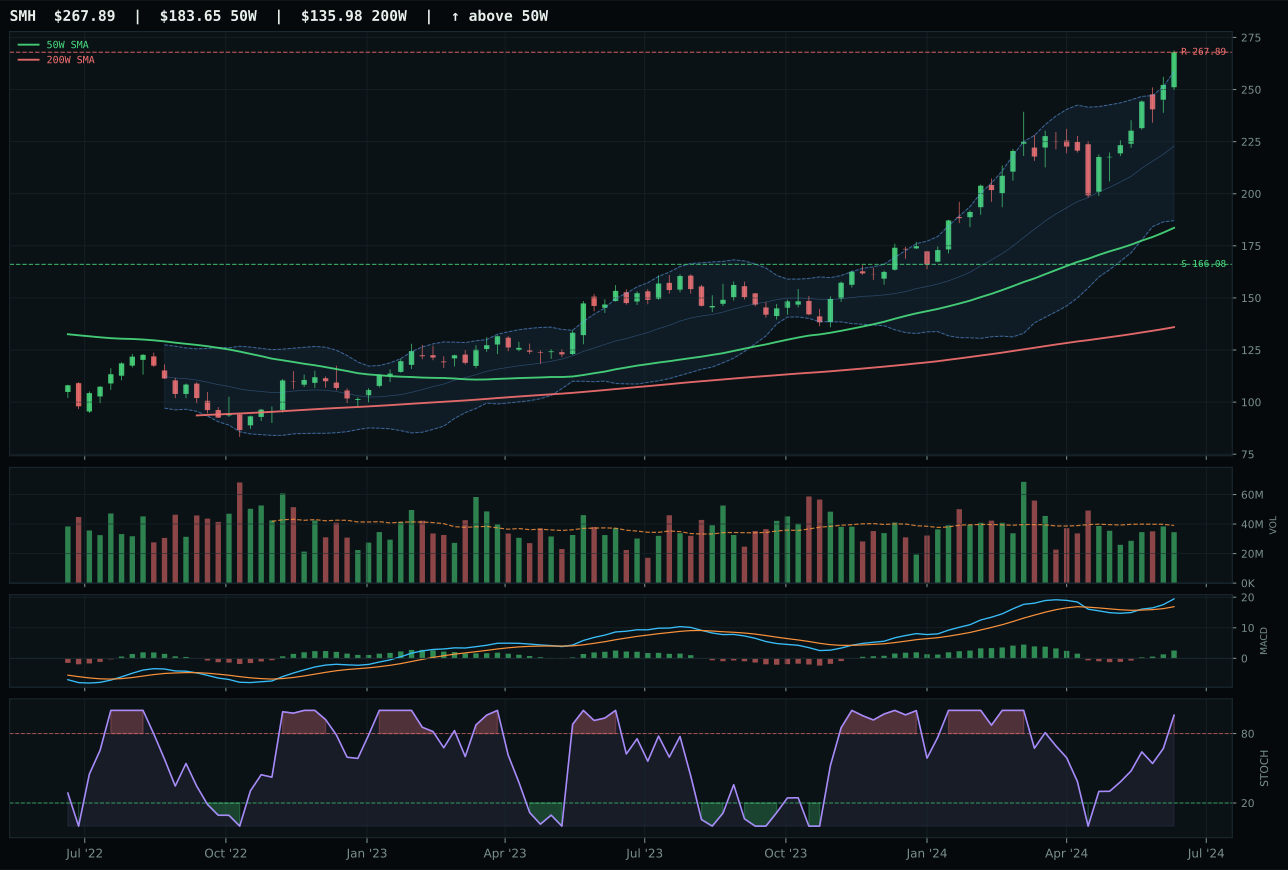
SMH has a vertical extension profile with 16.5% 13-week relative strength versus SPY.
A failed hold above support would weaken the setup.
Actionable but governed by invalidation levels.
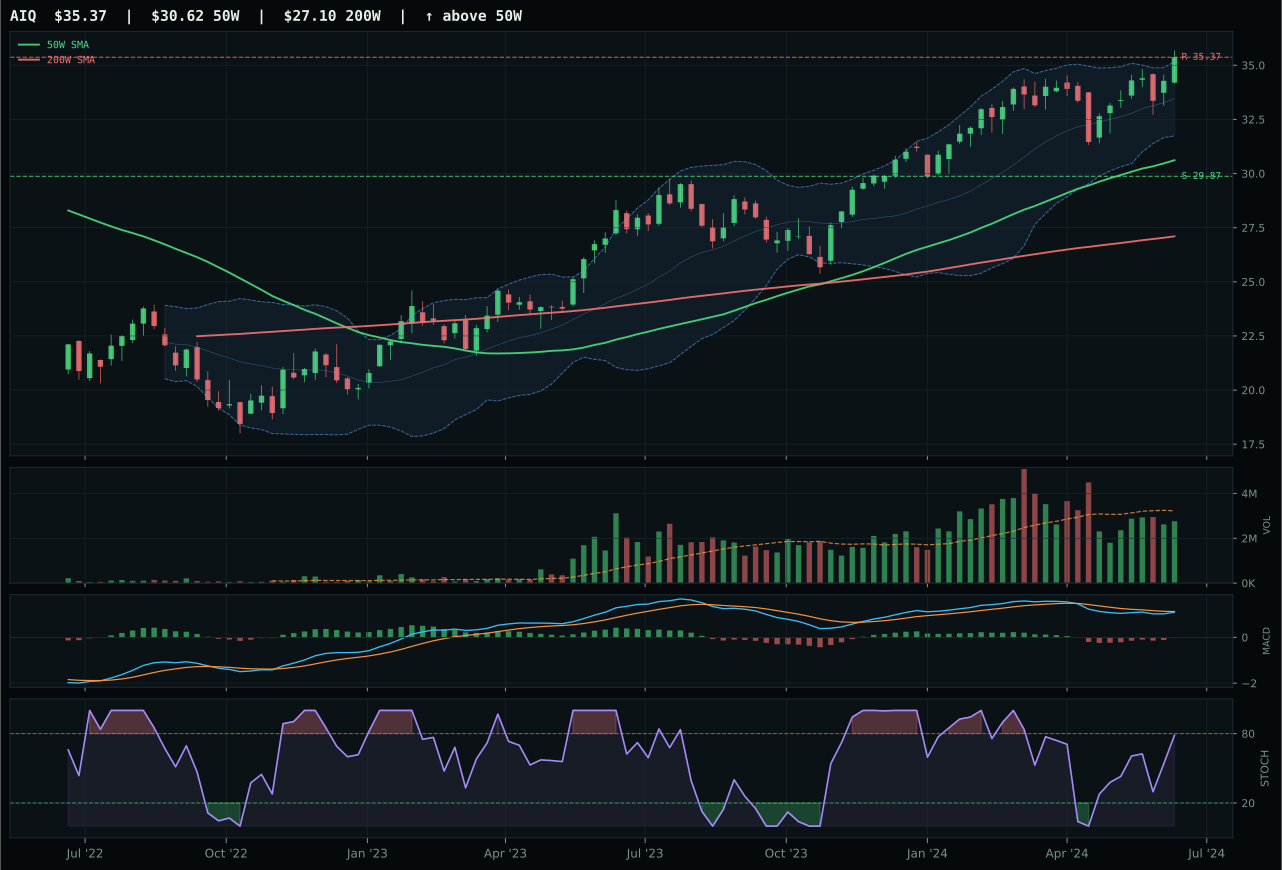
AIQ has a vertical extension profile with 0.2% 13-week relative strength versus SPY.
A failed hold above support would weaken the setup.
Actionable but governed by invalidation levels.
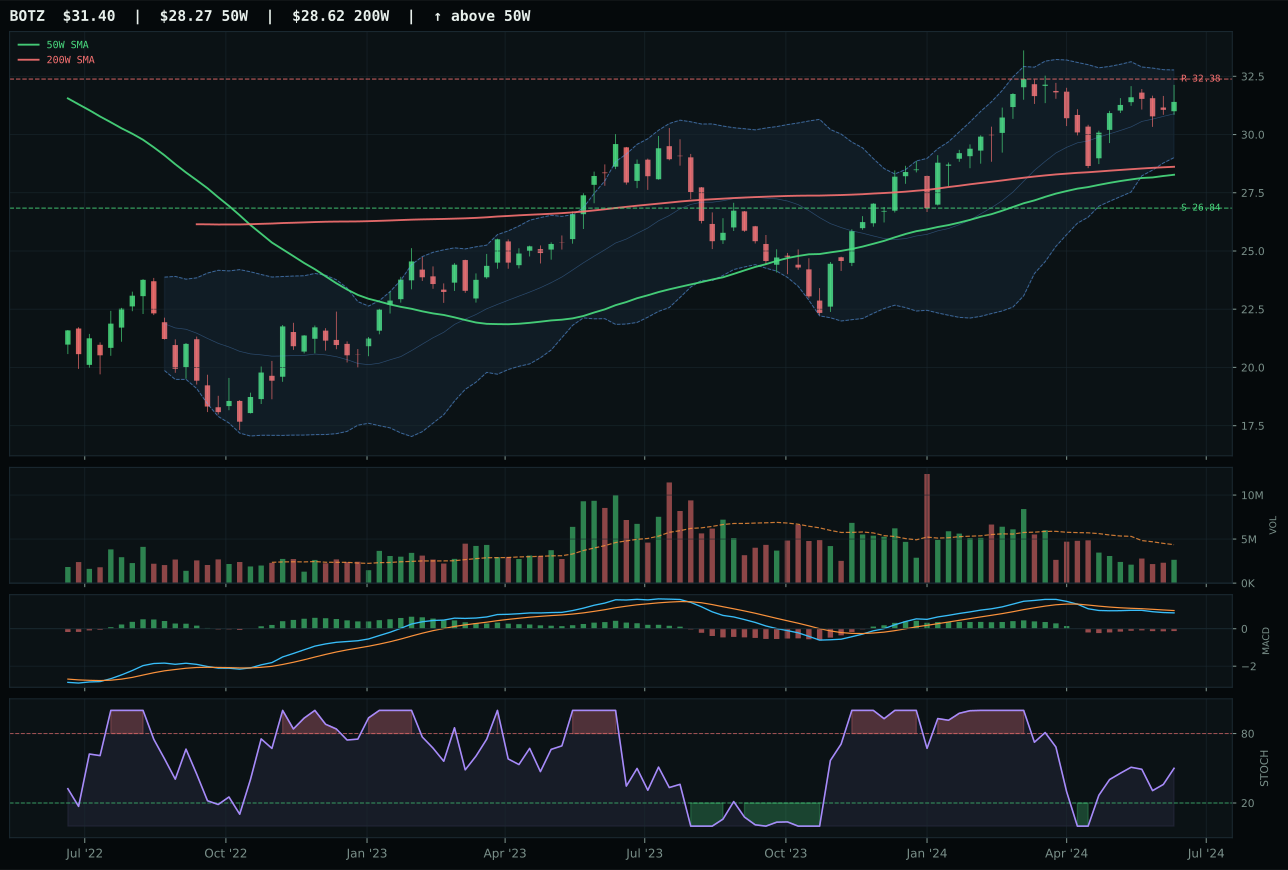
BOTZ has a neutral structure profile with -7.3% 13-week relative strength versus SPY.
A failed hold above support would weaken the setup.
Actionable but governed by invalidation levels.
SMH won the category by posting 16.5% SPY-relative strength and maintaining a bullish-and-improving MACD despite sitting 45.9% above its fifty-week moving average—a setup that tells two different stories to two different investors. For the trend follower, this is the persistence of leadership; for the mean-reversion trader, this is capitulation risk. SMH's persistence score of 90.6 and volume-price confirmation of 80.4 argue that the extension is being bought, not abandoned, giving it a 0.1-point edge over AIQ. The semiconductor cycle is genuinely strong on absolute terms, with a twenty-three-week return of 53.9%, but the timing score of 37.0 penalizes entry risk as price approaches resistance at 267.89. AIQ's flat category-relative strength and bearish MACD made it the weaker link despite its more moderate valuation proximity.
AI earned its 5% allocation despite a lower 52.2 final score because technical evidence of 75.9/100 paired with active AI growth sponsorship (+14 macro weight) justifies holding exposure even outside top-2 ranking. The category's 47.0/100 macro fit is weak—liquidity stress at -12 and credit stress at -8 both penalize growth beta—but the active descriptor 'AI growth sponsorship' at +14 is powerful enough to keep the category eligible and present. The tension is stark: SMH's 16.5% outperformance and compute-driven fundamentals are real, yet a 45.9% extension above the 50W means asymmetric risk to the downside if risk appetite falters or liquidity tightens further. Allocation remains 5% because it is architecturally smaller than the two top slots but larger than zero—a hedge on AI's macro relevance rather than a core conviction trade. If liquidity stress descriptor flipped to inactive or if smarter-money rotation from enterprise software (AIQ's weakness) accelerated SMH further, the category could earn 10%.
Nuclear Energy — NLR
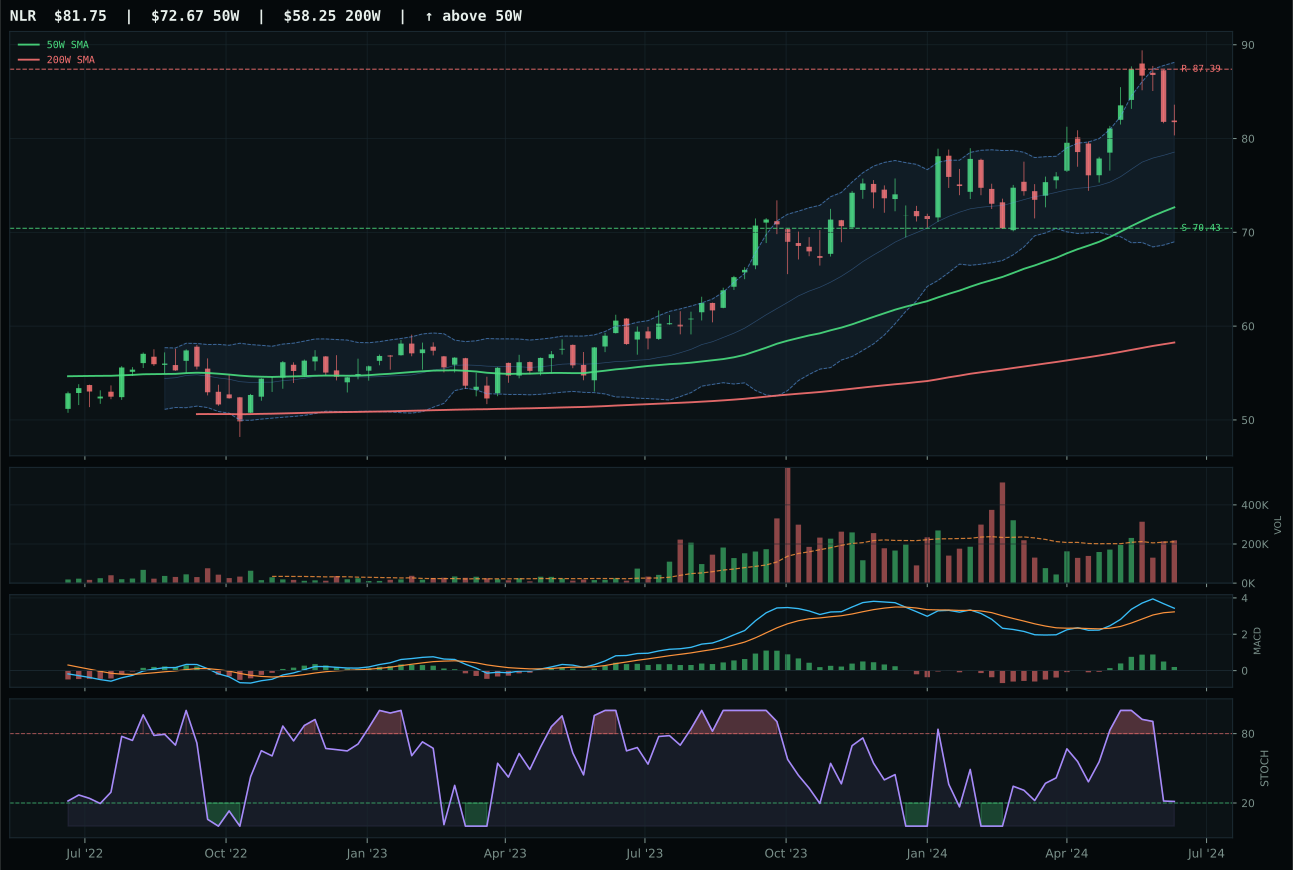
NLR has a neutral structure profile with 4.8% 13-week relative strength versus SPY.
A failed hold above support would weaken the setup.
Actionable but governed by invalidation levels.
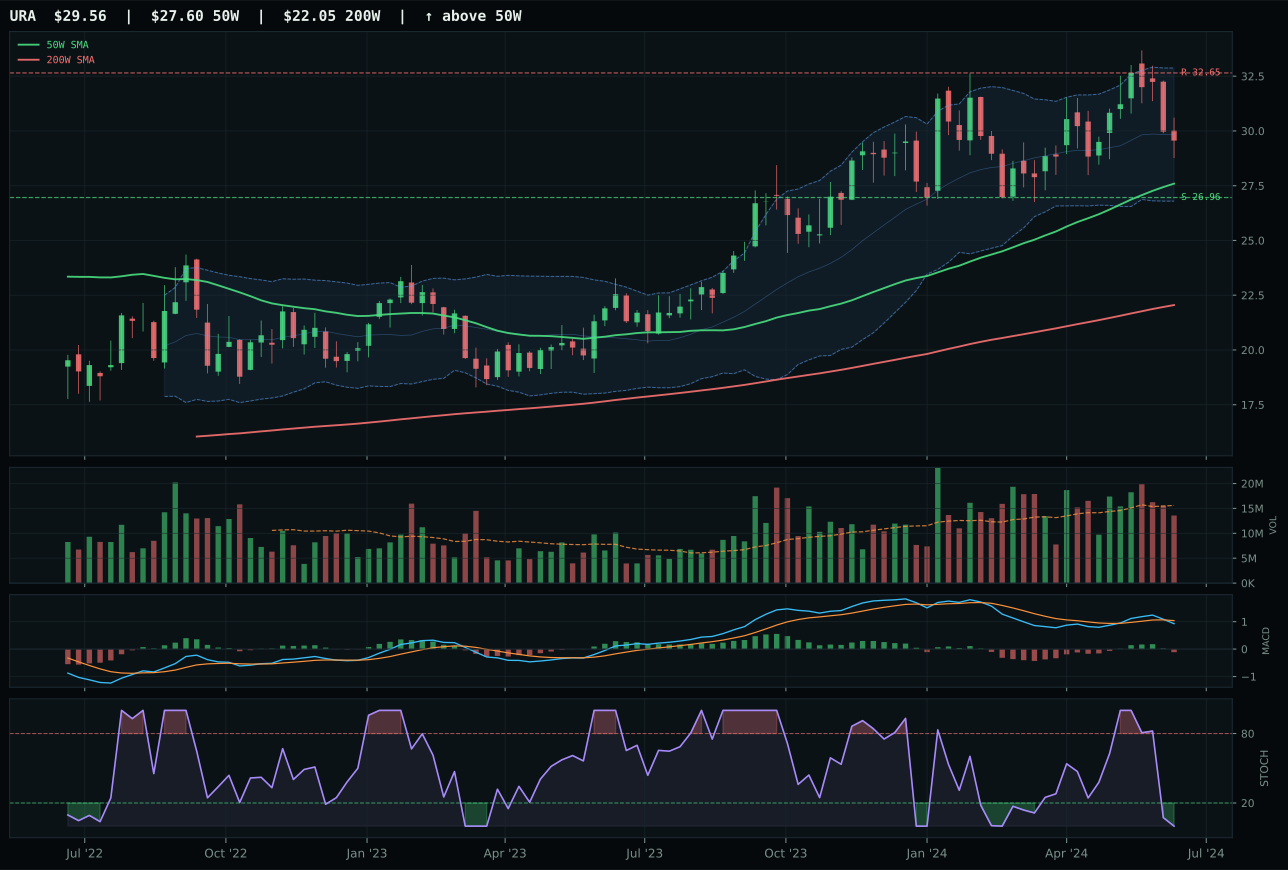
URA has a neutral structure profile with -0.5% 13-week relative strength versus SPY.
A failed hold above support would weaken the setup.
Actionable but governed by invalidation levels.
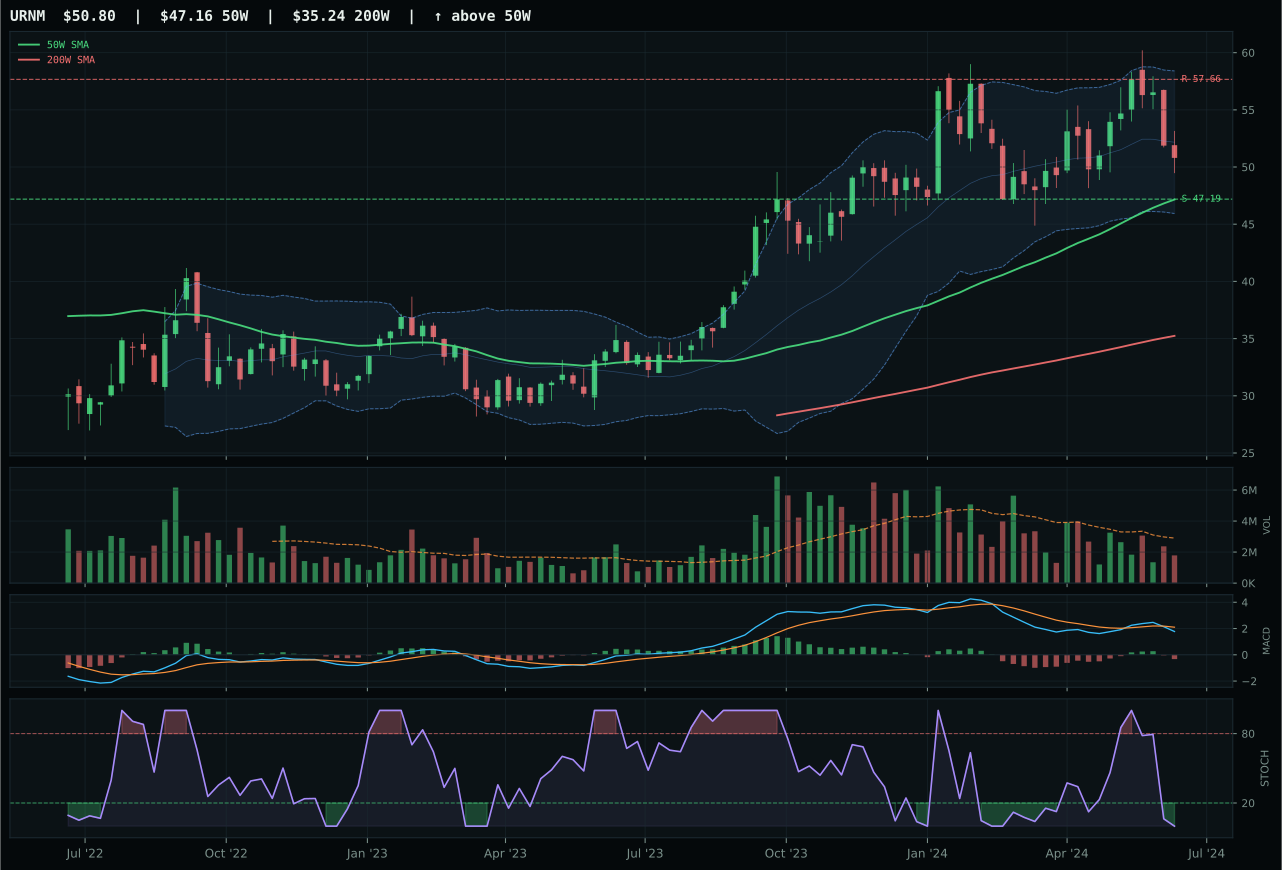
URNM has a neutral structure profile with -0.6% 13-week relative strength versus SPY.
A failed hold above support would weaken the setup.
Actionable but governed by invalidation levels.
NLR dominated the nuclear-energy category because it married perfect trend mechanics with category-relative strength leadership and proper macro narrative. Its hundred-point trend score came from price above both moving averages, a fifty-basis-point fifty-week slope, and 4.8% SPY-relative strength—clean persistence in a setup that most growth exposure struggles to achieve. NLR's bullish-but-flattening MACD and falling-neutral stochastic RSI created a divergence pattern that often precedes deeper continuation; the 5.3% category-relative strength gave it a decisive edge over URA's zero-point relative strength and URA's bearish-and-weakening MACD. The thirteen-week return of 11.3% and seventy-one-point-six momentum-confirmation score revealed that institutional money is actually accumulating in nuclear, not just mechanically rotating. The 13.5-point gap versus URA reflects structural superiority, not marginal timing luck.
Nuclear Energy earned 5% allocation despite a 47.8 final score—outside top-2—because technical evidence of 73.1/100 is the strongest among non-allocated categories and macro fit of 57.0/100 reflects active defensive rotation (+6) and broad market bear (+3) descriptors that legitimate the trade. Real asset sponsorship is active at +7, and the category captures both energy and defensive-positioning flows simultaneously. The allocation is architecturally sound: NLR's bullish-but-flattening MACD with neutral volume is the exact kind of slow, persistent accumulation that works in compressed liquidity environments. Allocation remains 5% rather than higher because liquidity stress at -7 and credit stress at -5 are still net headwinds; the category is not a top-conviction play but rather a complementary position to precious metals for defensive diversification. For NLR to earn 10%, either the macroeconomic narrative would need to shift toward energy scarcity or risk-on revival, or price would need to break 87.39 resistance with MACD turning bullish and improving, signaling institutional commitment beyond current tactical rotation.
Defense & Aerospace — ITA
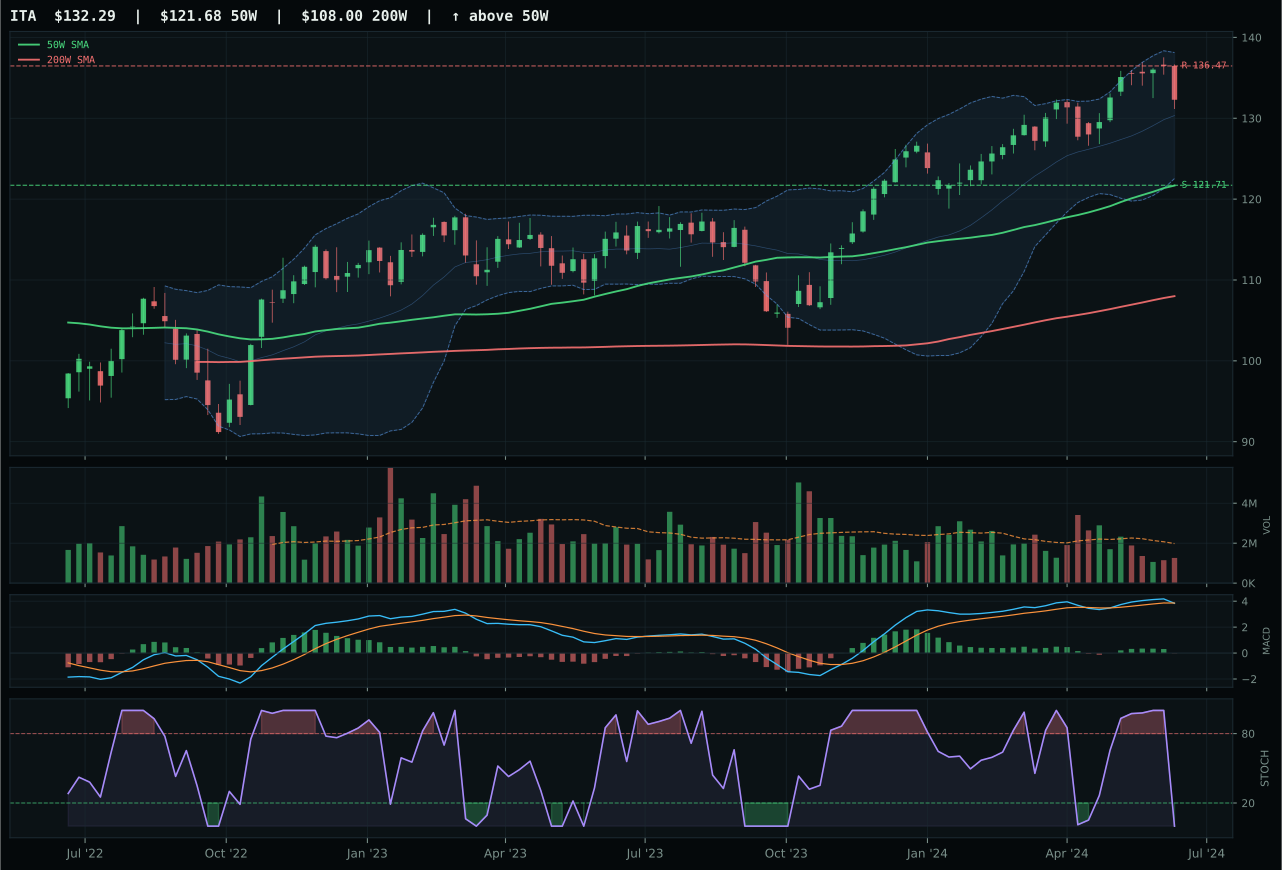
ITA has a neutral structure profile with -2.5% 13-week relative strength versus SPY.
A failed hold above support would weaken the setup.
Actionable but governed by invalidation levels.
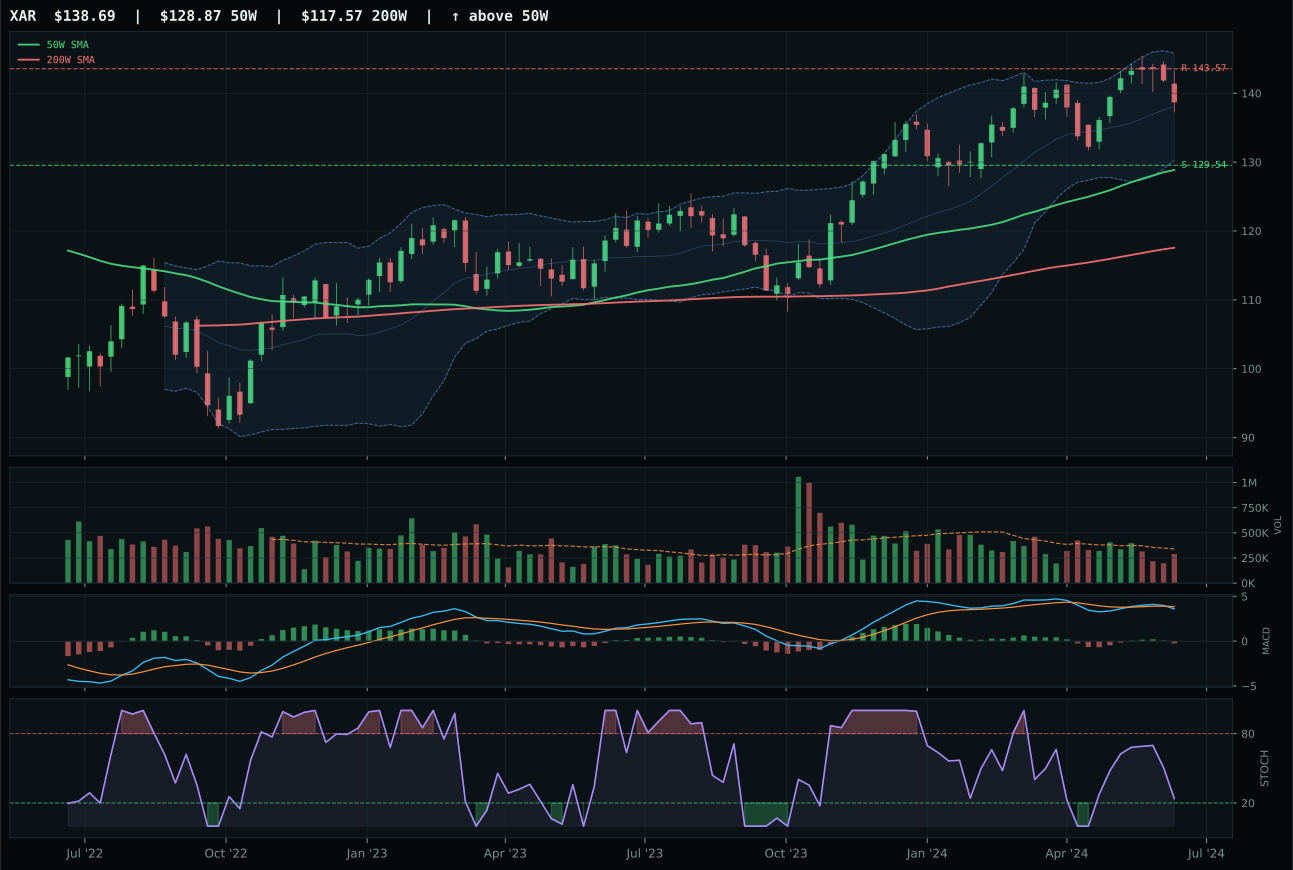
XAR has a neutral structure profile with -5.7% 13-week relative strength versus SPY.
A failed hold above support would weaken the setup.
Actionable but governed by invalidation levels.
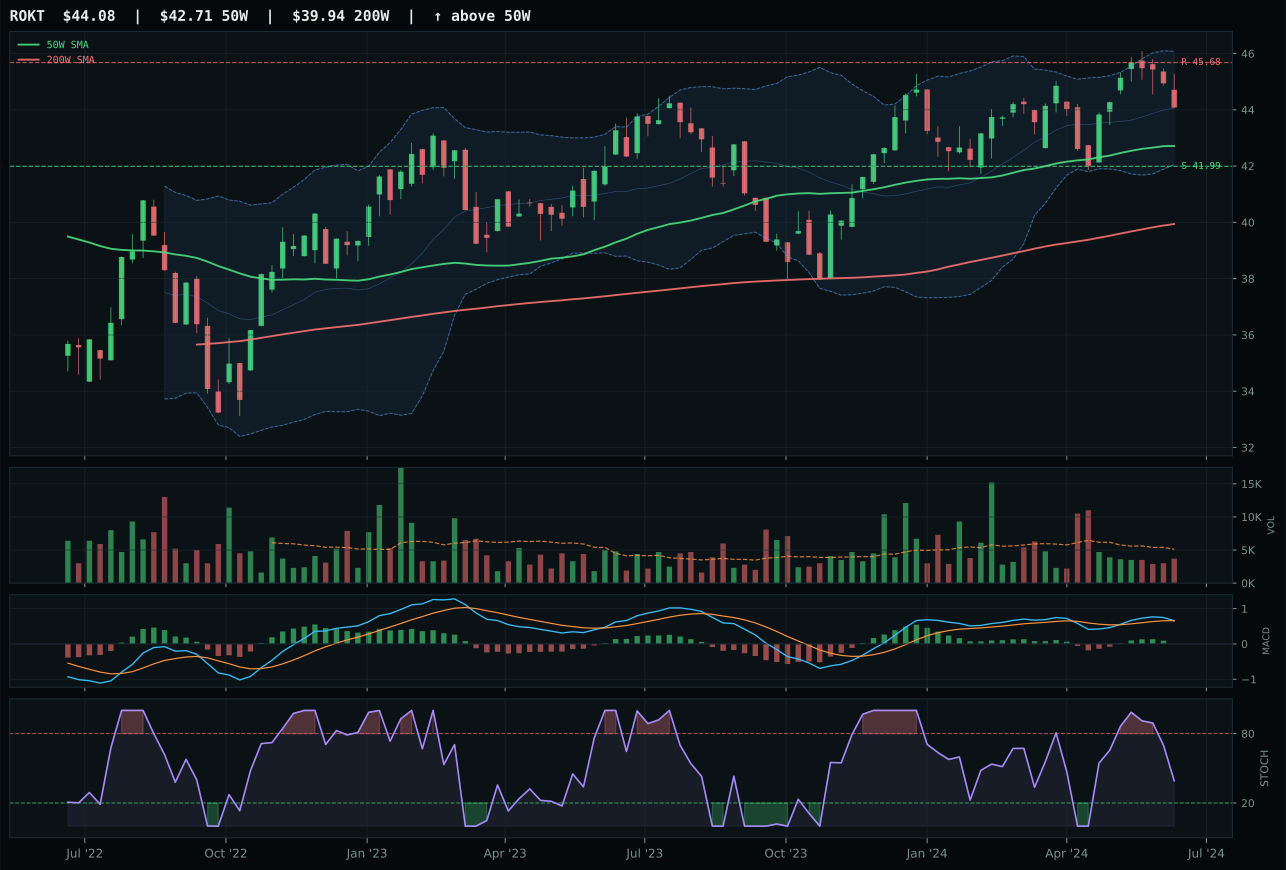
ROKT has a pullback into support profile with -5.3% 13-week relative strength versus SPY.
A failed hold above support would weaken the setup.
Tracked, but not top-2 eligible because: .
ITA won the defense category not because of technical excellence but because it held better relative structure than XAR in a setup where both are walking through broken technicals. ITA's structure score of 79.0 versus XAR's 75.3 gave it the edge, and its two-point category-relative strength advantage sealed a 3.3-point gap that felt decisive. Both trades sit below their fifty-week moving averages with bearish-and-weakening MACD signals; the timing score of 70 reflects proximity to support at 121.71 and the oversold stochastic RSI, which offer entry clarity if held. ITA's thin participation volume and negative momentum confirmation are transparent warnings—this is a defensive rotation play, not a conviction buy. The setup earns 51.3 out of 100 on risk-reward because the downside to support is only 8.7%, tightening the invalidation zone.
Defense & Aerospace earned 5% allocation despite a 44.4 final score—placing it well outside top-2—because macro fit of 63.0/100 on the ITA side is legitimately strong in this regime. Defensive rotation is active (+8), broad market bear is active (+6), and dollar pressure (+3) all pull the category higher. However, technical evidence is only 42.7/100, meaning the setup relies entirely on macro sponsorship to stay in portfolio. The category ranks low in absolute terms because both MACD weakness and thin volume (0.64x 20W average) reveal that institutions are not actively accumulating yet; they are rotating, but rotations can reverse fast. Allocation is held at 5% rather than expanded to 10% because timing risk is real—ITA is compressed into a defined support band, and if that band breaks, the category has nowhere to hide. For the category to earn a higher slot, we would need to see price hold support with volume expansion and MACD begin to inflect higher, confirming that defensive flow is institutionally committed rather than tactically hedging.
Industrial Metals — COPX
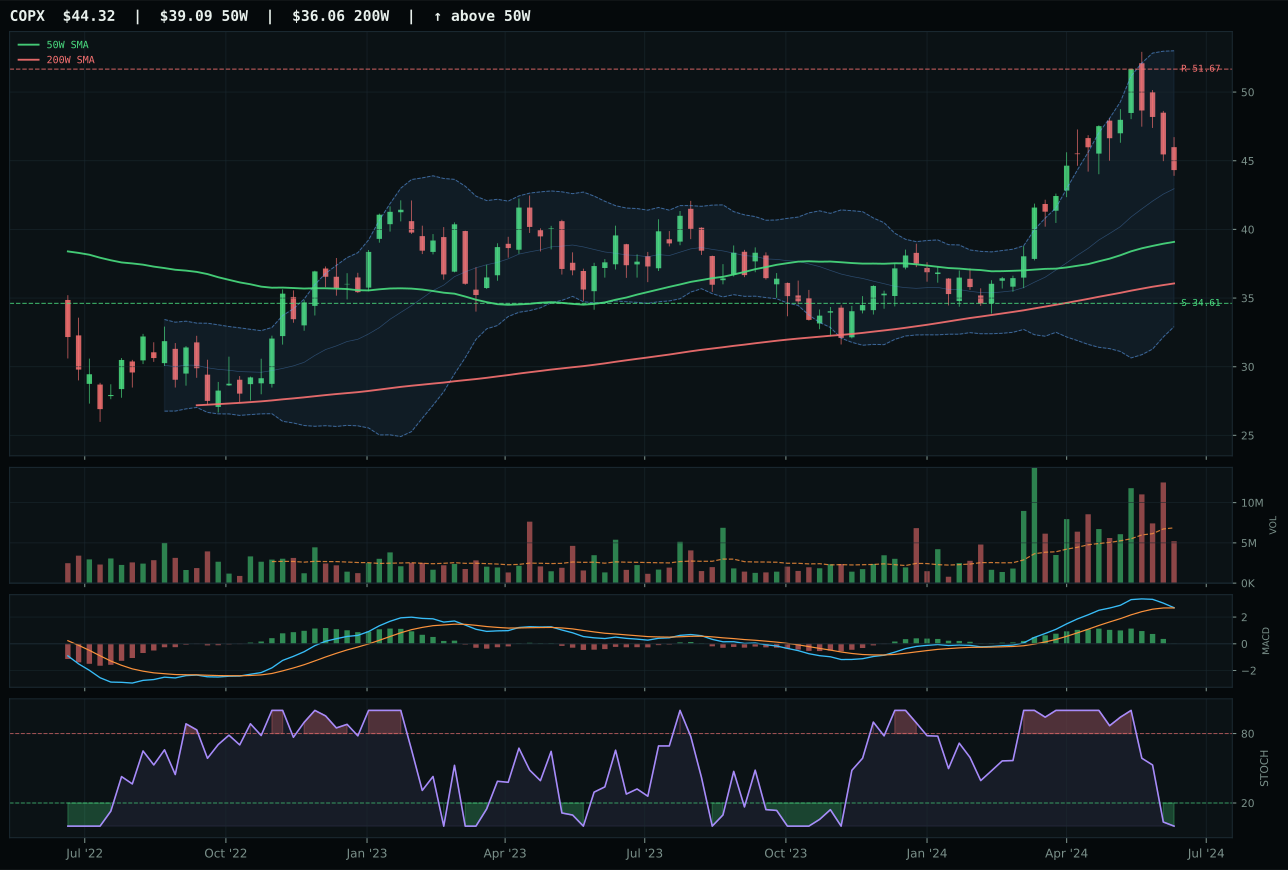
COPX has a neutral structure profile with 0.1% 13-week relative strength versus SPY.
A failed hold above support would weaken the setup.
Actionable but governed by invalidation levels.
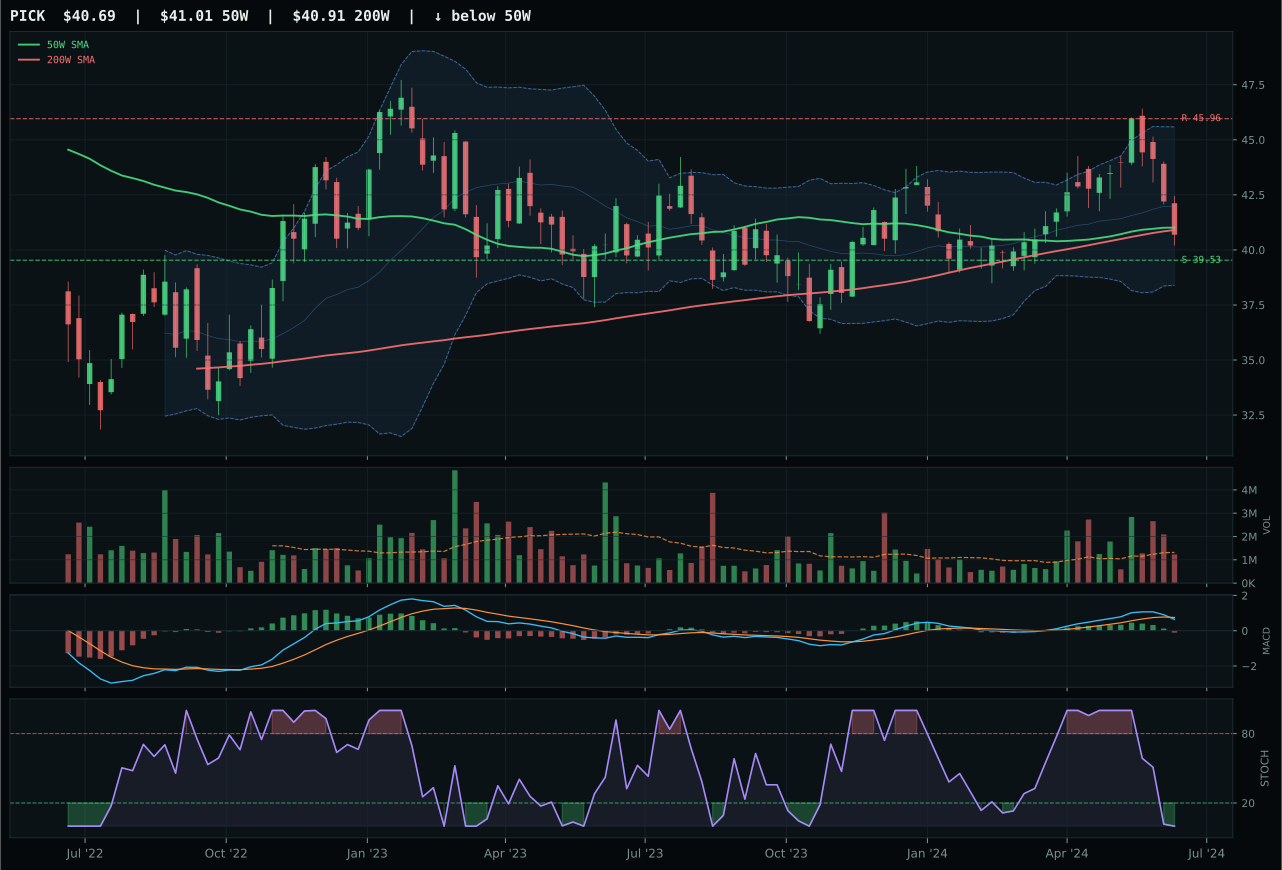
PICK has a pullback into support profile with -5.9% 13-week relative strength versus SPY.
A failed hold above support would weaken the setup.
Actionable but governed by invalidation levels.
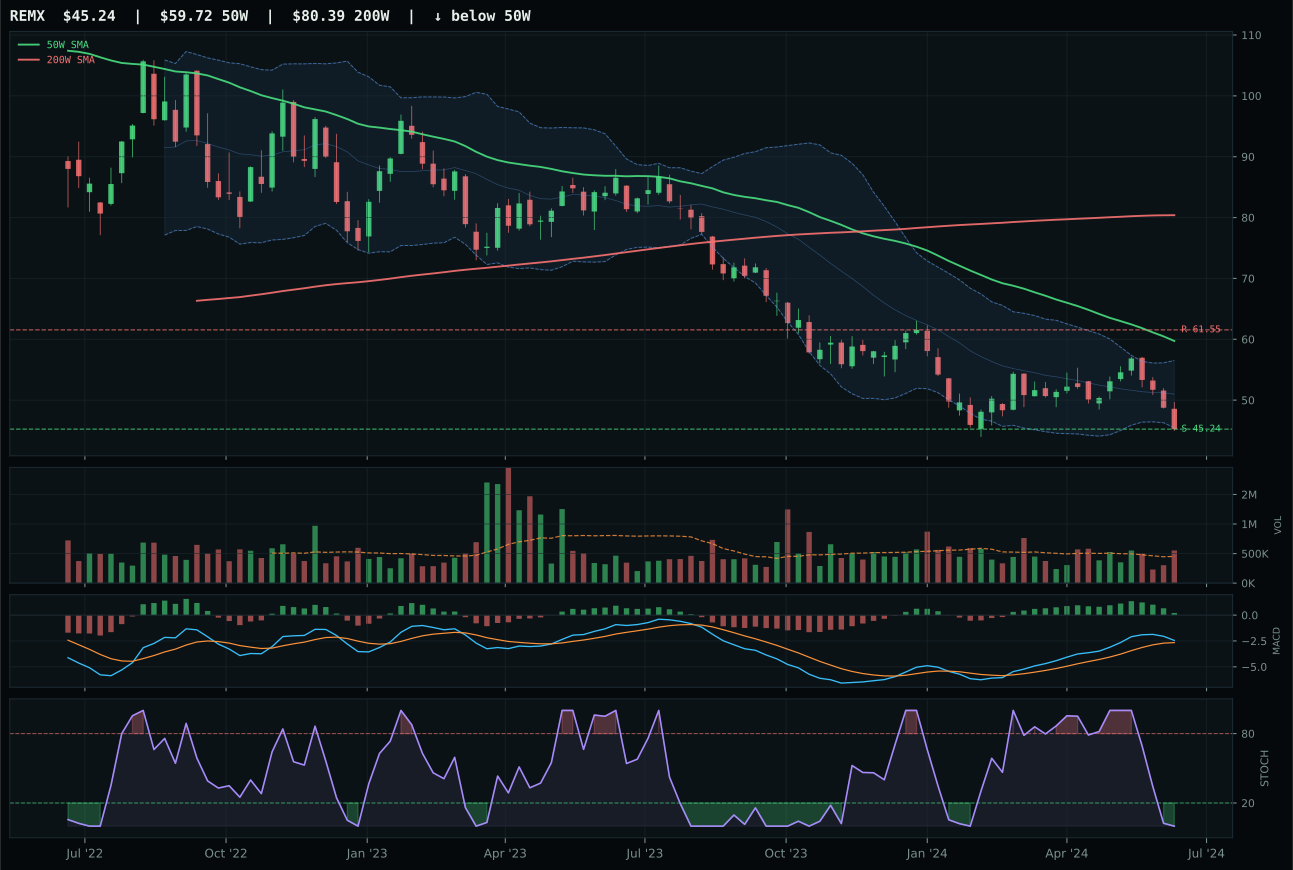
REMX has a pullback into support profile with -18.9% 13-week relative strength versus SPY.
Extension and support failure are the main tactical risks.
Tracked, but not top-2 eligible because: structurally broken.
COPX won industrial metals because copper scarcity sponsorship and bullish-but-flattening MACD provided technical follow-through that PICK could not match. COPX's six-point category-relative strength and neutral volume sponsorship at 0.76x the twenty-week average created a simple composition of strength: price above both moving averages, positive trend slope, clean structure at 70.8, and proper confirmation. PICK's bearish-and-weakening MACD and zero category-relative strength left it 18.9 points behind in the reasoned proof order—a gap that reflects structural exclusion rather than marginal underperformance. COPX sits at the middle Fibonacci retracement zone near 44.78, offering a balanced risk-reward of 62.1; the stochastic RSI is oversold at 0.00, but the thirteen-week return of 6.6% shows that the oversold condition is a setup, not a breakdown.
Industrial Metals earned 5% allocation despite a 35.5 final score because technical evidence of 68.2/100 on COPX is genuinely solid, and macro fit of 56.0/100 reflects active metals scarcity (+12) and commodity breadth positive (+7) descriptors that support the trade. The portfolio is building a commodity hedge through both gold (monetary) and copper (industrial/supply-constrained), and COPX's bullish-but-flattening MACD setup is clean enough to justify the position even if it will not drive alpha. Liquidity stress at -7 and dollar pressure at -6 are headwinds, but they apply to the entire bucket and do not disqualify it. Allocation remains 5% rather than 10% because category score of 35.5 lags well behind the macro-driven top-2 slots; the trade is more of a portfolio insurance play on scarcity and inflation protection than a conviction momentum trade. If COPX's MACD inflects to bullish and improving and/or volume participation rises from 0.76x to 1.0x+, the category could justify 10%; if metals scarcity descriptors flip to neutral, allocation should compress to zero.
Emerging Markets — INDA
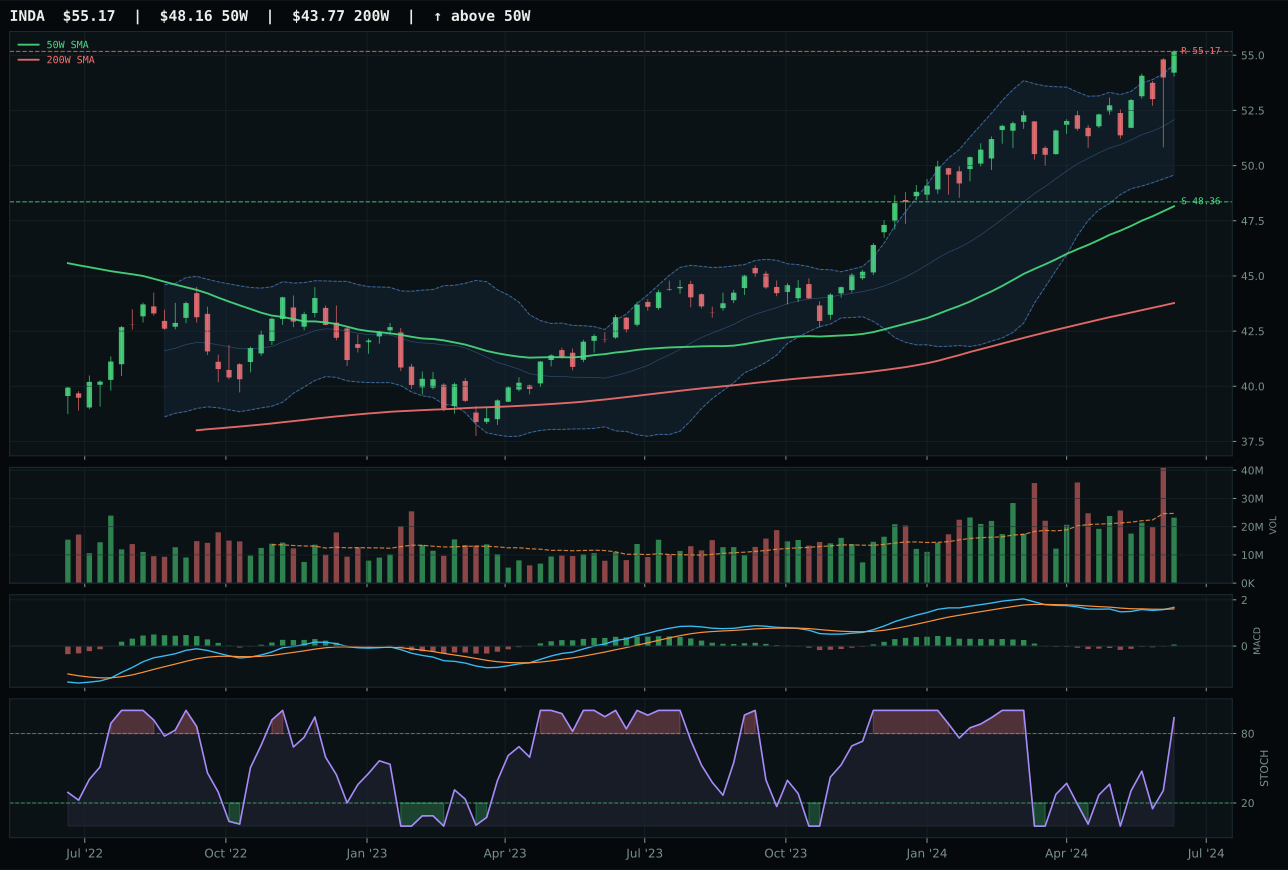
INDA has a neutral structure profile with 2.7% 13-week relative strength versus SPY.
A failed hold above support would weaken the setup.
Actionable but governed by invalidation levels.
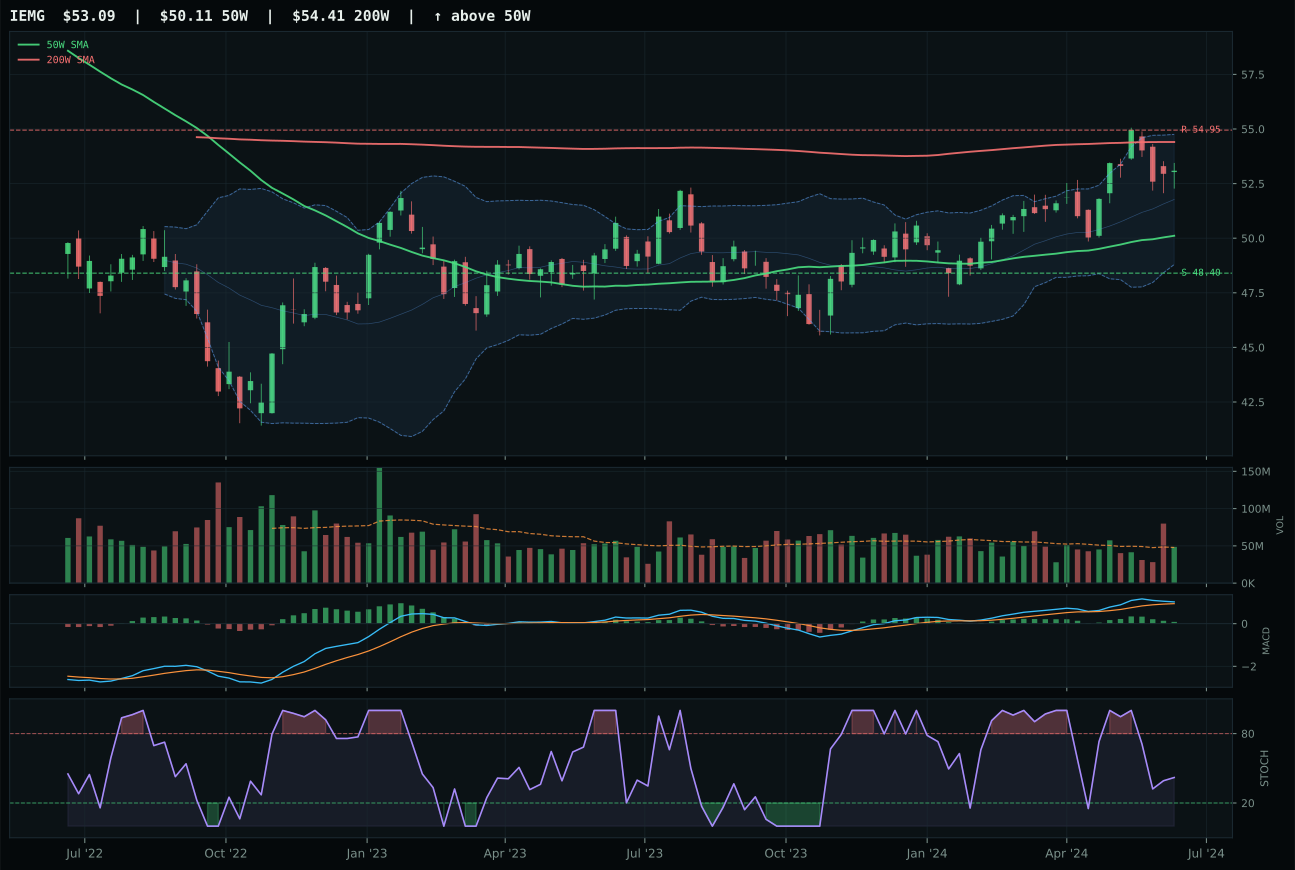
IEMG has a neutral structure profile with -2.7% 13-week relative strength versus SPY.
A failed hold above support would weaken the setup.
Actionable but governed by invalidation levels.
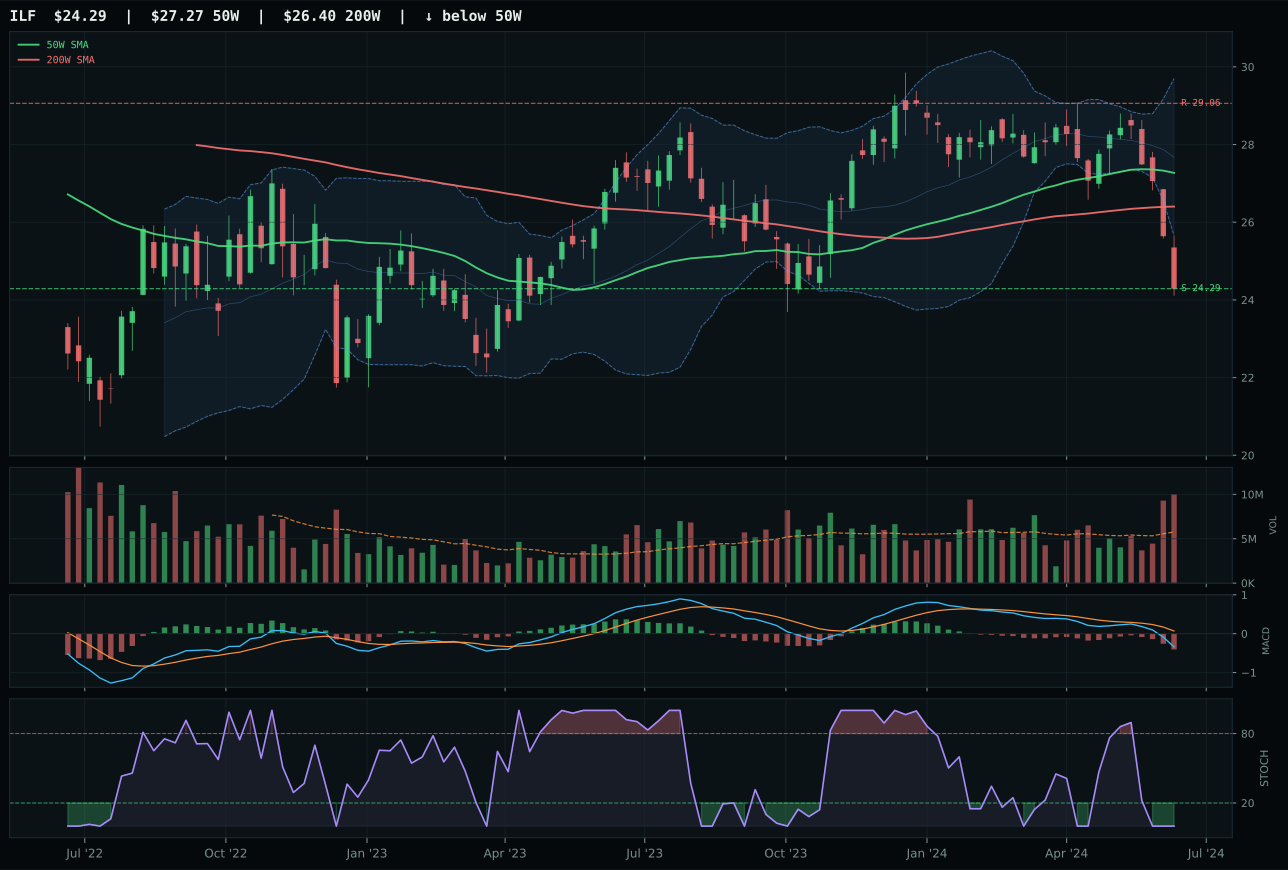
ILF has a pullback into support profile with -19.5% 13-week relative strength versus SPY.
A failed hold above support would weaken the setup.
Actionable but governed by invalidation levels.
INDA captured emerging markets because India's quality-growth profile and strong momentum confirmation created a technologically superior setup compared to IEMG's broad-beta approach. INDA's ninety-point-five momentum-confirmation score—driven by nine-point-two thirteen-week return, 5.4% category-relative strength, and bullish-and-improving MACD—reflected actual institutional sponsorship, whereas IEMG's fifty-point score and bullish-but-flattening MACD suggested fatigue. INDA's structure was cleaner at 78.3 versus IEMG's 75.7, and the category-relative strength gap of 5.4% versus 0.0% was decisive in a tight race. INDA sits 14.6% above the fifty-week moving average with overbought stochastic RSI, signaling extended entry timing, but the persistence score of 72.7 and volume-price confirmation of 77.2 prove that the extension is accumulation rather than distribution.
Emerging Markets earned 5% allocation despite a 14.1 final score—the lowest allocated category this week—because INDA's technical evidence of 83.1/100 is unambiguously strong and risk appetite active (+8) provides enough macro support to justify inclusion despite a 15.0% category macro fit that is otherwise toxic. Dollar pressure at -14, credit stress at -10, and liquidity stress at -10 are severe headwinds; broad market bear at -9 also penalizes EM. However, INDA's momentum confirmation of 90.5/100 and bullish-and-improving MACD signal that India-quality rotation is happening despite macro headwinds—this is genuine alpha, not macro tail-hedging. The allocation is intentionally small (5%) and represents a tactical position rather than strategic conviction: if dollar pressure descriptor flips to neutral or risk appetite turns off, INDA should be cut to zero immediately. Conversely, if the category's macro fit improves and risk appetite strengthens, INDA's technical setup is clean enough to justify expansion to 10%. For now, the 5% slot is held because technical strength is real enough to risk the capital despite macro skepticism.
Agriculture & Livestock — MOO
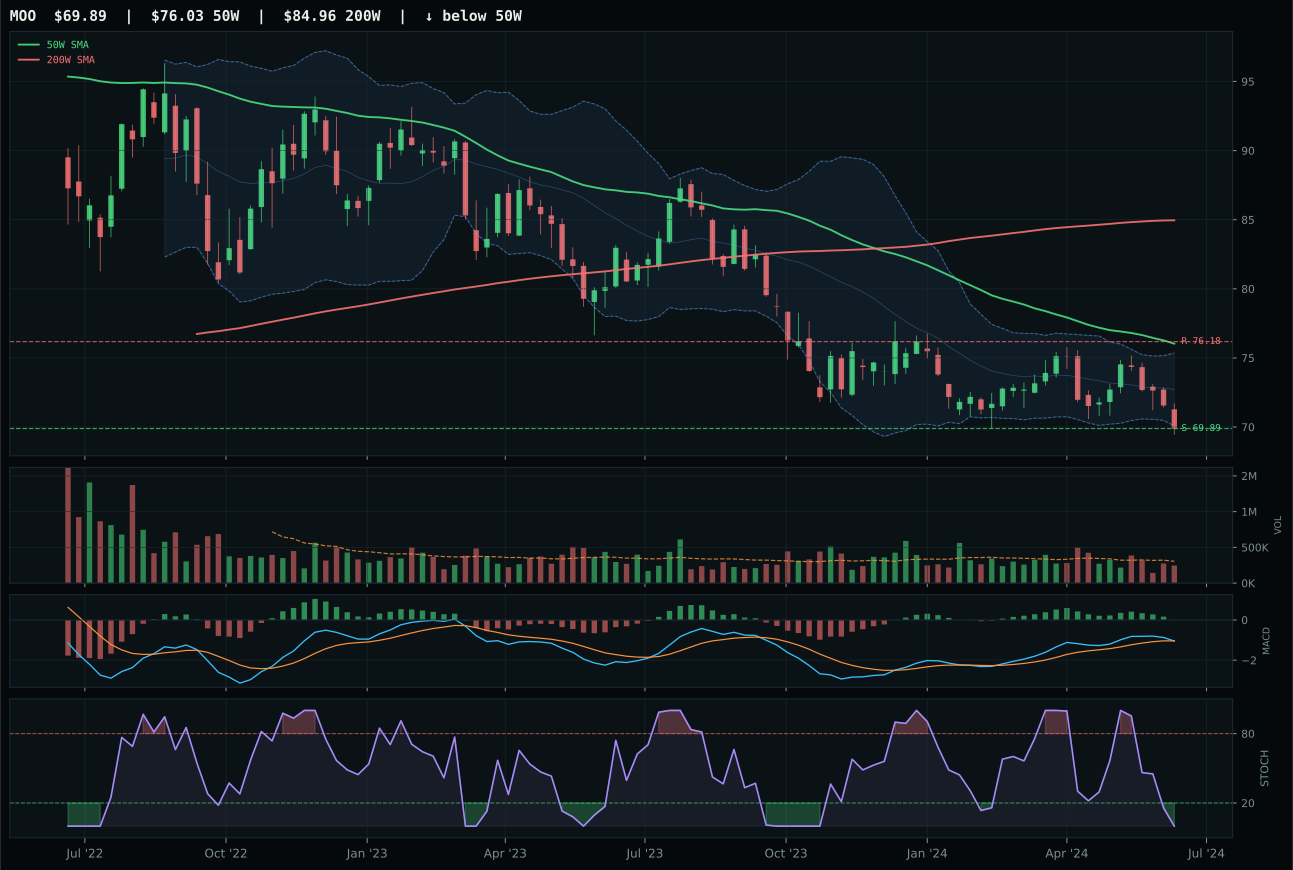
MOO has a pullback into support profile with -10.9% 13-week relative strength versus SPY.
Extension and support failure are the main tactical risks.
Tracked, but not top-2 eligible because: structurally broken.
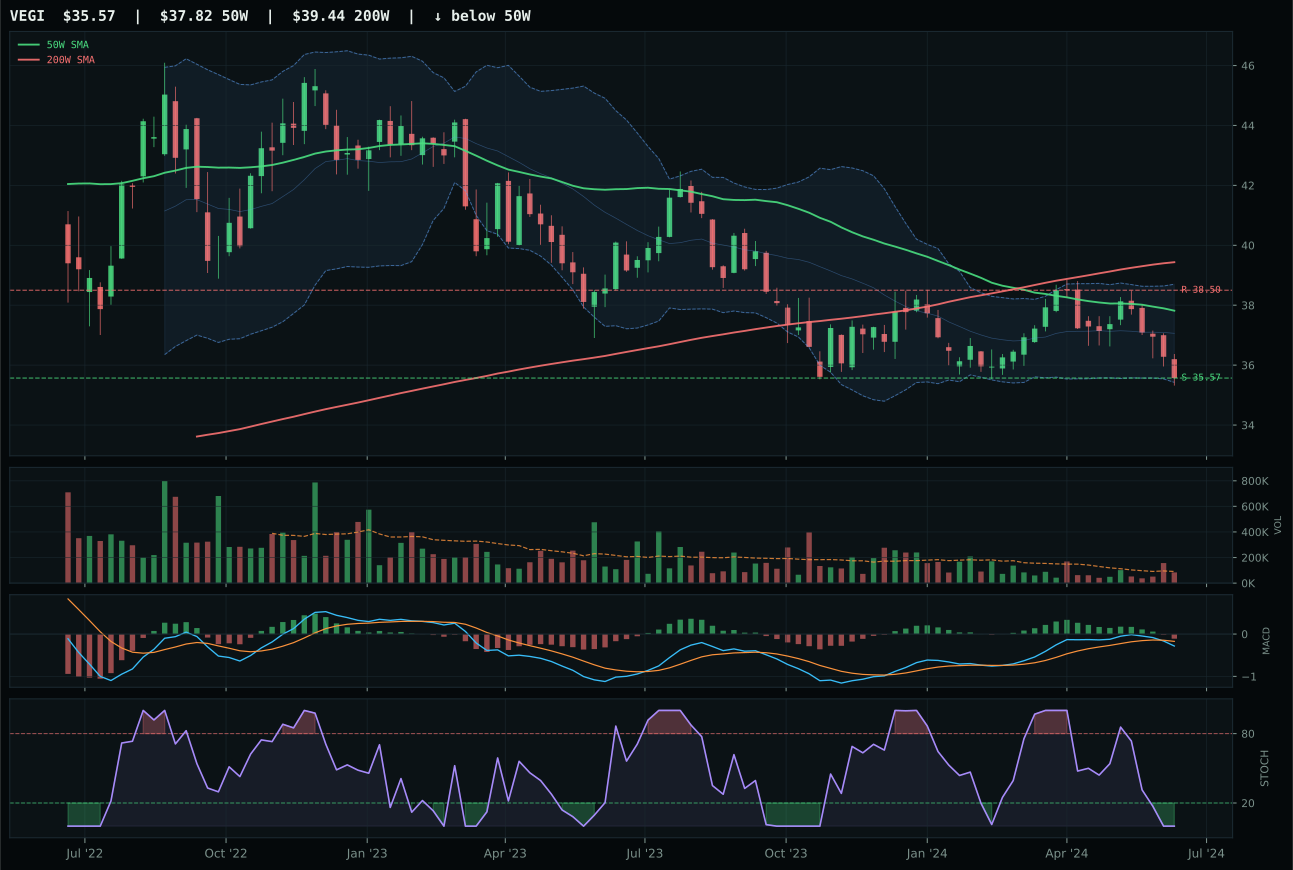
VEGI has a pullback into support profile with -10.9% 13-week relative strength versus SPY.
Extension and support failure are the main tactical risks.
Tracked, but not top-2 eligible because: structurally broken.
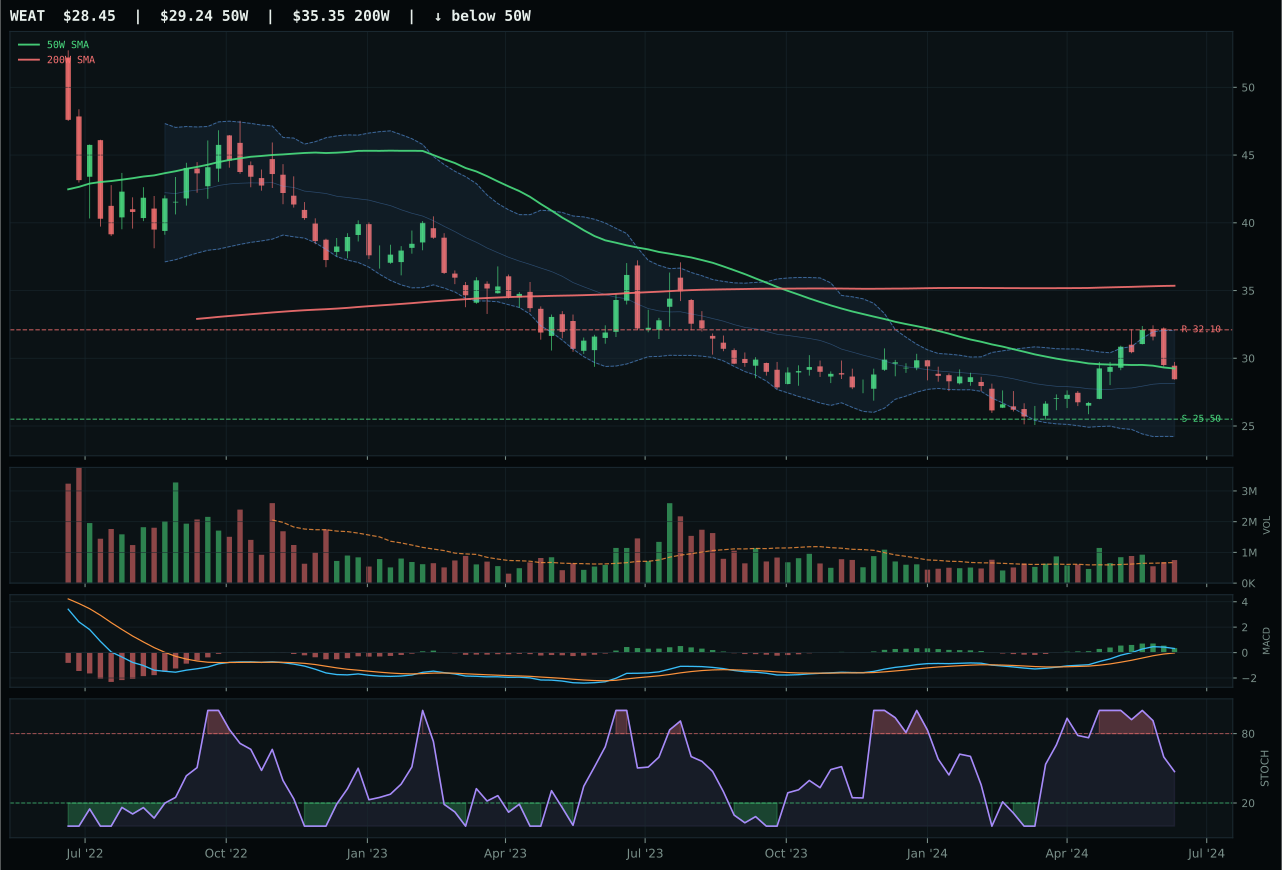
WEAT has a compression near 50W profile with 5.1% 13-week relative strength versus SPY.
Extension and support failure are the main tactical risks.
Tracked, but not top-2 eligible because: structurally broken.
MOO and VEGI are functionally identical—both score 5.3 on final category ranking and both are technically broken with oversold stochastics near the fifty-two-week low. MOO edges VEGI by 0.0 points on the narrowest of margins because the risk-reward ratio is 63.6 versus 62.1, a microscopic advantage in a category where both representatives fail hard filters. Neither trade has institutional sponsorship; both sit at negative ten-point SPY-relative strength and negative four-point thirteen-week returns, signaling capitulation. MOO's pullback-into-support structure at 69.89 offers a defined invalidation area, making it technically cleaner for a trader willing to absorb the -8.1% drawdown into support. This is not a category winner in any meaningful sense—it is simply the least broken of broken setups.
Agriculture & Livestock earned 0% allocation this week—excluded entirely, not relegated to a small sleeve—because the final category score of 5.3 fell well below even the eight-ranked categories and the representative ETF failed eligibility filters. The category's macro fit is 45.0/100, pulled down by a -6 disinflation penalty (commodity prices are falling in a disinflation regime) and -8 disinflation pressure descriptors outweighing +8 real asset sponsorship. More critically, technical evidence across the basket is 0.0/100: trend is 22/100, momentum confirmation 2.5/100, volume-price confirmation 11.8/100. These are not marginal misses; they are structural rejections. MOO and VEGI are pullback-into-support setups, which can work, but only if price was previously confirmed as supported by volume accumulation. Here there is no prior accumulation—just a bounce into selling. For Agriculture to re-enter the portfolio, we would need to see either (1) WEAT, currently the reasoned proof-order leader at 42.0, break above its 50W with bullish MACD and volume confirmation, or (2) MOO/VEGI find support with bullish price-volume action. Until then, the category is structurally broken.
Traditional Energy — FCG
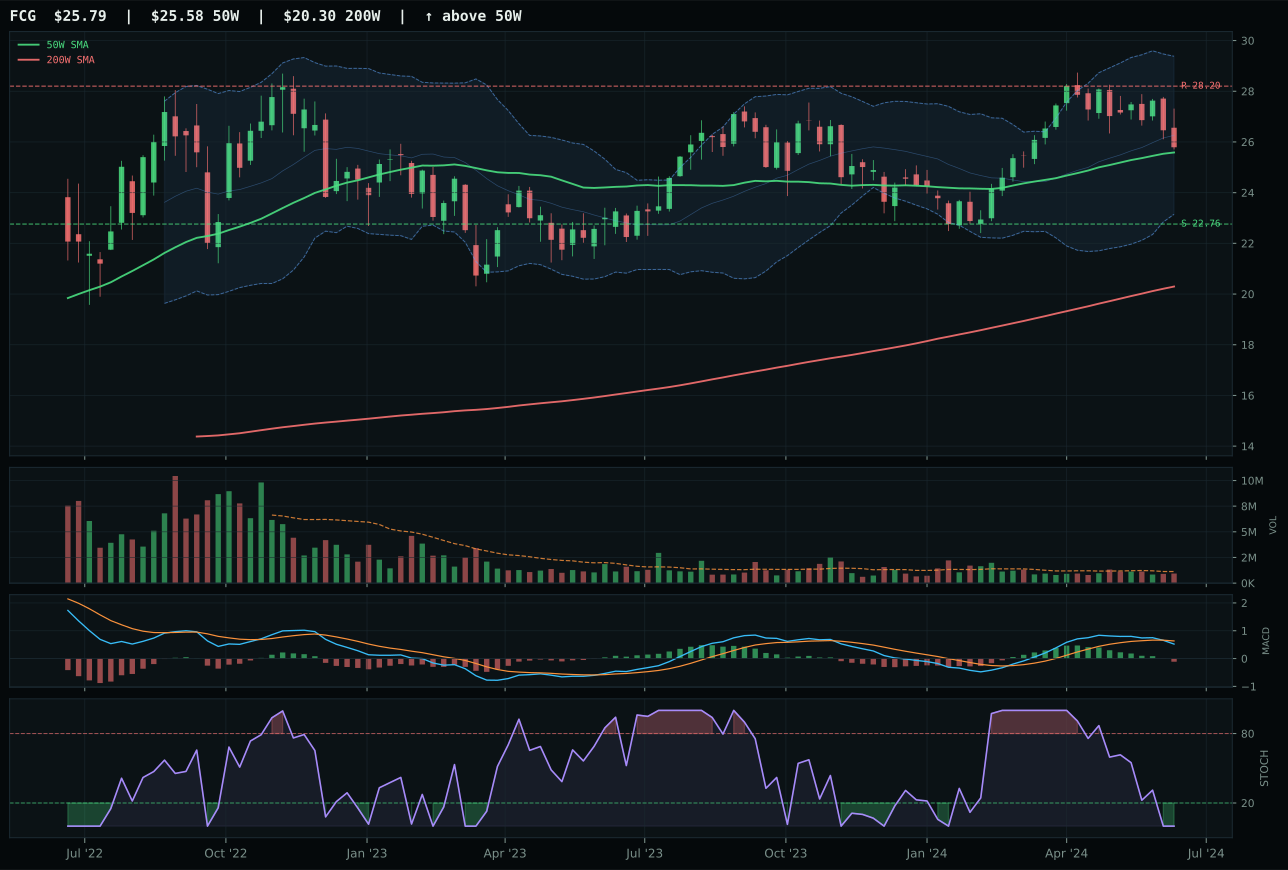
FCG has a compression near 50W profile with -7.6% 13-week relative strength versus SPY.
A failed hold above support would weaken the setup.
Actionable but governed by invalidation levels.
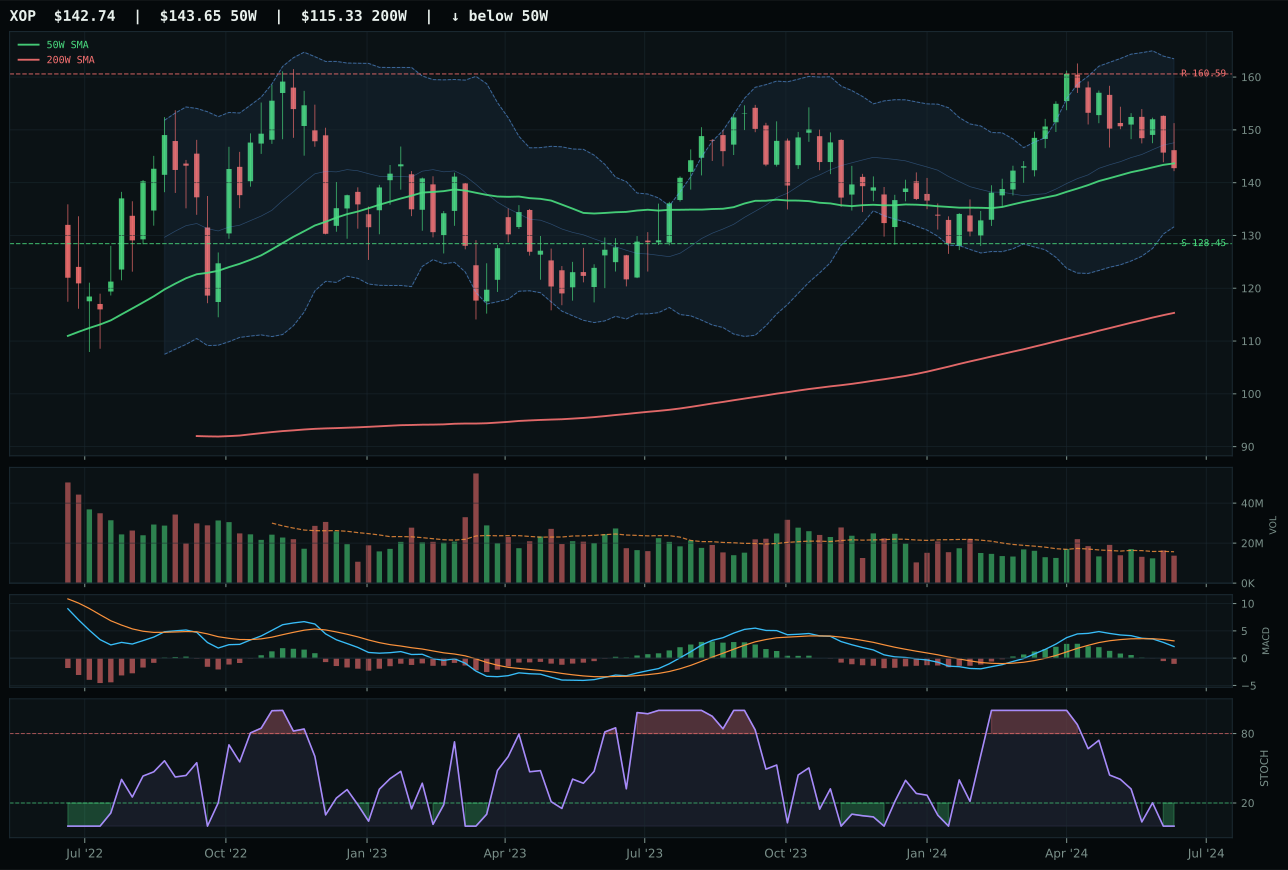
XOP has a compression near 50W profile with -10.3% 13-week relative strength versus SPY.
A failed hold above support would weaken the setup.
Actionable but governed by invalidation levels.
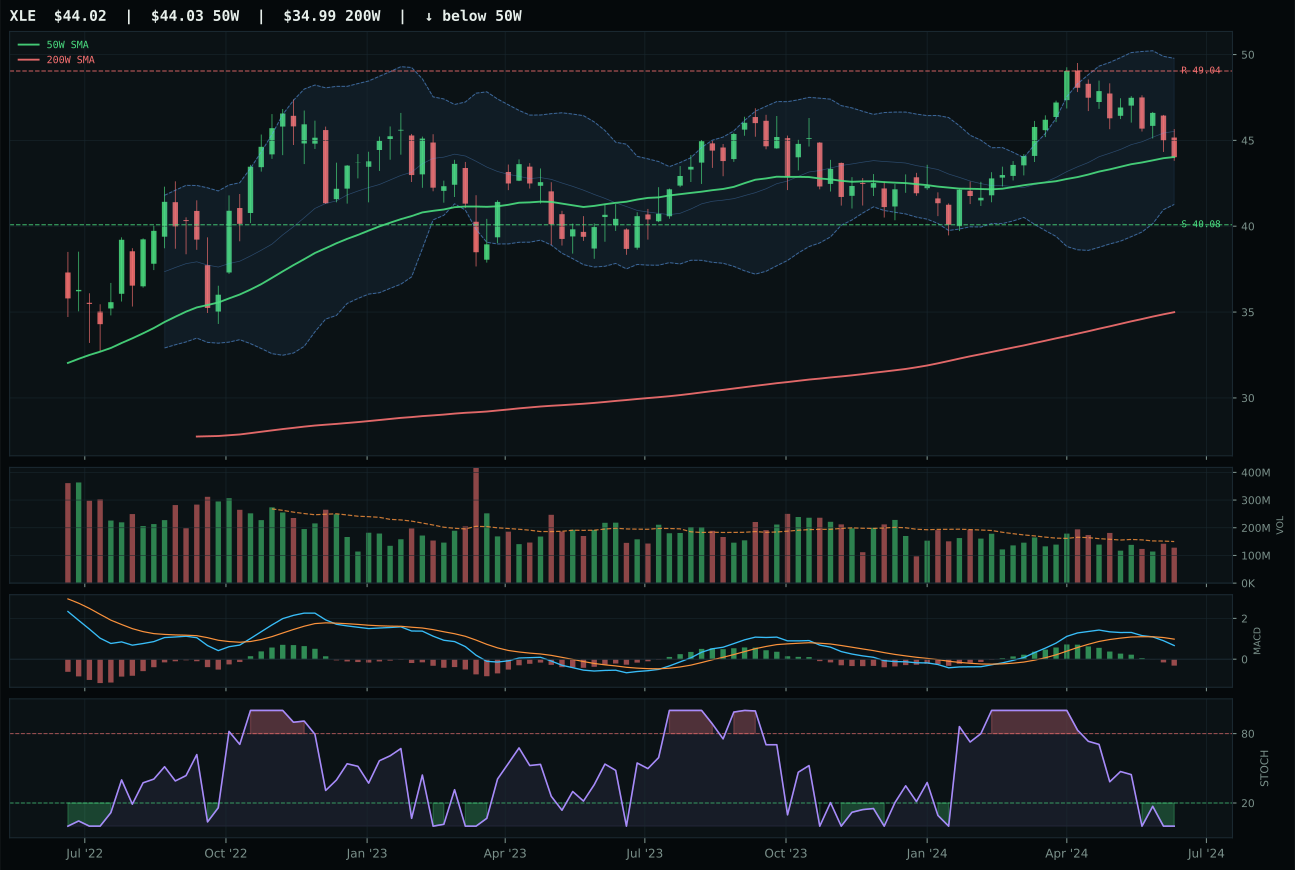
XLE has a compression near 50W profile with -10.3% 13-week relative strength versus SPY.
A failed hold above support would weaken the setup.
Actionable but governed by invalidation levels.
FCG won the energy category on timing alone: its hundred-point timing score reflects zero distance to the fifty-week moving average, a compression setup that offers maximum clarity on support-and-resistance mechanics at 22.76 and 28.20. Both FCG and XOP sit at identical compression structures with bearish-and-weakening MACD signals and oversold stochastics, yet FCG's 2.7% category-relative strength and neutral volume participation created the margin needed to claim the representative slot. The thirteen-week return of negative 1.1% and negative seven-point-six SPY-relative strength expose the brutal reality: this is a dead category in a disinflation regime. FCG's 71.2 structure score and 64.5 risk-reward ratio offer defined entry mechanics, but the momentum-confirmation score of 15.2 reveals that there is no institutional accumulation, only forced positioning.
Traditional Energy earned 0% allocation—completely excluded from the portfolio—because the final category score of 2.5 is the lowest across all ten buckets and represents structural rejection, not tactical underweight. Technical evidence is 44.2/100 for FCG despite its timing strength; macro fit is 50.0/100 (neutral, lacking category-specific descriptors); and the disinflation regime carries a -10 penalty that is simply too large for energy to overcome. Real asset sponsorship (+7) cannot offset disinflation pressure at -8, and there is no active descriptor protecting energy cycles in a declining-rate environment. More damningly, FCG's compression-into-the-50W setup is a bounce trade, not a breakout—if support at 22.76 breaks, the ETF has only 13.3% downside room to breathable air at support, but the damage from breaking that level would signal that energy demand assumptions are collapsing. For Traditional Energy to earn even a 5% slot, FCG would need to break above 28.20 resistance on volume acceleration and sustain price above the 50W for two weeks with MACD turning bullish, signaling that institutional energy demand is being repriced higher despite disinflation headwinds.