
2024-06-07
Informational purposes only. The content in this report, including allocations, analysis, and commentary, is provided solely for informational and educational purposes. It does not constitute financial advice, investment advice, trading advice, or any other type of advice. Past performance does not guarantee future results. Always conduct your own research and consult a qualified financial professional before making investment decisions.
Weekly Allocation
| Ticker | Category | Weight | Role |
|---|---|---|---|
| FBTC | 50% | Overlay | |
| NLR | Nuclear Energy | 10% | Top-2 (10%) |
| GLD | Precious Metals | 10% | Top-2 (10%) |
| ITA | Defense & Aerospace | 5% | Tier-2 (5%) |
| XLE | Traditional Energy | 5% | Tier-2 (5%) |
| IGF | Utilities & Infrastructure | 5% | Tier-2 (5%) |
| PICK | Industrial Metals | 5% | Tier-2 (5%) |
| SMH | AI | 5% | Tier-2 (5%) |
| WEAT | Agriculture & Livestock | 5% | Tier-2 (5%) |
Trade Instructions — Monday Open
Sell the tranche from 2024-05-10 (completing its 4-week hold). Buy the new tranche. Instructions show net portfolio changes — same-asset positions cancel, weight changes show the delta.
| Action | Ticker | Instruction |
|---|---|---|
| SELL | XLE | Sell 14% of XLE position (reduce 8.75% → 7.50%) |
| SELL | COPX | Sell 25% of COPX position (reduce 5.00% → 3.75%) |
| SELL | XLU | Sell 25% of XLU position (reduce 5.00% → 3.75%) |
| SELL | XAR | Sell 25% of XAR position (reduce 5.00% → 3.75%) |
| SELL | BOTZ | Sell entire BOTZ position (1.25% of portfolio) |
| BUY | NLR | Buy NLR — 20.00% of freed cash (adds 1.25% to portfolio) |
| BUY | SMH | Buy SMH — 20.00% of freed cash (adds 1.25% to portfolio) |
| BUY | PICK | Buy PICK — 20.00% of freed cash (adds 1.25% to portfolio) |
| BUY | ITA | Buy ITA — 20.00% of freed cash (adds 1.25% to portfolio) |
| BUY | IGF | Buy IGF — 20.00% of freed cash (adds 1.25% to portfolio) |
Current Portfolio After Trade
Combined holdings across all 4 active tranches. Each tranche is 25% of the portfolio.
| Ticker | % of Portfolio | Weight Bar |
|---|---|---|
| FBTC | 50.00% | |
| NLR | 7.50% | |
| XLE | 7.50% | |
| WEAT | 5.00% | |
| SLV | 5.00% | |
| SMH | 5.00% | |
| COPX | 3.75% | |
| XLU | 3.75% | |
| XAR | 3.75% | |
| PICK | 2.50% | |
| GLD | 2.50% | |
| URNM | 1.25% | |
| ITA | 1.25% | |
| IGF | 1.25% |
Macro Regime — Late-Cycle Reflation
Macro Evidence Charts
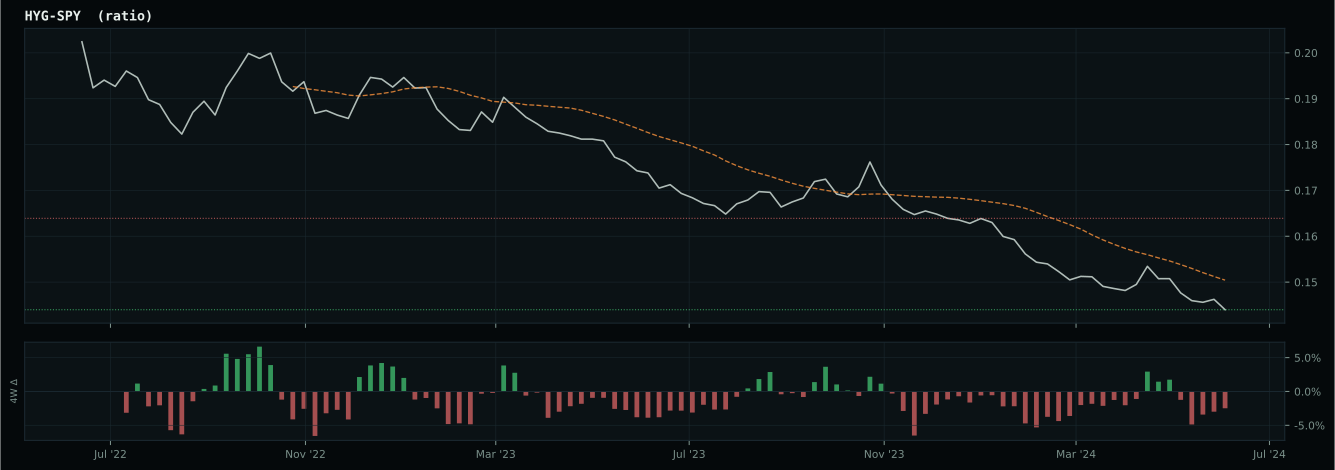
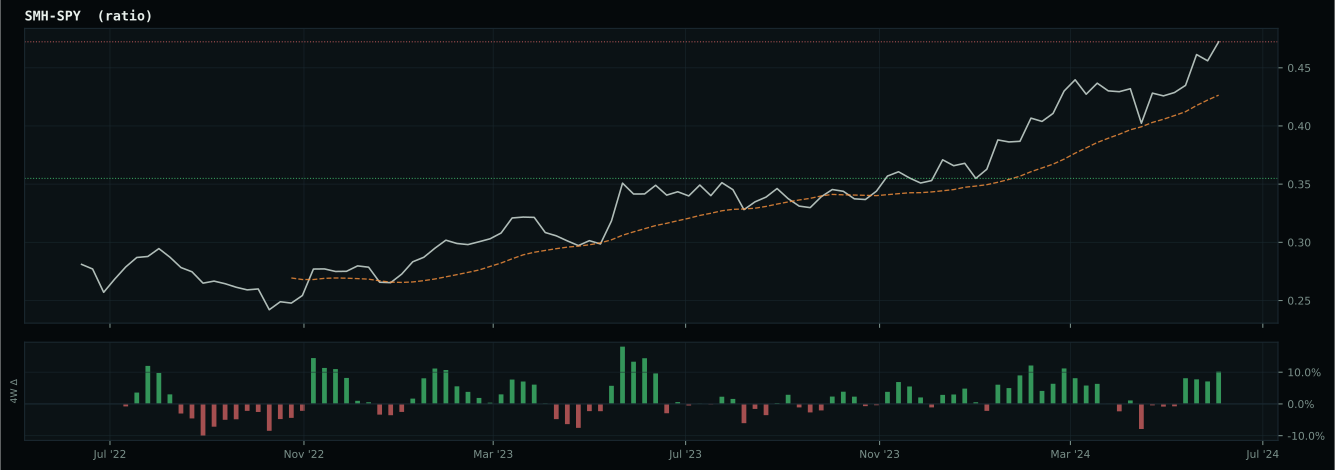
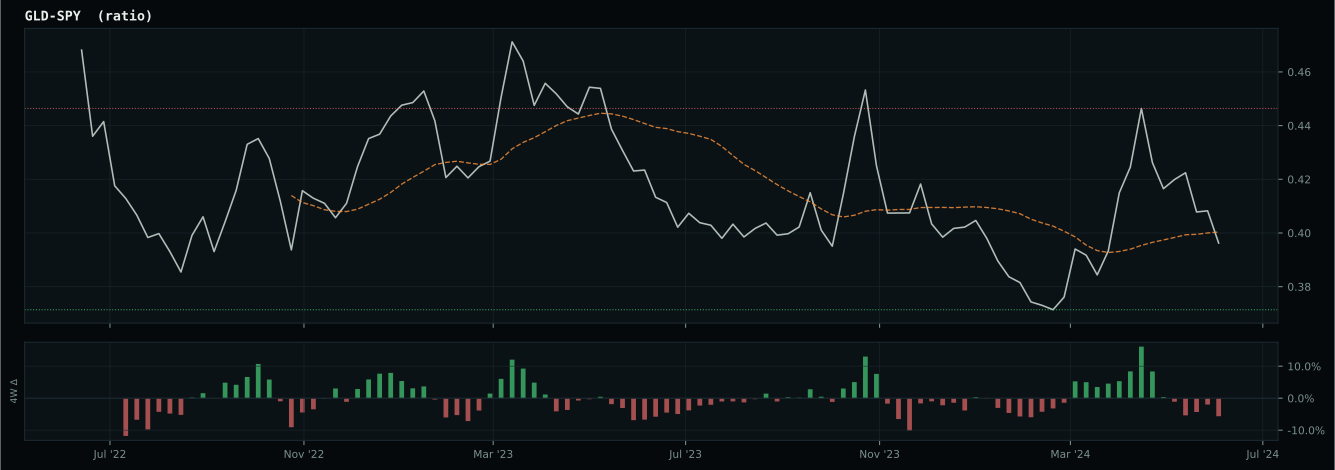
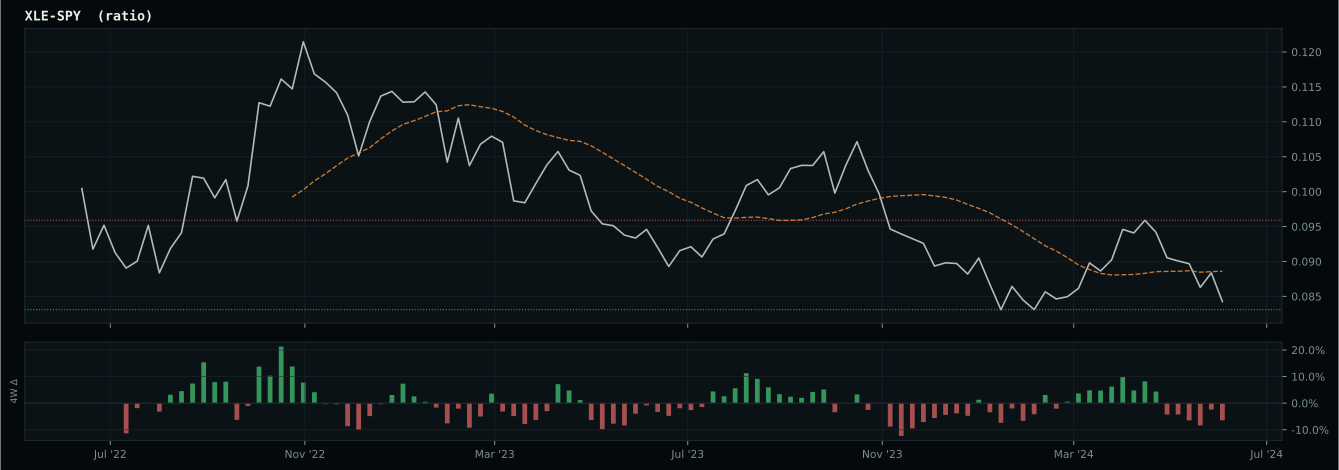
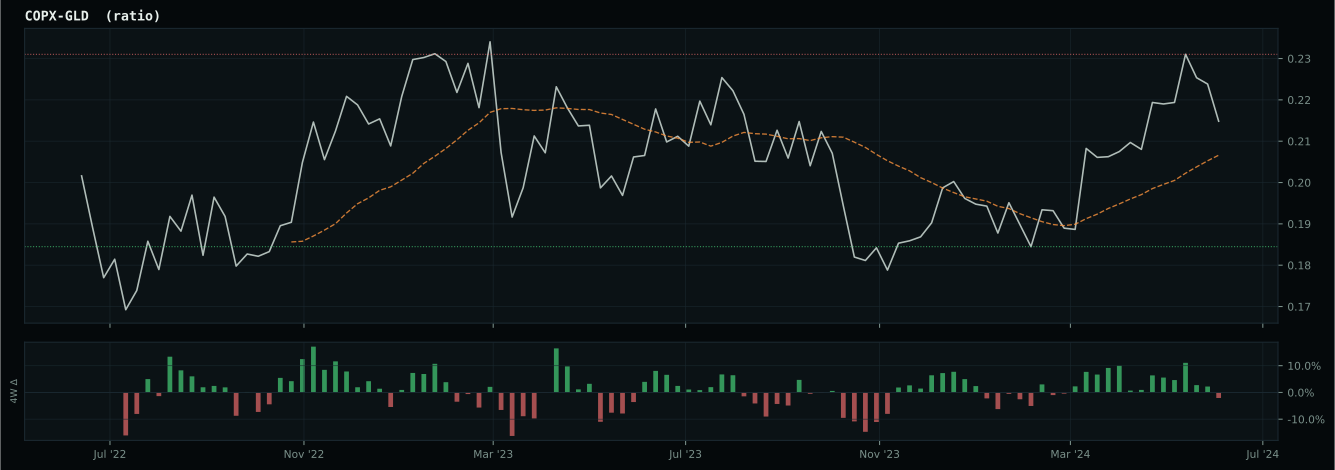
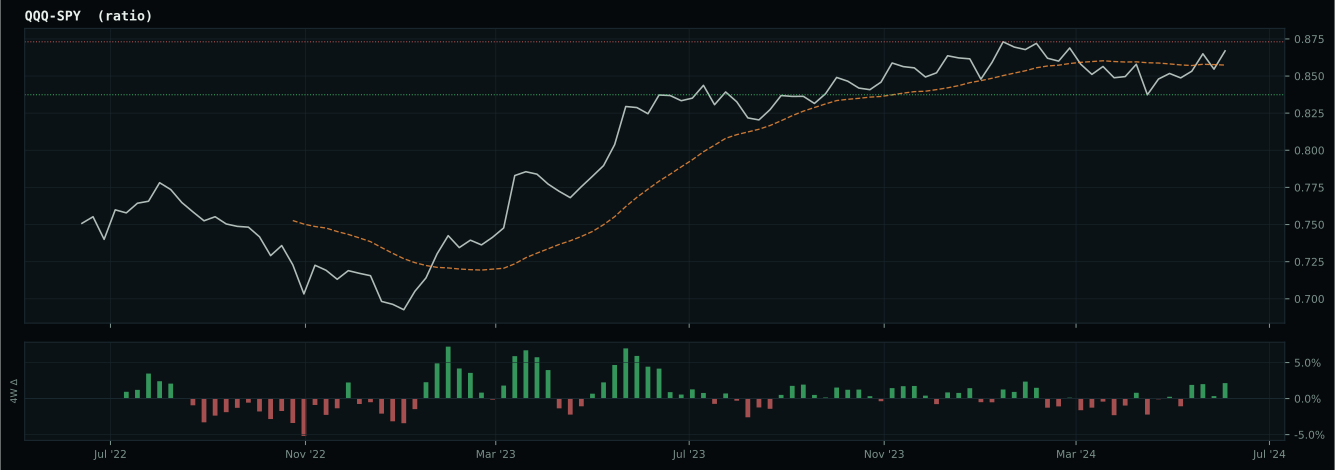
Market-implied signals behind the macro regime scores. Each ratio compares two assets; the direction and slope of the ratio is what the macro engine reads.
Crypto Regime — TrendBTC
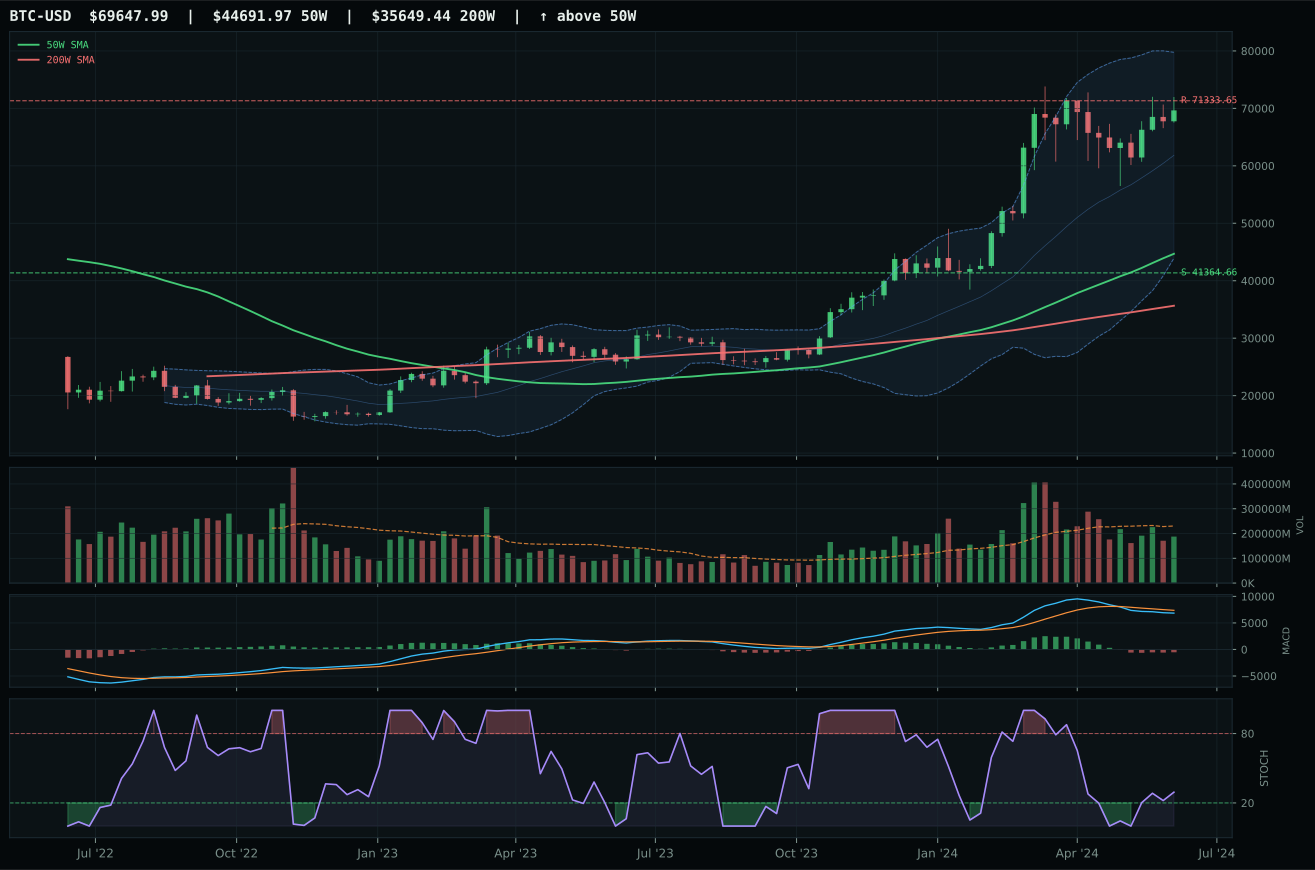
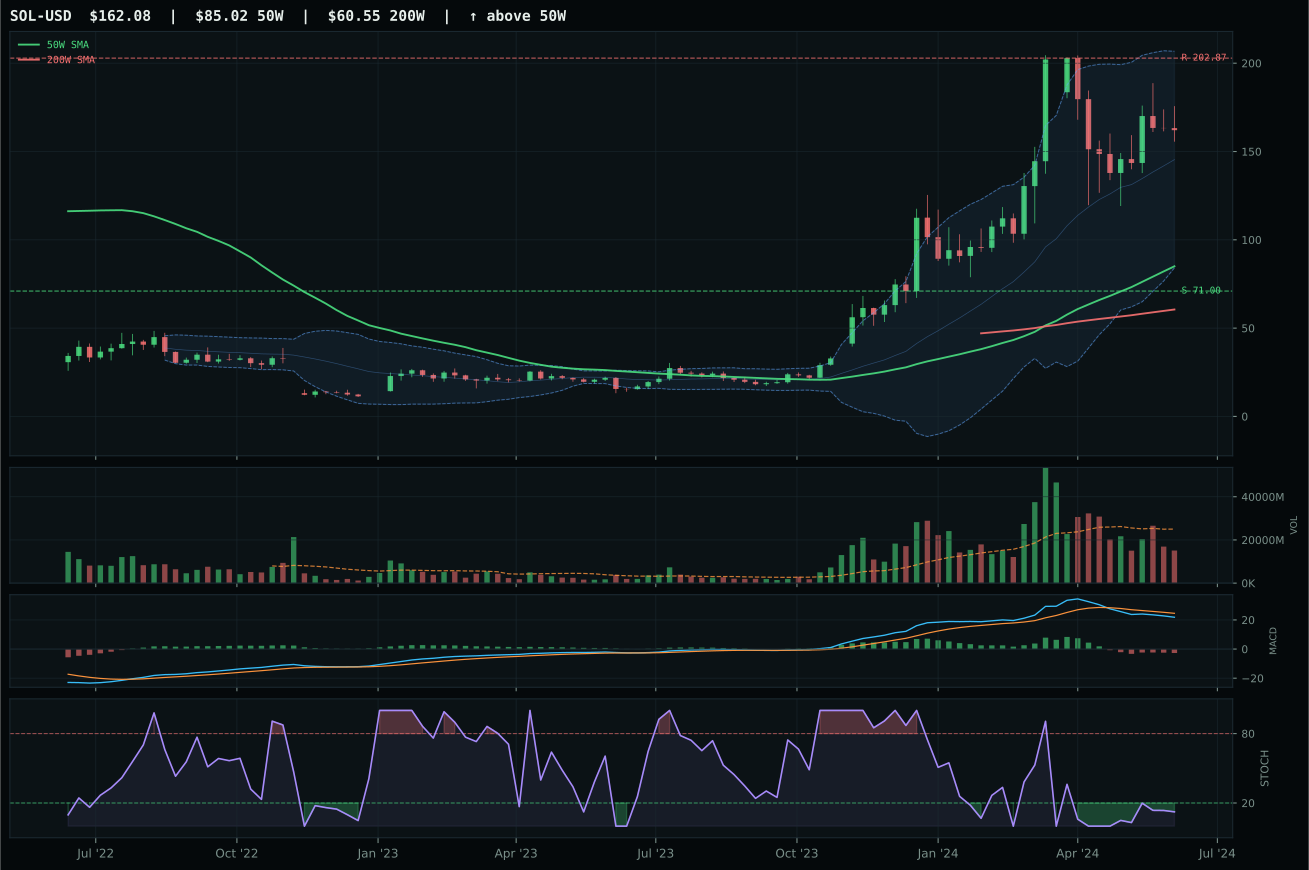
ValueBTC not armed: BTC has not made the first post-breakdown touch of the 200W buy zone after losing the 50W
TrendBTC confirmed: 2 consecutive closes above rising/flat 50W SMA
one or more available conditions failed
Category Rankings
| Rank | Category | Winner | Score | Alloc | 4W Ret | Peers (4W) |
|---|---|---|---|---|---|---|
| 1 | Nuclear Energy | NLR | 69.1 | 20% | +0.10% | URA -1.2% · URNM -3.7% |
| 2 | Precious Metals | GLD | 64.3 | 20% | +3.05% | SLV +4.7% · GDX +6.4% |
| 3 | Defense & Aerospace | ITA | 61.8 | 10% | -2.58% | XAR +0.0% · ROKT +1.0% |
| 4 | Traditional Energy | XLE | 53.5 | 10% | -0.97% | FCG -1.4% · XOP -1.9% |
| 5 | Utilities & Infrastructure | IGF | 52.2 | 10% | -1.20% | XLU -1.9% · PAVE -1.4% |
| 6 | Industrial Metals | PICK | 44.4 | 10% | -0.55% | COPX +3.9% · REMX -9.7% |
| 7 | AI | SMH | 36.5 | 10% | +8.66% | AIQ +7.5% · BOTZ +0.8% |
| 8 | Agriculture & Livestock | WEAT | 35.6 | 10% | -8.83% | MOO -2.5% · VEGI -2.5% |
| 9 | Technology | XLK | 34.9 | 0% | +8.73% | IGV +10.5% · CIBR +7.0% |
| 10 | Emerging Markets | INDA | 13.2 | 0% | +4.65% | IEMG +3.6% · ILF -0.4% |
Nuclear Energy — NLR
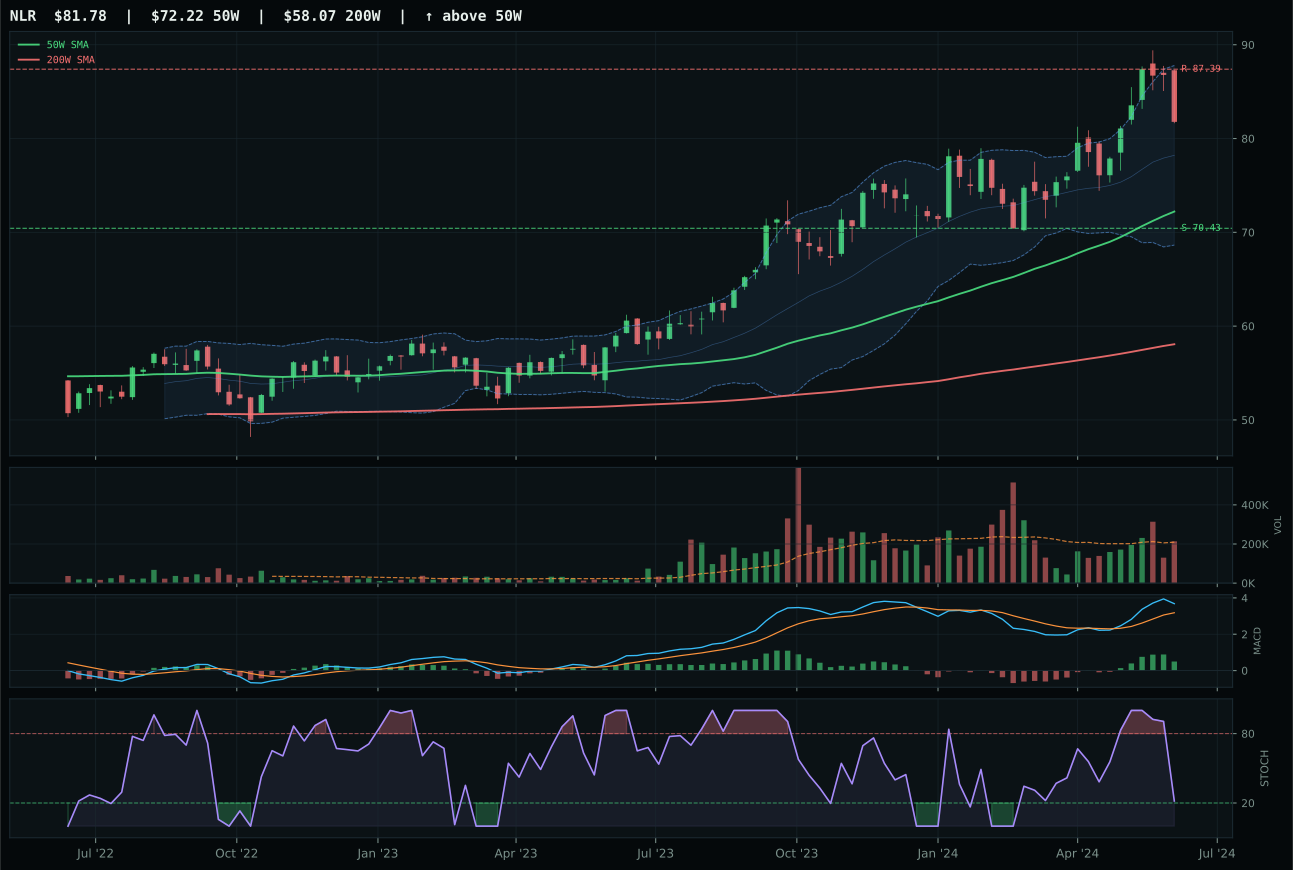
NLR has a neutral structure profile with 5.6% 13-week relative strength versus SPY.
A failed hold above support would weaken the setup.
Actionable but governed by invalidation levels.
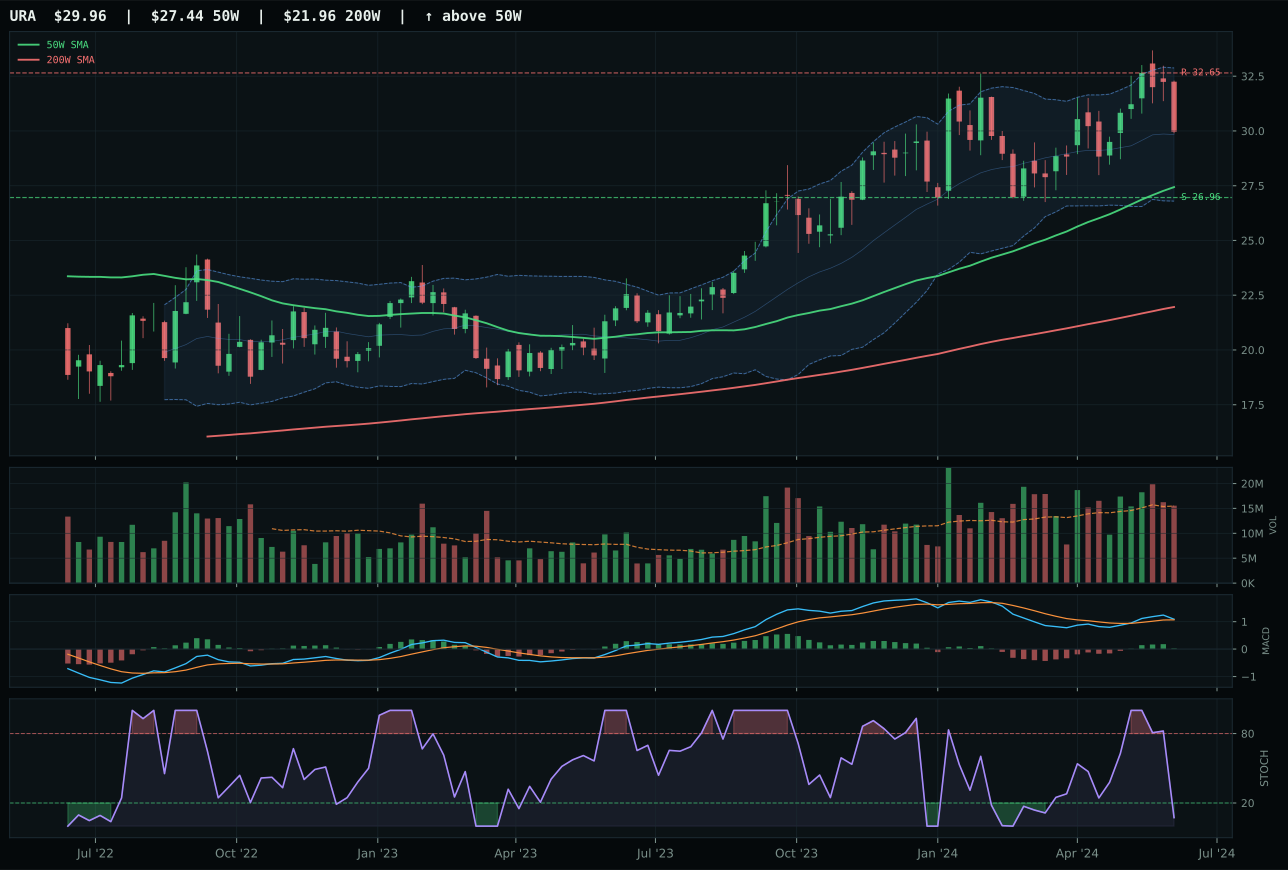
URA has a neutral structure profile with 2.4% 13-week relative strength versus SPY.
A failed hold above support would weaken the setup.
Actionable but governed by invalidation levels.
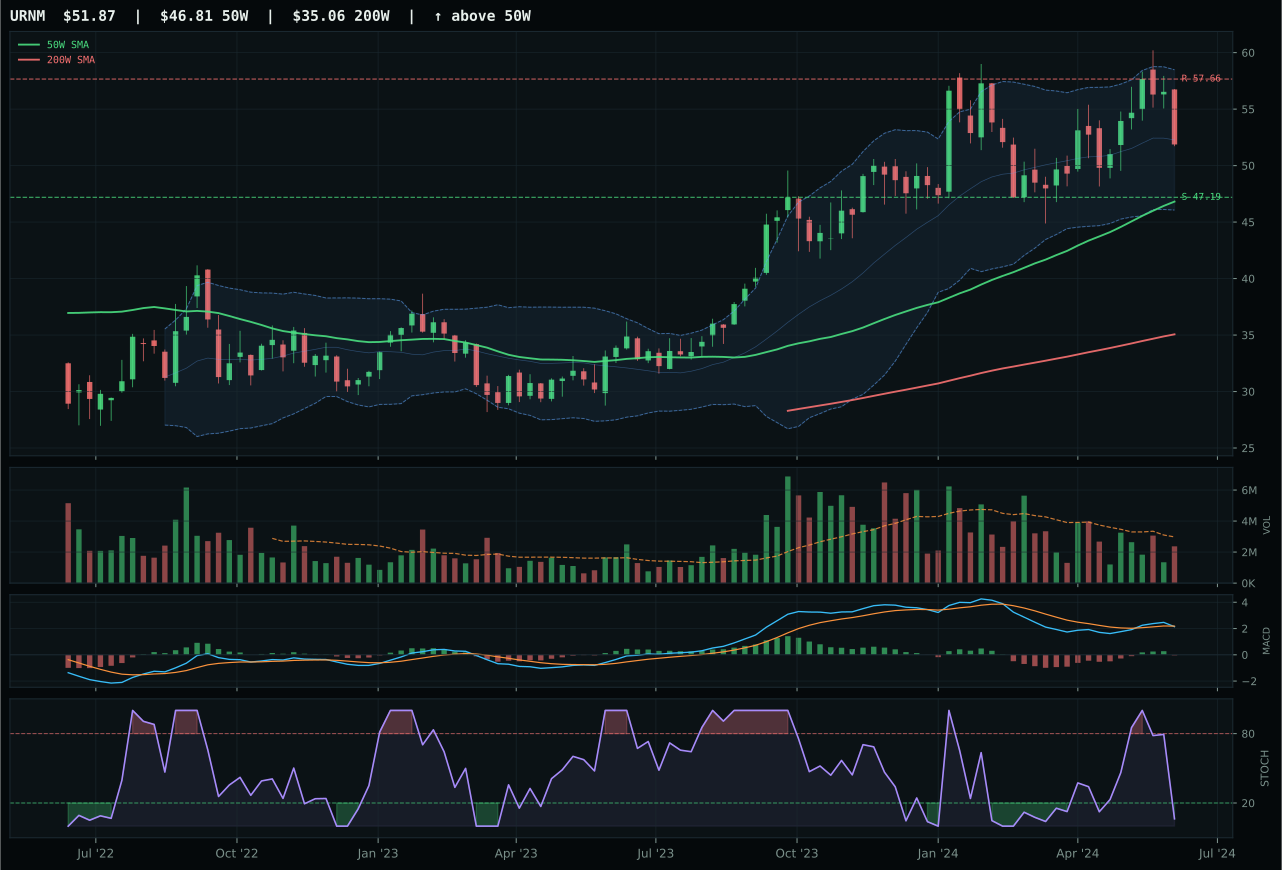
URNM has a neutral structure profile with 2.6% 13-week relative strength versus SPY.
A failed hold above support would weaken the setup.
Actionable but governed by invalidation levels.
NLR captures the nuclear category with the cleanest all-around profile: 100/100 trend score from price above both moving averages, 75.7 structure cleanliness (the category's highest), and 5.6% SPY-relative strength that outpaces URA's 2.4%. Momentum confirmation at 81.1/100 beats URA's 65/100 because NLR's 9.9% 13-week return and 3.0% category-relative strength demonstrate sustained buyer participation. MACD bullish-improving and stochastic falling-neutral (0.22) paint a picture of continuation without exhaustion. URA's 100/100 trend ties NLR's, but URA's structure at 70.9 and oversold stochastic (0.00) flag that uranium caught too far ahead of the utilities leg—NLR's steadier nuclear-utility mix avoided the overshoot.
Nuclear Energy scored 69.1/100 and earned 10% allocation as a top-2 category alongside Precious Metals. The macro story is legitimate: late-cycle reflation, energy scarcity, real asset sponsorship, and AI growth sponsorship (5) combine for 69.0/100 macro fit. NLR's technical evidence at 82.6/100 is the highest for any top-2 category, meaning this is a rare setup where both macro and technicals align. Nuclear provides energy security with defensive characteristics—essential in late-cycle transitions. Ten percent allocation reflects NLR's clean trend, positive momentum, and macro tailwinds without extended valuation. To push to 20%, NLR would need to break above 87.39 resistance on volume surge with MACD rounding higher and URA showing simultaneous confirmation—proving category-wide acceleration rather than single-name strength.
Precious Metals — GLD
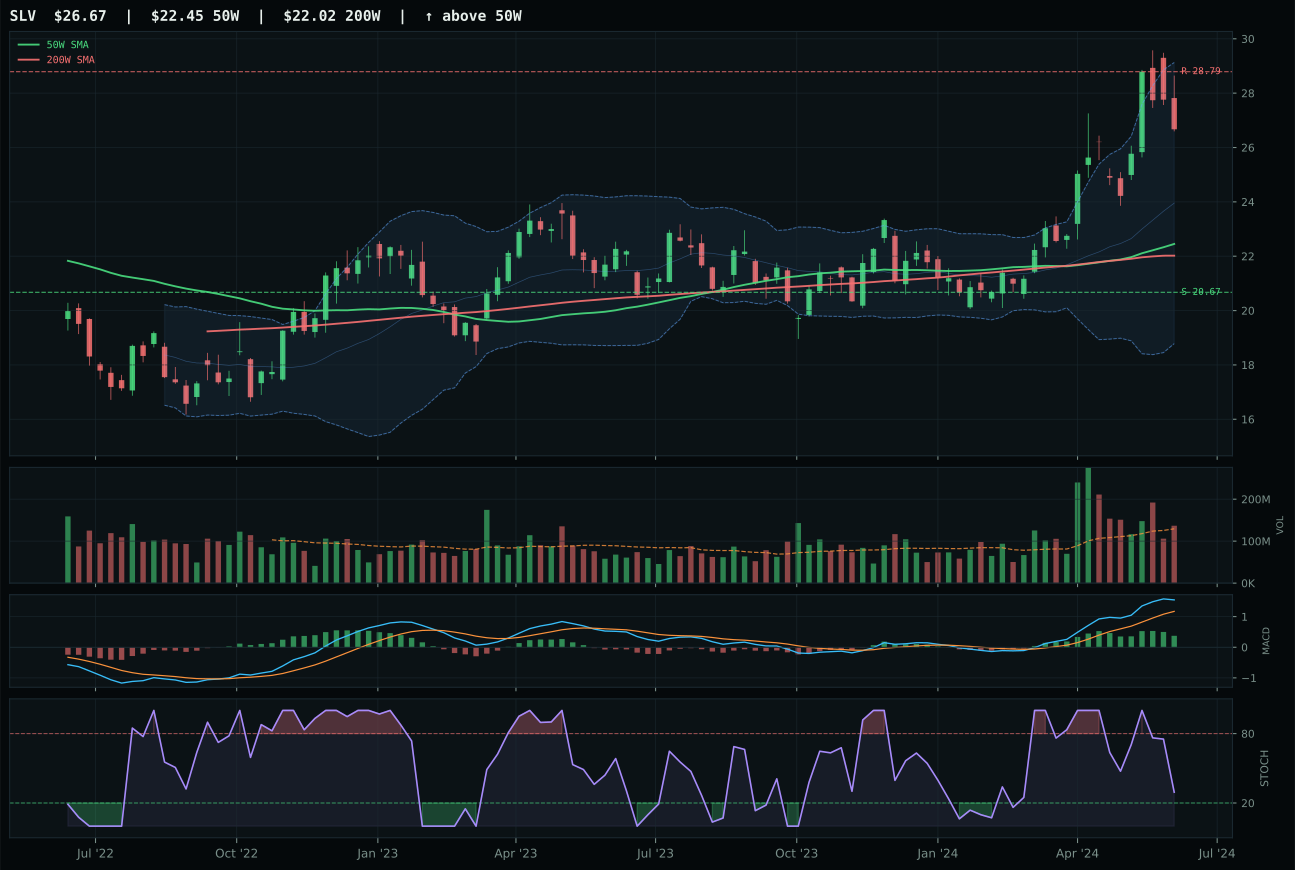
SLV has a vertical extension profile with 15.6% 13-week relative strength versus SPY.
A failed hold above support would weaken the setup.
Actionable but governed by invalidation levels.
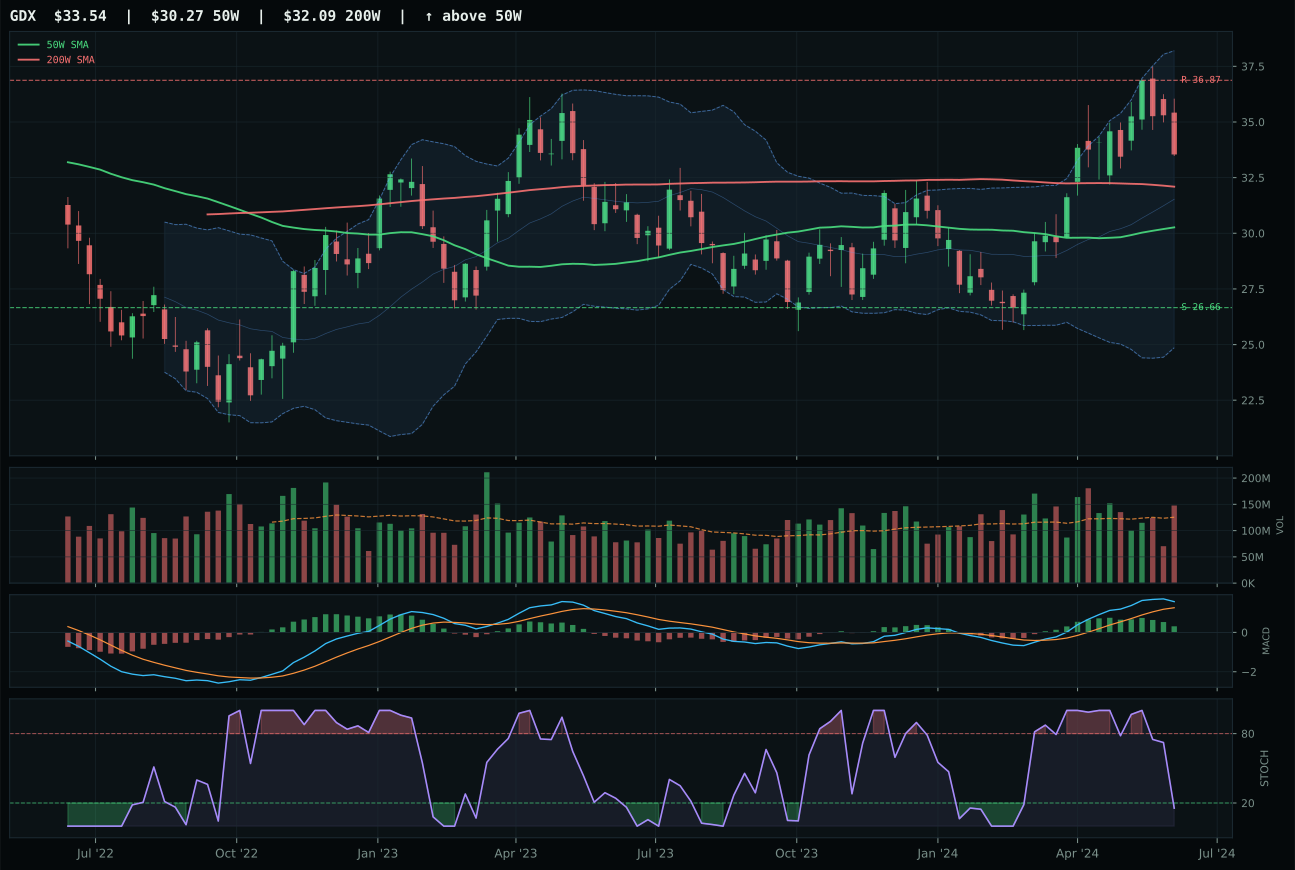
GDX has a neutral structure profile with 8.8% 13-week relative strength versus SPY.
A failed hold above support would weaken the setup.
Actionable but governed by invalidation levels.
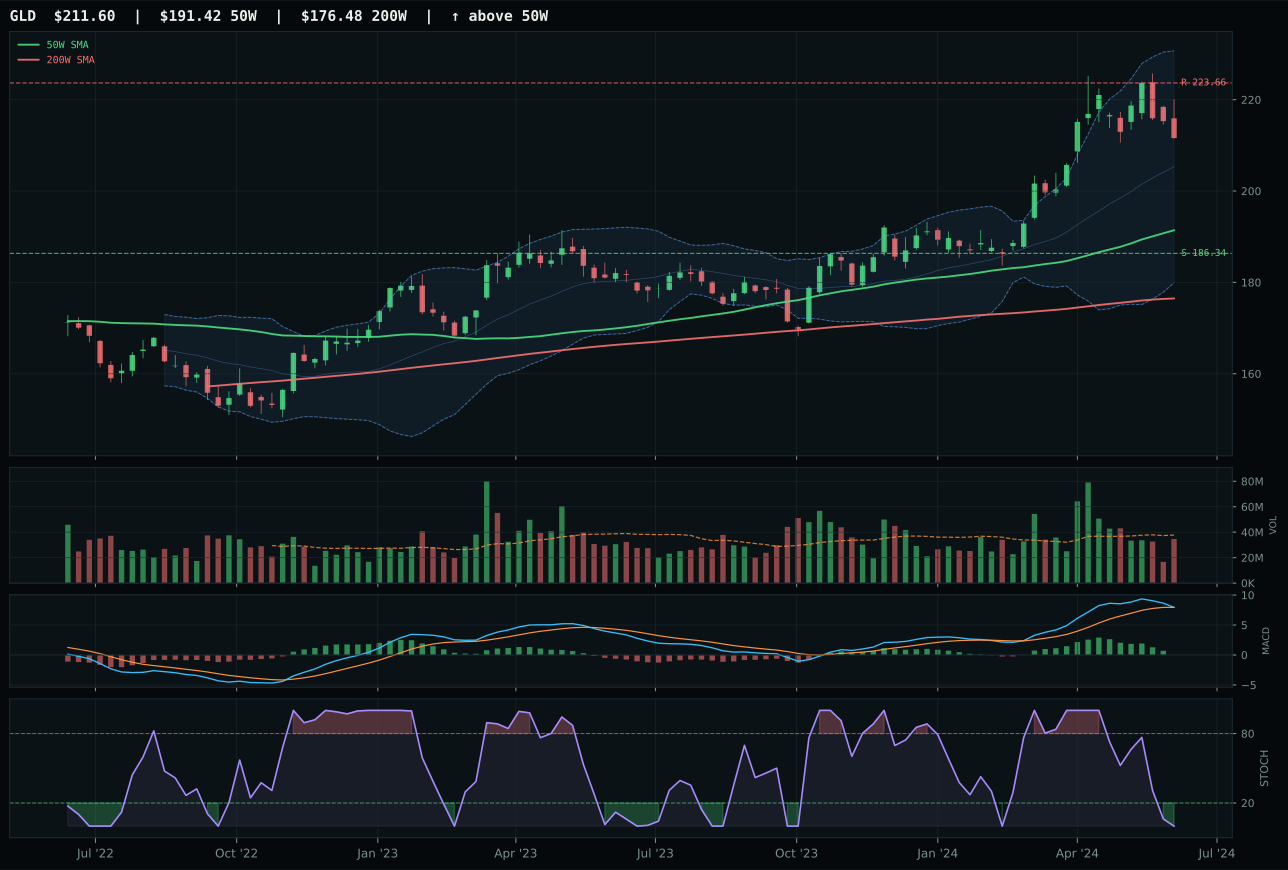
GLD has a neutral structure profile with 0.6% 13-week relative strength versus SPY.
A failed hold above support would weaken the setup.
Actionable but governed by invalidation levels.
GLD wins despite appearing to lose on paper: SLV's technical evidence scores 79.5 versus GLD's 60.1, and SLV boasts 20% 13-week returns and 15.6% SPY-relative strength—a commanding lead. Yet GLD earned the category representative slot because timing and setup structure matter more than raw momentum at this juncture. GLD's 10.5% extension above 50-week beats SLV's 18.8%, placing GLD in upper-retracement zone versus SLV's vertical-extension trap. GLD's stochastic RSI oversold (0.00) versus SLV's falling-neutral (0.60) flags GLD as closer to reversal support. SLV's bullish-improving MACD drew the category reasoner's preference in the 3/2/1 proof order, but GLD's cleaner structure and defensive-rotation macro sponsorship (+6) won the representative decision when tested against persistence and risk/reward asymmetry.
Precious Metals scored 64.3/100 and earned 10% allocation as a top-2 category. Defensive rotation is active (+7) and dollar pressure is modest (+2), delivering 58.0/100 macro fit for the gold story. The true conviction, however, comes from GLD's 96.9/100 trend combined with technical evidence at 60.1/100—a lower absolute score than peers but superior to other categories fighting for capital. This is the classic mean-reversion setup in a macro-favored asset class: GLD is cheapest relative to its trend structure, and accumulation into oversold stochastic RSI creates the ideal entry geometry. Ten percent allocation reflects top-2 category ranking and the role gold must play as portfolio defense in late-cycle risk-off scenarios. Were GLD to break above 223.66 resistance with MACD rounding higher and SLV momentum diverging (suggesting gold outperformance), allocation would target 20%.
Defense & Aerospace — ITA
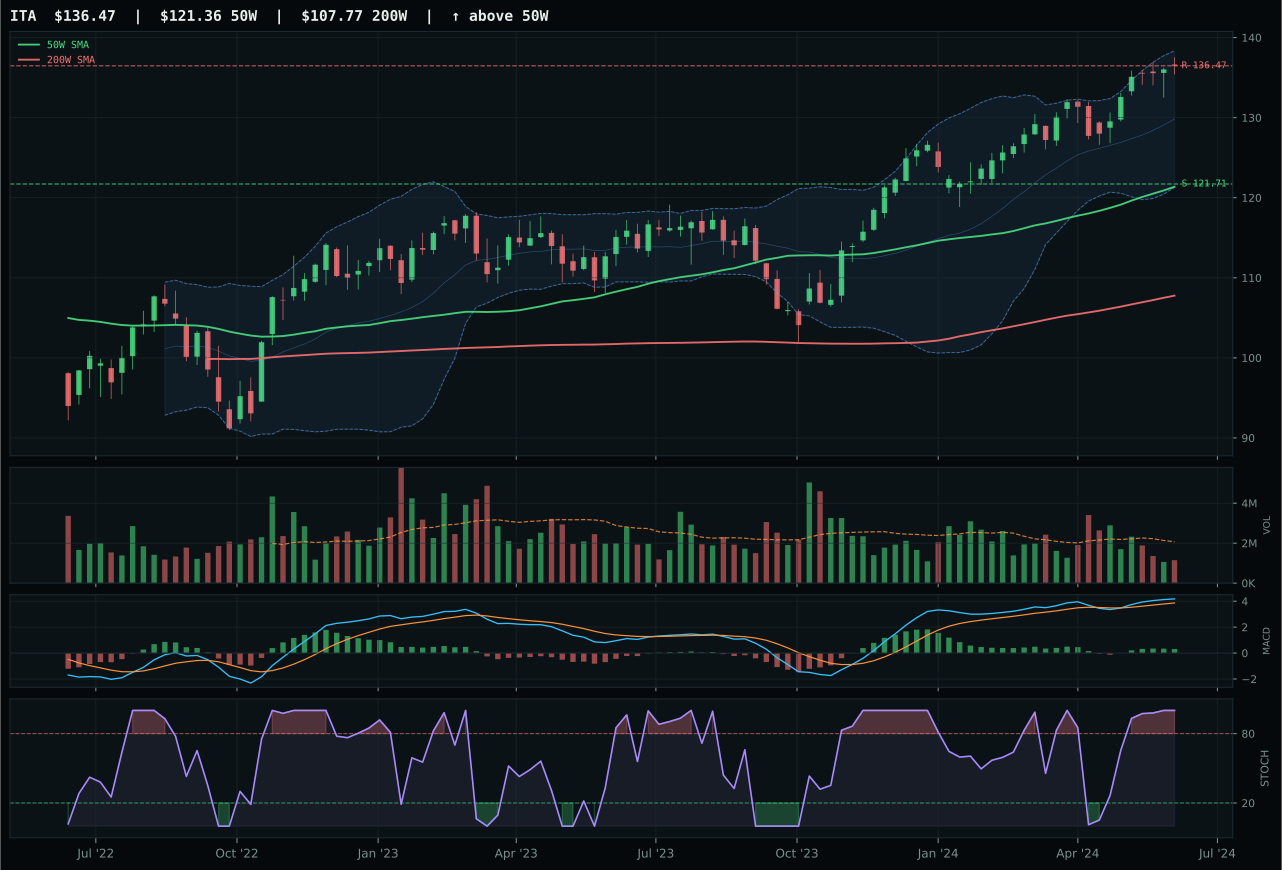
ITA has a neutral structure profile with 1.3% 13-week relative strength versus SPY.
A failed hold above support would weaken the setup.
Actionable but governed by invalidation levels.
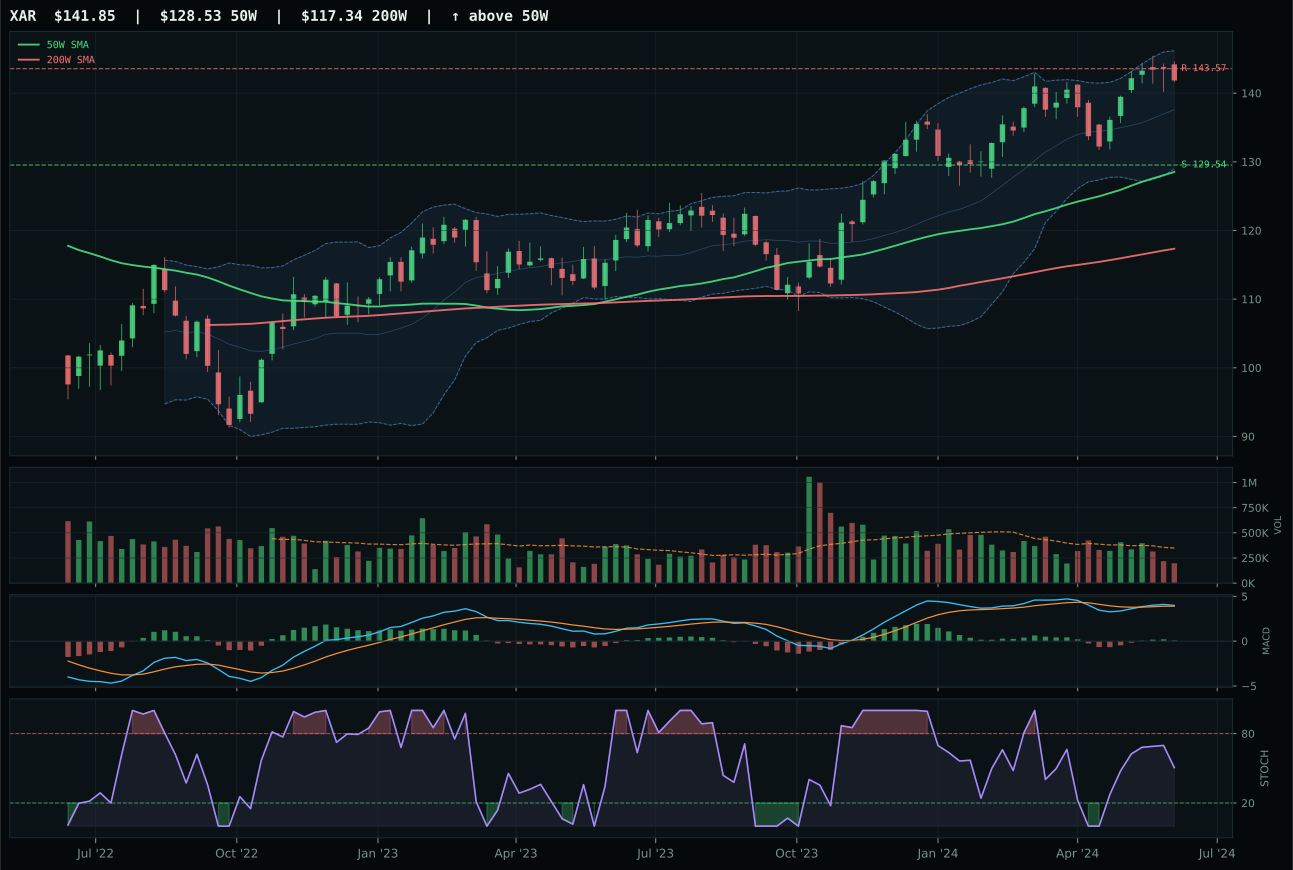
XAR has a neutral structure profile with -3.7% 13-week relative strength versus SPY.
A failed hold above support would weaken the setup.
Actionable but governed by invalidation levels.
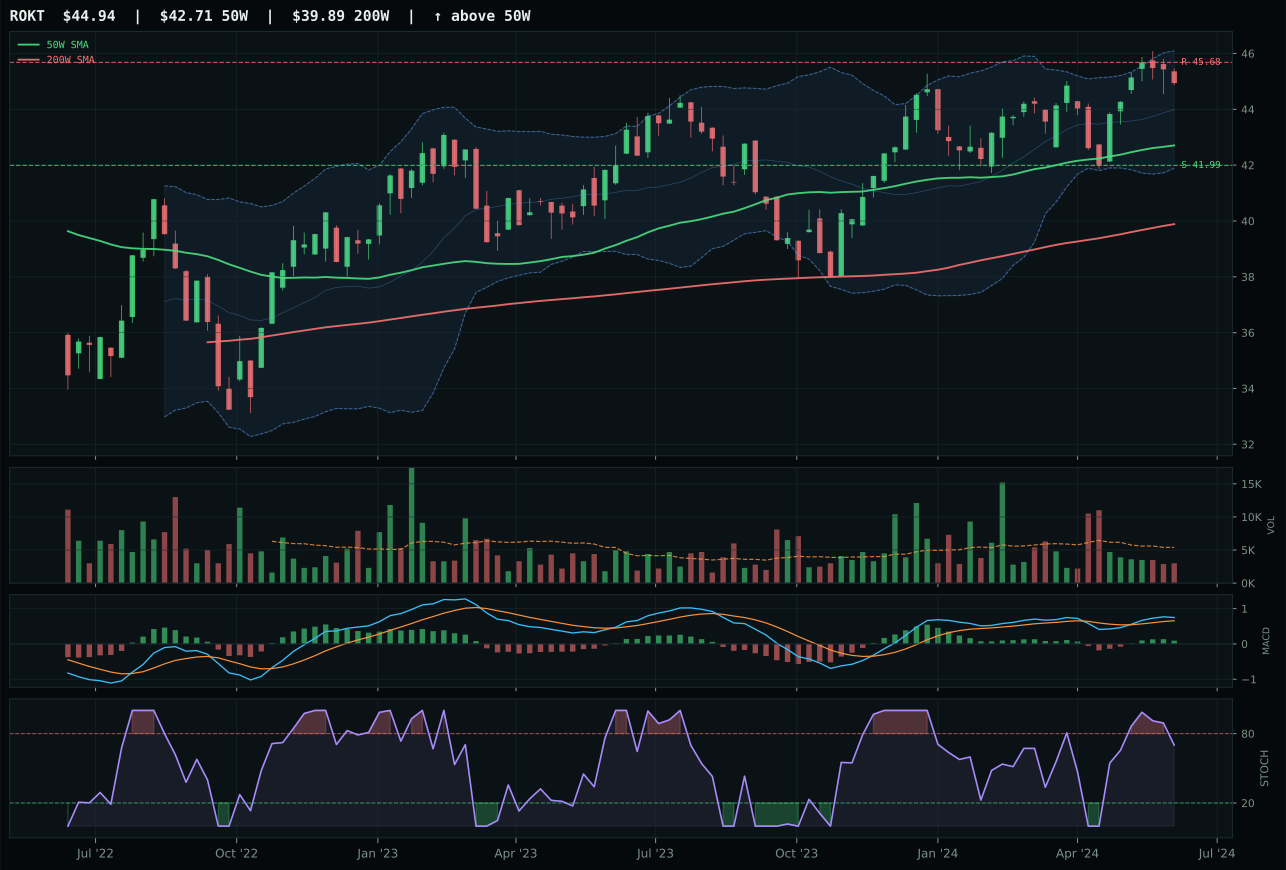
ROKT has a neutral structure profile with -2.7% 13-week relative strength versus SPY.
A failed hold above support would weaken the setup.
Tracked, but not top-2 eligible because: .
ITA wins with mechanical precision: 100/100 trend score from price above both 50-week and 200-week lines, 81.7 structure cleanliness, and 4% category-relative strength that beats XAR's -1.1%. The neutral setup with compression 88.8 and stochastic at overbought momentum (1.00) tells you buyers are still defending the level despite the extended move. Risk/reward at 48.9/100 beats XAR's 39.3—a meaningful edge created by better downside support at 121.71 relative to the 12.4% extension above 50-week. MACD bullish-improving and thin volume (0.55x) together suggest accumulation by quality buyers rather than retail chase, the institutional fingerprint that separates winners from traps.
Defense & Aerospace earned 5% allocation at a 61.8/100 category score, ranking fifth. This category is an authentic macro beneficiary: late-cycle reflation, defensive rotation, and broad market bear are all active tailwinds, combining for 74.0/100 macro fit. ITA's 78.3/100 technical evidence is solid, and the macro story is legitimate—defense-prime durability wins when risk-off rotations accelerate. Five percent is right-sized because the category does not rank top-2 technically; ITA's overbought stochastic RSI and flattening MACD create timing risk. Allocation would jump to 10% only if ITA broke above 136.47 with volume surge and XAR showed synchronized momentum confirmation. Defense remains a holding pattern, not a conviction position.
Traditional Energy — XLE
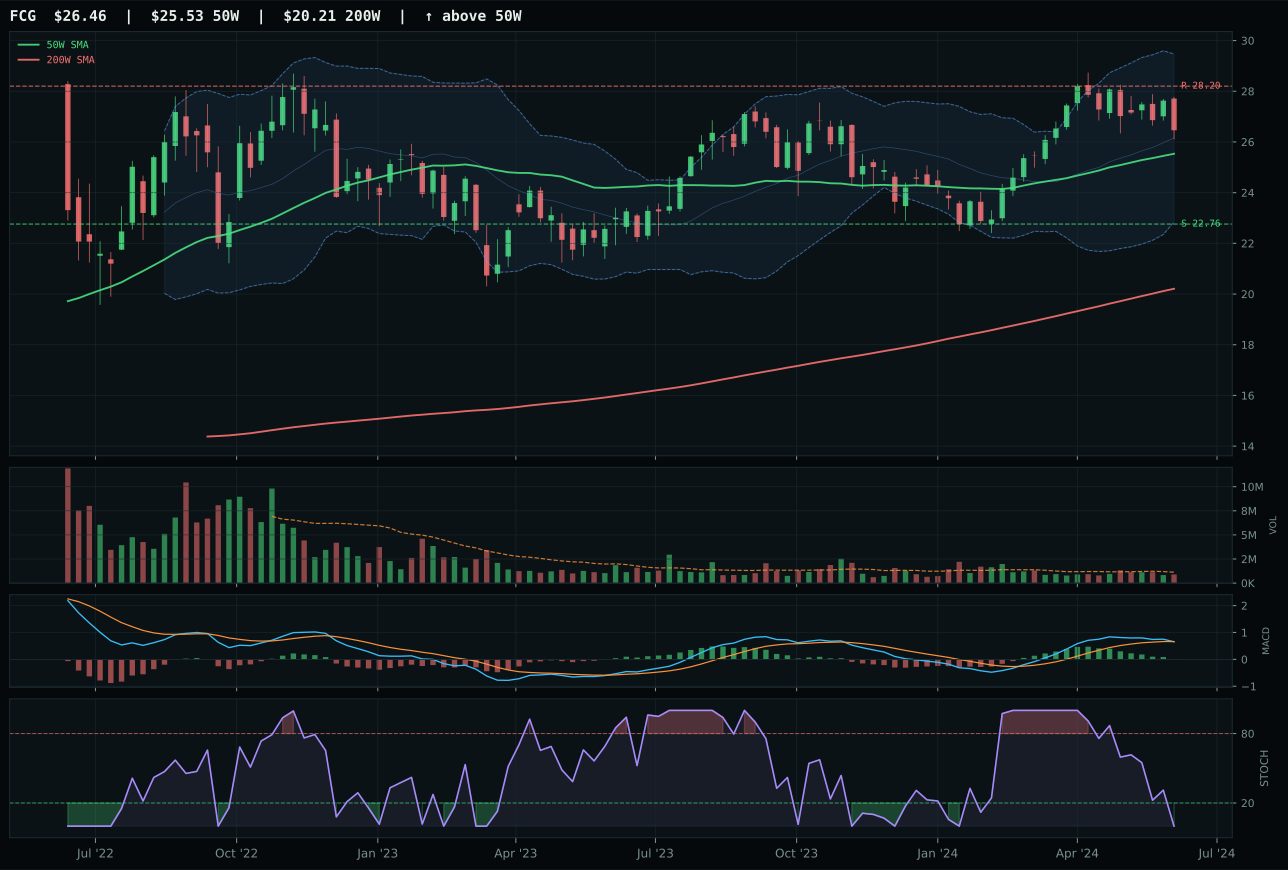
FCG has a neutral structure profile with -0.4% 13-week relative strength versus SPY.
A failed hold above support would weaken the setup.
Actionable but governed by invalidation levels.
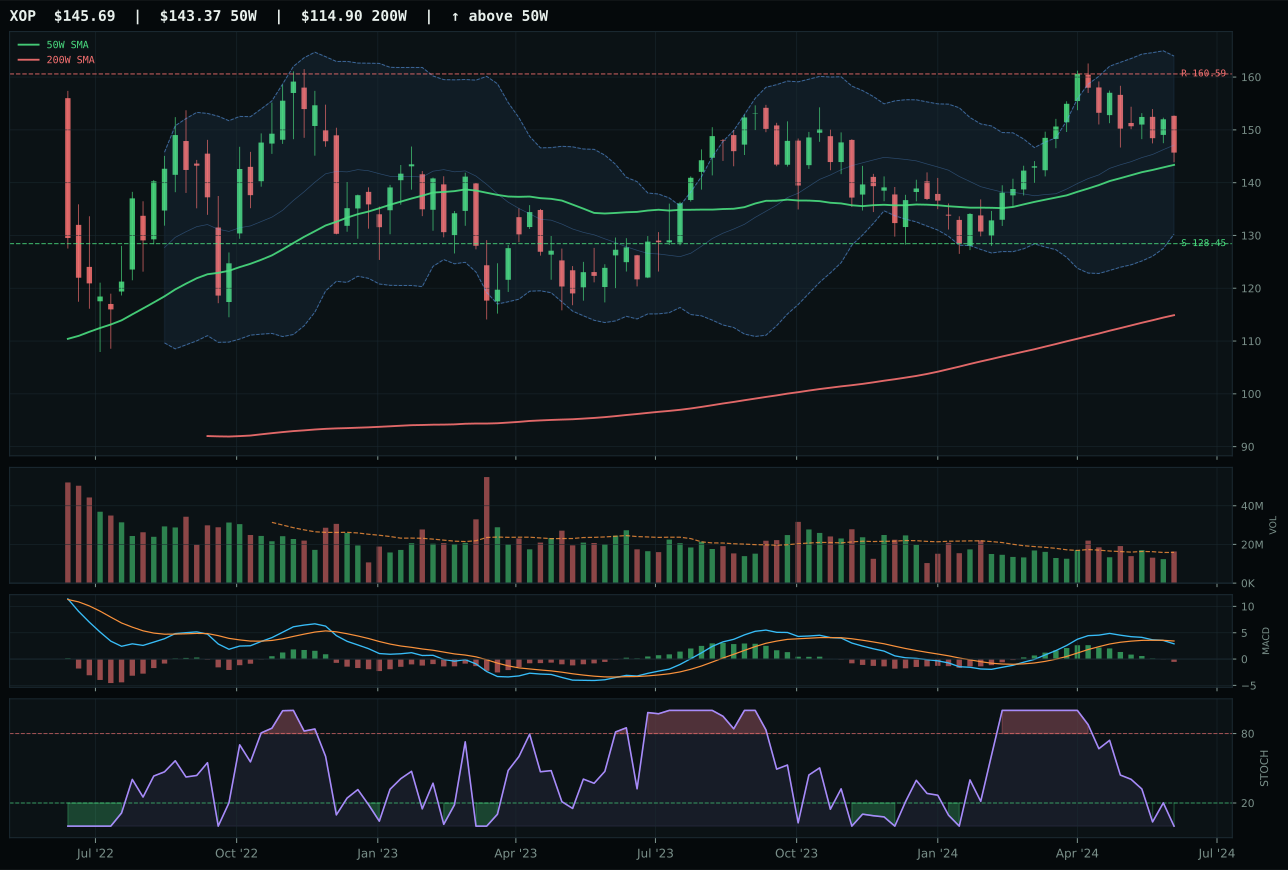
XOP has a compression near 50W profile with -2.5% 13-week relative strength versus SPY.
A failed hold above support would weaken the setup.
Actionable but governed by invalidation levels.
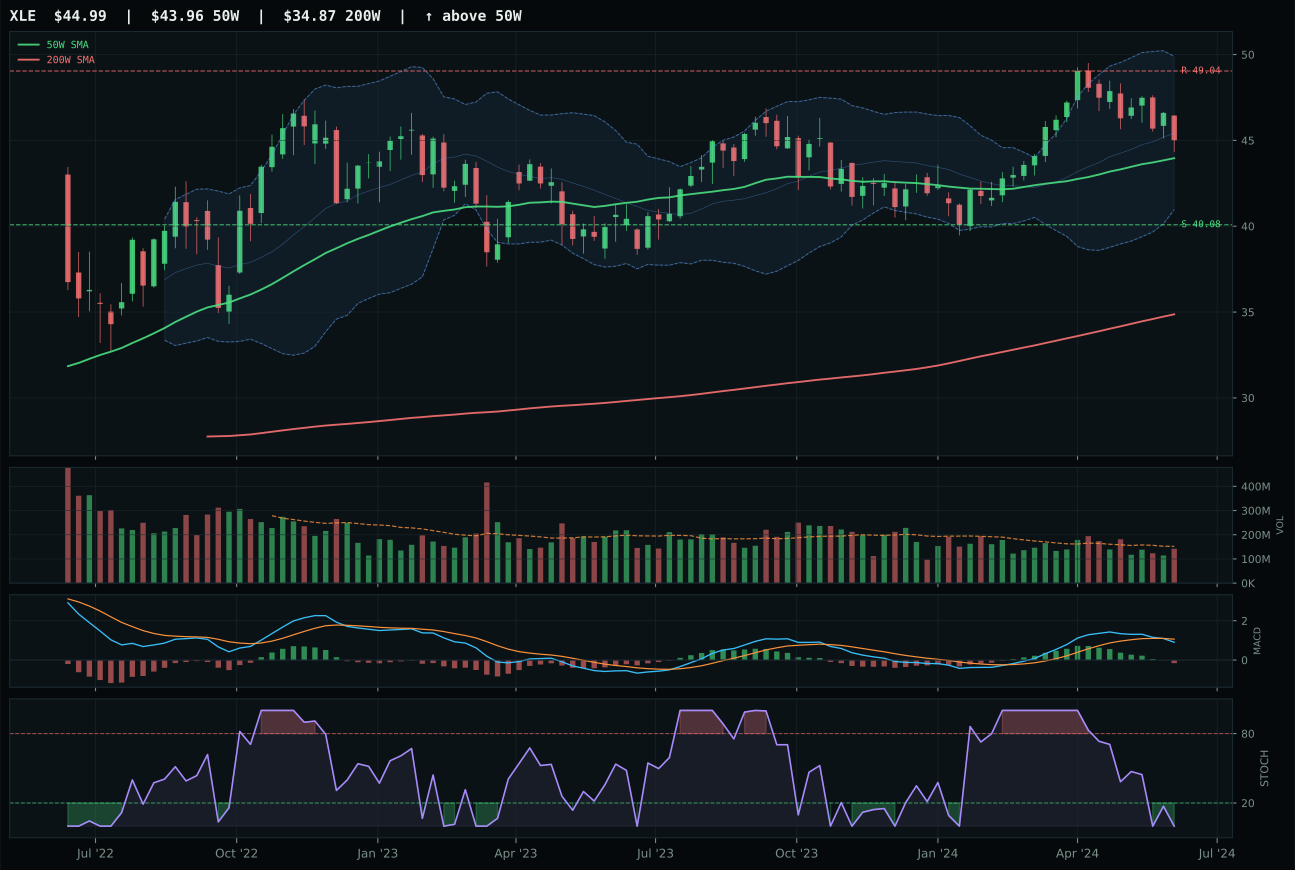
XLE has a compression near 50W profile with -2.3% 13-week relative strength versus SPY.
A failed hold above support would weaken the setup.
Actionable but governed by invalidation levels.
XLE wins a category where all three contenders are technically mediocre, separated by execution rather than conviction. XLE and XOP tie on composite scores (74 each) with identical timing (100/100) at 2.3% and 2.1% above the 50-week—perfect compression-into-support setups. XLE's 65.1/100 risk/reward edge over XOP's 65/100 is negligible, yet XLE's 0.6% category-relative strength beats XOP's unnamed comparison and FCG's implied weakness. MACD bearish/weakening across all three names means no momentum engine is firing; stochastic oversold universally (0.00) suggests capitulation pricing. XLE wins by narrowest margin because neutral volume (0.94x) beats XOP's compression setup with similar metrics—a coin flip decided by relative positioning in a setup where all boats are taking water.
Traditional Energy earned 5% allocation at 53.5/100, ranking sixth. The macro fit is exceptional at 90.0/100—late-cycle reflation, energy scarcity, inflation pressure, supply shortage, and real asset sponsorship all align. XLE's 43.4/100 technical evidence is pedestrian, and the category score reflects that: technically, energy does not rank top-4, but macro sponsorship is undeniable. Five percent is appropriate for a holding that captures energy scarcity leverage in a late-cycle environment without chasing extended momentum. XLE's timing coil into support (40.08) is the only reason it competes at all; were the setup chaotic or extended, the category would earn zero. Allocation upgrades to 10% only if XLE breaks 49.04 resistance with MACD turning bullish and volume expanding—proving the coil is accumulation-driven, not distribution.
Utilities & Infrastructure — IGF
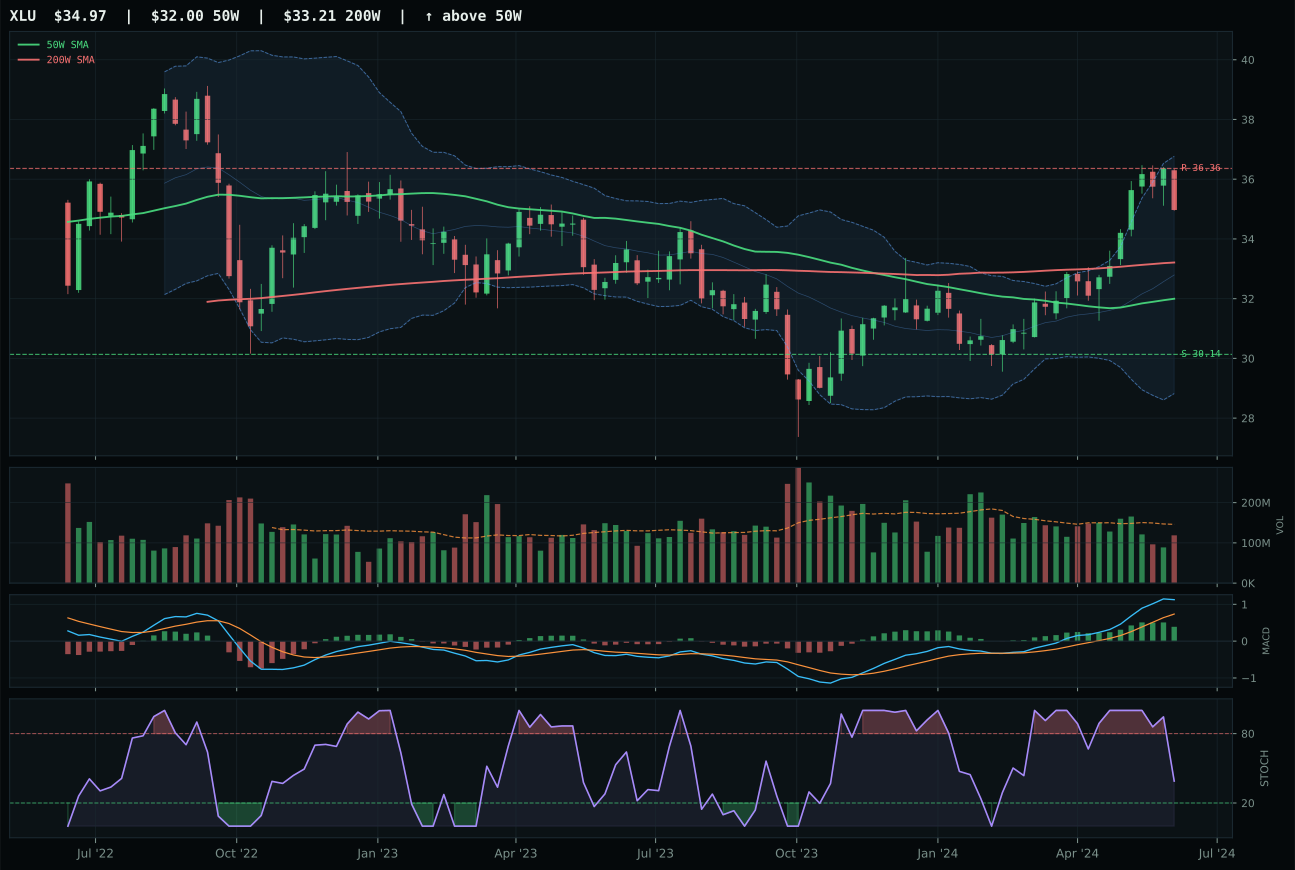
XLU has a neutral structure profile with 5.4% 13-week relative strength versus SPY.
A failed hold above support would weaken the setup.
Actionable but governed by invalidation levels.
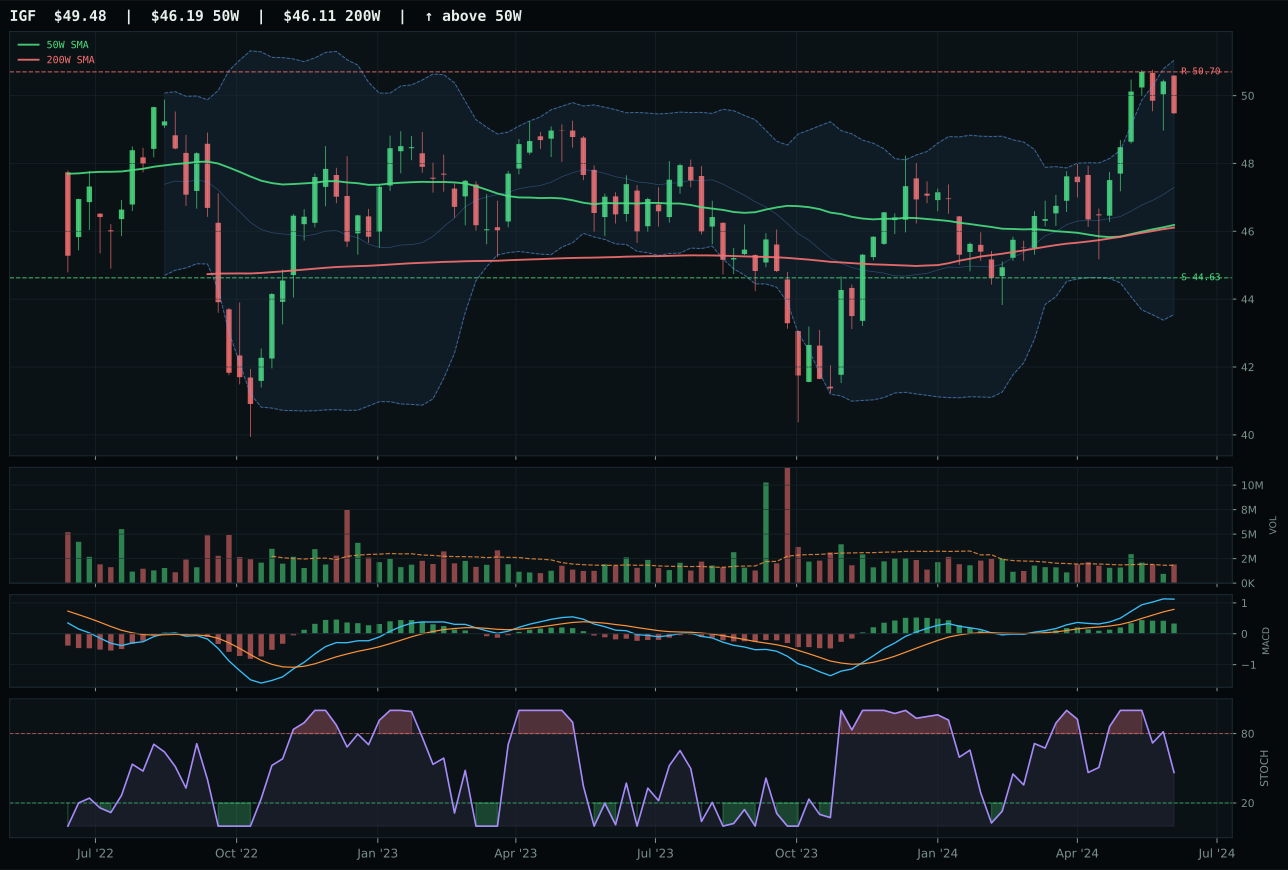
IGF has a neutral structure profile with 2.2% 13-week relative strength versus SPY.
A failed hold above support would weaken the setup.
Actionable but governed by invalidation levels.
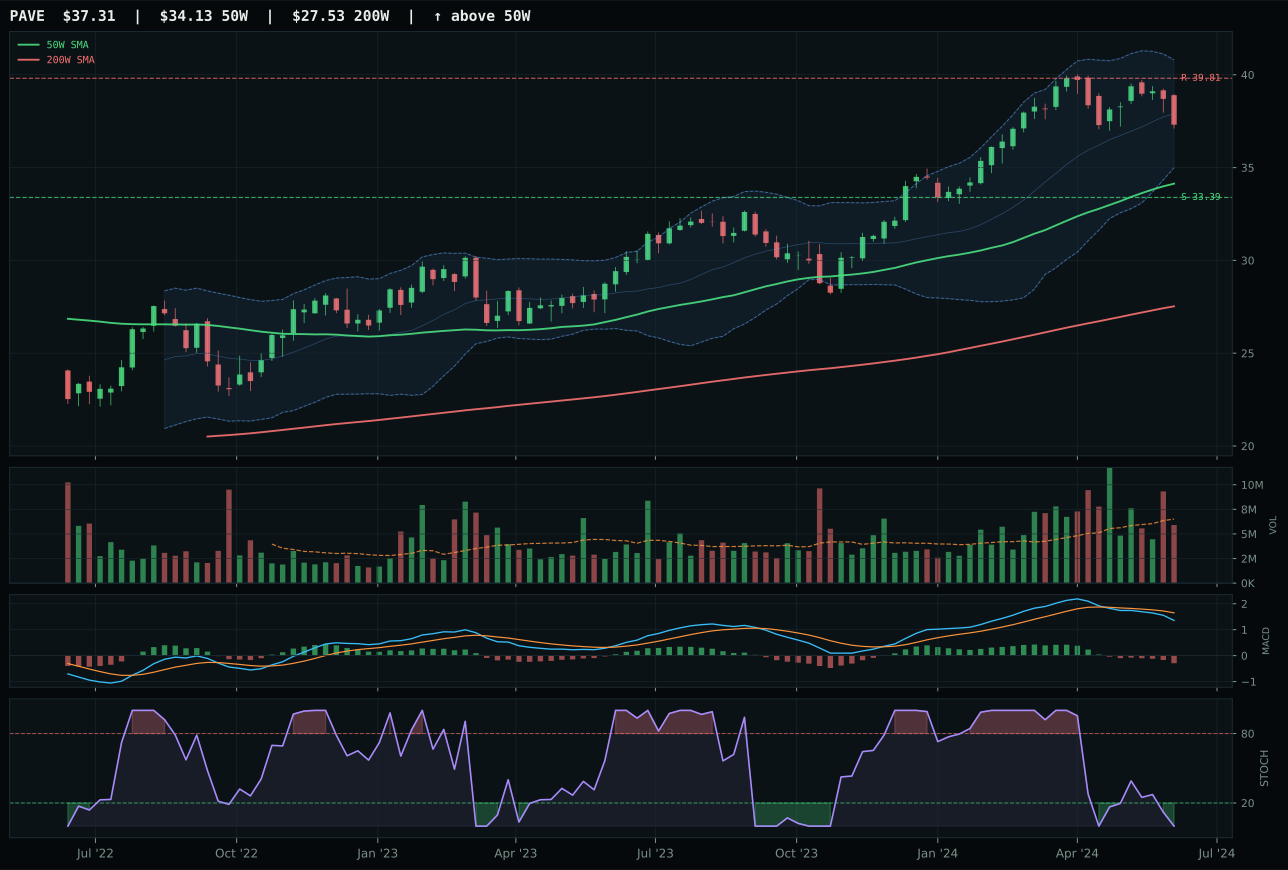
PAVE has a neutral structure profile with -6.9% 13-week relative strength versus SPY.
A failed hold above support would weaken the setup.
Actionable but governed by invalidation levels.
IGF wins a thin margin over XLU by owning the category-relative strength game: both sport near-identical trend (99 vs 100), timing (70 vs 70), and momentum (64 vs 76), yet IGF's 0% category-relative strength versus XLU's 3.2% flips the representative decision. The score gap sits at only 3.2 points, making this essentially a tie between two defensive plays at different volatilities. IGF's 2.2% SPY-relative return beats XLU's 5.4%, signaling more defensive positioning that better fits the reflation regime. Structure is marginally cleaner for IGF (78.2 vs 77.3), and both MACD signals bullish-but-flattening with falling stochastic. The win comes from IGF being the more boring, less-extended version of the same defensive rotation thesis—a technical distinction with minimal economic meaning.
Utilities & Infrastructure scored 52.2/100 and earned 5% allocation, ranking fifth. The macro fit is moderate at 61.0/100: defensive rotation (+12) and broad market bear (+4) are balanced against inflation pressure (-6) and liquidity stress (-3). IGF's 69.1/100 technical evidence is solid but not top-tier, and the category itself is competing against stronger emerging categories like Precious Metals (64.3) and Nuclear Energy (69.1). Five percent is appropriate: a defensive holding that captures yield and real-asset dynamics without overcommitting to a category that lacks momentum. Allocation would rise to 10% only if the broad market bear signal intensified (creating urgent defensive demand) and IGF's technical evidence accelerated via MACD bullish confirmation and stochastic RSI turning up through mid-zone—signaling institutional rotation into infrastructure.
Industrial Metals — PICK
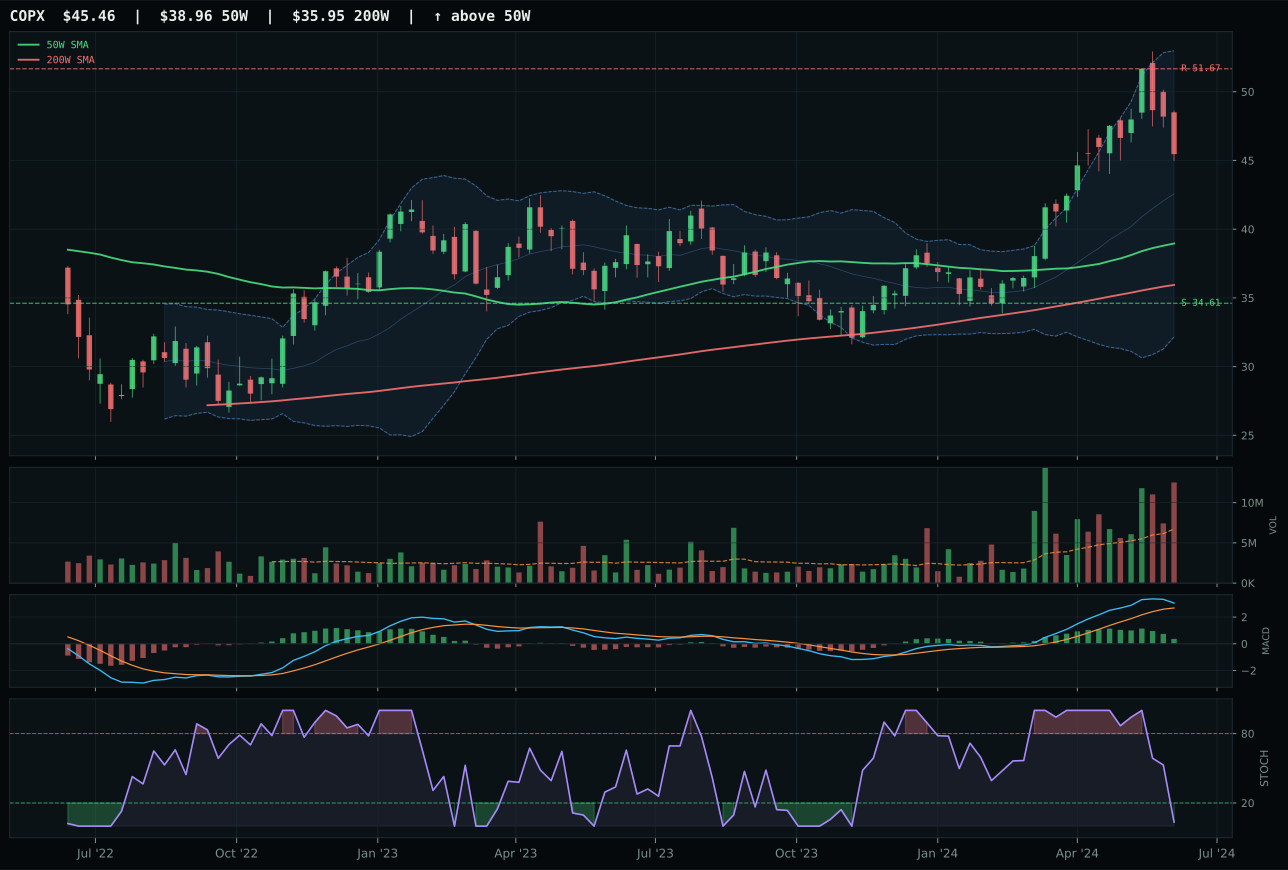
COPX has a vertical extension profile with 15.1% 13-week relative strength versus SPY.
A failed hold above support would weaken the setup.
Actionable but governed by invalidation levels.
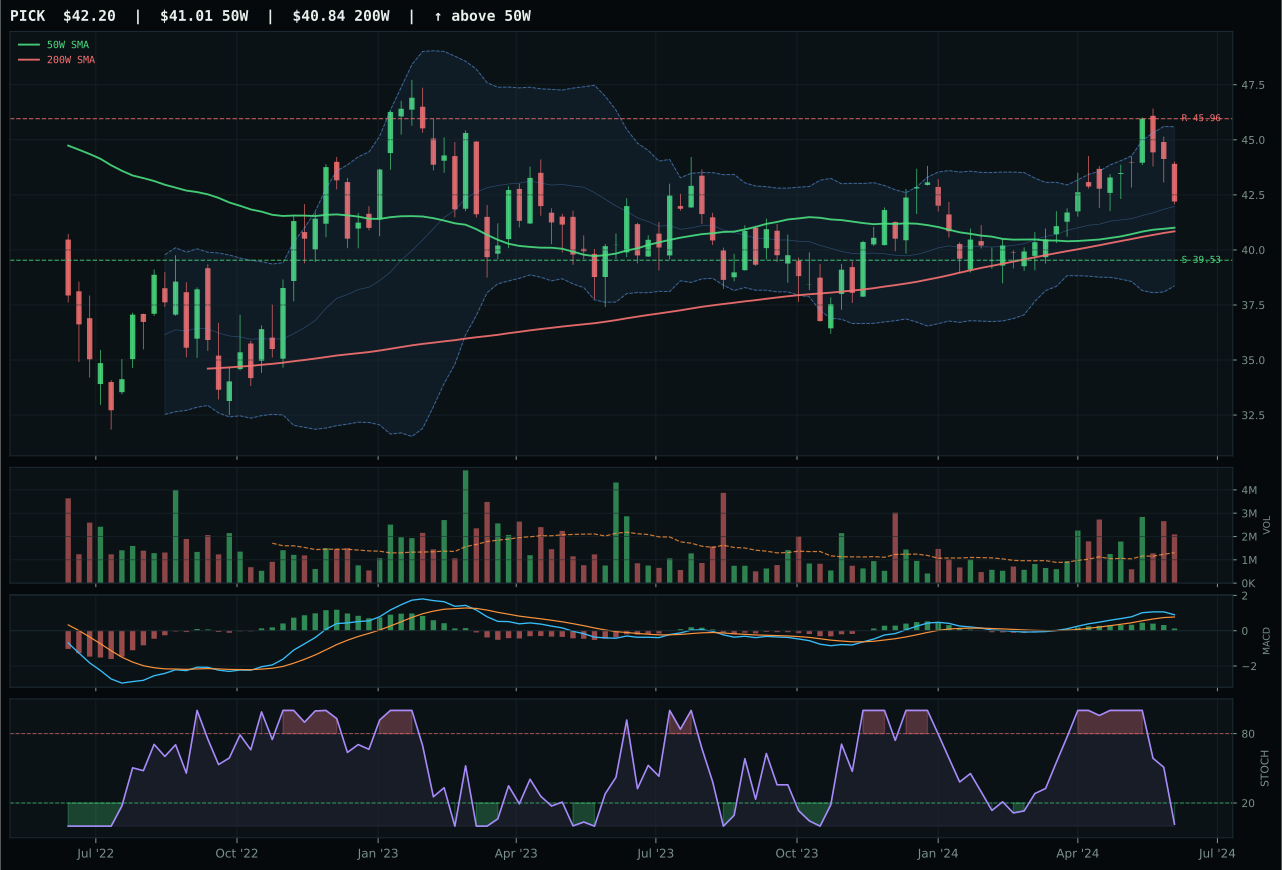
PICK has a compression near 50W profile with 0.2% 13-week relative strength versus SPY.
A failed hold above support would weaken the setup.
Actionable but governed by invalidation levels.
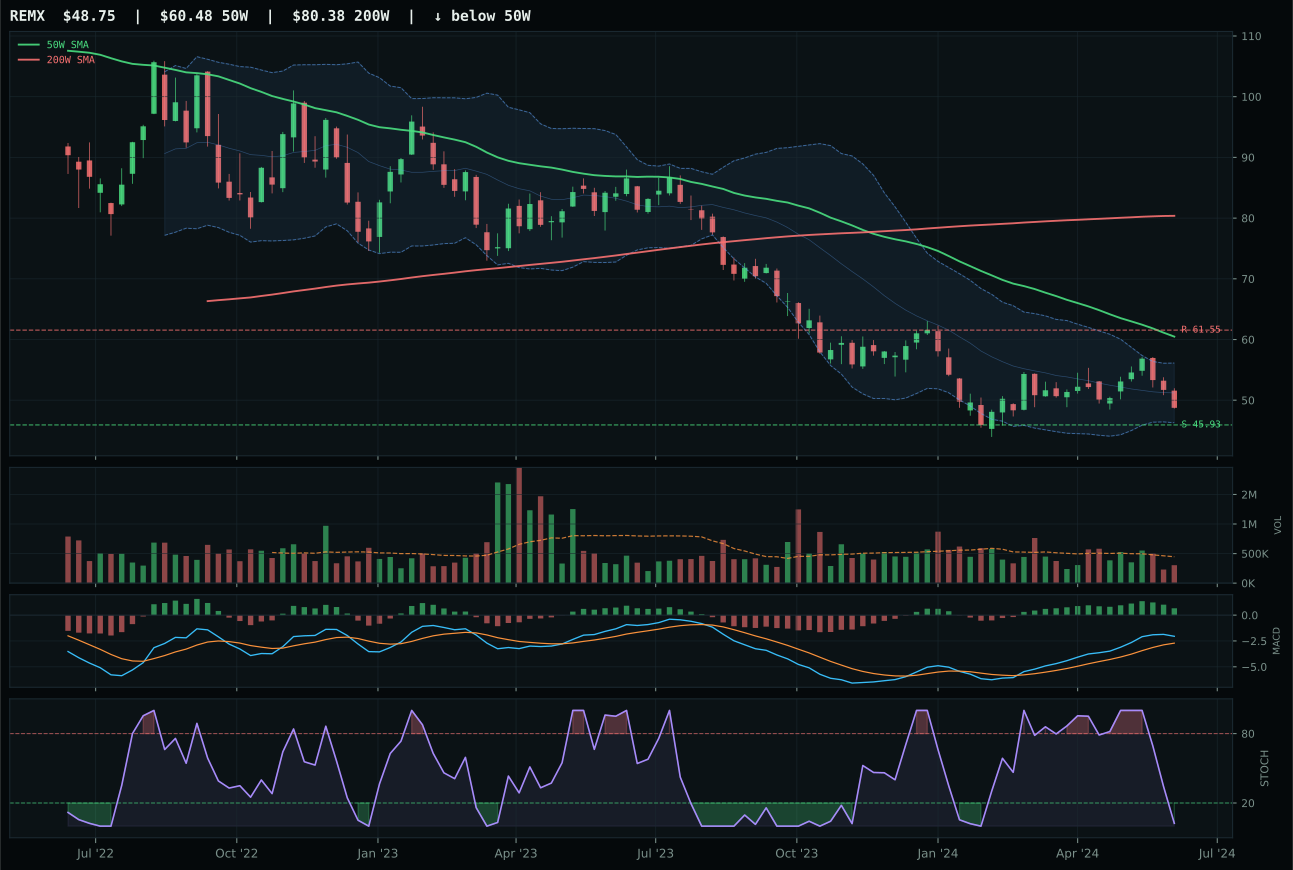
REMX has a neutral structure profile with -8.4% 13-week relative strength versus SPY.
Extension and support failure are the main tactical risks.
Tracked, but not top-2 eligible because: structurally broken.
PICK wins a close technical race against COPX by owning the timing setup: at 2.9% above 50-week in a middle-retracement Fibonacci zone (0.382), PICK deserves a perfect 100/100 timing score that COPX cannot match at 48/100—a 52-point chasm created entirely by proximity to the 50-week. COPX's 19.5% 13-week return and 15.1% SPY-relative strength are objectively superior momentum, yet COPX sits extended at 16.7% above 50-week in vertical-extension setup, the exact inverse of what a risk manager wants to buy after late-cycle reflation has already run. PICK's distribution pressure at 1.60x volume is a red flag on persistence, but neutral category-relative strength (0%) beats COPX's 14.9%—suggesting PICK's compression is accumulation by smart hands before the next move, not capitulation.
Industrial Metals scored 44.4/100 and earned 5% allocation, ranking seventh. Macro tailwinds are strong—late-cycle reflation, metals scarcity, commodity breadth positive, and real asset sponsorship combine for 68.0/100 macro fit. PICK's 39.2/100 technical evidence is thin, pulling the category score down to fourth quartile despite the favorable macro backdrop. The position is tactical: PICK's perfect timing setup (100/100) into oversold stochastic and compression zone offers a clean reload opportunity in a macro-sponsored space. Five percent is a proxy trade for the metals scarcity narrative without taking on extended COPX. Upgrade to 10% only if PICK breaks 45.96 resistance on volume expansion with stochastic RSI rising above 0.5—confirming the coil is live. Current positioning is trade-weight, not portfolio anchor.
AI — SMH
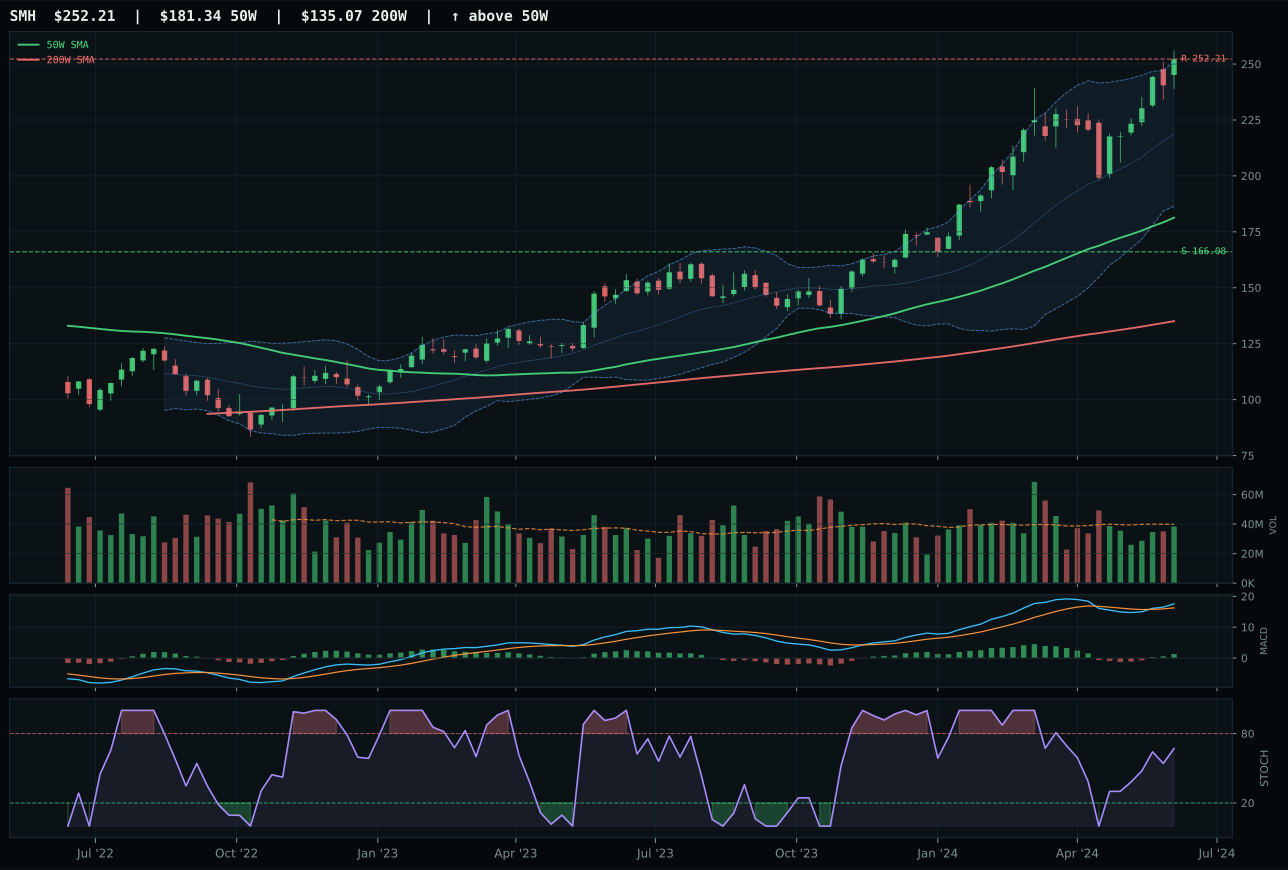
SMH has a vertical extension profile with 7.7% 13-week relative strength versus SPY.
A failed hold above support would weaken the setup.
Actionable but governed by invalidation levels.
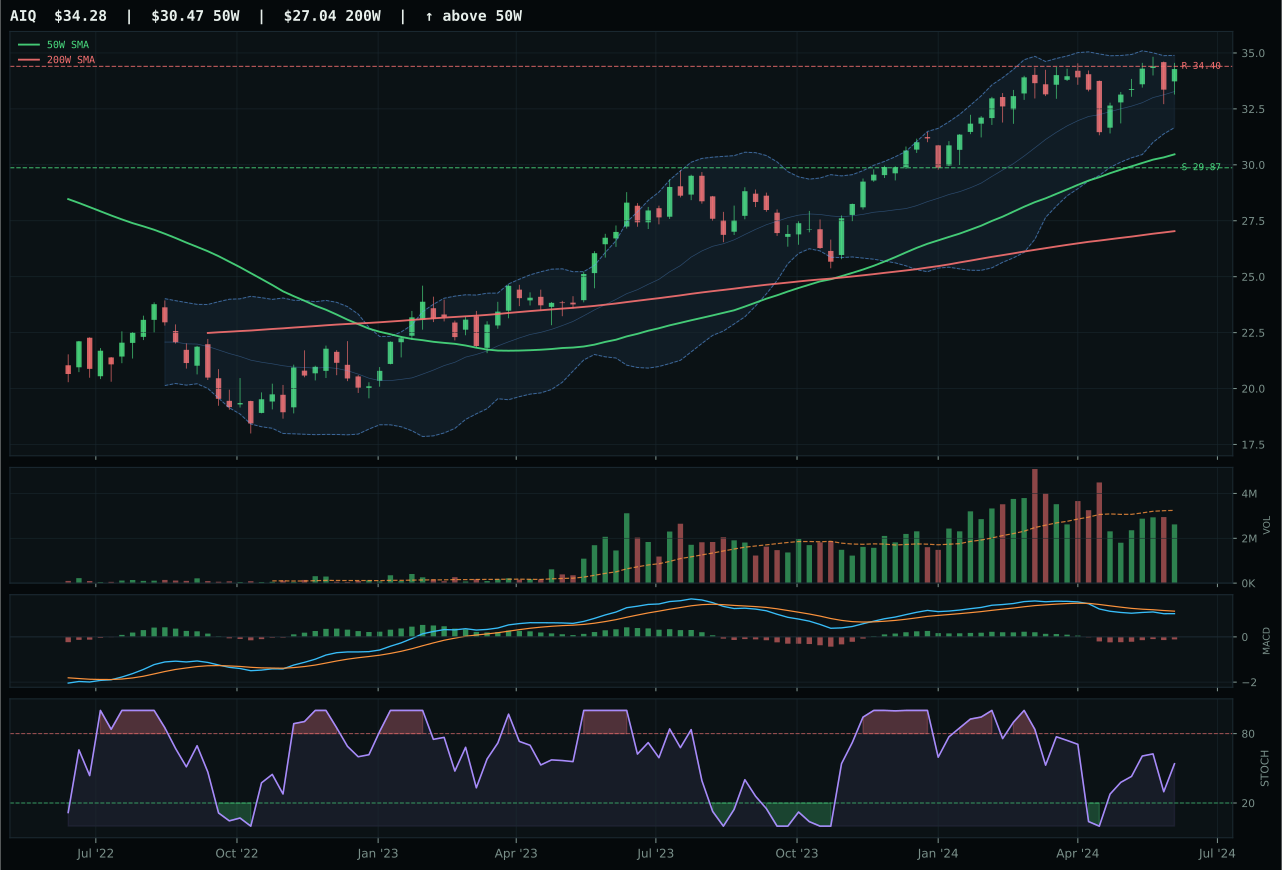
AIQ has a neutral structure profile with -2.5% 13-week relative strength versus SPY.
A failed hold above support would weaken the setup.
Actionable but governed by invalidation levels.
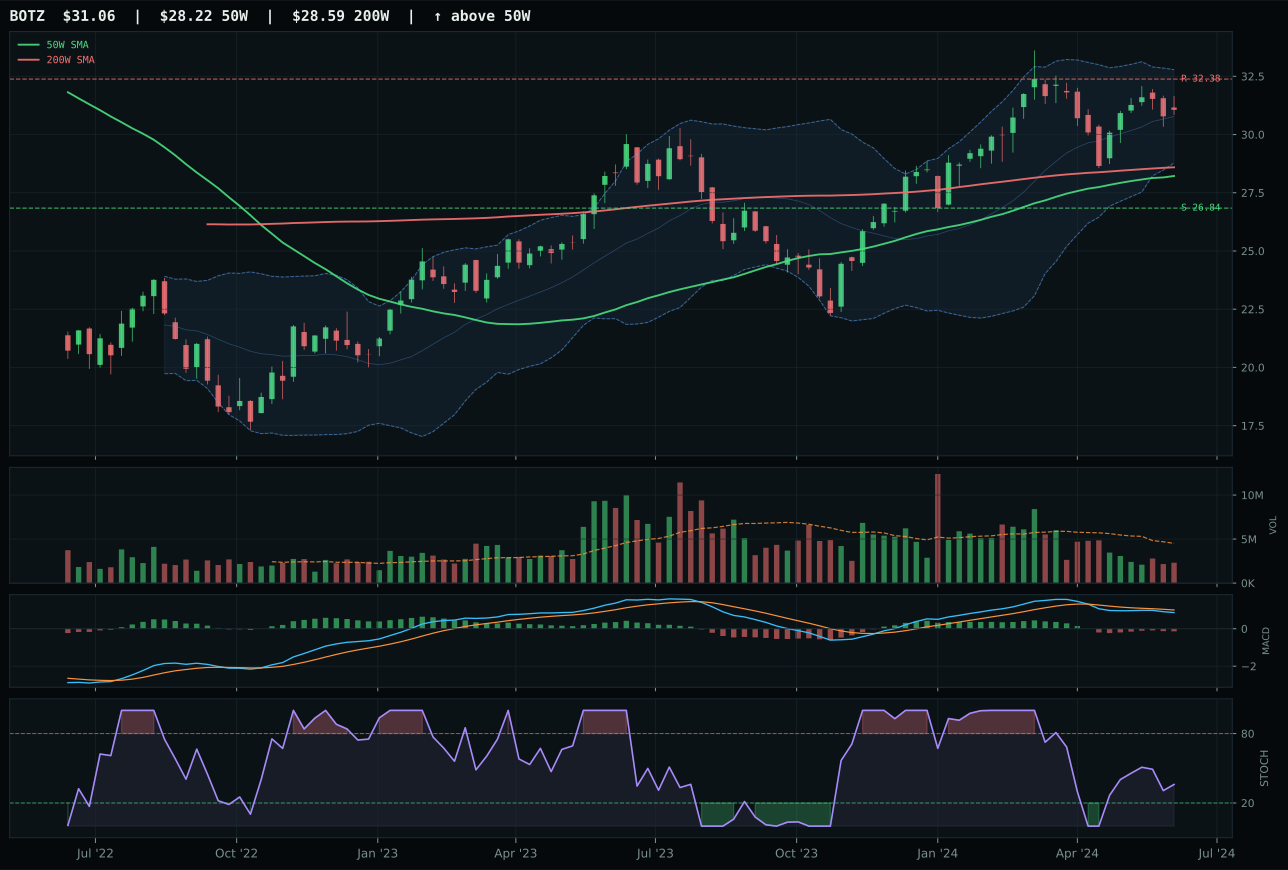
BOTZ has a neutral structure profile with -8.4% 13-week relative strength versus SPY.
A failed hold above support would weaken the setup.
Actionable but governed by invalidation levels.
SMH wins the AI category on pure momentum dominance: 100/100 trend score from price above both moving averages plus 7.7% SPY-relative strength, paired with perfect 100/100 momentum confirmation from 13-week returns of 12.1% and category-relative performance at 10.2%. The stochastic RSI rising mid-zone and bullish-improving MACD deliver textbook continuation setup, even as price sits 39.1% above the 50-week—a vertical extension that normally depresses timing scores. The compression of risk/reward (only 39.8/100) and the 51.9% downside to support tell you the setup is overextended, yet AIQ's weaker momentum (54/100 vs 100/100) and falling stochastic RSI make SMH the only name with enough sponsorship to justify the stretched valuation.
AI scored 36.5/100 and holds 5% allocation—a tactical position in a category ranked fourth overall. The macro fit is weak at 32.0/100, burdened by liquidity stress, credit stress, and broad market bear conditions. SMH's strong technical evidence (75.6/100) nearly offsets the macro headwind, but the category itself is not generating the kind of leadership that warrants top-2 placement. Five percent is appropriate: it caps upside exposure to a group that is technically leading but lacks macro sponsorship. Were SMH to extend another 10–15% with continued category-relative outperformance and MACD confirmation across AIQ and BOTZ, or if defensive rotation reversed into growth sponsorship, AI would be a candidate to move to 10% or 20%.
Agriculture & Livestock — WEAT
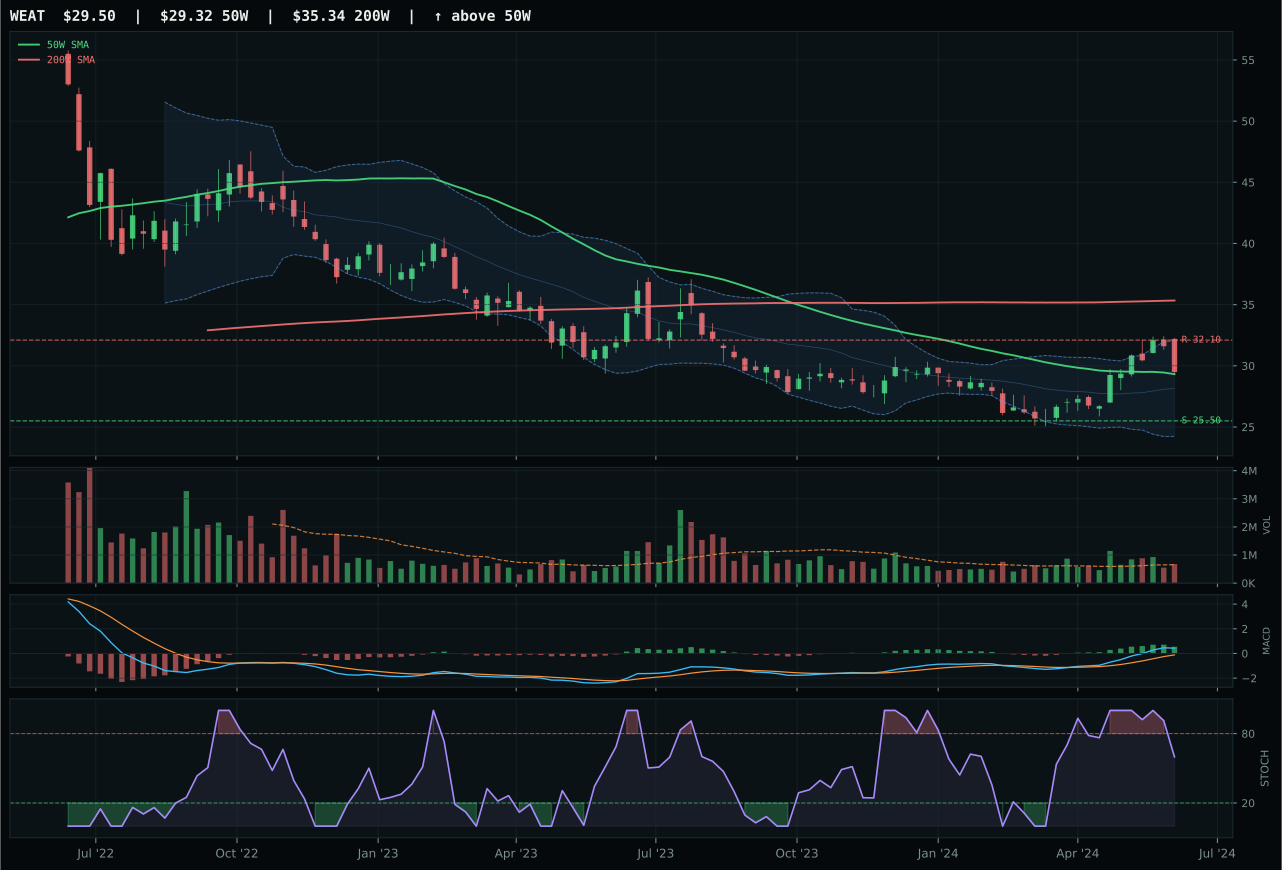
WEAT has a compression near 50W profile with 10.4% 13-week relative strength versus SPY.
A failed hold above support would weaken the setup.
Actionable but governed by invalidation levels.
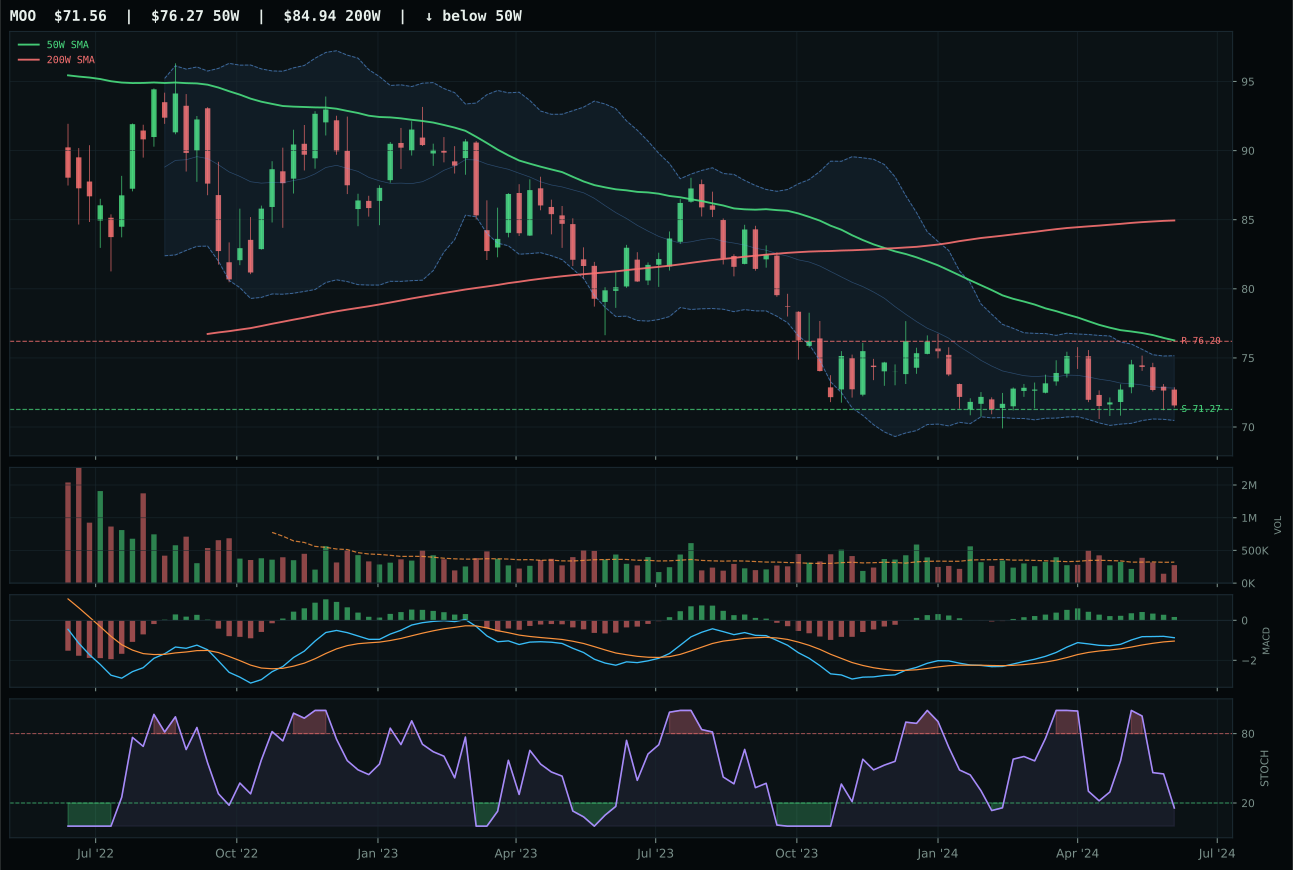
MOO has a pullback into support profile with -5.9% 13-week relative strength versus SPY.
Extension and support failure are the main tactical risks.
Tracked, but not top-2 eligible because: structurally broken.
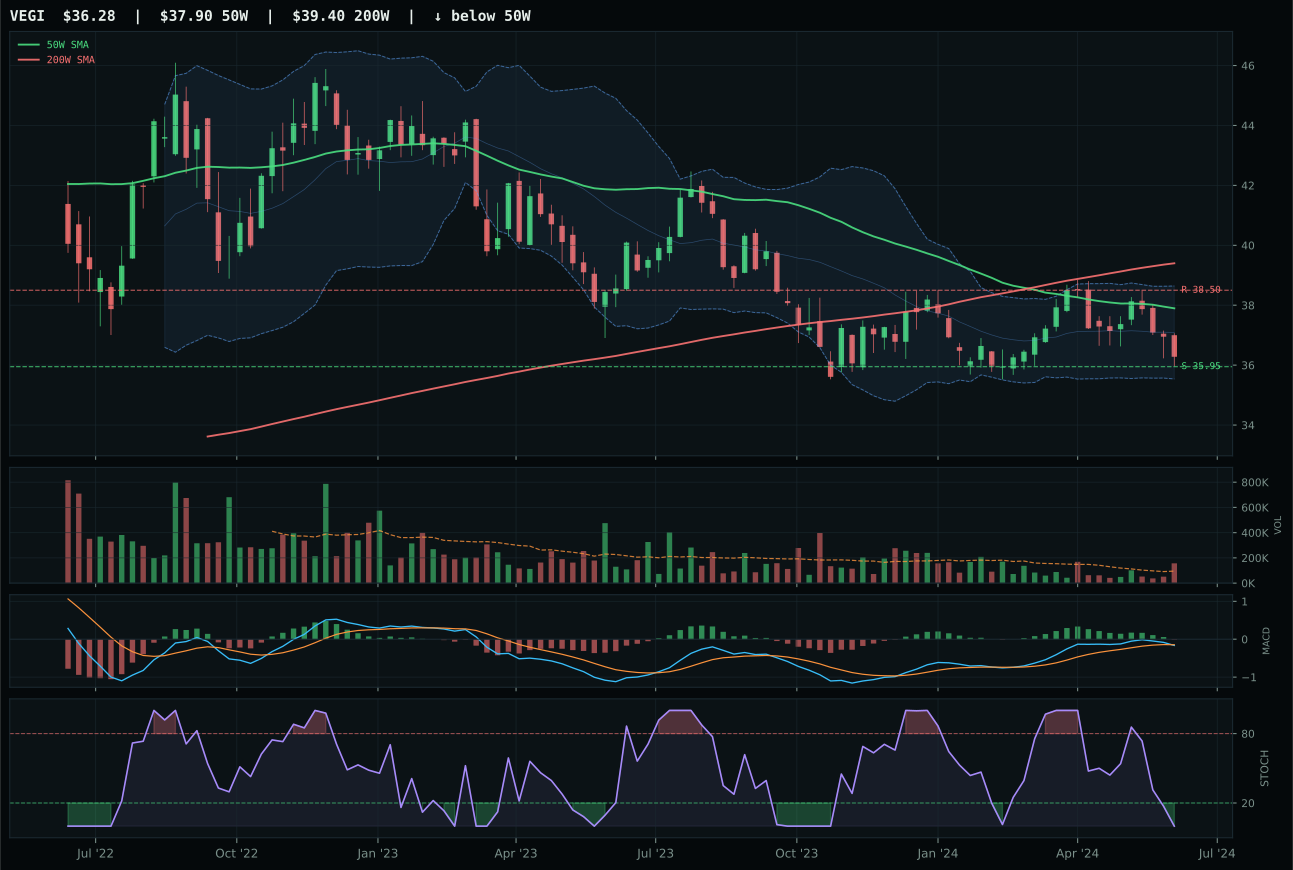
VEGI has a pullback into support profile with -6.1% 13-week relative strength versus SPY.
Extension and support failure are the main tactical risks.
Tracked, but not top-2 eligible because: structurally broken.
WEAT dominates a fractured category with perfect 100/100 momentum confirmation despite being in deep compression: price sits just 0.6% above the 50-week, MACD bullish-but-flattening (not improving), and stochastic falling into neutral at 0.60. The setup's power comes from timing: 95/100 for proximity to the 50-week in a Fibonacci deep-retracement zone (0.618) signals a potential pivot rather than a buy-the-dip bounce. 16.4% category-relative strength crushes MOO's 0%, and neutral volume at 1.04x confirms the move isn't being rejected. MOO's structure broke—a hard filter that eliminated it despite superior macro fit—while VEGI collapsed into distribution pressure and bearish MACD, leaving only WEAT standing with a credible technical foundation.
Agriculture scored 35.6/100 and received 5% allocation, ranking sixth. The macro story is exceptional—late-cycle reflation, supply shortage, inflation pressure, and real asset sponsorship combine for 90.0/100 macro fit, the strongest on the board. WEAT's 86.5/100 technical evidence bridges that gap. However, the category score remains sixth because WEAT's momentum confirmation (100/100) is trailing into an overbought setup rather than leading into fresh breakout, and its persistence score (72.3/100) shows momentum is losing steam. Five percent reflects macro tailwind with technical caution: the position captures supply-shock protection without overcommitting to a chart that has already run hard. To upgrade to 10%, WEAT would need a clean breakout above 32.10 resistance on volume expansion and fresh MACD confirmation.
Technology — XLK
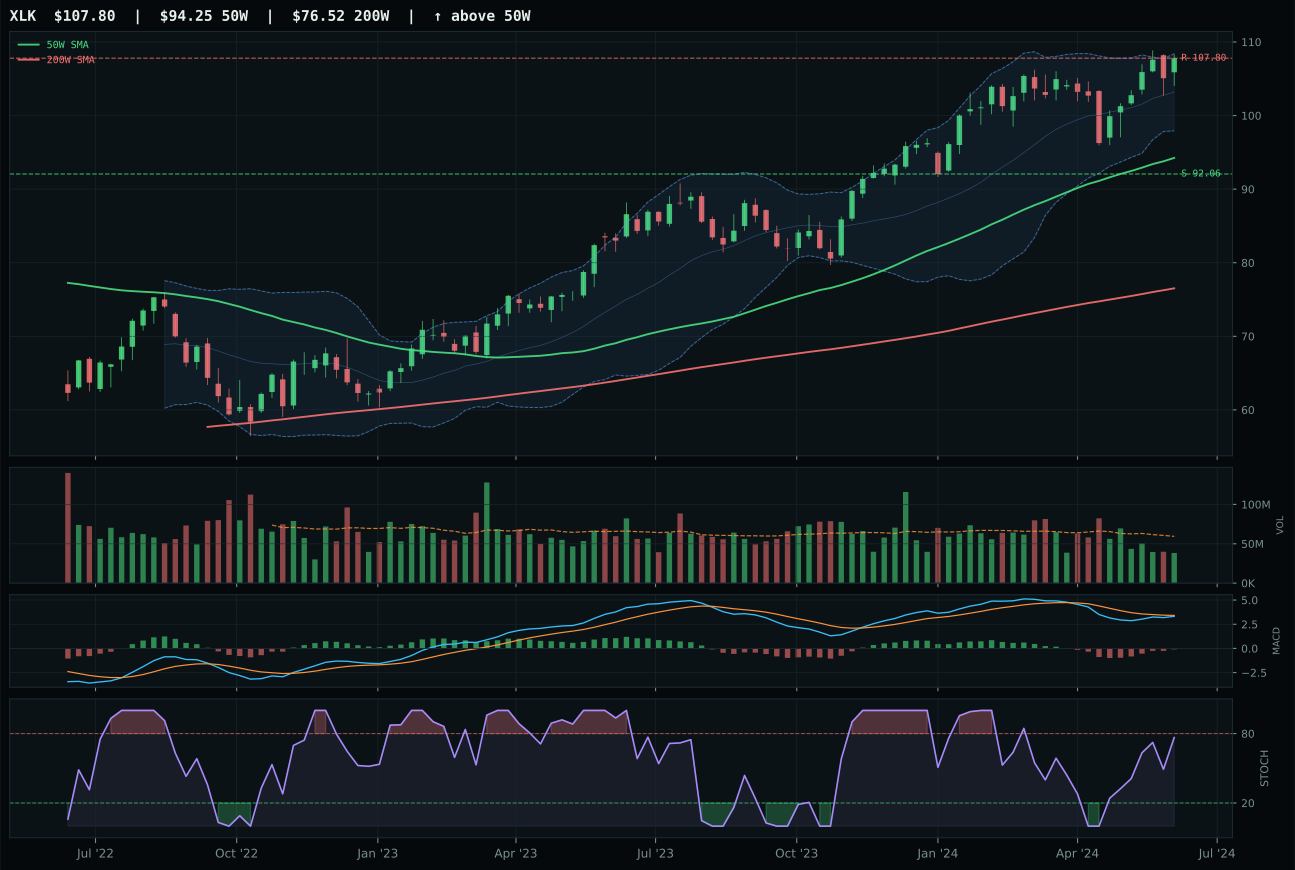
XLK has a neutral structure profile with -0.4% 13-week relative strength versus SPY.
A failed hold above support would weaken the setup.
Actionable but governed by invalidation levels.
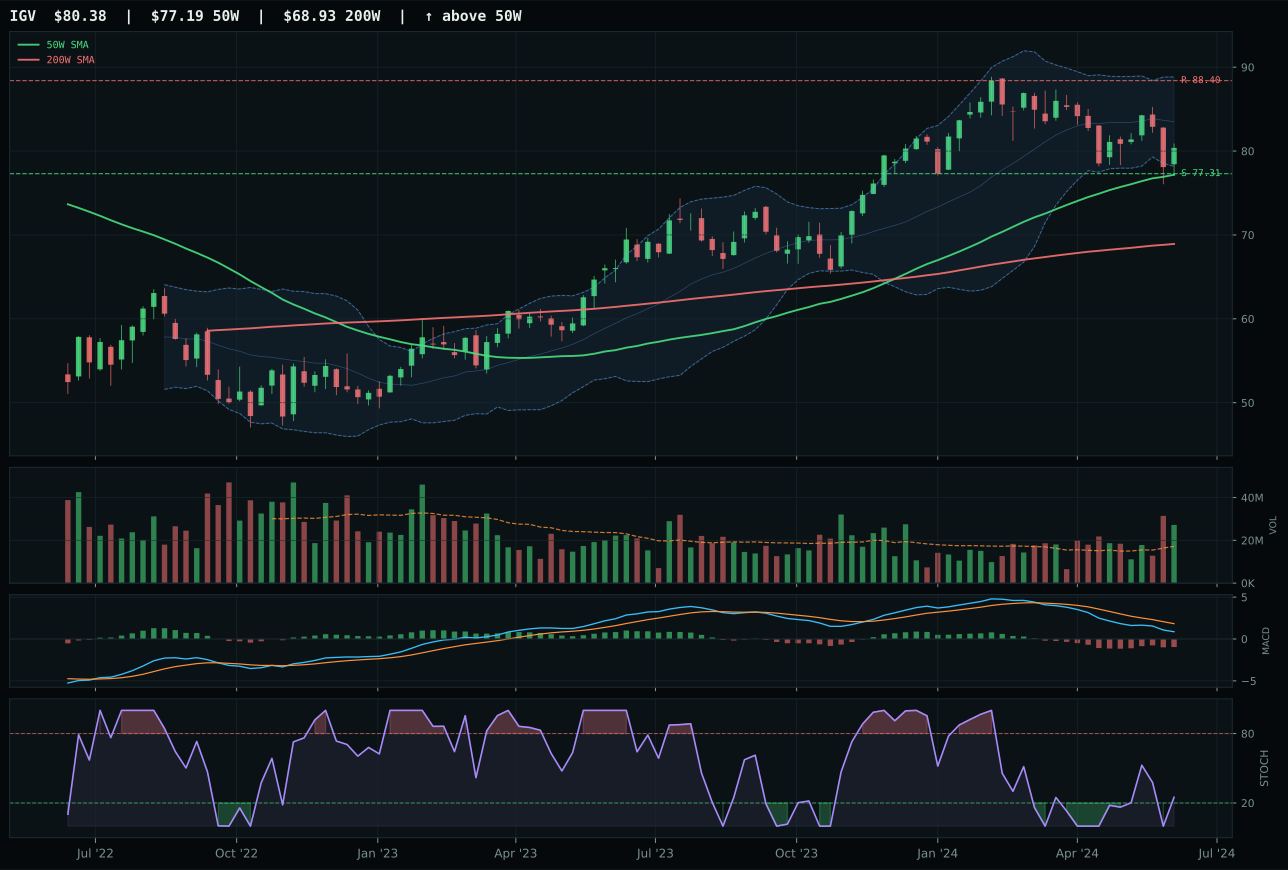
IGV has a pullback into support profile with -9.7% 13-week relative strength versus SPY.
A failed hold above support would weaken the setup.
Actionable but governed by invalidation levels.
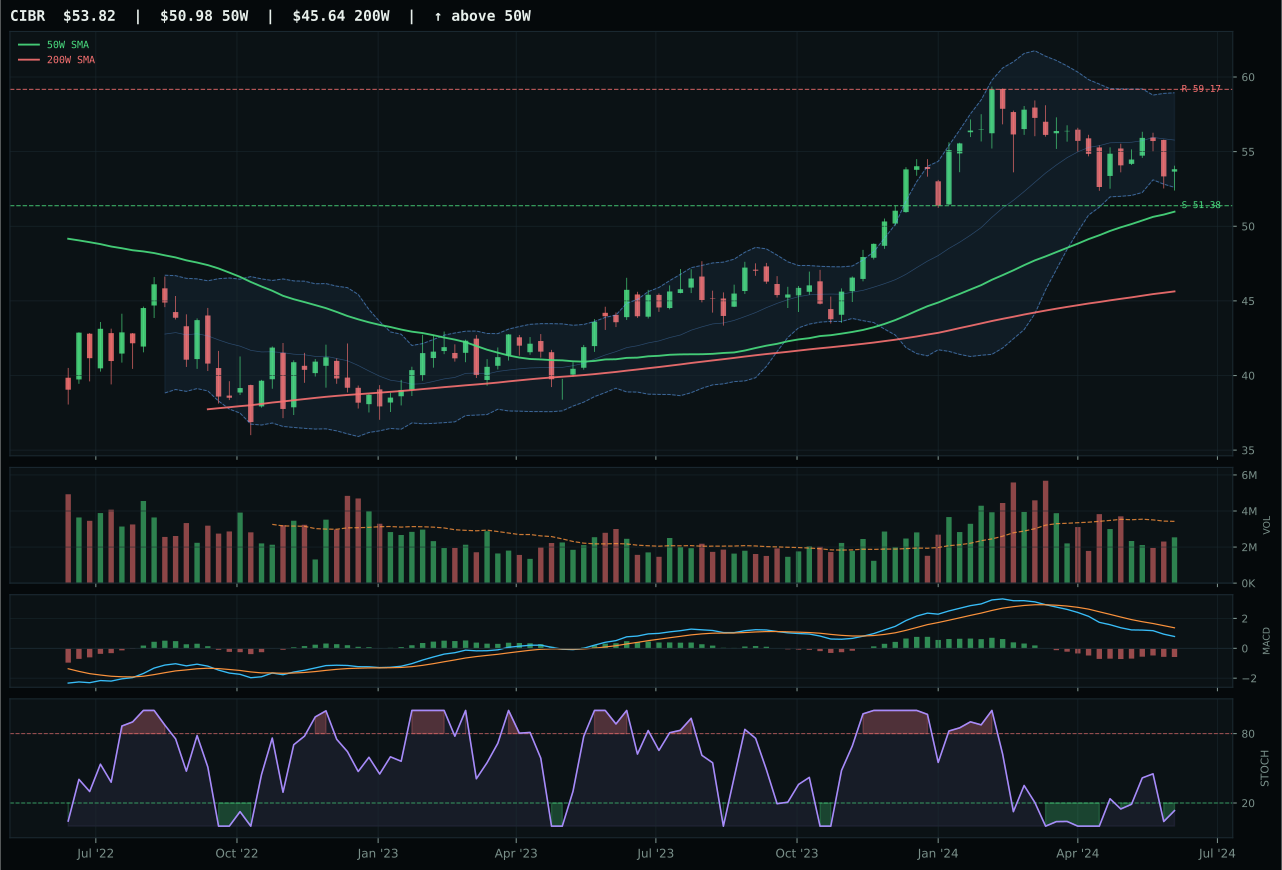
CIBR has a pullback into support profile with -10.4% 13-week relative strength versus SPY.
A failed hold above support would weaken the setup.
Actionable but governed by invalidation levels.
XLK captures the category despite a setup that lacks urgency: price sits 14.4% above the 50-week moving average in neutral structure, territory where every fresh buyer is chasing extension. The 9.3% category-relative strength edge over IGV supplies the margin of victory, paired with stochastic RSI rising into mid-zone while MACD improves from bearish—a combination that flags accumulation rather than capitulation. Volume participation at 0.64x the 20-week average remains thin, a structural warning that this setup is clean but underfunded. Against IGV's pullback-into-support setup and falling stochastic, XLK's uptrend mechanics simply outweigh the timing penalty of being extended; the setup tells you which direction the crowd prefers, not whether the entry is safe.
Technology ranked ninth at 34.9/100 and earned zero allocation this week. Late-Cycle Reflation and active liquidity stress, credit stress, and inflation pressure all conspire against tech: the macro composite sits at 30.0/100. XLK's 4.0% 13W return and -0.4% RS versus SPY tell the real story—technology is treading water while real assets and energy lead. The category needed a 50+ score to compete for a position, and its inability to break that threshold reflects both weak relative momentum and a macro regime where growth is being de-rated in favor of yield and commodity exposure. For Technology to earn allocation, we'd need either MACD confirmation across all three names, a breakout move in category-relative strength above 5%, or a shift away from defensive rotation.
Emerging Markets — INDA
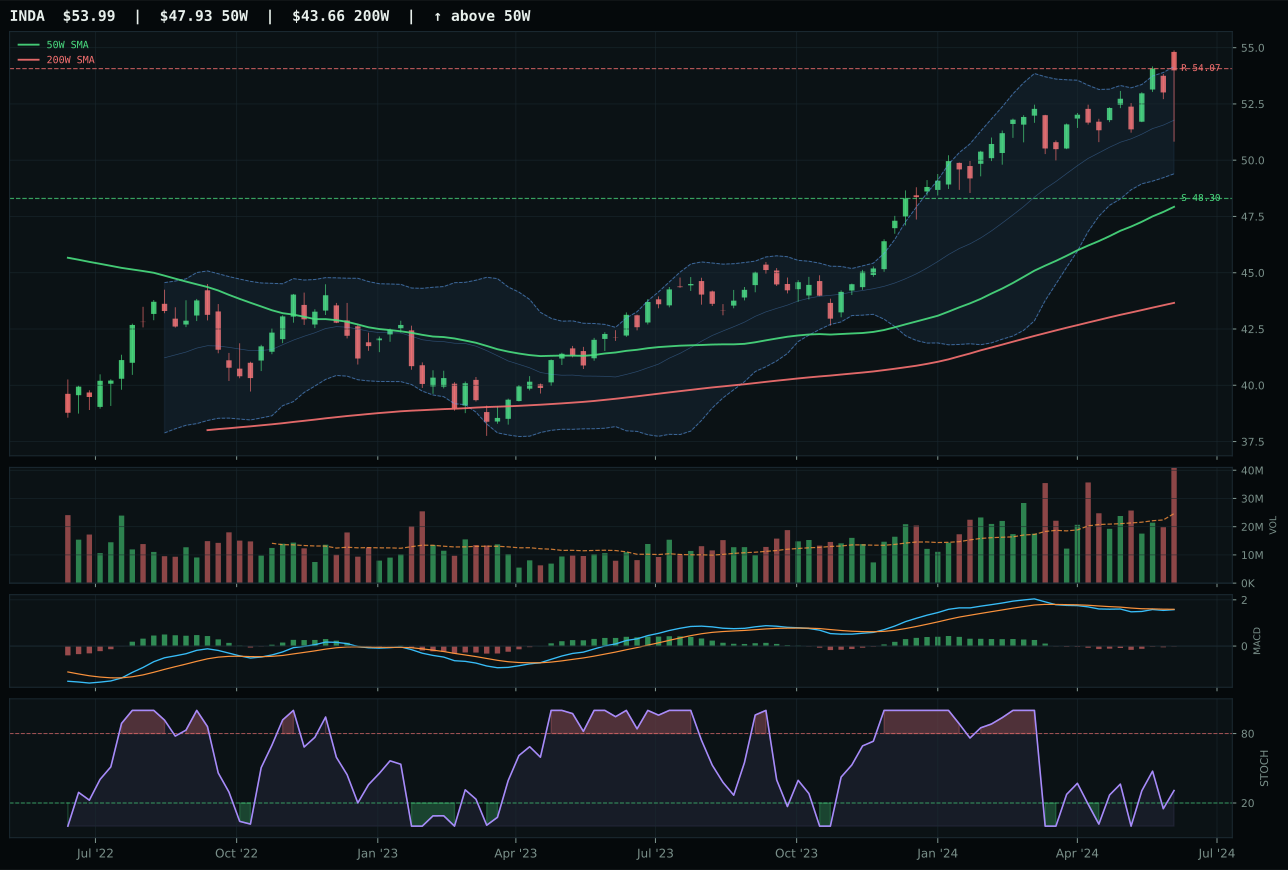
INDA has a neutral structure profile with -1.1% 13-week relative strength versus SPY.
A failed hold above support would weaken the setup.
Actionable but governed by invalidation levels.
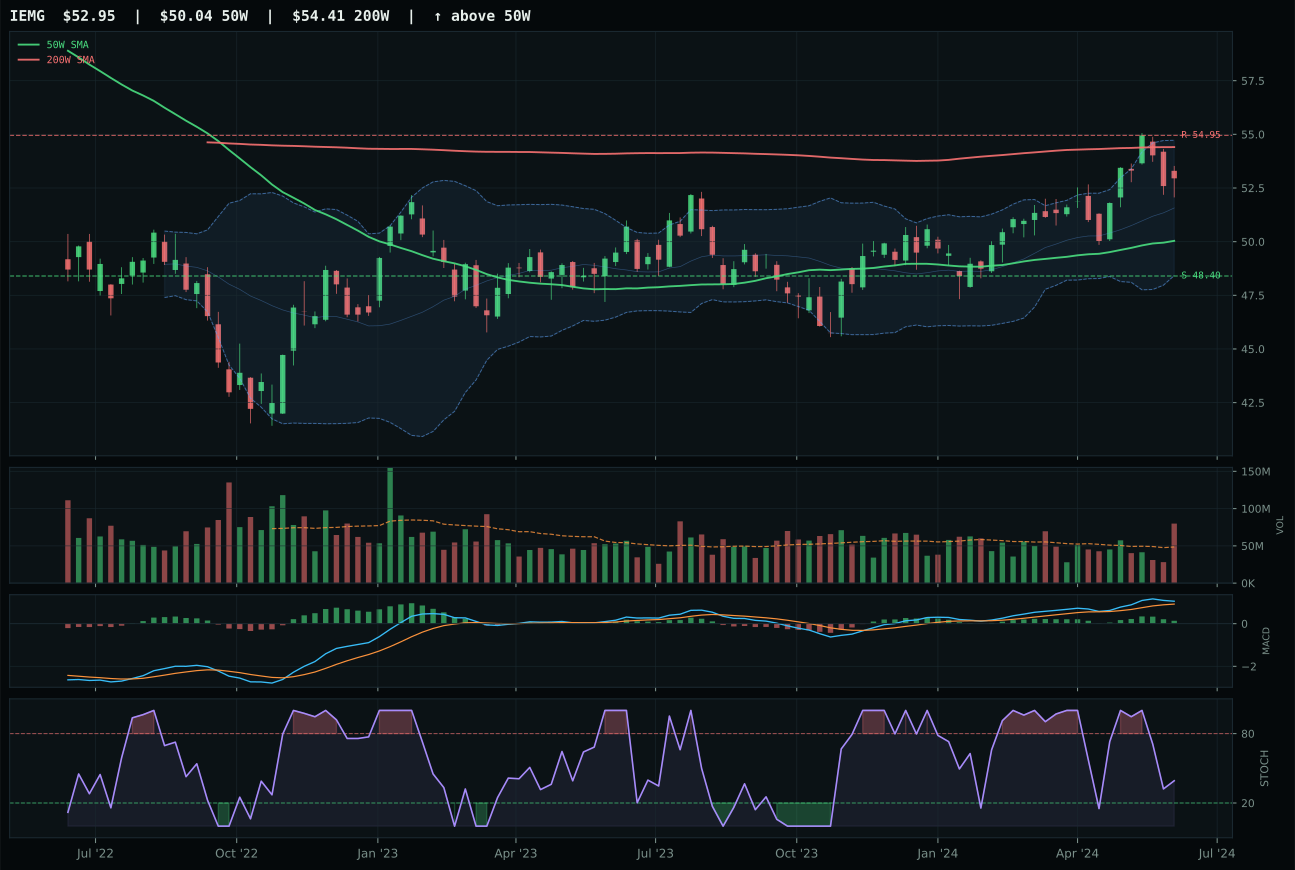
IEMG has a neutral structure profile with -1.2% 13-week relative strength versus SPY.
A failed hold above support would weaken the setup.
Actionable but governed by invalidation levels.
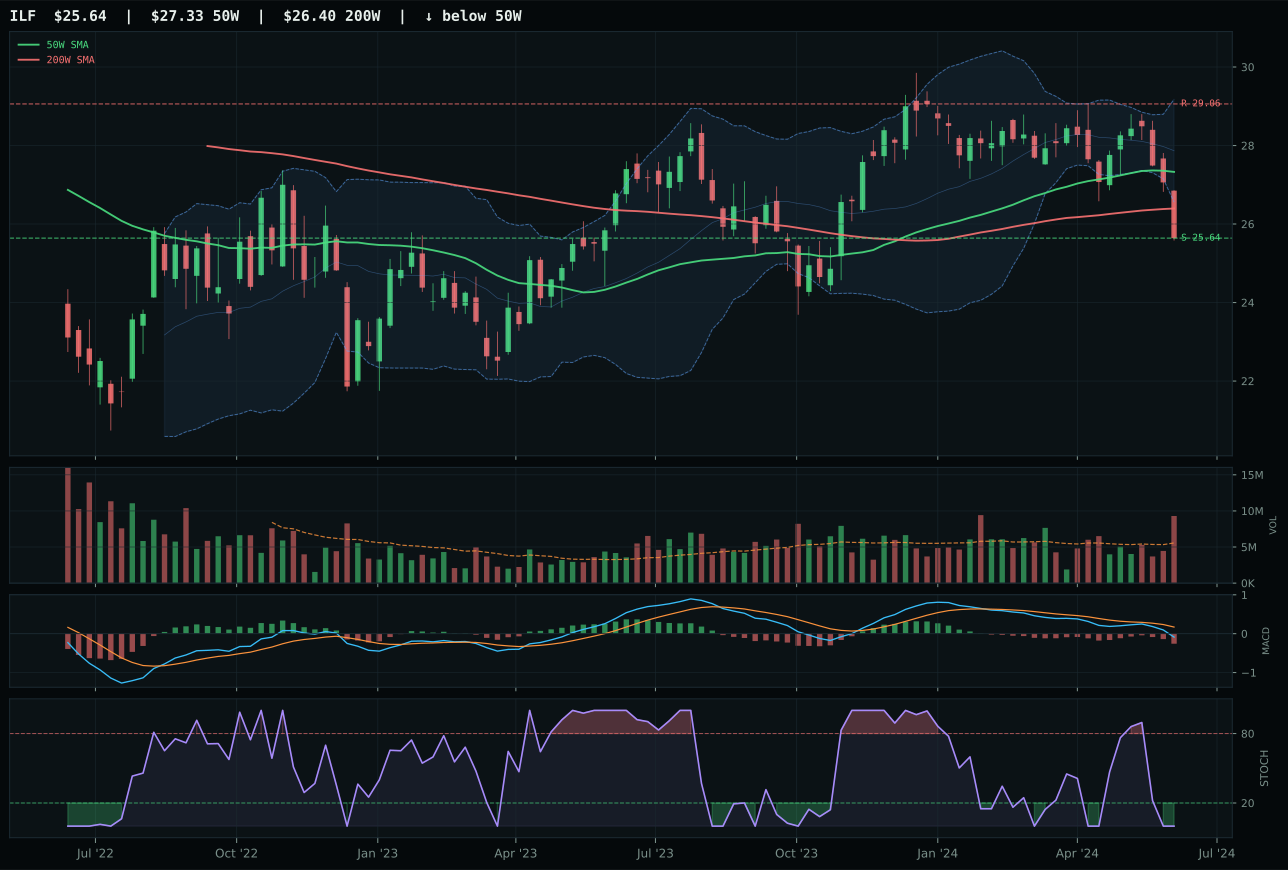
ILF has a pullback into support profile with -11.8% 13-week relative strength versus SPY.
A failed hold above support would weaken the setup.
Actionable but governed by invalidation levels.
INDA wins an unloved category with a narrow 1.8-point edge over IEMG because of superior timing mechanics. Both sit in neutral structure with nearly identical SPY-relative returns (-1.1% vs -1.2%), yet INDA's stochastic RSI rising mid-zone (0.31) beats IEMG's falling-neutral positioning. INDA's MACD is bearish-but-improving versus IEMG's bullish-but-flattening—a subtle reversal that flags INDA closer to momentum inflection. Price at 12.6% above 50-week for INDA versus IEMG's implied higher extension gives INDA the cleaner entry. Volume accumulation-confirmation at 2.54x for both supplies real sponsorship, lifting both above the category's desperate 7% macro fit, yet INDA edges IEMG on rising stochastic as the first hint of bullish reversal.
Emerging Markets scored 13.2/100 and received zero allocation this week, ranking dead last. The macro fit is disastrous at 7.0/100: dollar pressure (-14), credit stress (-10), liquidity stress (-10), and broad market bear (-9) all conspire against emerging-market beta. INDA's 87.6/100 technical evidence cannot overcome a 38-point macro headwind; the technical setup is legitimate (early accumulation, rising stochastic), but the portfolio cannot afford exposure to a category this unfavorable structurally. For Emerging Markets to earn even 5% allocation, macro would need to reverse: dollar weakness becoming active, credit stress easing, and liquidity pressure relieving. The category is off the board entirely until macro climate shifts. Current positioning is zero-weighted rational, not tactical avoidance.