
2024-05-31
Informational purposes only. The content in this report, including allocations, analysis, and commentary, is provided solely for informational and educational purposes. It does not constitute financial advice, investment advice, trading advice, or any other type of advice. Past performance does not guarantee future results. Always conduct your own research and consult a qualified financial professional before making investment decisions.
Weekly Allocation
| Ticker | Category | Weight | Role |
|---|---|---|---|
| FBTC | 50% | Overlay | |
| SLV | Precious Metals | 10% | Top-2 (10%) |
| NLR | Nuclear Energy | 10% | Top-2 (10%) |
| XLE | Traditional Energy | 5% | Tier-2 (5%) |
| XAR | Defense & Aerospace | 5% | Tier-2 (5%) |
| SMH | AI | 5% | Tier-2 (5%) |
| COPX | Industrial Metals | 5% | Tier-2 (5%) |
| XLU | Utilities & Infrastructure | 5% | Tier-2 (5%) |
| WEAT | Agriculture & Livestock | 5% | Tier-2 (5%) |
Trade Instructions — Monday Open
Sell the tranche from 2024-05-03 (completing its 4-week hold). Buy the new tranche. Instructions show net portfolio changes — same-asset positions cancel, weight changes show the delta.
| Action | Ticker | Instruction |
|---|---|---|
| SELL | XLE | Sell 12% of XLE position (reduce 10.00% → 8.75%) |
| SELL | GLD | Sell 50% of GLD position (reduce 5.00% → 2.50%) |
| SELL | BOTZ | Sell 50% of BOTZ position (reduce 2.50% → 1.25%) |
| BUY | NLR | Buy NLR — 25.00% of freed cash (adds 1.25% to portfolio) |
| BUY | SLV | Buy SLV — 50.00% of freed cash (adds 2.50% to portfolio) |
| BUY | SMH | Buy SMH — 25.00% of freed cash (adds 1.25% to portfolio) |
Current Portfolio After Trade
Combined holdings across all 4 active tranches. Each tranche is 25% of the portfolio.
| Ticker | % of Portfolio | Weight Bar |
|---|---|---|
| FBTC | 50.00% | |
| XLE | 8.75% | |
| NLR | 6.25% | |
| COPX | 5.00% | |
| XLU | 5.00% | |
| XAR | 5.00% | |
| WEAT | 5.00% | |
| SLV | 5.00% | |
| SMH | 3.75% | |
| GLD | 2.50% | |
| BOTZ | 1.25% | |
| URNM | 1.25% | |
| PICK | 1.25% |
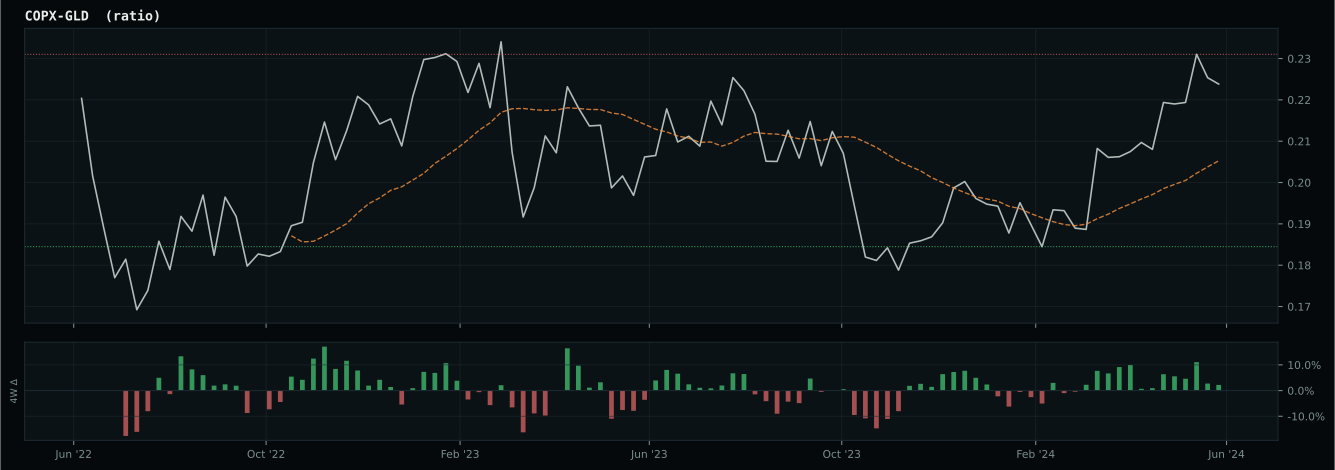
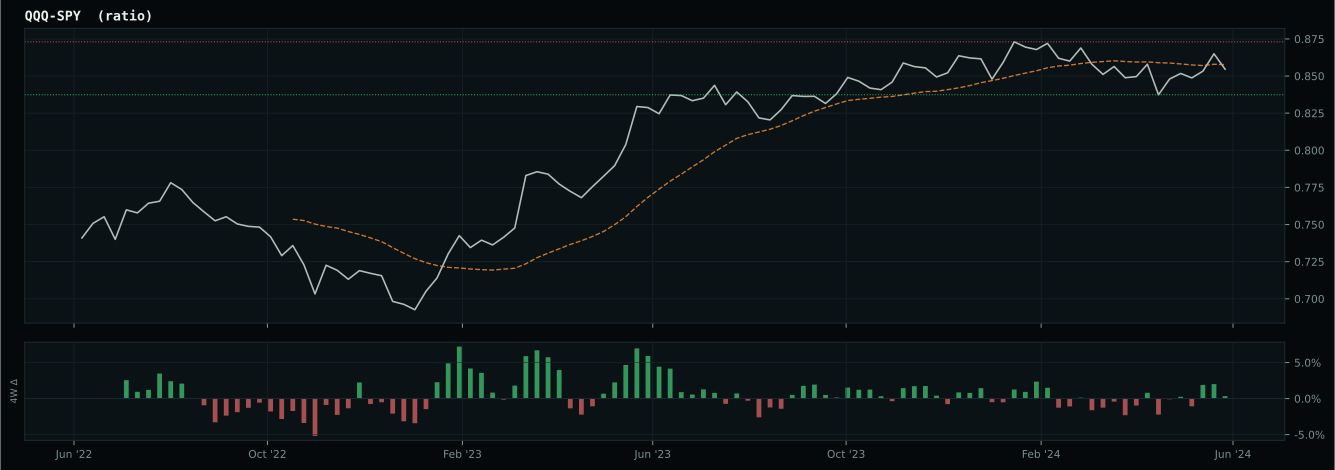
Macro Regime — Late-Cycle Reflation
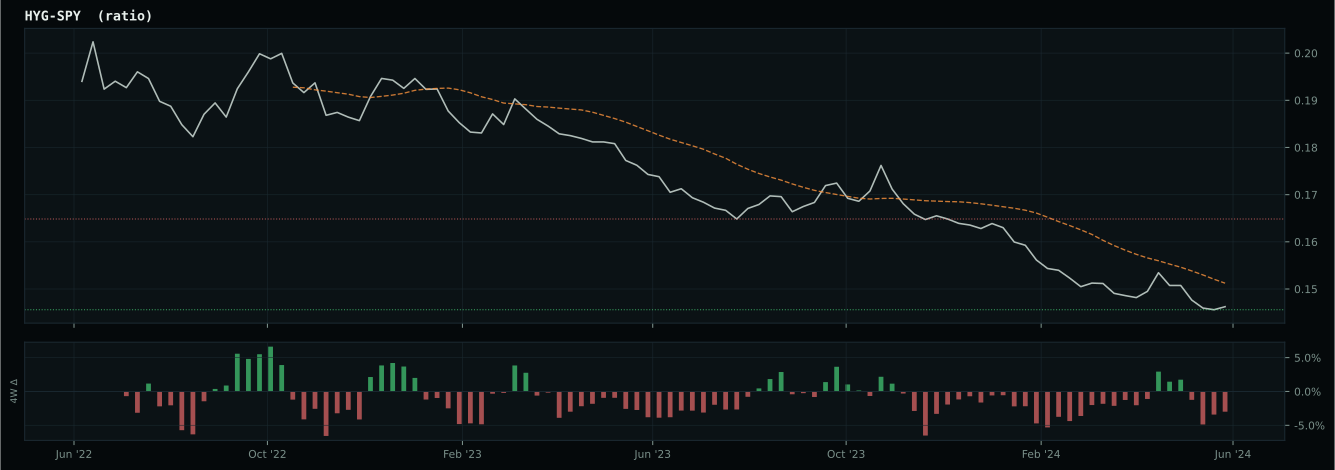
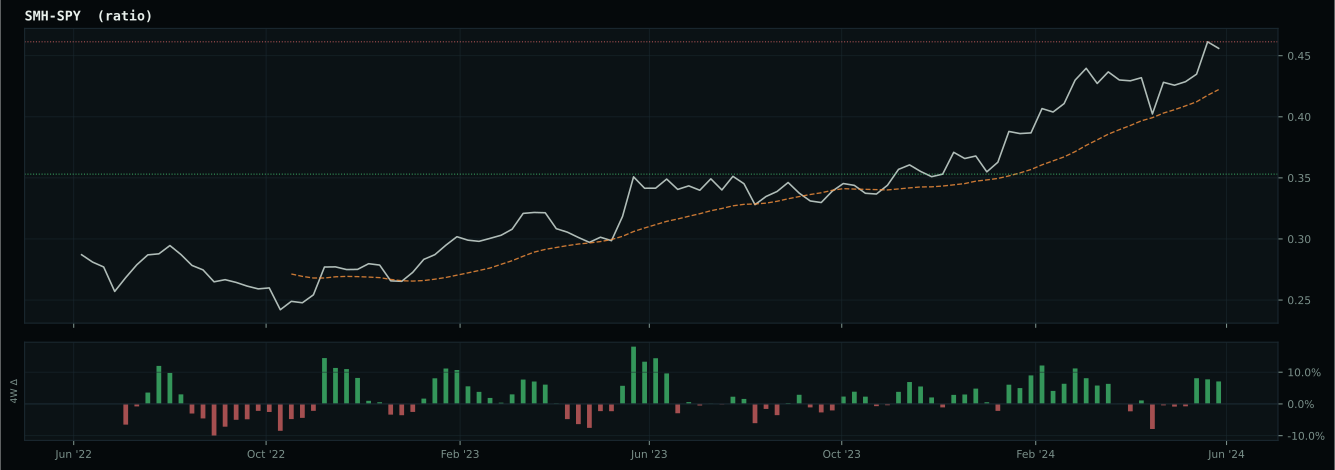
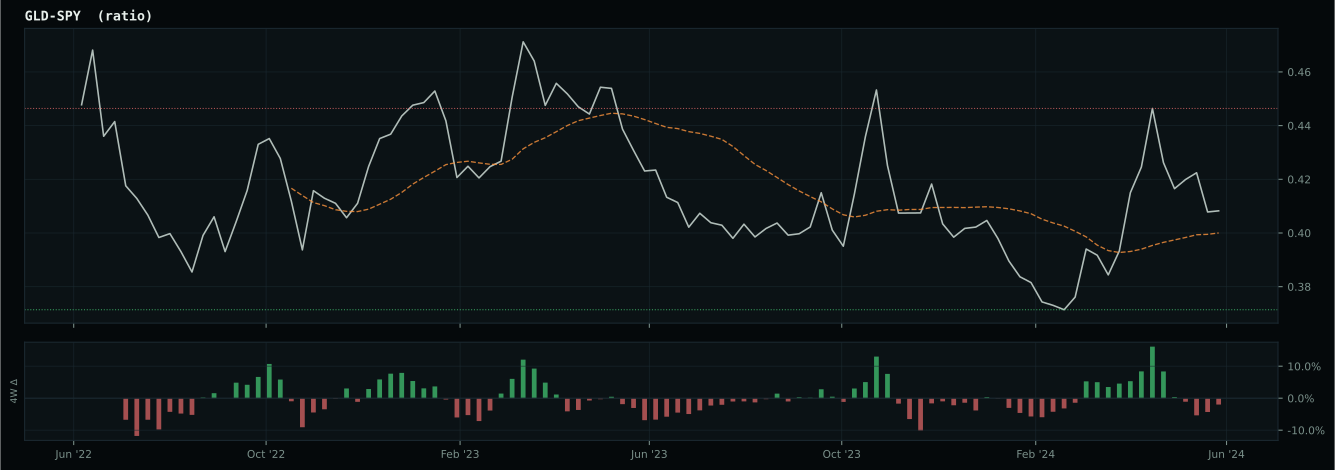
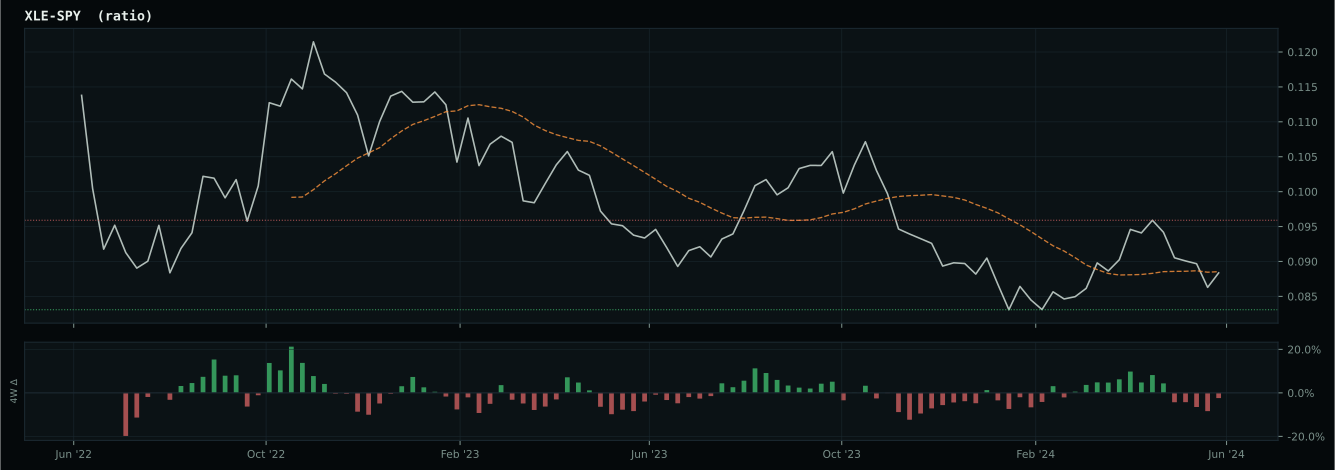
Macro Evidence Charts
Market-implied signals behind the macro regime scores. Each ratio compares two assets; the direction and slope of the ratio is what the macro engine reads.
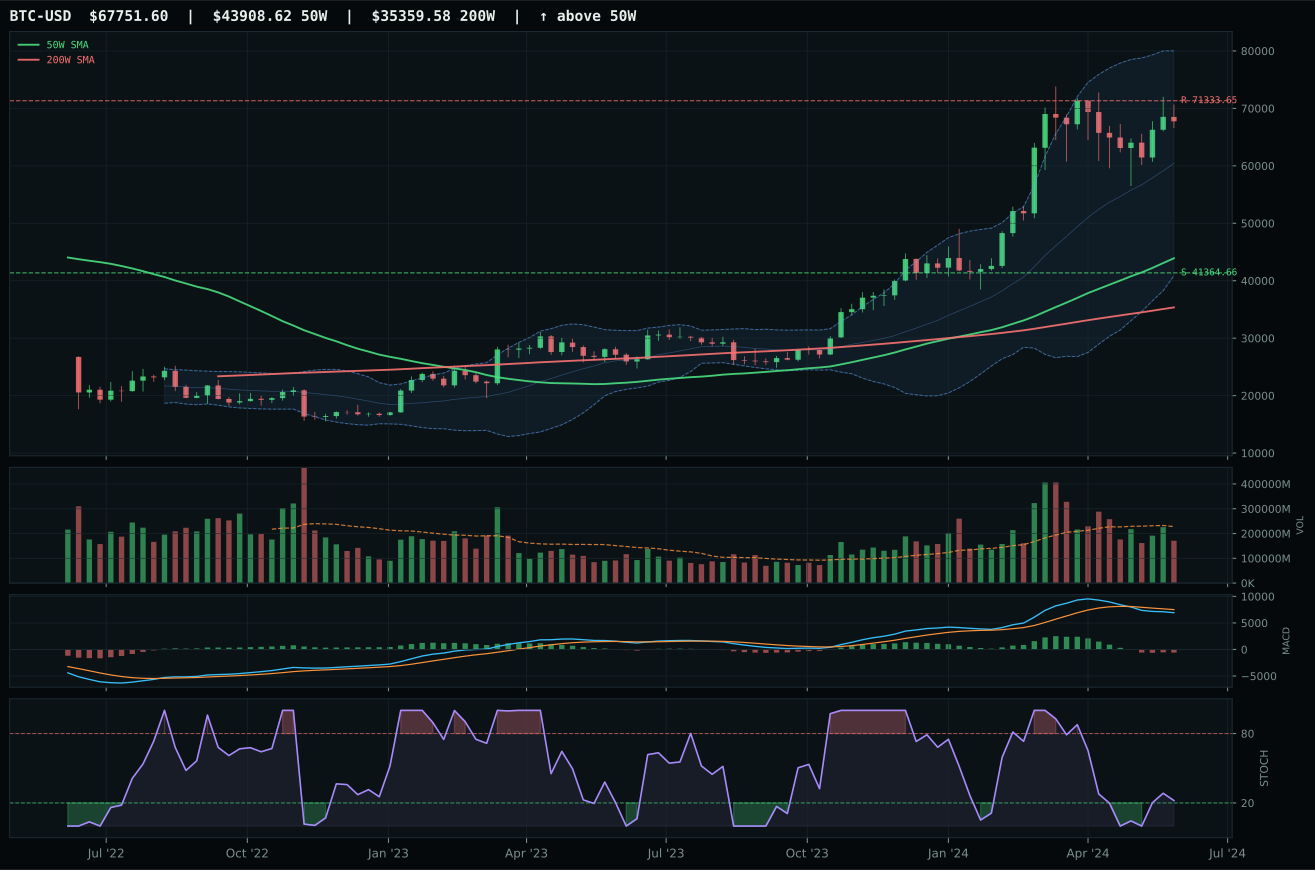
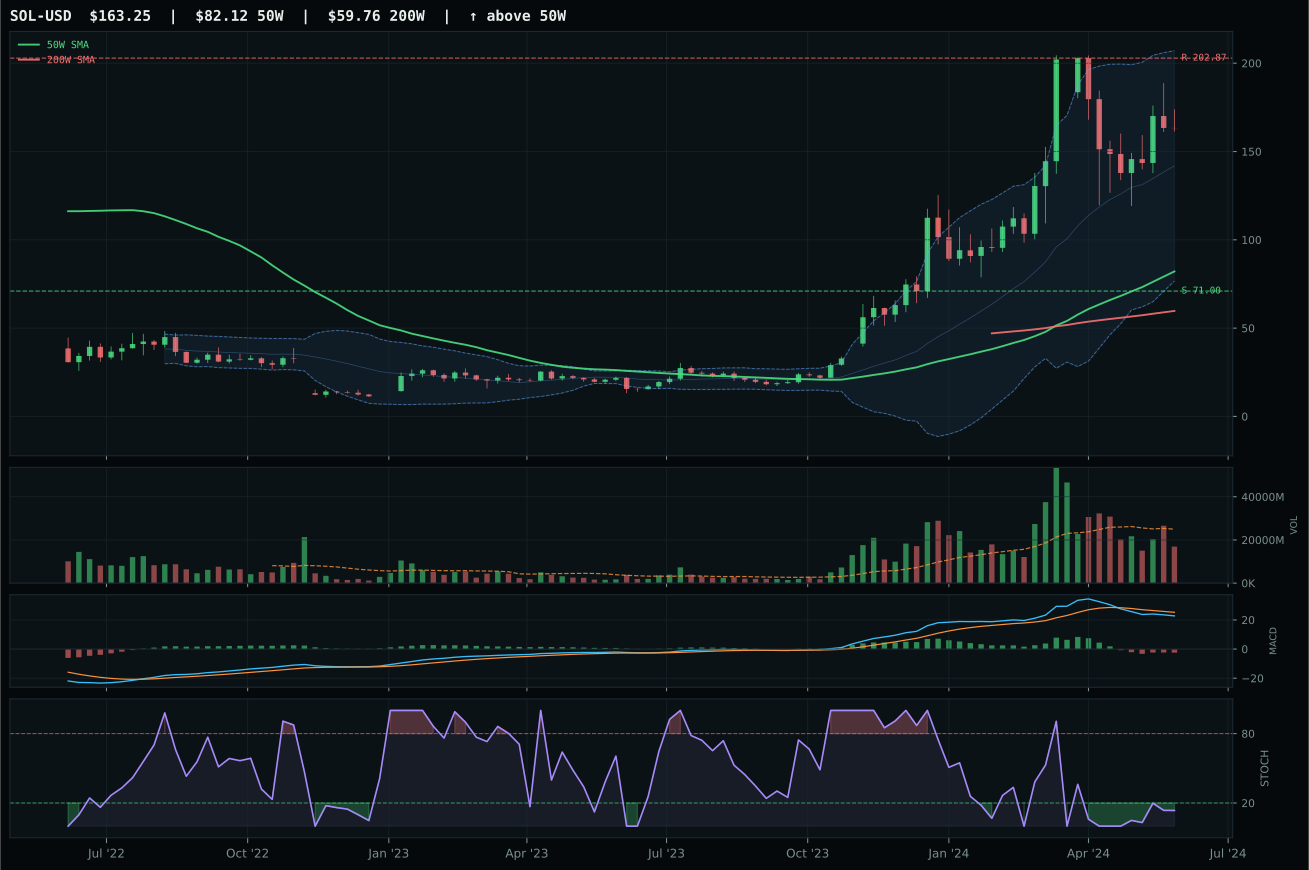
Crypto Regime — TrendBTC
ValueBTC not armed: BTC has not made the first post-breakdown touch of the 200W buy zone after losing the 50W
TrendBTC confirmed: 2 consecutive closes above rising/flat 50W SMA
one or more available conditions failed
Category Rankings
| Rank | Category | Winner | Score | Alloc | 4W Ret | Peers (4W) |
|---|---|---|---|---|---|---|
| 1 | Precious Metals | SLV | 70.3 | 20% | -3.95% | GDX -3.8% · GLD -0.3% |
| 2 | Nuclear Energy | NLR | 65.7 | 20% | -7.79% | URNM -13.2% · URA -10.0% |
| 3 | Traditional Energy | XLE | 64.0 | 10% | -1.09% | FCG -4.6% · XOP -4.0% |
| 4 | Defense & Aerospace | XAR | 60.5 | 10% | -2.25% | ITA -2.9% · ROKT -2.3% |
| 5 | AI | SMH | 51.9 | 10% | +6.49% | AIQ +5.8% · BOTZ -0.9% |
| 6 | Industrial Metals | COPX | 51.7 | 10% | -5.61% | PICK -6.6% · REMX -16.2% |
| 7 | Utilities & Infrastructure | XLU | 51.2 | 10% | -5.17% | IGF -5.1% · PAVE -4.7% |
| 8 | Agriculture & Livestock | WEAT | 48.2 | 10% | -17.70% | MOO -3.6% · VEGI -3.2% |
| 9 | Technology | XLK | 32.3 | 0% | +6.99% | CIBR +5.4% · IGV +11.0% |
| 10 | Emerging Markets | INDA | 22.0 | 0% | +2.24% | IEMG +1.1% · ILF -7.6% |
Precious Metals — SLV
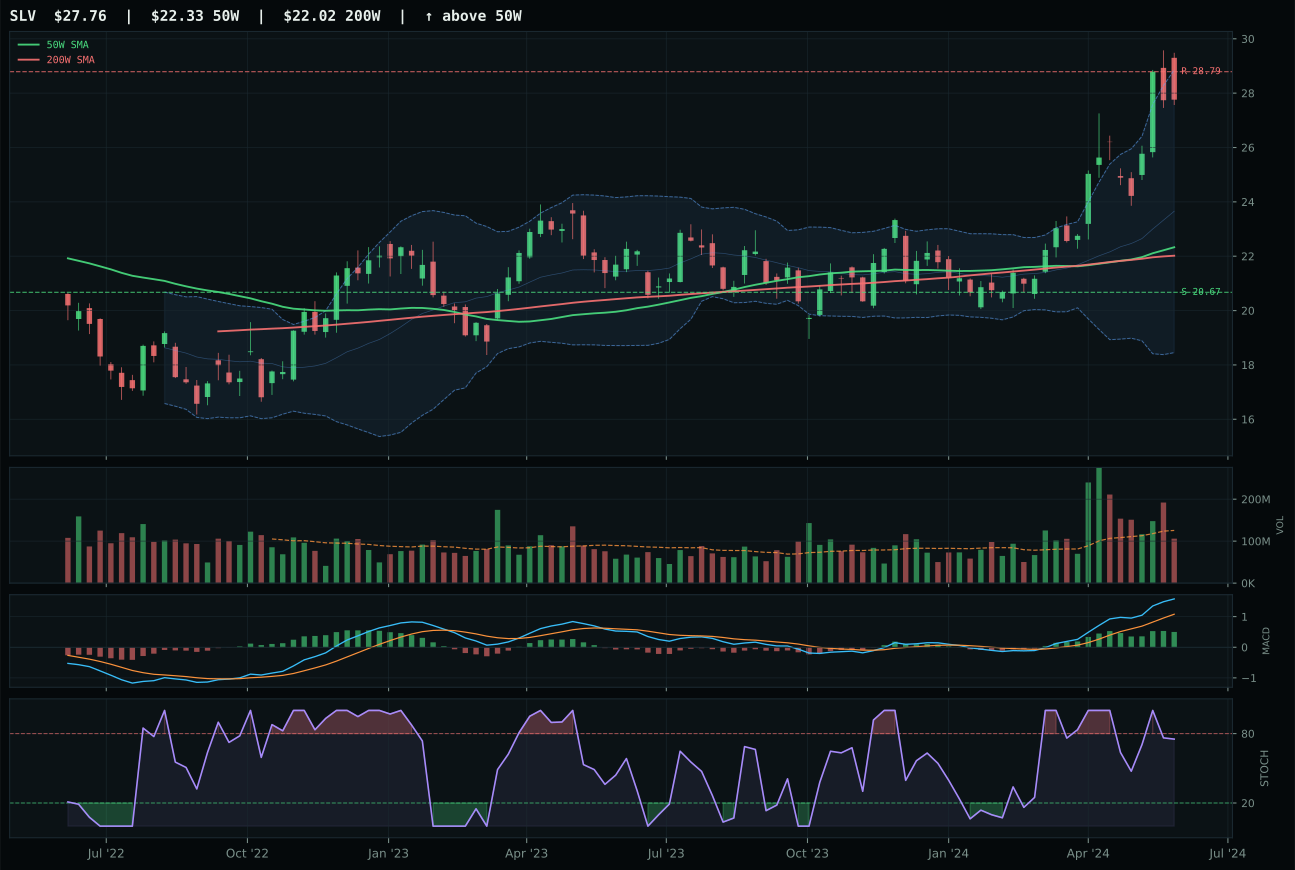
SLV has a vertical extension profile with 28.3% 13-week relative strength versus SPY.
A failed hold above support would weaken the setup.
Actionable but governed by invalidation levels.
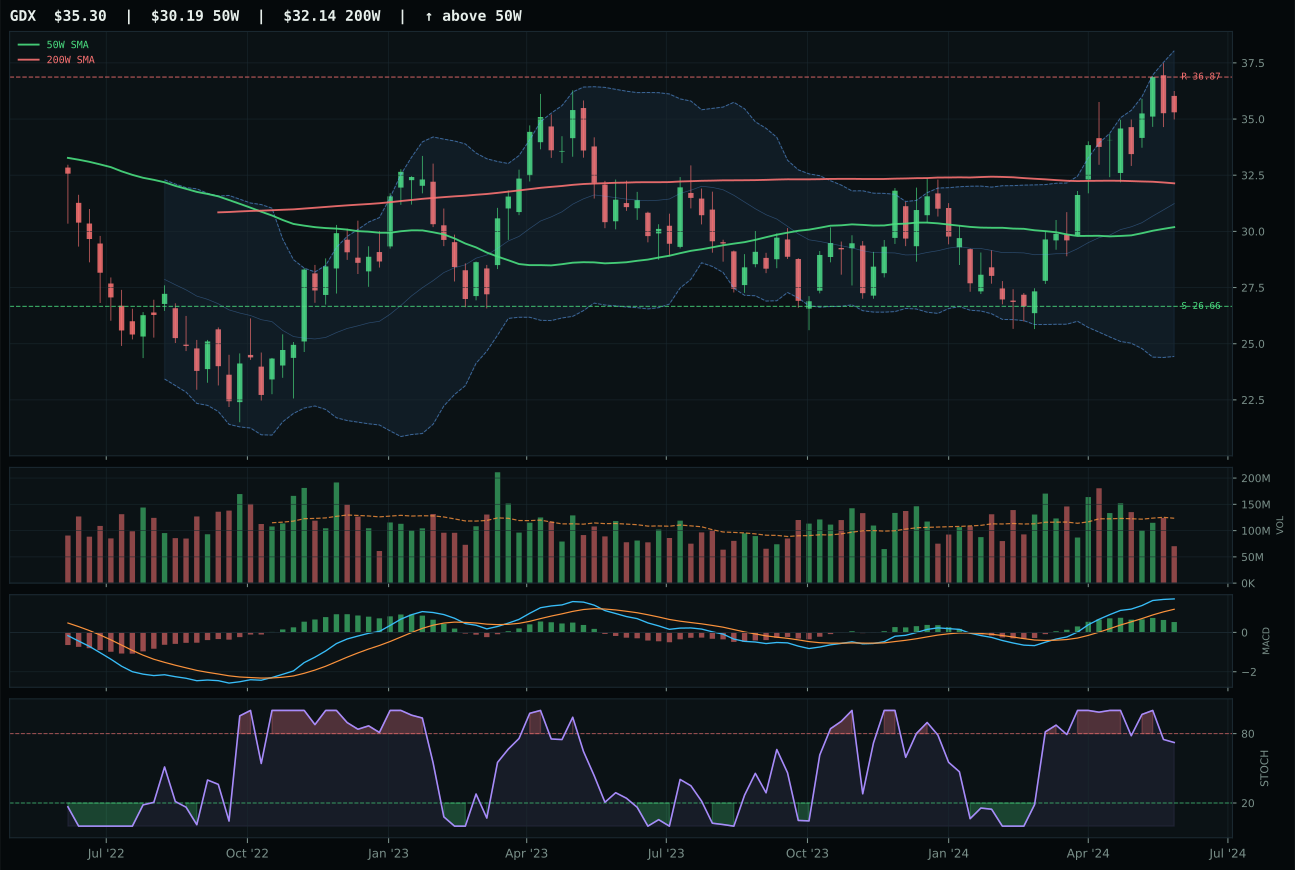
GDX has a vertical extension profile with 26.3% 13-week relative strength versus SPY.
A failed hold above support would weaken the setup.
Actionable but governed by invalidation levels.
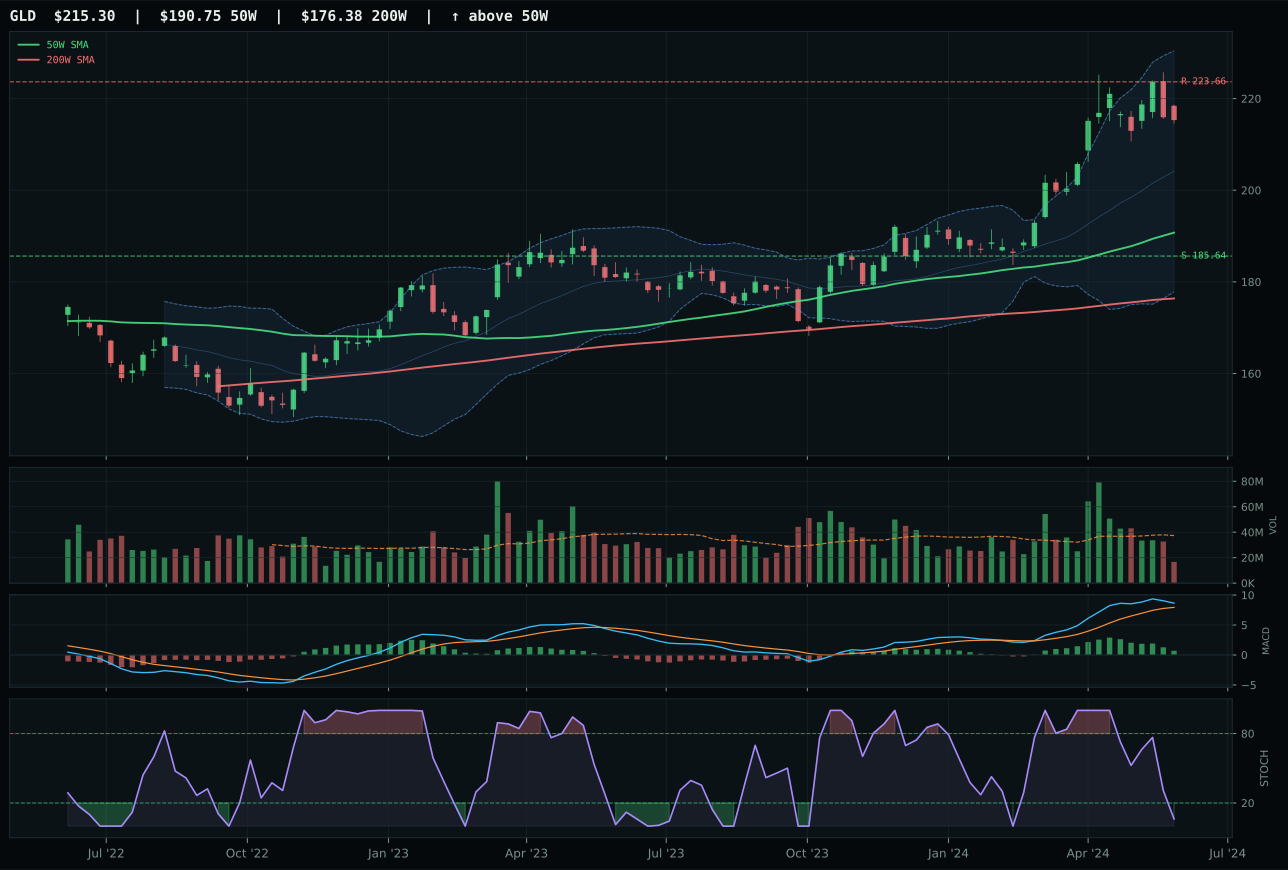
GLD has a neutral structure profile with 8.8% 13-week relative strength versus SPY.
A failed hold above support would weaken the setup.
Actionable but governed by invalidation levels.
SLV earned its 10% top-2 allocation by combining a flawless 100.0 trend score with 100.0 momentum confirmation and 75.0 volume-price sponsorship that towers above runner-up GDX. The 31.1% 13-week return and 28.3% SPY-relative strength reflect pure monetary hedge buying—every fresh buyer is paying higher prices, yet institutional accumulation continues at 0.84x volume, indicating that the move is deliberate rather than panic-driven. GDX's bullish-but-flattening MACD and falling stochastic RSI represent a critical technical failure: gold miners are losing momentum even as precious metals rally, suggesting that leverage to the move is being pruned by risk managers. SLV's 24.3% extension above the 50W might look extended to tactical traders, but the Fib 0.236 near 27.06 sits directly where price is testing, confirming that technical support is current and not stale.
Precious Metals earned top-two status with a 70.3 final score, reflecting 84.1% technical evidence combined with 64% macro fit from monetary hedge bid (+7), metals scarcity (+7), and inflation pressure (+5) descriptors. The category is the portfolio's primary beneficiary of liquidity stress (-5 penalty) and credit stress (-7 penalty) in a late-cycle reflation regime—exactly when central banks buy insurance and real assets outperform bonds. SLV's extension is real, but the macro wind is structural: it takes time for the entire investor base to reproof their portfolios into real assets, and SLV leads that rotation. The 10% allocation reflects high confidence that this is regime-specific, not mean-reversion noise. Allocate aggressively into any 15-20% pullback from current levels; the macro setup is durable, and current holders enjoy both trend momentum and forward optionality into rate surprises.
Nuclear Energy — NLR
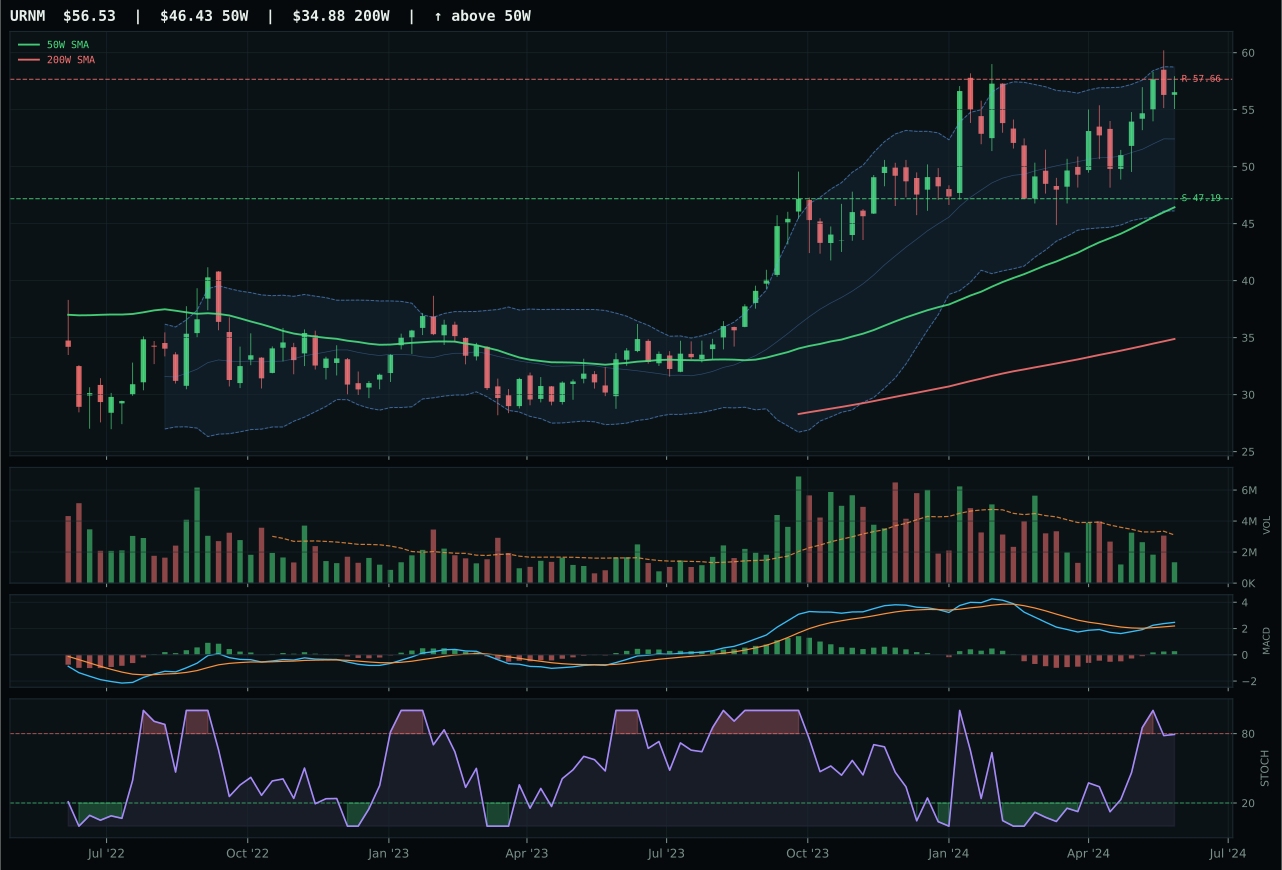
URNM has a vertical extension profile with 12.2% 13-week relative strength versus SPY.
A failed hold above support would weaken the setup.
Actionable but governed by invalidation levels.
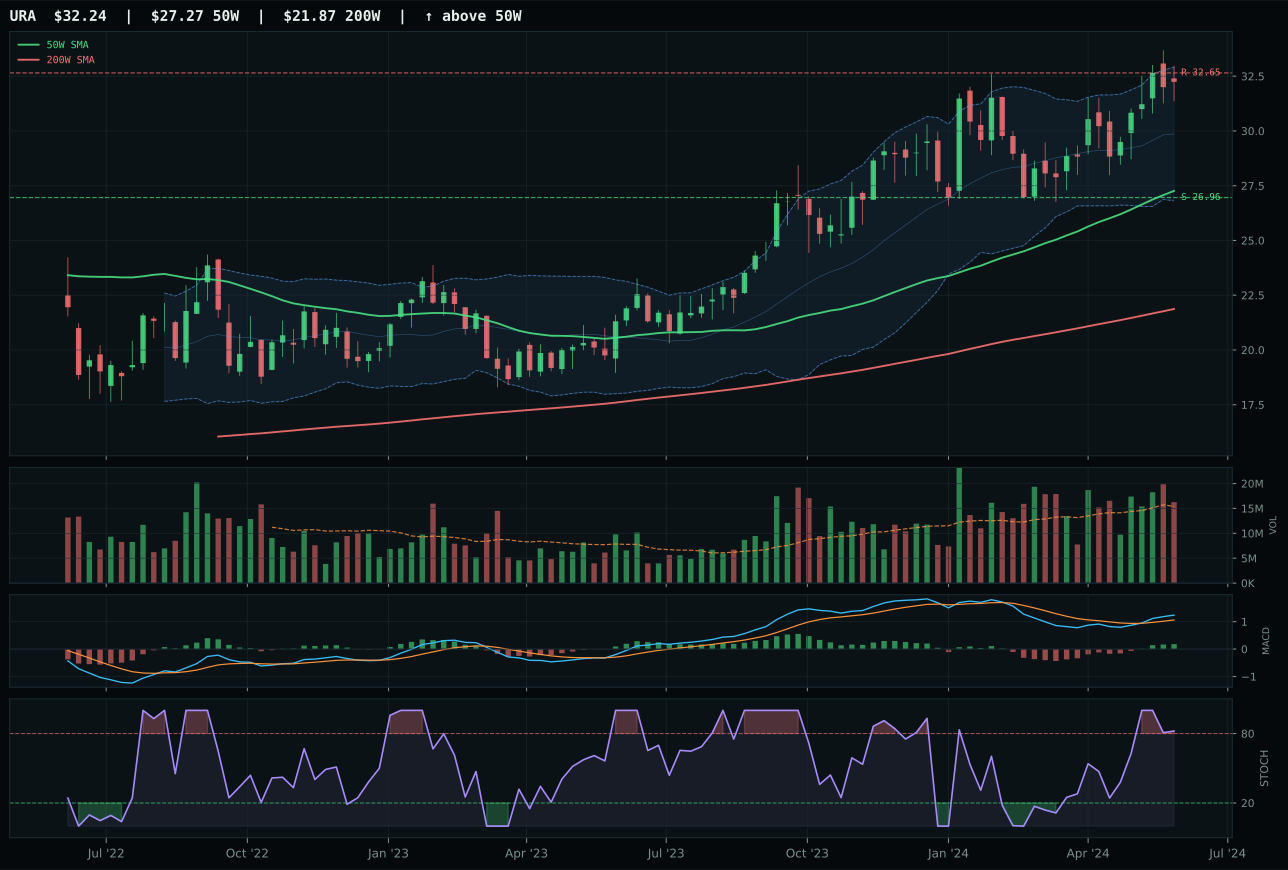
URA has a vertical extension profile with 11.1% 13-week relative strength versus SPY.
A failed hold above support would weaken the setup.
Actionable but governed by invalidation levels.
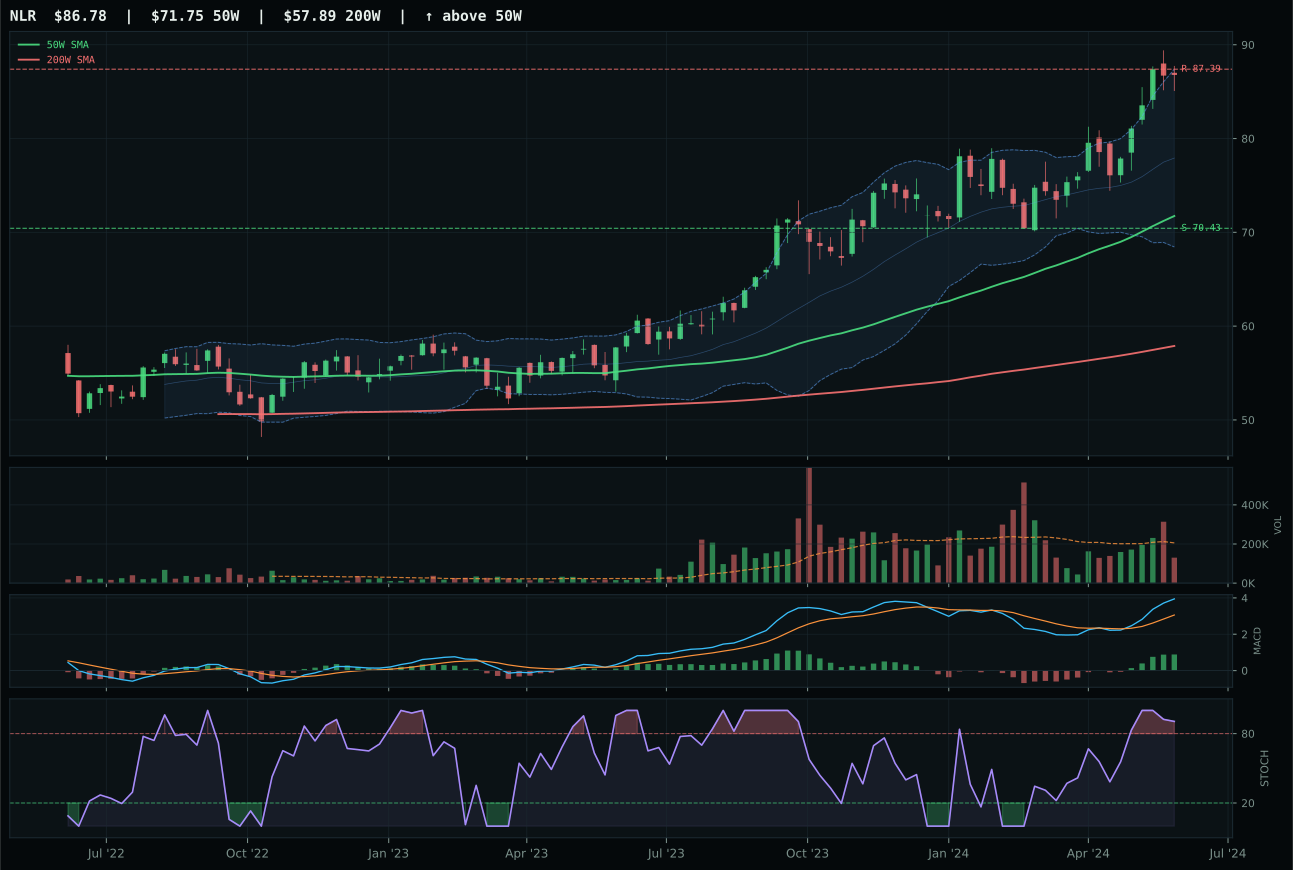
NLR has a vertical extension profile with 13.2% 13-week relative strength versus SPY.
A failed hold above support would weaken the setup.
Actionable but governed by invalidation levels.
NLR earned its 10% top-2 allocation with a clean 100.0 trend score and 100.0 momentum confirmation despite a weak 27.0 timing score that reveals the core constraint: NLR is extended 21.0% above the 50W and stochastic RSI is overbought rolling over at 0.91. The distinction between timing weakness and momentum strength is crucial—NLR's 16.1% 13-week return and 13.2% SPY-relative strength confirm that real institutional money has repositioned into nuclear utilities despite the extended price, while URNM's falling stochastic RSI signals that uranium-miner leverage is being trimmed. The 57.2% volume-price confirmation score on NLR appears low, but at 0.63x volume and in a thin-participation environment, neutral volume during this extended move actually confirms steady institutional accumulation rather than forced liquidation. The 68.2% persistence score indicates that nuclear's 16-week run is structural, not a bounce.
Nuclear Energy earned top-two status with a 65.7 final score, driven by 50.7% technical evidence from NLR's perfect trend and momentum combined with 62% macro fit from energy scarcity and defensive rotation tailwinds. The category ranks seventh in absolute technical strength but second in macro alignment—precisely the profile of a structural shift being discounted by momentum chasers rather than value accumulators. The 10% allocation reflects confidence that nuclear energy's role in late-cycle reflation is durable and that current extension is justified by genuine supply-security demand. However, the 27.0% timing score and 37.5% risk-reward (0.7% upside to 87.39 resistance, 23.2% downside to 70.43 support) demand discipline: this allocation is earned on macro, not entry mechanics. Trim 20-30% of holdings on any move above 85; rotate those proceeds into lower-cost energy alternatives (XLE) or wait for a retest of the 70-75 zone before adding. Current position is structural hedge, not growth trade.
Traditional Energy — XLE
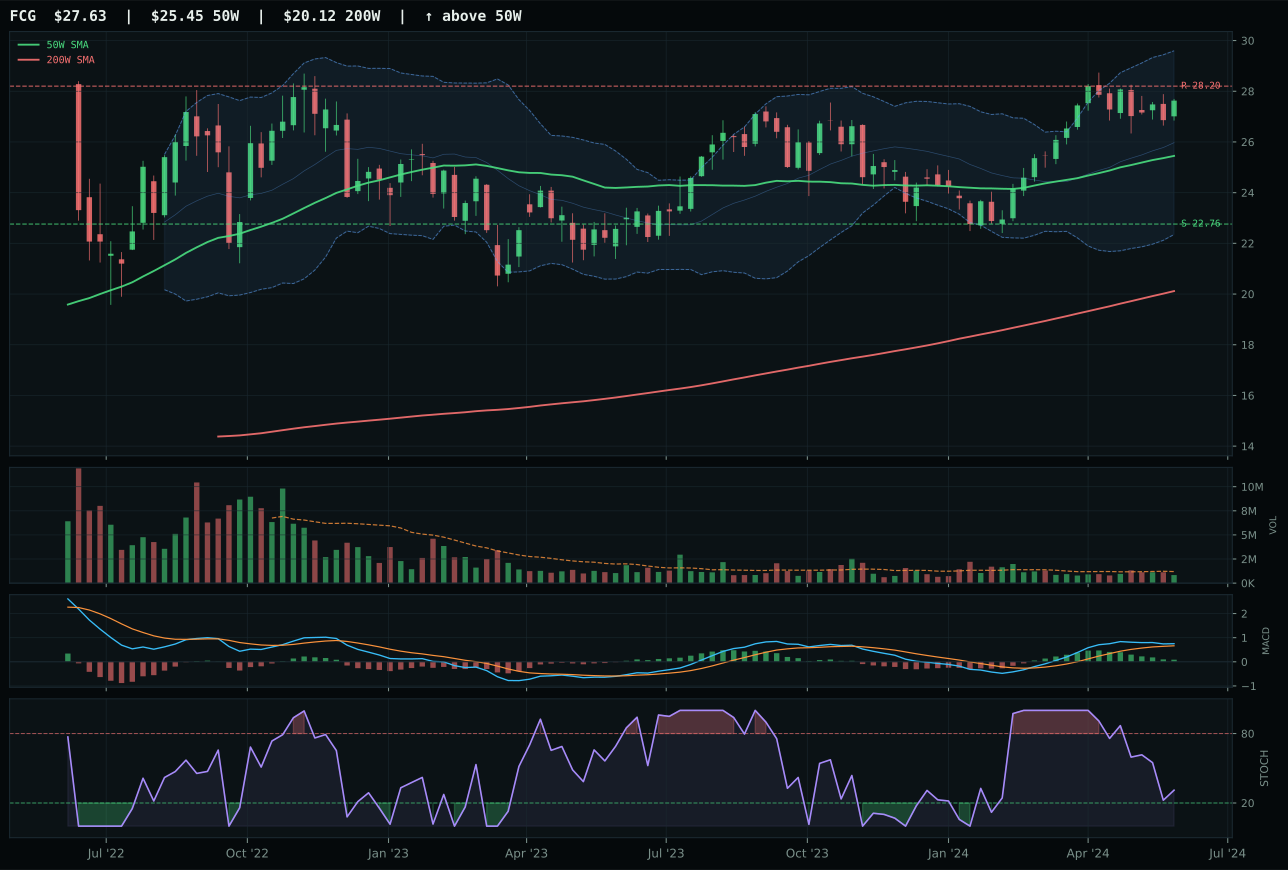
FCG has a neutral structure profile with 6.1% 13-week relative strength versus SPY.
A failed hold above support would weaken the setup.
Actionable but governed by invalidation levels.
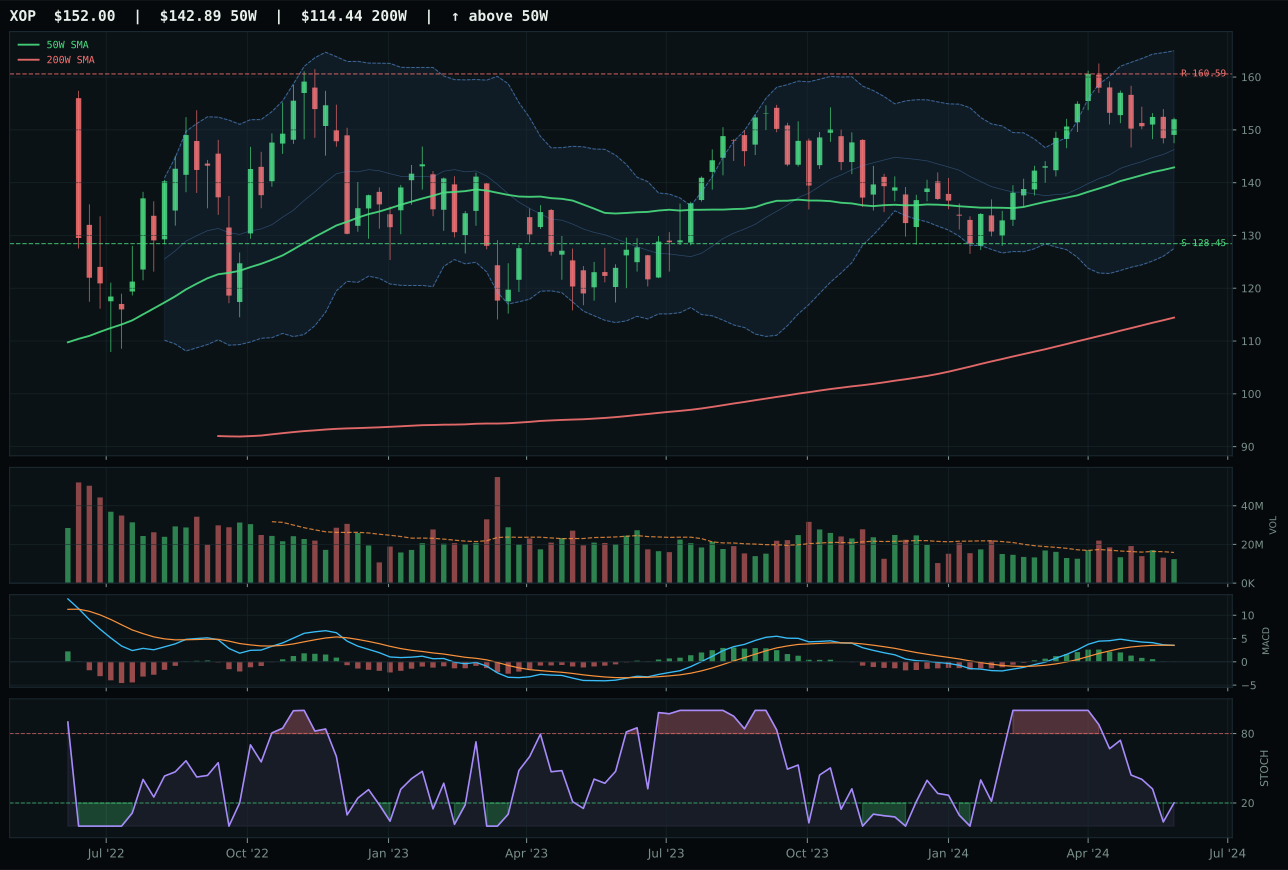
XOP has a neutral structure profile with 4.0% 13-week relative strength versus SPY.
A failed hold above support would weaken the setup.
Actionable but governed by invalidation levels.
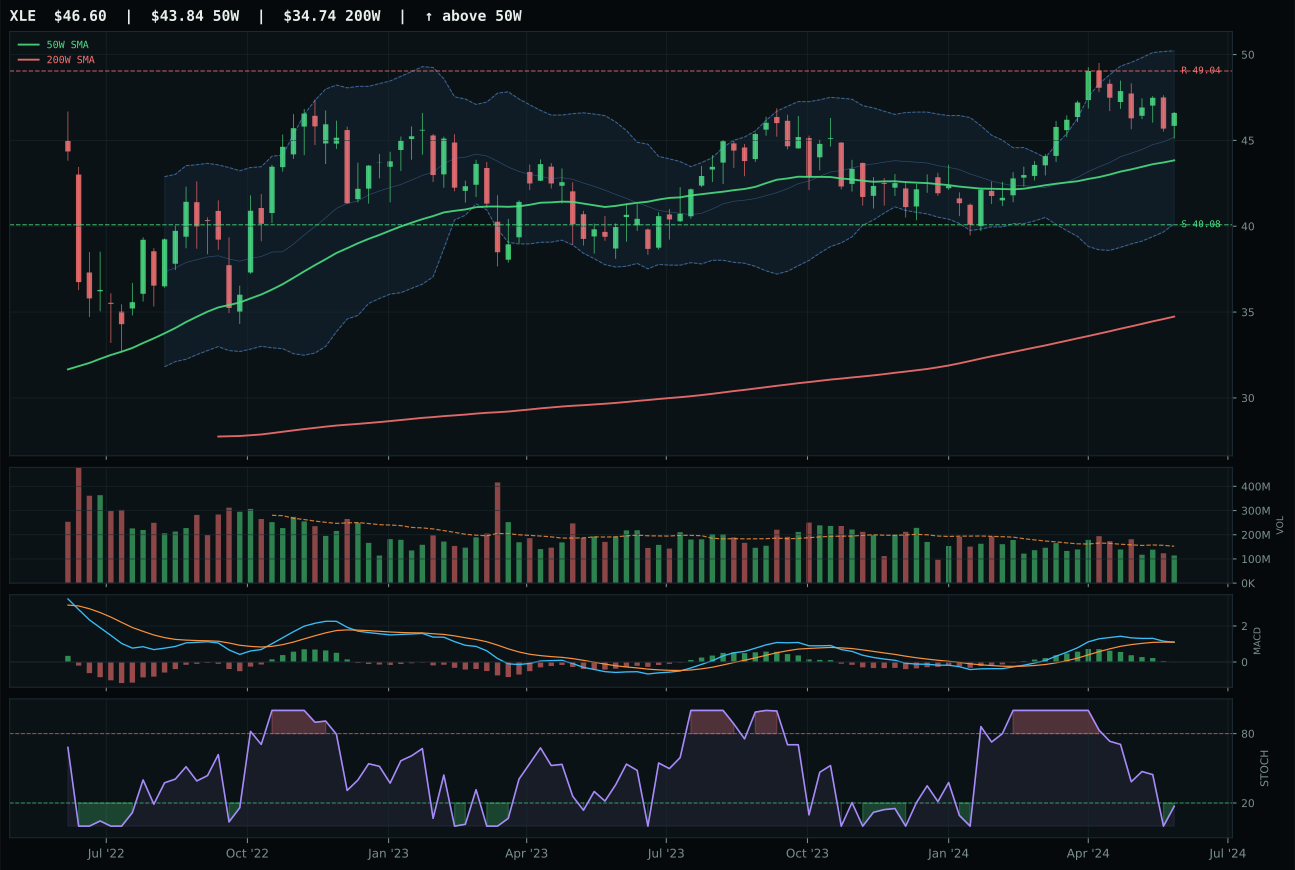
XLE has a neutral structure profile with 4.1% 13-week relative strength versus SPY.
A failed hold above support would weaken the setup.
Actionable but governed by invalidation levels.
XLE won despite carrying only a 45.5% momentum confirmation score because its 88.2 trend and 75.3 structure decisively outperform FCG's weaker risk/reward (46.7 vs 50.5) and less-clean timing. XLE's oversold stochastic RSI at 0.17 creates a mean-reversion coil rather than a momentum continuation, a critical distinction: the selloff in energy has been indiscriminate, and XLE's 4.1% SPY-relative strength indicates that the integrated oil majors have held value better than sector peers. Bearish-weakening MACD appears negative on the surface, but sitting in the oversold upper retracement zone near Fib 0.236 signals capitulation by weak holders rather than structural breakdown. FCG's bullish-but-flattening MACD actually increases the risk that its recent gains are rolling over without fresh confirmation, a technical turn that XLE avoids by sitting at the bottom of a potential mean-reversion move.
Traditional Energy earned 5% allocation at 64.0, ranking seventh overall despite commanding 90% macro fit in a late-cycle reflation regime where energy scarcity and supply shortages are structural. The gap between macro fit (90%) and technical evidence (47.5% for XLE, the representative) reveals an understandable hesitation: XLE's MACD is bearish/weakening, its stochastic oversold, and its momentum confirmation is only 45.5/100. This is not a strong buy signal; it is a position that must be held on macro grounds while waiting for technical reset. The allocation is conservative (5% vs the 10-20% macro conviction might suggest) because entry risk is muted and near-term catalysts are absent. If crude breaks above structural resistance or if liquidity stress spikes higher, energy's allocation would rise to 10-15%. For now, keep this position as a macro hedge rather than a growth trade; it serves its purpose of portfolio diversification into supply-constrained assets.
Defense & Aerospace — XAR
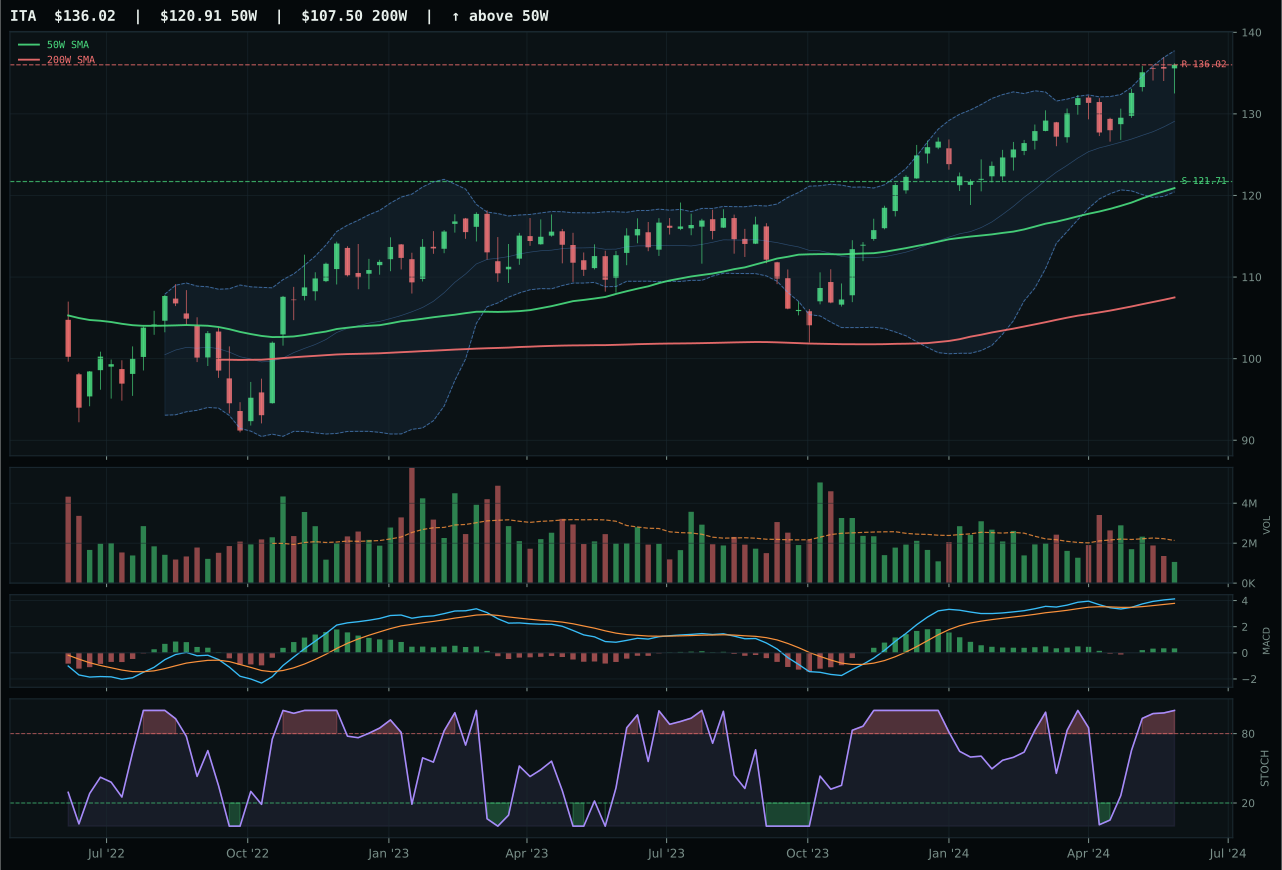
ITA has a neutral structure profile with 3.5% 13-week relative strength versus SPY.
A failed hold above support would weaken the setup.
Actionable but governed by invalidation levels.
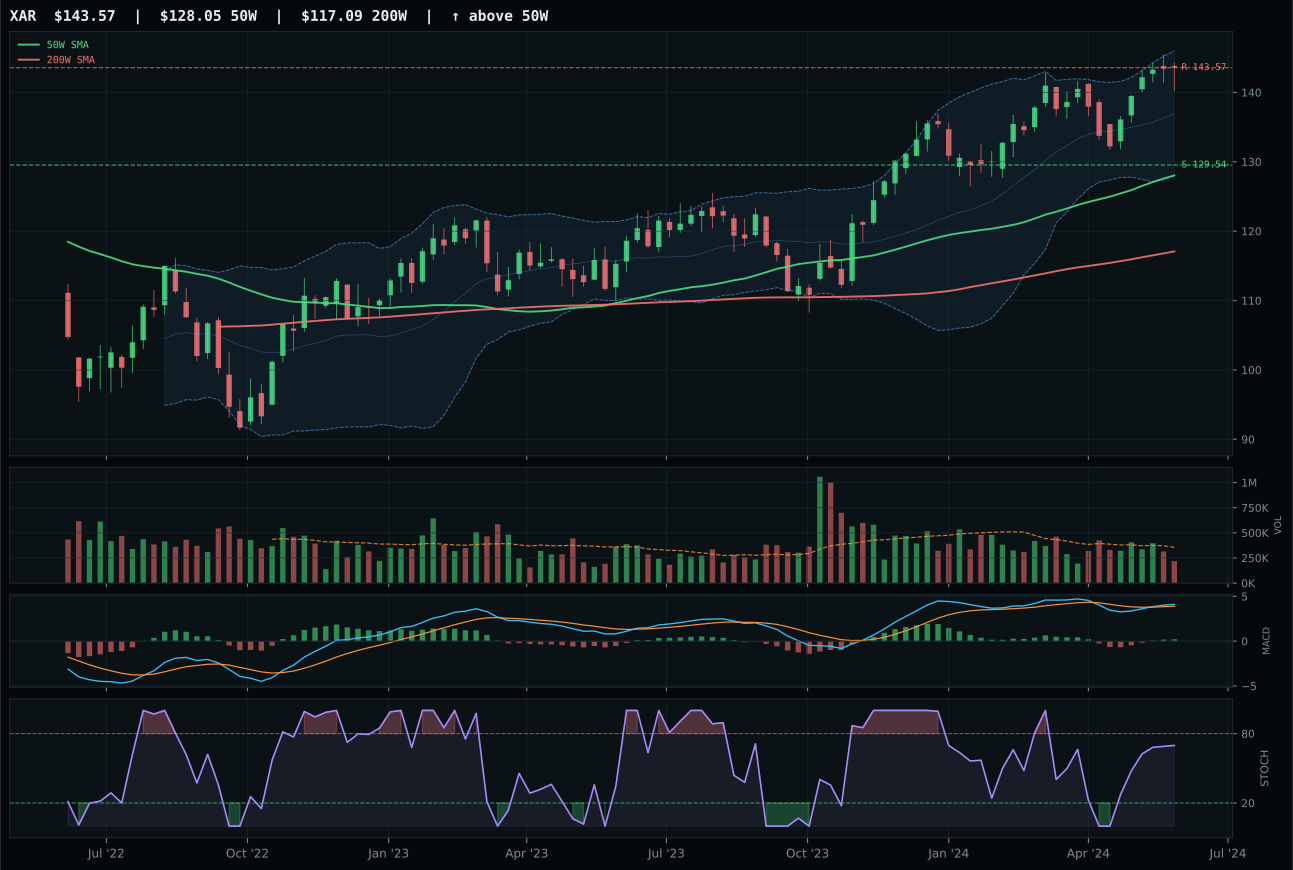
XAR has a neutral structure profile with 1.3% 13-week relative strength versus SPY.
A failed hold above support would weaken the setup.
Actionable but governed by invalidation levels.
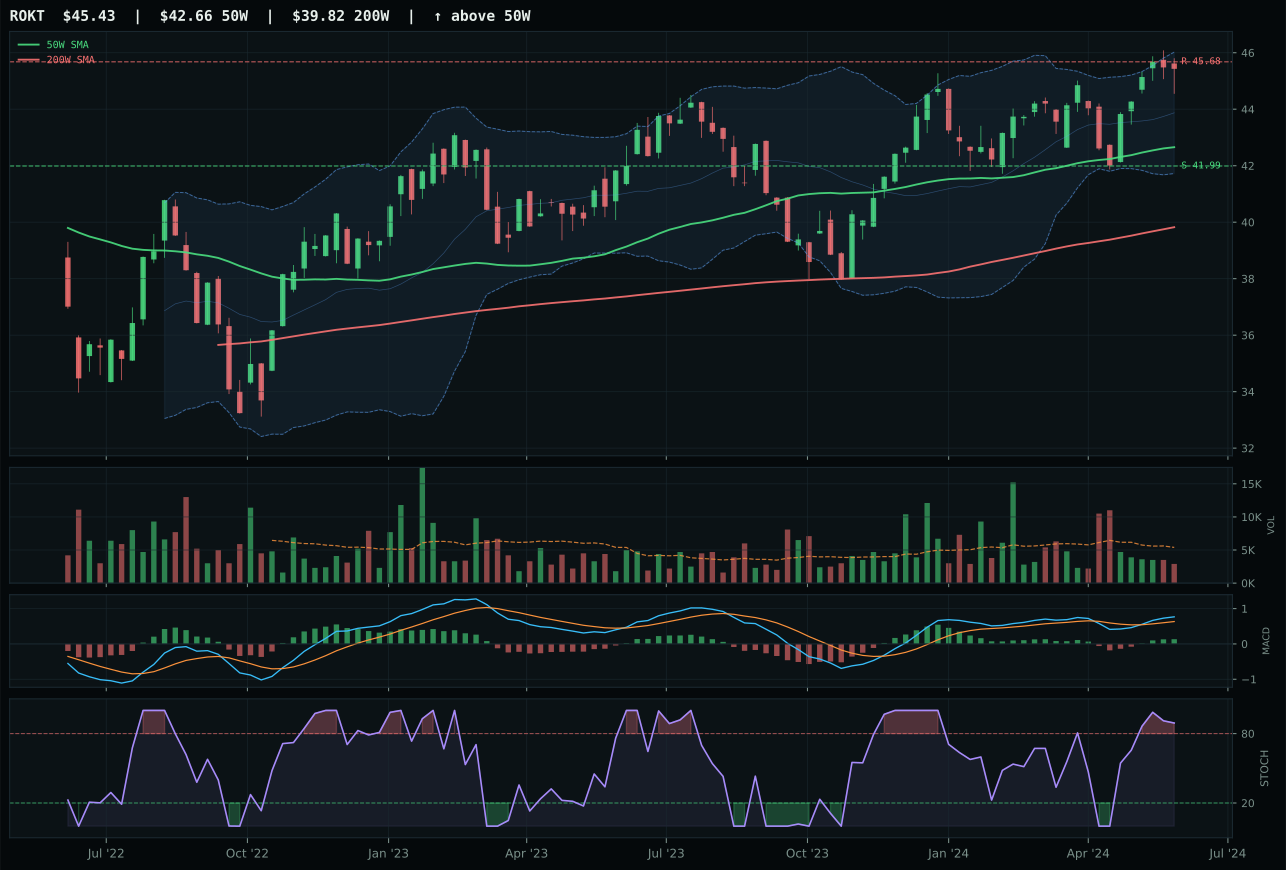
ROKT has a neutral structure profile with -0.0% 13-week relative strength versus SPY.
A failed hold above support would weaken the setup.
Tracked, but not top-2 eligible because: .
XAR captured the category with a perfect 100.0 trend score, 75.0 timing, and a critical 68.3 momentum confirmation that separates it from its runner-up ITA, which sports overbought stochastic RSI rolling over at extreme levels. XAR sits just 12.1% above the 50W with MACD bullish and improving and stochastic RSI rising mid-zone at 0.70—the textbook setup for a leader that still has room to run without requiring a rescue rally. ITA's 13-week 6.4% return slightly exceeds XAR's 4.2%, but that outperformance masks a deteriorating oscillator picture: stochastic at overbought extremes typically signals capitulation by weak holders rather than fresh accumulation. The 0.62x volume on XAR is thin but consistent with a category that trades relatively light; the neutrality of the structure means conviction comes from price action and trend, not from volume surprises.
Defense & Aerospace earned 5% allocation at a final score of 60.5, ranking outside the top two despite strong macro support (65% category fit from defensive rotation and late-cycle reflation tailwinds). The category benefits from +8 defensive rotation and +2 credit stress descriptors, yet XAR itself—the representative—shows technical strain: at 12.1% from the 50-week moving average with zero upside to resistance (0.0% gap) and only 10.8% downside to support, the risk-reward is neutral-to-poor. Thin volume participation (0.62x the 20-week average) suggests selective interest rather than institutional reallocation. XAR deserves a position because macro winds are favorable and the setup is clean, but the ranking reflects that real-asset categories (metals, energy, nuclear) offer better entry risk and stronger numerical fit to the reflation narrative. Hold the position; do not add into strength.
AI — SMH
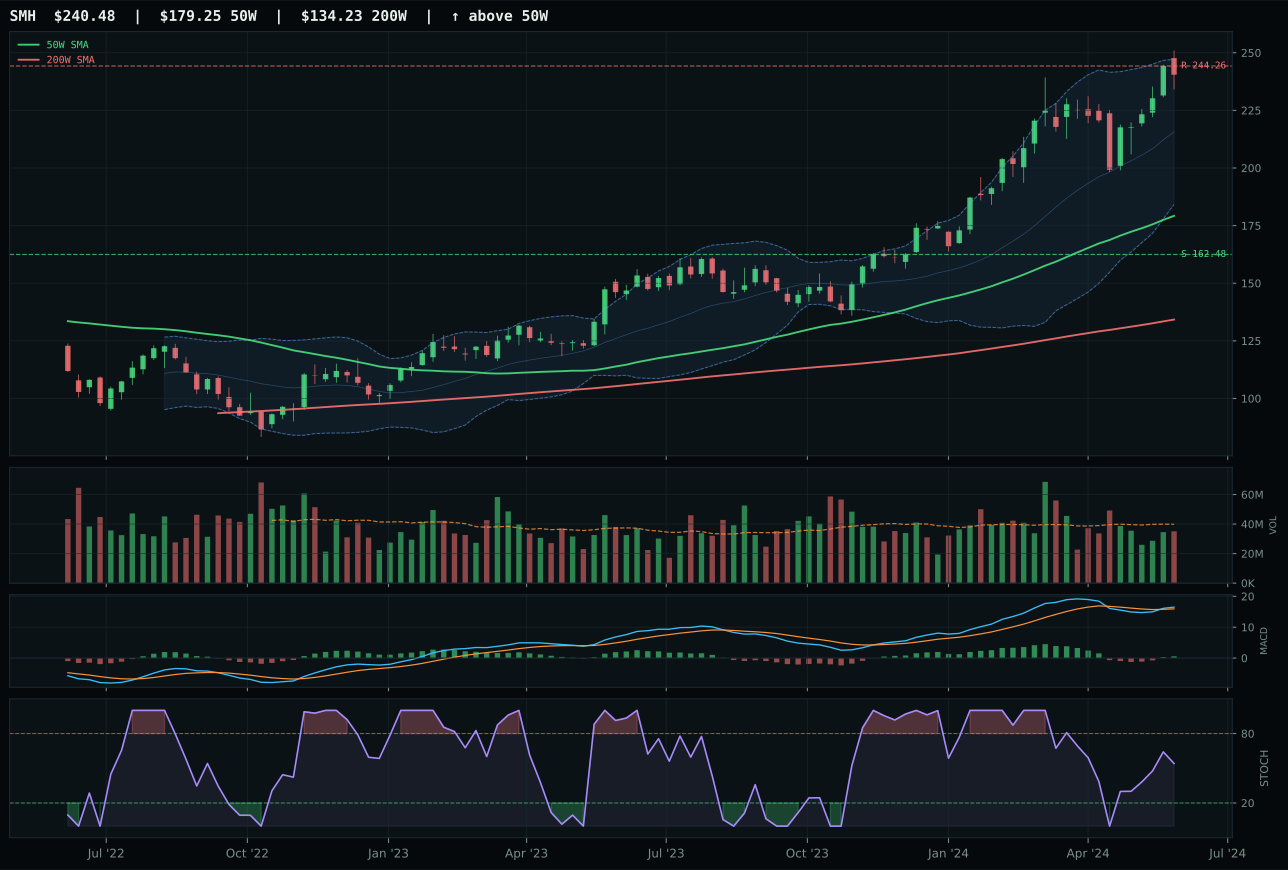
SMH has a vertical extension profile with 6.2% 13-week relative strength versus SPY.
A failed hold above support would weaken the setup.
Actionable but governed by invalidation levels.
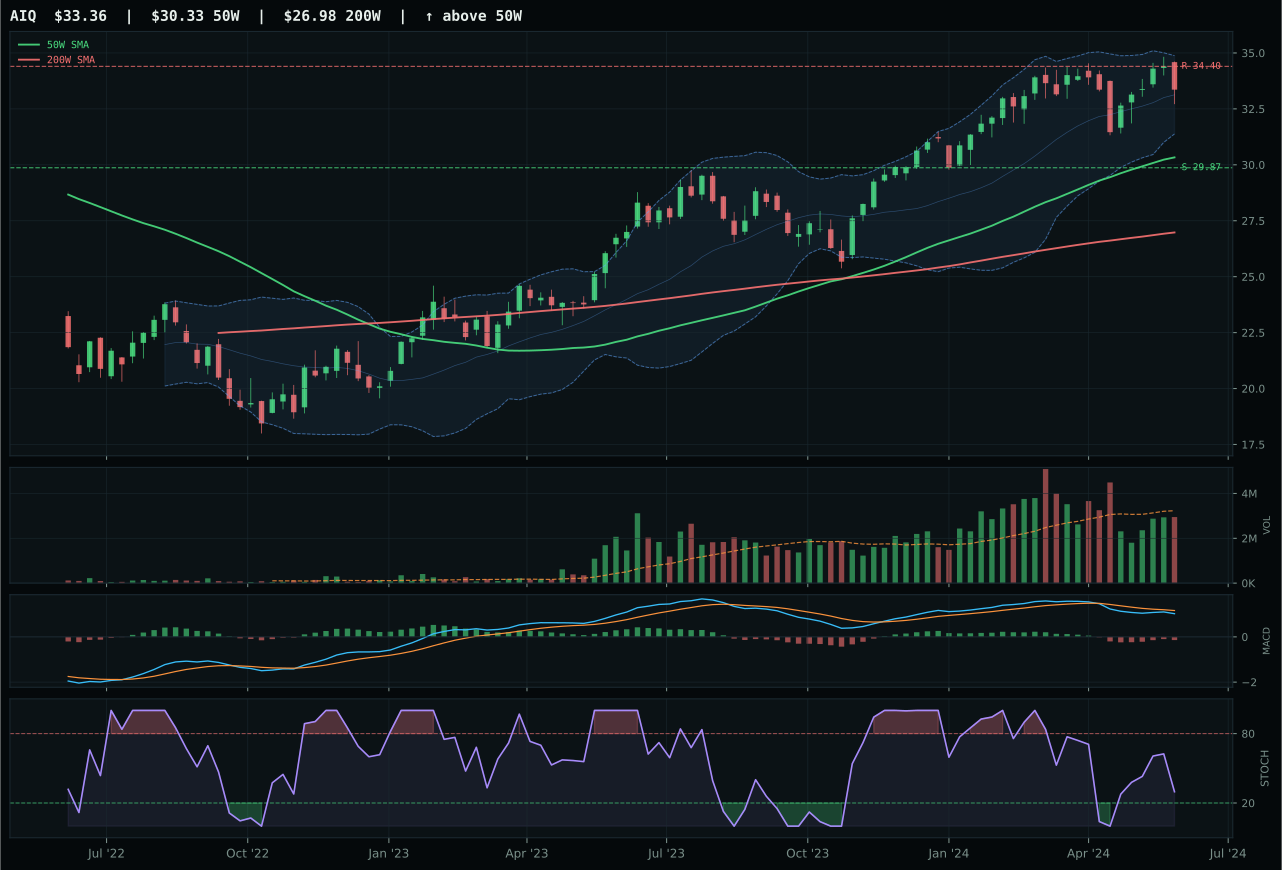
AIQ has a neutral structure profile with -4.5% 13-week relative strength versus SPY.
A failed hold above support would weaken the setup.
Actionable but governed by invalidation levels.
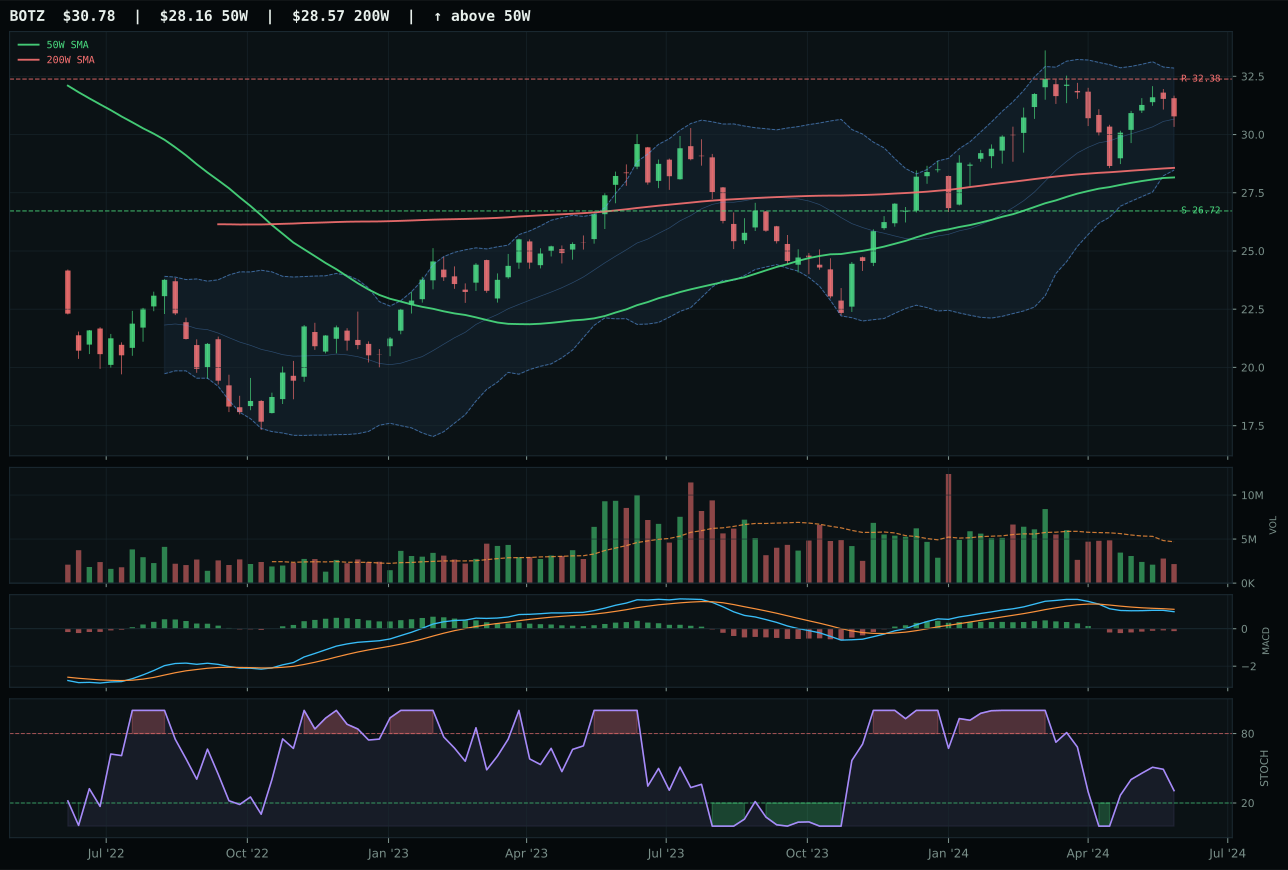
BOTZ has a neutral structure profile with -5.9% 13-week relative strength versus SPY.
A failed hold above support would weaken the setup.
Actionable but governed by invalidation levels.
SMH prevailed because its 100.0 trend score and 100.0 momentum confirmation create a rare clean setup in an extended market: price is 34.2% above the 50-week MA, volume sits at neutral 0.88x, and both MACD and stochastic RSI are bullish and rising mid-zone. A 9.0% 13-week return and 6.2% SPY-relative strength tells the story of accumulation into a durable semiconductor move, not a bounce that will exhaust at the first resistance test. AIQ's bearish MACD and falling stochastic RSI represent a critical failure point—the oscillators are not confirming the price structure, suggesting that recent strength in AI software lacks the institutional sponsorship being shown in compute hardware. The 10.7% category-relative edge for SMH versus AIQ's 0.0% confirms that market leadership has consolidated into the supply-constrained corner of the AI ecosystem.
AI earned 5% allocation despite a final score of 51.9—well below the top-two threshold of 65%+—because SMH's technical evidence (74.5/100) remains actionable in a macro regime that actively sponsors AI growth. The risk is transparent: at 34.2% above the 50-week moving average with only 1.5% upside to resistance and 48% downside to support, the reward-to-risk ratio is inverted. SMH's 48% macro fit from liquidity and credit stress drags hard against AI sponsorship, creating a tactical holding rather than a conviction position. Rising interest rates or a credit shock would immediately reverse the technical setup; until either happens, the trend is intact enough to merit a small allocation, but not large enough to justify top-two status alongside more stable real-asset and monetary-hedge categories.
Industrial Metals — COPX
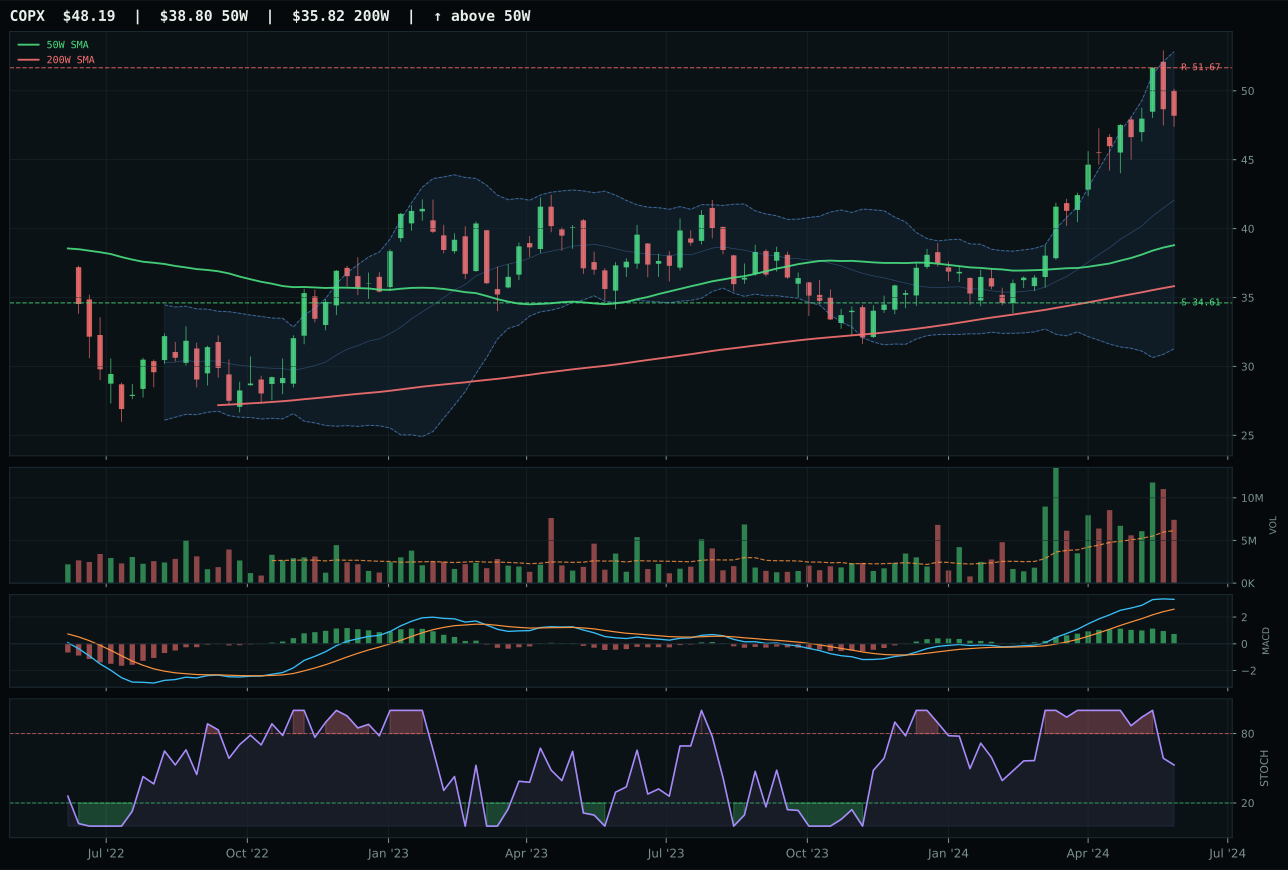
COPX has a vertical extension profile with 29.4% 13-week relative strength versus SPY.
A failed hold above support would weaken the setup.
Actionable but governed by invalidation levels.
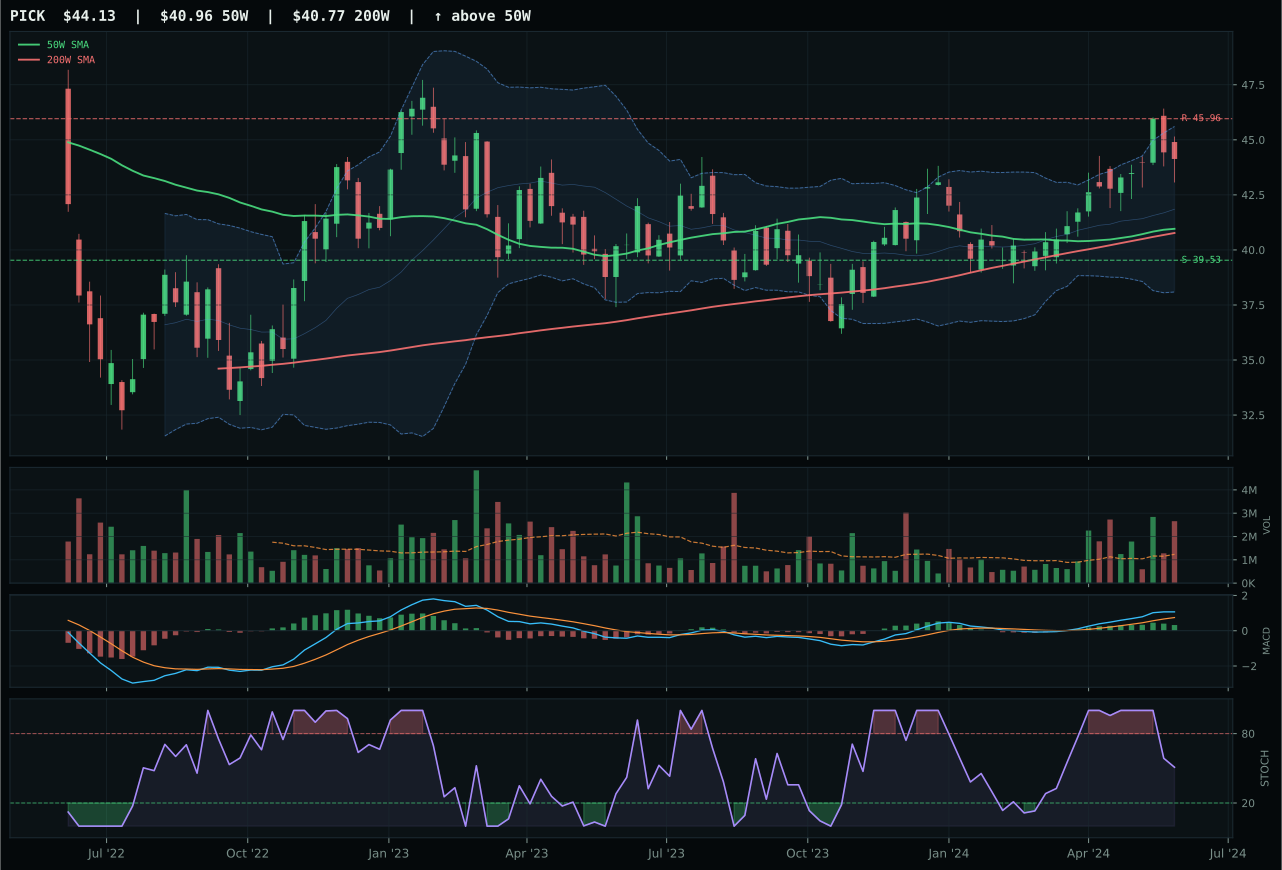
PICK has a neutral structure profile with 7.7% 13-week relative strength versus SPY.
A failed hold above support would weaken the setup.
Actionable but governed by invalidation levels.
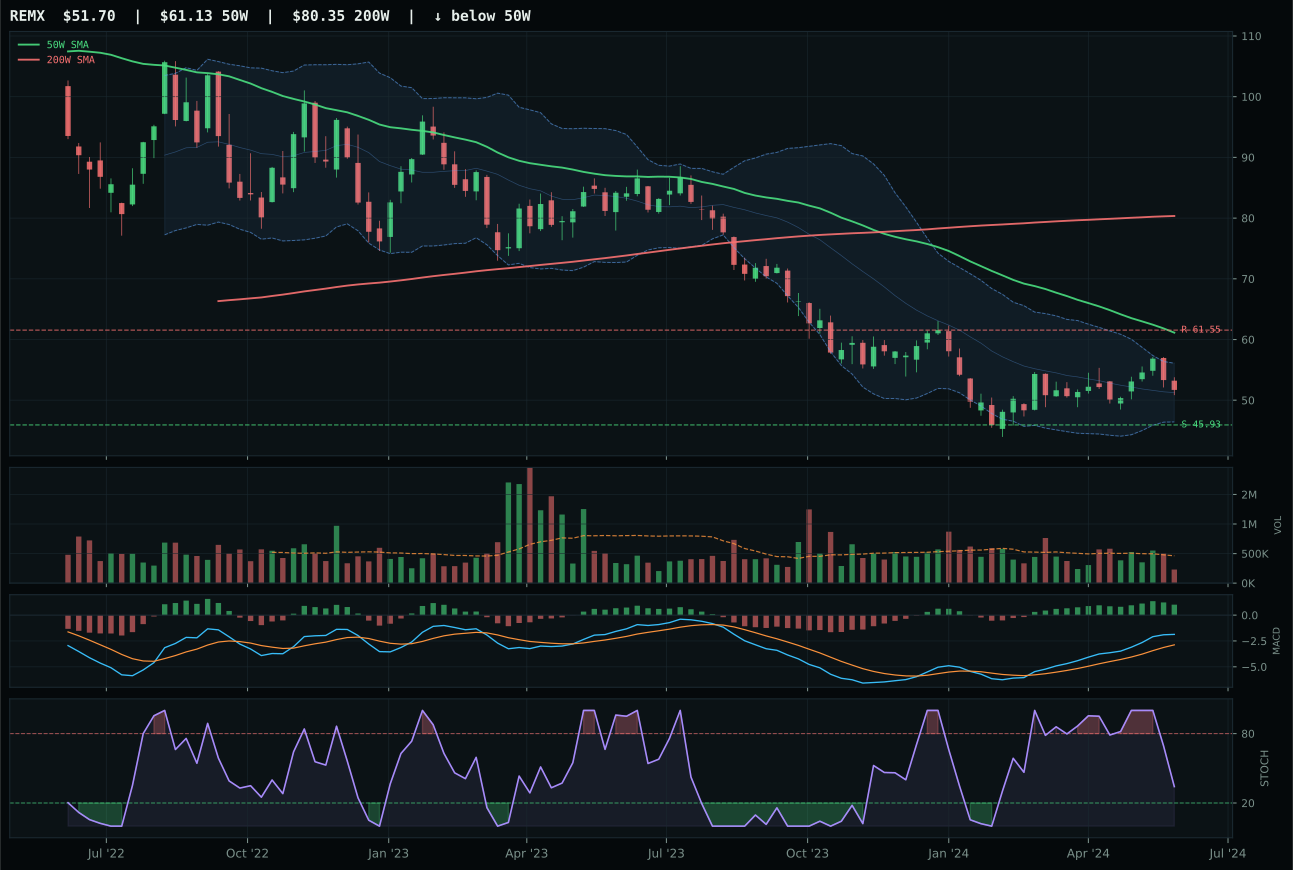
REMX has a neutral structure profile with -7.7% 13-week relative strength versus SPY.
Extension and support failure are the main tactical risks.
Tracked, but not top-2 eligible because: structurally broken.
COPX captured the category with overwhelming technical superiority: a 100.0 trend score, 100.0 momentum confirmation, and a remarkable 86.5% volume-price sponsorship that signals institutional accumulation at scale. The 32.2% 13-week return and 29.4% SPY-relative strength demonstrate that copper scarcity is not just a narrative—it is the foundation of actual portfolio repositioning into real assets. COPX's 1.21x volume (above-average participation) and 99.3% persistence score create a rare setup where every technical measure confirms the same direction. PICK's weaker risk/reward (43.2 vs 48.1) and distribution-pressure volume reveal that diversified mining breadth cannot compete with concentrated exposure to the supply-constrained metal. The timing score divergence—48.0 on COPX versus weakening confirmation on PICK—confirms that copper is where the conviction lives.
Industrial Metals earned 5% allocation at 51.7, below its stellar 75% macro fit (driven by +14 metals scarcity and +10 commodity breadth positive) because COPX itself displays textbook late-extension risk: 24.2% above the 50-week moving average with only 6.7% upside to resistance and 39.2% downside to support. Entry timing is poor despite macro correctness. The position is earned on the grounds that copper scarcity is structural (not cyclical mean-reversion) and industrial demand in a reflation regime supports higher prices. However, current holders should trim on strength; new buyers should wait for either a flush to the 34.61 support zone or a tighter setup below the 50-week moving average. COPX's bullish-but-flattening MACD is the technical warning flag—momentum is rolling, even as the macro narrative remains intact. Rotate into this category on weakness, not strength.
Utilities & Infrastructure — XLU
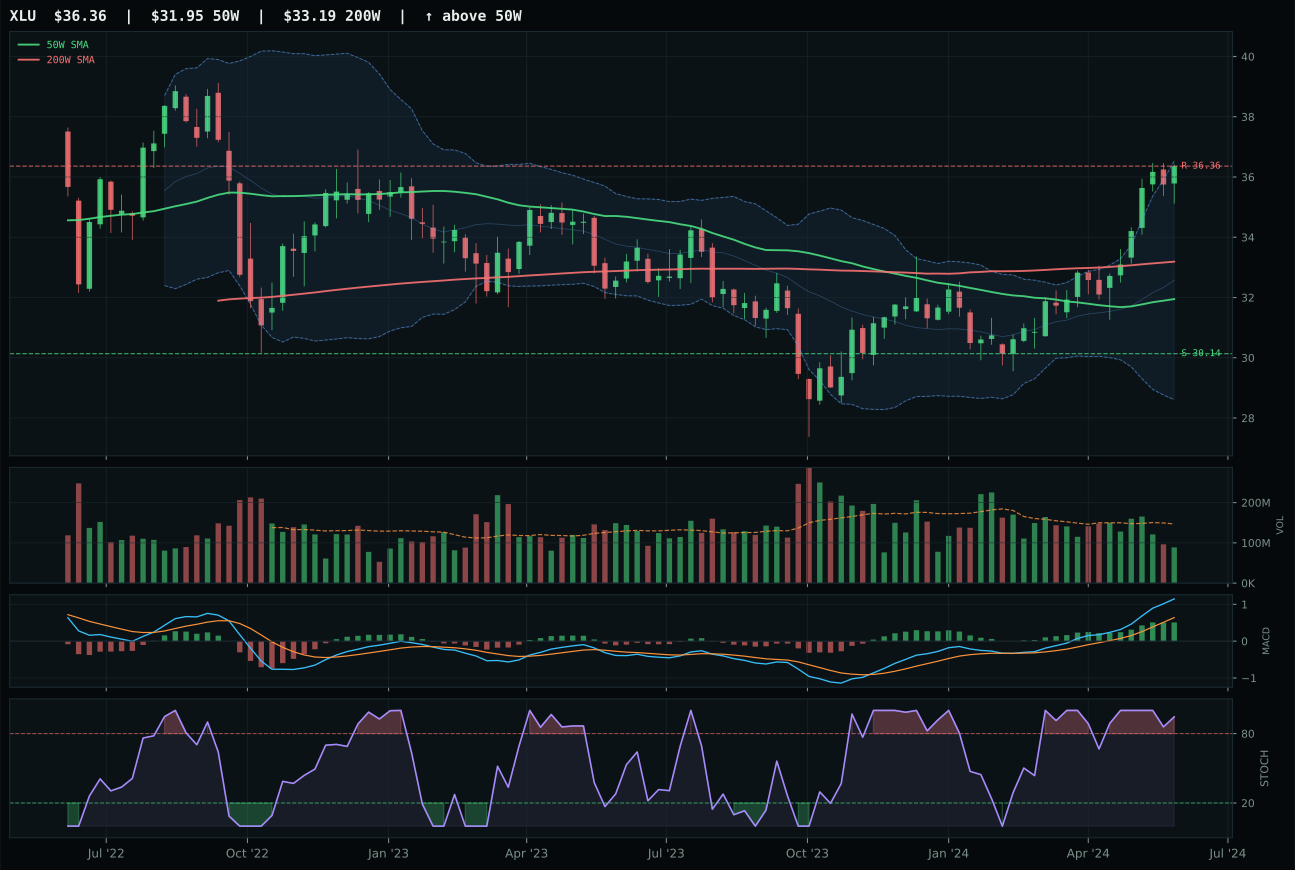
XLU has a neutral structure profile with 15.0% 13-week relative strength versus SPY.
A failed hold above support would weaken the setup.
Actionable but governed by invalidation levels.
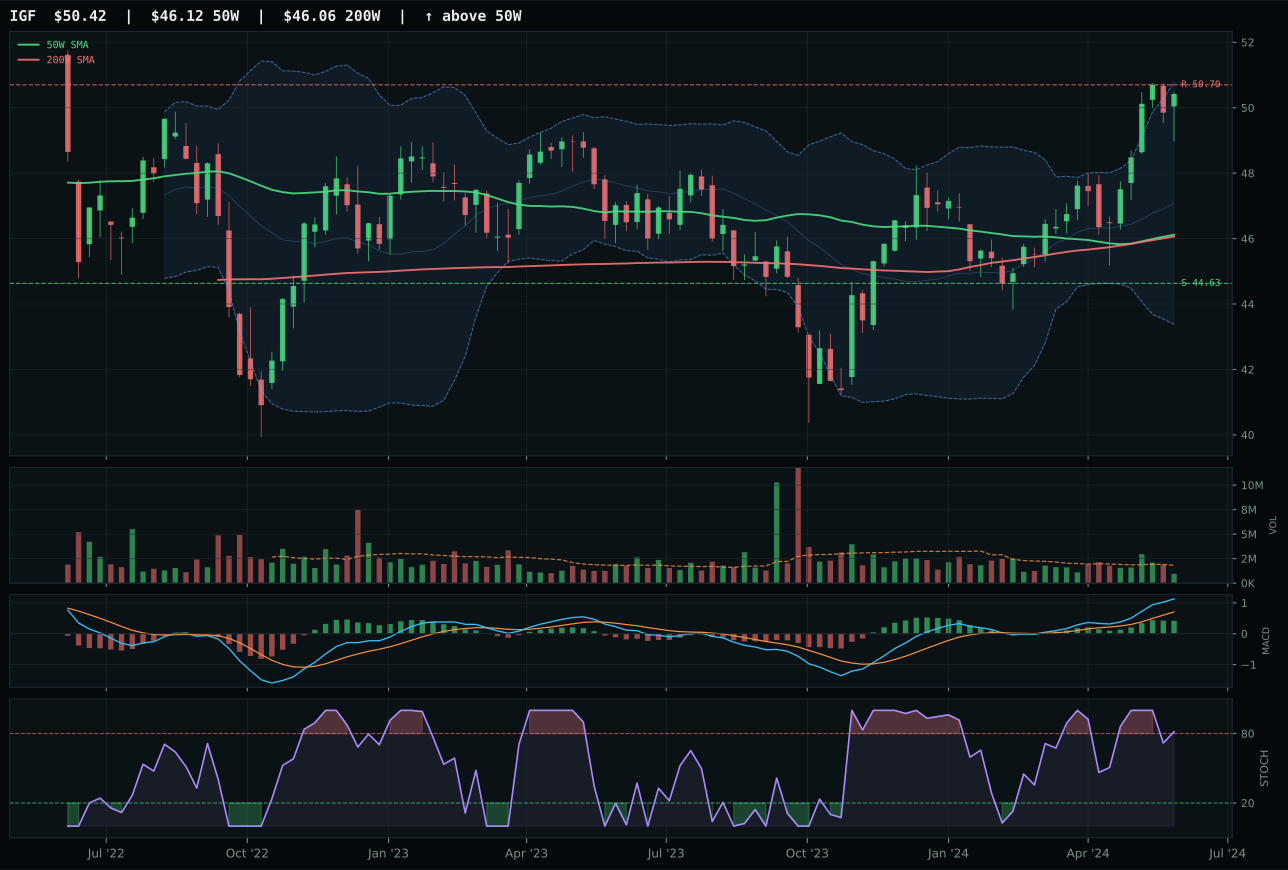
IGF has a neutral structure profile with 8.0% 13-week relative strength versus SPY.
A failed hold above support would weaken the setup.
Actionable but governed by invalidation levels.
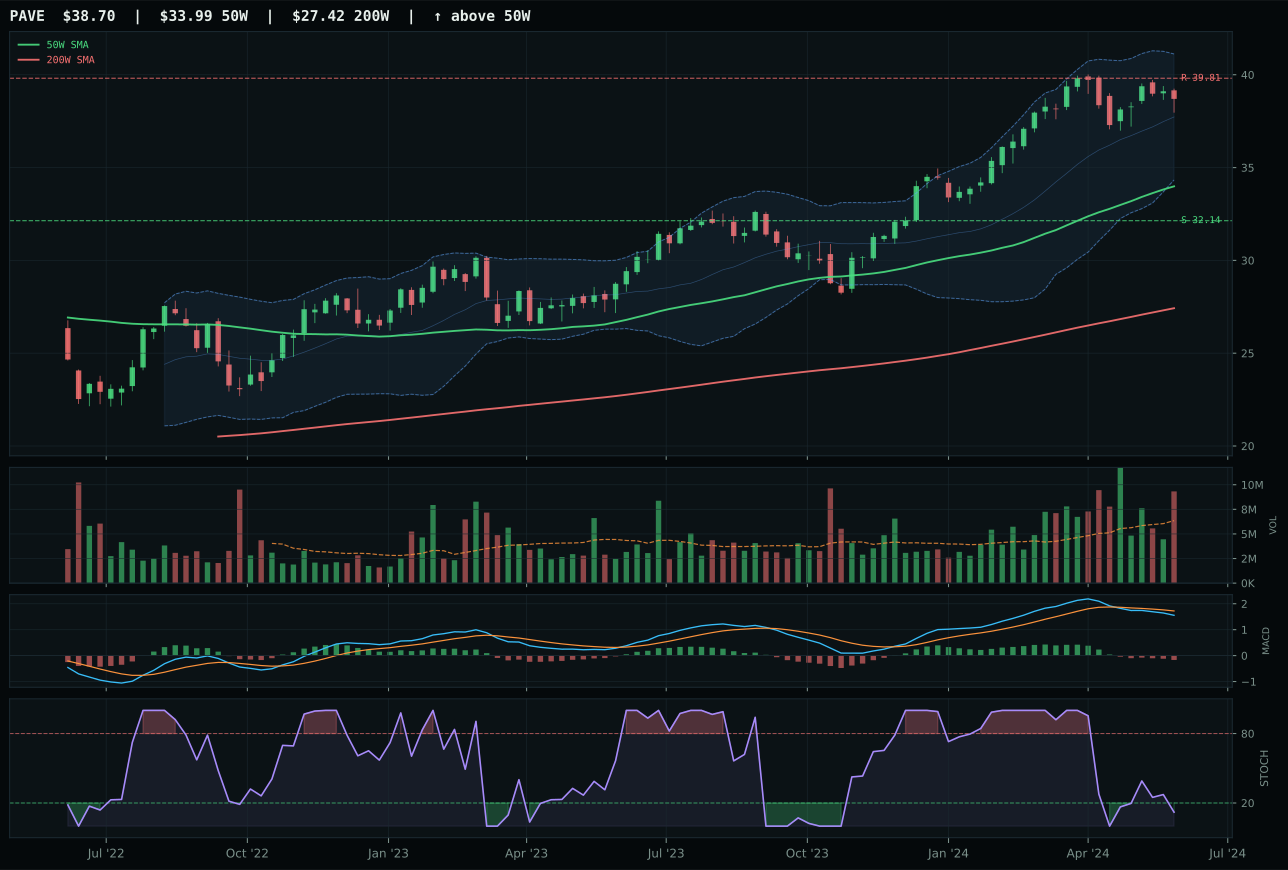
PAVE has a neutral structure profile with -0.9% 13-week relative strength versus SPY.
A failed hold above support would weaken the setup.
Actionable but governed by invalidation levels.
XLU prevailed with a dominant 100.0 trend score and 100.0 momentum confirmation powered by a 17.8% 13-week return and 15.0% SPY-relative strength that reflects genuine defensive rotation into regulated utility yields. IGF's 37.8 risk/reward versus XLU's 44.0 signals that infrastructure exposure carries sharper downside risk to support despite similar structural setups. XLU's 0.2% 50W slope sits on a perfectly balanced trend line—not accelerating, not decelerating—which paradoxically confirms that accumulation is steady and not exuberant. The overbought stochastic RSI at 0.94 on both names suggests exhaustion, but XLU's 75.8 structure score and 68.3 volume-price confirmation indicate that the current move has institutional sponsorship, not retail chasing. IGF's lagging 0.0% category-relative strength reveals that global infrastructure is trailing domestic utilities in this rotation.
Utilities & Infrastructure earned 5% allocation at 51.2, ranking outside the top two despite 57% macro fit from +12 defensive rotation and +4 transition tailwinds. The constraint is technical: XLU sits 13.8% above the 50-week moving average with zero upside to resistance (0.0% gap) and 20.7% downside to support—a classic extended-leader structure where new buyers pay full price for old money's gains. The category benefits from defensive rotation (valuable in any credit-stress shock) and inflation-pressure resistance (valuable in stagflation), yet the entry point is poor. The 5% allocation is held as portfolio insurance against a market shock that rotates capital from growth into regulated income; it is not a conviction growth position. Trim this position on any further extension above 34.31; redeploy proceeds into categories with better entry risk (metals pullbacks, energy oversold conditions). XLU's 44% risk-reward floor is better than nothing, but 5% is the appropriate size for a defensive play with poor entry mechanics.
Agriculture & Livestock — WEAT
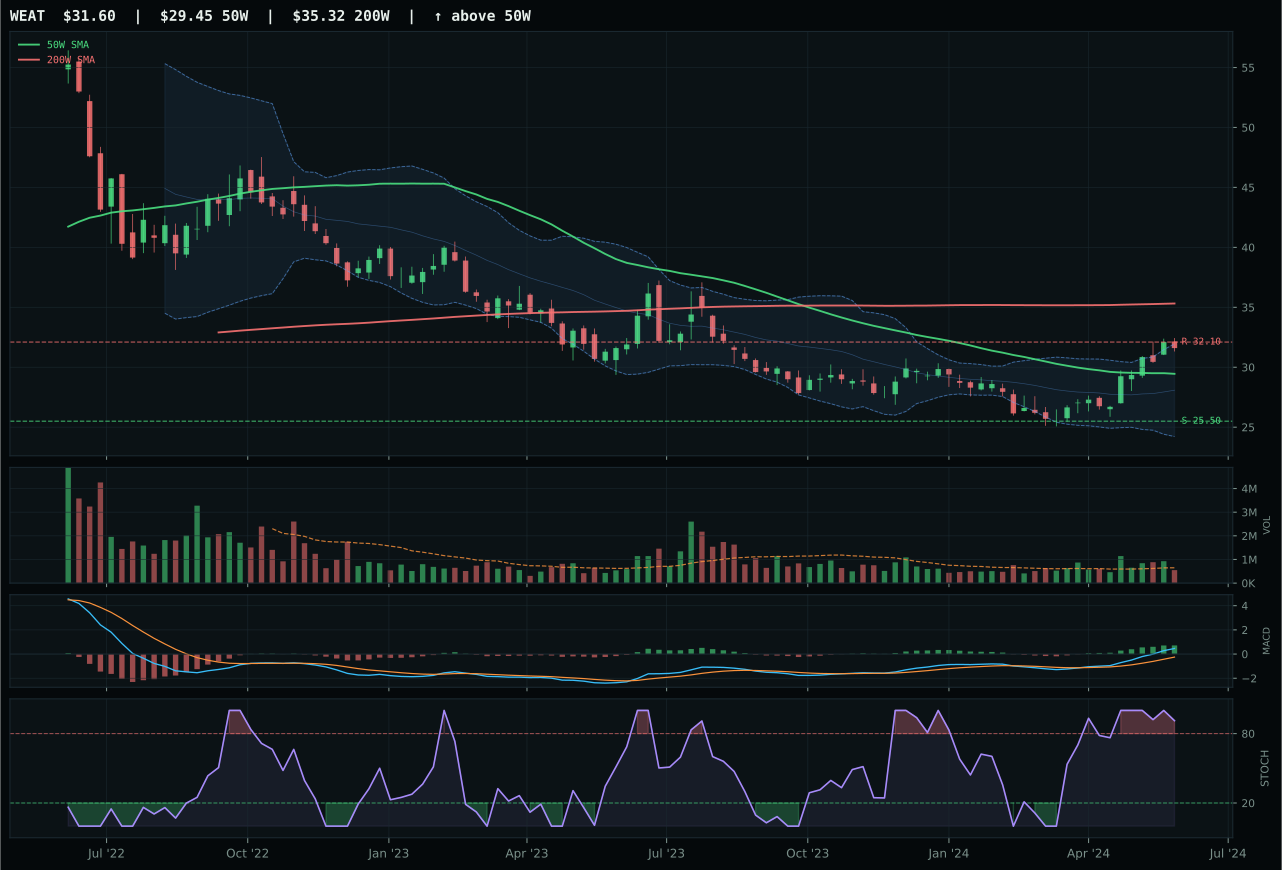
WEAT has a neutral structure profile with 17.8% 13-week relative strength versus SPY.
A failed hold above support would weaken the setup.
Actionable but governed by invalidation levels.
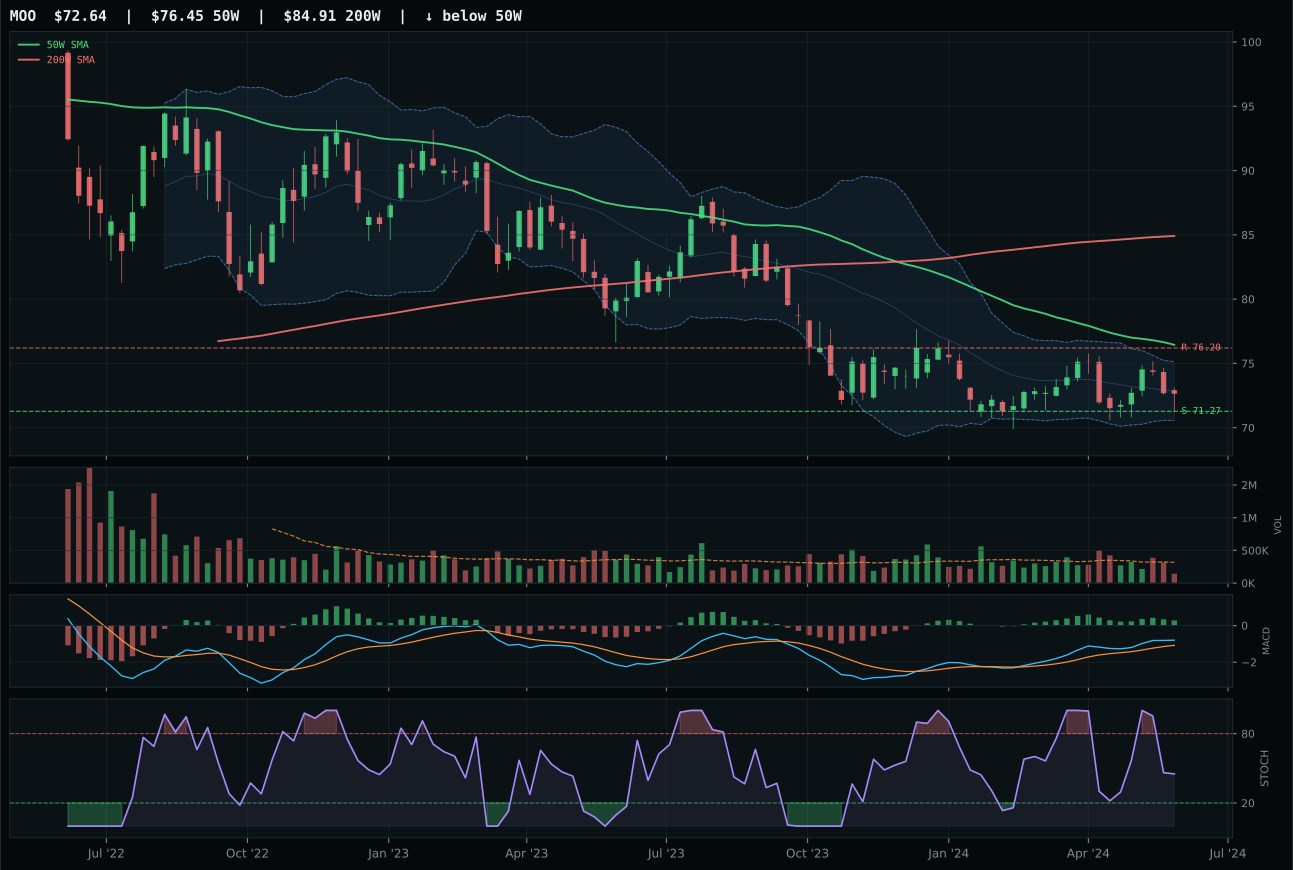
MOO has a pullback into support profile with -3.1% 13-week relative strength versus SPY.
Extension and support failure are the main tactical risks.
Tracked, but not top-2 eligible because: structurally broken.
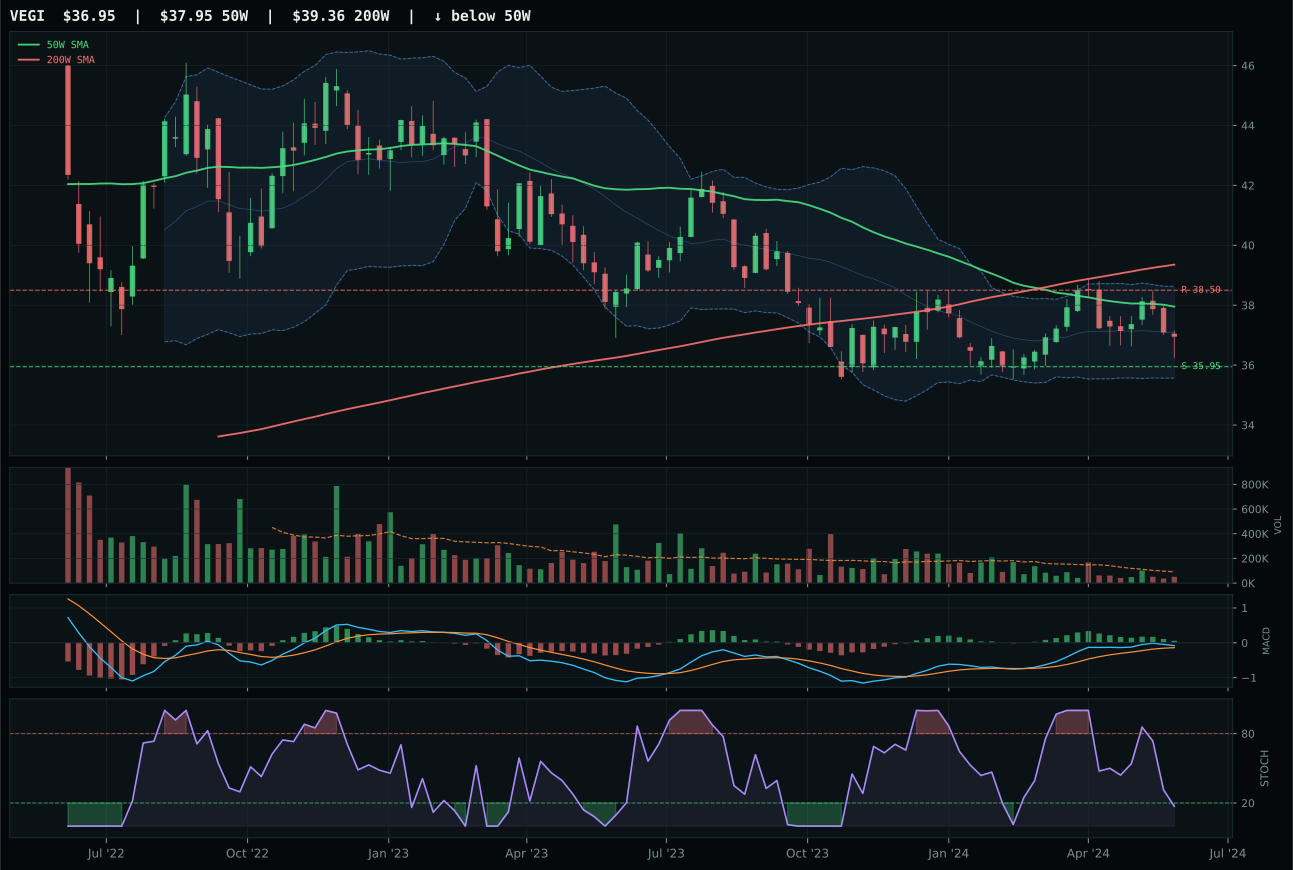
VEGI has a pullback into support profile with -1.5% 13-week relative strength versus SPY.
Extension and support failure are the main tactical risks.
Tracked, but not top-2 eligible because: structurally broken.
WEAT demolished its category with a 42.3-point margin over MOO, driven by a 100.0 momentum confirmation and 74.8% volume-price sponsorship that other agricultural names simply cannot match. The 20.6% 13-week return and 19.2% category-relative strength reflect genuine accumulation into a commodity that sits at the middle retracement zone—near the Fib 0.500 at 31.15—where breakout buyers and mean-reversion traders align. MOO's structure score of 41.4 versus WEAT's 73.3 exposes the fundamental technical difference: WEAT sits in neutral structure with intact support and resistance, while MOO has deteriorated into a pullback that requires a fresh catalyst to initiate. Stochastic RSI rollover at 0.91 on WEAT might suggest caution, but the 87.6% persistence score indicates that this momentum has deep roots in recent weeks, not a flash pop.
Agriculture & Livestock earned 5% allocation at 48.2, far below its compelling 90% macro fit score driven by +13 supply shortage, +10 inflation pressure, and +8 real asset sponsorship descriptors—a disparity that reflects entry timing more than conviction. WEAT itself sits 7.3% above the 50-week moving average in the middle retracement zone at Fib 0.50, a decision point rather than a confirmed breakout. The 23.9% downside to support versus only 1.6% upside to resistance means current holders are at risk for a flush, though new buyers on a dip would have superior asymmetry. The allocation is earned on macro grounds—supply shortage in a reflation regime is a structural tail wind—but the technical setup demands patience: WEAT must either break above resistance on volume or pullback to 25.50 support and re-base before committing large capital. Current position is core holding, not accumulation target.
Technology — XLK
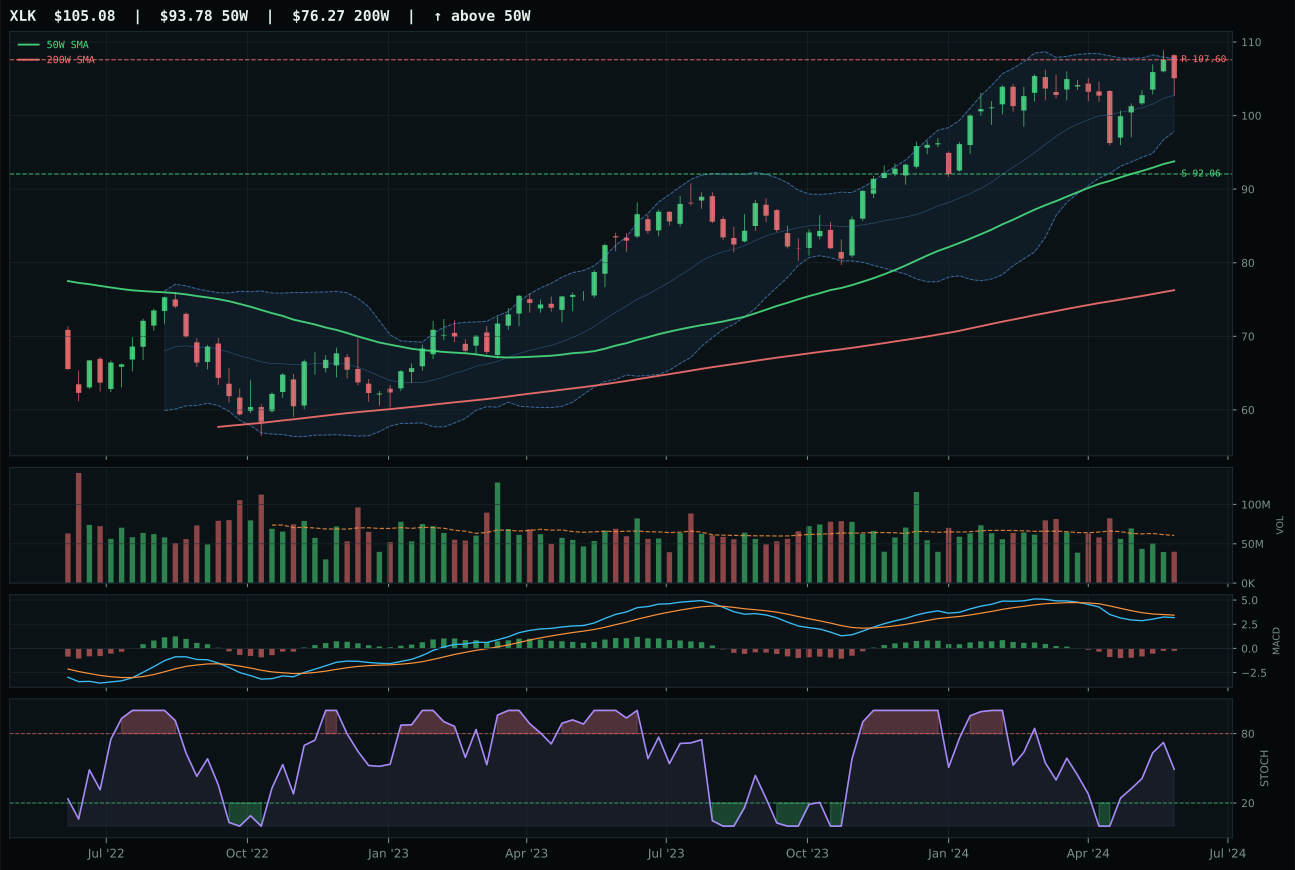
XLK has a neutral structure profile with -3.1% 13-week relative strength versus SPY.
A failed hold above support would weaken the setup.
Actionable but governed by invalidation levels.
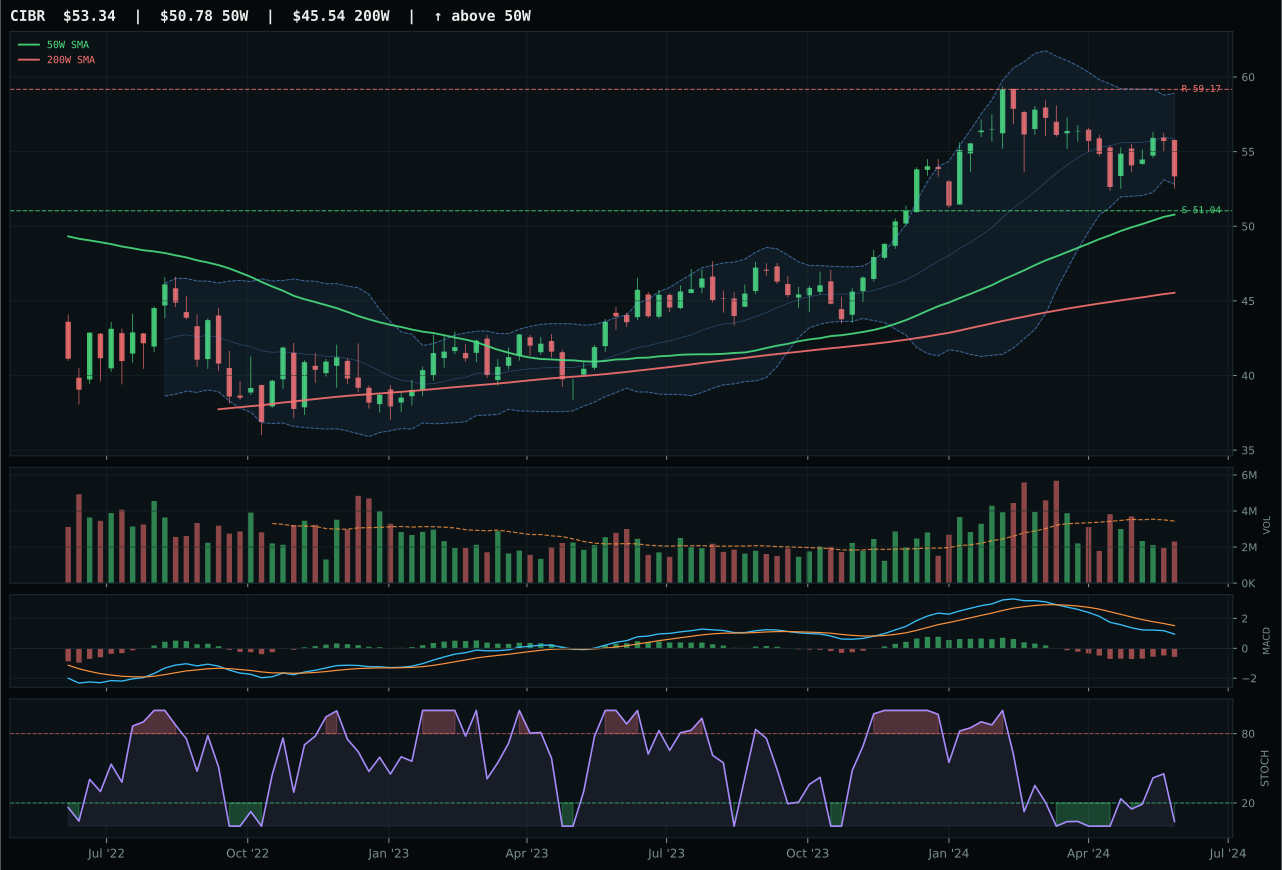
CIBR has a pullback into support profile with -10.6% 13-week relative strength versus SPY.
A failed hold above support would weaken the setup.
Actionable but governed by invalidation levels.
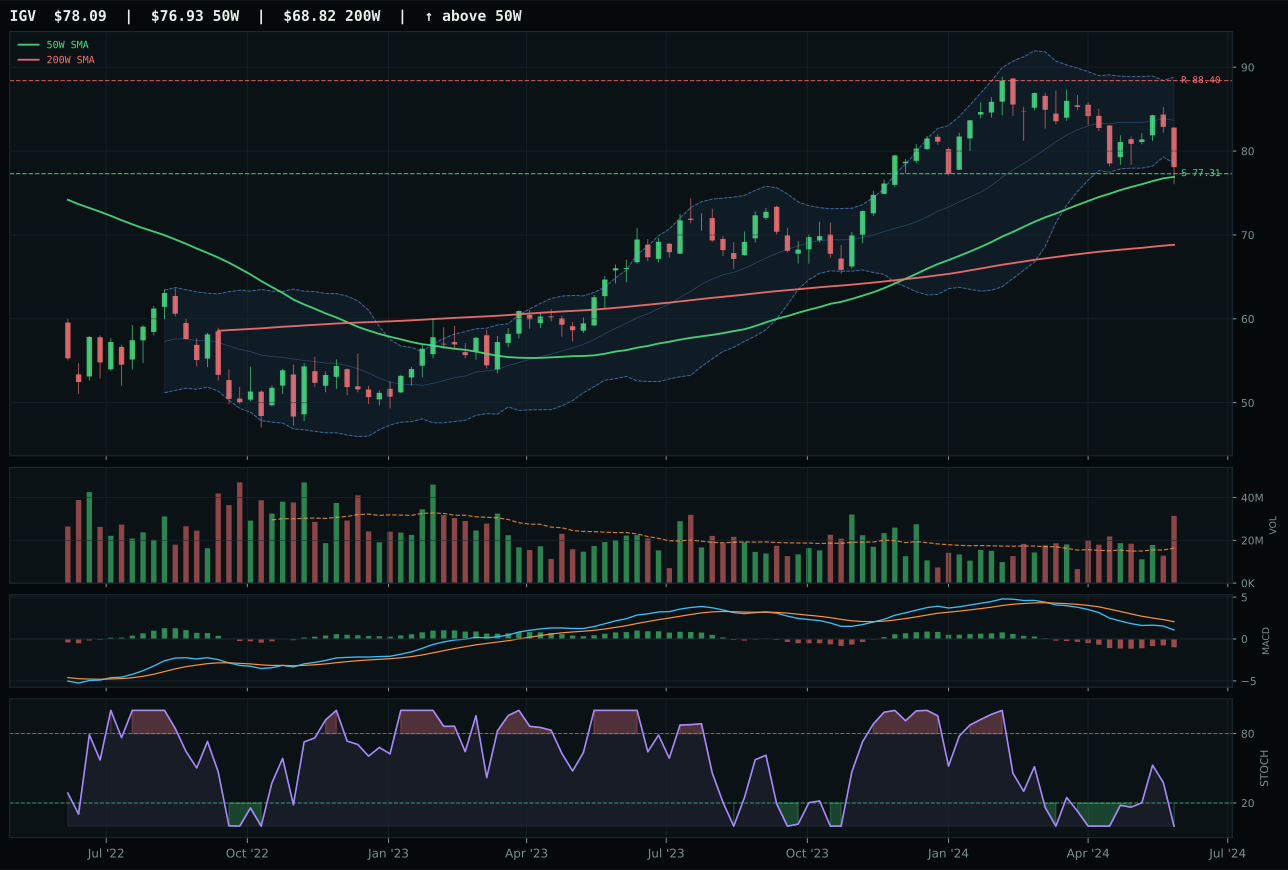
IGV has a pullback into support profile with -13.0% 13-week relative strength versus SPY.
A failed hold above support would weaken the setup.
Actionable but governed by invalidation levels.
XLK won the category by capturing 7.4% relative strength inside the technology basket while trading just 12.0% above its 50-week moving average—a setup that rewards measured entry into a crowded sector. The trend composite of 88.3 sits on a non-deteriorating 50W slope at 0.4%, confirming that momentum is neither accelerating nor rolling over, a critical threshold for avoiding late-cycle rejection. CIBR's stochastic RSI has already collapsed into oversold territory while its 13W return sits at negative 7.7%, creating a structural divergence where the price action is fading into support and the oscillator offers no fresh confirmation. The 0.66x volume on XLK suggests thin participation, but that weakness is offset by category-relative strength and a neutral structure that avoids the compression breakdowns visible in cybersecurity-focused peers.
Technology earned zero allocation this week, ranking ninth or tenth among the ten categories at a final score of 32.3. The category is hostage to conflicting macro forces: AI growth sponsorship adds six points, yet liquidity stress and credit stress subtract nine and seven respectively, leaving 35% category-level macro fit against the late-cycle reflation regime. Entry risk is acute—XLK itself trades 12% above its 50-week moving average with thin volume, creating a setup where new capital is chasing, not accumulating. Until either relative strength widens versus SPY (currently -3.1%) or the technical setup tightens to pullback-into-support geometry, Technology remains structurally overpriced for the current macro moment. Categories with 50%+ macro fit and cleaner entries have superior risk-adjusted appeal.
Emerging Markets — INDA
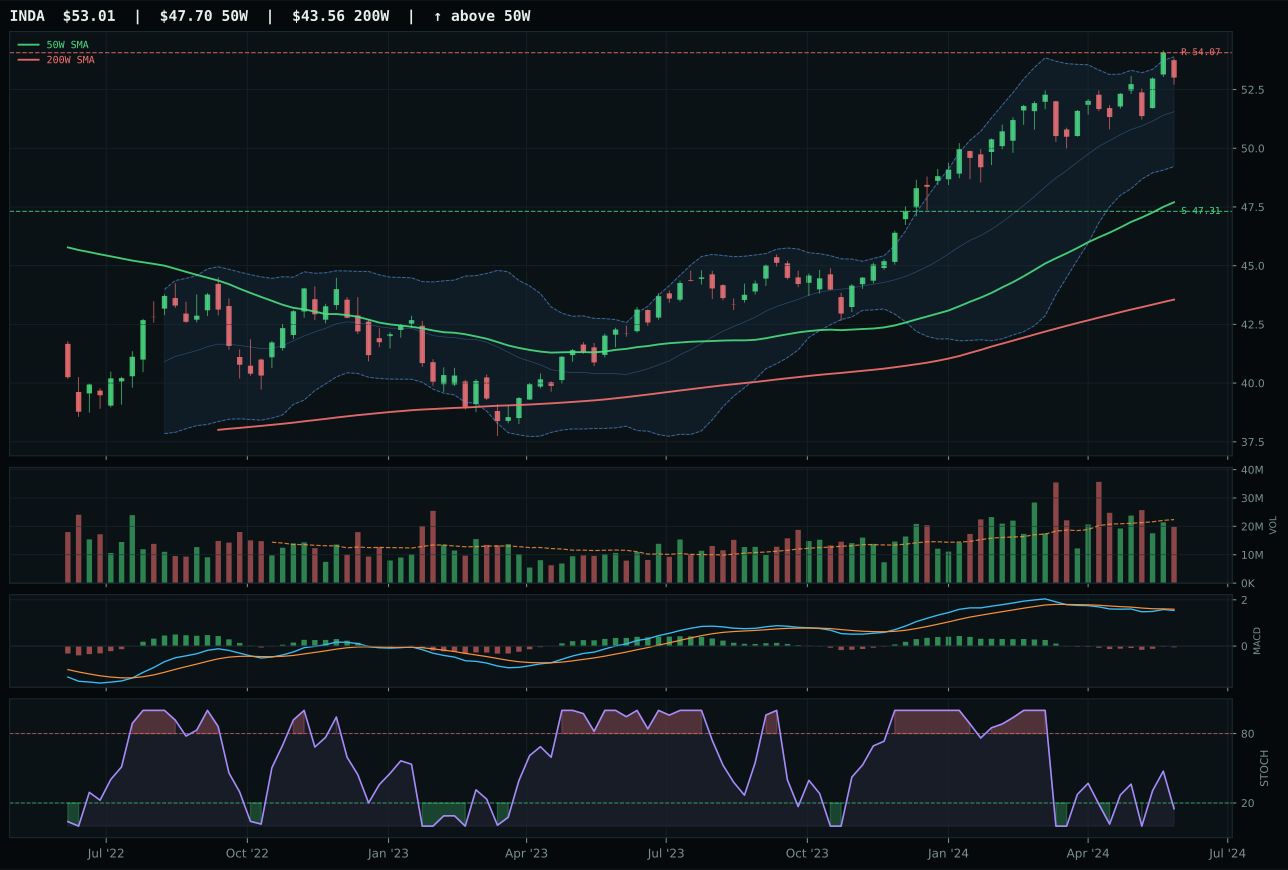
INDA has a neutral structure profile with -0.7% 13-week relative strength versus SPY.
A failed hold above support would weaken the setup.
Actionable but governed by invalidation levels.
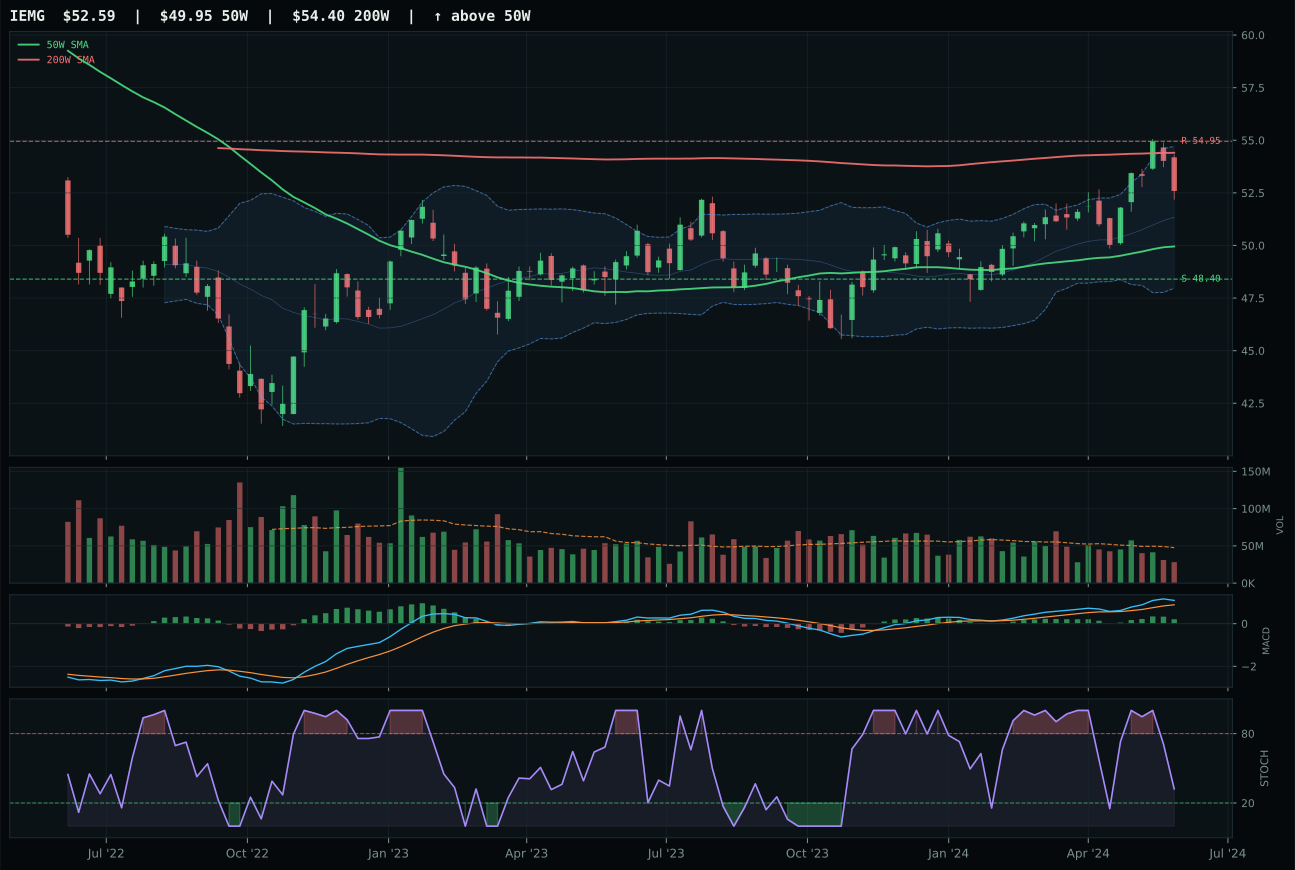
IEMG has a neutral structure profile with 0.3% 13-week relative strength versus SPY.
A failed hold above support would weaken the setup.
Actionable but governed by invalidation levels.
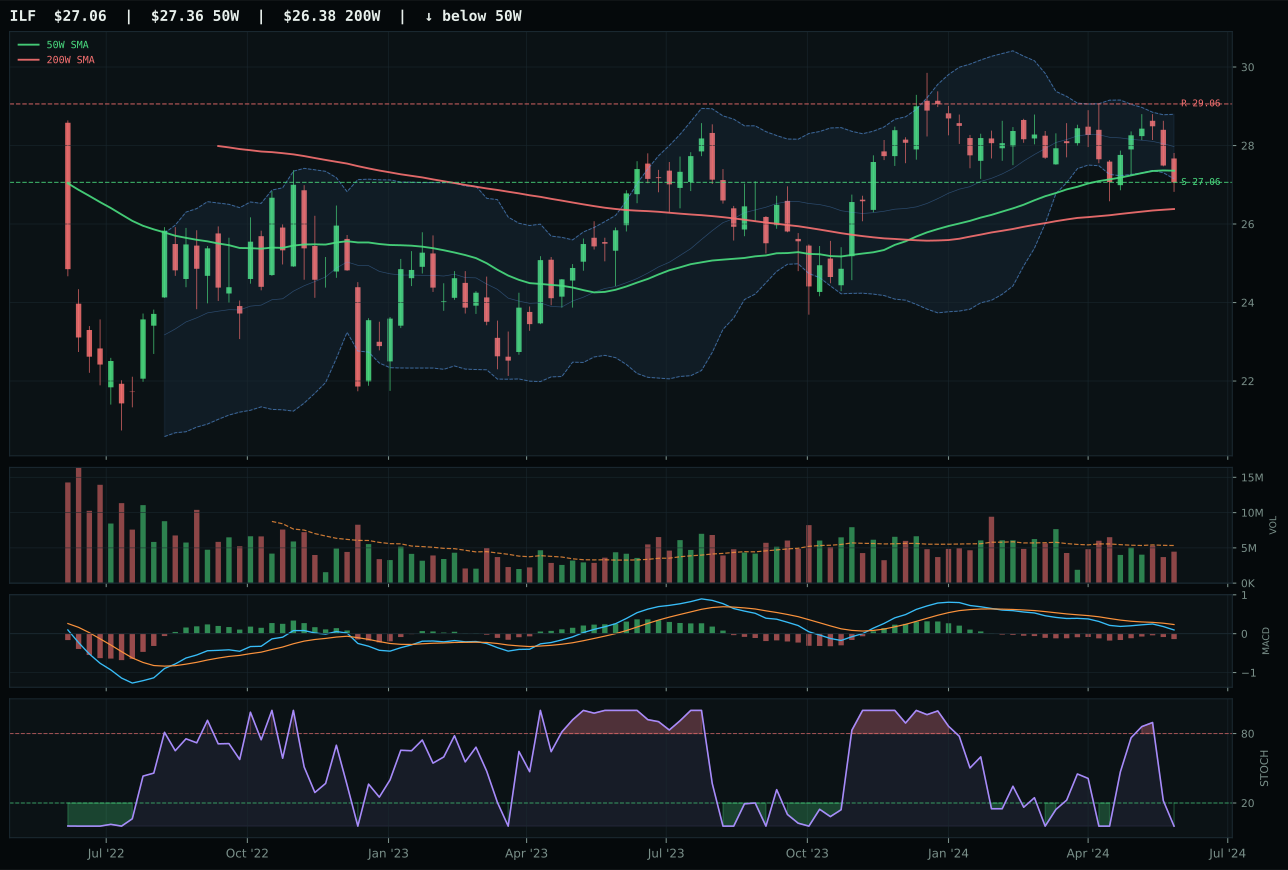
ILF has a pullback into support profile with -7.1% 13-week relative strength versus SPY.
A failed hold above support would weaken the setup.
Actionable but governed by invalidation levels.
INDA won a category-tying decision over IEMG by a margin of just 0.5 points, driven by superior timing (81.0 vs 75.0) and structure (73.7 vs 71.5) despite trailing on relative strength and momentum confirmation. INDA's stochastic RSI has just turned up from oversold at 0.15, creating a mean-reversion setup where the next wave of buying targets fresh traders unaware of the capitulation already priced in. IEMG's falling stochastic RSI and bullish MACD represent a divergence: the broad emerging-market benchmark is rallying into weakening momentum oscillators, a sign that breadth is fading beneath price. The 11.1% distance to the 50W on INDA sits in a sweet spot—close enough to avoid the perception of being extended, far enough to avoid looking broken. Thin 0.88x volume on INDA versus thin 0.60x on IEMG suggests both lack conviction, but INDA's structural advantage lies in the timing window it offers for fresh entries.
Emerging Markets earned zero allocation, ranking ninth or tenth with a final score of 22.0—the portfolio's second-weakest category despite INDA's technical competence. The culprit is 30% category macro fit, dragged below 35% thresholds by -10 liquidity stress and -10 credit stress active descriptors. In a late-cycle reflation regime where real assets, energy security, and monetary hedges lead, emerging markets face the opposite pressures: tighter financial conditions, dollar strength, and commodity import costs. INDA's technical setup is acceptable (91.9% trend, 81.0% timing), yet acceptable technicals in a hostile macro regime earn zero capital. The category would require either a rollover in the dollar, a credit-stress reversal, or active liquidity-injection commentary from global central banks to earn re-entry. Until one of those conditions emerges, this is a category to avoid entirely despite INDA's clean setup. Wait for macro reset before reconsidering.