
2024-05-24
Informational purposes only. The content in this report, including allocations, analysis, and commentary, is provided solely for informational and educational purposes. It does not constitute financial advice, investment advice, trading advice, or any other type of advice. Past performance does not guarantee future results. Always conduct your own research and consult a qualified financial professional before making investment decisions.
Weekly Allocation
| Ticker | Category | Weight | Role |
|---|---|---|---|
| FBTC | 50% | Overlay | |
| NLR | Nuclear Energy | 10% | Top-2 (10%) |
| XLE | Traditional Energy | 10% | Top-2 (10%) |
| SLV | Precious Metals | 5% | Tier-2 (5%) |
| XAR | Defense & Aerospace | 5% | Tier-2 (5%) |
| XLU | Utilities & Infrastructure | 5% | Tier-2 (5%) |
| SMH | AI | 5% | Tier-2 (5%) |
| PICK | Industrial Metals | 5% | Tier-2 (5%) |
| WEAT | Agriculture & Livestock | 5% | Tier-2 (5%) |
Trade Instructions — Monday Open
Sell the tranche from 2024-04-26 (completing its 4-week hold). Buy the new tranche. Instructions show net portfolio changes — same-asset positions cancel, weight changes show the delta.
| Action | Ticker | Instruction |
|---|---|---|
| SELL | GLD | Sell 33% of GLD position (reduce 7.50% → 5.00%) |
| SELL | COPX | Sell 20% of COPX position (reduce 6.25% → 5.00%) |
| SELL | URNM | Sell 50% of URNM position (reduce 2.50% → 1.25%) |
| SELL | ITA | Sell entire ITA position (1.25% of portfolio) |
| BUY | NLR | Buy NLR — 40.00% of freed cash (adds 2.50% to portfolio) |
| BUY | XAR | Buy XAR — 20.00% of freed cash (adds 1.25% to portfolio) |
| BUY | SLV | Buy SLV — 20.00% of freed cash (adds 1.25% to portfolio) |
| BUY | PICK | Buy PICK — 20.00% of freed cash (adds 1.25% to portfolio) |
Current Portfolio After Trade
Combined holdings across all 4 active tranches. Each tranche is 25% of the portfolio.
| Ticker | % of Portfolio | Weight Bar |
|---|---|---|
| FBTC | 50.00% | |
| XLE | 10.00% | |
| GLD | 5.00% | |
| COPX | 5.00% | |
| XLU | 5.00% | |
| WEAT | 5.00% | |
| NLR | 5.00% | |
| XAR | 5.00% | |
| SMH | 2.50% | |
| BOTZ | 2.50% | |
| SLV | 2.50% | |
| URNM | 1.25% | |
| PICK | 1.25% |
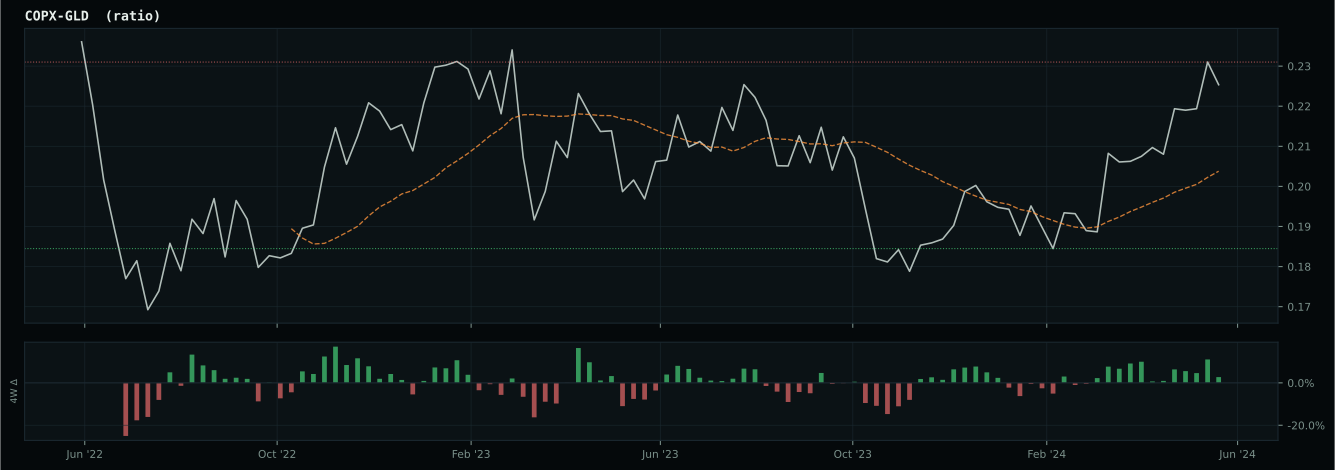
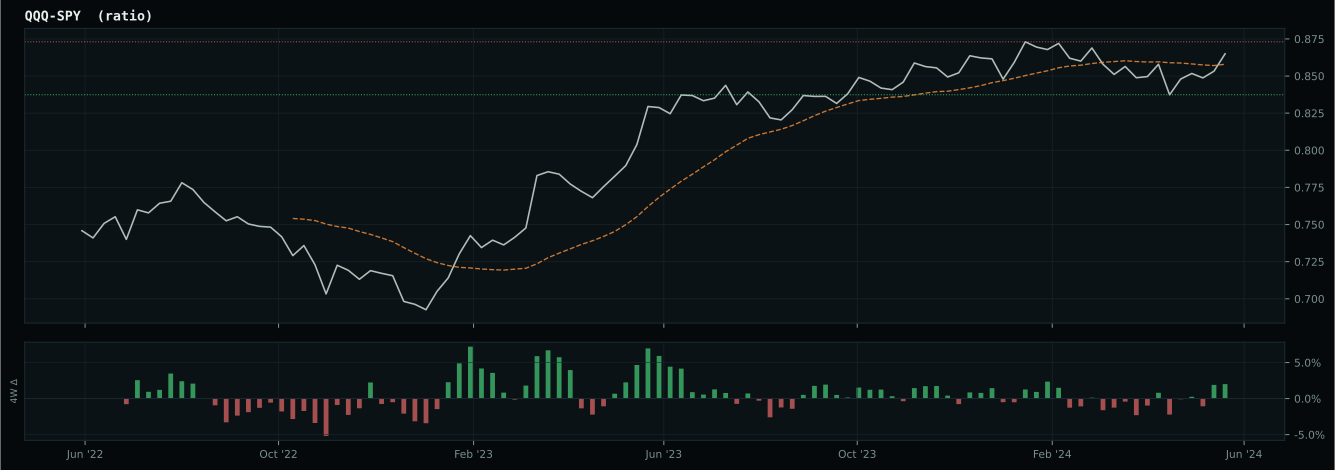
Macro Regime — Late-Cycle Reflation
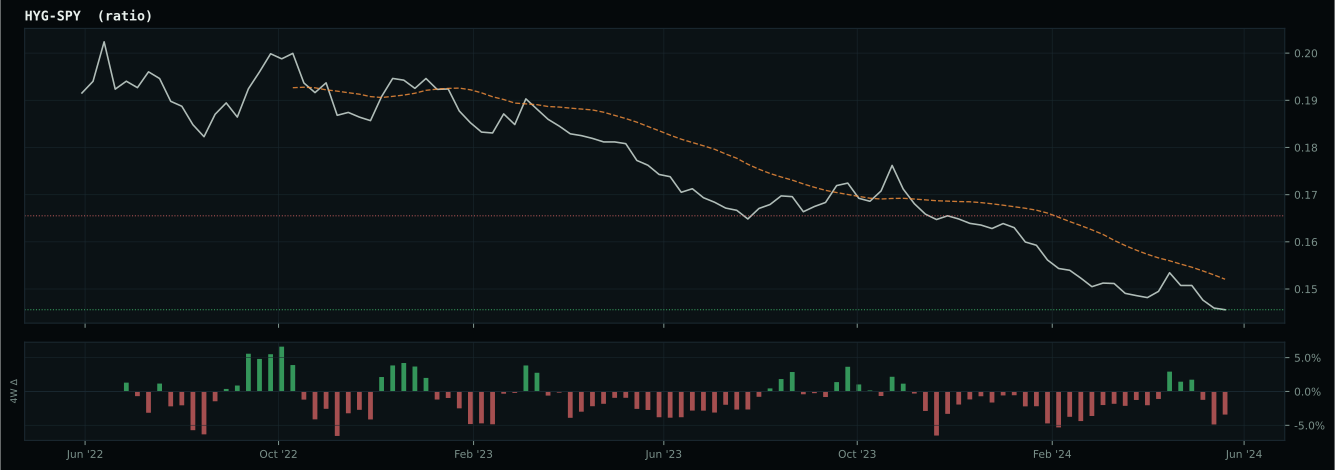
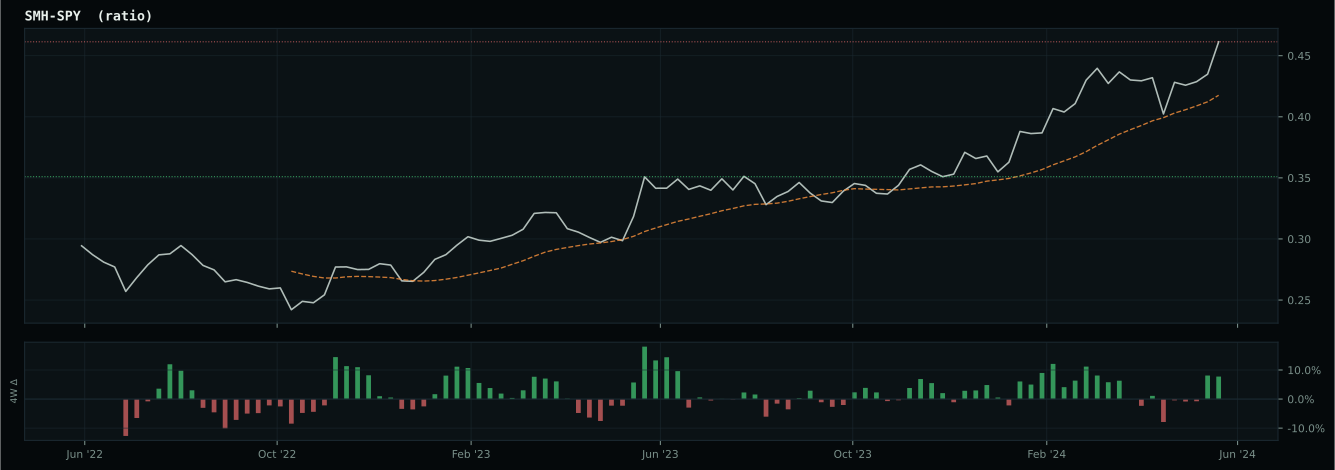
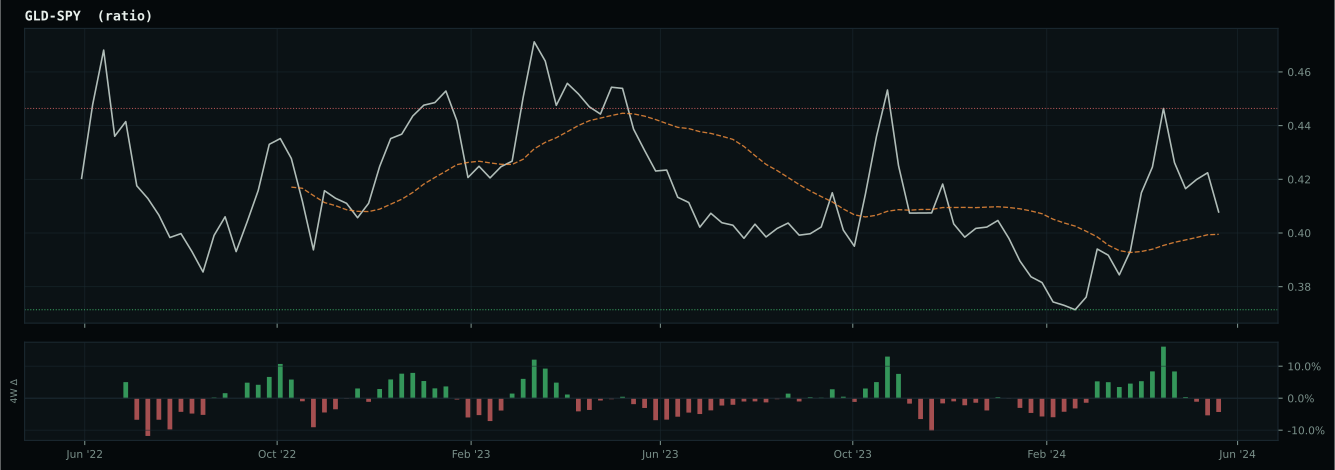
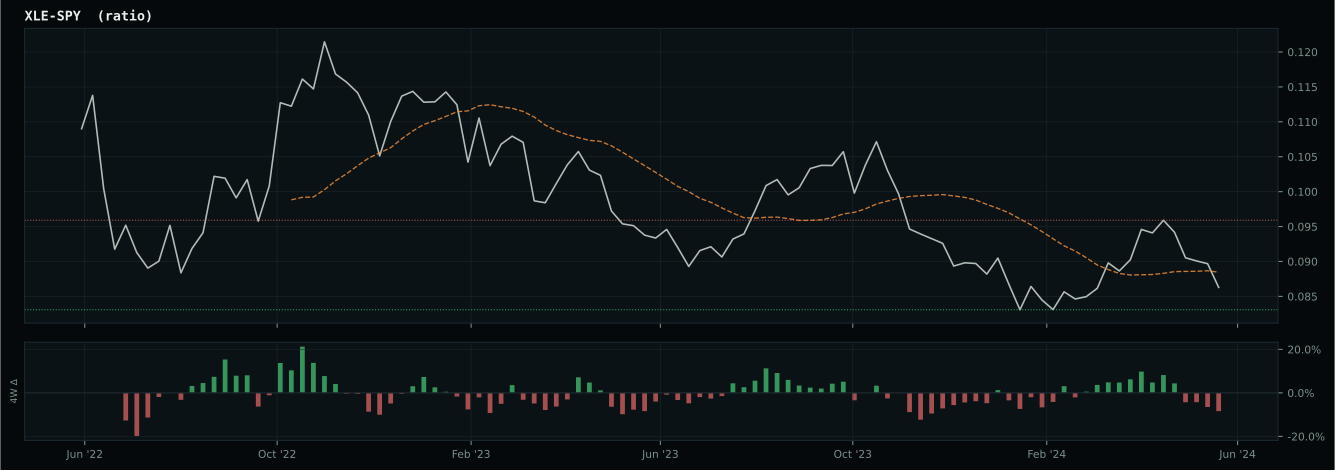
Macro Evidence Charts
Market-implied signals behind the macro regime scores. Each ratio compares two assets; the direction and slope of the ratio is what the macro engine reads.
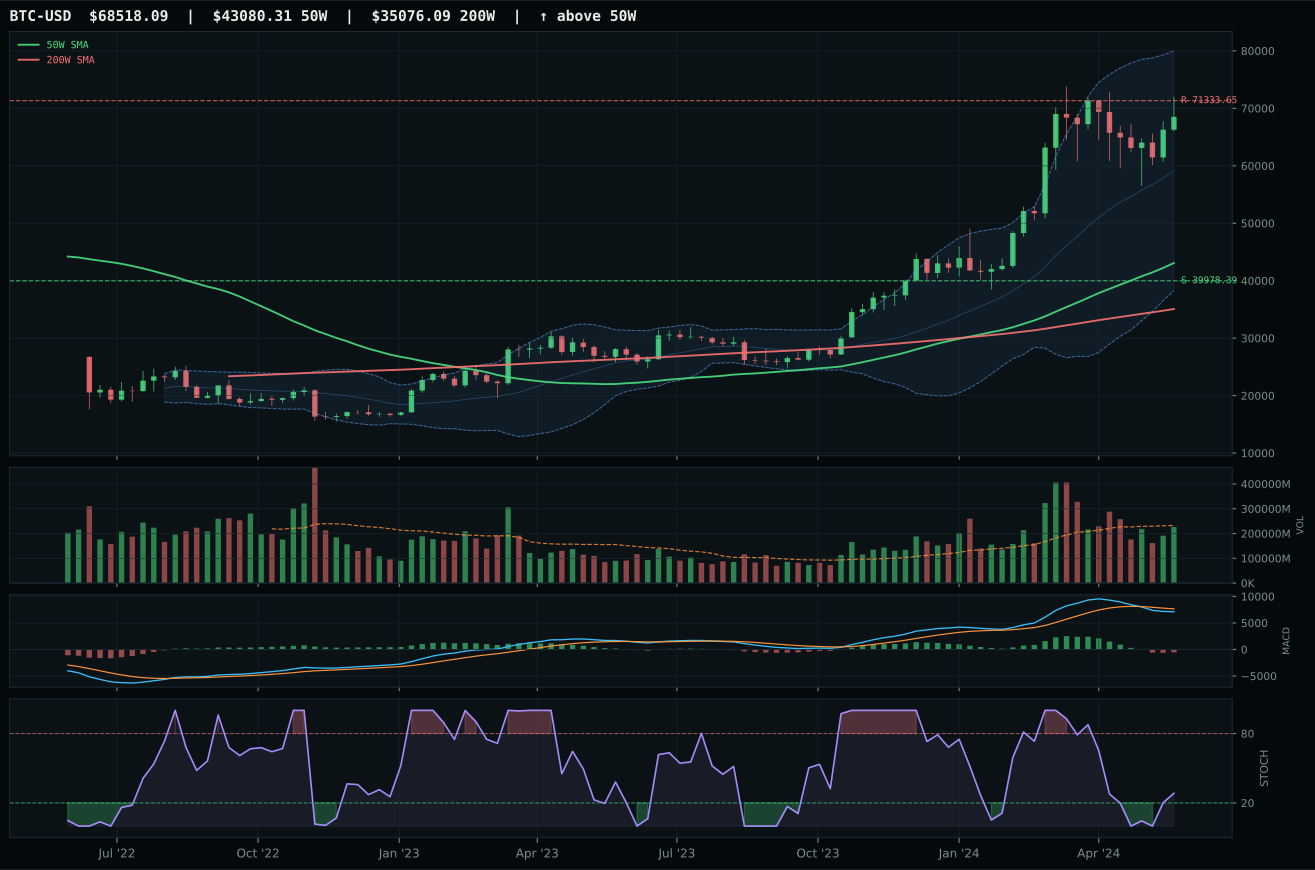
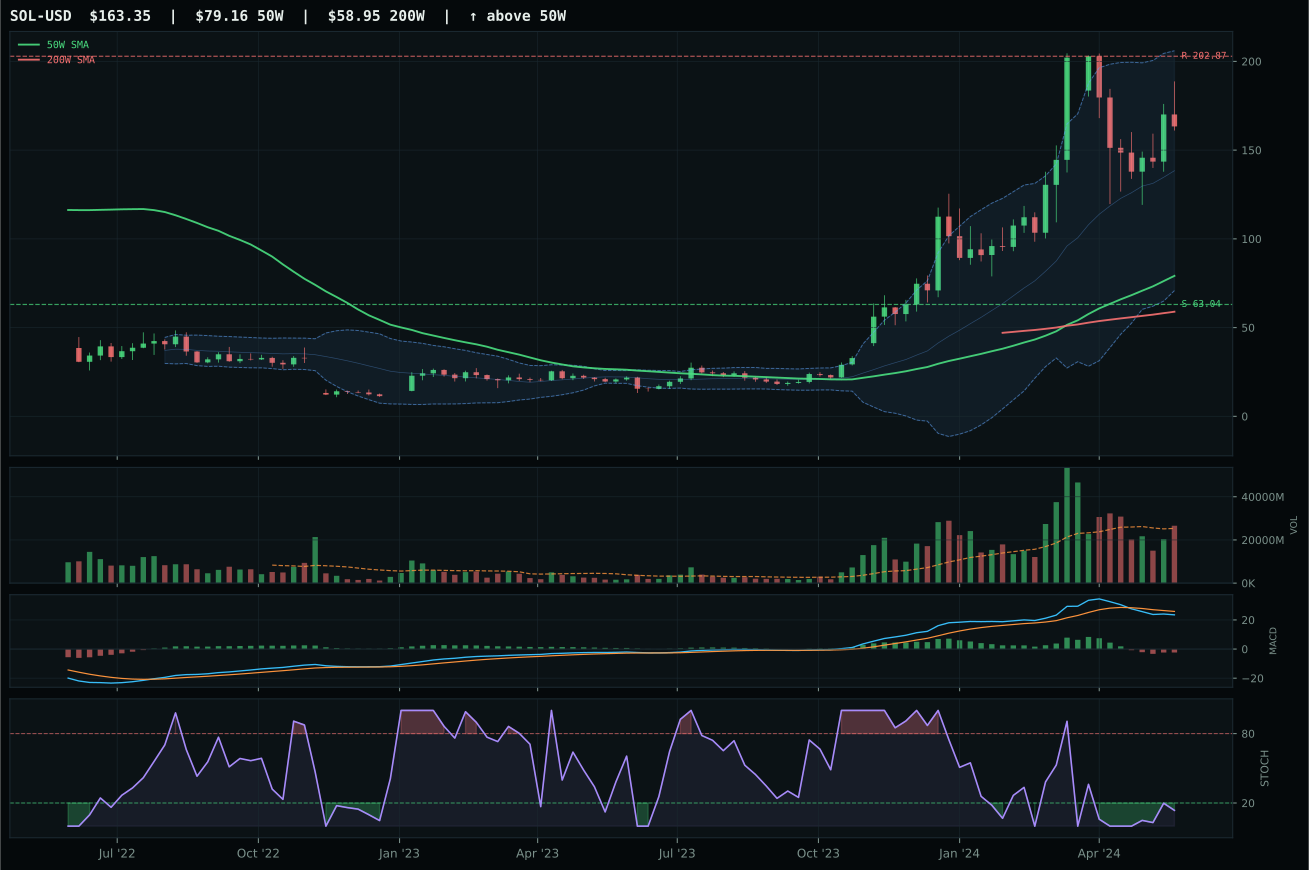
Crypto Regime — TrendBTC
ValueBTC not armed: BTC has not made the first post-breakdown touch of the 200W buy zone after losing the 50W
TrendBTC confirmed: 2 consecutive closes above rising/flat 50W SMA
one or more available conditions failed
Category Rankings
| Rank | Category | Winner | Score | Alloc | 4W Ret | Peers (4W) |
|---|---|---|---|---|---|---|
| 1 | Nuclear Energy | NLR | 78.9 | 20% | -5.49% | URA -8.4% · URNM -9.4% |
| 2 | Traditional Energy | XLE | 77.0 | 20% | -2.36% | FCG -3.9% · XOP -4.2% |
| 3 | Precious Metals | SLV | 69.2 | 10% | -7.65% | GDX -4.9% · GLD -1.3% |
| 4 | Defense & Aerospace | XAR | 59.9 | 10% | -1.03% | ITA -0.8% · ROKT -1.1% |
| 5 | Utilities & Infrastructure | XLU | 58.9 | 10% | -3.84% | IGF -3.4% · PAVE -4.4% |
| 6 | AI | SMH | 55.9 | 10% | +5.58% | AIQ +2.5% · BOTZ -2.6% |
| 7 | Industrial Metals | PICK | 54.7 | 10% | -9.11% | COPX -8.9% · REMX -18.6% |
| 8 | Agriculture & Livestock | WEAT | 48.1 | 10% | -17.57% | MOO -3.3% · VEGI -3.3% |
| 9 | Technology | XLK | 35.7 | 0% | +4.27% | CIBR -1.4% · IGV +1.7% |
| 10 | Emerging Markets | INDA | 28.5 | 0% | +2.46% | IEMG -1.0% · ILF -9.9% |
Nuclear Energy — NLR
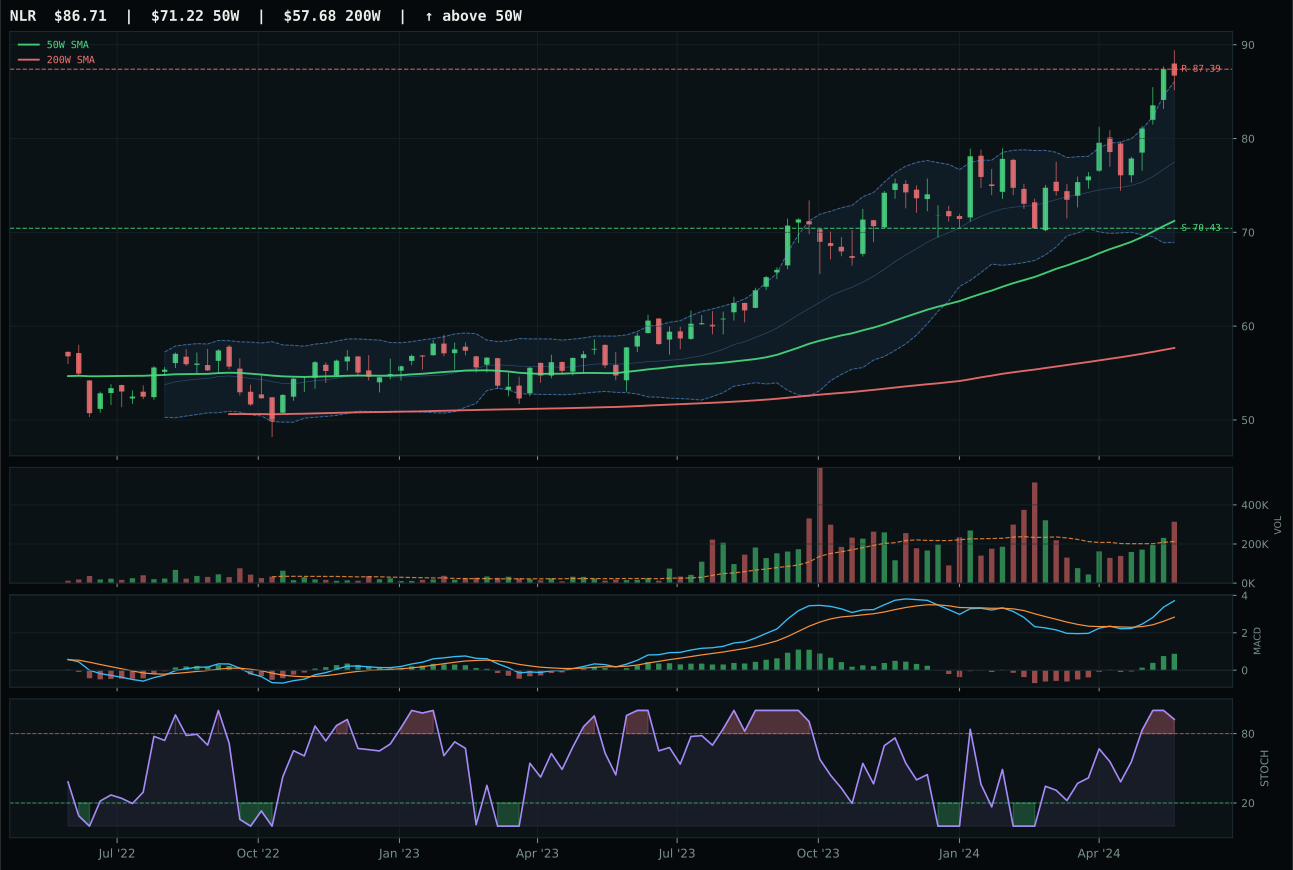
NLR has a vertical extension profile with 18.9% 13-week relative strength versus SPY.
A failed hold above support would weaken the setup.
Actionable but governed by invalidation levels.
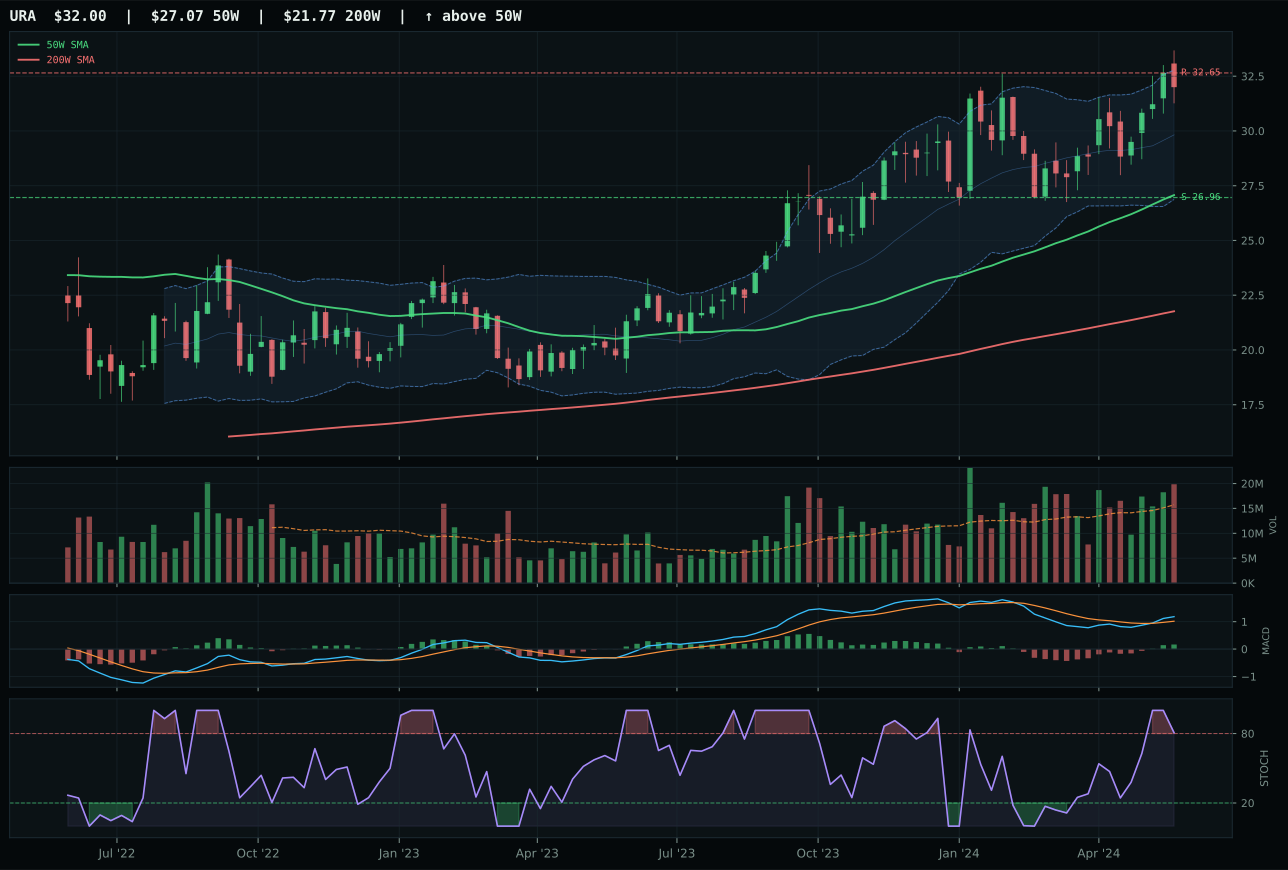
URA has a vertical extension profile with 14.4% 13-week relative strength versus SPY.
A failed hold above support would weaken the setup.
Actionable but governed by invalidation levels.
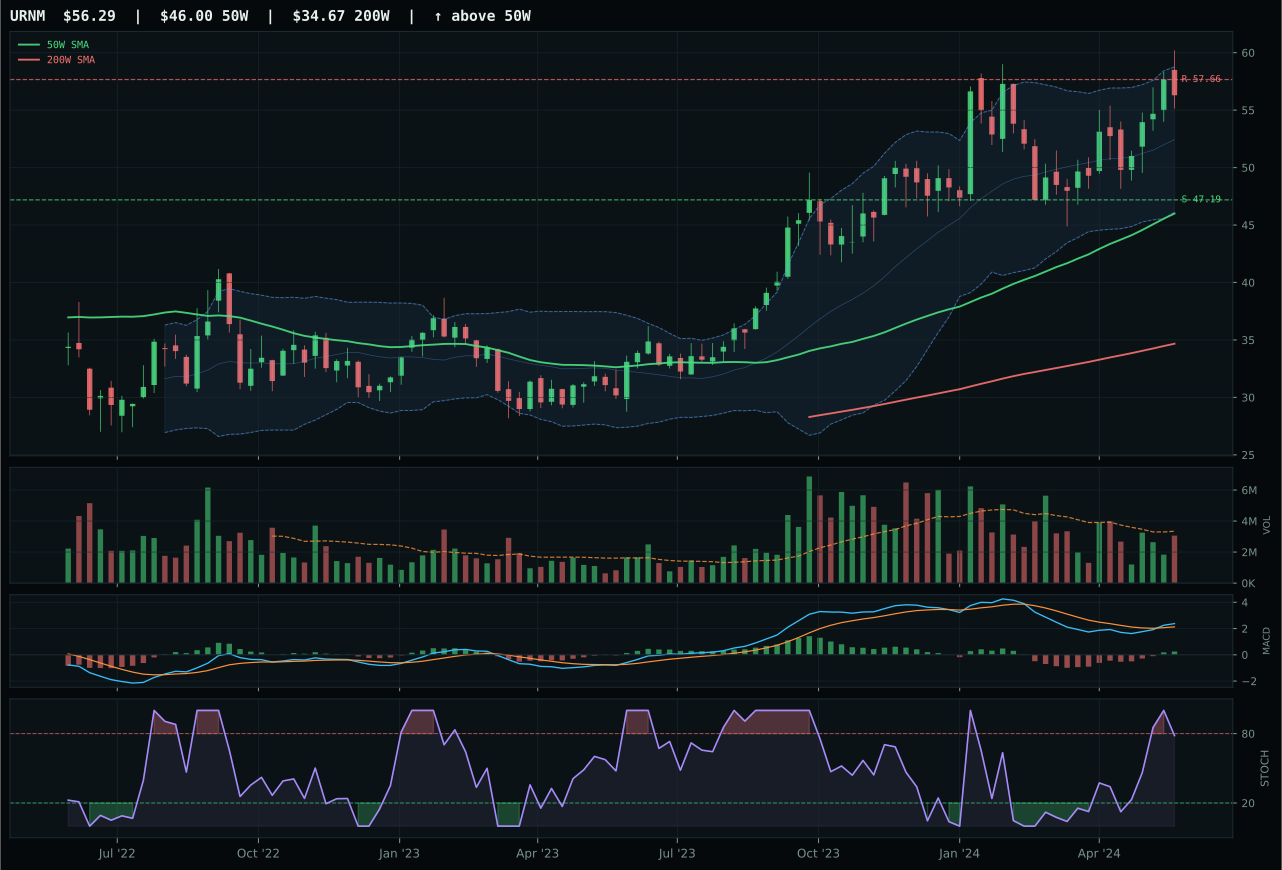
URNM has a vertical extension profile with 15.0% 13-week relative strength versus SPY.
A failed hold above support would weaken the setup.
Actionable but governed by invalidation levels.
NLR captures the nuclear category and earns top-2 status with a 78.9 final score despite having lower technical evidence (88.3/100) than runner-up URA (87.0) because NLR's 3.8% category-relative strength decisively beats URA's -0.7%, a 4.5-point peer gap that reflects genuine buying interest concentrated in NLR rather than distributed across the nuclear space. NLR's structure score of 76.3/100 exceeds URA's 71.6/100, driven by superior cleanliness (58.3 identical, but compression and support-resistance definition favor NLR) and the critical detail: NLR's volume at 1.48x the 20W average shows active accumulation while URA's above-average but lower level (75 volume score) suggests participation is thinning. Both are extended at 21.7% and 14.4% respectively from their 50W moving averages, stochastic RSI is overbought-momentum in both, but NLR's momentum confirmation of 100.0/100 versus URA's 100.0/100 creates a technical tie that the category-relative strength gap breaks in favor of NLR. Timing score of 37.0/100 reflects the extension penalty, but NLR's above-average volume participation and improving volume-price confirmation (77.6/100) signal that the extension is being accumulated, not distributed.
Nuclear Energy ranks as a top-2 category at 78.9, placing it in the second 10% allocation slot alongside Traditional Energy. NLR's 88.3/100 technical evidence is the strongest of any ETF in the portfolio, and category-level macro fit of 69.0/100 provides robust support: energy scarcity active at +9, real asset sponsorship at +7, Late-Cycle Reflation boost at +7, and AI growth sponsorship (from increased power demand) at +5 converge to push the category higher. Unlike Energy, which wins on supply constraints and inflation, Nuclear wins on the dual thesis of energy security and AI power demand—a narrative that strengthens as reflation extends. The timing risk is real: stochastic RSI overbought, MACD improving but not confirmed as sustained, and 37.6/100 risk/reward from limited upside and meaningful downside. Allocation at 10% reflects technical strength and macro positioning but with explicit recognition that NLR is extended and vulnerable to momentum breakdown.
Traditional Energy — XLE
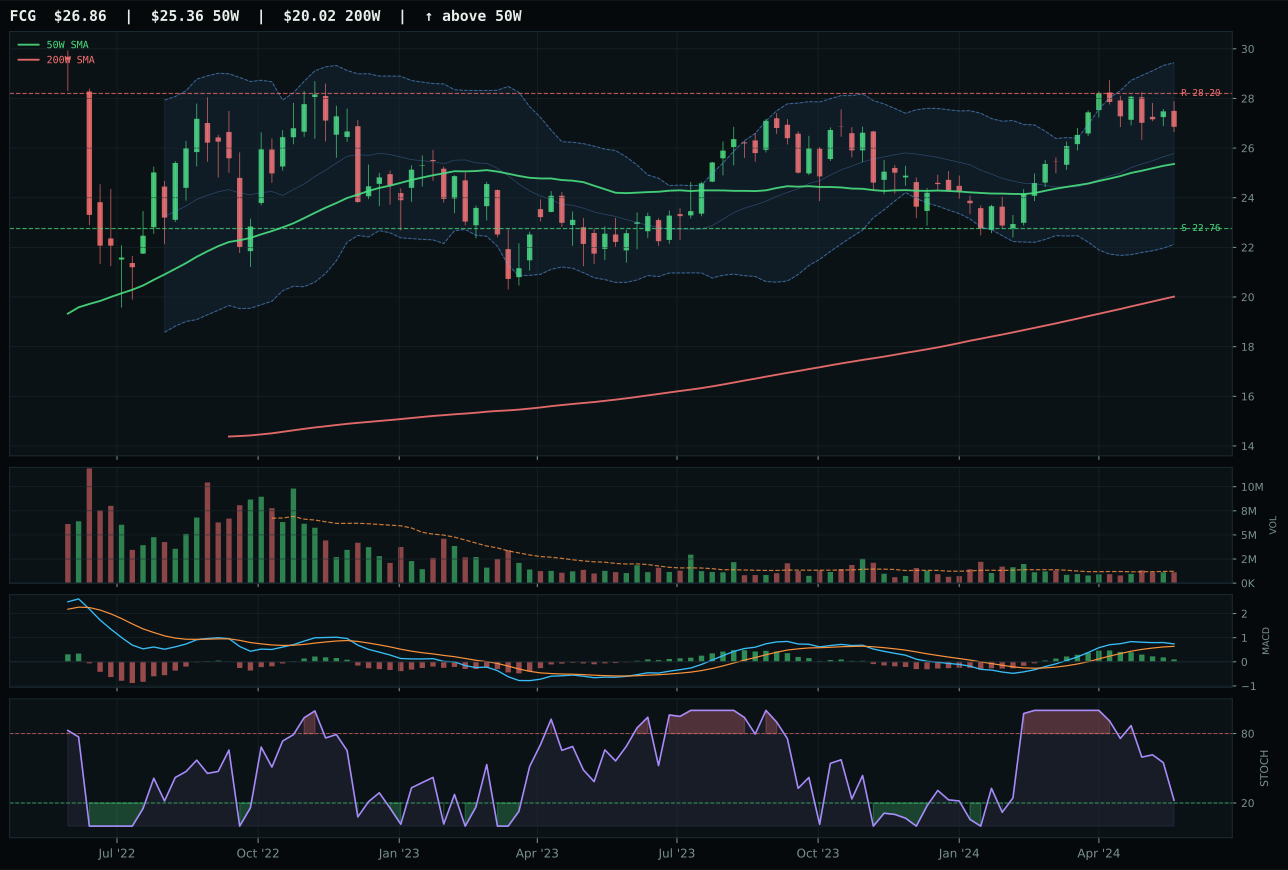
FCG has a neutral structure profile with 5.0% 13-week relative strength versus SPY.
A failed hold above support would weaken the setup.
Actionable but governed by invalidation levels.
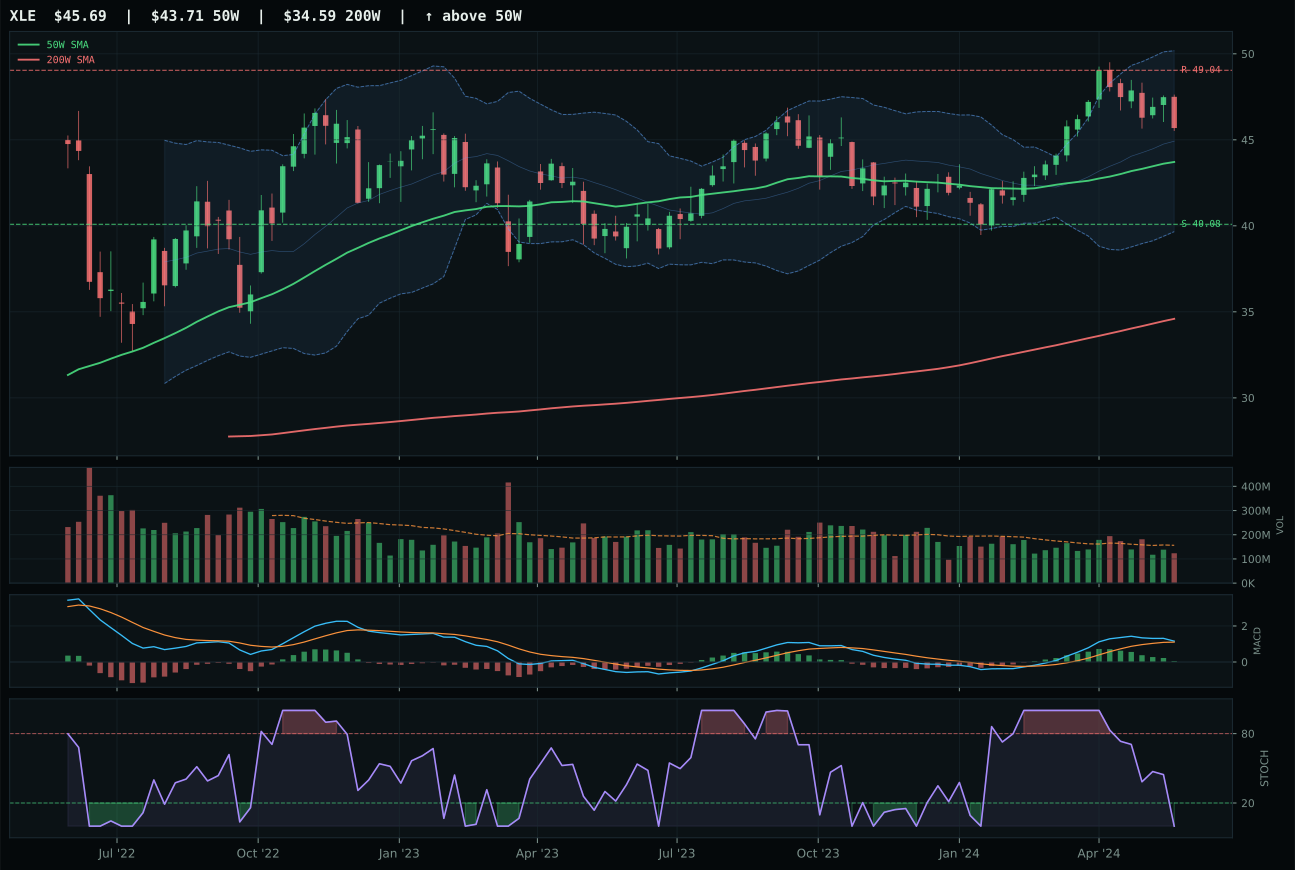
XLE has a neutral structure profile with 2.0% 13-week relative strength versus SPY.
A failed hold above support would weaken the setup.
Actionable but governed by invalidation levels.
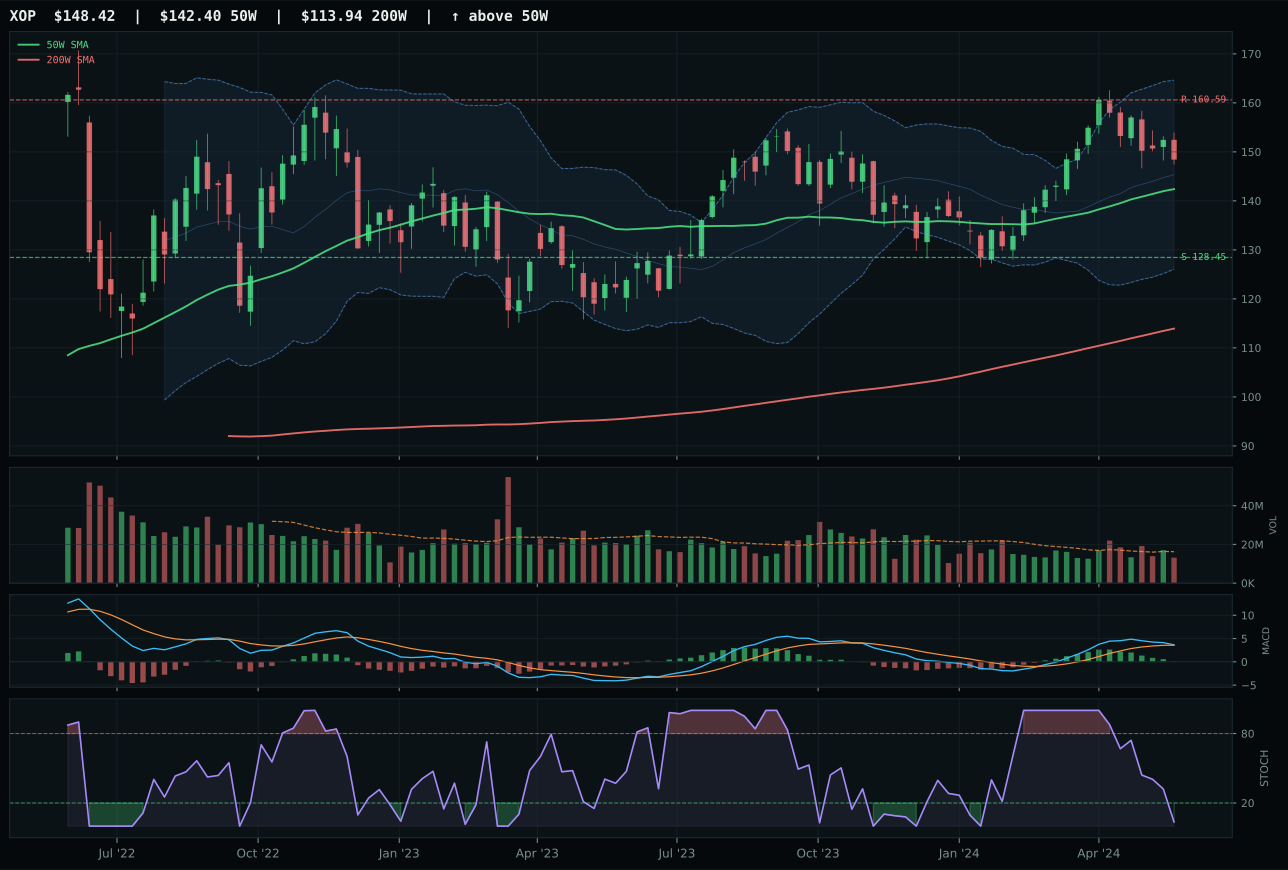
XOP has a neutral structure profile with 2.7% 13-week relative strength versus SPY.
A failed hold above support would weaken the setup.
Actionable but governed by invalidation levels.
XLE wins Traditional Energy and earns top-2 status with a 77.0 final category score by posting superior timing (85.0/100) against near-equivalent technical evidence from FCG (71.2) and XOP. XLE's critical advantage is stochastic RSI configuration: oversold at 0.00 versus FCG's falling/neutral and XOP's oversold, meaning XLE has reset more completely and arrived at the most favorable mean-reversion entry point in the category. Distance from the 50W of just 4.5%—the tightest in the entire portfolio—paired with bullish-but-flattening MACD and oversold stochastic RSI creates a textbook setup where the next wave of buyers can accumulate without paying extension premium; FCG's 70.0/100 timing score reflects 5.0% RS versus SPY advantage but weaker Fibonacci positioning and less favorable momentum reset. Both XLE and FCG show equivalent composite technical scores in the 78 range, but the category reasoner correctly elevated XLE based on timing precision: buyers have a clean entry point at mild extension (4.5% from 50W) with momentum indicators reset to favorable levels. The 0.4-point victory over FCG is tight, but the timing and entry geometry justify the representative selection.
Traditional Energy ranks as a top-2 category at 77.0, placing it alongside Nuclear Energy at 78.9 for the two 10% allocation slots. The category's macro fit of 90.0/100 is the second-best in the portfolio: energy scarcity active at +16, inflation pressure at +10, supply shortage at +9, real asset sponsorship at +7, and explicit Late-Cycle Reflation boost at +12 combine to create a 54-point macro tailwind. This is not a discretionary tactical call—it's a regime alignment decision. In Late-Cycle Reflation, energy is a structural beta, not a cyclical trade. XLE's technical evidence of 68.0/100 is solid but not extraordinary, meaning the allocation is macro-driven, and the category's second-place rank versus Nuclear Energy's first-place reflects XLE's weaker momentum confirmation despite superior timing. The allocation earns 10% because both energy themes are essential to reflation positioning.
Precious Metals — SLV
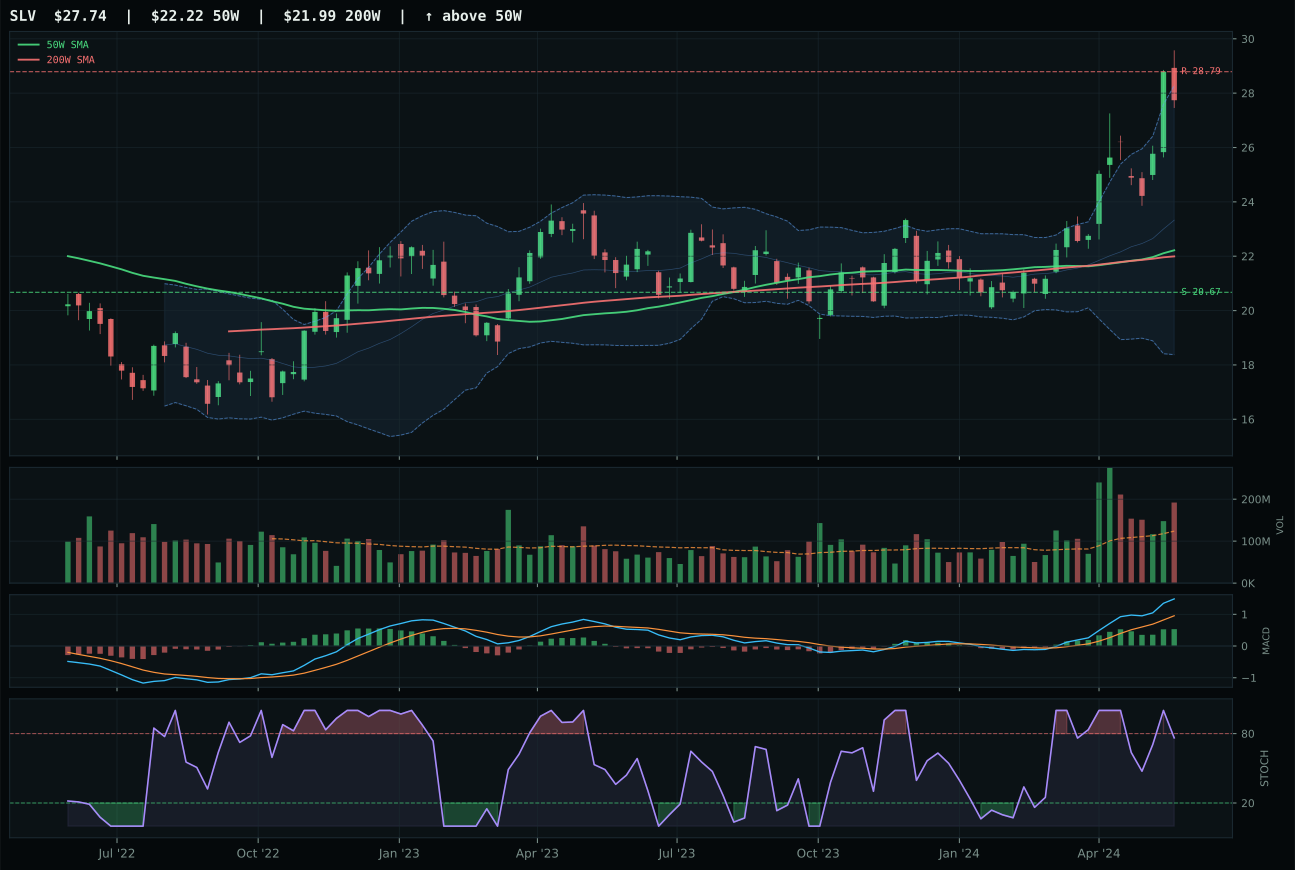
SLV has a vertical extension profile with 27.9% 13-week relative strength versus SPY.
A failed hold above support would weaken the setup.
Actionable but governed by invalidation levels.
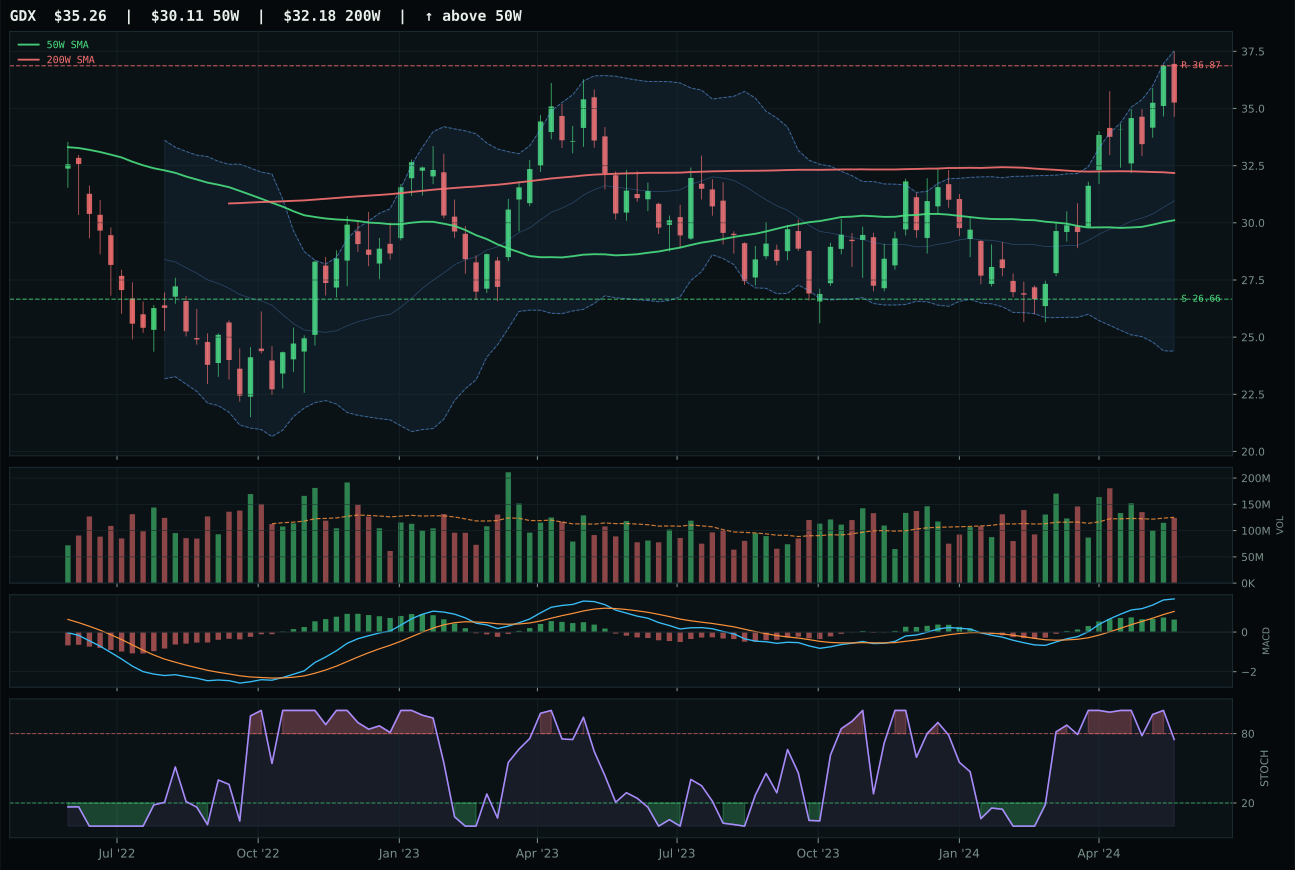
GDX has a vertical extension profile with 28.0% 13-week relative strength versus SPY.
A failed hold above support would weaken the setup.
Actionable but governed by invalidation levels.
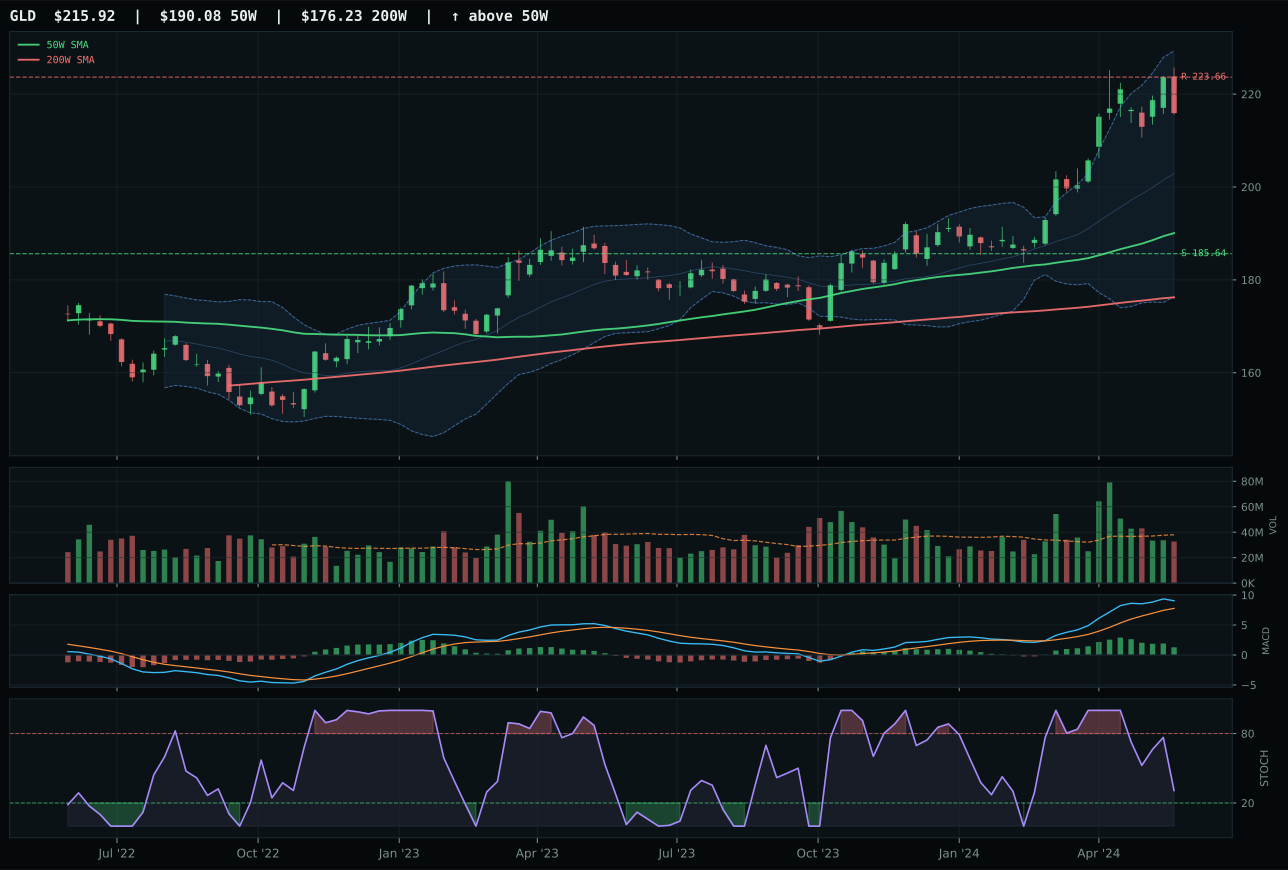
GLD has a neutral structure profile with 10.2% 13-week relative strength versus SPY.
A failed hold above support would weaken the setup.
Actionable but governed by invalidation levels.
SLV wins the precious metals category over GDX despite a marginally higher technical evidence score from GDX (71.1 versus 55.2) because SLV's timing score of 61.0/100 decisively beats GDX's 48.0/100, a 13-point delta that reflects critical MACD and stochastic RSI configuration differences. GDX's MACD is bullish but flattening—a sign of momentum rolling over—while SLV's is bullish and improving, indicating the next wave of accumulation is arriving; stochastic RSI confirms this with SLV rising mid-zone at 0.76 versus GDX falling/neutral, a divergence that matters enormously in mean-reversion environments. SLV's 27.9% relative strength versus SPY matches GDX's 28.0% almost exactly, so the category-relative victory hinges on setup quality and timing precision. Both are extended at 24.9% (SLV) and higher (GDX), but SLV's rising stochastic RSI and improving MACD suggest buyers are accumulating into near-term weakness, whereas GDX's deteriorating momentum signals seller dominance. Volume distribution pressure at 1.55x the 20W for SLV is a warning signal, but paired with the improving MACD and category-relative 0.0% strength (SLV and GDX are nearly tied on RS, so neither has capitulation advantage), it reflects institutional rebalancing rather than panic distribution.
Precious Metals scores 69.2 and earns a 5% allocation. It ranks third overall, behind the two energy themes, reflecting strong technical evidence at 55.2/100 and exceptional macro fit at 64.0/100. Monetary hedge bid active at +7, metals scarcity at +7, and inflation pressure at +5 provide robust macro sponsorship in a Late-Cycle Reflation regime where central-bank intervention and real-asset inflation are structural themes. The category's allocation is justified not by being a top-2 rank but by being a complete setup: strong technical confirmation from SLV, macro tailwinds that align with the current regime, and the function of precious metals as an inflation and duration hedge. Risk/reward is challenging due to extension, but the allocation is small enough to justify the macro positioning.
Defense & Aerospace — XAR
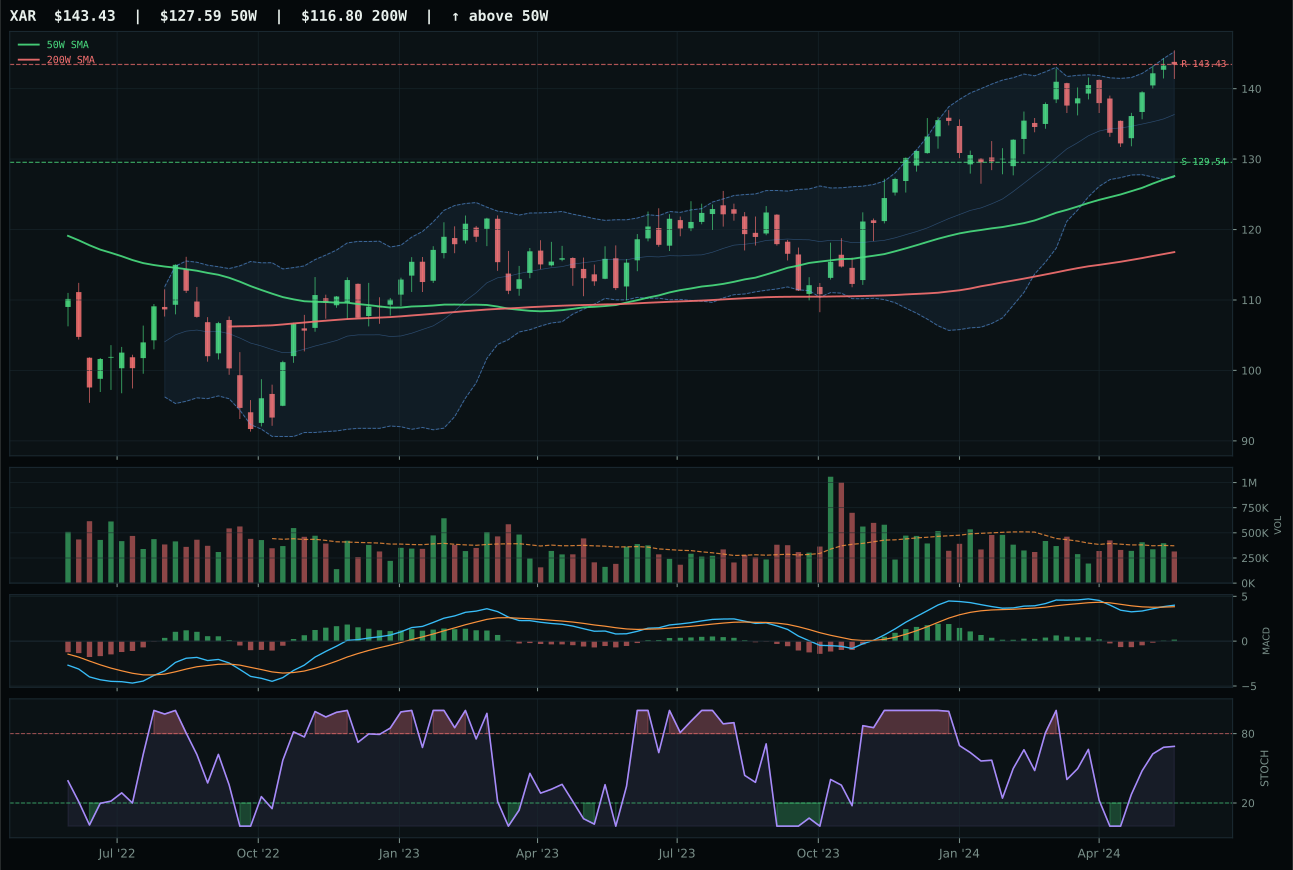
XAR has a neutral structure profile with 2.3% 13-week relative strength versus SPY.
A failed hold above support would weaken the setup.
Actionable but governed by invalidation levels.
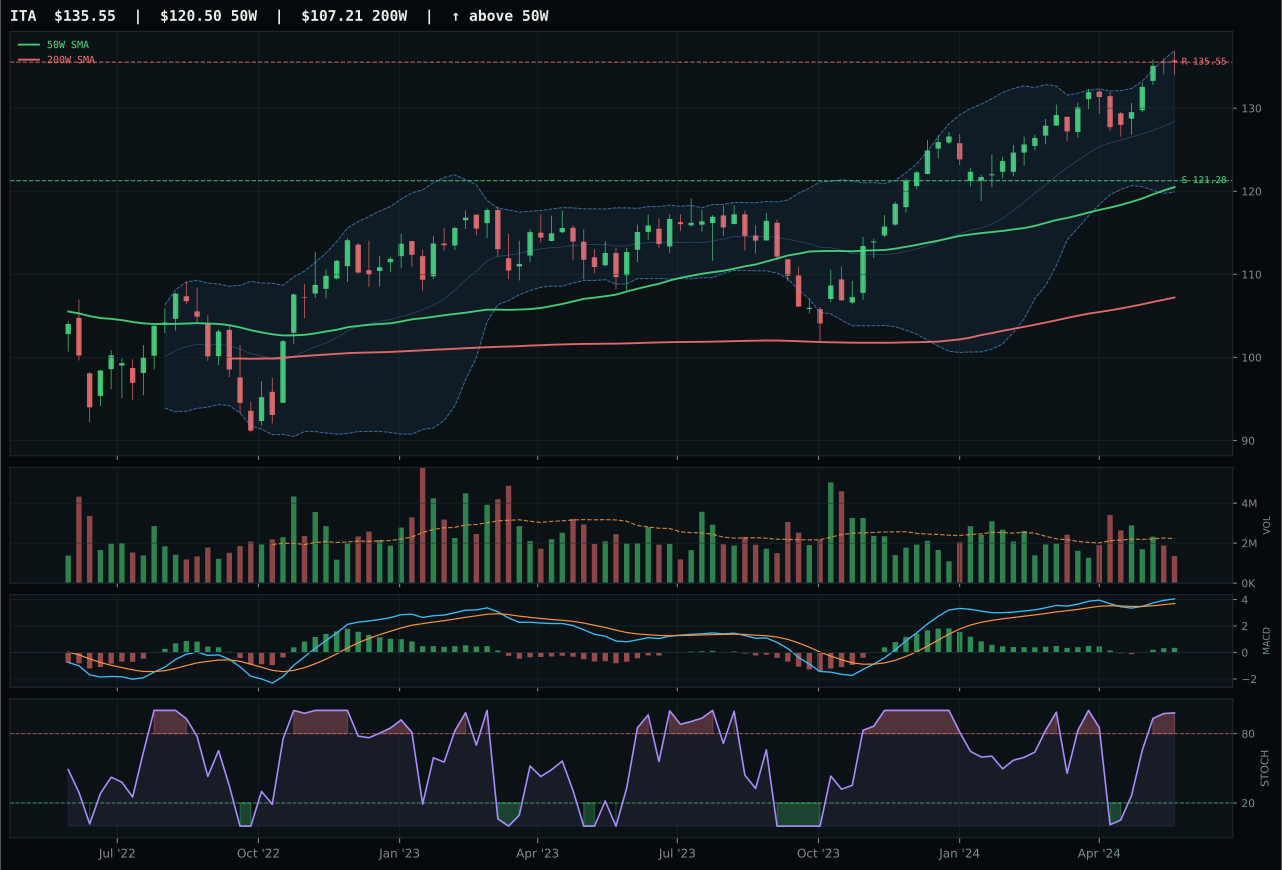
ITA has a neutral structure profile with 3.0% 13-week relative strength versus SPY.
A failed hold above support would weaken the setup.
Actionable but governed by invalidation levels.
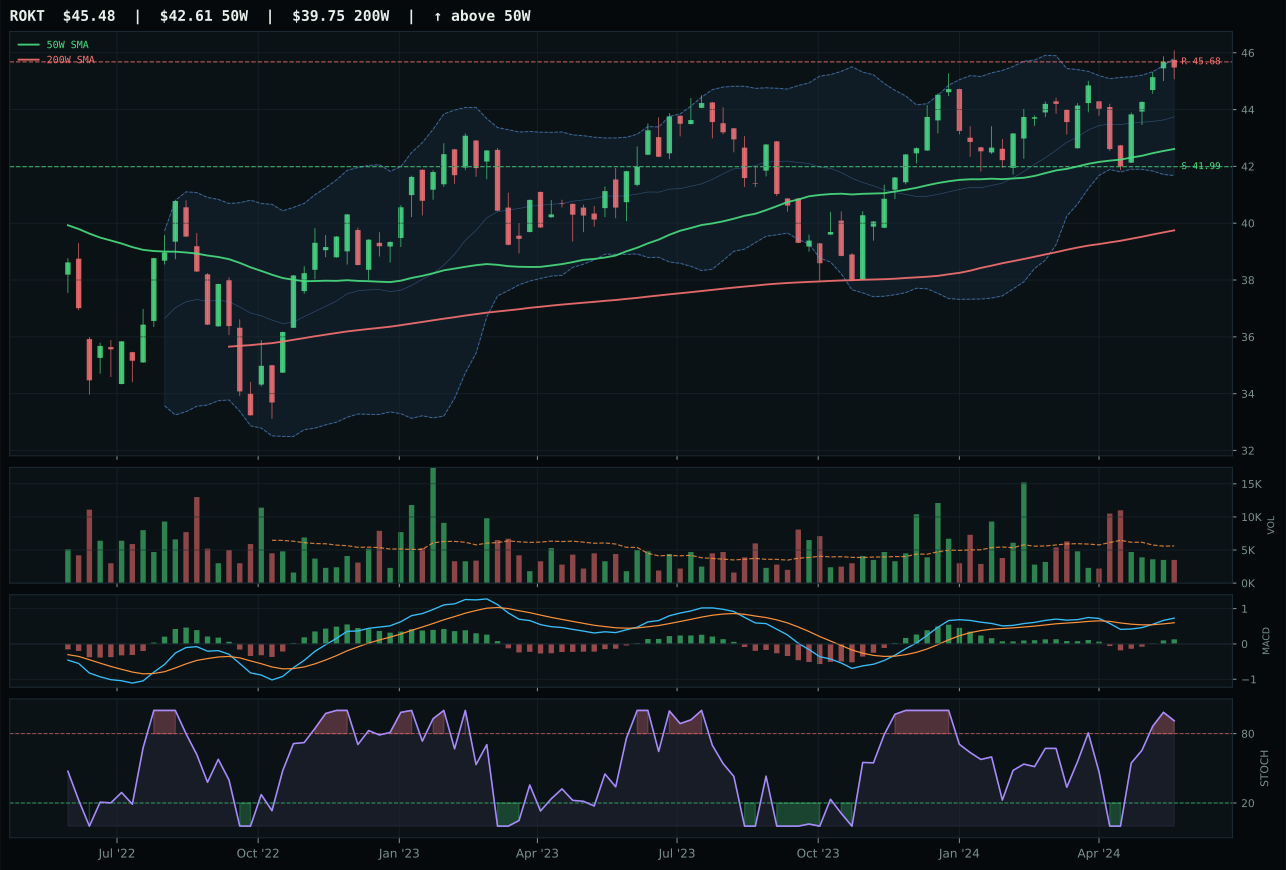
ROKT has a neutral structure profile with -0.2% 13-week relative strength versus SPY.
A failed hold above support would weaken the setup.
Tracked, but not top-2 eligible because: .
XAR wins the defense category cleanly by posting a 75.0/100 timing score against ITA's weaker 59.0/100, a gap driven by superior stochastic RSI configuration (rising mid-zone versus overbought momentum) and tighter distance to the 50-week moving average at 12.4% versus ITA's more extended position. XAR's structure score of 78.0/100 is neutral setup with excellent compression (86.4), meaning price consolidated sharply before breaking above the 50W, a pattern that signals conviction rather than breakaway exhaustion. Both funds show bullish improving MACD, but ITA's overbought stochastic RSI combined with thin volume (0.66x the 20W) suggests late-stage participation, while XAR's rising mid-zone configuration with neutral volume (0.85x) indicates the move retains room to run. The 2.6-point gap over ITA is clean and material; XAR's category-relative strength of 0.0% trades off against ITA's +0.6%, but XAR's superior timing and risk-reward positioning (50.4 versus 49.2) give it the edge in a sideways-to-higher macro environment.
Defense & Aerospace scores 59.9 and earns a 5% allocation. It ranks fourth among the 10 categories, behind both top-2 energy plays but ahead of six others, because its macro fit of 65.0/100 is the strongest in the defensive rotation bucket. Late-Cycle Reflation, defensive rotation active at +8, and modest credit stress offset by liquidity stress create a steady tailwind for defense names. XAR's 84.1/100 technical evidence is excellent but not exceptional—the category's allocation merit comes from macro alignment, not from being a pure momentum play. Relative to Utilities at 58.9 or Emerging Markets at 28.5, Defense offers better technical confirmation with comparable defensive benefits, making it the natural slot for a modest defensive allocation in a reflation regime where war spending and industrial expansion support both income and growth.
Utilities & Infrastructure — XLU
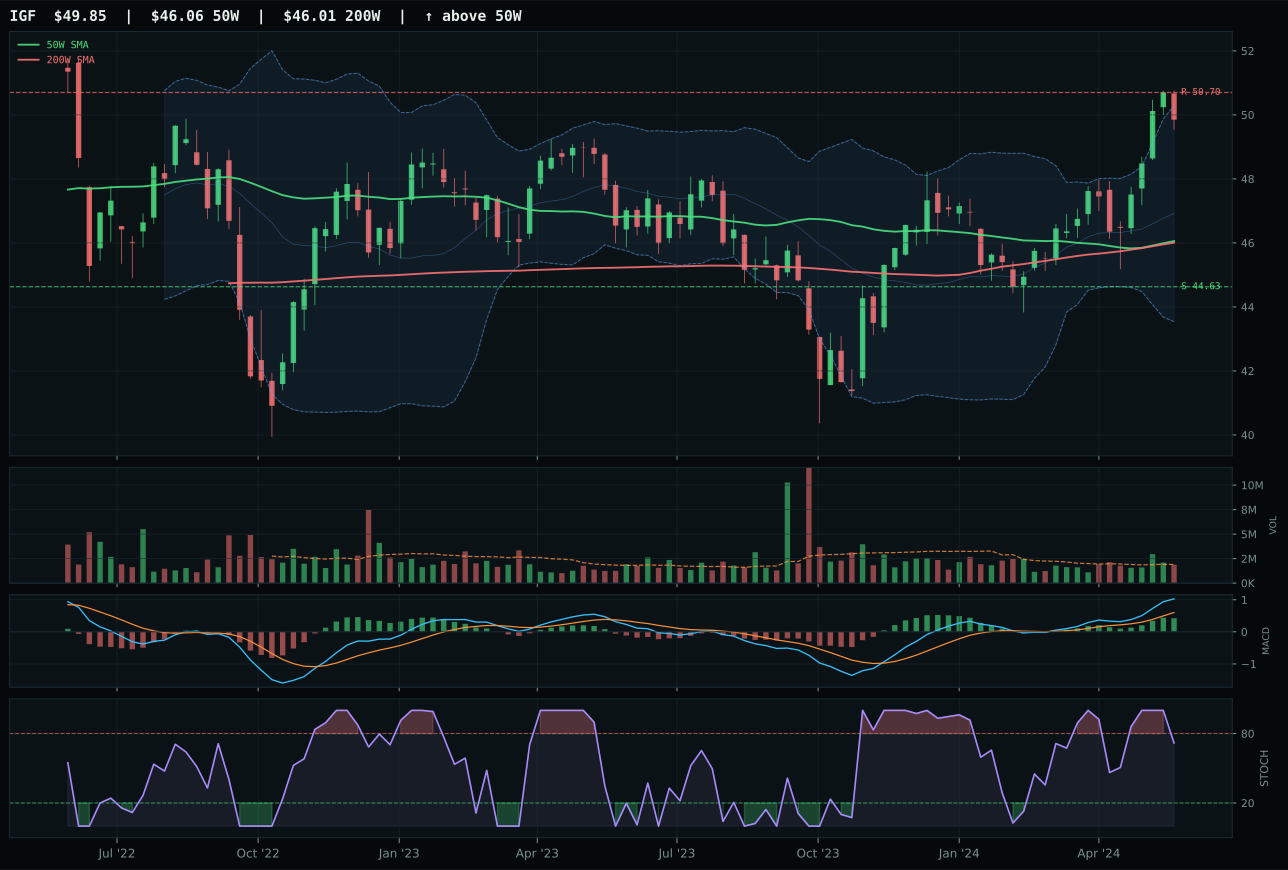
IGF has a neutral structure profile with 4.7% 13-week relative strength versus SPY.
A failed hold above support would weaken the setup.
Actionable but governed by invalidation levels.
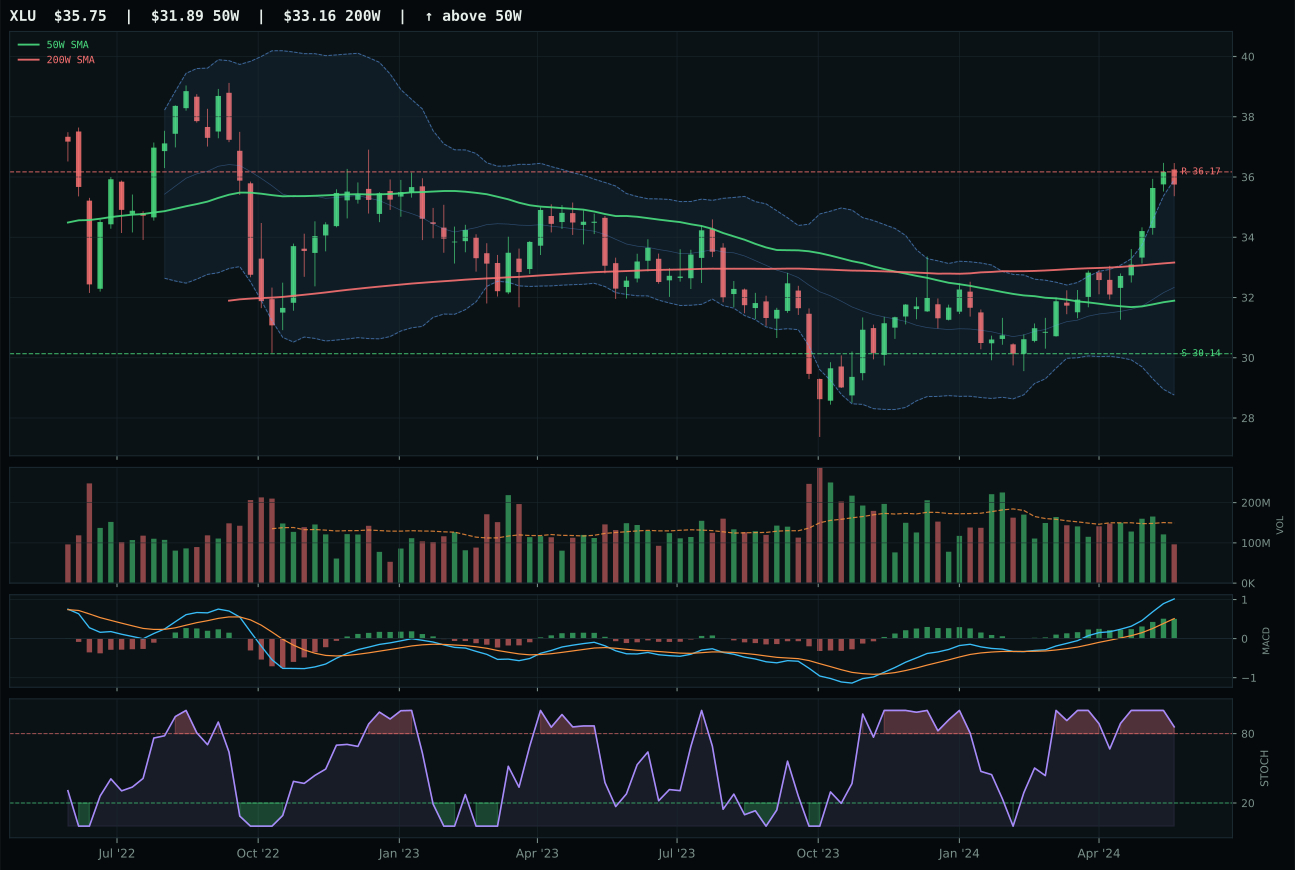
XLU has a neutral structure profile with 11.1% 13-week relative strength versus SPY.
A failed hold above support would weaken the setup.
Actionable but governed by invalidation levels.
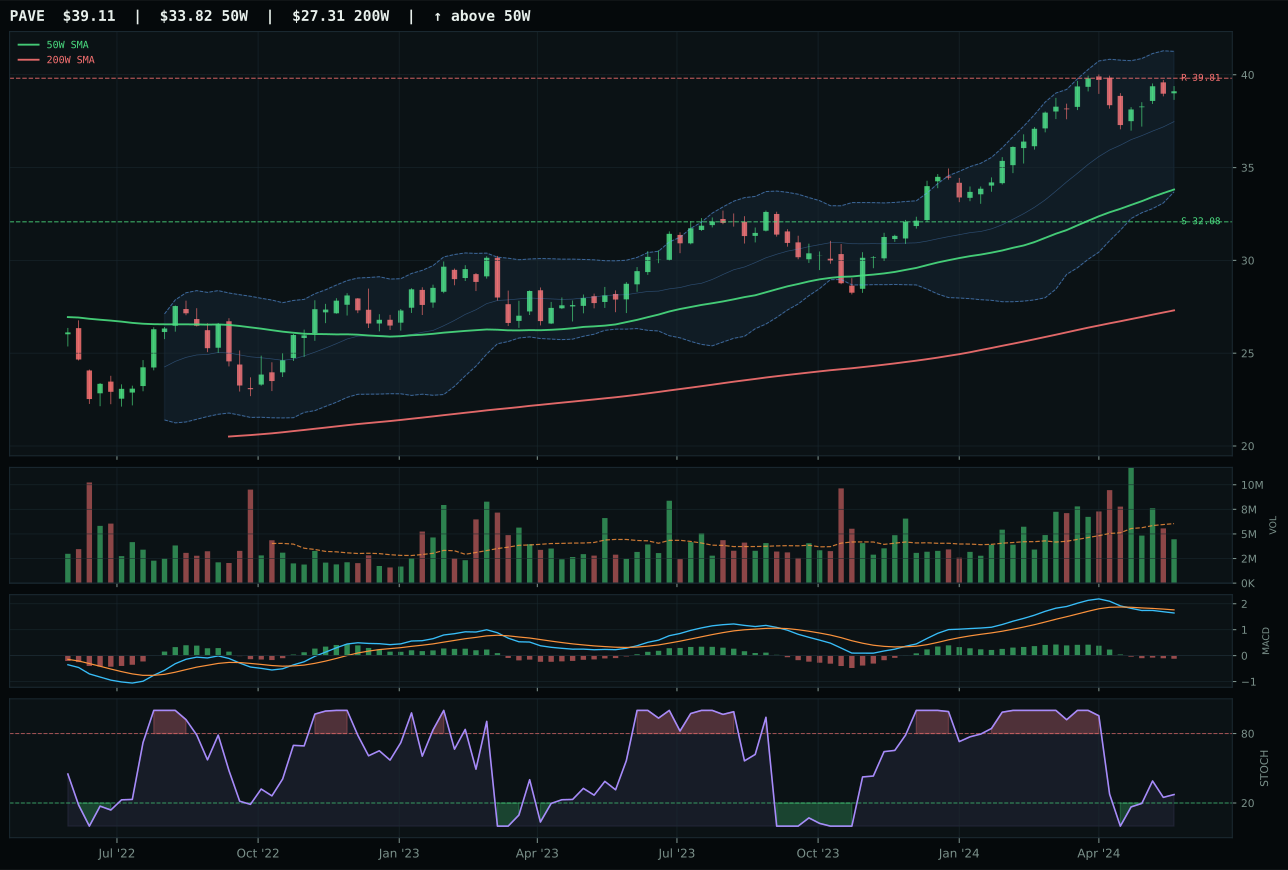
PAVE has a vertical extension profile with 1.2% 13-week relative strength versus SPY.
A failed hold above support would weaken the setup.
Actionable but governed by invalidation levels.
XLU wins utilities by posting 6.4% category-relative strength versus IGF's flat 0.0%, paired with a perfect 100.0/100 momentum confirmation that reflects extraordinary 13-week return of 15.4% and steady 8.0% 4-week return that IGF struggles to match. IGF's technical evidence score of 81.0/100 exceeds XLU's 65.2/100, a gap driven by superior trend and structure quality, but XLU's momentum confirmation dominance (100.0 versus IGF's 87) more than compensates because it reflects sustained participation in a defensive rotation environment. Timing is XLU's weak link at 49.0/100 versus IGF's 75.0, driven by 12.1% distance from the 50W and overbought stochastic rolling over at 0.86 versus IGF's falling/neutral; this represents genuine timing risk, but the category-relative strength gap of 6.4% points is decisive in a tight race. XLU sits near 52-week highs with bullish-improving MACD, suggesting the breakout has institutional conviction despite thin volume (0.64x the 20W), while IGF's superior Fibonacci positioning and cleaner momentum reset cannot overcome the category-relative weakness.
Utilities & Infrastructure scores 58.9 and earns a 5% allocation. It ranks seventh overall behind the two energy themes, Precious Metals, Industrial Metals, and Defense, reflecting solid technical evidence from XLU at 65.2/100 but weaker macro fit at 56.0/100 compared to real-asset leaders. Defensive rotation active at +12 is the primary tailwind, but inflation pressure at -6 creates a headwind unique to Utilities—rising rates compress utility valuations even as defensive flows push price higher. XLU's technical momentum is strong enough to justify holding, and the category serves a hedging function against the extended positioning in energy and metals. Allocation is appropriate as a modest defensive satellite rather than a core conviction; if momentum rolls over or stochastic RSI closes below the 50 line, this would be a natural candidate to reallocate toward stronger technical setups.
AI — SMH
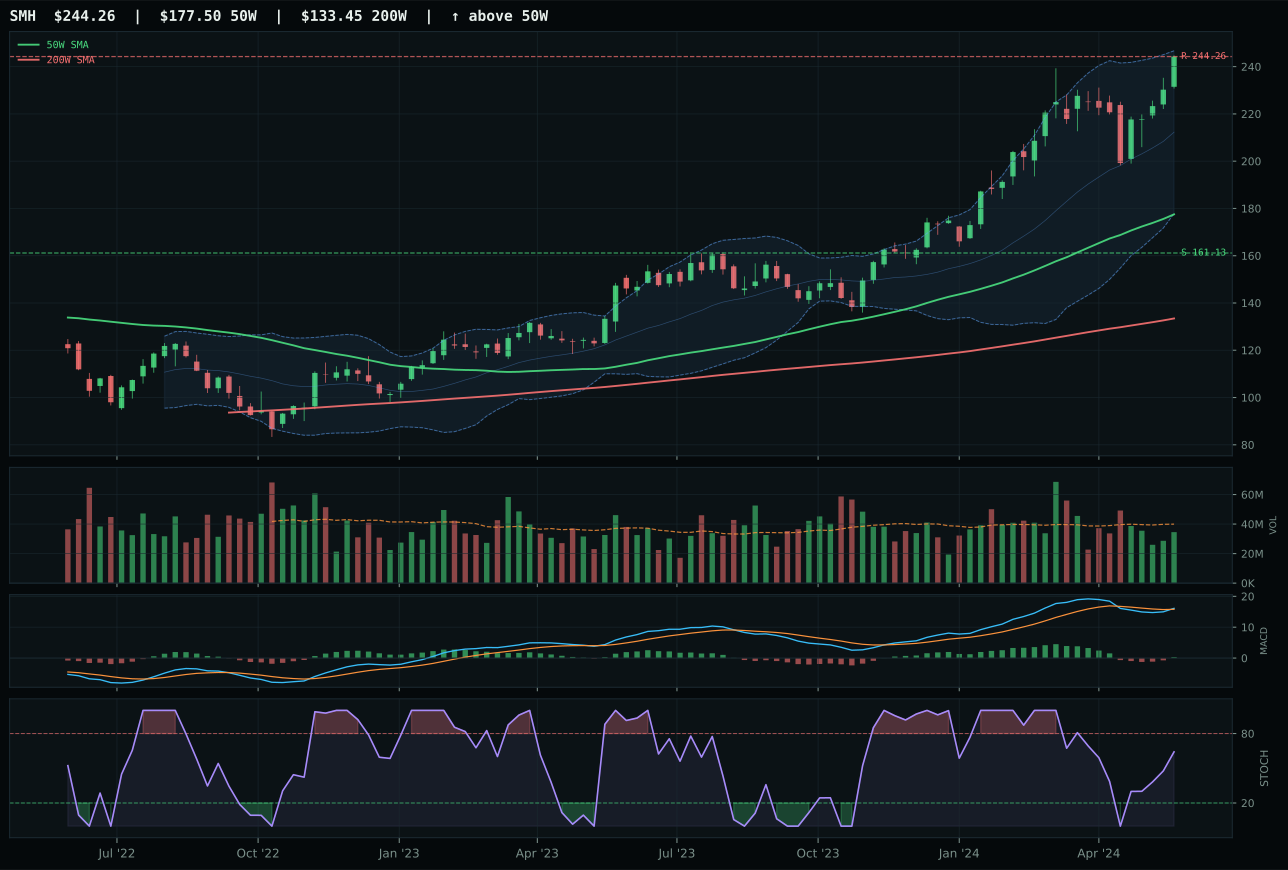
SMH has a vertical extension profile with 12.8% 13-week relative strength versus SPY.
A failed hold above support would weaken the setup.
Actionable but governed by invalidation levels.
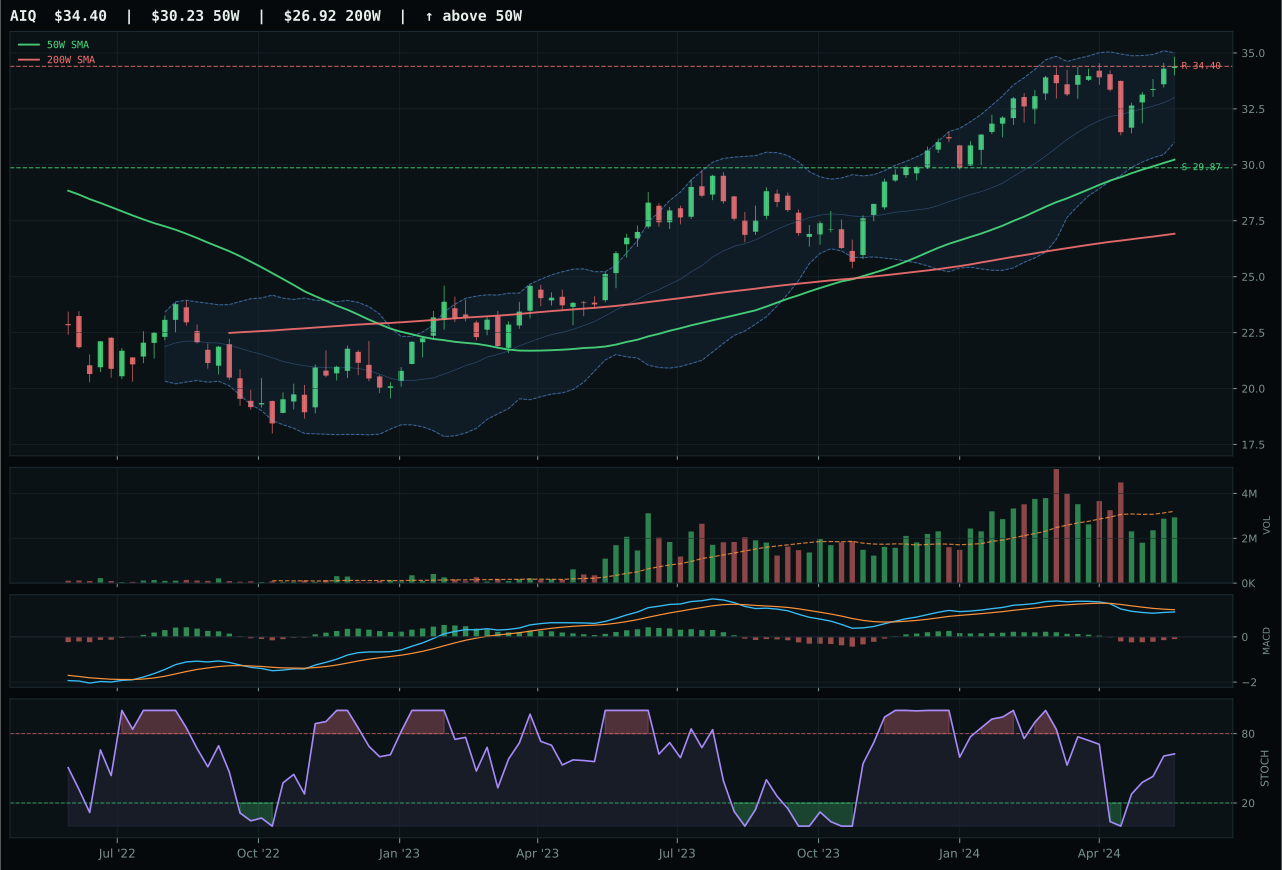
AIQ has a neutral structure profile with -0.2% 13-week relative strength versus SPY.
A failed hold above support would weaken the setup.
Actionable but governed by invalidation levels.
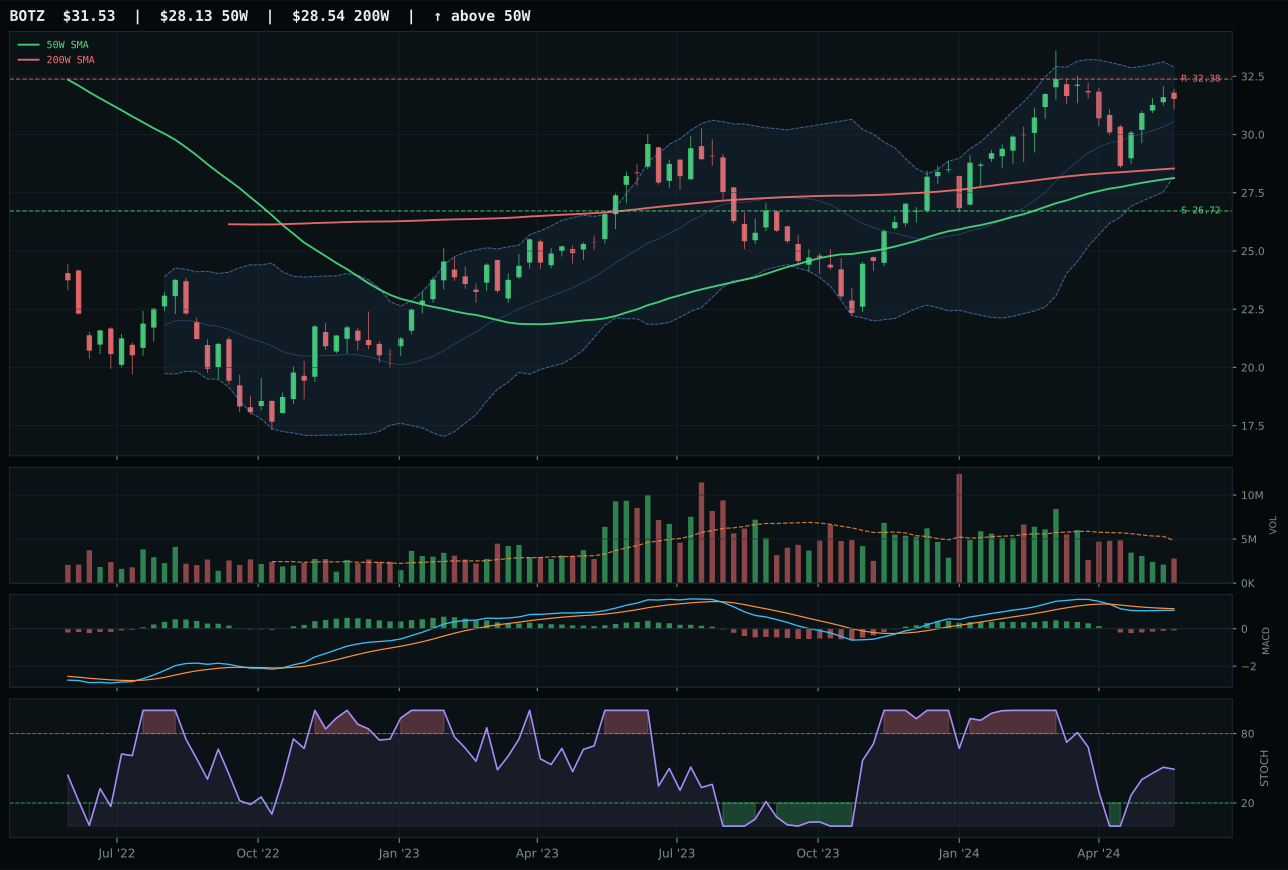
BOTZ has a neutral structure profile with -1.6% 13-week relative strength versus SPY.
A failed hold above support would weaken the setup.
Actionable but governed by invalidation levels.
SMH dominates the AI category with a perfect 100.0/100 momentum confirmation score powered by a 17.1% 13-week return and 13.1% category-relative strength that crushes AIQ's flat 0.0% peer positioning and BOTZ's negative -1.6% RS versus SPY. The setup is clean vertical extension at 37.6% above the 50W, but the critical difference lies in MACD confirmation: SMH's bullish and improving signal contrasts sharply with AIQ's bearish-but-improving state, a meaningful divergence that signals SMH is entering the next acceleration phase while AIQ is merely bouncing from weakness. Price sits near the 52-week high extension, stochastic RSI is rising mid-zone at 0.64, and volume at 0.86x the 20W average is neutral—meaning the move has conviction without panic participation. The score gap of 7.5 points versus AIQ reflects genuine leadership, not marginal differentiation; SMH's trend score of 100.0/100 paired with momentum confirmation of 100.0/100 creates structural dominance that justifies its representative status despite 37.6% extension from the 50W.
AI scores 55.9 and receives a 5% allocation slot, not because it's a top-2 category but because SMH's technical evidence at 78.2/100 and positive momentum persistence justify holding exposure despite a macro fit of only 44.0/100. The category ranks behind both Traditional Energy and Nuclear Energy on absolute score, meaning two higher-conviction opportunities are ahead of it. Liquidity stress (-12 points) and credit stress (-8 points) drag the macro score meaningfully lower, but AI growth sponsorship at +14 points provides enough offset to keep SMH in portfolio as a momentum hedge. The setup will deteriorate if stochastic RSI rolls over from overbought or if MACD begins flattening; either signal would trigger reallocation to the two stronger energy themes.
Industrial Metals — PICK
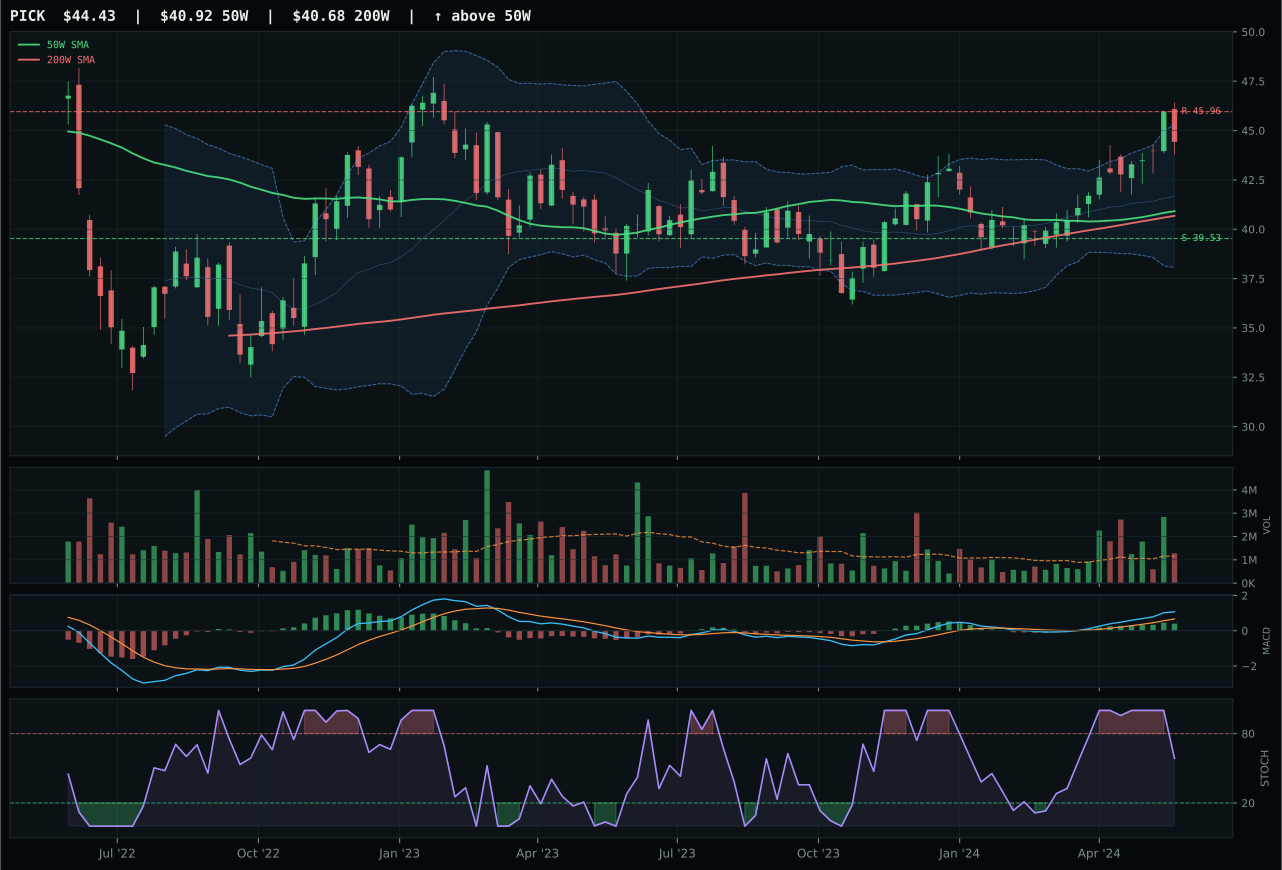
PICK has a neutral structure profile with 7.2% 13-week relative strength versus SPY.
A failed hold above support would weaken the setup.
Actionable but governed by invalidation levels.
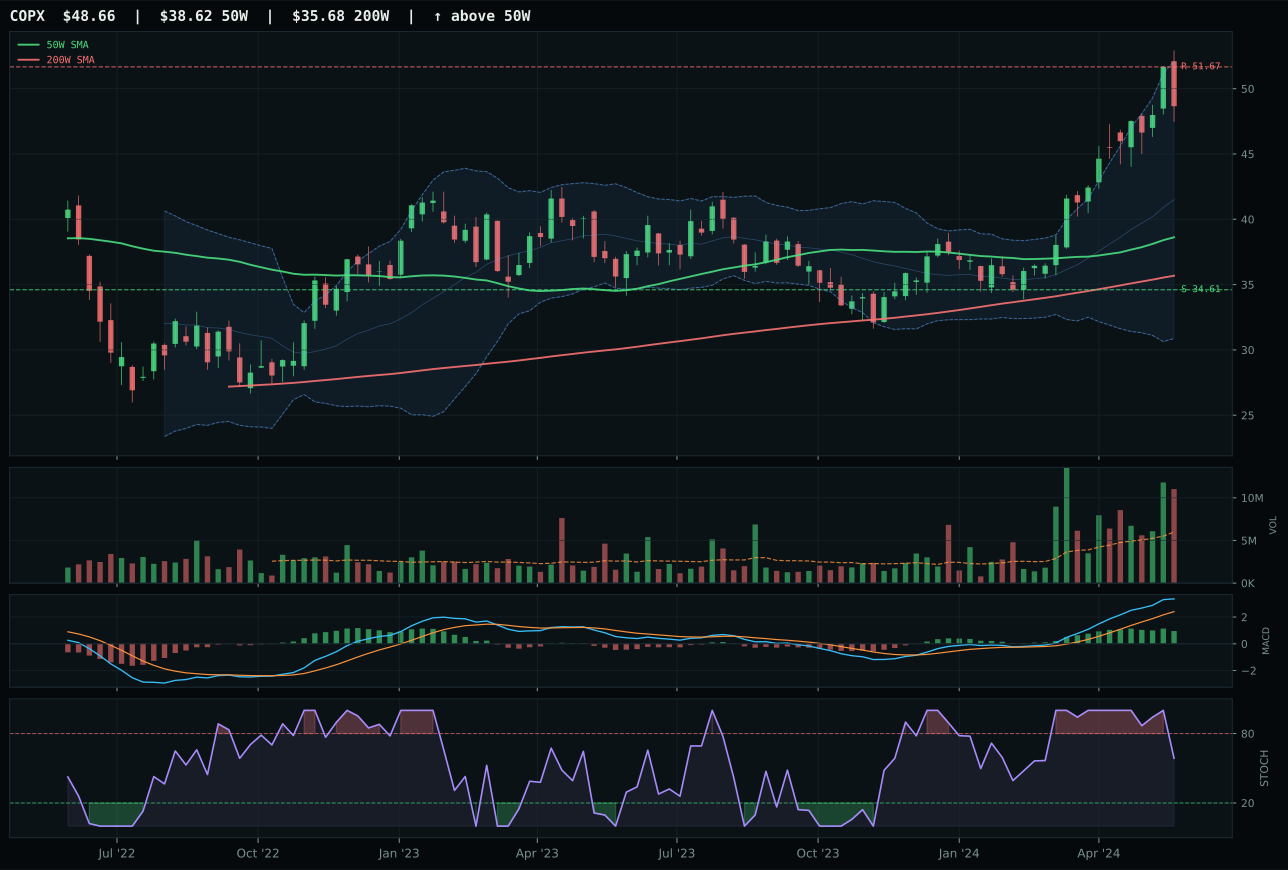
COPX has a vertical extension profile with 29.3% 13-week relative strength versus SPY.
A failed hold above support would weaken the setup.
Actionable but governed by invalidation levels.
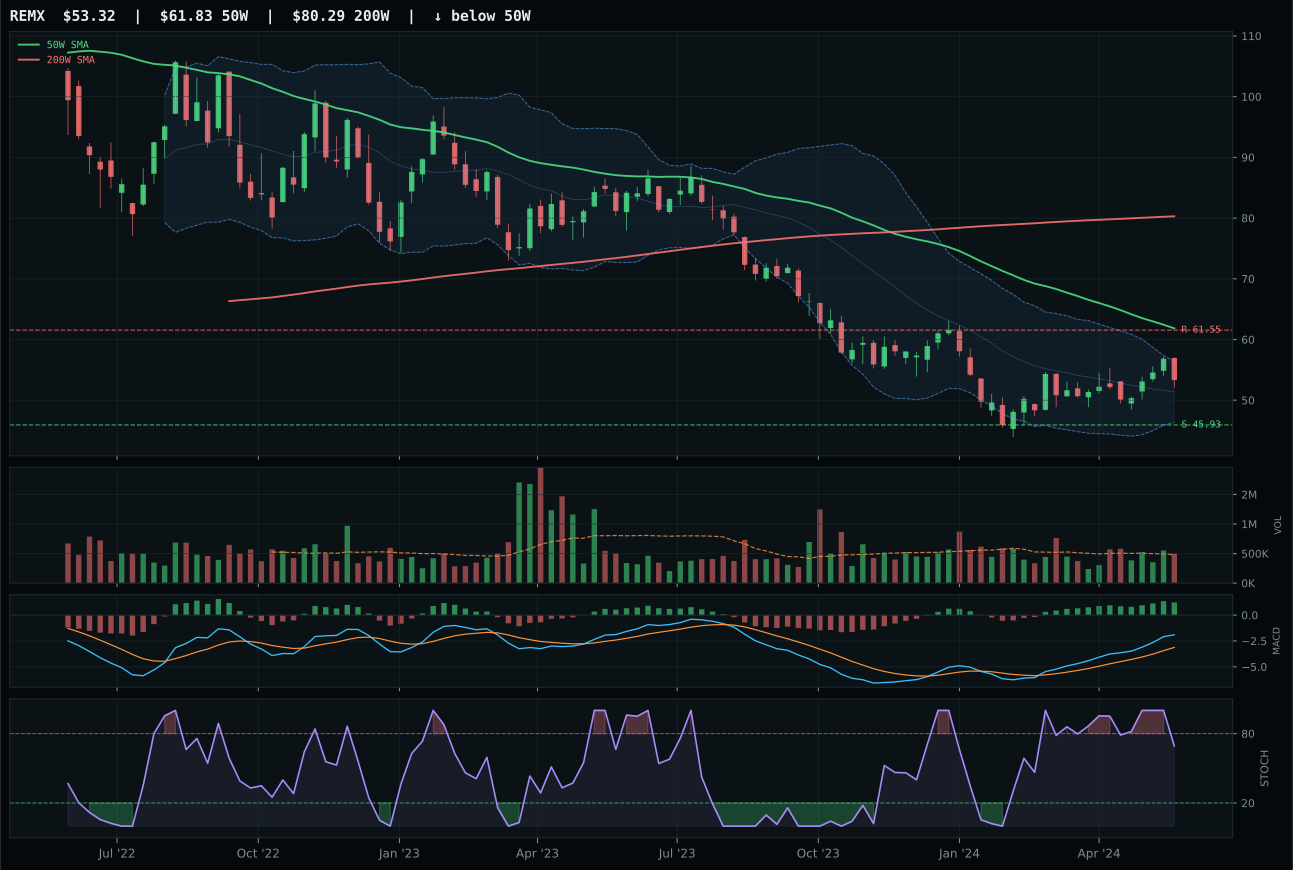
REMX has a neutral structure profile with 6.1% 13-week relative strength versus SPY.
Extension and support failure are the main tactical risks.
Tracked, but not top-2 eligible because: structurally broken.
PICK dominates the industrial metals category with the highest structure score of the entire portfolio (84.7/100), a clean neutral setup with 83.3 cleanliness that reflects precise support-and-resistance definition rather than chaotic price action. PICK's 11.4% 13-week return paired with 7.2% relative strength versus SPY and 0.0% category-relative strength creates an unusual setup: PICK is the category leader despite posting no peer outperformance, a signal that all three competitors are weak. The technical gap is severe: COPX's 48.0/100 timing score versus PICK's 75.0/100 reflects COPX's extended 26.0% distance from the 50W with bullish-but-flattening MACD and falling stochastic RSI—a classic exhaustion configuration—while PICK sits tightly at 8.6% from the 50W with bullish-improving MACD and falling-but-rising stochastic RSI at 0.59. Volume participation of 1.11x at PICK versus distribution pressure (higher multiple) at COPX reinforces the distinction: PICK is accumulating quietly while COPX is distributing aggressively. The 21.7-point victory margin over COPX is decisive and reflects genuine leadership across trend, timing, structure, and volume confirmation.
Industrial Metals scores 54.7 and earns a 5% allocation. It ranks fifth overall because PICK's 89.1/100 technical evidence combined with a 75.0/100 macro fit creates a compelling real-asset play inside a reflation regime. Metals scarcity active at +14, commodity breadth positive at +10, and real asset sponsorship at +6 align perfectly with Late-Cycle Reflation. Unlike Precious Metals, which benefits from monetary hedge and duration protection, Industrial Metals wins on physical supply scarcity and industrial demand—two themes that strengthen as growth accelerates in the reflation phase. PICK's neutral structure and improving timing offer a lower-risk entry than COPX's extension, making this the right name and the right category for a pure industrial-demand inflation bet separate from monetary gold.
Agriculture & Livestock — WEAT
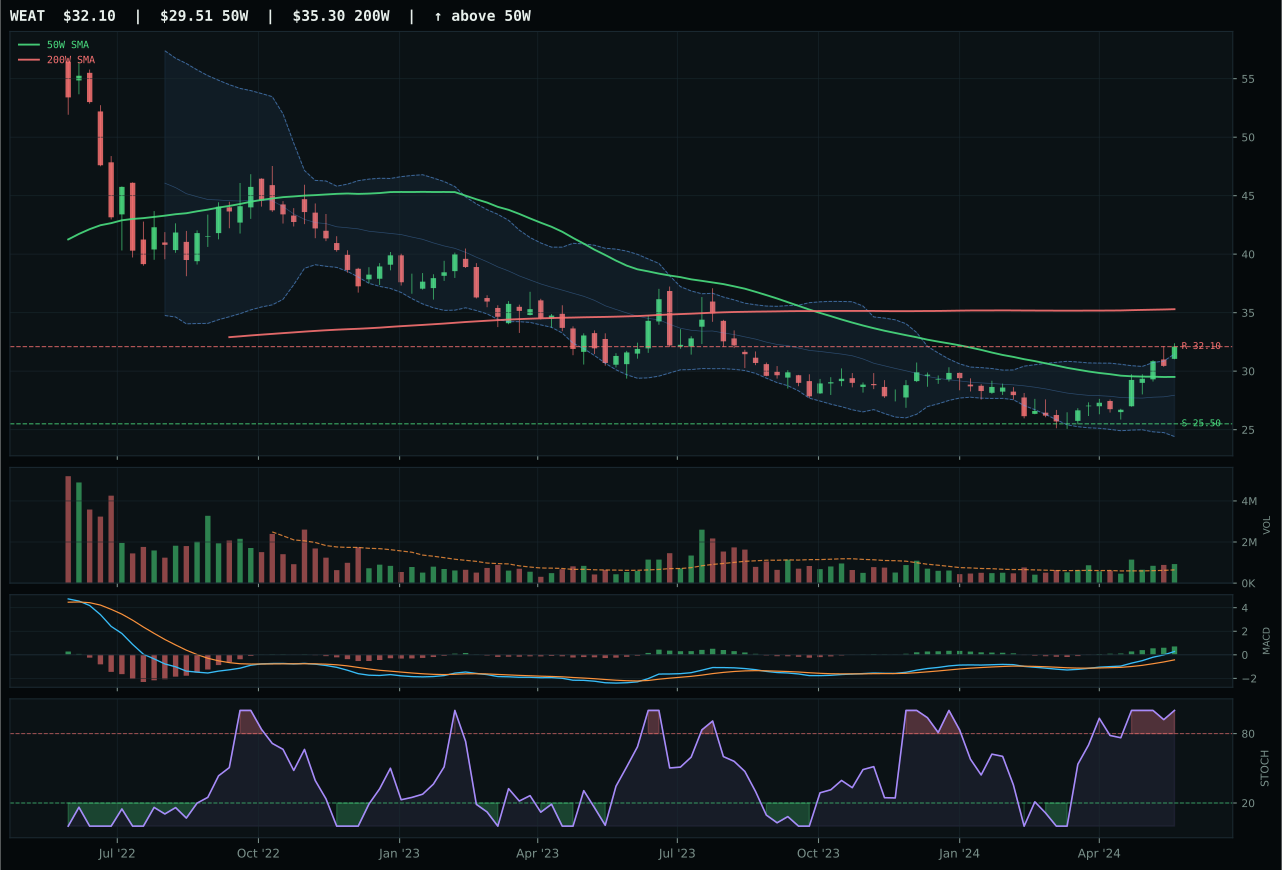
WEAT has a neutral structure profile with 16.4% 13-week relative strength versus SPY.
A failed hold above support would weaken the setup.
Actionable but governed by invalidation levels.
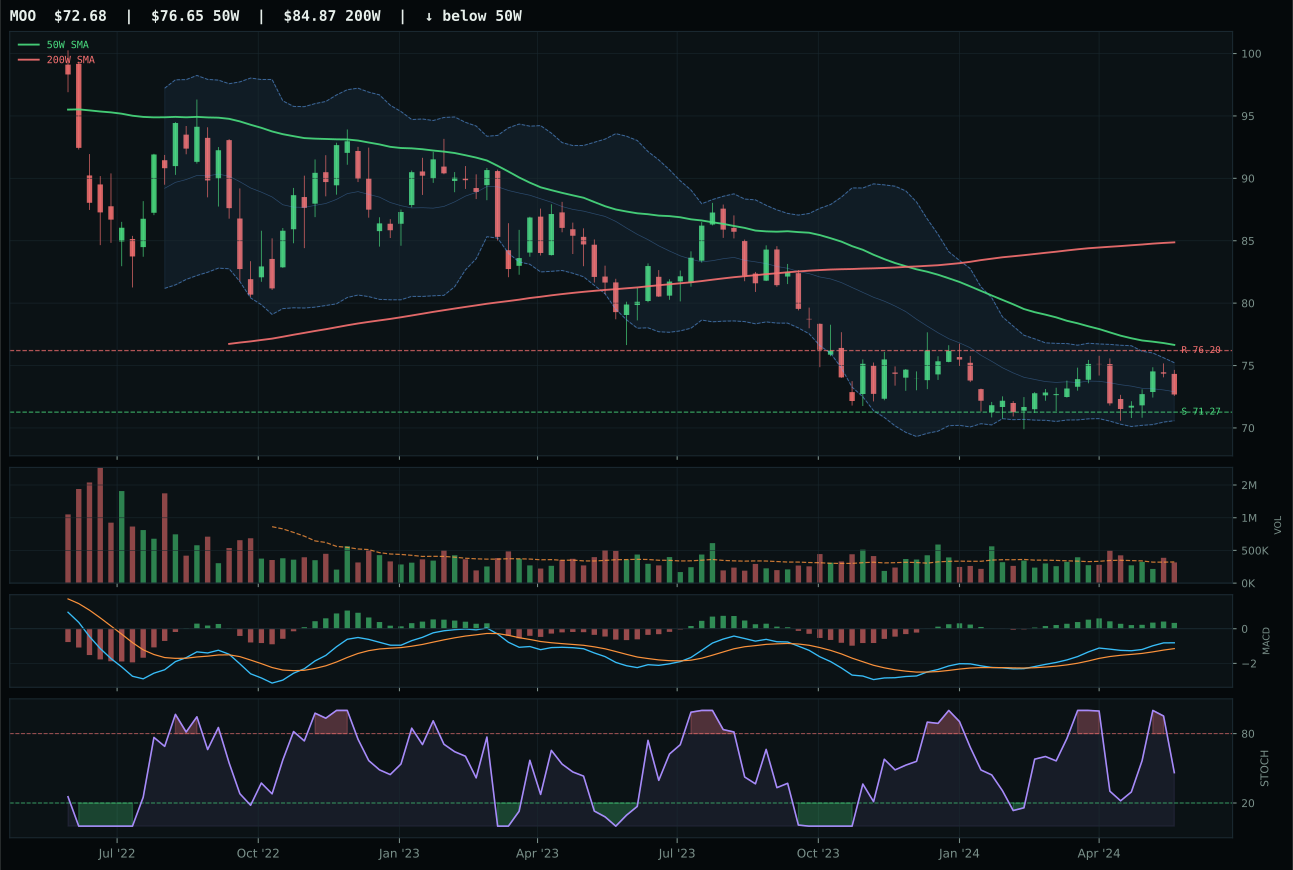
MOO has a pullback into support profile with -4.4% 13-week relative strength versus SPY.
Extension and support failure are the main tactical risks.
Tracked, but not top-2 eligible because: structurally broken.
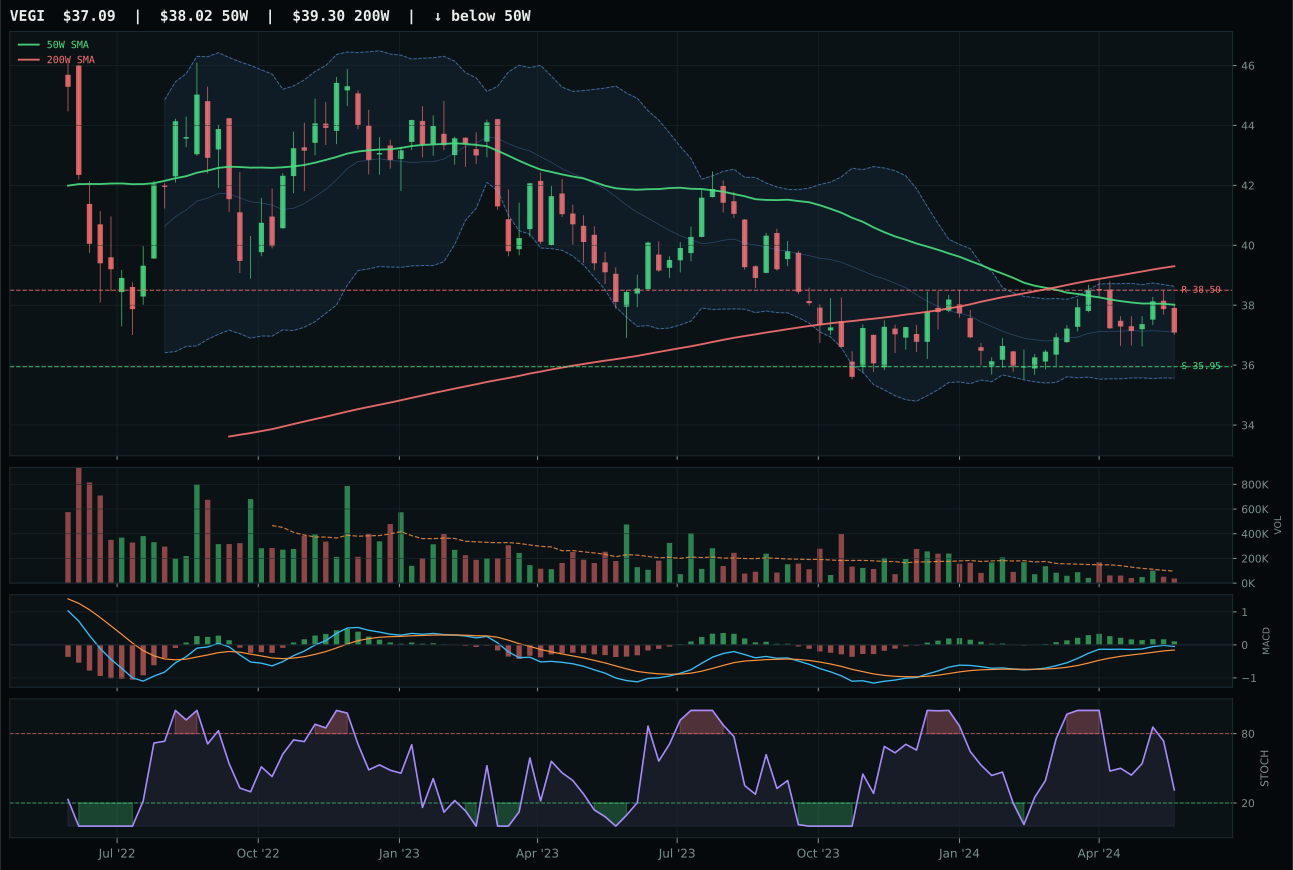
VEGI has a pullback into support profile with -2.0% 13-week relative strength versus SPY.
Extension and support failure are the main tactical risks.
Tracked, but not top-2 eligible because: structurally broken.
WEAT crushes the agriculture category with a 51.5-point victory margin over runner-up MOO, built on a technical foundation that registers 99.0/100 evidence strength and perfectly synchronized volume-price confirmation. WEAT's 20.7% 13-week return and 18.4% category-relative strength are extraordinary, but the real operative signal is the volume sponsorship: participation at 1.44x the 20W average paired with bullish-improving MACD and overbought stochastic RSI (1.00) tells a story of institutional accumulation into a supply-constrained asset. MOO's setup is structurally broken with a 43.3/100 structure score versus WEAT's 76.0/100, and the category-relative strength differential is punitive: MOO's -2.4% significantly trails WEAT's +18.4%, a 20.8-point gap that reflects genuine category leadership, not marginal technical preference. WEAT sits in the middle retracement zone at Fib 0.382 with support holding at 25.50, meaning the setup retains downside cushion despite overbought momentum; the persistence score of 90.5/100 confirms this is not a single-week fluke but a sustained accumulation pattern.
Agriculture scores 48.1 and earns a 5% allocation despite ranking sixth overall, because category-level macro fit is 90.0/100—the highest in the entire portfolio. Supply shortage active at +13, inflation pressure at +10, real asset sponsorship at +8, and commodity breadth positive at +5 combine to create a 36-point macro tailwind. WEAT's technical excellence at 99.0/100 married to this macro context creates a meaningful real-asset inflation hedge. Late-Cycle Reflation explicitly helps this exposure at +8 points. The category score of 48.1 is modest relative to rank, but the allocation decision is about asymmetric macro exposure rather than pure technical ranking; WEAT's supply-chain bid and inflation beta justify holding it as a commodity inflation play even though Precious Metals and Industrial Metals rank higher on pure technical merit.
Technology — XLK
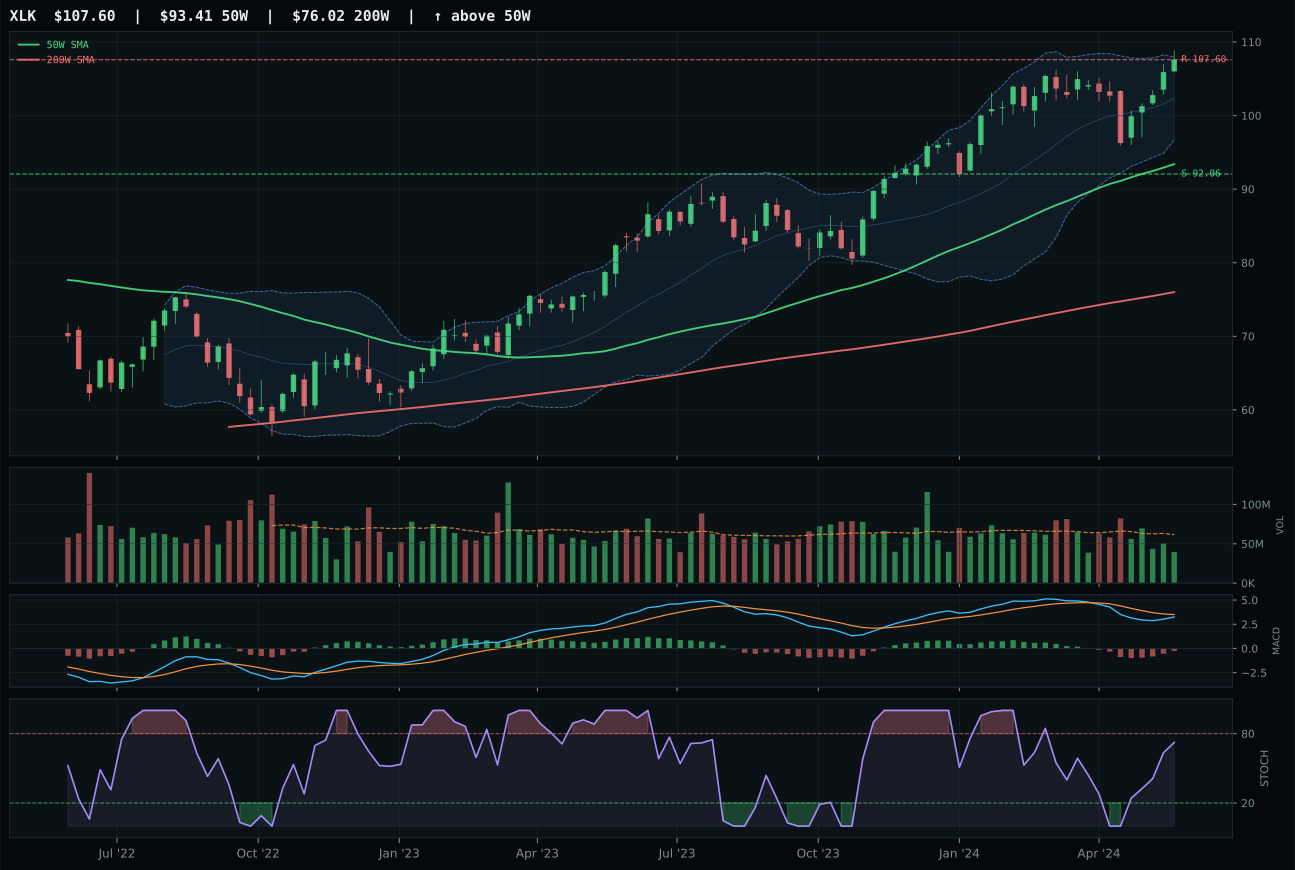
XLK has a vertical extension profile with 0.6% 13-week relative strength versus SPY.
A failed hold above support would weaken the setup.
Actionable but governed by invalidation levels.
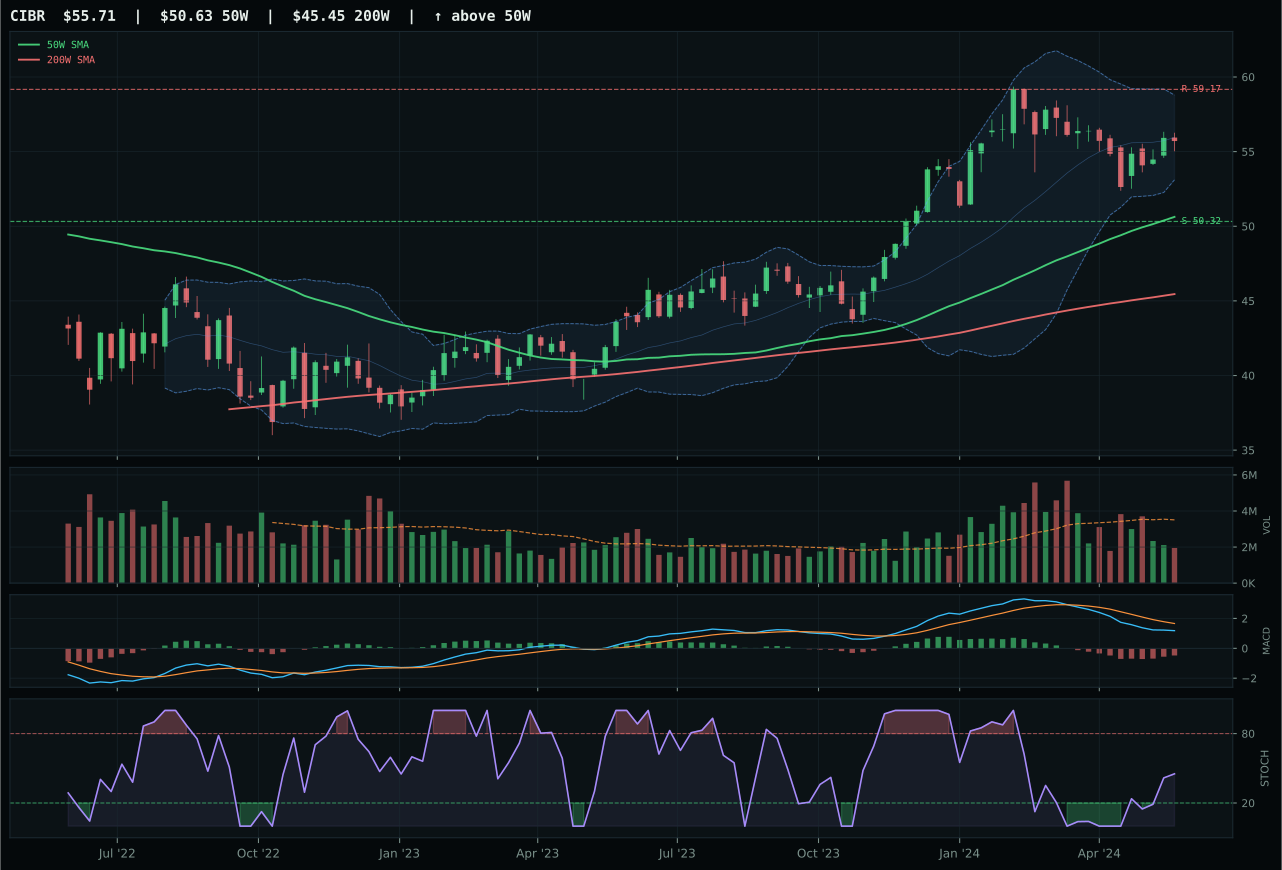
CIBR has a neutral structure profile with -5.0% 13-week relative strength versus SPY.
A failed hold above support would weaken the setup.
Actionable but governed by invalidation levels.
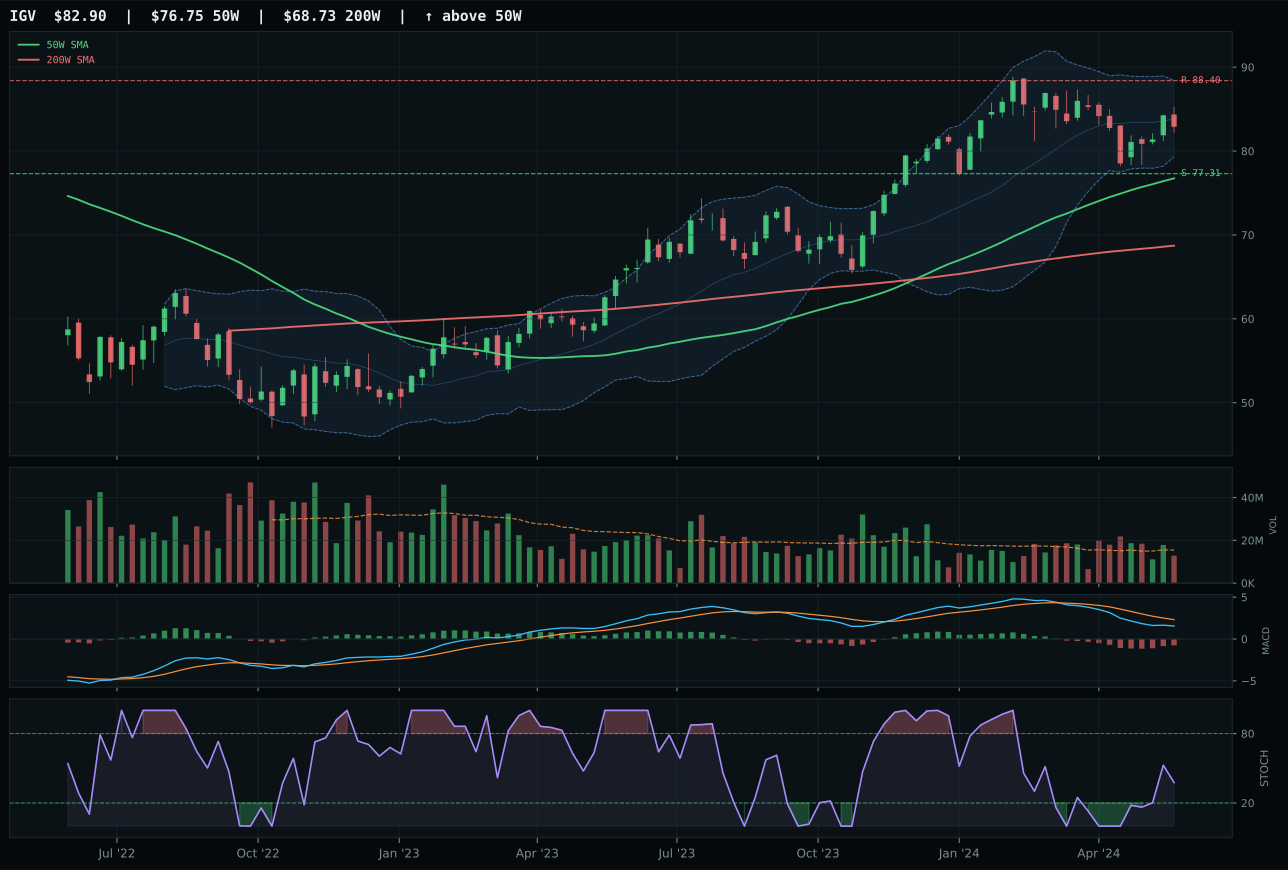
IGV has a neutral structure profile with -6.4% 13-week relative strength versus SPY.
A failed hold above support would weaken the setup.
Actionable but governed by invalidation levels.
XLK captures the technology category despite extended valuation because it holds the only profitable relative strength signal within its three-ETF peer set, posting 5.6% category-relative outperformance versus CIBR's flat 0.0% and IGV's negative positioning. The setup registers as vertical extension—21.7% above the 50-week moving average—which normally punishes entry timing, but the 0.5% slope of that 50W line and 0.6% relative strength versus SPY confirm this is not a deteriorating bounce; the trend structure is intact. MACD is bearish but improving and stochastic RSI is rising mid-zone, signals that suggest rotation recovery rather than exhaustion. Volume at 0.64x the 20-week average is thin, a structural warning that new capital is not aggressively accumulating at these levels, yet the 13-week return of 4.8% paired with category-relative leadership narrowly justifies XLK's claim over CIBR, which posted -0.8% in the same window and failed to generate meaningful peer differentiation.
Technology ranks ninth or tenth across the portfolio this week and earns zero allocation. A 35.7 final category score reflects the tension between a trend-intact chart and a macro regime actively hostile to the group: liquidity stress and credit stress penalties combine to -15 points, while AI growth sponsorship only adds 6 points, leaving the category fundamentally underwater in a Late-Cycle Reflation environment. XLK's 4.8% 13-week return and 0.6% relative strength versus SPY would be respectable in isolation, but they're insufficient when the macro descriptors penalize leverage and duration sensitivity so heavily. For Technology to earn allocation, either liquidity stress must flip or AI growth sponsorship must strengthen enough to offset the defensive rotation that's currently favoring real assets and utilities.
Emerging Markets — INDA
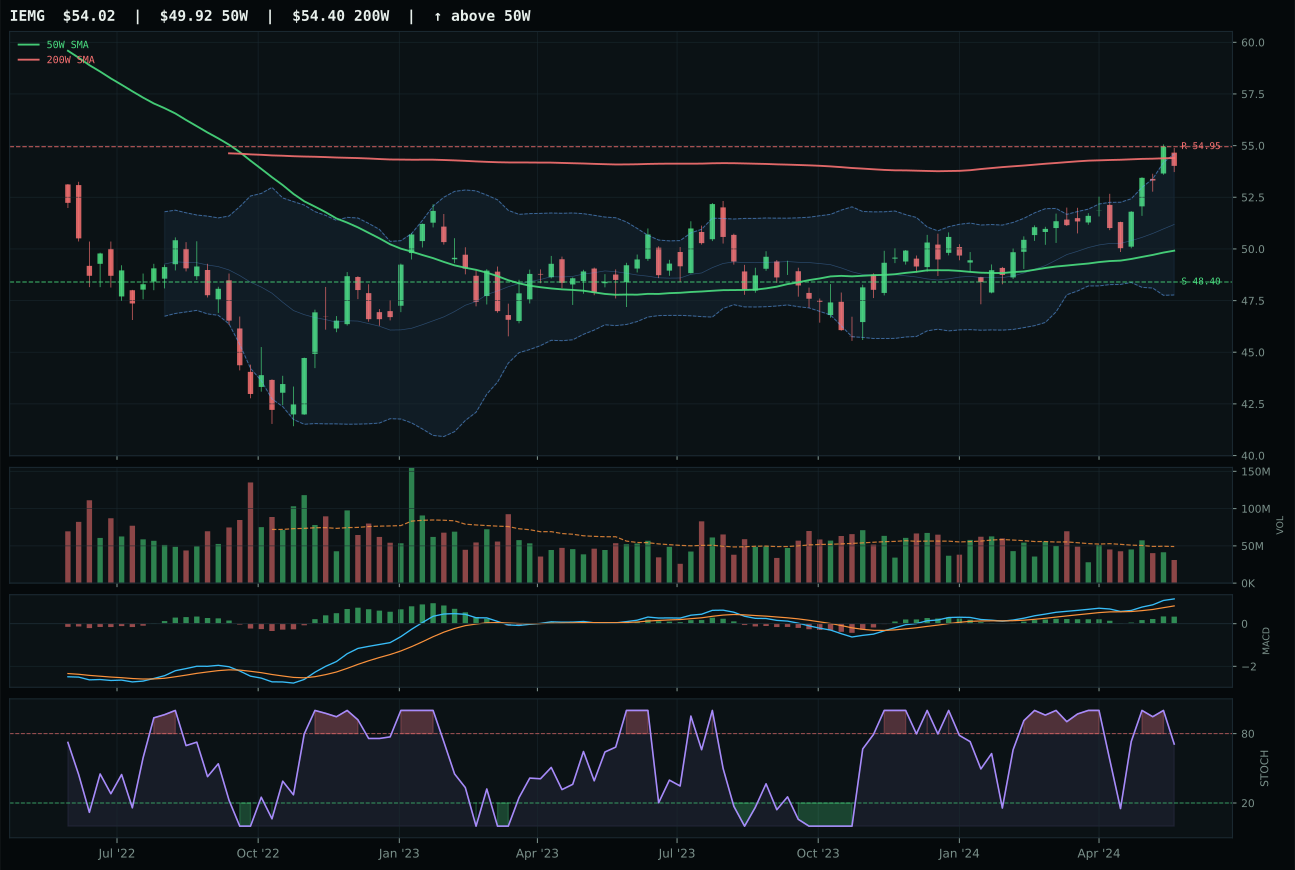
IEMG has a neutral structure profile with 1.6% 13-week relative strength versus SPY.
A failed hold above support would weaken the setup.
Actionable but governed by invalidation levels.
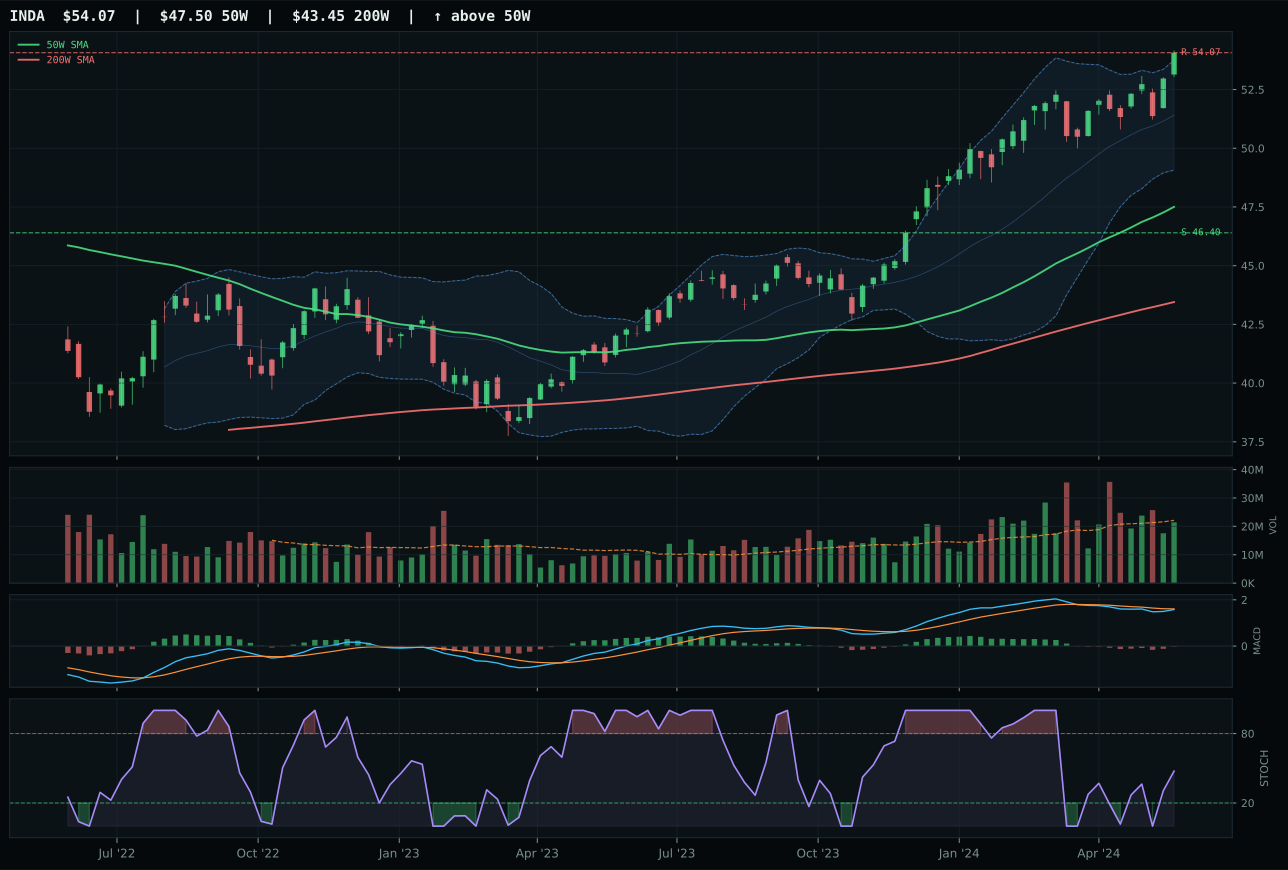
INDA has a neutral structure profile with 0.1% 13-week relative strength versus SPY.
A failed hold above support would weaken the setup.
Actionable but governed by invalidation levels.
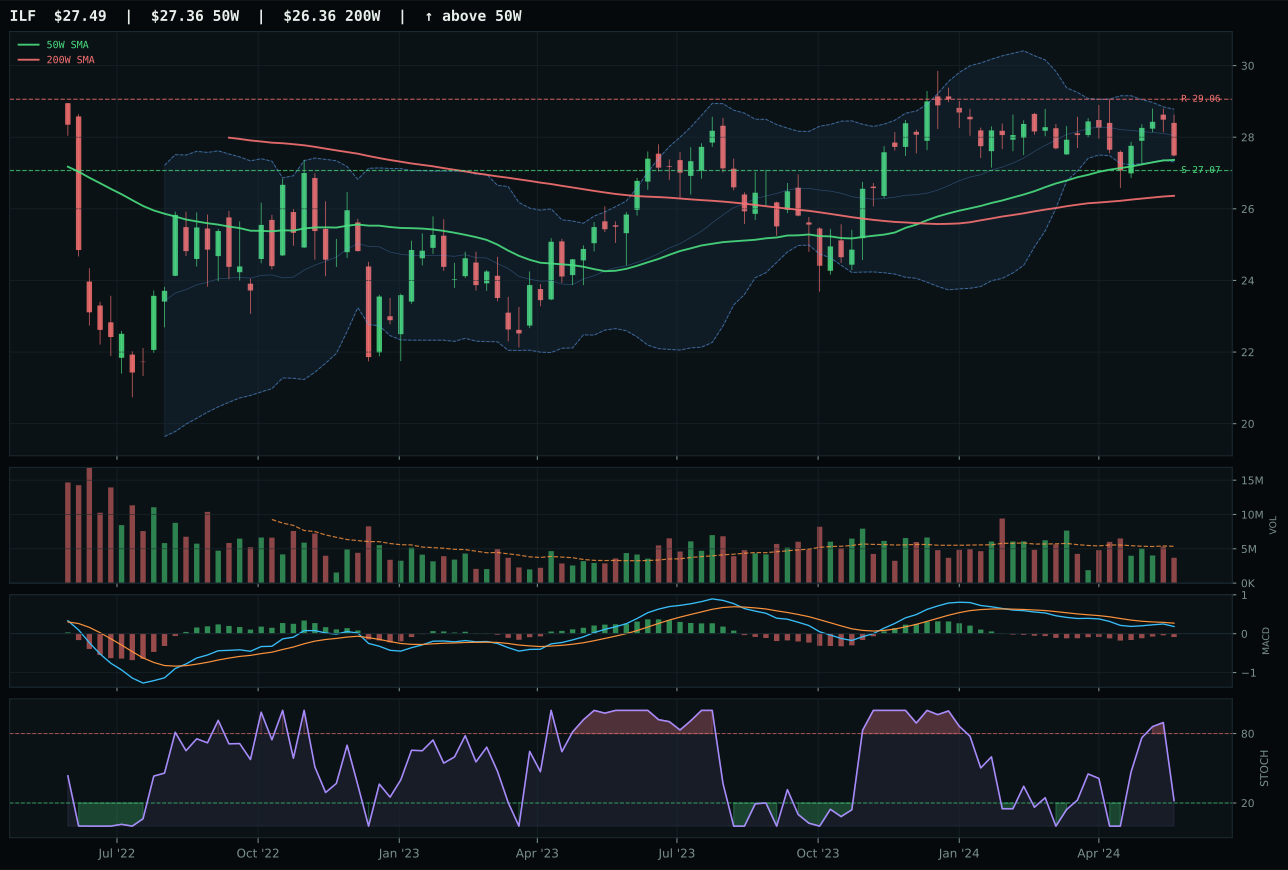
ILF has a pullback into support profile with -6.6% 13-week relative strength versus SPY.
A failed hold above support would weaken the setup.
Actionable but governed by invalidation levels.
INDA wins the emerging markets category narrowly over IEMG despite essentially equivalent composite technical scores (74 and 75) by posting superior stochastic RSI configuration (rising mid-zone at 0.47 versus IEMG's falling/neutral) and better volume confirmation (neutral at 0.97x versus IEMG's thin participation at 0.66x). INDA's structure score of 76.3/100 marginally exceeds IEMG's 74.2, driven by identical cleanliness (58.3) but superior compression (89.9 versus tighter competition) and category-relative strength of 0.0% versus IEMG's 0.0%—a statistical tie that gives the nod to INDA based on momentum configuration. Both are near 52-week highs with bearish-but-improving MACD (INDA) and bullish-improving MACD (IEMG), a divergence that slightly favors IEMG's confirmation but is offset by INDA's rising stochastic and neutral volume versus IEMG's falling stochastic and thin volume. The 1.5-point gap (IEMG 29.0 versus INDA 27.5 reasoned evidence) is extremely tight, reflecting a category with weak conviction across all three competitors; INDA's representative status results from technical precision rather than dominant leadership.
Emerging Markets scores 28.5 and earns zero allocation, ranking ninth or tenth depending on how you order the bottom tiers. Credit stress at -10 and liquidity stress at -10 points combine to create a 20-point macro headwind that overwhelms INDA's 70.4/100 technical evidence. In Late-Cycle Reflation, EM is a compression play on rate differentials and a carry-trade bet, neither of which work when credit stress and liquidity constraints are active. INDA's 4.4% 13-week return and 0.1% RS versus SPY are flat, not negative—the category just isn't offering any return premium to justify the EM credit and currency risk. For Emerging Markets to earn allocation, either credit stress must flip or liquidity stress must ease; until then, the portfolio prefers domestic real assets and energy security over EM beta.