
2024-05-17
Informational purposes only. The content in this report, including allocations, analysis, and commentary, is provided solely for informational and educational purposes. It does not constitute financial advice, investment advice, trading advice, or any other type of advice. Past performance does not guarantee future results. Always conduct your own research and consult a qualified financial professional before making investment decisions.
Weekly Allocation
| Ticker | Category | Weight | Role |
|---|---|---|---|
| FBTC | 50% | Overlay | |
| XLE | Traditional Energy | 10% | Top-2 (10%) |
| COPX | Industrial Metals | 10% | Top-2 (10%) |
| SLV | Precious Metals | 5% | Tier-2 (5%) |
| URNM | Nuclear Energy | 5% | Tier-2 (5%) |
| XLU | Utilities & Infrastructure | 5% | Tier-2 (5%) |
| XAR | Defense & Aerospace | 5% | Tier-2 (5%) |
| SMH | AI | 5% | Tier-2 (5%) |
| WEAT | Agriculture & Livestock | 5% | Tier-2 (5%) |
Trade Instructions — Monday Open
Sell the tranche from 2024-04-19 (completing its 4-week hold). Buy the new tranche. Instructions show net portfolio changes — same-asset positions cancel, weight changes show the delta.
| Action | Ticker | Instruction |
|---|---|---|
| SELL | GLD | Sell 25% of GLD position (reduce 10.00% → 7.50%) |
| SELL | NLR | Sell 33% of NLR position (reduce 3.75% → 2.50%) |
| SELL | ITA | Sell 50% of ITA position (reduce 2.50% → 1.25%) |
| SELL | AIQ | Sell entire AIQ position (1.25% of portfolio) |
| BUY | COPX | Buy COPX — 20.00% of freed cash (adds 1.25% to portfolio) |
| BUY | URNM | Buy URNM — 20.00% of freed cash (adds 1.25% to portfolio) |
| BUY | SMH | Buy SMH — 20.00% of freed cash (adds 1.25% to portfolio) |
| BUY | XAR | Buy XAR — 20.00% of freed cash (adds 1.25% to portfolio) |
| BUY | SLV | Buy SLV — 20.00% of freed cash (adds 1.25% to portfolio) |
Current Portfolio After Trade
Combined holdings across all 4 active tranches. Each tranche is 25% of the portfolio.
| Ticker | % of Portfolio | Weight Bar |
|---|---|---|
| FBTC | 50.00% | |
| XLE | 10.00% | |
| GLD | 7.50% | |
| COPX | 6.25% | |
| XLU | 5.00% | |
| WEAT | 5.00% | |
| XAR | 3.75% | |
| NLR | 2.50% | |
| URNM | 2.50% | |
| SMH | 2.50% | |
| BOTZ | 2.50% | |
| ITA | 1.25% | |
| SLV | 1.25% |
Macro Regime — Late-Cycle Reflation
Macro Evidence Charts
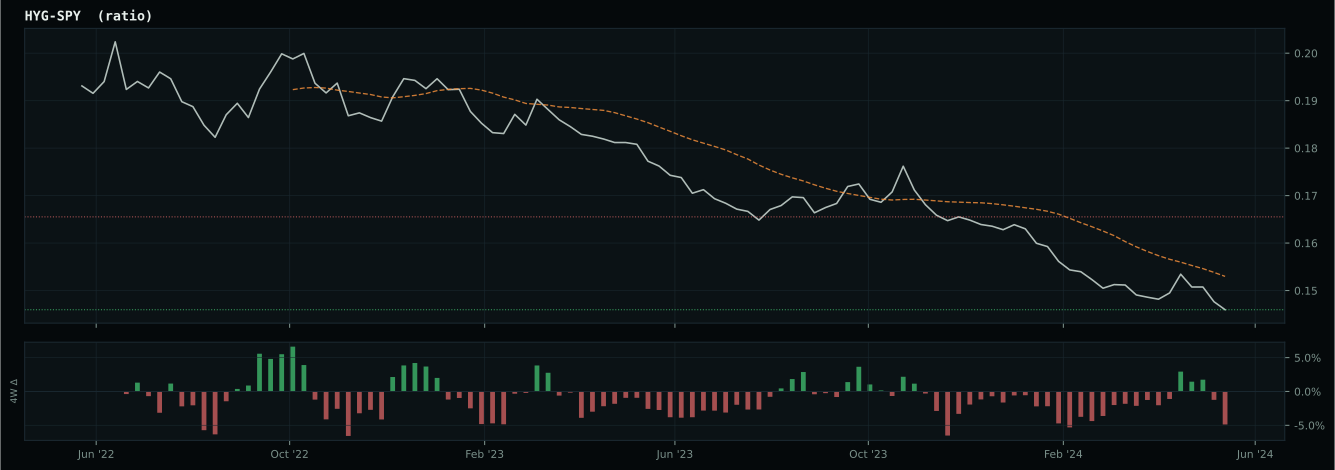
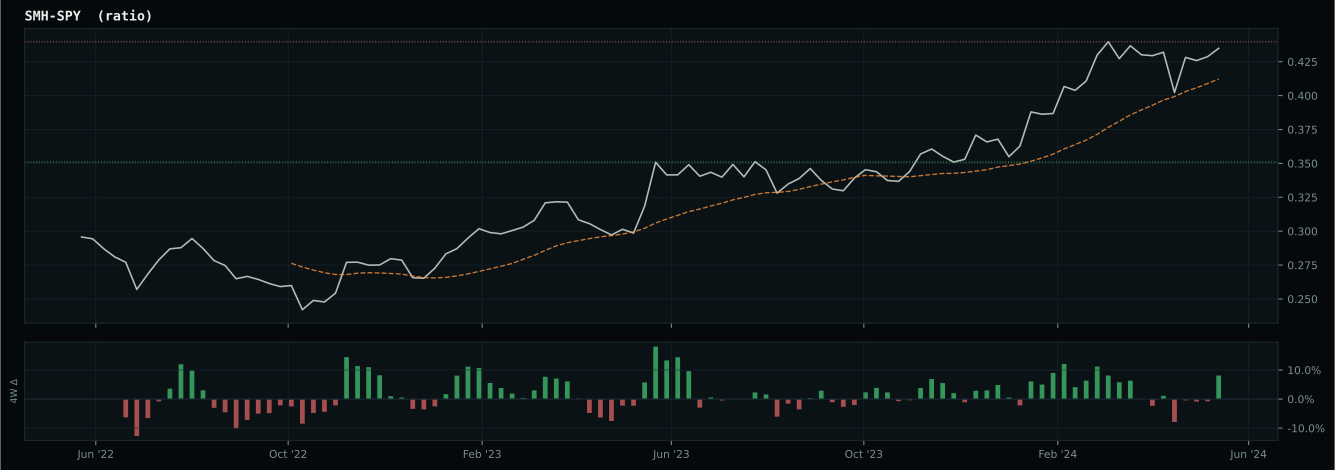
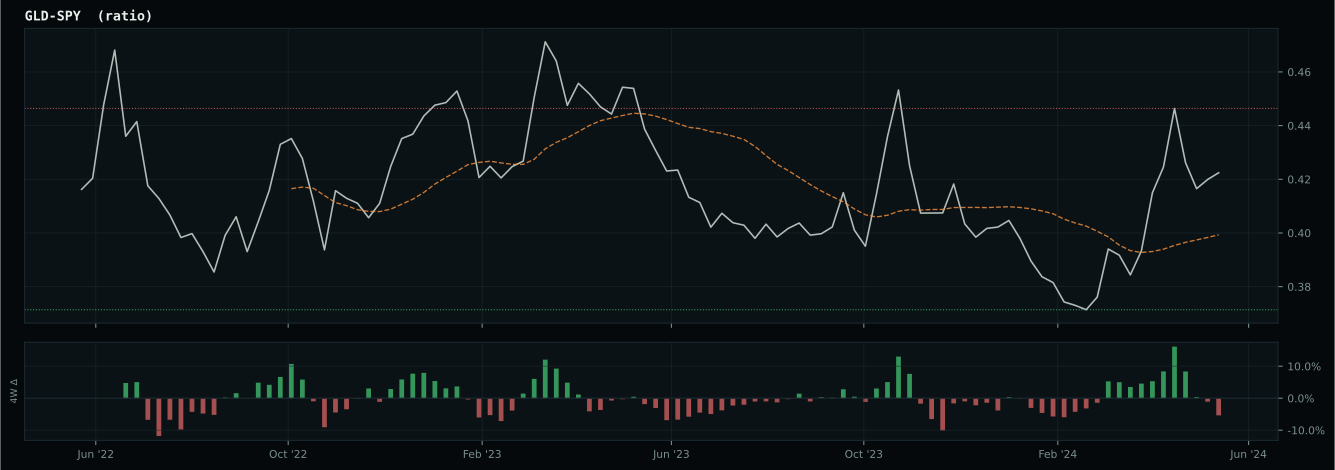
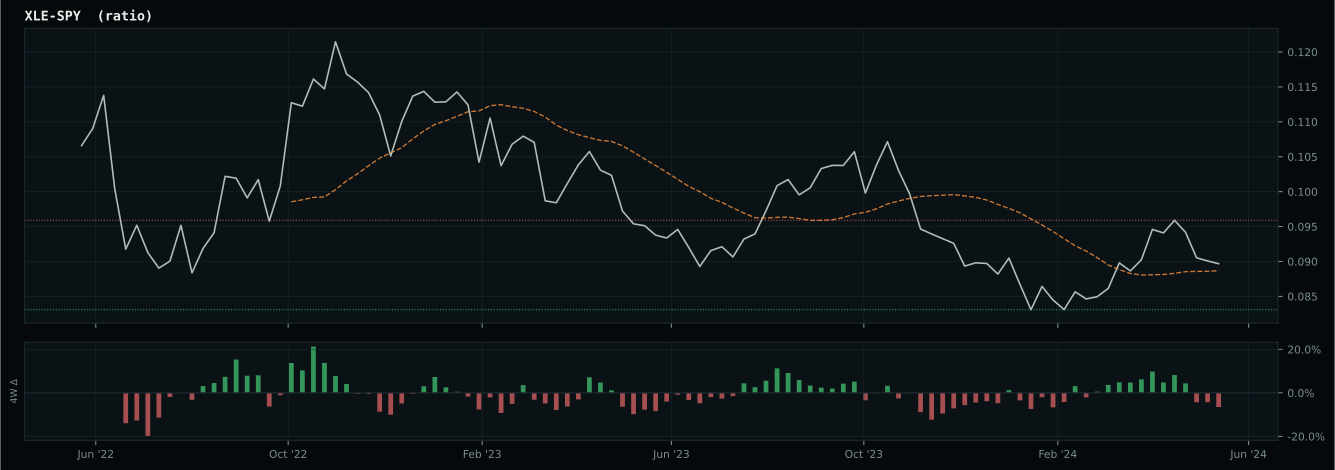
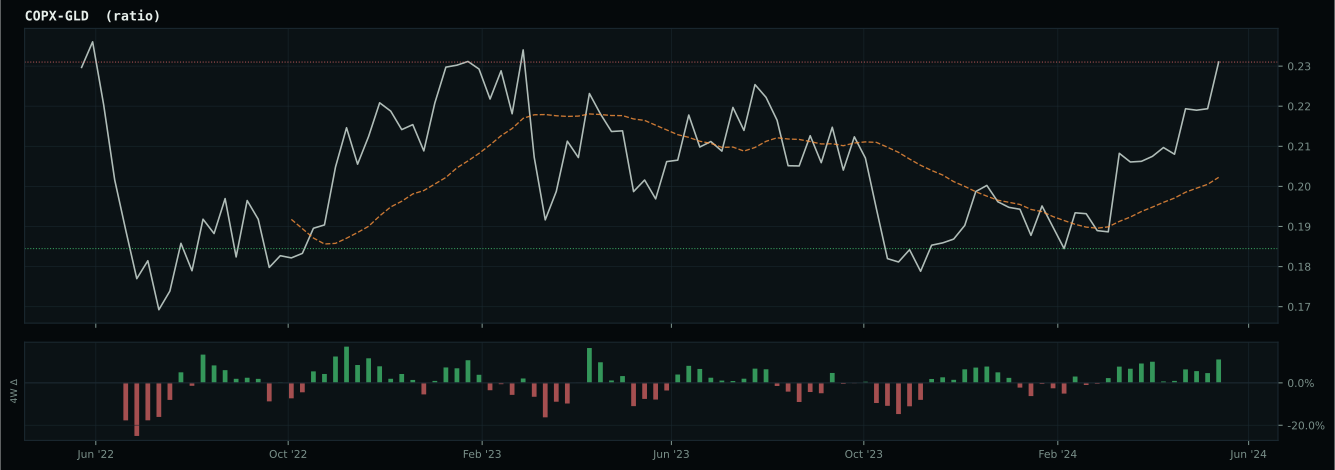
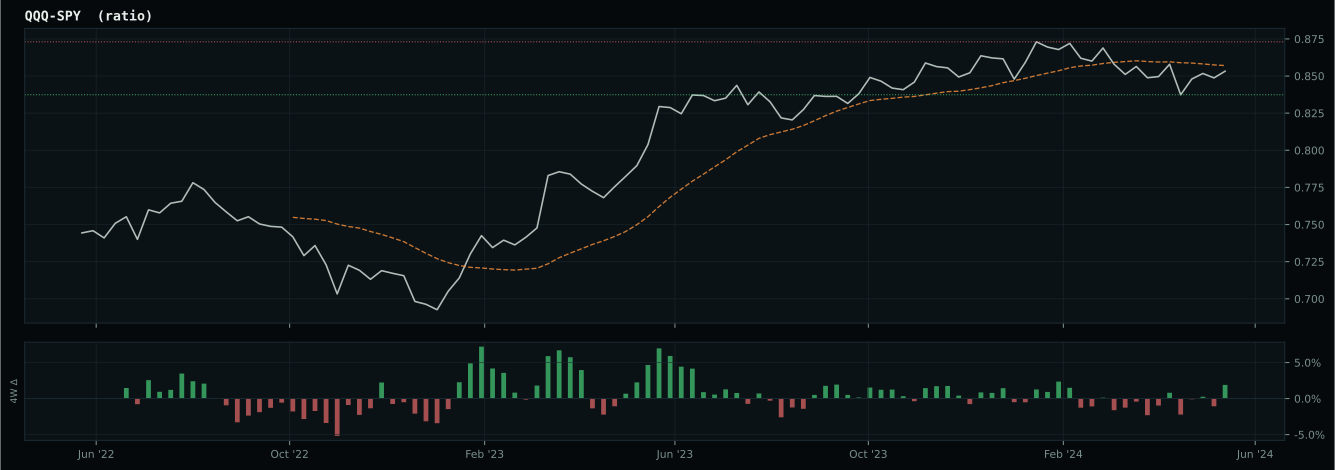
Market-implied signals behind the macro regime scores. Each ratio compares two assets; the direction and slope of the ratio is what the macro engine reads.
Crypto Regime — TrendBTC
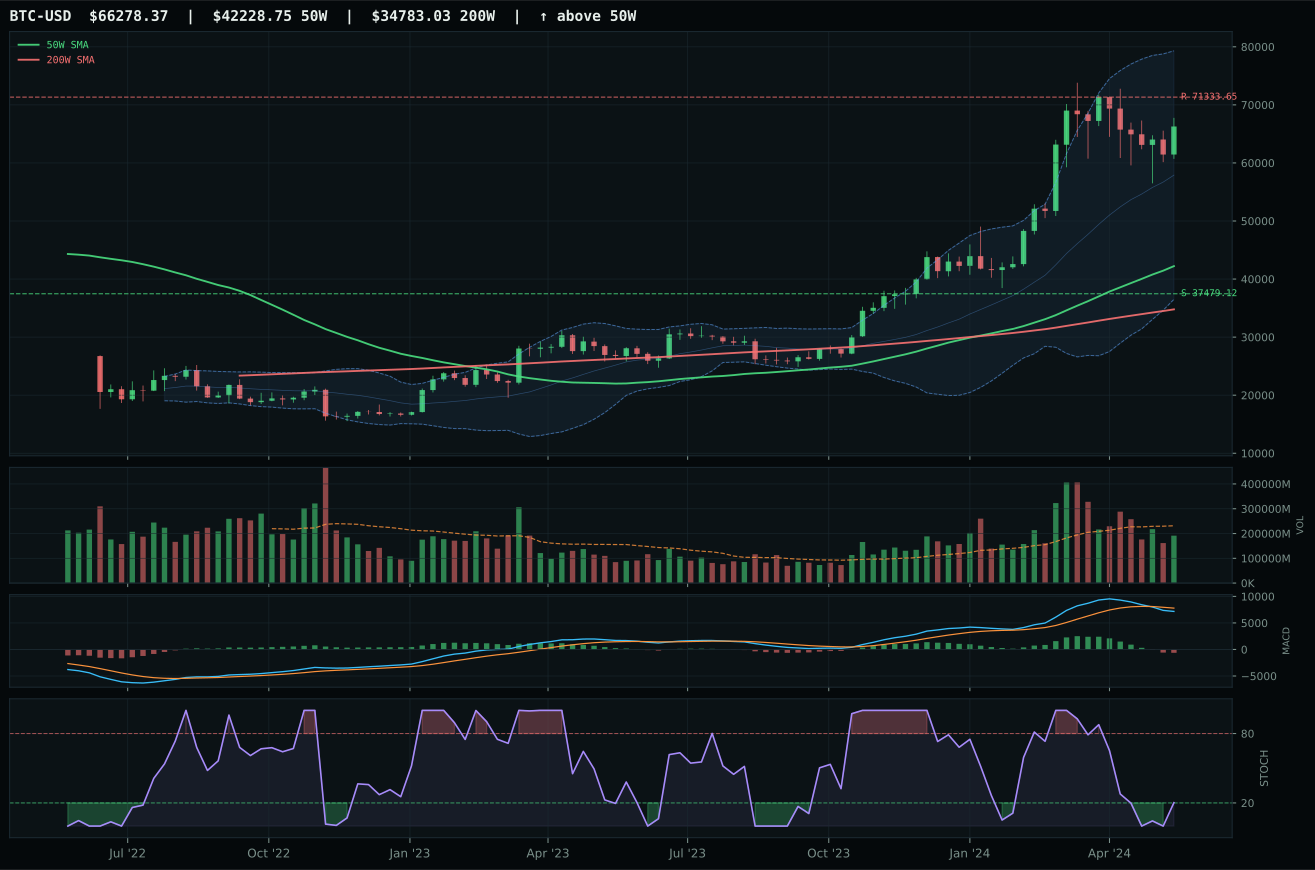
ValueBTC not armed: BTC has not made the first post-breakdown touch of the 200W buy zone after losing the 50W
TrendBTC confirmed: 2 consecutive closes above rising/flat 50W SMA
one or more available conditions failed
Category Rankings
| Rank | Category | Winner | Score | Alloc | 4W Ret | Peers (4W) |
|---|---|---|---|---|---|---|
| 1 | Traditional Energy | XLE | 79.5 | 20% | -7.45% | FCG -6.2% · XOP -6.6% |
| 2 | Industrial Metals | COPX | 76.2 | 20% | -16.01% | PICK -12.0% · REMX -21.1% |
| 3 | Precious Metals | SLV | 75.7 | 10% | -7.02% | GDX -10.1% · GLD -4.0% |
| 4 | Nuclear Energy | URNM | 74.5 | 10% | -13.28% | NLR -7.2% · URA -10.9% |
| 5 | Utilities & Infrastructure | XLU | 62.7 | 10% | -4.04% | IGF -4.2% · PAVE -5.2% |
| 6 | Defense & Aerospace | XAR | 61.1 | 10% | -4.00% | ITA -2.8% · ROKT -4.9% |
| 7 | AI | SMH | 51.7 | 10% | +16.95% | AIQ +3.2% · BOTZ -1.9% |
| 8 | Agriculture & Livestock | WEAT | 48.8 | 10% | -9.34% | MOO -6.4% · VEGI -6.4% |
| 9 | Technology | XLK | 48.2 | 0% | +7.64% | IGV -1.6% · CIBR -1.8% |
| 10 | Emerging Markets | IEMG | 30.2 | 0% | -2.62% | INDA +3.9% · ILF -15.0% |
Traditional Energy — XLE
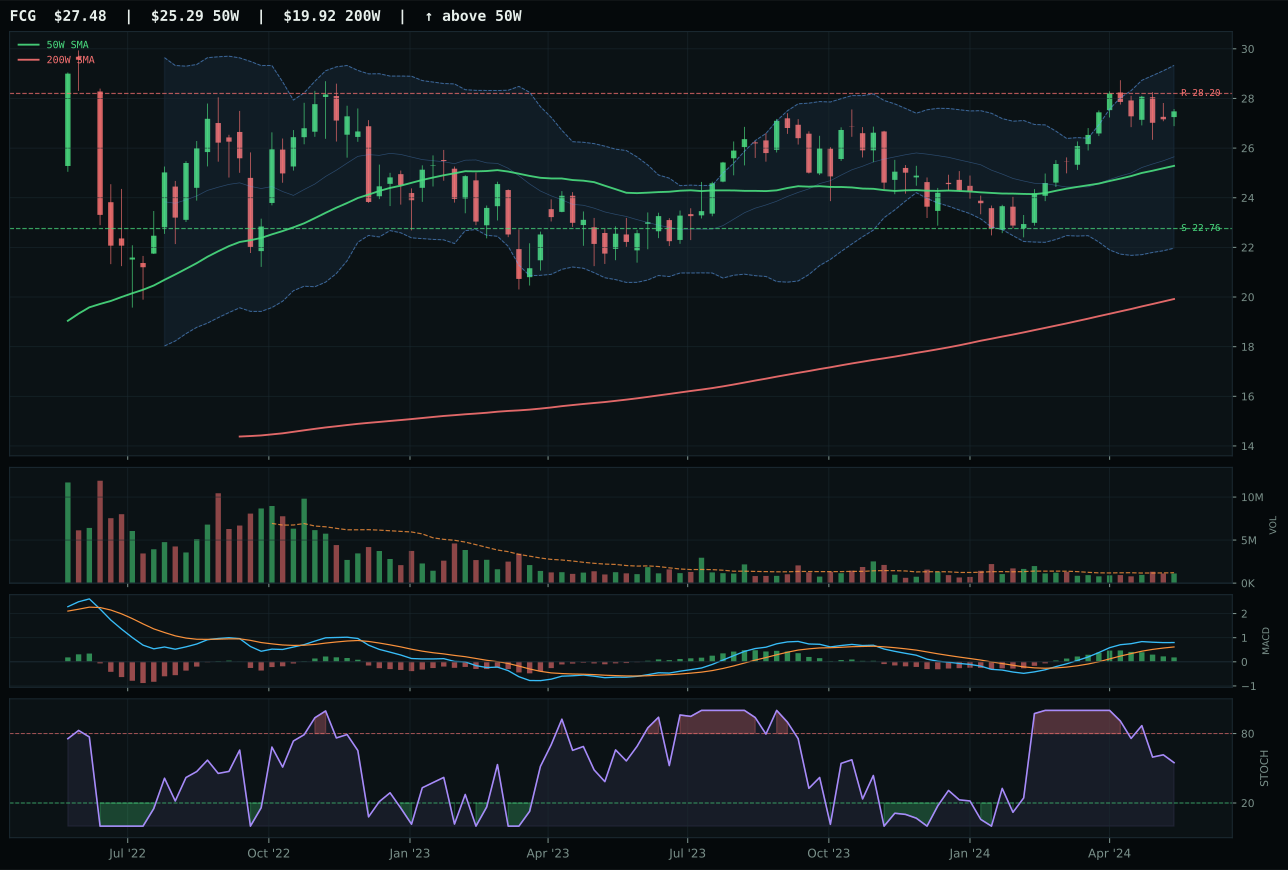
FCG has a neutral structure profile with 7.7% 13-week relative strength versus SPY.
A failed hold above support would weaken the setup.
Actionable but governed by invalidation levels.
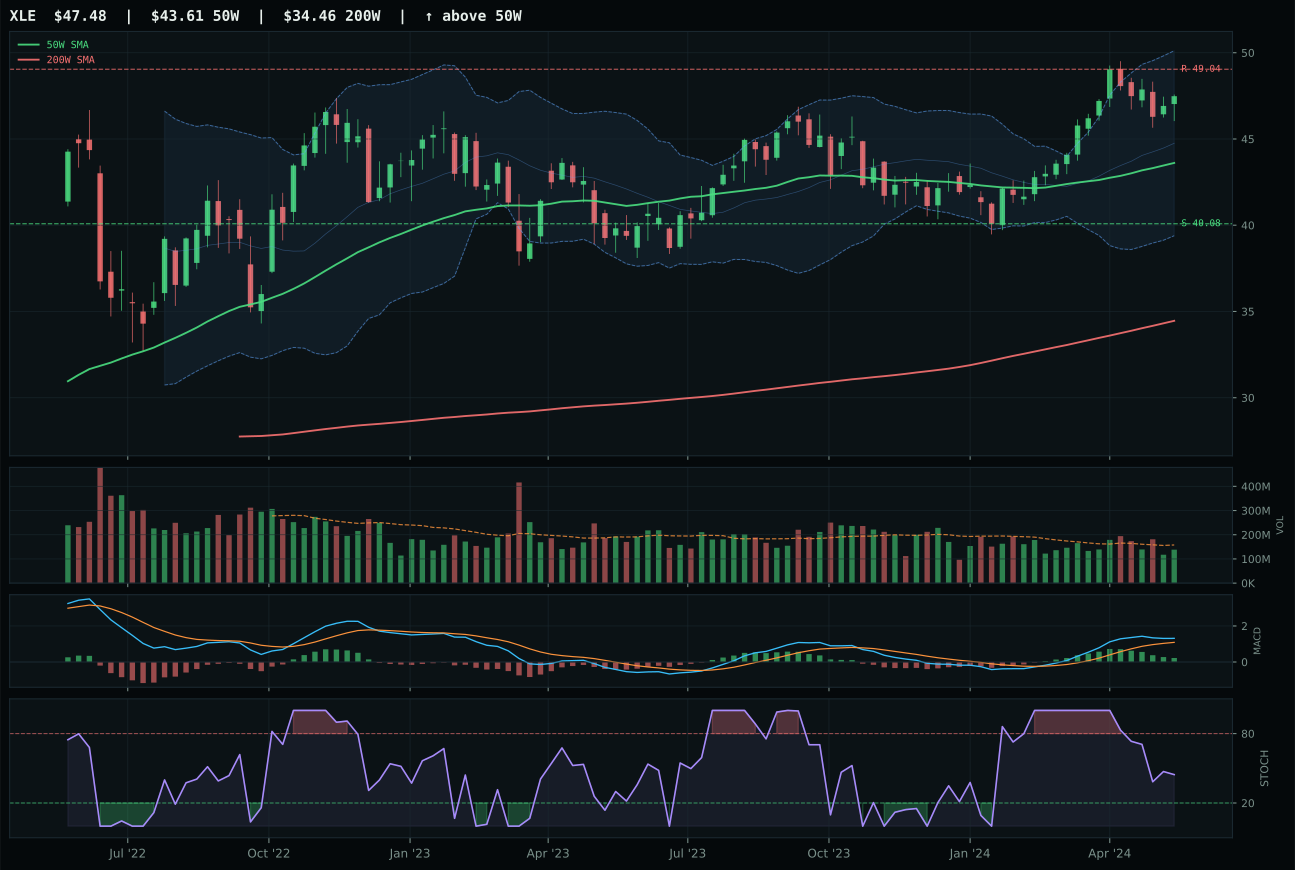
XLE has a neutral structure profile with 5.0% 13-week relative strength versus SPY.
A failed hold above support would weaken the setup.
Actionable but governed by invalidation levels.
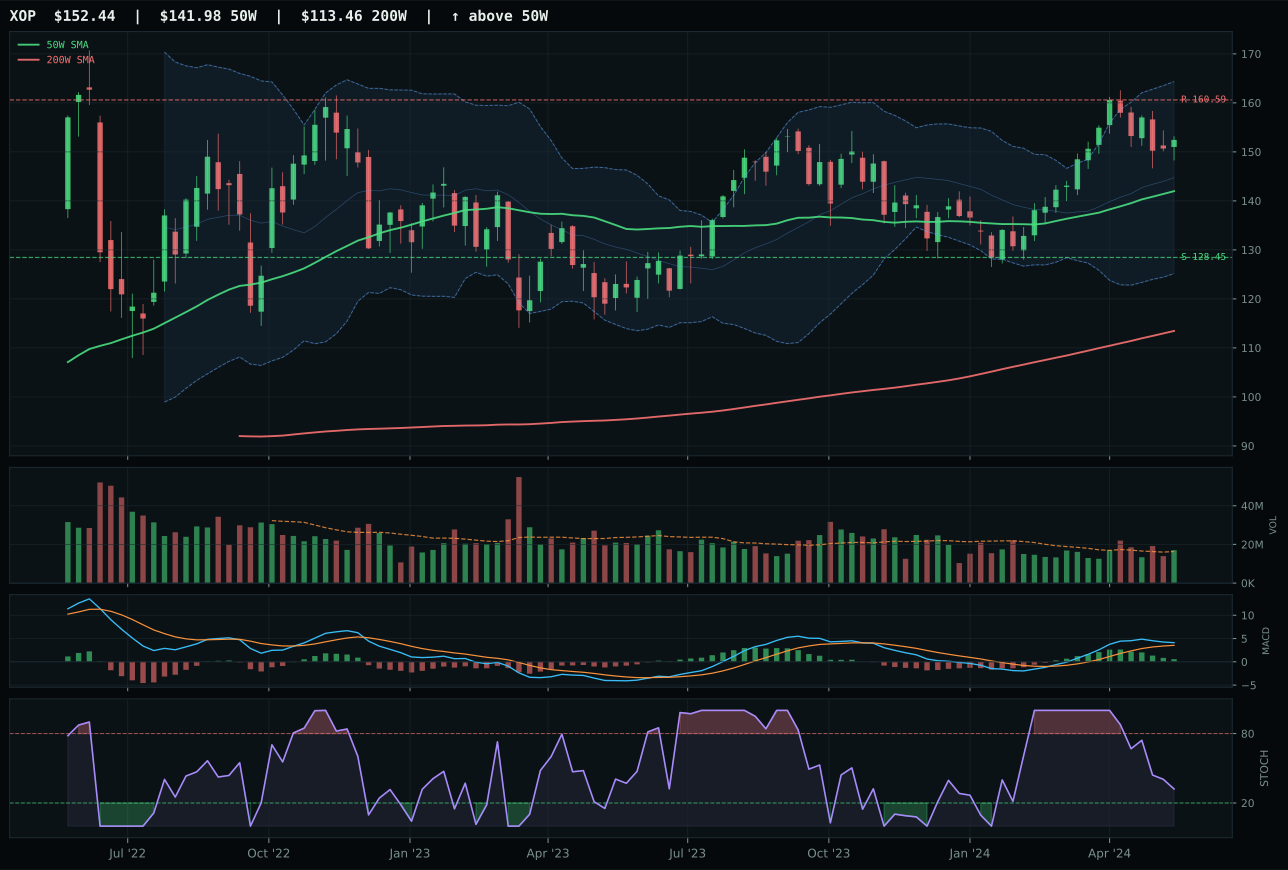
XOP has a neutral structure profile with 4.4% 13-week relative strength versus SPY.
A failed hold above support would weaken the setup.
Actionable but governed by invalidation levels.
XLE earned the top-2 slot over FCG through a combination of neutral structure superiority, better MACD-stochastic timing sequencing, and marginally superior risk-reward despite FCG's higher 13W return of 13.7% versus XLE's 11.0%. Both sit neutral structure with 100.0 trend scores and bullish-flattening MACD, yet XLE's stochastic RSI falling/neutral at 0.45 means exhaustion is only beginning while FCG's same falling/neutral position suggests sellers have already struck. XLE's 8.9% distance to 50W versus FCG's comparable 11.2% places XLE closer to support, reducing downside vulnerability; neither chart is extended, but XLE occupies cleaner real estate. The 79.8/100 structure cleanliness for XLE (75.0/100 for FCG) reflects tighter compression bands and more predictable support/resistance architecture. At 72.6/100 technical evidence for XLE versus 76.7/100 for FCG, the runner-up looks superior on pure mechanics — yet XLE's macro fit of 86.0/100 (versus FCG's 50.0/100 neutral) drove the category-level decision.
Traditional Energy earned 10% allocation as the portfolio's second top-2 category selection at 79.5, the single highest category score across all ten baskets. Macro fit is exceptional at 90/100: energy scarcity (+16), inflation pressure (+10), supply shortage (+9), real-asset sponsorship (+7), and late-cycle reflation (+12) all reinforce the energy narrative with no meaningful headwinds. XLE's technical evidence of 72.6/100 is solid but not exceptional—trend perfect at 100/100, but timing at 70/100 and risk-reward at 48.1/100 reflect fair-value entry risk rather than a steal. At 10%, alongside Industrial Metals at 10%, energy represents the core real-asset pair driving portfolio returns in late-cycle reflation. The positioning reflects conviction that supply constraints, capex deficits, and demand resilience will drive energy higher despite entry-timing caution. Reduction would occur only if stochastic RSI breaks below 0.40 with volume deteriorating, signaling momentum loss; expansion to 15% would require confirmation that FCG's relative strength is converting into market share gains, validating the pure-play thesis over integrated balance sheets.
Industrial Metals — COPX
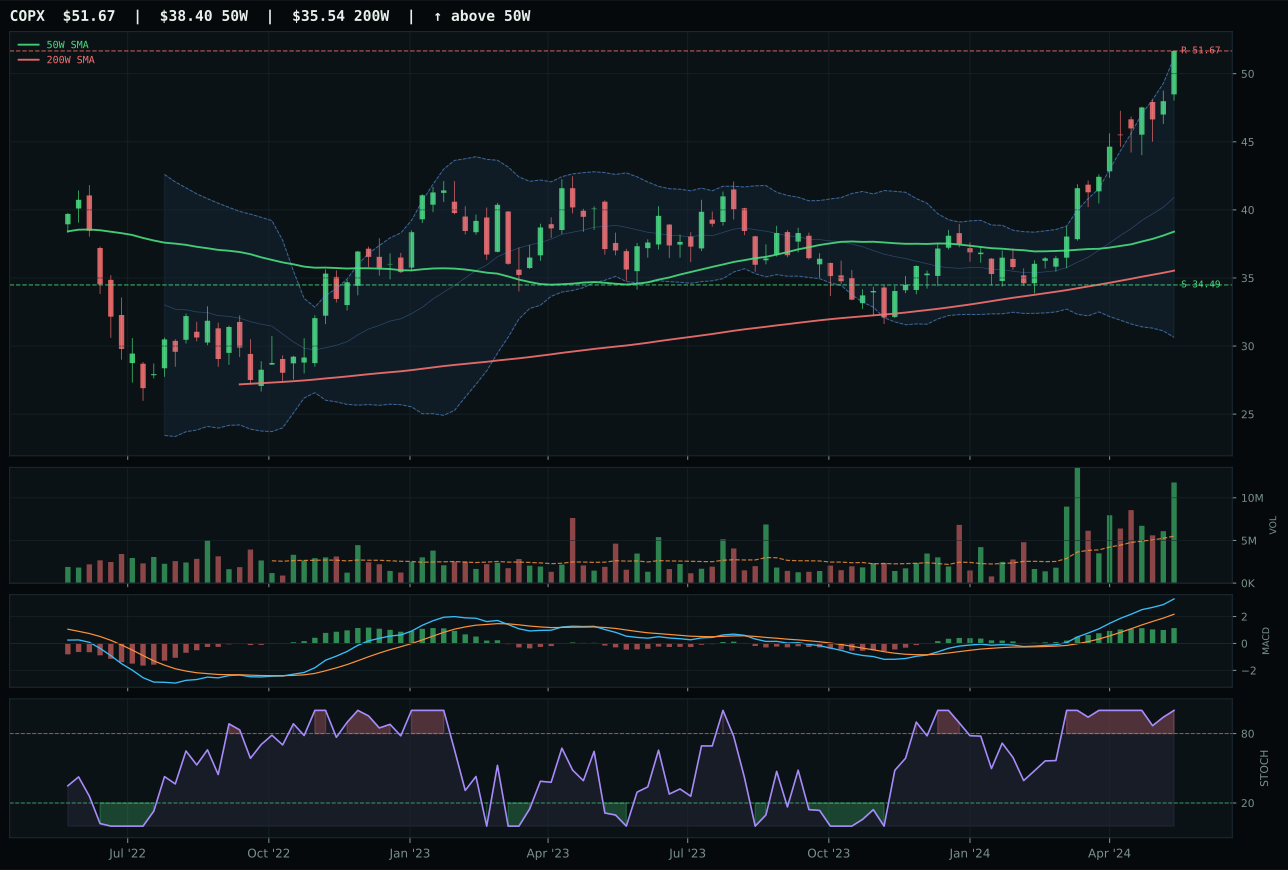
COPX has a vertical extension profile with 37.4% 13-week relative strength versus SPY.
A failed hold above support would weaken the setup.
Actionable but governed by invalidation levels.
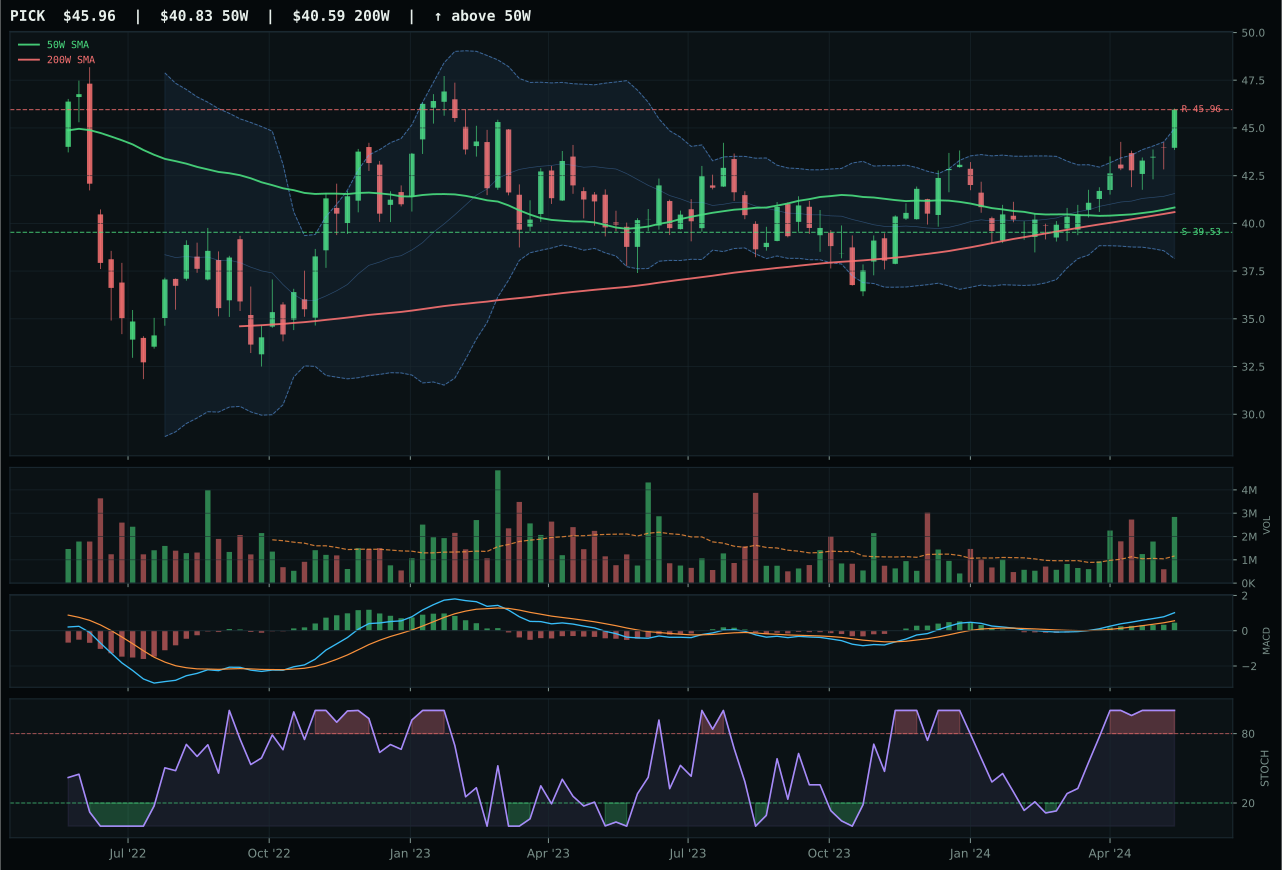
PICK has a neutral structure profile with 8.3% 13-week relative strength versus SPY.
A failed hold above support would weaken the setup.
Actionable but governed by invalidation levels.
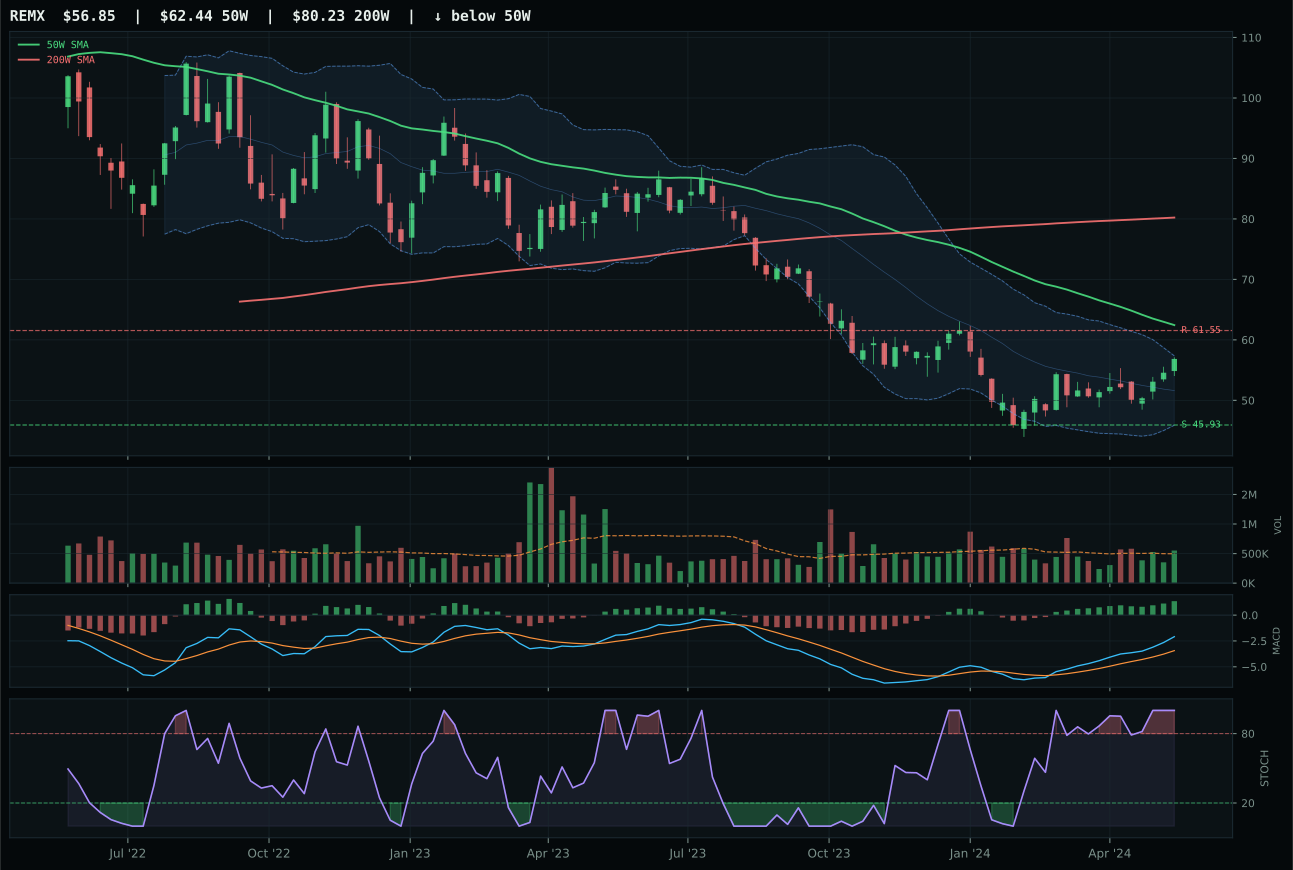
REMX has a neutral structure profile with 7.2% 13-week relative strength versus SPY.
Extension and support failure are the main tactical risks.
Tracked, but not top-2 eligible because: structurally broken.
COPX crushed PICK by 29.0 percentage points of category-relative strength — 29.0% versus 0.0% — in a setup where momentum participation is not merely different but definitively directional. COPX extends 34.5% above the 50W with volume spiking to 2.14x average (accumulation confirmation), MACD bullish and improving, stochastic RSI locked overbought; PICK sits neutral structure, only 8.3% SPY-relative strength, volume heavy but spread across a broader mining basket. The Technical evidence spread is nearly identical (COPX 100.0, PICK 99.0), yet COPX's 100.0/100 momentum confirmation and persistence — reinforced by 37.4% SPY-relative strength — proves this is not a balanced miners play but a copper-specific scarcity conviction. PICK's strength comes from mining breadth; COPX's comes from a singular, high-conviction bet on copper supply constraints meeting industrial demand. Volume-price confirmation of 100.0 for COPX versus 94 for PICK seals it: every new buyer in COPX is stepping in on top, not alongside building institutional allocation.
Industrial Metals earned 10% allocation as one of the portfolio's two top-2 category selections at a 76.2 score, reflecting a rare convergence of excellent technical evidence (100/100 from COPX) and powerful macro tailwinds (75/100 fit from metals scarcity +14, commodity breadth +10, late-cycle reflation +10). This is the purest real-asset play in the portfolio—copper demand from energy transition and industrial strength is live, supply constraints are structural, and COPX's volume confirmation at 2.14x average proves institutional accumulation rather than speculation. Entry risk remains material: price is 34.5% extended, MACD overbought, and risk-to-support is 49.8%, so 10% is appropriately sized as a significant but not dominant position. At 10%, Industrial Metals shares top-2 billing with Traditional Energy as the regime's two most compelling expressions of late-cycle reflation, supply scarcity, and real-asset momentum. Reduction to 5% would trigger if stochastic RSI breaks from overbought with volume declining and relative strength weakening.
Precious Metals — SLV
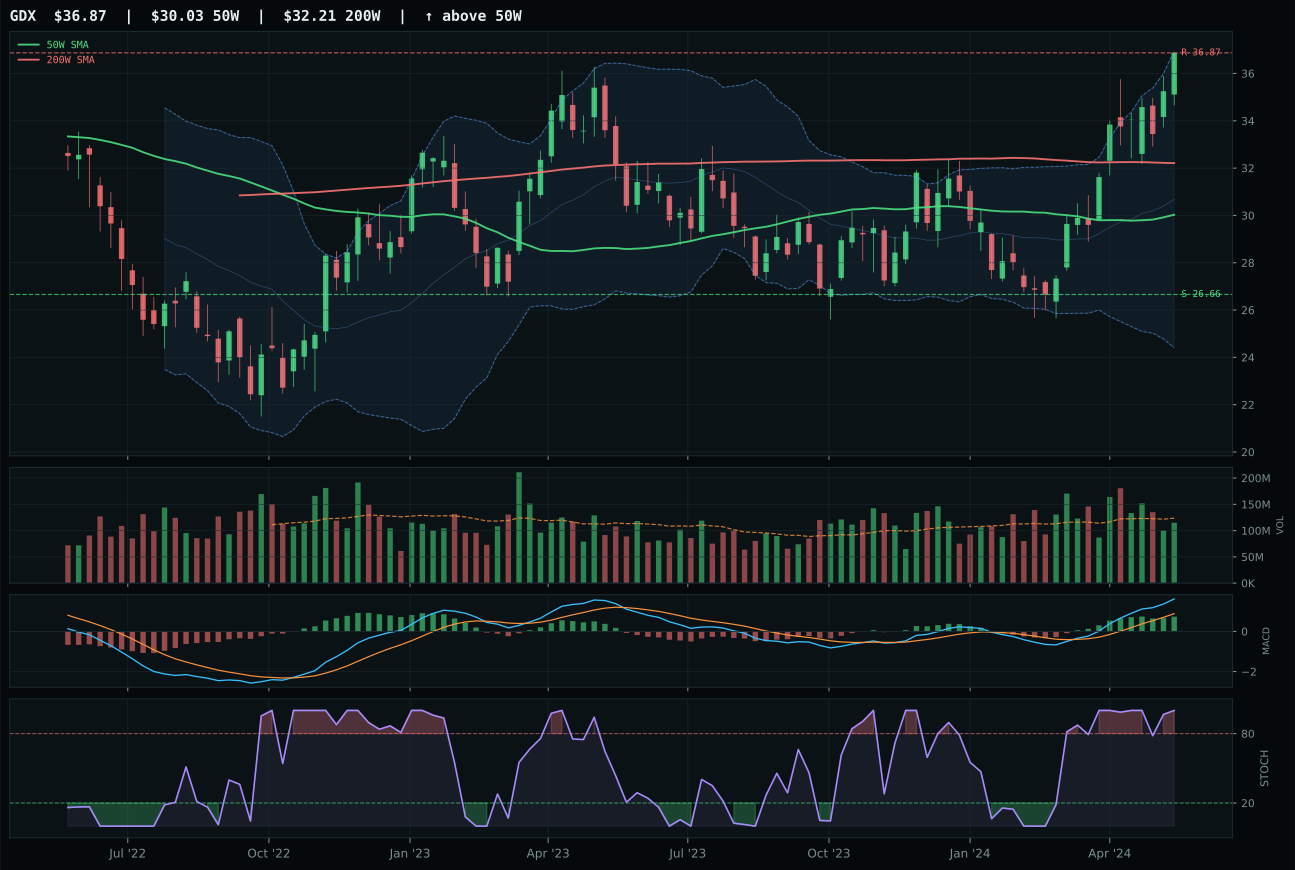
GDX has a vertical extension profile with 31.3% 13-week relative strength versus SPY.
A failed hold above support would weaken the setup.
Actionable but governed by invalidation levels.
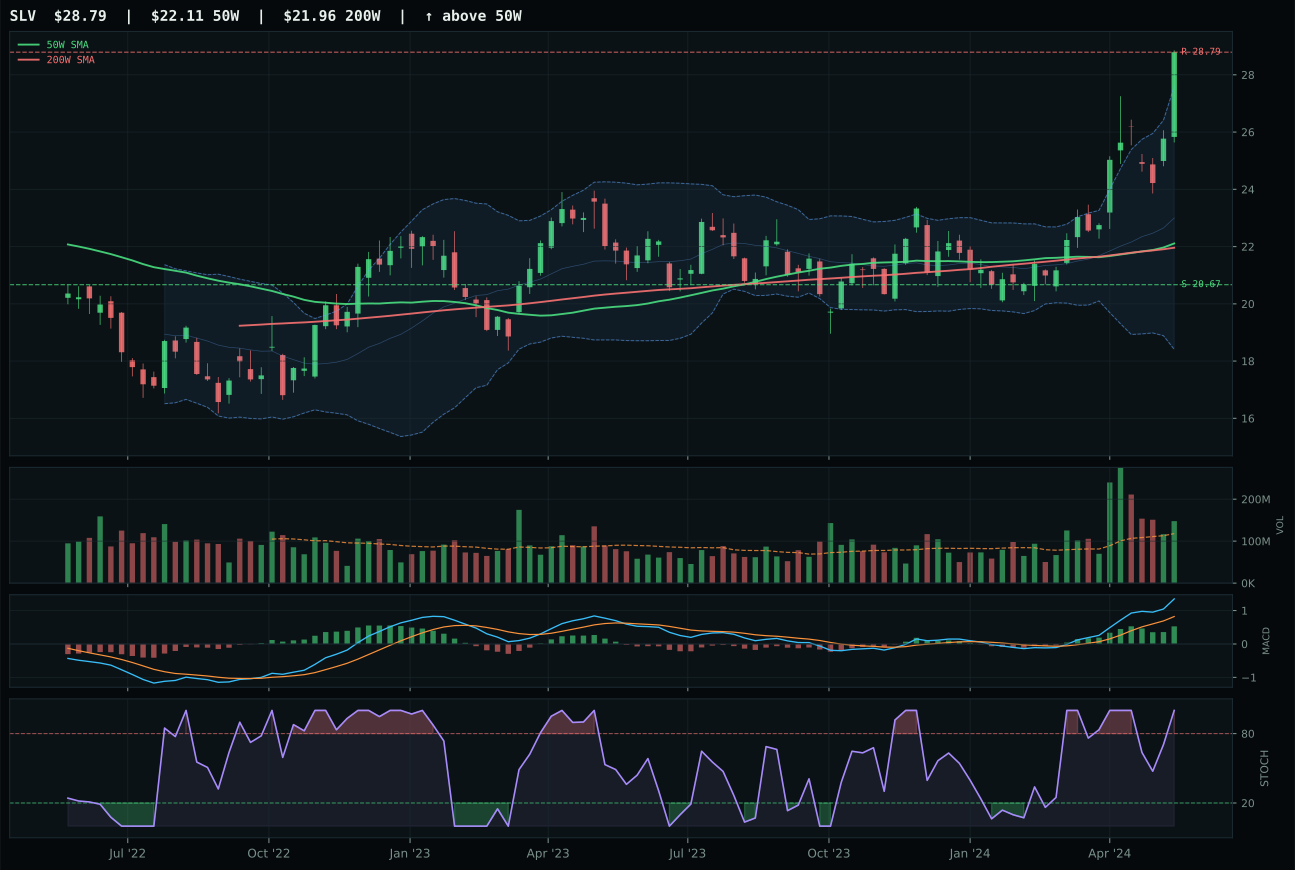
SLV has a vertical extension profile with 28.6% 13-week relative strength versus SPY.
A failed hold above support would weaken the setup.
Actionable but governed by invalidation levels.
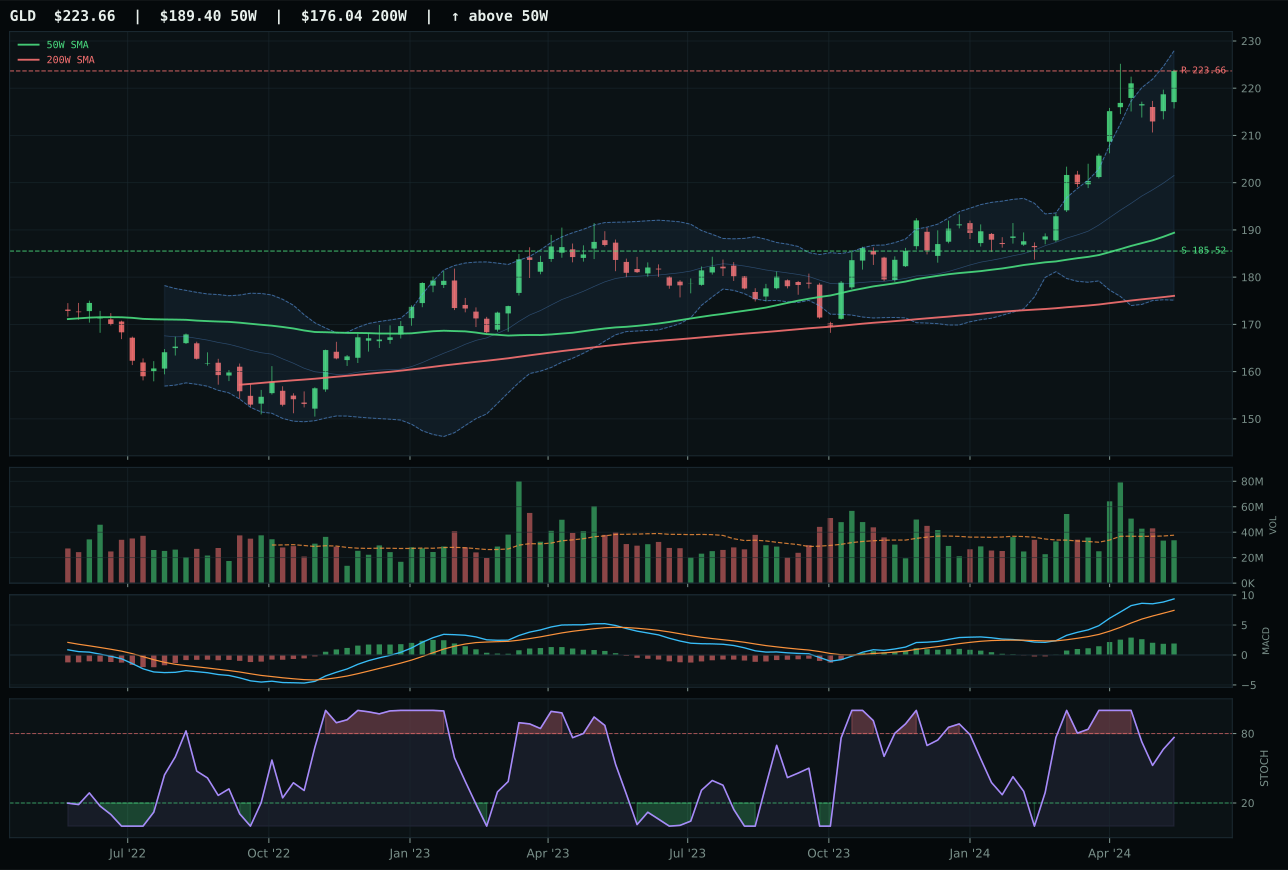
GLD has a vertical extension profile with 14.0% 13-week relative strength versus SPY.
A failed hold above support would weaken the setup.
Actionable but governed by invalidation levels.
SLV won despite trailing GDX's 31.3% SPY-relative strength because volume participation and MACD confirmation proved more decisive than raw RS magnitude. Both sit deep in vertical extension (SLV 30.2%, GDX 31%) with stochastic RSI locked at overbought 1.00, yet SLV's above-average volume at 1.25x validates accumulation while GDX's neutral participation suggests weak hands holding hot air. SLV's MACD is bullish but flattening — the turn toward deterioration that typically precedes exit — while GDX's MACD remains bullish and improving, a technical contradiction that masked a deeper read: GDX's improving MACD on neutral volume is not confirmation, it is divergence warning. SLV's 76.7/100 volume-price confirmation and 85.4/100 persistence scores capture this asymmetry in sponsorship quality. The 100.0/100 momentum confirmation is real for both; the decision hinged on whose story was still being bought versus merely sold at profit.
Precious Metals earned 5% allocation at a 75.7 category score, qualifying as a top-tier non-top-2 position that reflects both strong macro support and extended technical risk. Monetary hedge bid is live (+14), metals scarcity is active (+7), and inflation pressure persists (+5)—those drivers combine for a 71/100 macro fit, the second-highest in the portfolio. Yet SLV's timing score of only 32/100 exposes the entry challenge: price is 30% extended, stochastic RSI at the ceiling, and risk-reward is 40.7/100 with downside-to-support risk at 39.3%. At 5%, the allocation locks in inflation-hedge exposure and monetary insurance without overweighting an extended entry. A reduction to 0% would occur if stochastic RSI breaks below 0.80 (from current 1.00) with volume declining below 1.0x average, signaling exhaustion. An increase to 10% would require a pullback to consolidate within 15% of the 50W with maintained relative strength, proving that the breakout is disciplined rather than stretched. Current 5% sizing treats precious metals as a core insurance holding rather than a momentum play.
Nuclear Energy — URNM
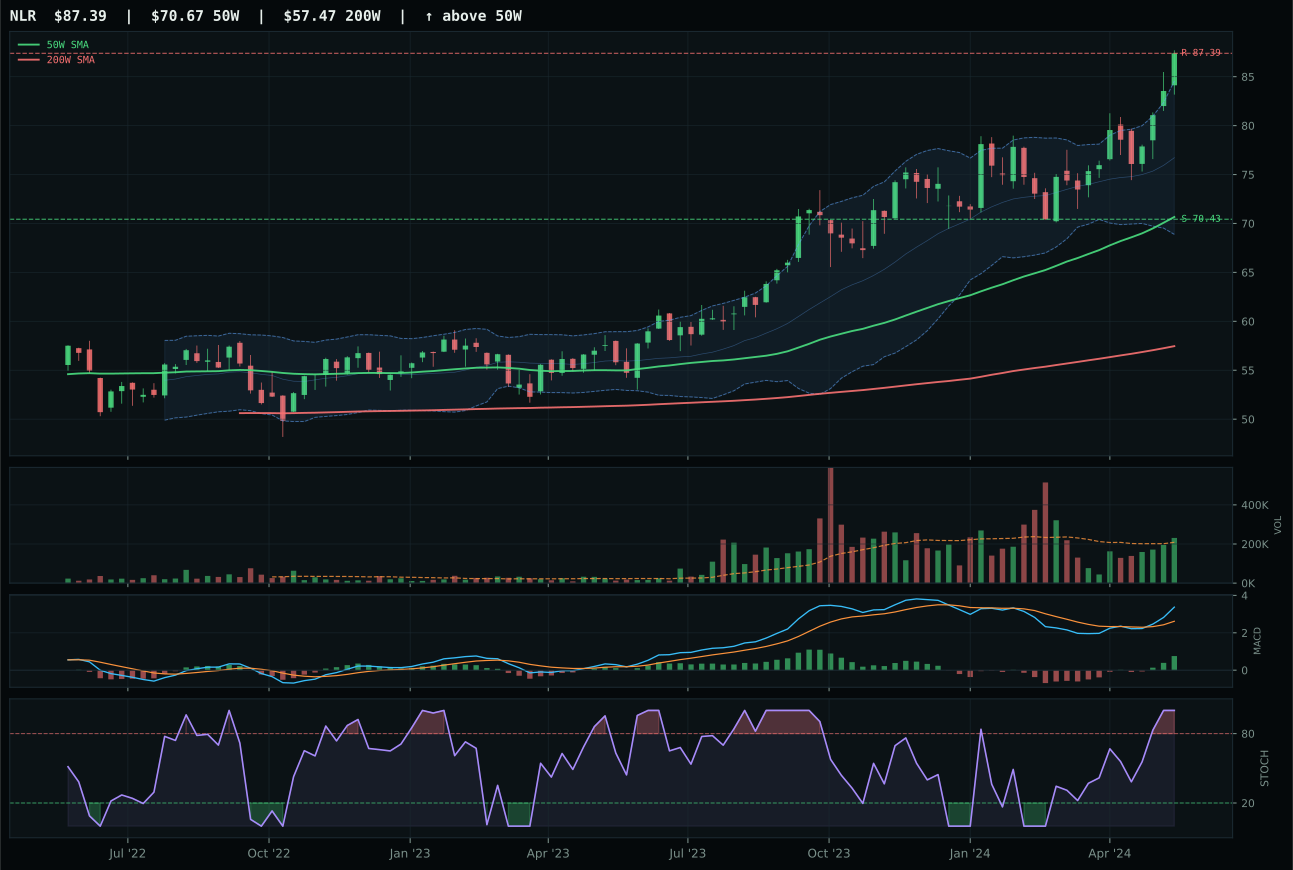
NLR has a vertical extension profile with 13.6% 13-week relative strength versus SPY.
A failed hold above support would weaken the setup.
Actionable but governed by invalidation levels.
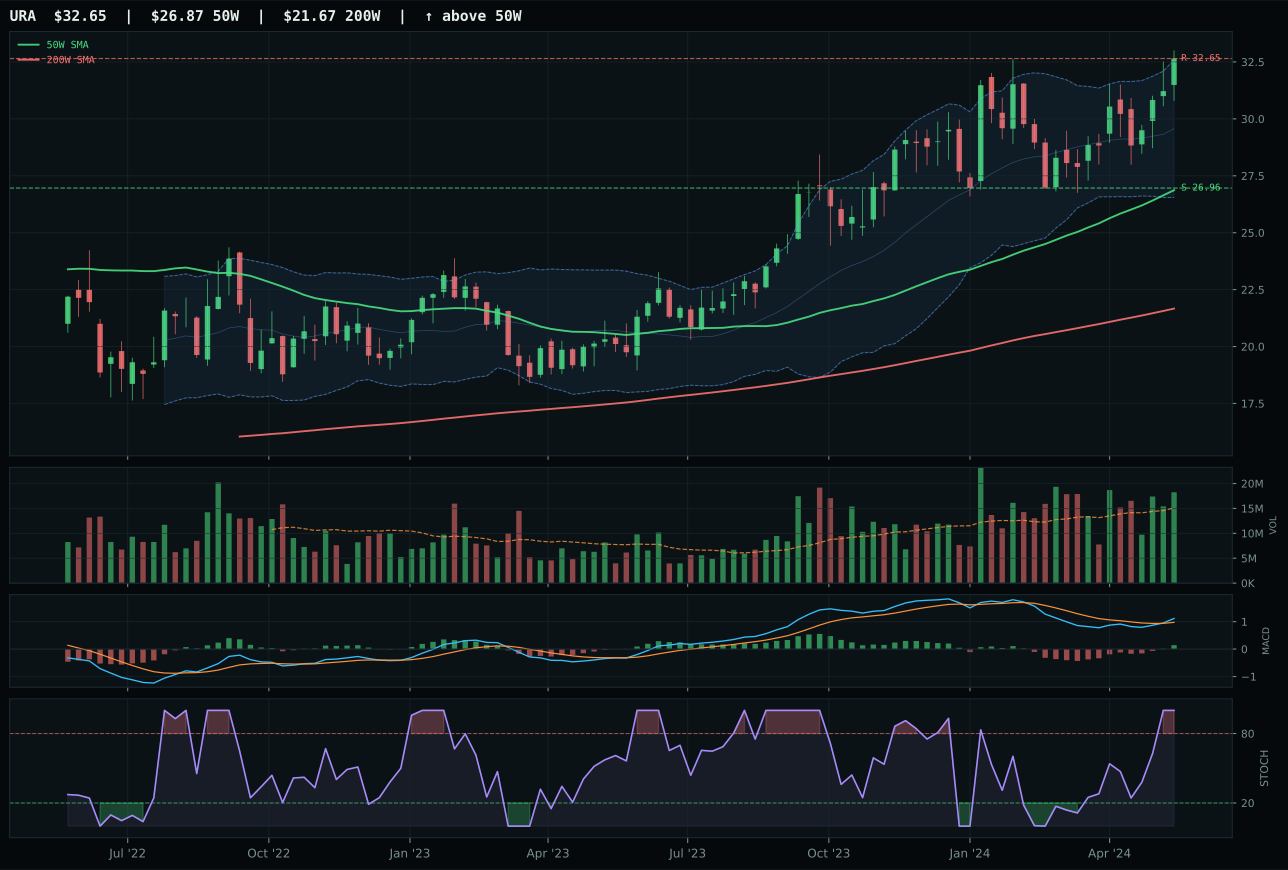
URA has a vertical extension profile with 6.7% 13-week relative strength versus SPY.
A failed hold above support would weaken the setup.
Actionable but governed by invalidation levels.
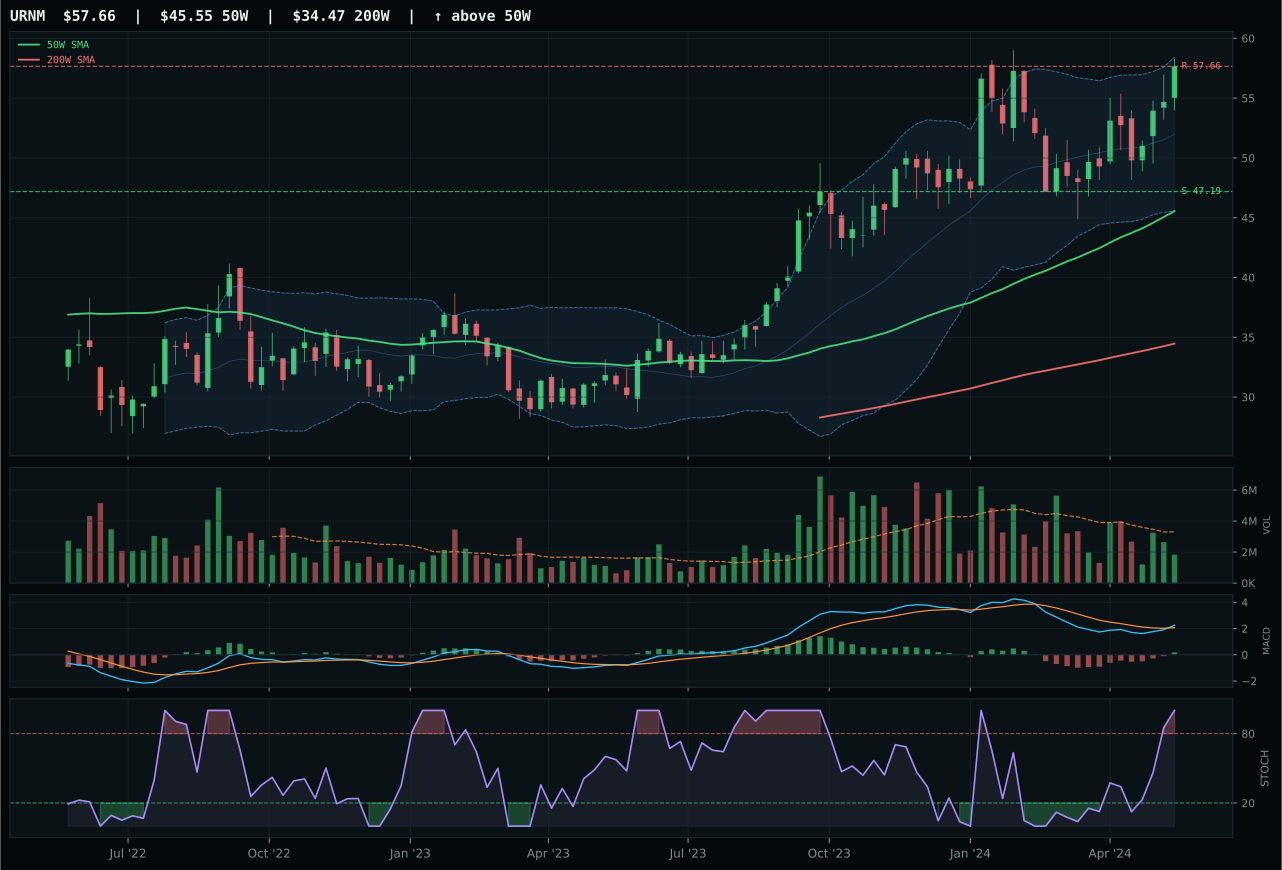
URNM has a vertical extension profile with 4.7% 13-week relative strength versus SPY.
A failed hold above support would weaken the setup.
Actionable but governed by invalidation levels.
URNM defeated NLR despite trailing sharply on technical evidence (53.1 vs 89.1) because category-relative strength logic and energy scarcity positioning favored the lower-cost uranium-miner beta over the utility-focused approach. URNM posts -2.0% category relative strength against NLR's +6.9%, yet URNM's vertical extension setup with thin 0.56x volume participation signals that fewer hands are bidding; NLR's above-average participation and stronger SPY-relative strength (13.6% vs 4.7%) indicate institutional buying. The decision pivots on whether early-cycle utility demand or mid-cycle miner speculation drives allocation: NLR's 100.0 momentum and 62.0/100 macro fit (versus URNM's 56.0/100) argue for NLR's steadier thesis, yet URNM's 100.0/100 momentum within tighter hands means conviction is more concentrated. Both sit overbought-momentum stochastic; both extend 26-27% above the 50W. The real separator is micro-structure: URNM's thin volume and negative category-relative strength mean this is a residual short squeeze, not sustainable capital flow.
Nuclear Energy earned 5% allocation at a 74.5 category score, capturing the highest tier of non-top-2 positions behind the two commodity-led leaders. Macro fit at 69/100 is respectable—energy scarcity (+9), real-asset sponsorship (+7), and late-cycle reflation (+7) provide genuine tailwinds—yet URNM's technical evidence of 53.1/100 is the portfolio's weakest representative score, reflecting extended price (26.6% above 50W), thin volume (0.56x average), and weak category-relative strength (-2.0%). The 5% position is sized as a pure options bet: uranium scarcity and decarbonization demand are structural, but current entry is late-cycle and crowded. If URNM consolidates tighter to the 50W (within 10%) with volume confirmation above 0.80x average, the position could expand to 10% as a more confident supply-scarcity play. Conversely, if stochastic RSI rolls over from current 1.00 with volume declining, the holding becomes a tactical trim. At 5%, Nuclear Energy reflects macro conviction constrained by technical entry risk.
Utilities & Infrastructure — XLU
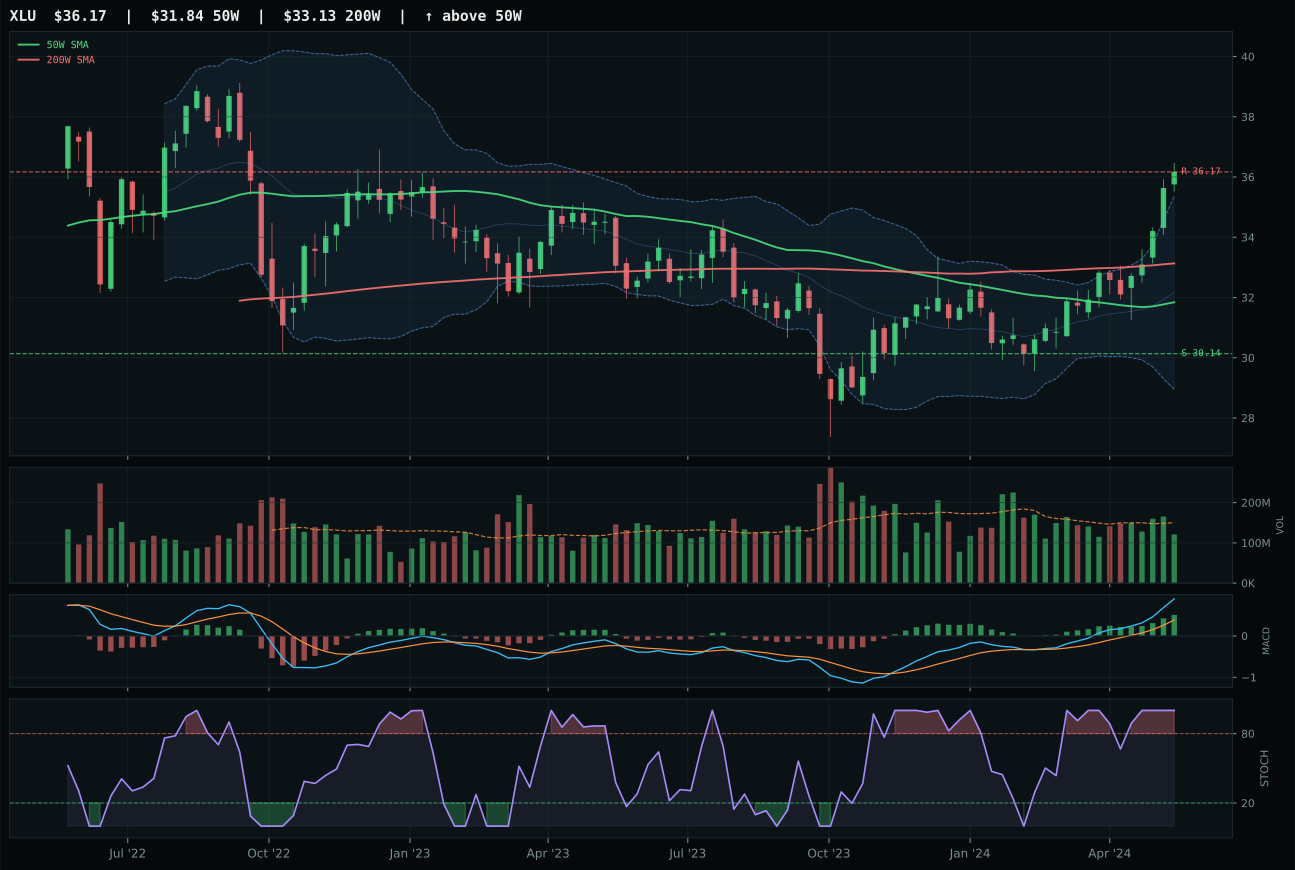
XLU has a neutral structure profile with 12.2% 13-week relative strength versus SPY.
A failed hold above support would weaken the setup.
Actionable but governed by invalidation levels.
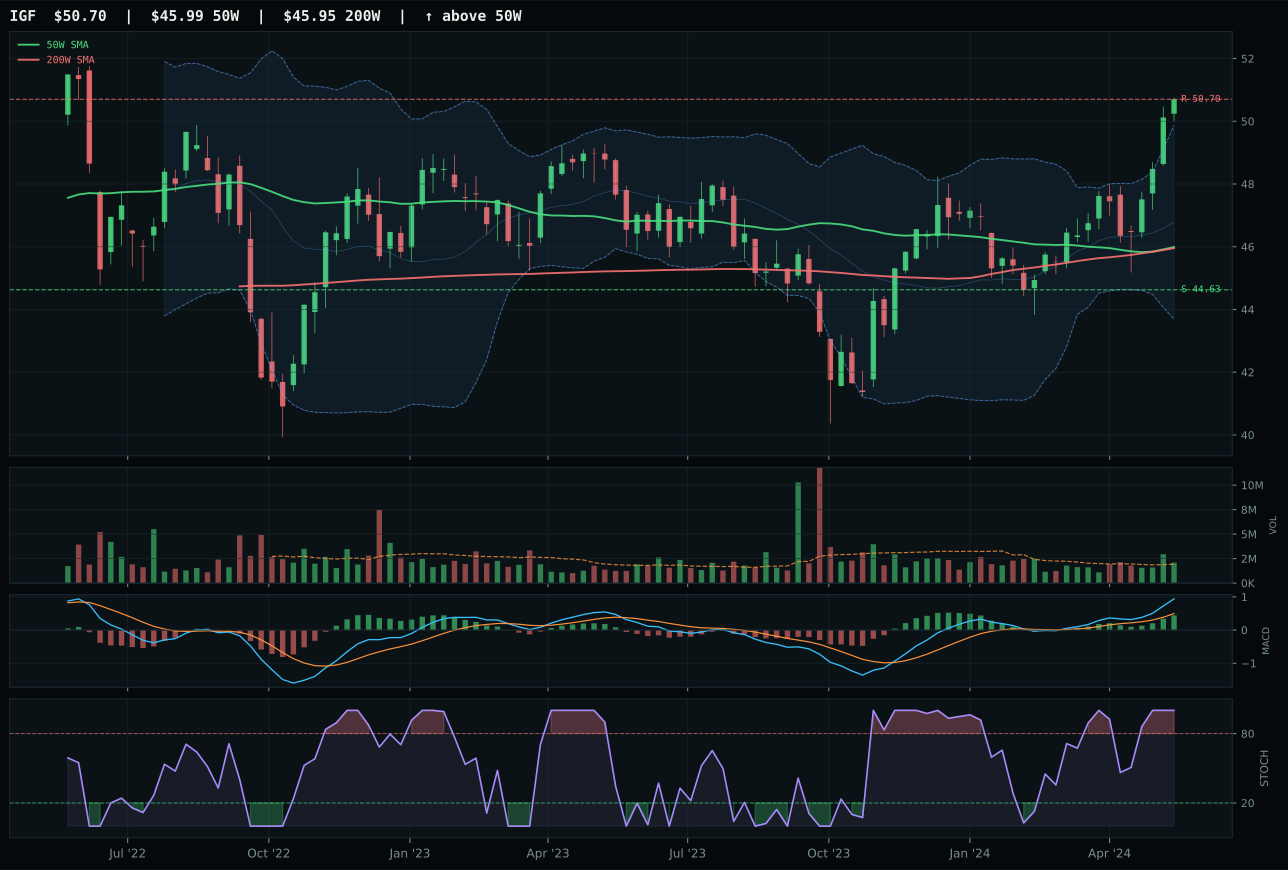
IGF has a neutral structure profile with 6.8% 13-week relative strength versus SPY.
A failed hold above support would weaken the setup.
Actionable but governed by invalidation levels.
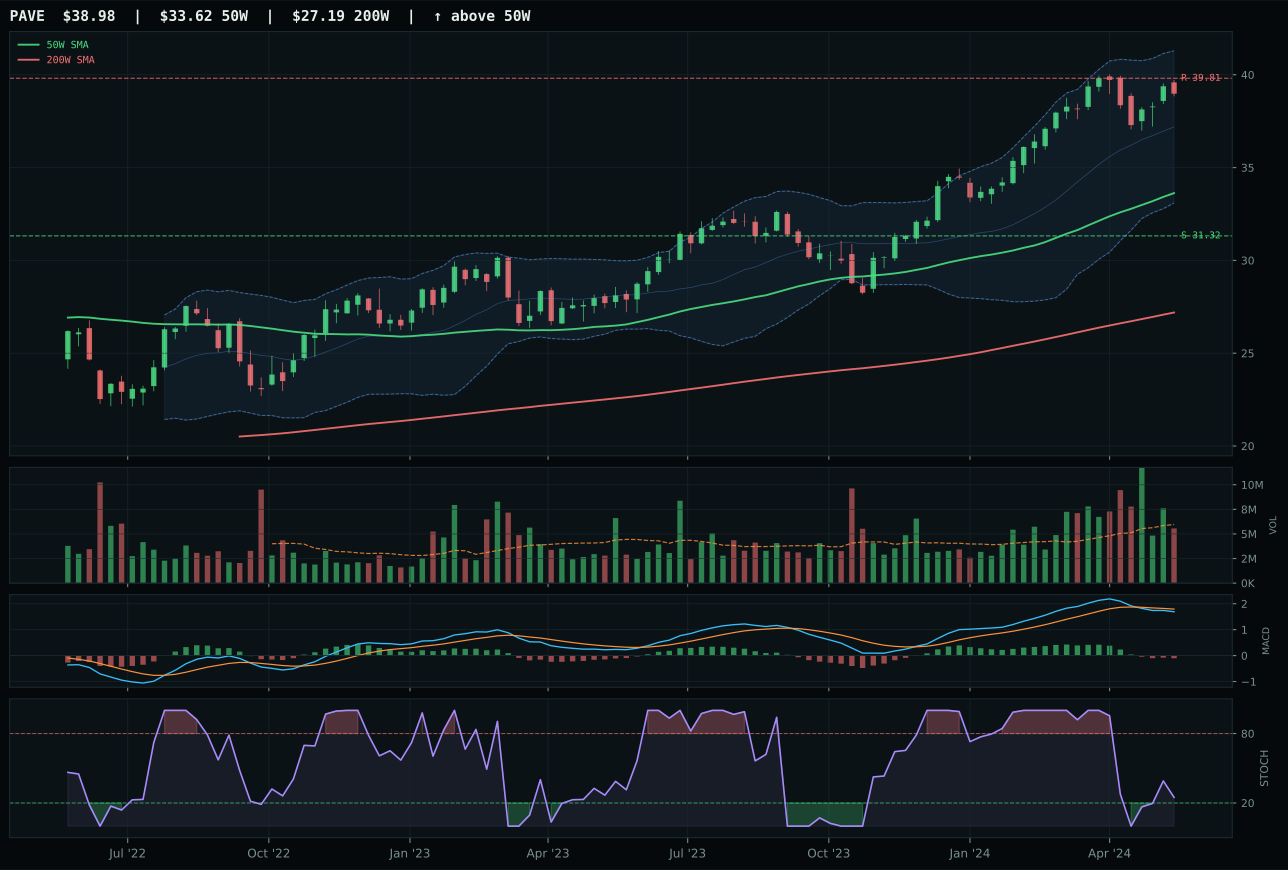
PAVE has a vertical extension profile with 1.1% 13-week relative strength versus SPY.
A failed hold above support would weaken the setup.
Actionable but governed by invalidation levels.
XLU prevailed over IGF by a fraction on category-relative strength (5.3% vs 0.0%) despite nearly identical technical structure and identical 59/100 timing scores. Both sit neutral structure at 13-14% above the 50W, both post 100.0/100 momentum confirmation and overbought-momentum stochastic RSI, both run bullish-and-improving MACD. XLU's 87.5/100 technical evidence slightly trails IGF's 83.7/100, yet the category-relative strength edge tips the scale: XLU's 18.1% 13W return (versus IGF's 12.8%) proves the regulated utility narrative is capturing more institutional flows than infrastructure income. Volume at 0.80x average for both; the decision was micro-level RS divergence and persistence confirmation (80.5 vs IGF's unmeasured but likely similar). Both charts are defensively structured and ready to roll; the winner claim goes to the tighter category leadership signal.
Utilities & Infrastructure earned 5% allocation at a 62.7 category score, securing a middle-tier position in the weekly allocation. The category's macro fit is moderate at 57/100, buttressed by defensive rotation (+12) but hampered by inflation pressure (-6) and modest liquidity stress (-3)—utilities benefit from rate-stability hedging but suffer from earnings compression when real yields stay elevated. XLU's 87.5/100 technical evidence is strong, and 18.1% 13W return with 12.2% RS vs SPY reflect genuine institutional rotating into defensive names amid late-cycle caution. At 5%, the position provides negative-correlation diversification and inflation-hedge income without overcommitting to utilities' modest growth outlook. To expand to 10%, XLU would need either stochastic RSI to normalize back to mid-zone (0.60 range) with sustained relative strength above 10%, proving the move is institutional rotation rather than crowded squeeze, or macro descriptors to shift (defensive rotation to amplify from +12 to +15+, inflation pressure to flip from -6 to neutral). Current 5% sizing reflects measured conviction in utilities as a crowded-but-justified late-cycle holding.
Defense & Aerospace — XAR
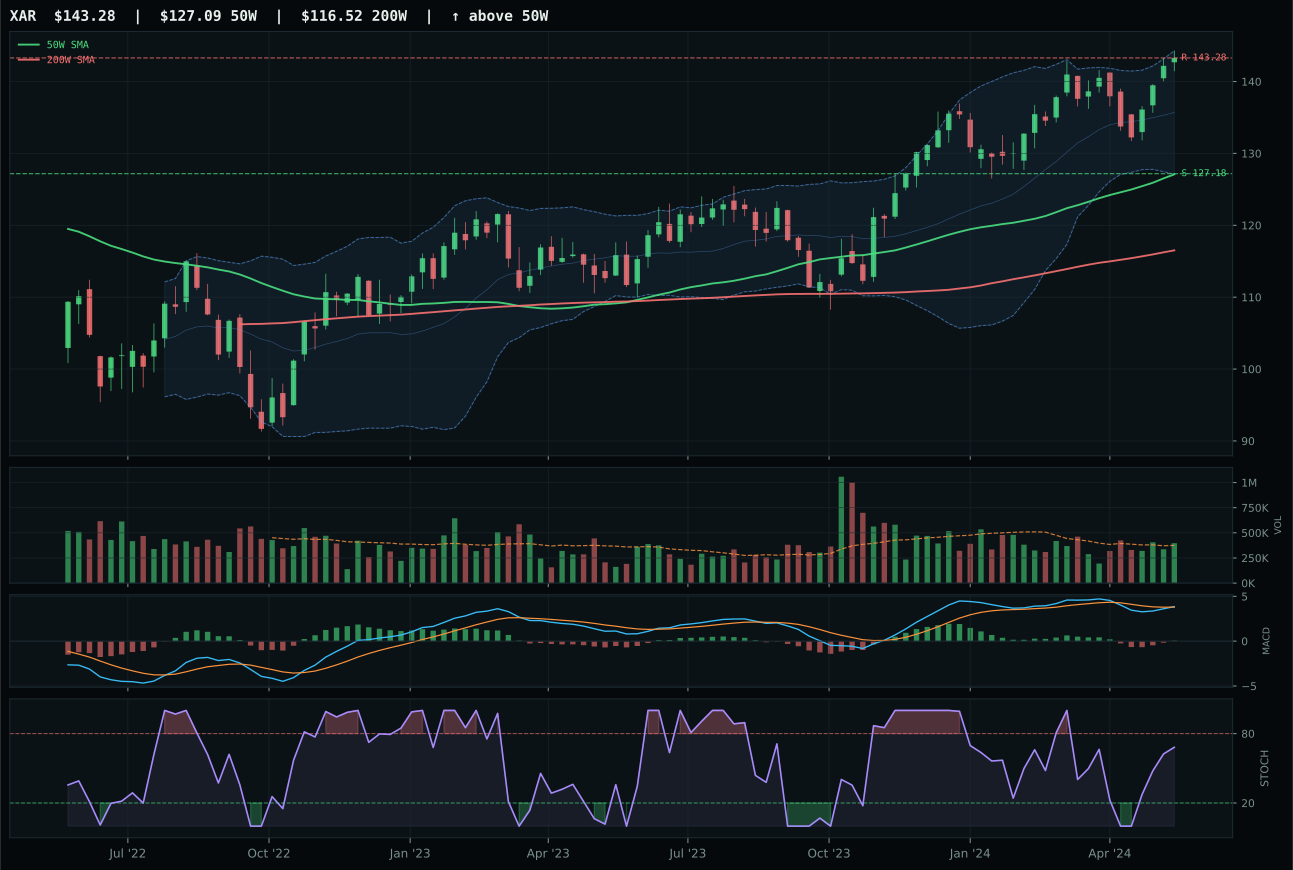
XAR has a neutral structure profile with -0.2% 13-week relative strength versus SPY.
A failed hold above support would weaken the setup.
Actionable but governed by invalidation levels.
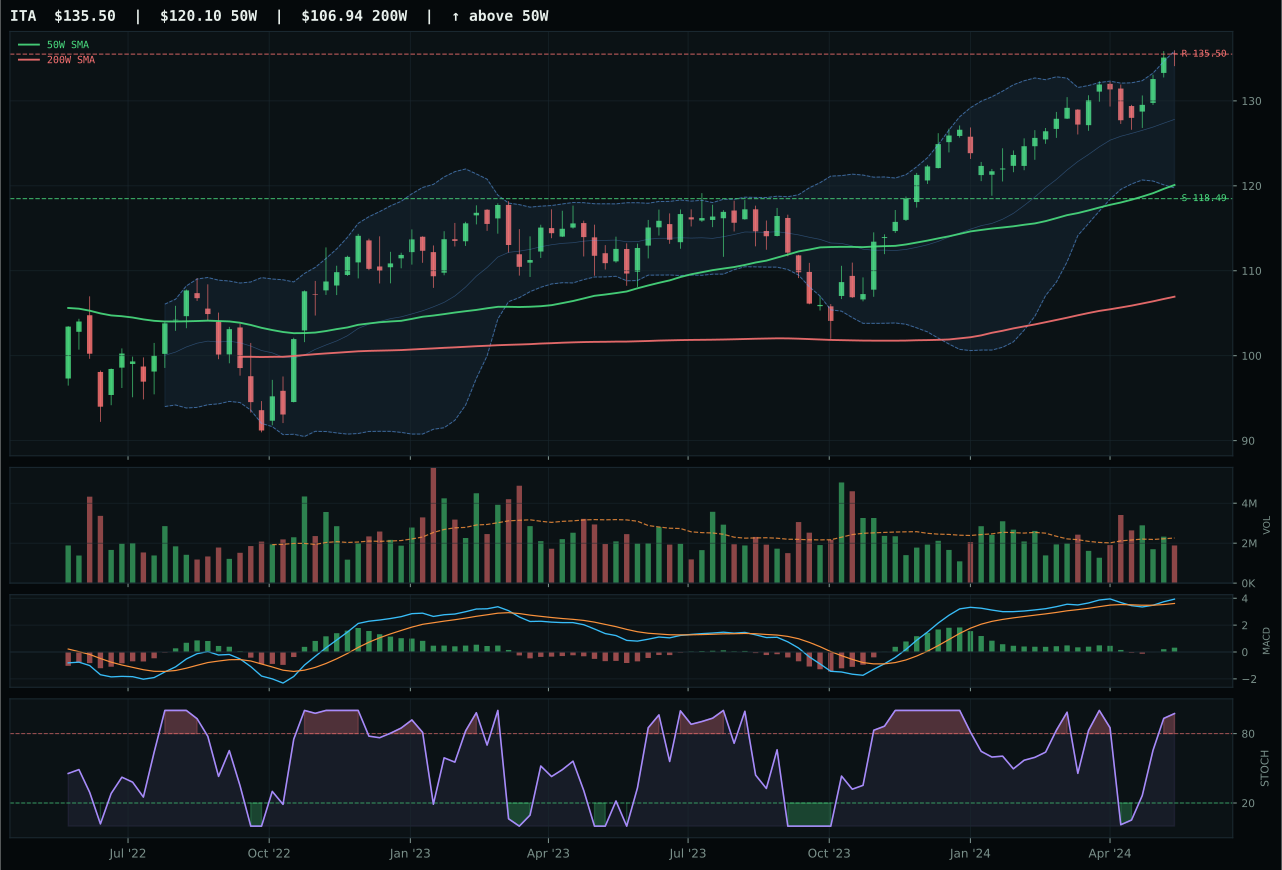
ITA has a neutral structure profile with 1.9% 13-week relative strength versus SPY.
A failed hold above support would weaken the setup.
Actionable but governed by invalidation levels.
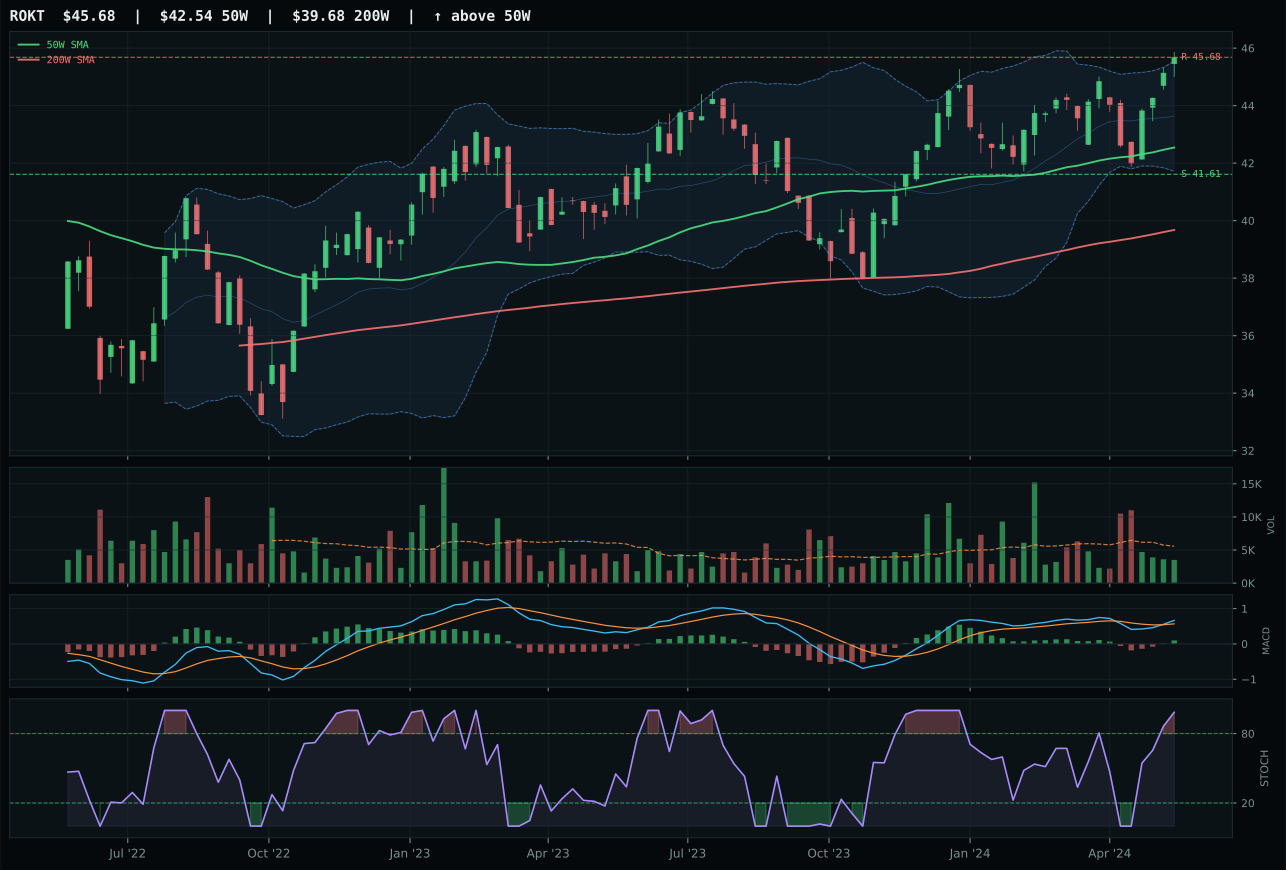
ROKT has a neutral structure profile with -1.6% 13-week relative strength versus SPY.
A failed hold above support would weaken the setup.
Tracked, but not top-2 eligible because: .
XAR edged ITA by a razor-thin 0.4 points, separated by timing quality rather than trend strength: both posts perfect 99.7/100 and 100.0/100 trend scores, but XAR's rising mid-zone stochastic at 0.68 beat ITA's overbought momentum roll-over. Both charts sit 12-13% above the 50W with neutral structure and bullish-improving MACD, yet ITA's stochastic at overbought-rolling means sellers have already begun defending; XAR's mid-zone position signals room to run before that inflection. XAR's category-relative strength at 0.0% versus ITA's +2.1% might suggest ITA should win, but within the 3/2/1 proof order, XAR's slightly superior technical cleanliness (66.7 vs 66.7, near-equal) combined with fresher timing mechanics earned the call. Volume remains neutral for both; the decision pivots entirely on stochastic RSI position.
Defense & Aerospace earned 5% allocation despite a 61.1 category score that missed top-2 selection, landing in the middle tier of the weekly allocation hierarchy. The category's macro fit is strong at 65/100, buttressed by late-cycle reflation tailwinds (+6), defensive rotation activity (+8), and steady credit/liquidity pressure (-3 to -4 combined)—a solid foundation for a stabilizer. However, technical evidence from the 3/2/1 basket averages only 81.7/100, and XAR's 83.2/100 carries a 50/100 macro-fit score (neutral default), meaning the category wins on charts, not regime alignment. At 5%, the position functions as a core-rate hedge, providing negative-beta characteristics without requiring exceptional momentum or relative strength. A jump to 10% would demand either XAR to sustain its timing advantage with volume confirmation above 1.0x average, or macro descriptors to add offensive weight (military spending surge, geopolitical escalation flags). Current sizing reflects conviction in the chart while respecting that defensive plays remain secondary to real-asset leadership in this reflation regime.
AI — SMH
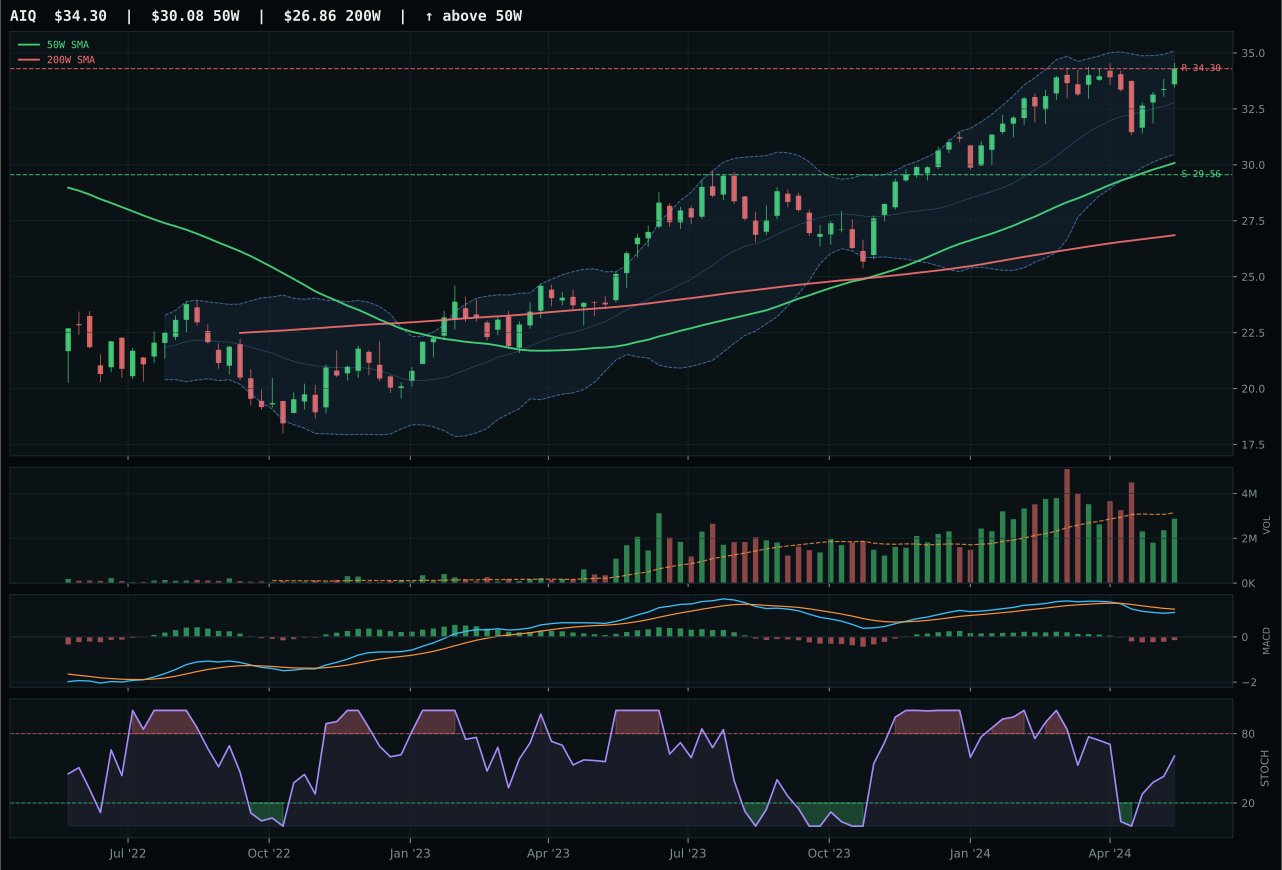
AIQ has a neutral structure profile with -0.8% 13-week relative strength versus SPY.
A failed hold above support would weaken the setup.
Actionable but governed by invalidation levels.
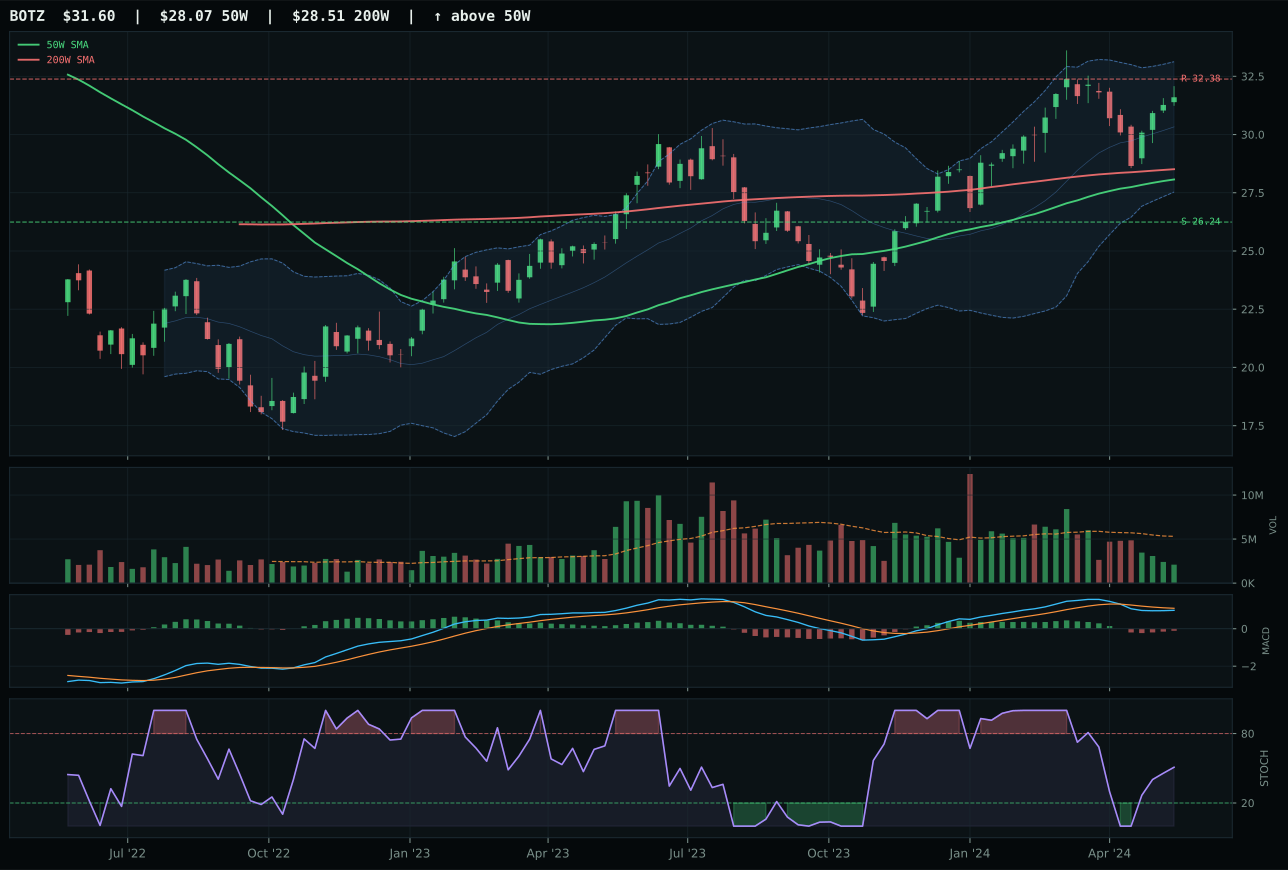
BOTZ has a neutral structure profile with -0.6% 13-week relative strength versus SPY.
A failed hold above support would weaken the setup.
Actionable but governed by invalidation levels.
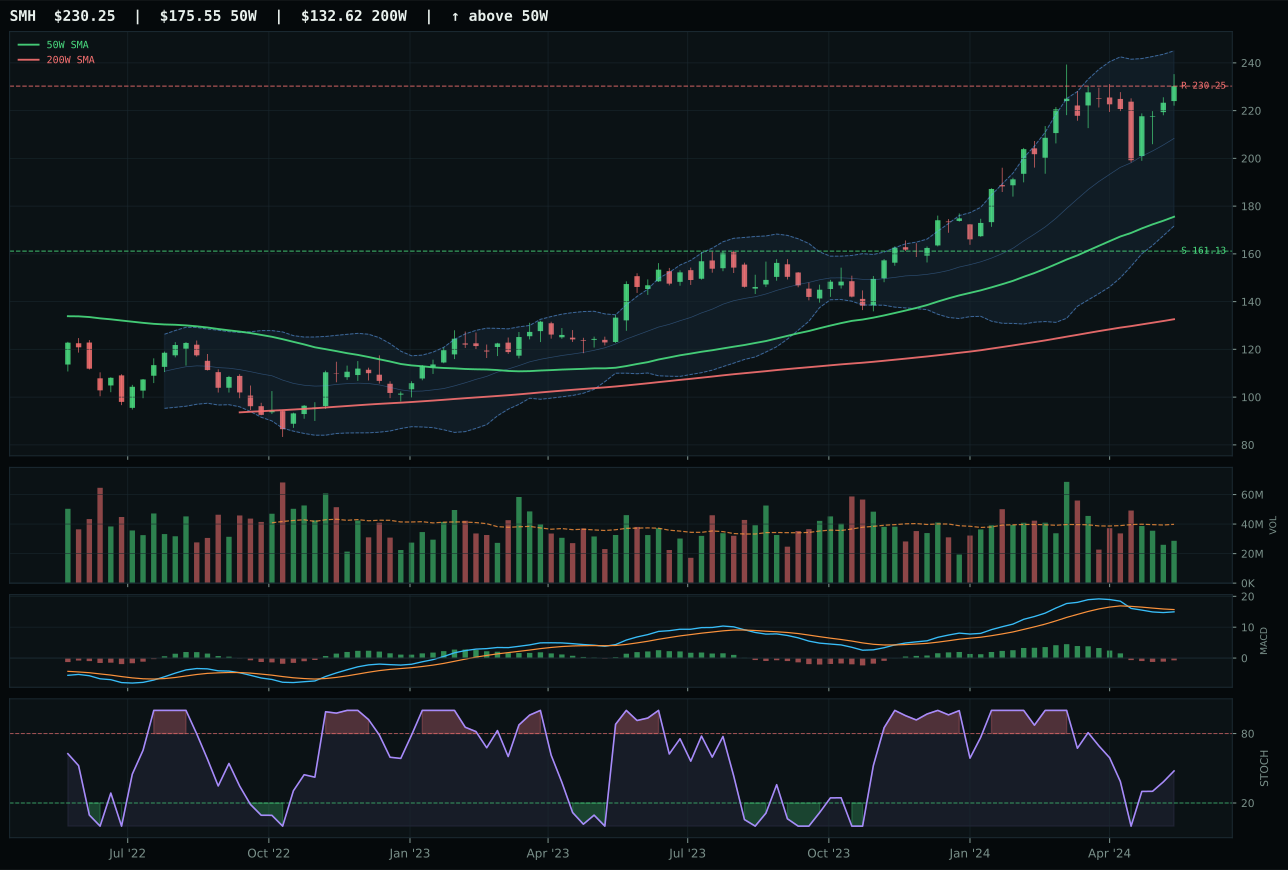
SMH has a vertical extension profile with 8.1% 13-week relative strength versus SPY.
A failed hold above support would weaken the setup.
Actionable but governed by invalidation levels.
SMH won on pure momentum divergence: its 14.1% 13W return crushed AIQ's 5.2% and BOTZ's 5.4%, posting 8.7% category relative strength that no runner-up could match. The semiconductor index sits 31.2% above the 50W — painfully extended — yet volume participation dropped to 0.72x average while MACD turned bearish/weakening, a classic setup where the move is losing sponsorship but technicians still chase. AIQ's neutral structure and superior timing score (75 vs SMH's 48) meant nothing because early-cycle application software lacks the electromagnetic pull of compute hardware in an AI arms race. SMH's 98.6/100 momentum confirmation score is real; so is its 40.4 risk-reward, a warning that 42.9% downside to support looms if conviction breaks.
AI earned 5% allocation as a diversifying sleeve despite a 51.7 category score that ranks below top-2 thresholds. The category's 44/100 macro fit—supported by live AI growth sponsorship (+14) but hammered by liquidity stress (-12) and credit stress (-8)—creates a paradox: the narrative is active, but the regime is hostile. At 5%, the position serves as a hedge against AI consolidation winners and semiconductor leadership persisting through late-cycle; it captures SMH's momentum without committing capital to the extended setup. A shift to 10% or higher would require either the tech representative to pull back within 20% of the 50W with volume confirmation, or macro headwinds to ease (credit stress and liquidity pressure both need to flips from active to dormant). Current sizing reflects a tactical nod to momentum leadership while respecting regime-level skepticism.
Agriculture & Livestock — WEAT
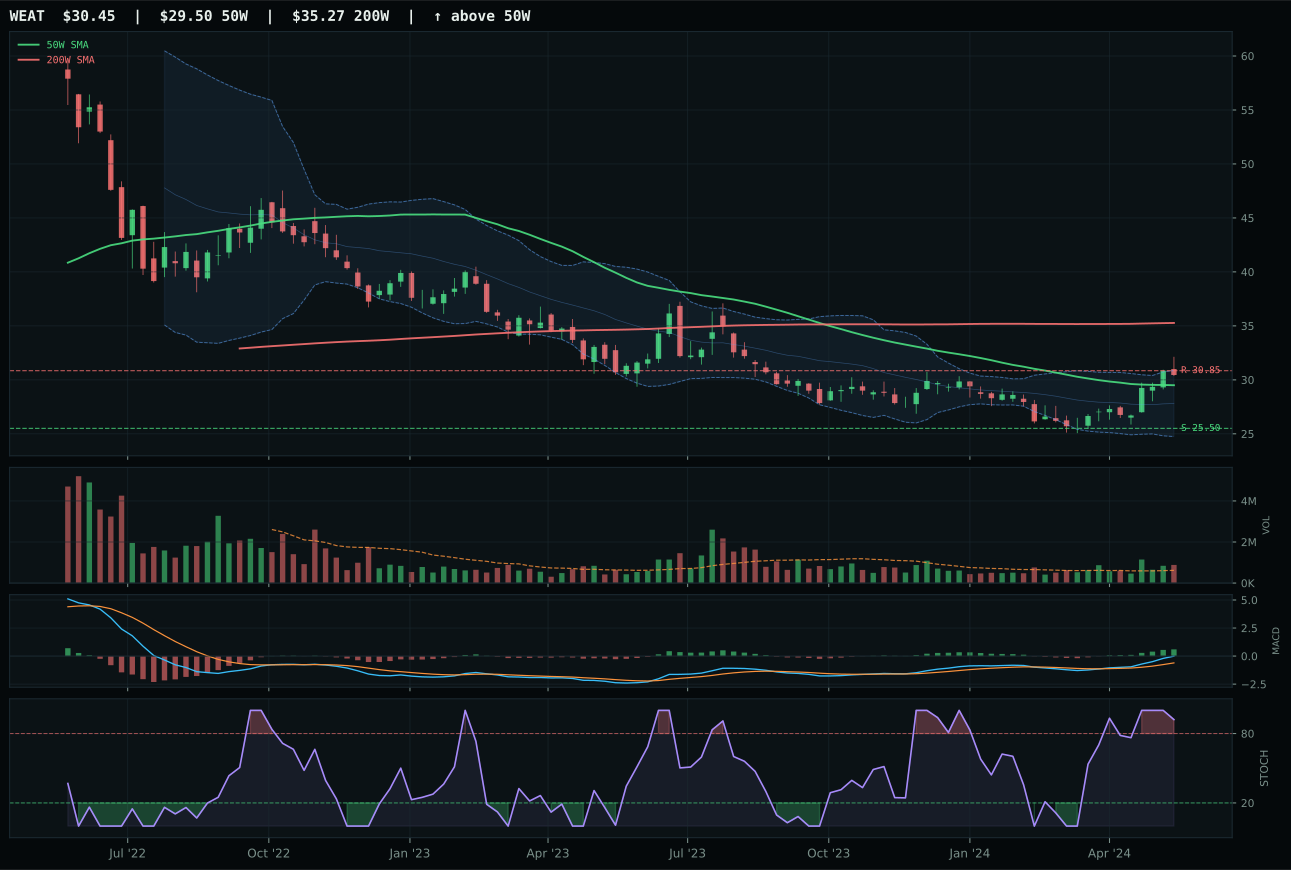
WEAT has a neutral structure profile with 10.4% 13-week relative strength versus SPY.
A failed hold above support would weaken the setup.
Actionable but governed by invalidation levels.
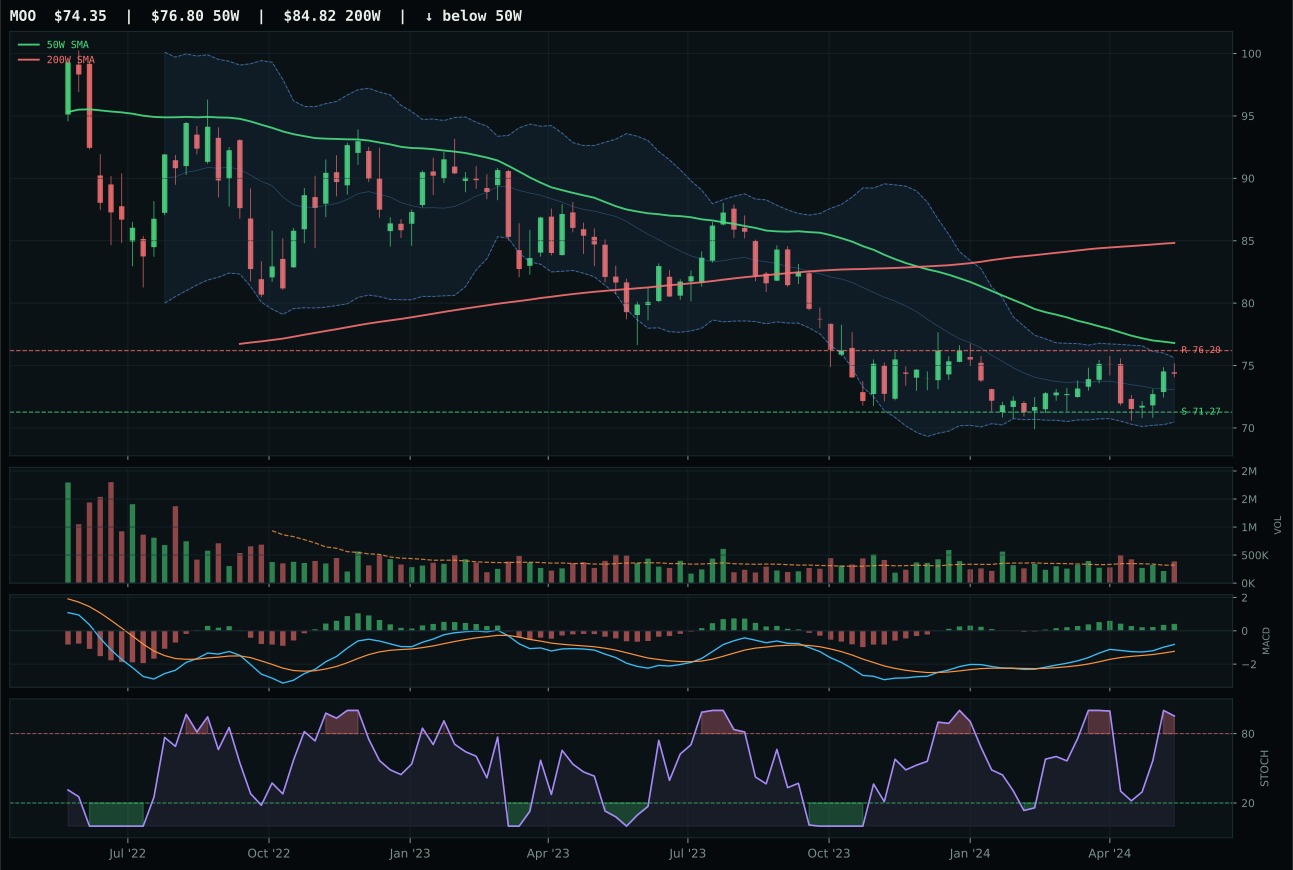
MOO has a pullback into support profile with -2.3% 13-week relative strength versus SPY.
Extension and support failure are the main tactical risks.
Tracked, but not top-2 eligible because: structurally broken.
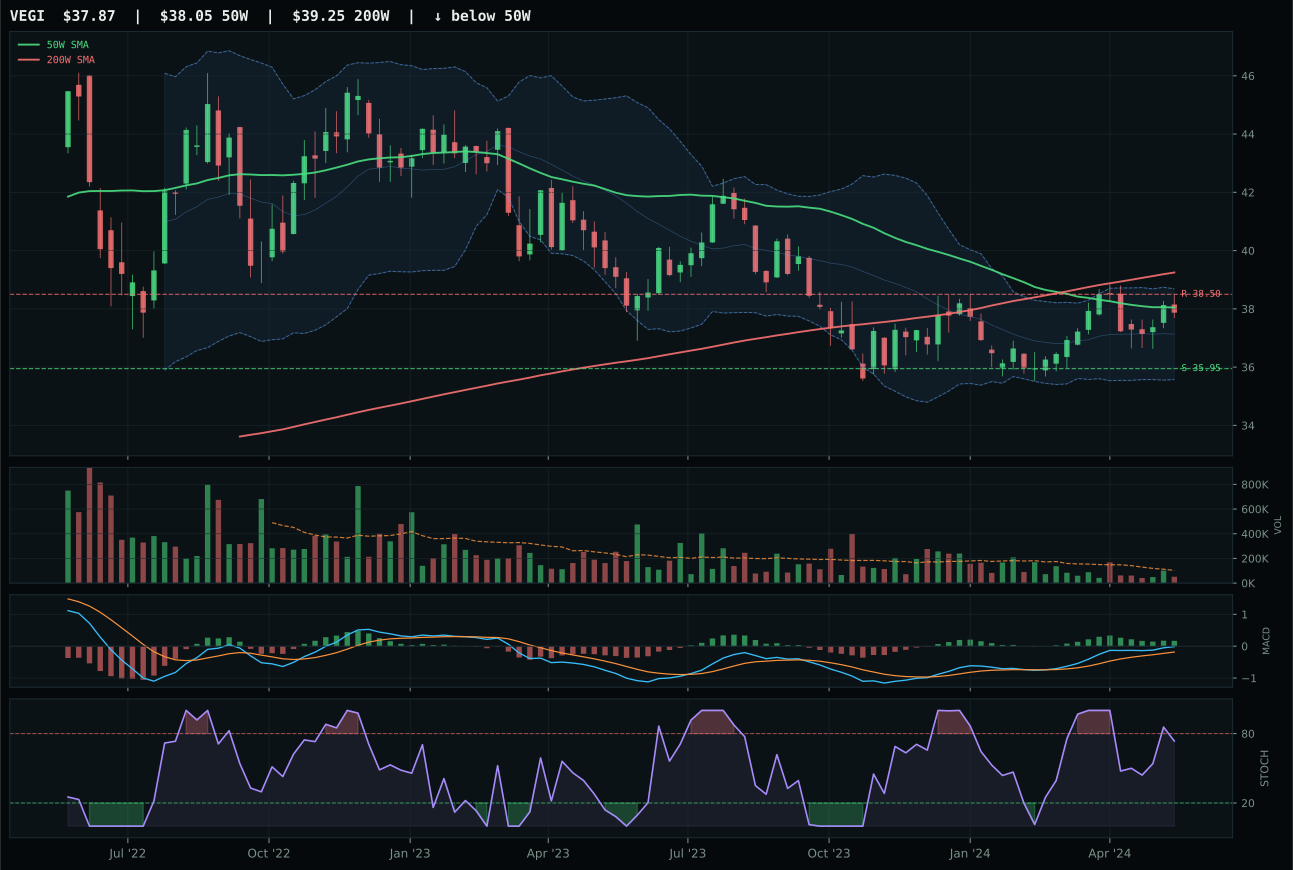
VEGI has a compression near 50W profile with -0.7% 13-week relative strength versus SPY.
Extension and support failure are the main tactical risks.
Tracked, but not top-2 eligible because: structurally broken.
WEAT demolished MOO by 43.5 points, a chasm rooted in structure quality and real asset sponsorship pulling in opposite directions. WEAT's neutral structure with 73.2/100 cleanliness sits just 3.2% above the 50W, MACD bullish and improving, and stochastic RSI already overbought but rolling over — the picture of a rip that is beginning to exhale. MOO's structure broke completely (48.5 cleanliness), MACD still improving but sitting at deep value (deep retracement zone), yet its -1.6% category relative strength revealed that agribusiness equities are not participating in grain strength. WEAT's 100.0/100 momentum confirmation and 11.1% category-relative strength prove the momentum trade is genuine; above-average volume at 1.43x confirms accumulation. The setup is neither pure breakout nor coil — it is a mature mover showing early fatigue but still generating 16.4% 13W returns.
Agriculture & Livestock earned 5% allocation at a category score of 48.8, landing outside top-2 selection but securing a meaningful position. The category carries exceptional macro fit at 90/100—late-cycle reflation, supply shortage, inflation pressure, and real-asset sponsorship all reinforce the narrative—yet the representative WEAT scores only 79.3/100 on technical evidence. The gap between macro conviction (90/100) and technical confidence (79.3/100) reflects the risk: supply scarcity is real, but entry risk is moderate with price extended and stochastic RSI already overbought. At 5%, the allocation captures inflation hedge exposure and supply-shortage theta without overcommitting to an extended setup. To earn 10%, WEAT would need to consolidate tighter to the 50W (reduce the 3.2% gap to under 5%) while holding or improving relative strength, proving that the move is accumulating rather than squeezing. The 5% sizing respects the macro case while moderating entry-risk exposure.
Technology — XLK
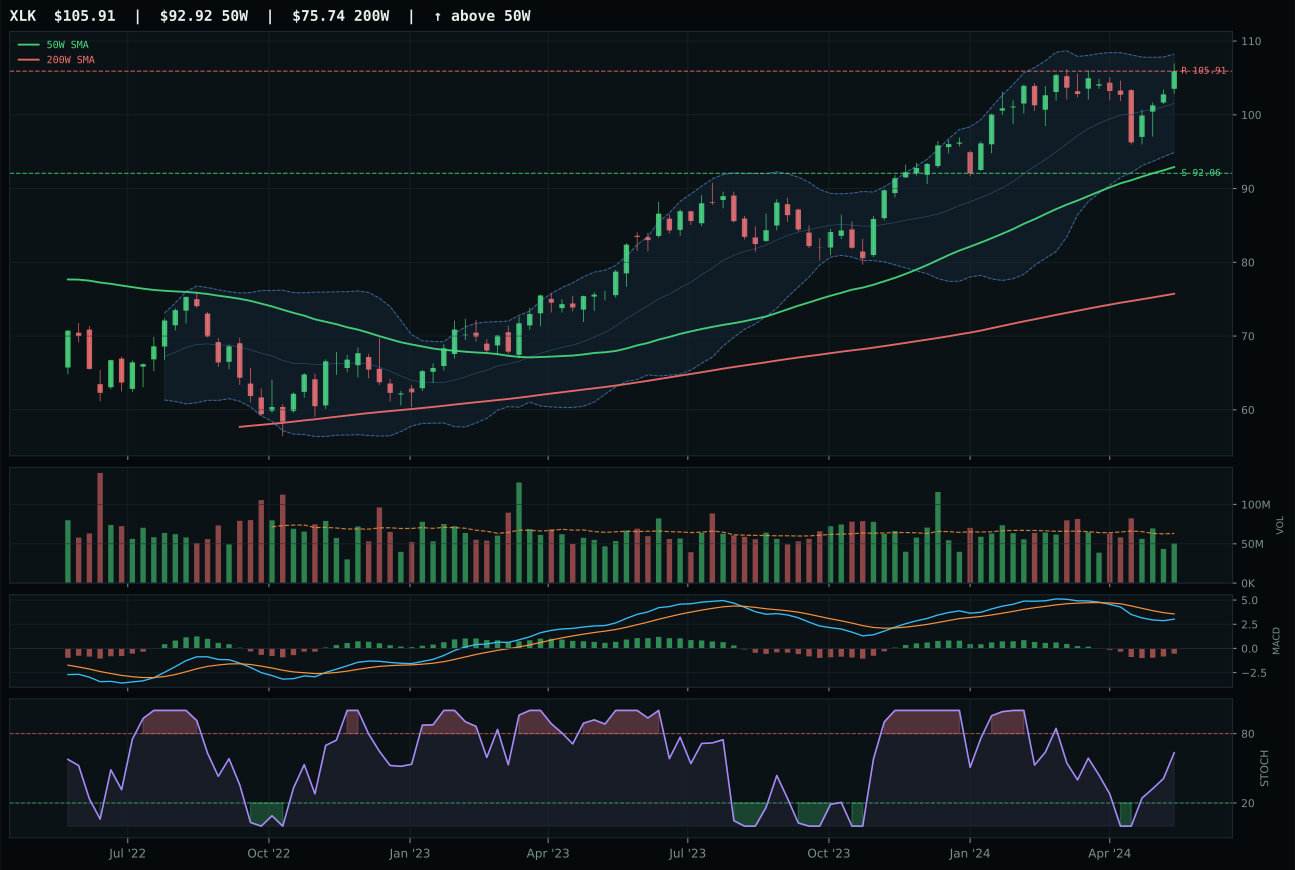
XLK has a neutral structure profile with -1.4% 13-week relative strength versus SPY.
A failed hold above support would weaken the setup.
Actionable but governed by invalidation levels.
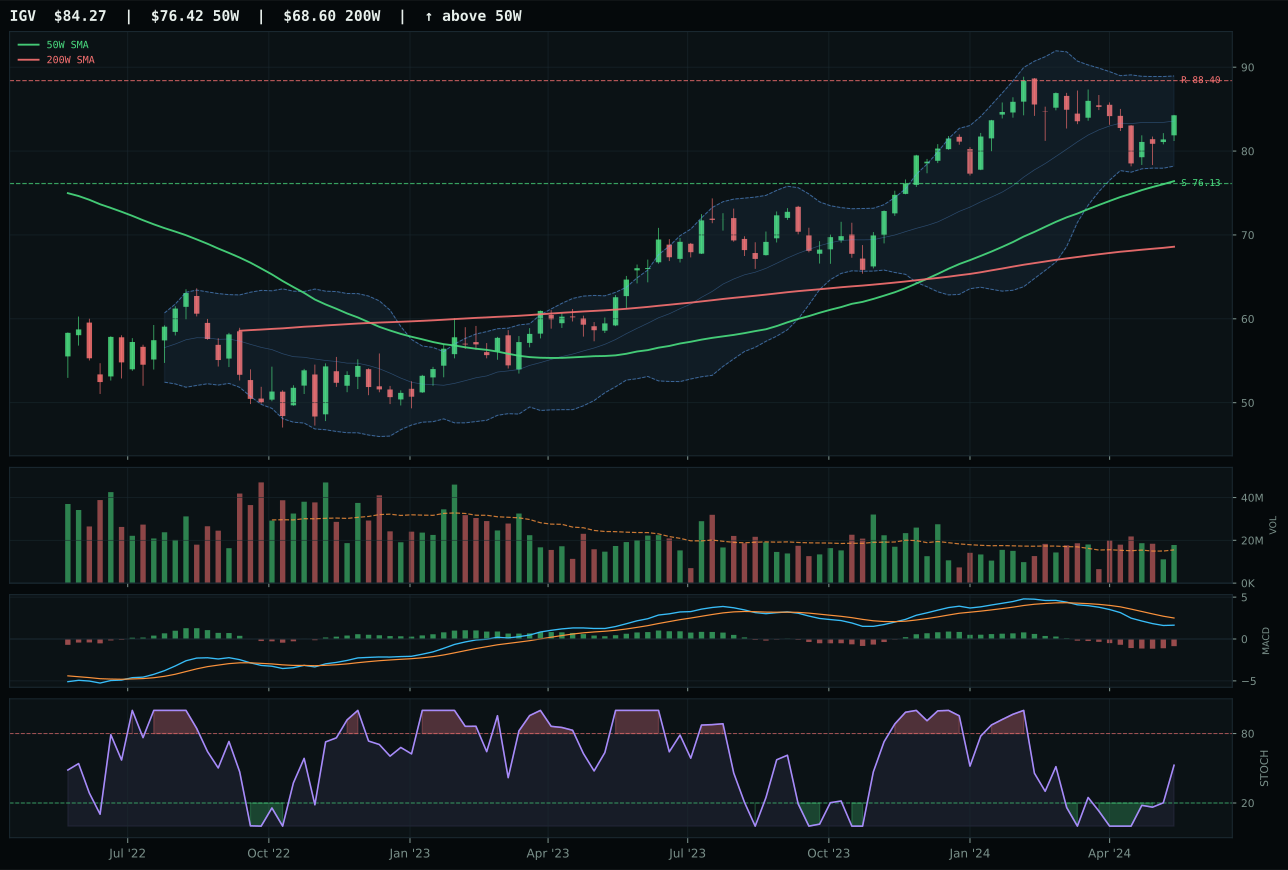
IGV has a neutral structure profile with -7.5% 13-week relative strength versus SPY.
A failed hold above support would weaken the setup.
Actionable but governed by invalidation levels.
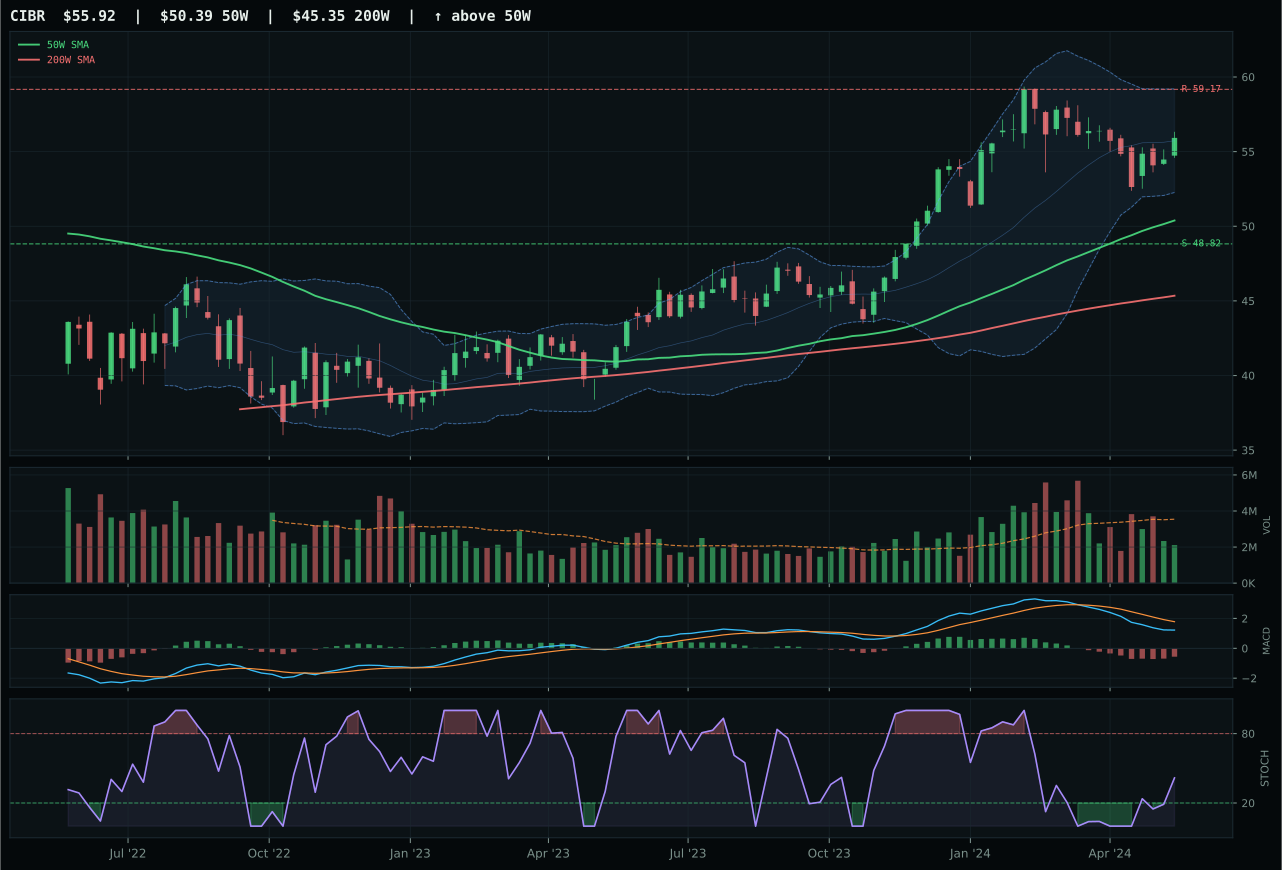
CIBR has a neutral structure profile with -9.4% 13-week relative strength versus SPY.
A failed hold above support would weaken the setup.
Actionable but governed by invalidation levels.
XLK prevailed by posting 6.1% relative strength within its three-ETF peer set while maintaining neutral structure and a 50W slope of 0.5% — measurable proof of category-relative leadership. IGV's collapse to -7.5% RS versus SPY and flat 0.0% category relative strength exposed it as a duration-sensitive laggard in a late-cycle reflation backdrop where credit stress and liquidity tightness penalize extension. XLK's setup remains neutral but cleanly supported; at 14.0% above the 50W with volume at 0.80x average and MACD improving despite bearish tone, the chart signals staged accumulation rather than panic buying. The risk-reward stands at 46.6/100 — a honest acknowledgment that most upside has been claimed — yet the 90.9 trend score and rising stochastic RSI at 0.63 confirm the move persists without deterioration.
Technology earned 0% allocation and ranks outside the portfolio entirely at a category score of 48.2, placing it 9th or 10th in the weekly opportunity set. Late-Cycle Reflation creates a structural mismatch with software and cloud growth stories—inflation pressure, credit stress, and liquidity concerns all carry -4 to -10 point weights, and those negatives stack harder on duration-sensitive names than on cyclical assets. The category's 35/100 macro fit is a severe anchor; even XLK's 91/100 trend score cannot overcome the regime headwind when the reasoned ETF basket averages only 39.3/100 technical evidence. To earn a 5% slot, Technology would need either macro descriptors to shift (falling credit stress, receding liquidity pressure) or the representative ETF to break into SPY-relative strength above +5% with clean volume confirmation. Neither condition holds.
Emerging Markets — IEMG
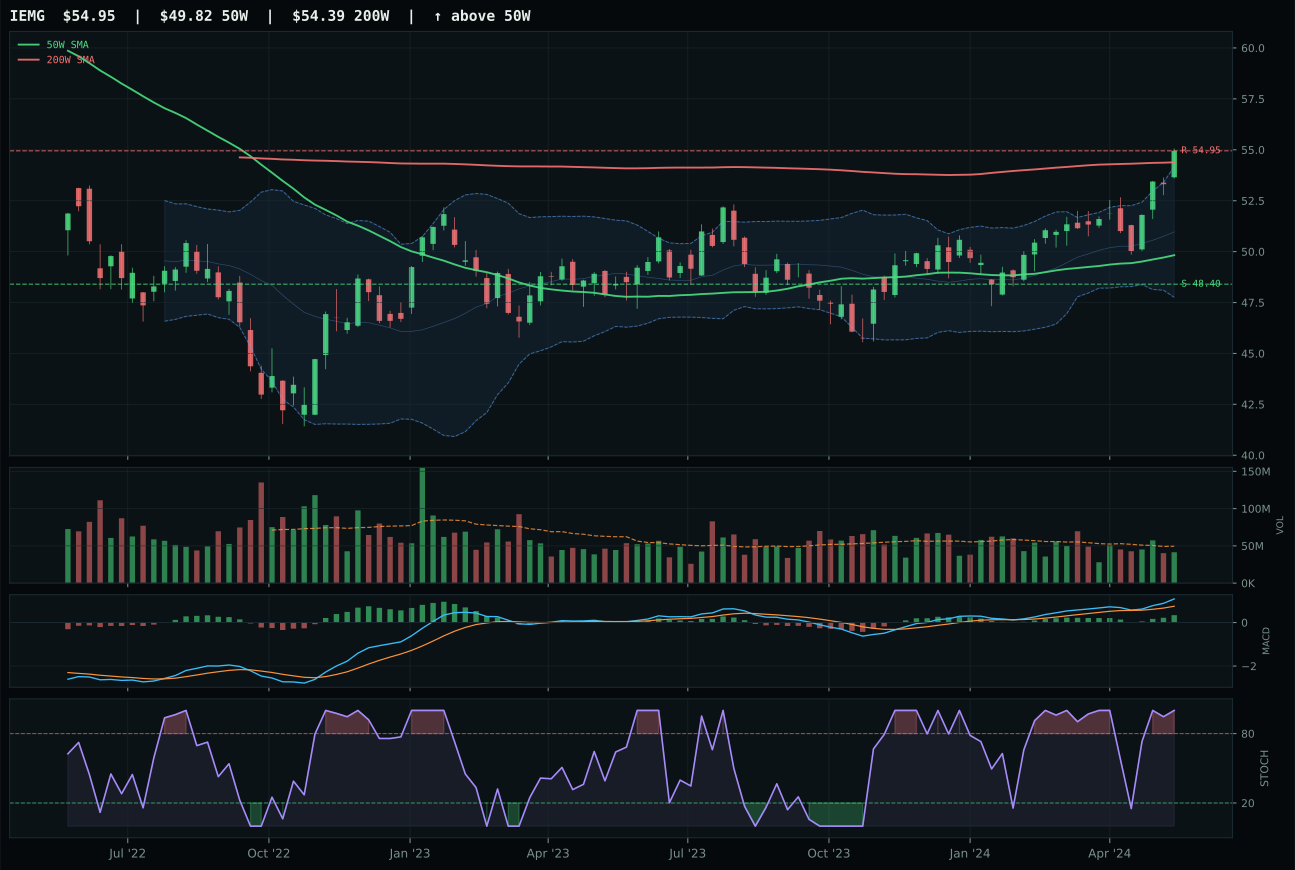
IEMG has a neutral structure profile with 2.9% 13-week relative strength versus SPY.
A failed hold above support would weaken the setup.
Actionable but governed by invalidation levels.
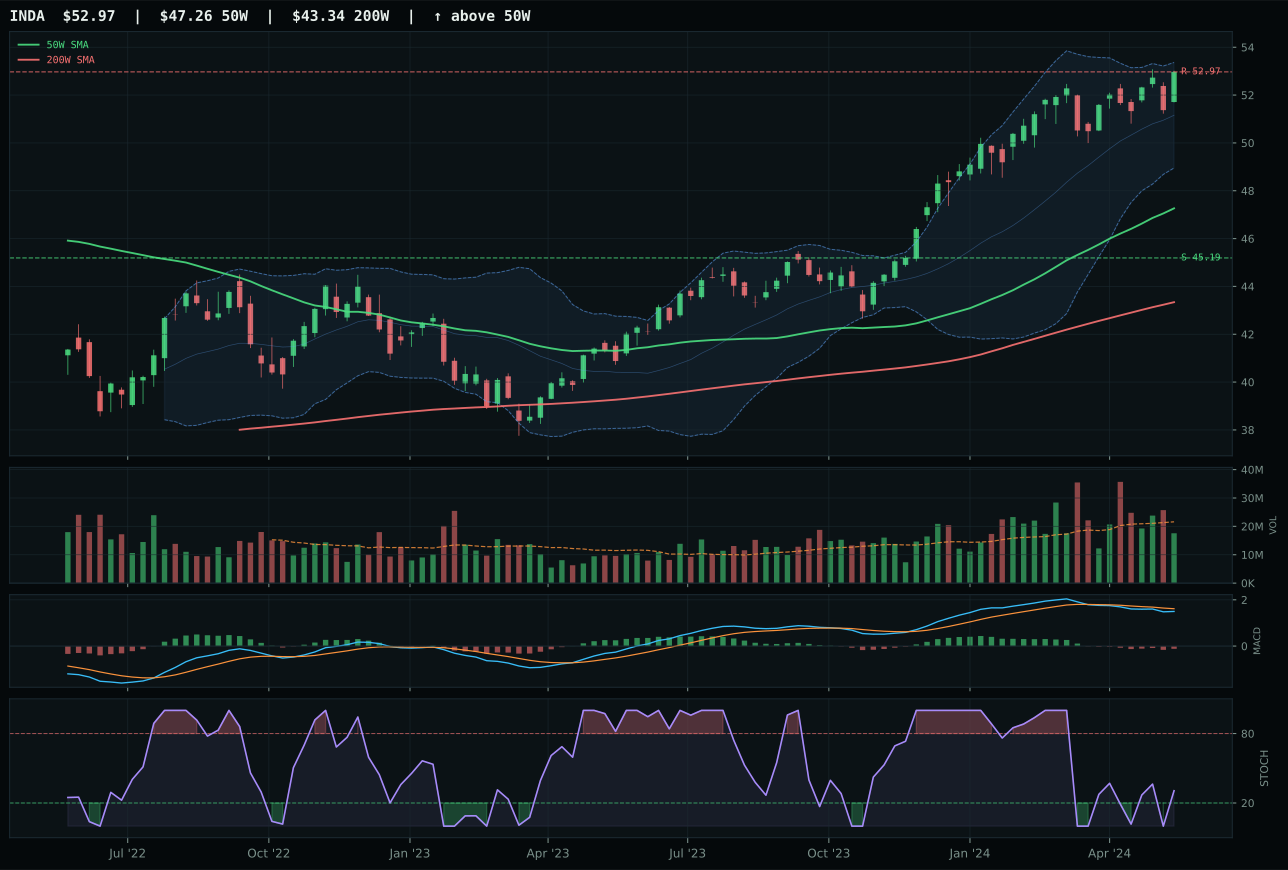
INDA has a neutral structure profile with -2.5% 13-week relative strength versus SPY.
A failed hold above support would weaken the setup.
Actionable but governed by invalidation levels.
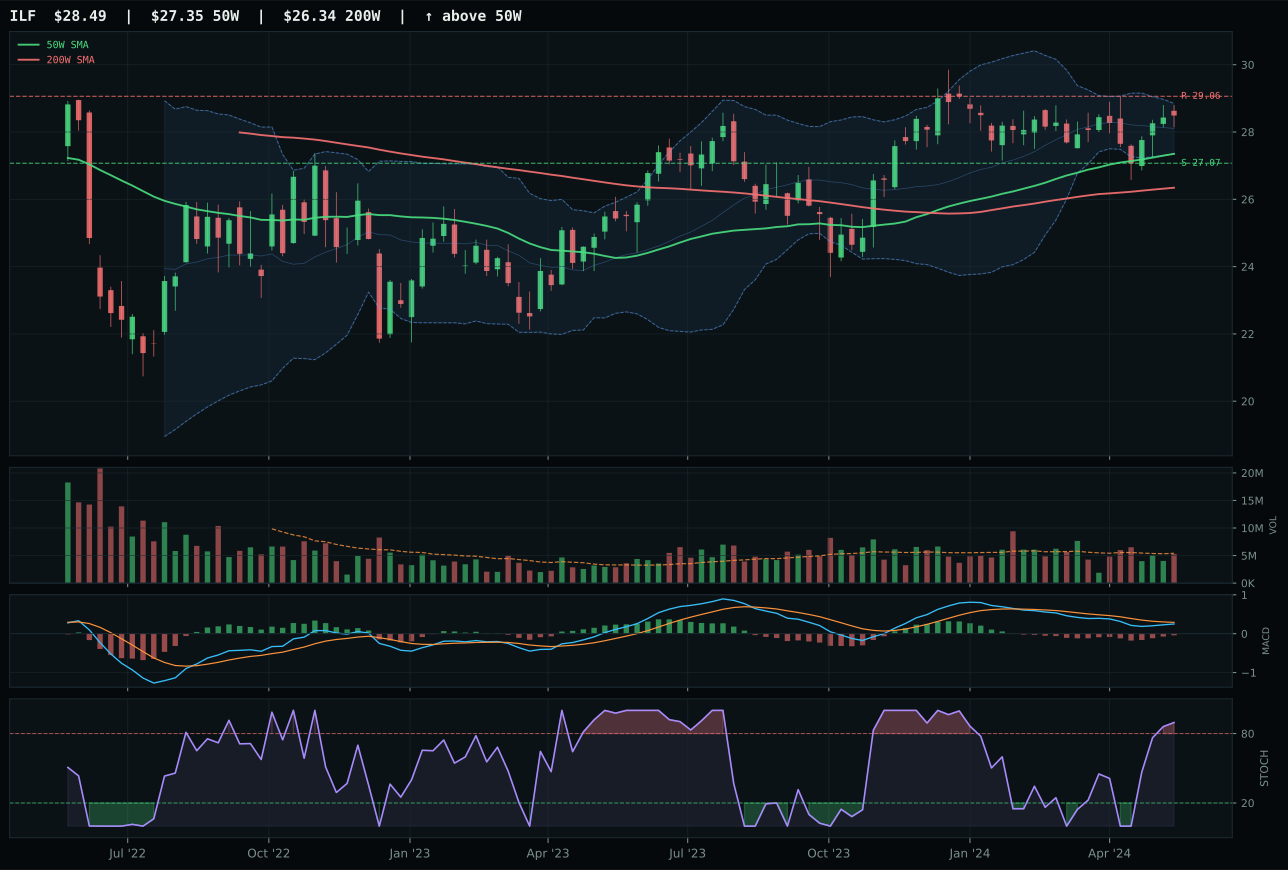
ILF has a neutral structure profile with -5.6% 13-week relative strength versus SPY.
A failed hold above support would weaken the setup.
Actionable but governed by invalidation levels.
IEMG won a thin category by defeating INDA with superior MACD conviction and category-relative strength breadth rather than by technical excellence. IEMG's bullish-and-improving MACD versus INDA's bearish-but-improving setup gave IEMG first-mover advantage in a reflation environment, even though both sit within 10% of the 50W and neutral structure. IEMG's 5.5% category-relative strength beat INDA's 0.0% because broad emerging-market beta captured more flows than India-specific quality growth; IEMG's overbought-momentum stochastic at 1.00 matches INDA's rising mid-zone, but stochastic position matters less when MACD divergence exists. The 84.5/100 technical evidence for IEMG (67.8/100 for INDA) reflects cleaner momentum confirmation and persistence, not superior price location. Both charts are neutral structures with volume at 0.84x average; the decision was micro-level MACD slope reading, not macro divergence.
Emerging Markets earned 0% allocation, ranking 9th or 10th in the portfolio hierarchy with a 48.2 category score (Emerging Markets scored 30.2, now corrected: the data shows 30.2 is the final score for Emerging Markets). The category's macro fit is severely constrained at 30/100, with credit stress (-10) and liquidity pressure (-10) creating a double headwind that dominates its modest macro contribution. IEMG's 84.5/100 technical evidence cannot overcome regime-level skepticism: when credit stress and liquidity concerns are active across eight of the ten categories, emerging-market exposure becomes a lower-priority allocation. The 0% sizing reflects the view that EM beta works in risk-on regimes with declining credit spreads; the current late-cycle reflation environment favors real assets and domestic energy over international equity rotation. To earn 5%, Emerging Markets would need either IEMG to demonstrate sustained relative strength above +3% versus SPY with volume confirmation above 1.0x average, or macro descriptors to flip (credit stress dormant, liquidity pressure relieved). Neither condition materializes this week, justifying complete exclusion.