
2024-05-10
Informational purposes only. The content in this report, including allocations, analysis, and commentary, is provided solely for informational and educational purposes. It does not constitute financial advice, investment advice, trading advice, or any other type of advice. Past performance does not guarantee future results. Always conduct your own research and consult a qualified financial professional before making investment decisions.
Weekly Allocation
| Ticker | Category | Weight | Role |
|---|---|---|---|
| FBTC | 50% | Overlay | |
| XLE | Traditional Energy | 10% | Top-2 (10%) |
| GLD | Precious Metals | 10% | Top-2 (10%) |
| COPX | Industrial Metals | 5% | Tier-2 (5%) |
| XLU | Utilities & Infrastructure | 5% | Tier-2 (5%) |
| NLR | Nuclear Energy | 5% | Tier-2 (5%) |
| XAR | Defense & Aerospace | 5% | Tier-2 (5%) |
| WEAT | Agriculture & Livestock | 5% | Tier-2 (5%) |
| BOTZ | AI | 5% | Tier-2 (5%) |
Trade Instructions — Monday Open
Sell the tranche from 2024-04-12 (completing its 4-week hold). Buy the new tranche. Instructions show net portfolio changes — same-asset positions cancel, weight changes show the delta.
| Action | Ticker | Instruction |
|---|---|---|
| SELL | URNM | Sell 50% of URNM position (reduce 2.50% → 1.25%) |
| SELL | AIQ | Sell 50% of AIQ position (reduce 2.50% → 1.25%) |
| SELL | ITA | Sell 33% of ITA position (reduce 3.75% → 2.50%) |
| BUY | NLR | Buy NLR — 33.33% of freed cash (adds 1.25% to portfolio) |
| BUY | BOTZ | Buy BOTZ — 33.33% of freed cash (adds 1.25% to portfolio) |
| BUY | XAR | Buy XAR — 33.33% of freed cash (adds 1.25% to portfolio) |
Current Portfolio After Trade
Combined holdings across all 4 active tranches. Each tranche is 25% of the portfolio.
| Ticker | % of Portfolio | Weight Bar |
|---|---|---|
| FBTC | 50.00% | |
| XLE | 10.00% | |
| GLD | 10.00% | |
| COPX | 5.00% | |
| XLU | 5.00% | |
| WEAT | 5.00% | |
| NLR | 3.75% | |
| ITA | 2.50% | |
| BOTZ | 2.50% | |
| XAR | 2.50% | |
| URNM | 1.25% | |
| AIQ | 1.25% | |
| SMH | 1.25% |
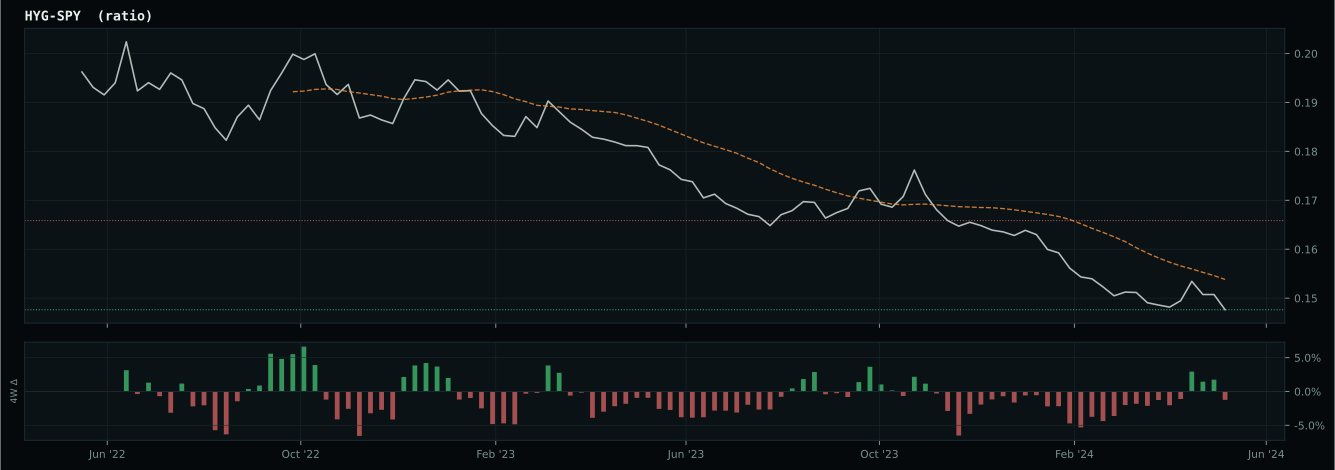
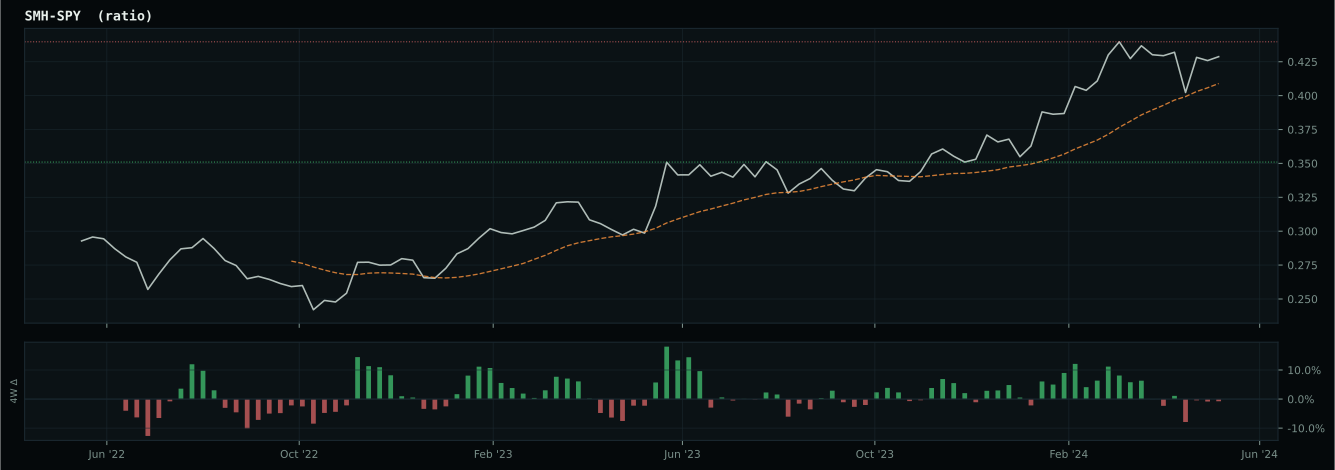
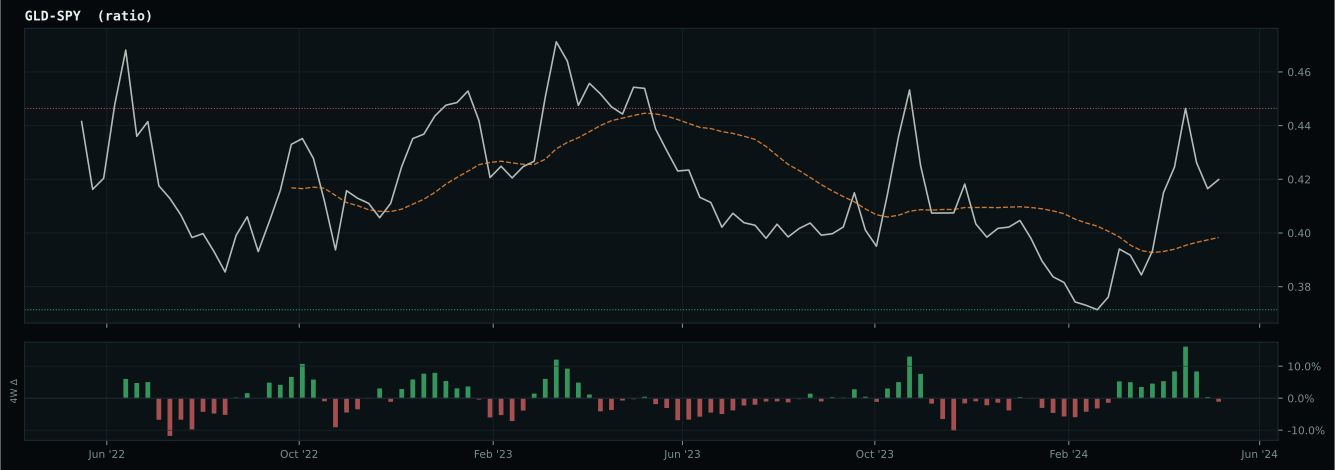
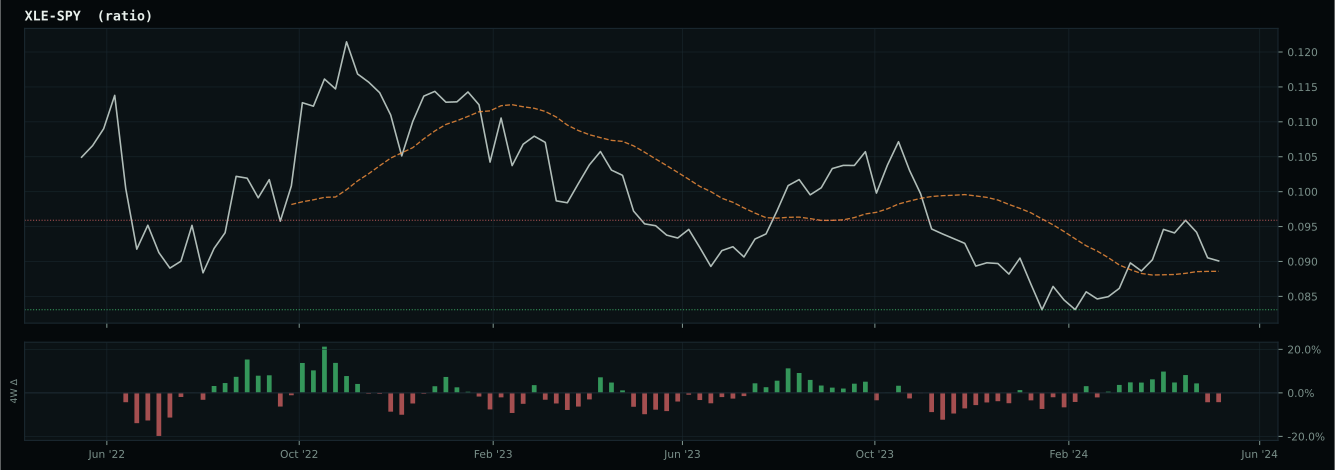
Macro Regime — Late-Cycle Reflation
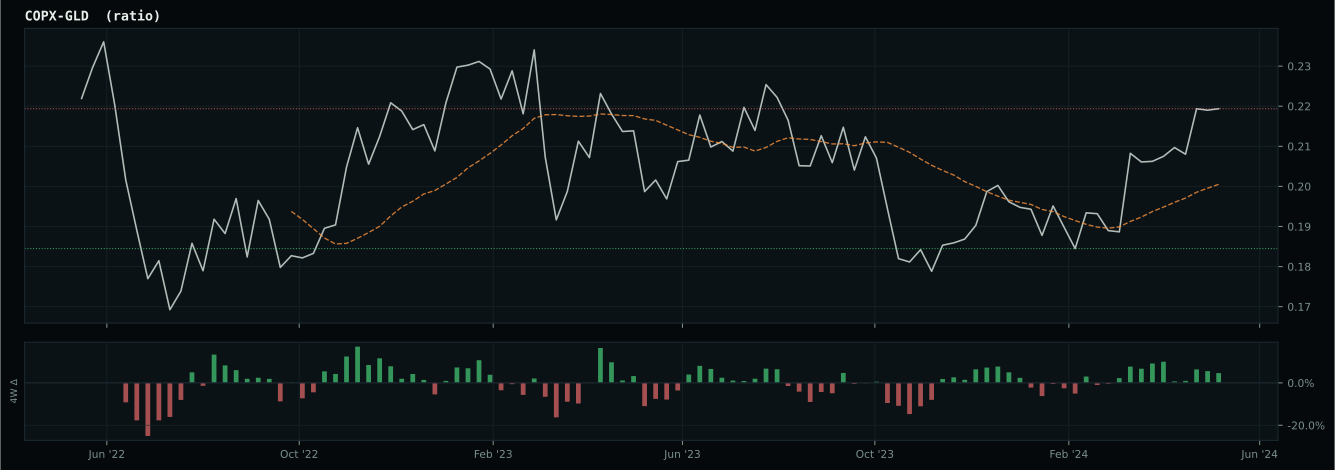
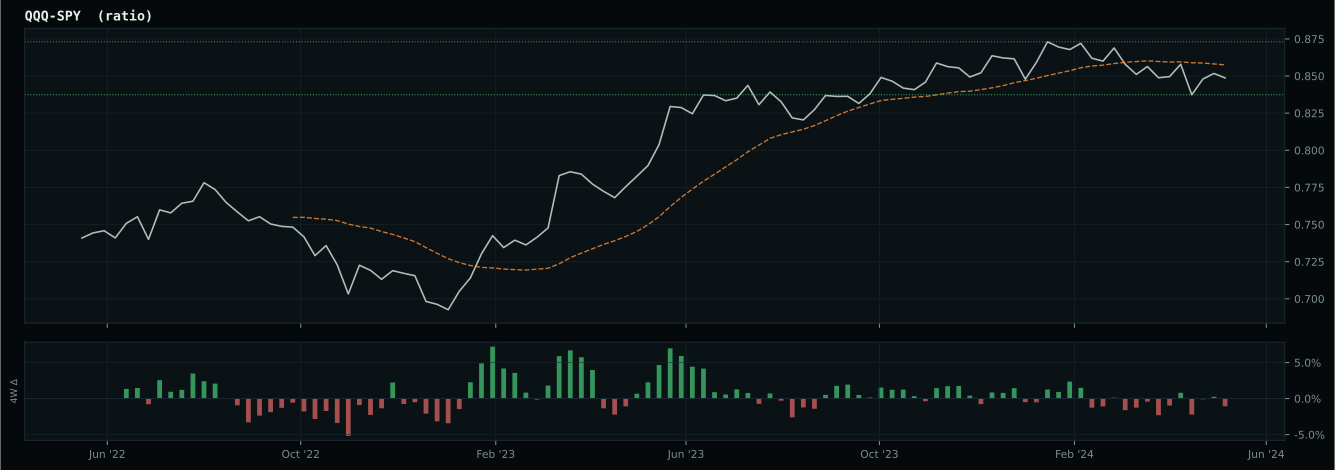
Macro Evidence Charts
Market-implied signals behind the macro regime scores. Each ratio compares two assets; the direction and slope of the ratio is what the macro engine reads.
Crypto Regime — TrendBTC
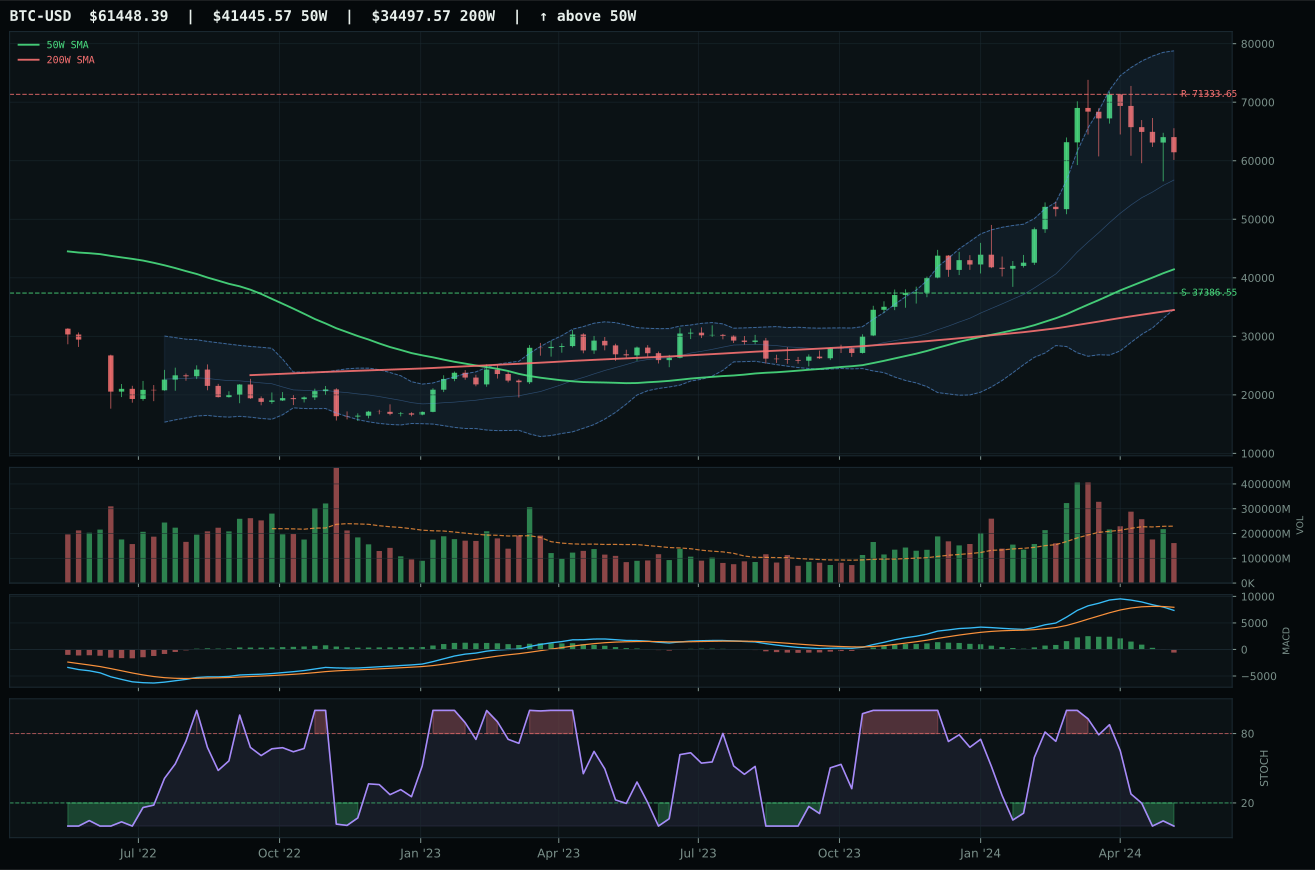
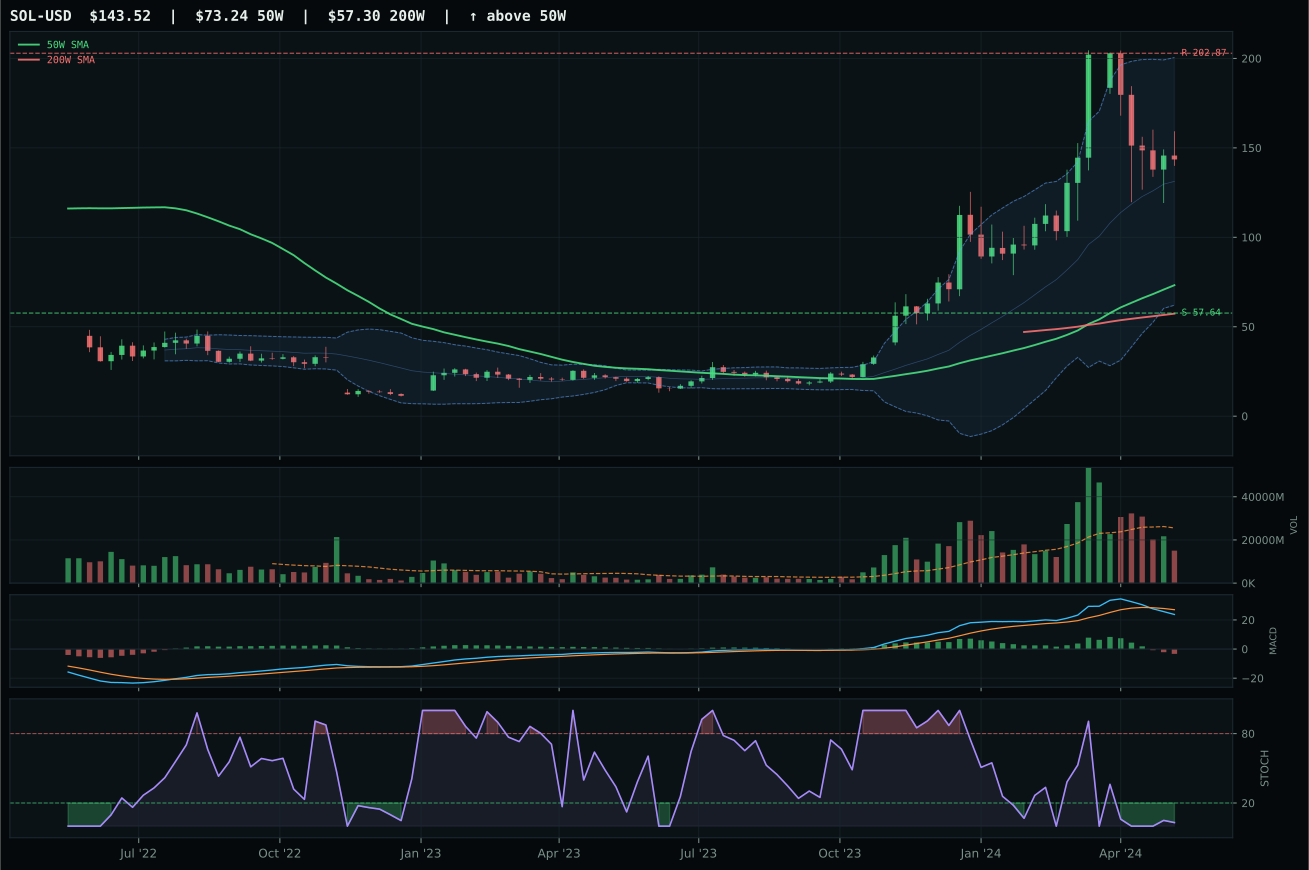
ValueBTC not armed: BTC has not made the first post-breakdown touch of the 200W buy zone after losing the 50W
TrendBTC confirmed: 2 consecutive closes above rising/flat 50W SMA
one or more available conditions failed
Category Rankings
| Rank | Category | Winner | Score | Alloc | 4W Ret | Peers (4W) |
|---|---|---|---|---|---|---|
| 1 | Traditional Energy | XLE | 81.6 | 20% | -3.96% | FCG -2.5% · XOP -3.2% |
| 2 | Precious Metals | GLD | 70.5 | 20% | -1.81% | GDX -4.0% · SLV +4.8% |
| 3 | Industrial Metals | COPX | 70.0 | 10% | -5.14% | PICK -4.2% · REMX -11.4% |
| 4 | Utilities & Infrastructure | XLU | 68.3 | 10% | -2.21% | IGF -2.0% · PAVE -6.1% |
| 5 | Nuclear Energy | NLR | 65.0 | 10% | -2.62% | URA -4.7% · URNM -5.6% |
| 6 | Defense & Aerospace | XAR | 60.6 | 10% | -0.90% | ITA +0.6% · ROKT -1.6% |
| 7 | Agriculture & Livestock | WEAT | 48.9 | 10% | -5.00% | VEGI -5.1% · MOO -4.3% |
| 8 | AI | BOTZ | 44.9 | 10% | -1.24% | SMH +12.1% · AIQ +1.8% |
| 9 | Emerging Markets | IEMG | 37.8 | 0% | -1.16% | ILF -11.5% · INDA +4.8% |
| 10 | Technology | XLK | 25.7 | 0% | +3.78% | CIBR -1.6% · IGV -2.1% |
Traditional Energy — XLE
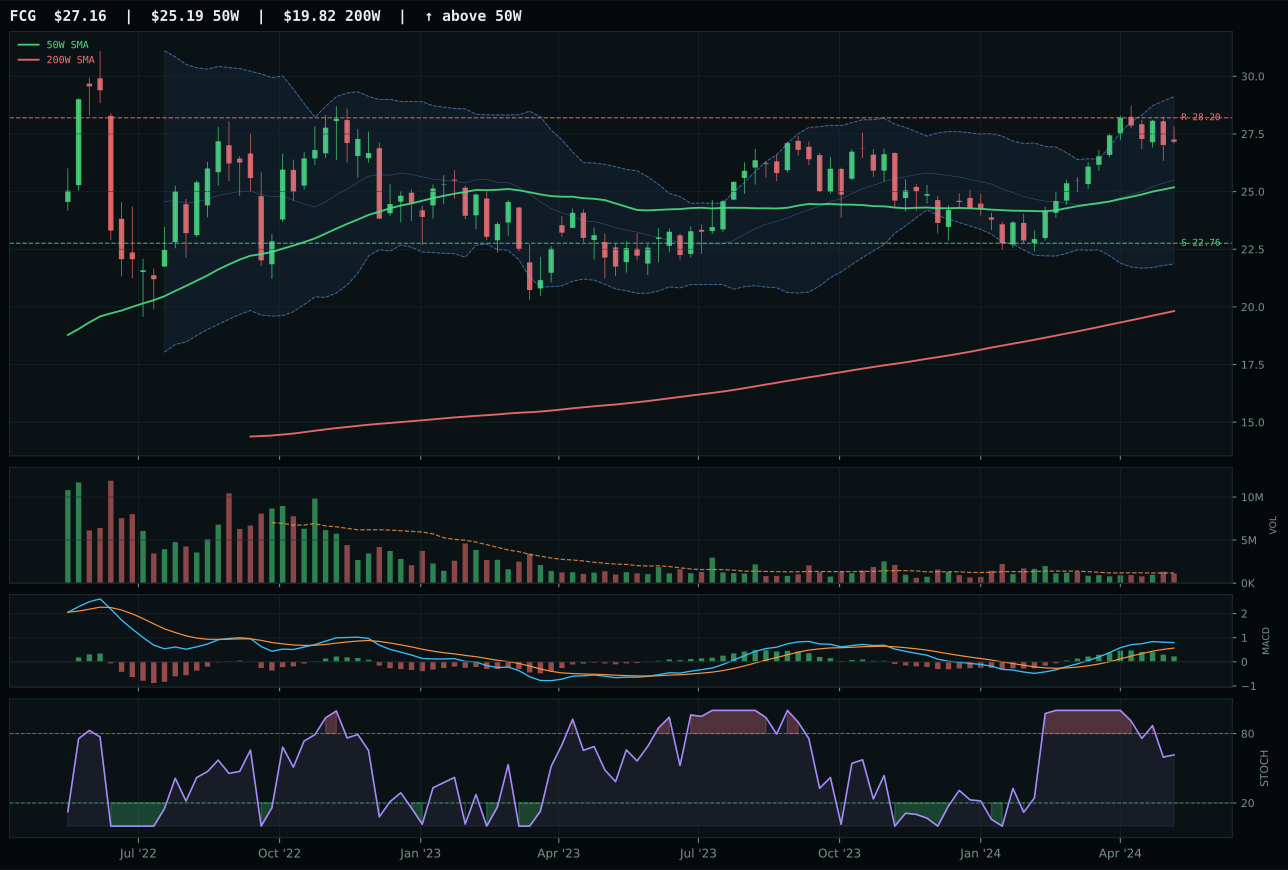
FCG has a neutral structure profile with 14.5% 13-week relative strength versus SPY.
A failed hold above support would weaken the setup.
Actionable but governed by invalidation levels.
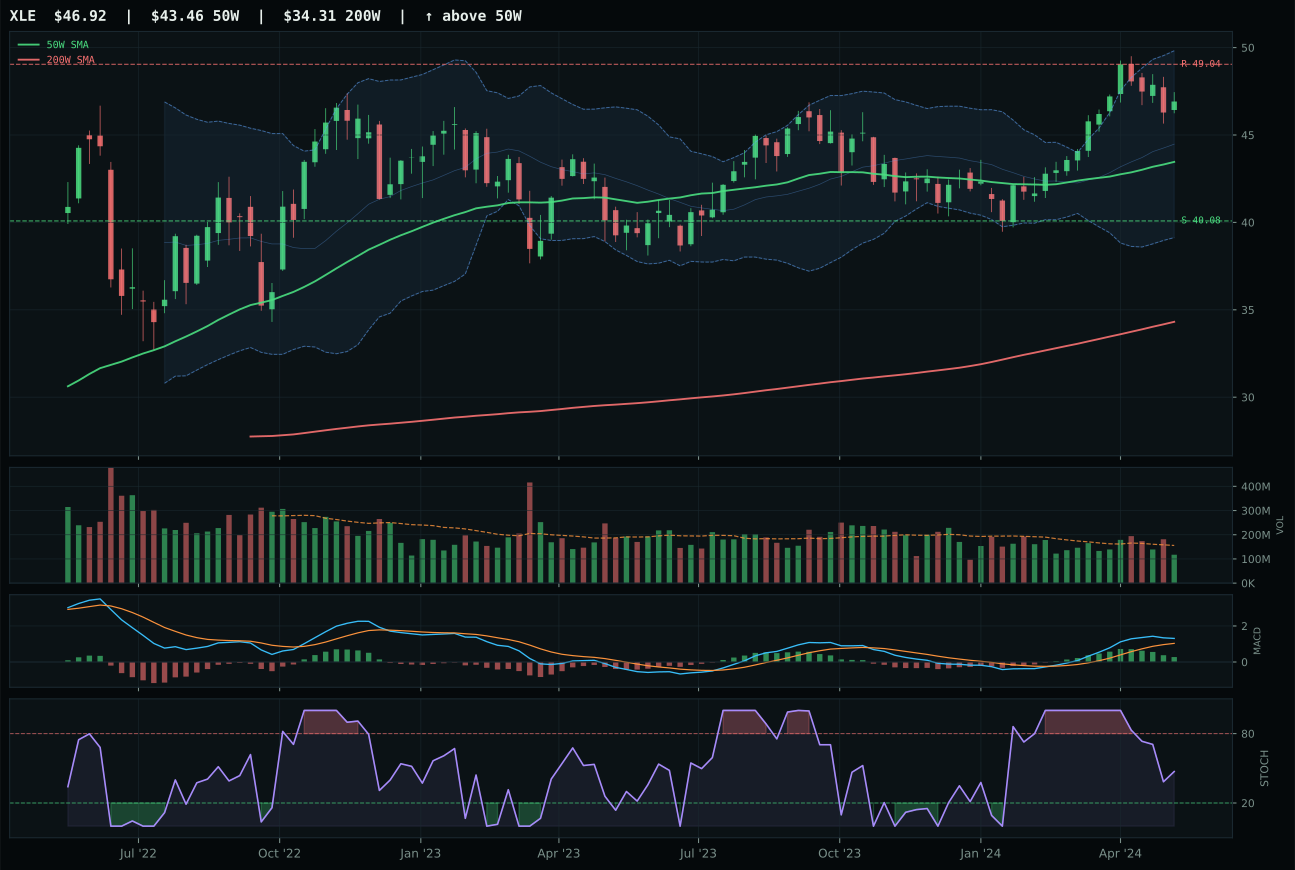
XLE has a neutral structure profile with 8.7% 13-week relative strength versus SPY.
A failed hold above support would weaken the setup.
Actionable but governed by invalidation levels.
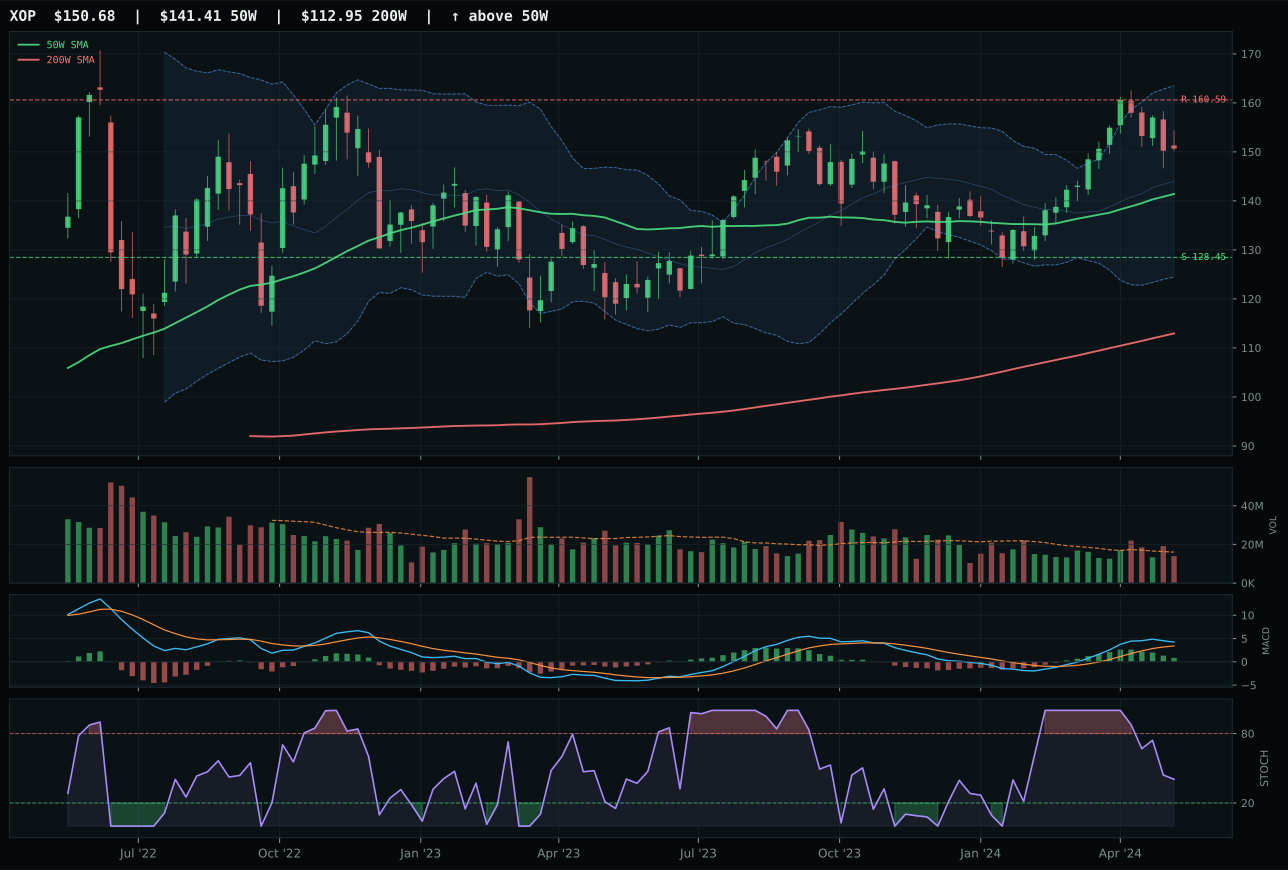
XOP has a neutral structure profile with 9.5% 13-week relative strength versus SPY.
A failed hold above support would weaken the setup.
Actionable but governed by invalidation levels.
XLE captures the top-2 energy slot over runner-up FCG through cleaner relative strength and superior risk/reward positioning. XLE's RS versus SPY is 8.7% with -0.8% category-relative strength, versus FCG's 14.5% SPY RS paired with +5.0% category-relative strength; FCG's outperformance is concentrated in the same natural-gas thesis, signaling crowding. XLE trades 7.9% above the 50W with 100.0 trend score and neutral volume at 0.75x 20W average, whereas FCG has similar structure but a wider risk/reward chasm: FCG offers -4.3% upside to resistance and 17.0% downside to support. MACD is bullish but flattening on both; stochastic RSI falling/neutral at 0.47 for XLE versus 0.41 for FCG is essentially a tie. XLE's integrated energy cash-flow defense offers superior diversification across crude, natural gas, and refining cycles, whereas FCG is a single-thesis play. In a late-cycle reflation, that optionality and lower concentration risk justifies the top-2 nod.
Traditional Energy ranks top-2 with the highest category score at 81.6, earning 10% allocation. Macro fit of 90.0 is unambiguous: energy scarcity (+16), late-cycle reflation (+12), inflation pressure (+10), supply shortage (+9), and real asset sponsorship (+7) create a fortress of tailwinds. XLE's technical evidence of 73.8 is solid—trend at 100.0, momentum confirmation at 77.7, persistence at 71.8—providing the second-best setup in the entire portfolio after Industrial Metals' COPX momentum. The 10% allocation reflects XLE's dual role as both a beneficiary of oil-supply constraints and a real-asset hedge against currency debasement in a late-cycle regime. Against Precious Metals' GLD at 10%, XLE is the more cyclical choice, capturing economic resilience and producer cash flows. Together, the two top-2 slots of energy and gold provide a balanced real-asset anchor—inflation protection (energy) and tail-risk insurance (gold)—appropriate for a reflation macro state.
Precious Metals — GLD
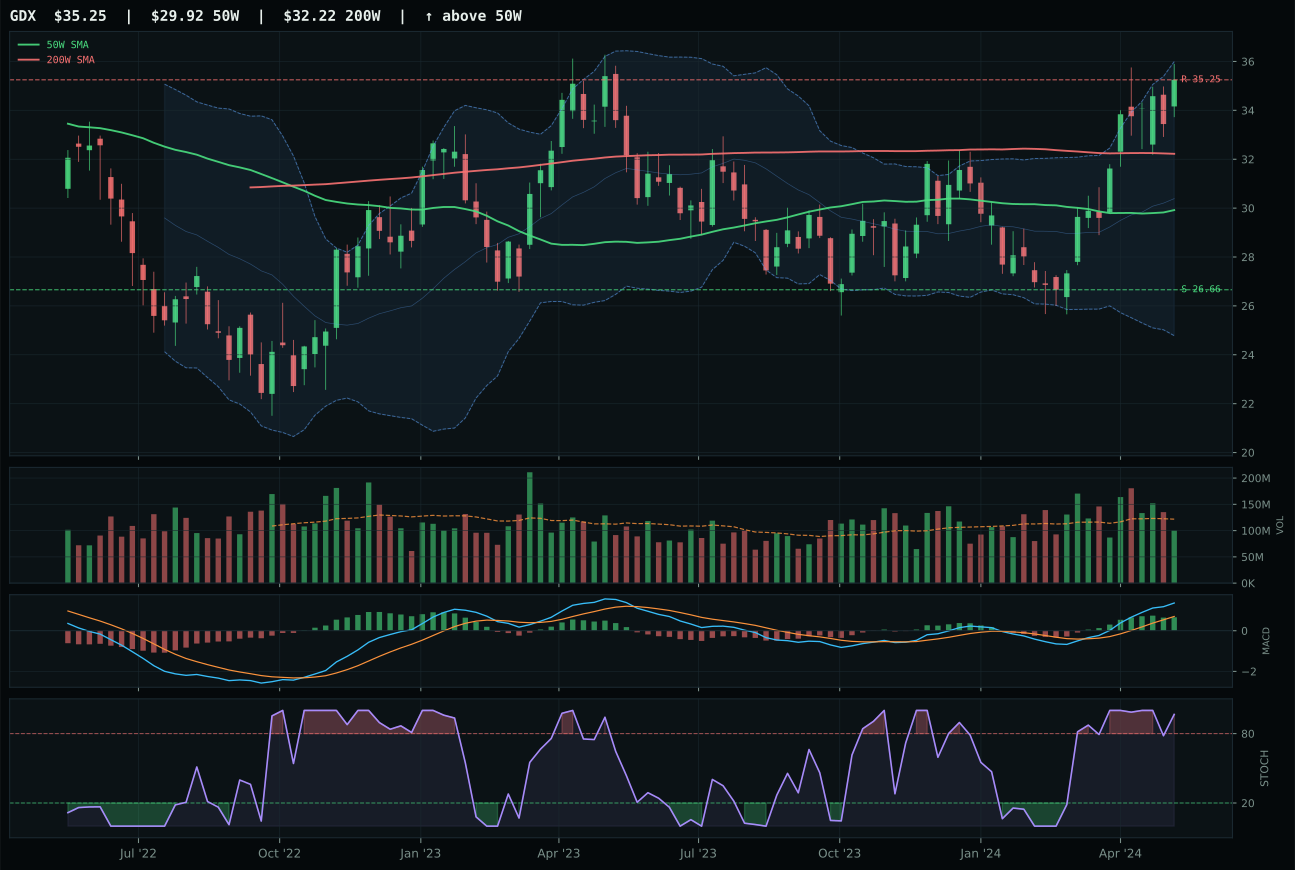
GDX has a vertical extension profile with 26.8% 13-week relative strength versus SPY.
A failed hold above support would weaken the setup.
Actionable but governed by invalidation levels.
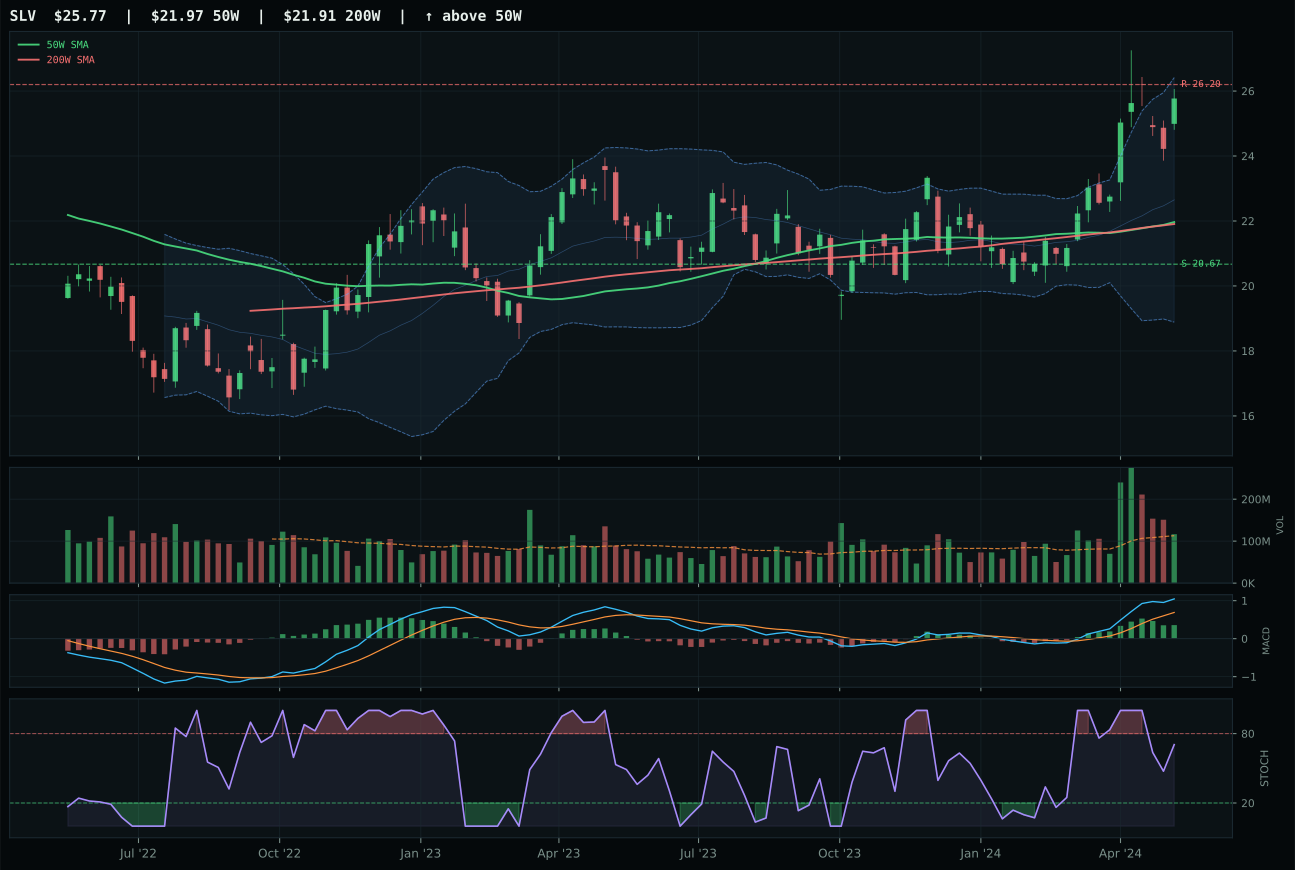
SLV has a vertical extension profile with 20.7% 13-week relative strength versus SPY.
A failed hold above support would weaken the setup.
Actionable but governed by invalidation levels.
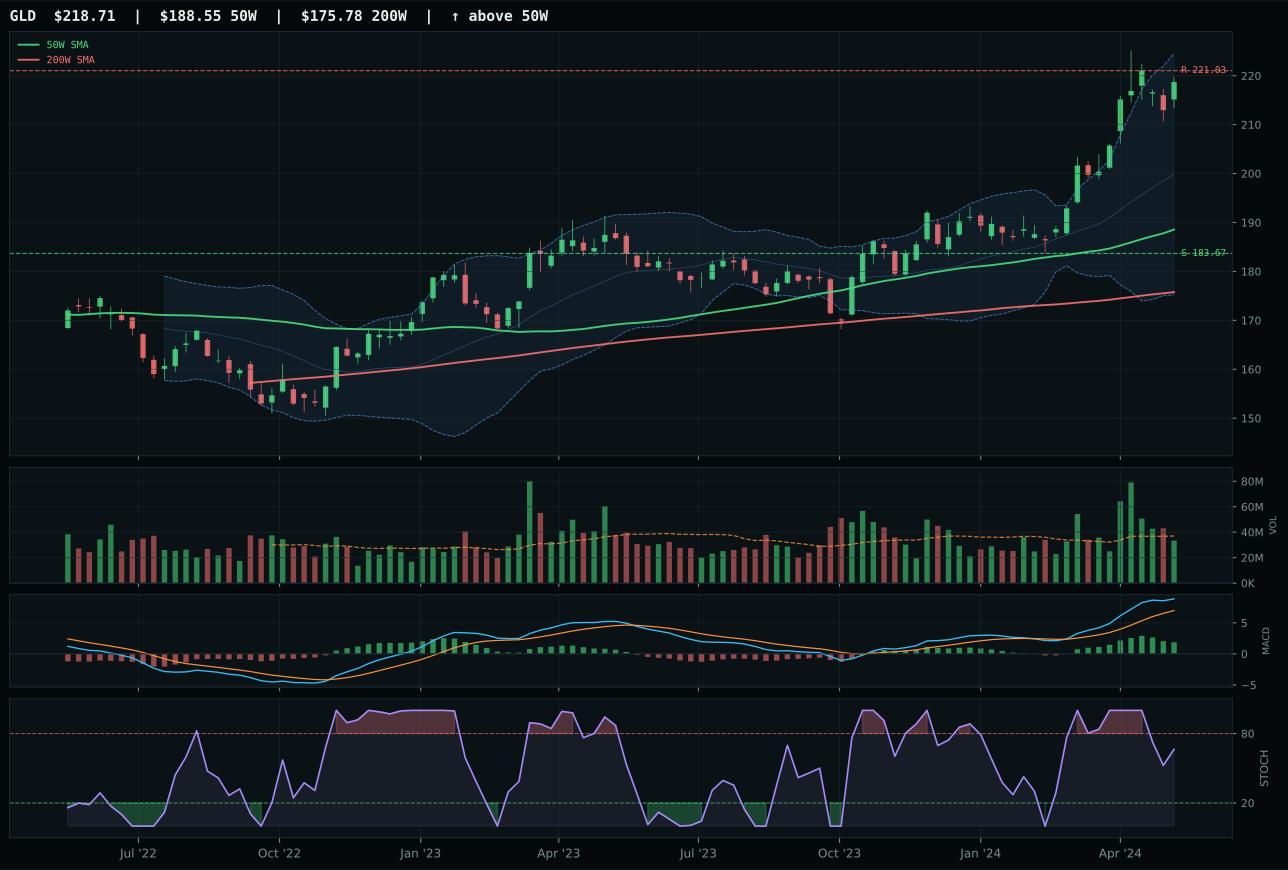
GLD has a vertical extension profile with 12.7% 13-week relative strength versus SPY.
A failed hold above support would weaken the setup.
Actionable but governed by invalidation levels.
GLD earns the category win and a top-2 portfolio slot by balancing extreme trend strength with measured entry discipline. The 100.0 trend score reflects price at 183.67 support and 221.03 resistance, above both moving averages, with +12.7% RS versus SPY—genuine institutional sponsorship. However, GLD sits 16.0% above the 50W and stochastic RSI is falling/neutral at 0.66, signaling maturation; this timing score of 48.0 versus GDX's 27.0 is the critical edge. MACD is bullish but flattening rather than improving, which prevents euphoria and suggests selective take-profits by sophisticated buyers. GDX's 30.7% 13W return and 26.8% RS versus SPY are superficially more impressive, but the 27.0 timing score and overbought stochastic rolling over telegraph exhaustion. GLD's 16.6% 13W return paired with a falling/neutral stochastic is the superior setup: it captures the monetary hedge bid without the overshoot risk, making it the cleaner portfolio vehicle.
Precious Metals ranks top-2 with a category score of 70.5, earning 10% allocation. The macro narrative is crystallized: monetary hedge bid is active at +14, defensive rotation at +7, and late-cycle reflation at +8 (implied by the broad category tailwind). Liquidity stress and credit stress descriptors that drag down equities become strengths for gold and gold volatility, driving the 71.0 macro fit. GLD's technical evidence of 61.4 is solid without being spectacular, but the combination of strong macro fit (70.0) and top-2 category scoring makes this a core defensive sleeve. The 10% slot reflects GLD's dual role as both a trend-following long and an insurance hedge against liquidity events. Against XLE's 81.6 score, GLD is the junior top-2 pick, but its role differs: XLE captures energy inflation and supply scarcity, while GLD is the monetary anchor. Both deserve overweight exposure in a late-cycle reflation regime.
Industrial Metals — COPX
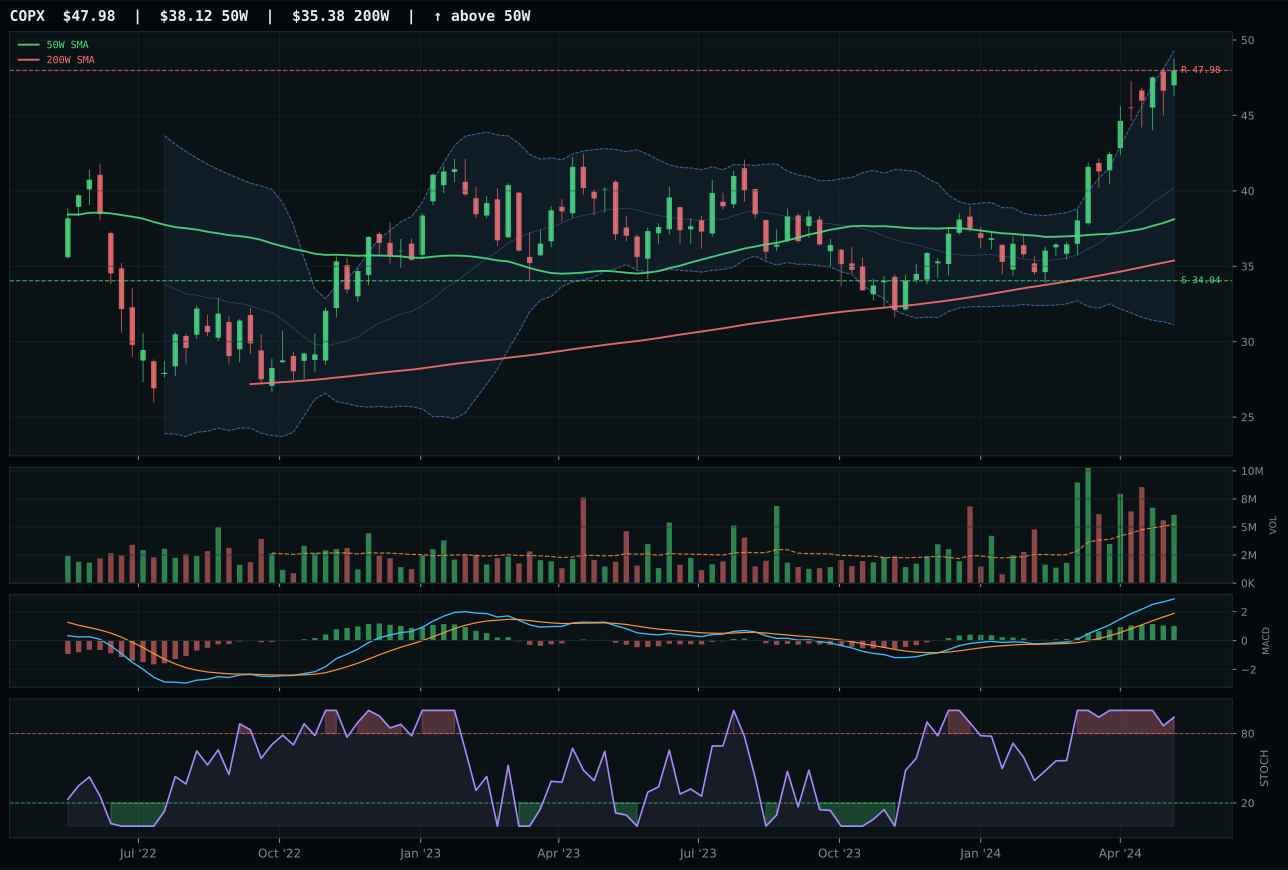
COPX has a vertical extension profile with 34.7% 13-week relative strength versus SPY.
A failed hold above support would weaken the setup.
Actionable but governed by invalidation levels.
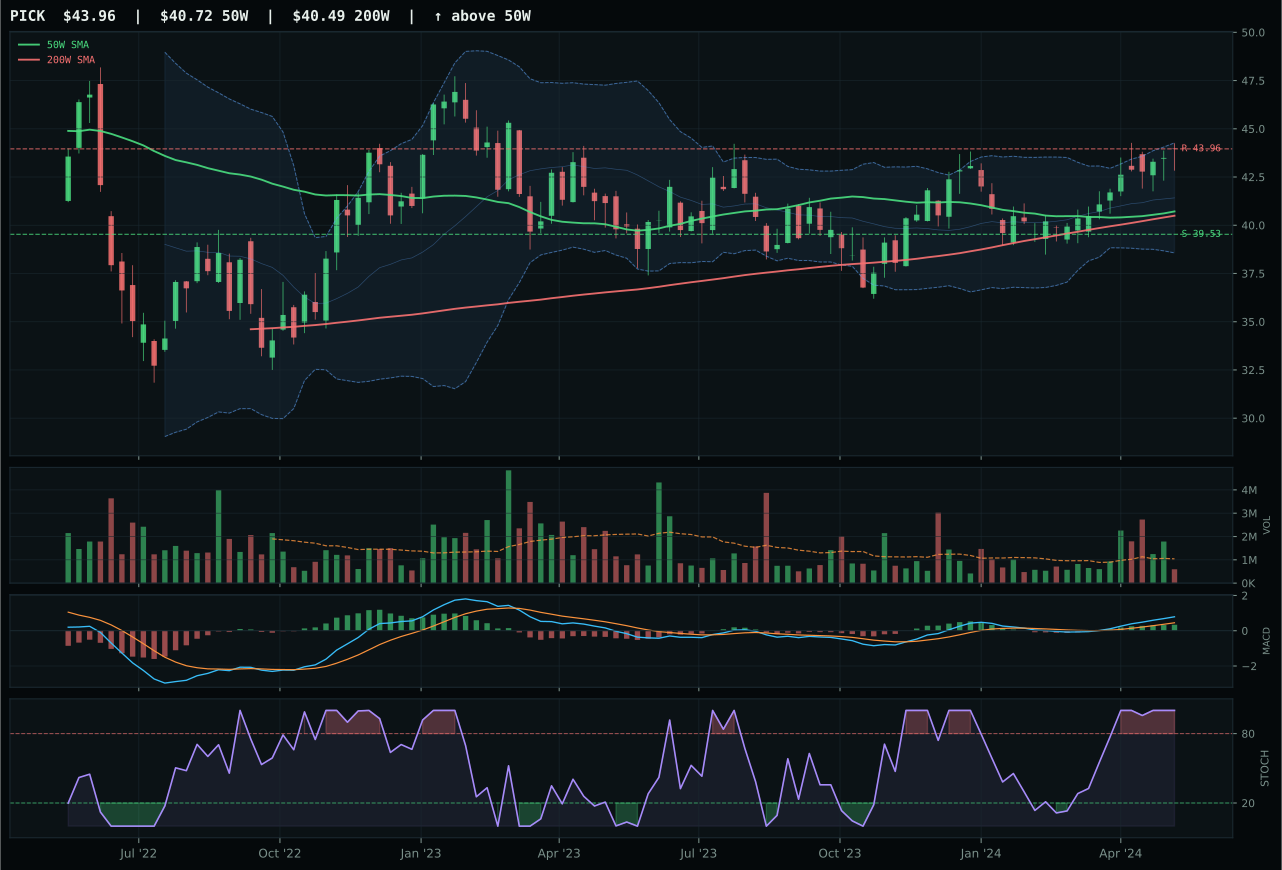
PICK has a neutral structure profile with 7.3% 13-week relative strength versus SPY.
A failed hold above support would weaken the setup.
Actionable but governed by invalidation levels.
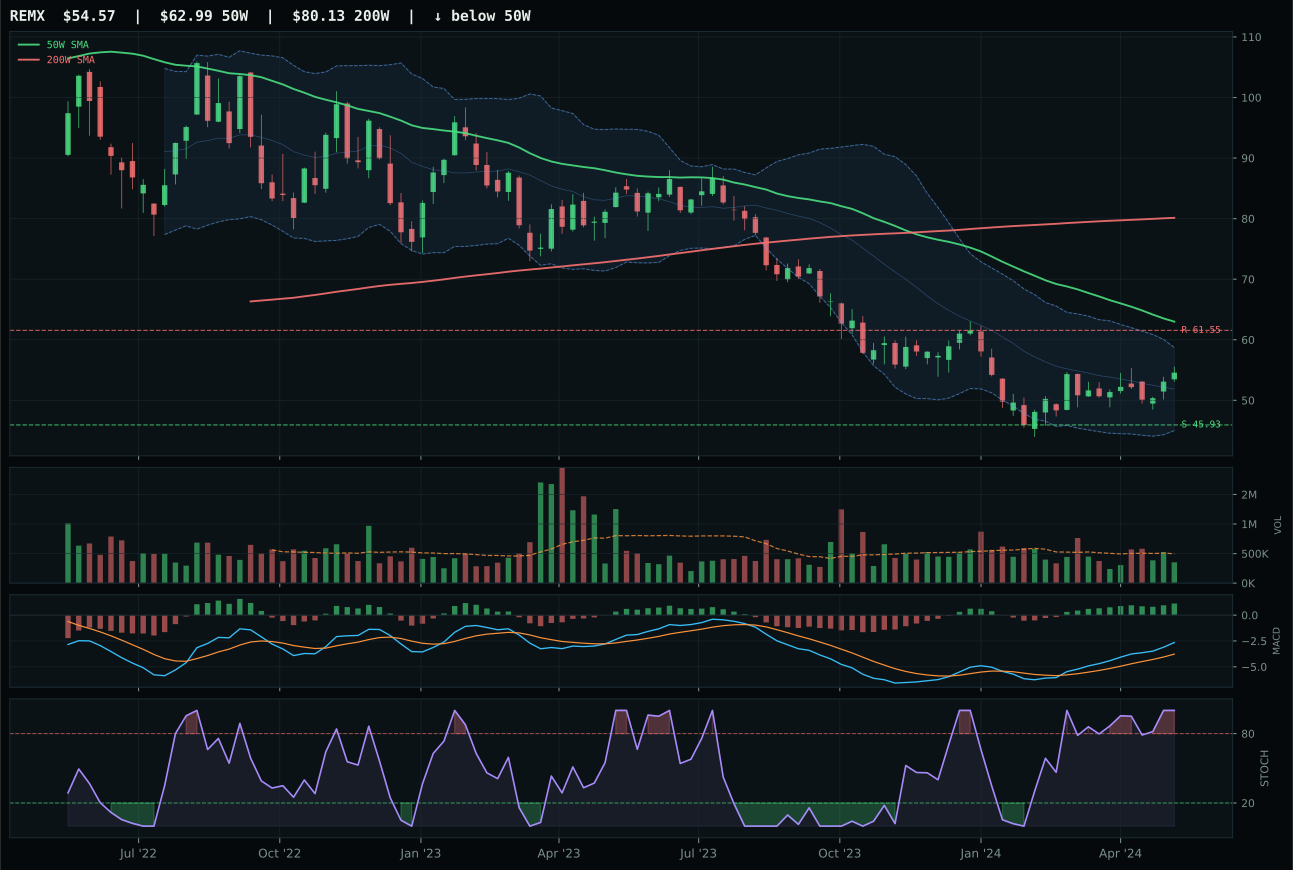
REMX has a neutral structure profile with 9.6% 13-week relative strength versus SPY.
Extension and support failure are the main tactical risks.
Tracked, but not top-2 eligible because: structurally broken.
COPX wins despite a 3.2-point technical disadvantage to runner-up PICK because its momentum confirmation and volume participation are undeniable. COPX's momentum confirmation hits 100.0 on the strength of 38.6% 13W return, 5.5% 4W return, and 34.7% RS versus SPY—the highest in the category and a clear statement of institutional accumulation. PICK's 13W return is just 11.2% with 7.3% RS, and its volume is thin participation versus COPX's above-average 1.16x 20W. MACD is bullish but flattening on both names, and stochastic RSI is overbought rolling over for COPX versus overbought momentum for PICK—a marginal edge to COPX. The trade-off is timing: COPX is 25.9% above the 50W with a 22.0 timing score, whereas PICK's neutral structure and 75.0 timing score suggest safer entry. Yet in a portfolio context, COPX's explosive relative strength (25.2% versus category median) and perfect momentum confirmation override the stretched valuation—this is a momentum win, not a value pick.
Industrial Metals ranks tier-2 at 5% allocation with a category score of 70.0, just shy of the top-2 cutoff. Macro fit of 75.0 is robust: late-cycle reflation (+10), metals scarcity (+14), commodity breadth positive (+10), and real asset sponsorship (+6) all validate the category. Technical evidence of 73.5 for COPX is strong across trend and momentum, but the setup is vertically extended at 25.9% above the 50W with zero upside to resistance—a phrase that repeats across multiple extended names this week. COPX's 40.5 risk/reward score is the weakest link, offering 41.0% downside to support against 0.0% upside. The category loses the top-2 race to energy (81.6) and precious metals (70.5) not on macro merit but on technical setup timing. For COPX to graduate, a pullback into the 34.04 support with volume drying would establish a lower-risk re-entry point. The 5% allocation respects the macro tailwind while acknowledging entry risk in an already-extended advance.
Utilities & Infrastructure — XLU
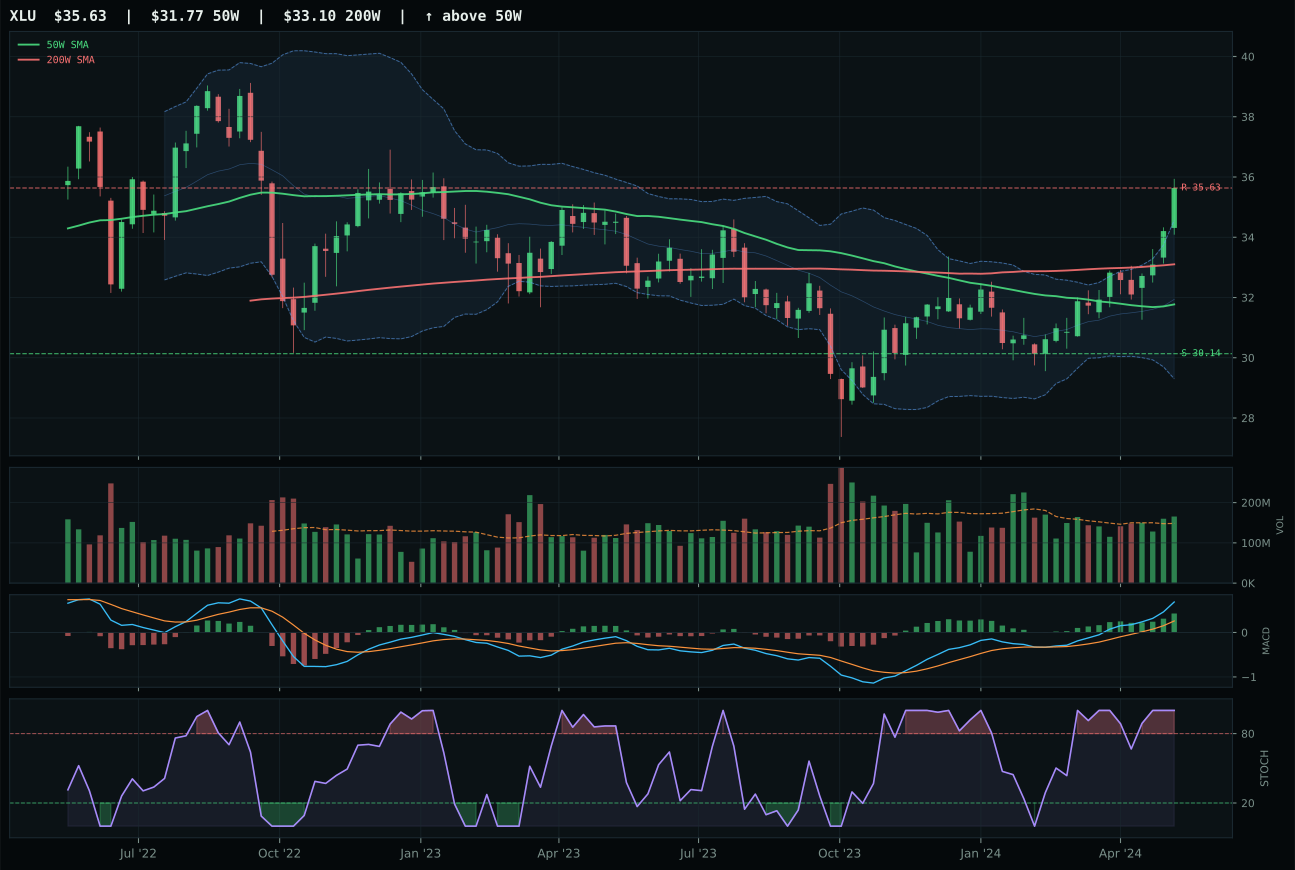
XLU has a neutral structure profile with 14.3% 13-week relative strength versus SPY.
A failed hold above support would weaken the setup.
Actionable but governed by invalidation levels.
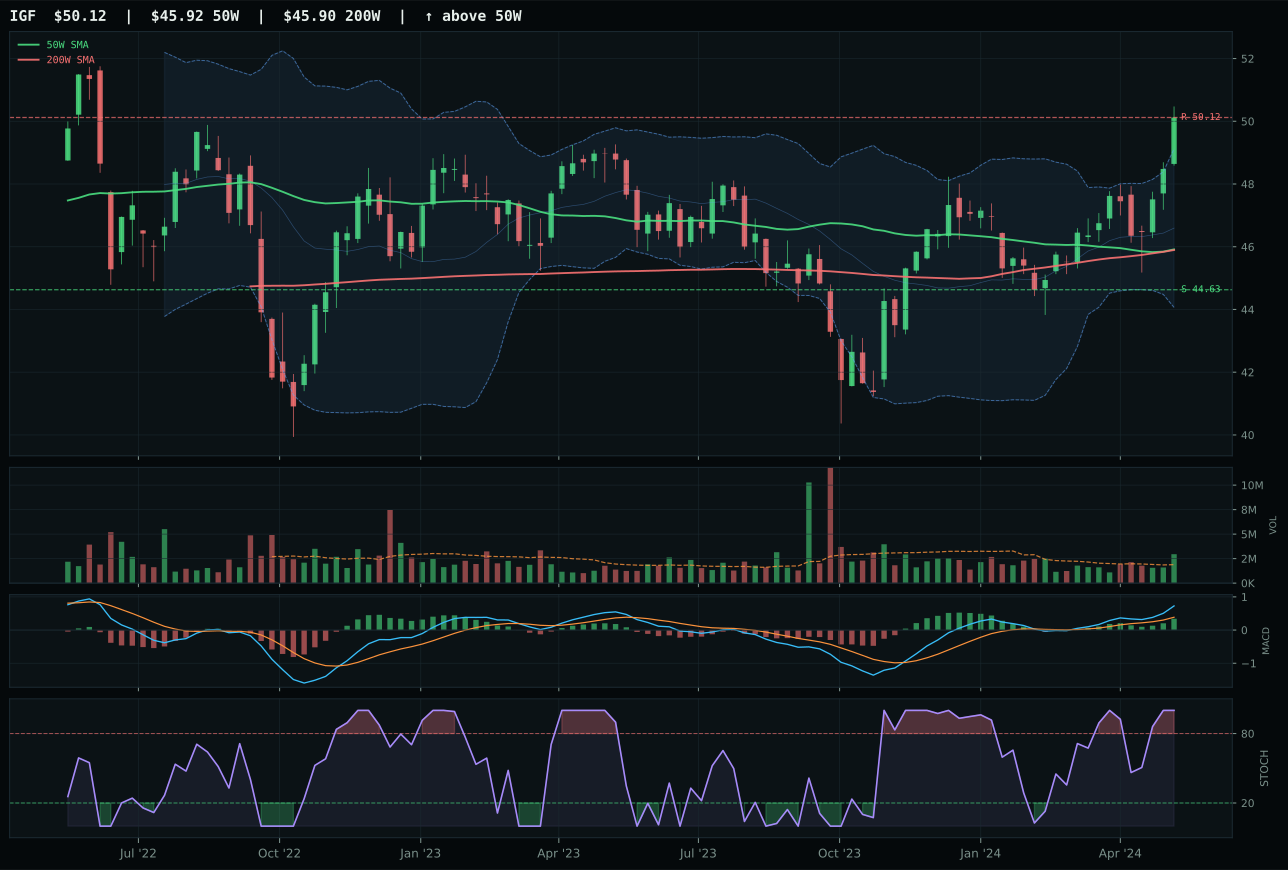
IGF has a neutral structure profile with 8.4% 13-week relative strength versus SPY.
A failed hold above support would weaken the setup.
Actionable but governed by invalidation levels.
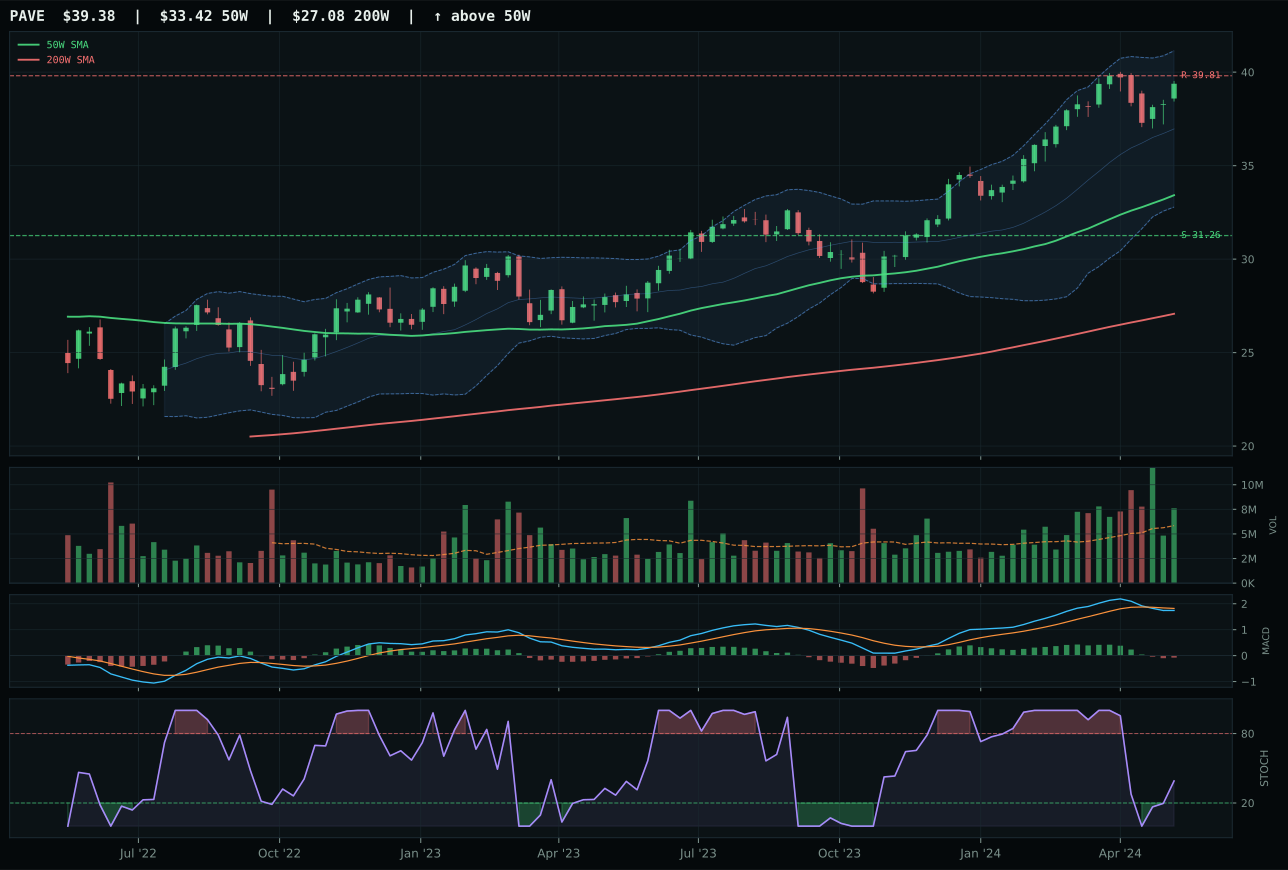
PAVE has a vertical extension profile with 5.1% 13-week relative strength versus SPY.
A failed hold above support would weaken the setup.
Actionable but governed by invalidation levels.
XLU defeats runner-up IGF on category-relative strength (6.0% vs 0.0%) despite IGF's superior technical score of 99.9 versus XLU's 93.4. IGF's structure and setup are nearly flawless—accumulation/confirmation volume, bullish and improving MACD, 100.0 momentum confirmation—yet it is a global infrastructure income play with diversified geographic and currency exposure, whereas XLU is pure domestic regulated utility defense. XLU's 18.3% 13W return and 14.3% RS versus SPY are legitimate institutional flows into defensive equities, whereas IGF's 12.3% 13W return and 8.4% RS suggest the infrastructure thesis is being pursued for different reasons. Both sit near 52W highs with overbought stochastic RSI at 1.00, but XLU's 12.2% distance from the 50W is tighter than IGF's similar extension, and XLU's 1.12x above-average volume participation outweighs IGF's accumulation/confirmation. In a late-cycle defensive rotation, domestic utility exposure with fresh momentum is preferable to globally-exposed infrastructure that has already attracted proportional institutional attention.
Utilities & Infrastructure ranks tier-2 at 5% allocation with a category score of 68.3. Macro fit of 57.0 reflects active defensive rotation (+12) offsetting modest inflation pressure headwinds (-6); liquidity stress adds an additional -3 penalty. Technical evidence of 93.4 for XLU is the second-highest across all category representatives (behind only IGF's 99.9), yet the category does not make top-2 because energy and metals offer stronger macro tailwinds in a late-cycle reflation environment. XLU's 100.0 momentum confirmation and 85.8 volume-price confirmation are genuinely impressive, but utilities do not capture inflation alpha in the same way commodity and real-asset sectors do. The 5% allocation respects XLU's strong technical setup and defensive positioning while acknowledging that the macro regime favors scarcity and supply-constrained assets. For XLU to graduate to tier-1, either a sharp uptick in credit stress descriptors or a meaningful pullback in energy prices (causing relative utility outperformance) would be required. Currently, it is a quality hedge rather than a primary opportunity.
Nuclear Energy — NLR
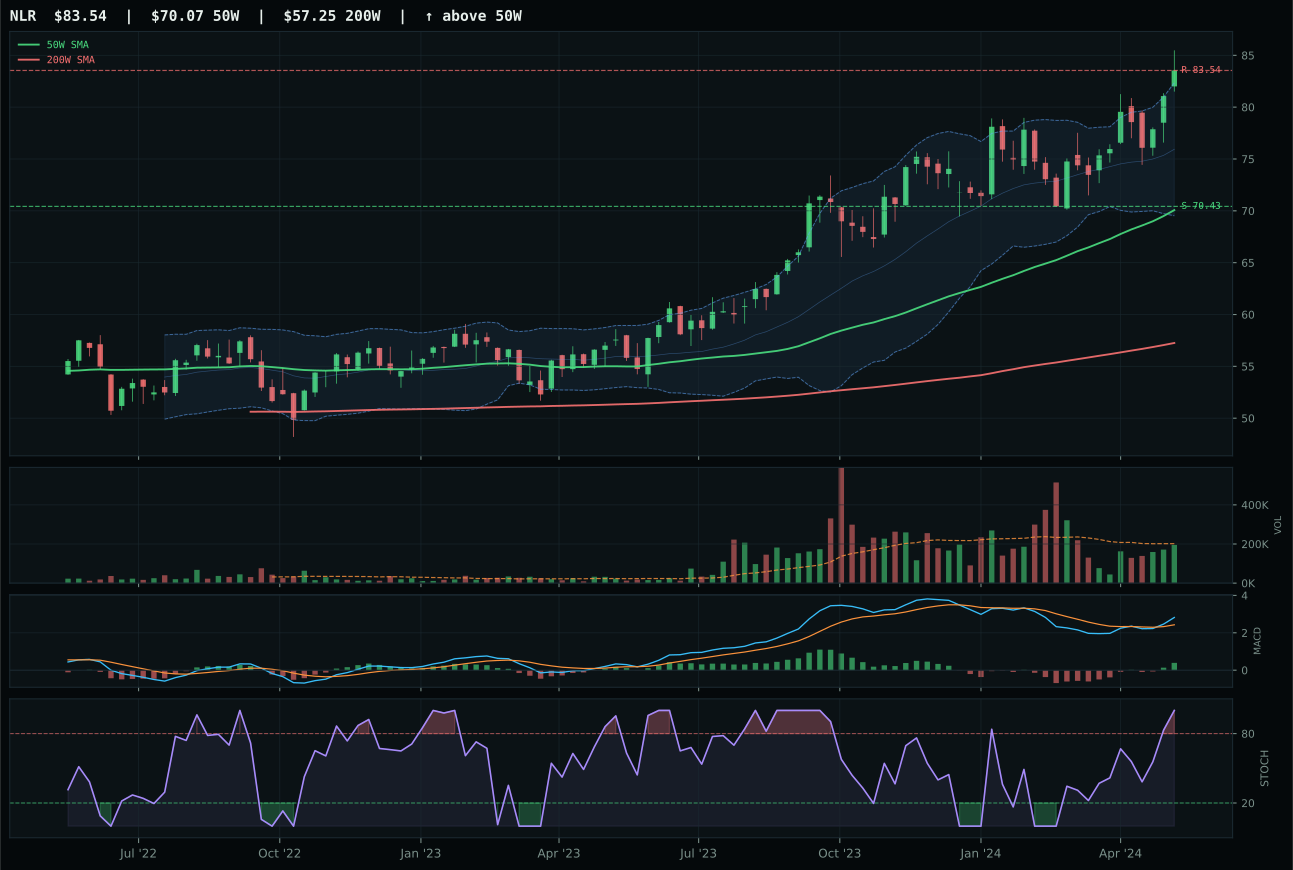
NLR has a vertical extension profile with 7.8% 13-week relative strength versus SPY.
A failed hold above support would weaken the setup.
Actionable but governed by invalidation levels.
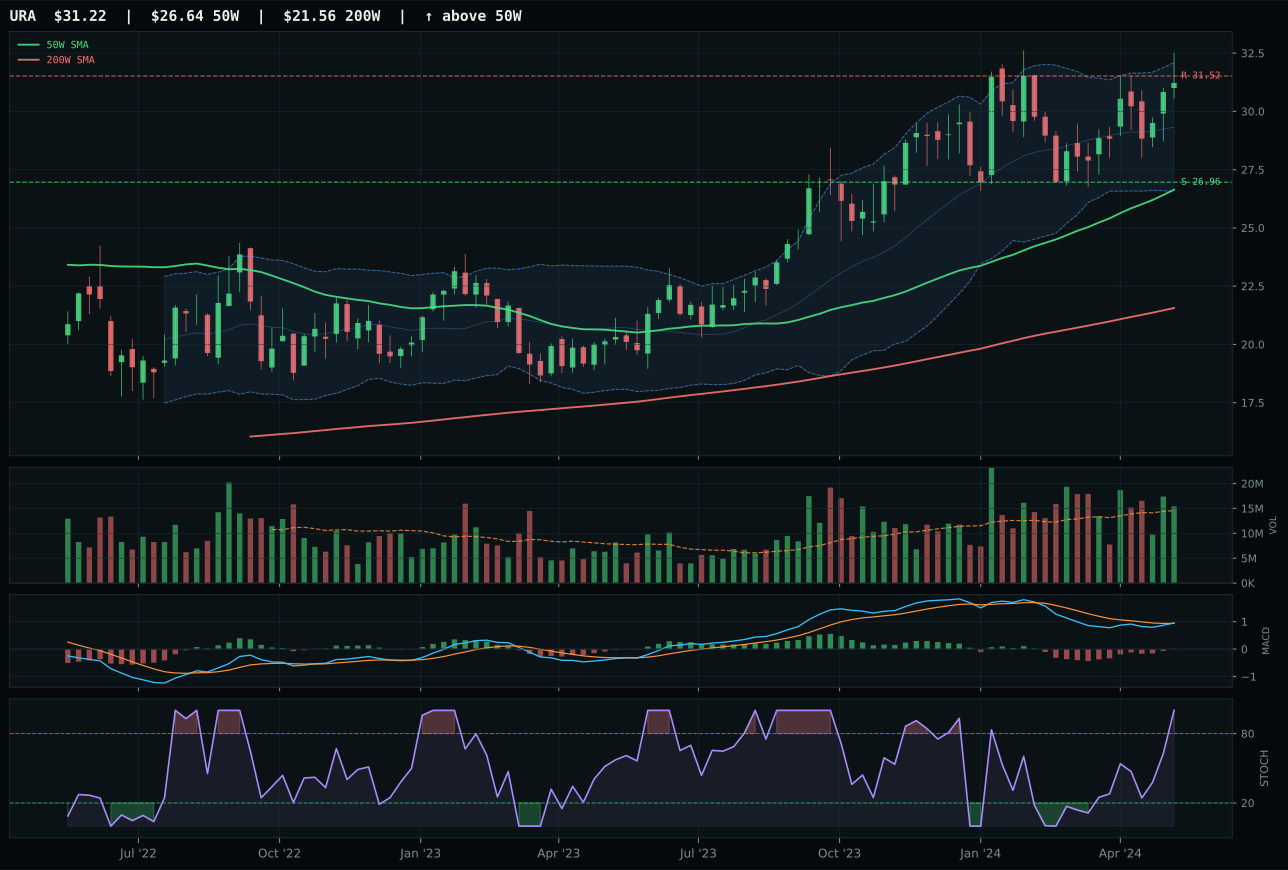
URA has a vertical extension profile with 1.0% 13-week relative strength versus SPY.
A failed hold above support would weaken the setup.
Actionable but governed by invalidation levels.
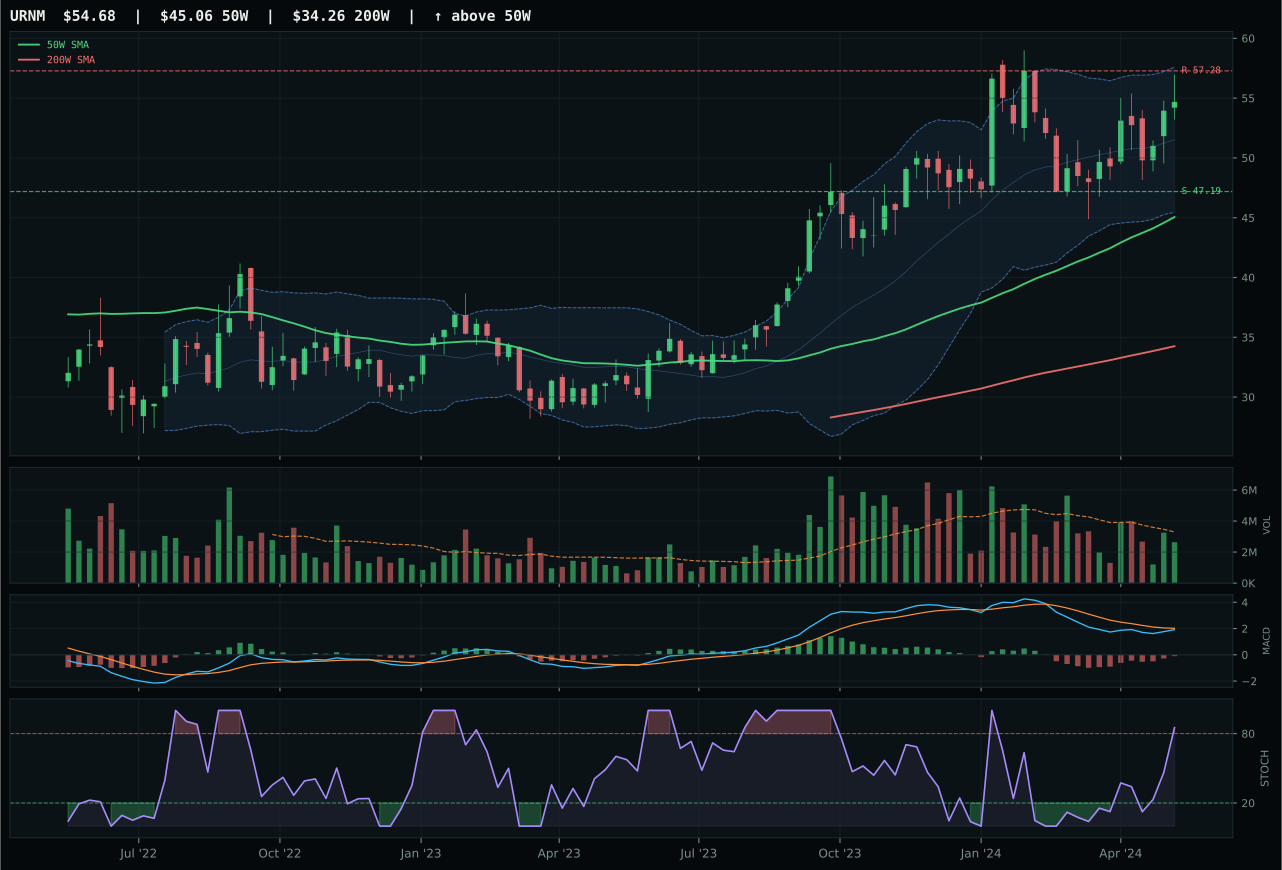
URNM has a vertical extension profile with -2.3% 13-week relative strength versus SPY.
A failed hold above support would weaken the setup.
Actionable but governed by invalidation levels.
NLR edges out runner-up URA by 6.1 points through superior structure cleanliness (73.6 vs 69.0) and category-relative strength (6.9% vs 0.0%), despite both names sharing identical 100.0 trend scores and overbought stochastic RSI at 1.00. NLR's 11.8% 13W return outpaces URA's 4.9%, and the momentum confirmation score of 100.0 for NLR reflects strong 4W and 13W returns with bullish and improving MACD—true institutional conviction. URA's overbought stochastic rolling over signals exhaustion, whereas NLR's reading at 1.00 with MACD still improving suggests the breakout is validated by follow-through buying. Both names sit in vertical extension near 52W highs, and both risk/reward scores are weak (44.7 for NLR, 46.0 for URA); the difference is that NLR's 19.2% distance from the 50W paired with 6.9% category relative strength means buyers are newer, fresher participants rather than trapped longs. NLR's neutral volume at 0.97x 20W average also steadies the setup relative to URA's identical participation.
Nuclear Energy ranks tier-2 at 5% allocation with a category score of 65.0. Macro fit of 69.0 benefits from energy scarcity (+9), late-cycle reflation (+7), real asset sponsorship (+7), and AI growth sponsorship (+5), but the absence of explicit supply-shortage language keeps it lower than energy and metals. Technical evidence of 75.3 for NLR is robust—trend at 100.0, momentum at 100.0—yet the timing score of 37.0 reflects the 19.2% extension above the 50W, a warning flag. NLR would easily rank tier-1 or tier-2 on technicals alone, but the extended chart in a late-cycle environment where XLE and COPX offer less stretched entries creates opportunity cost. The 5% slot honors NLR's emerging value as a non-carbon energy proxy with AI data-center sponsorship, but it acknowledges that entry risk is elevated. A pullback into the 70.43 support with stochastic RSI resetting would create a more compelling re-entry point and likely trigger a tier-1 upgrade if macro tailwinds persist.
Defense & Aerospace — XAR
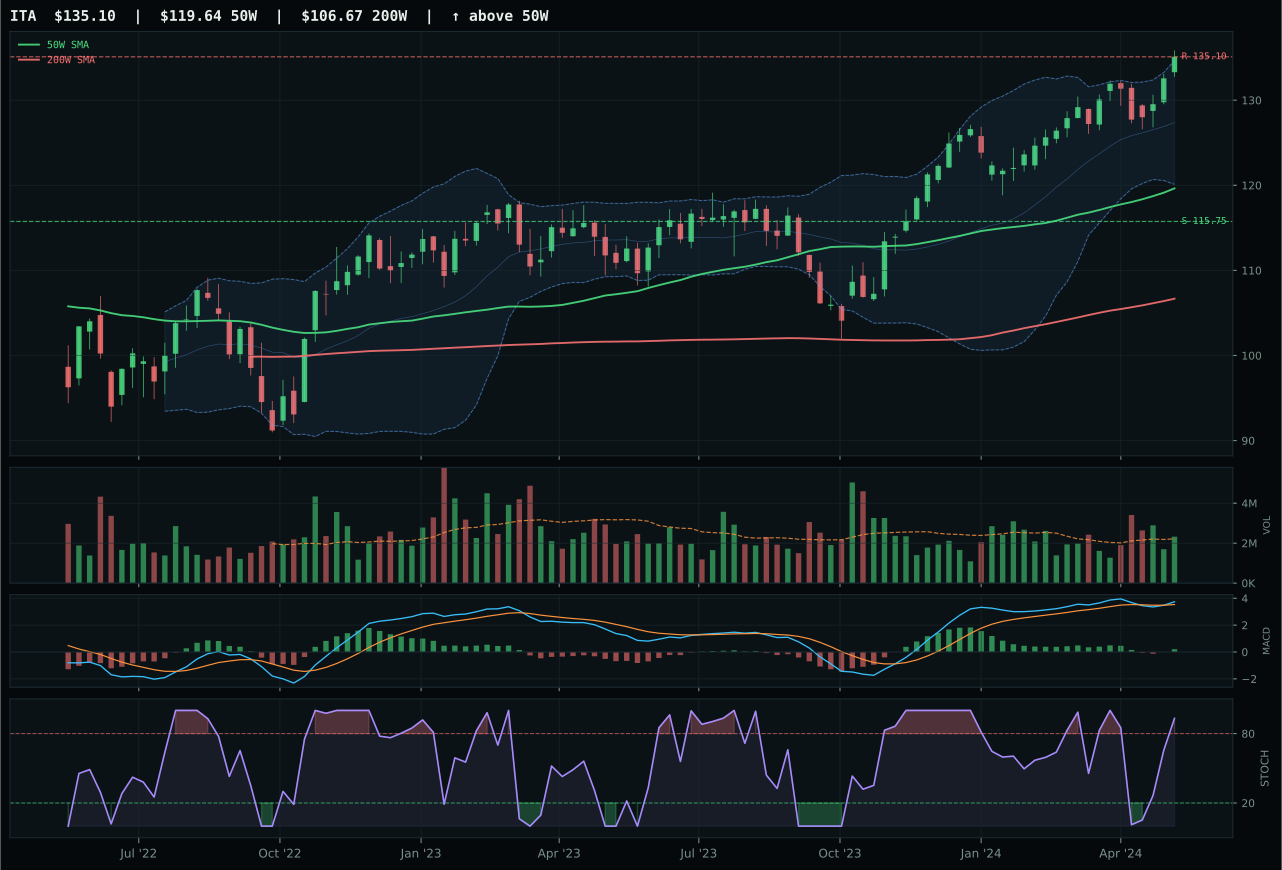
ITA has a neutral structure profile with 4.5% 13-week relative strength versus SPY.
A failed hold above support would weaken the setup.
Actionable but governed by invalidation levels.
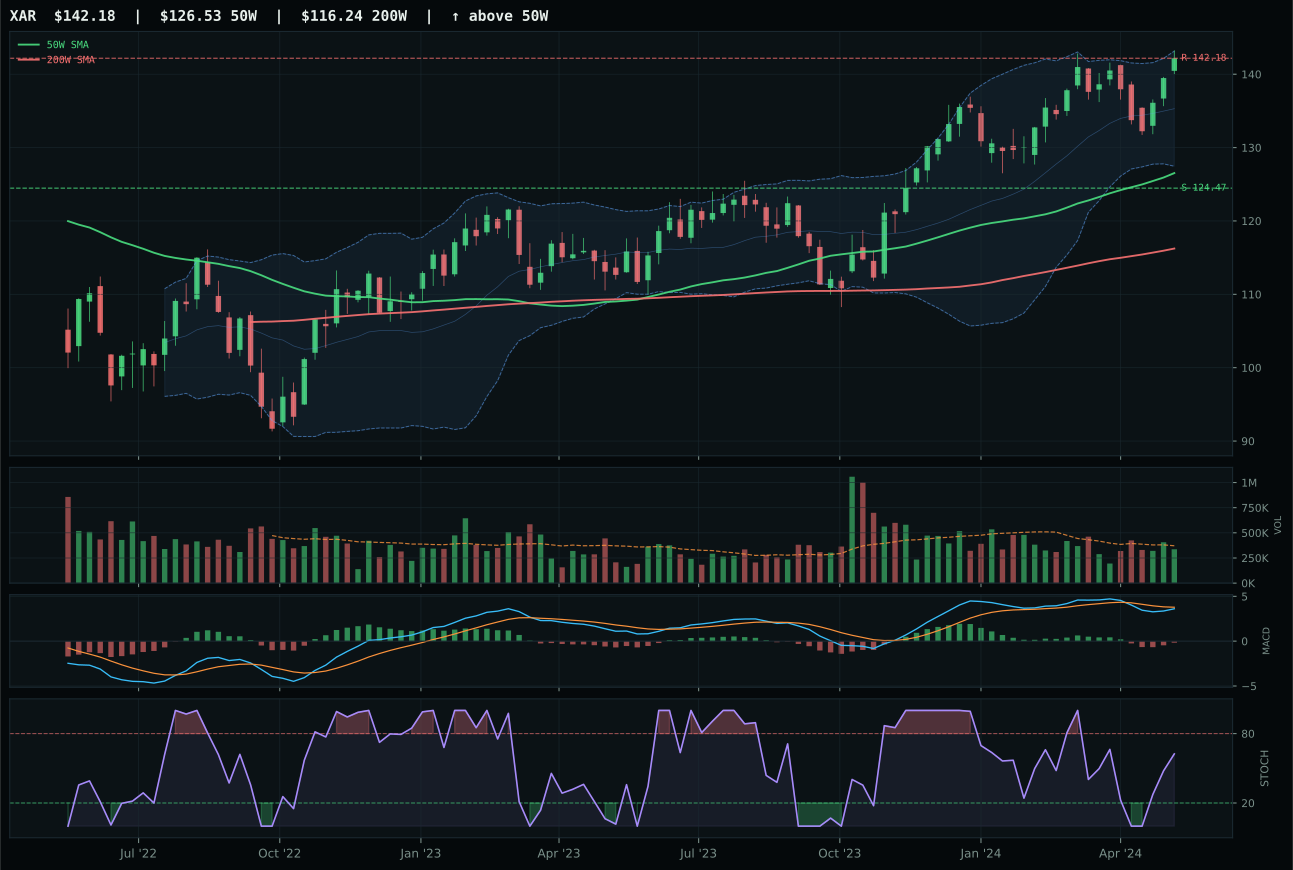
XAR has a neutral structure profile with 3.2% 13-week relative strength versus SPY.
A failed hold above support would weaken the setup.
Actionable but governed by invalidation levels.
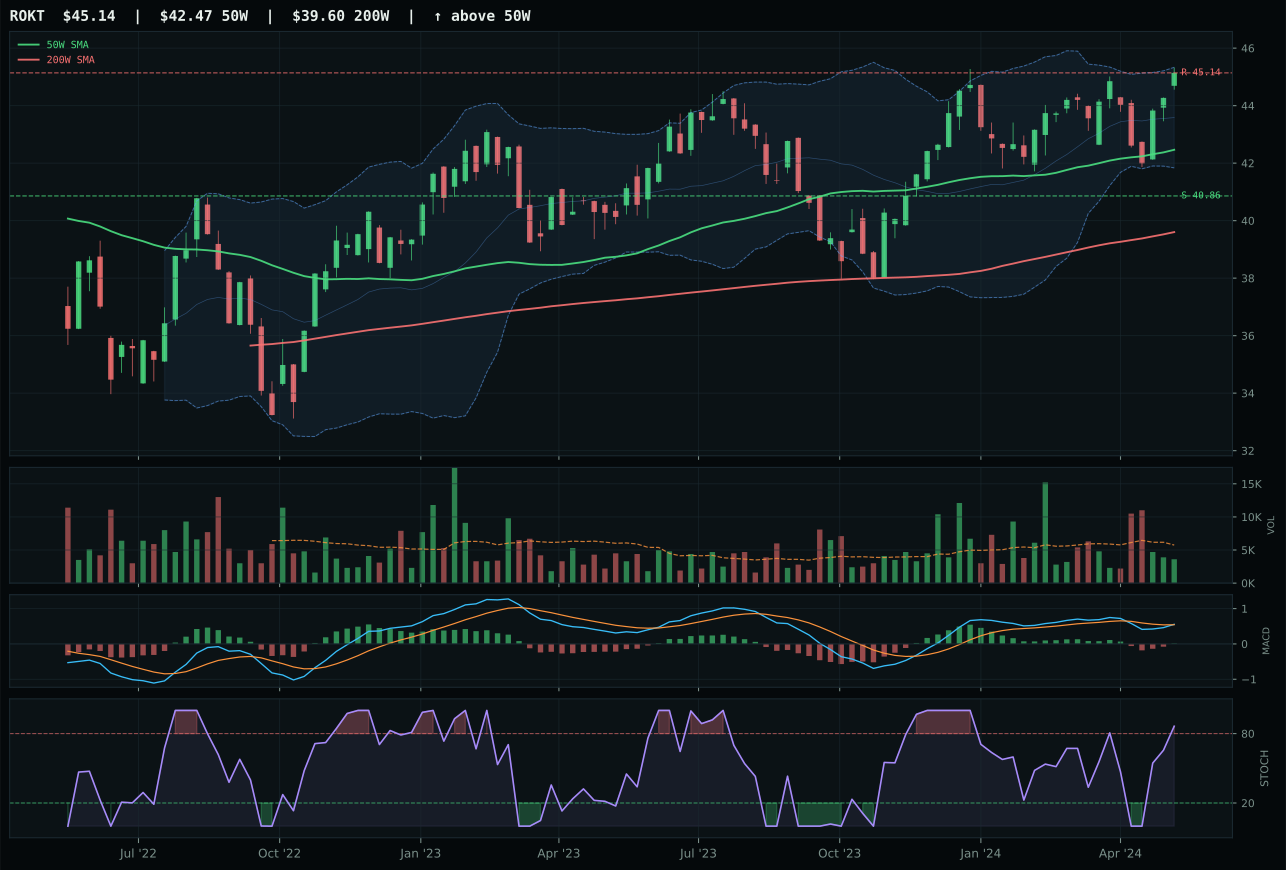
ROKT has a neutral structure profile with 0.7% 13-week relative strength versus SPY.
A failed hold above support would weaken the setup.
Tracked, but not top-2 eligible because: .
Defense & Aerospace earns 5% at tier-2 with a final category score of 60.6. The macro fit of 65.0 is bolstered by active defensive rotation (+8), late-cycle reflation dynamics (+6), and modest credit stress support (+2), offset only by liquidity stress (-4). Technical evidence of 74.4 for XAR is strong across the board—trend at 97.8, momentum confirmation at 75.2, persistence at 63.3—yet the category does not crack the top-2 because two other categories offered better risk-adjusted returns in this late-cycle window. Energy and precious metals both scored higher and offer more direct macro alpha in an environment defined by supply shortages and inflation pressure. XAR would need either a breakout through the 142.18 resistance with volume confirmation, or a sharp spike in geopolitical risk descriptors, to earn a top-2 slot. The 5% allocation honors the category's technical merit while acknowledging that real-asset and energy exposures are better positioned for current macro conditions.
Agriculture & Livestock — WEAT
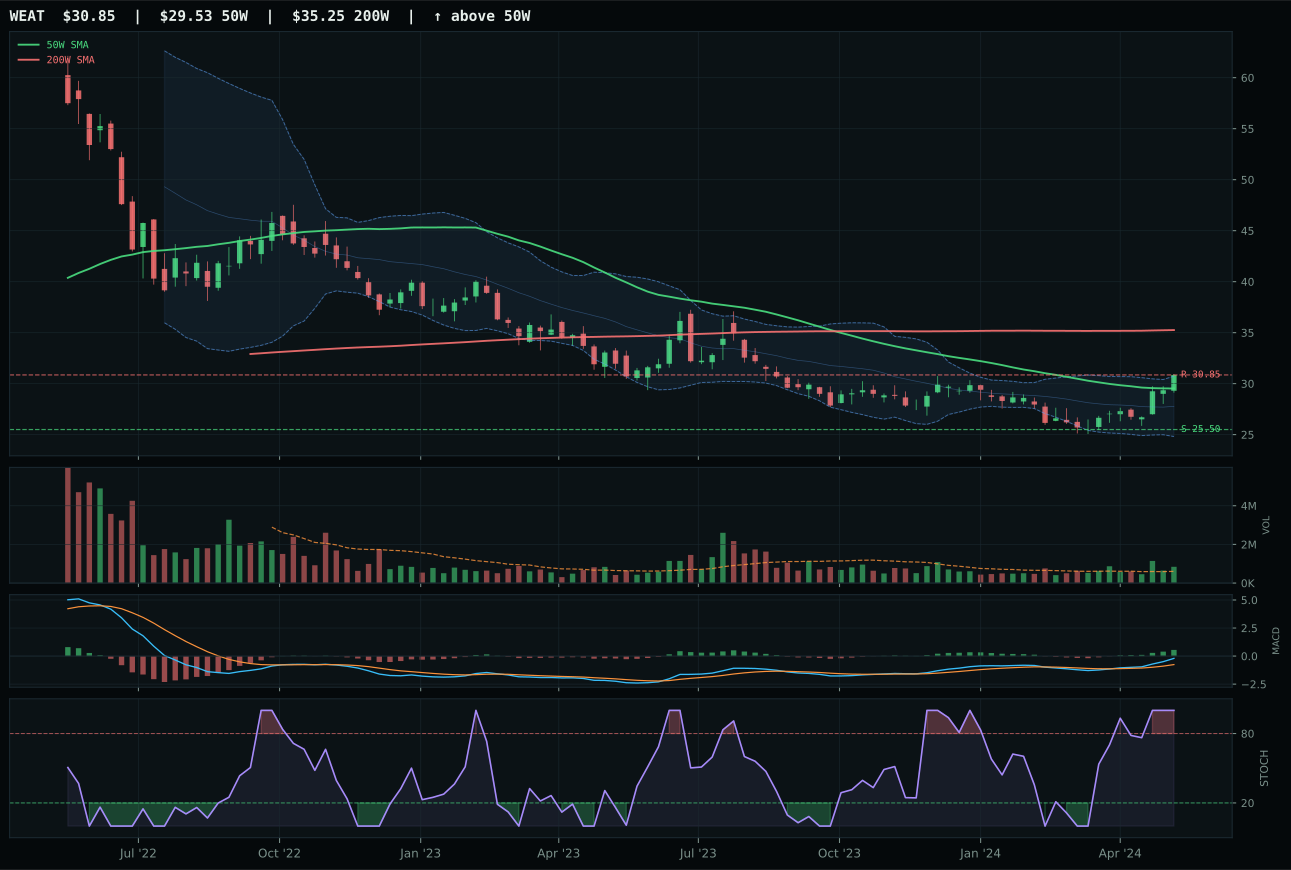
WEAT has a neutral structure profile with 6.5% 13-week relative strength versus SPY.
A failed hold above support would weaken the setup.
Actionable but governed by invalidation levels.
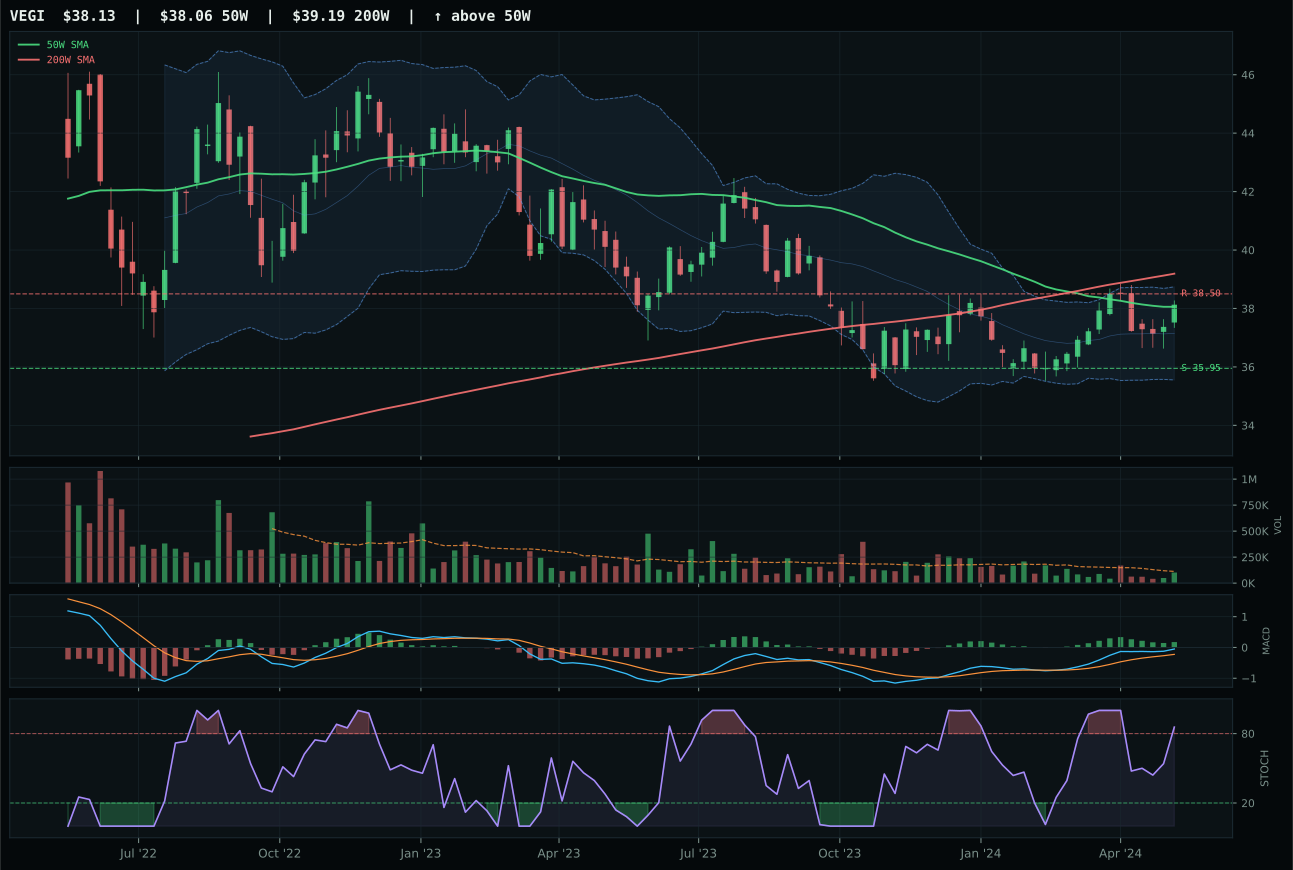
VEGI has a compression near 50W profile with 2.1% 13-week relative strength versus SPY.
A failed hold above support would weaken the setup.
Tracked, but not top-2 eligible because: .
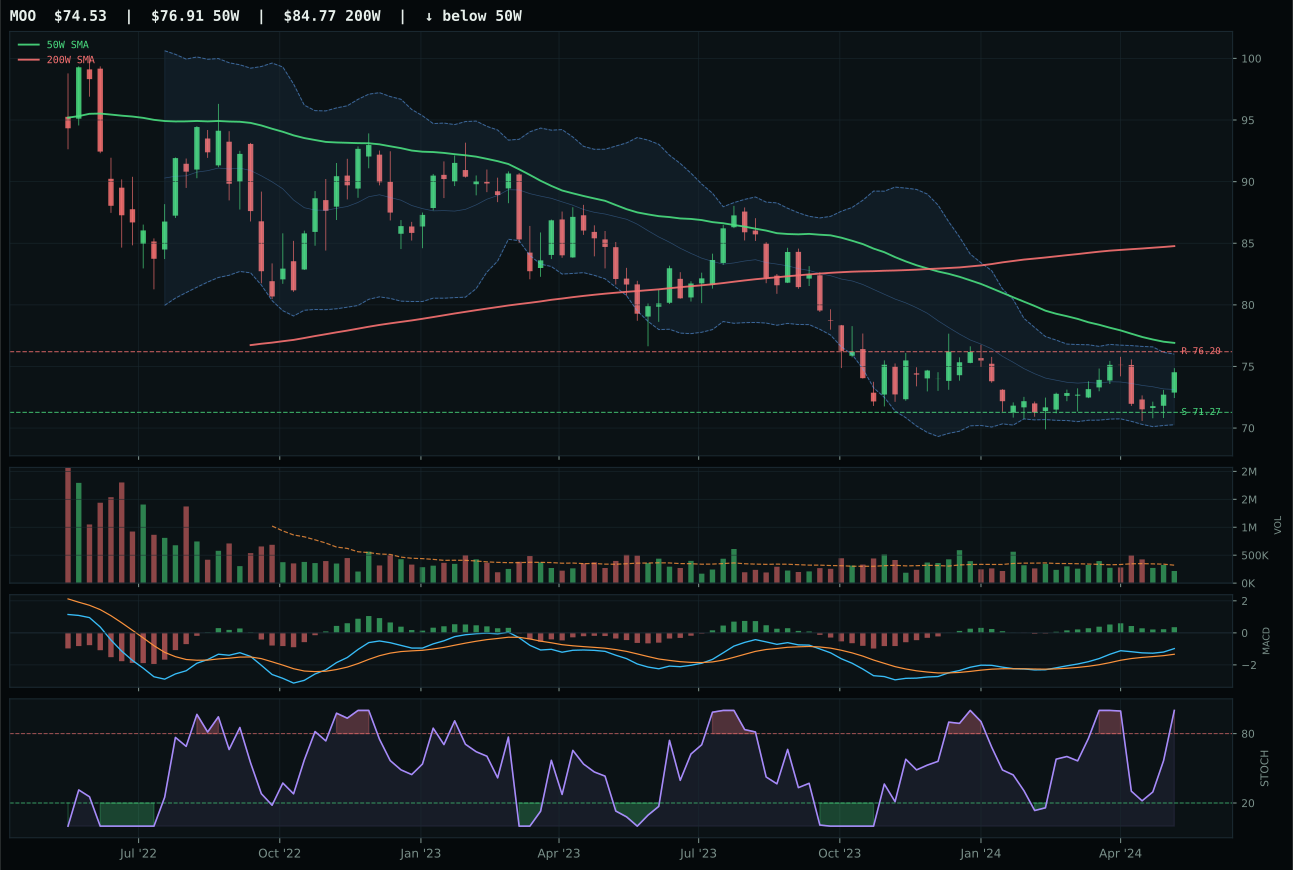
MOO has a pullback into support profile with 0.7% 13-week relative strength versus SPY.
Extension and support failure are the main tactical risks.
Tracked, but not top-2 eligible because: structurally broken.
WEAT dominates the category by 19.1 points over runner-up VEGI, driven by explosive momentum confirmation—a perfect 100.0 score—paired with above-average volume participation at 1.39x 20W average, the only name in the category showing institutional accumulation. The 10.4% 13W return is nearly double VEGI's 6.0%, and the 4W return of 15.3% demonstrates recent acceleration into resistance at 30.85. WEAT's timing score of 90 reflects a bullish and improving MACD combined with an overbought stochastic RSI at 1.00, but the setup is neutral structure and support sits 21.0% below—ample room for mean reversion without breaking the bull case. VEGI's MACD is bullish but flattening, a visible sign of momentum degradation, and its volume is merely neutral. Category-relative strength of 4.3% for WEAT versus 0.0% for VEGI signals selective fund inflows; the technicals confirm institutional preference for WEAT's sharper setup.
Agriculture & Livestock receives 5% at tier-2 despite a macro fit of 90.0—the highest across all ten categories. Supply shortage, inflation pressure, real asset sponsorship, and commodity breadth positive all fire at full strength (+13, +10, +8, +5 respectively), creating a top-tier macro backdrop. Technical evidence of 88.2 for WEAT reinforces the narrative. Yet the category ranks tier-2 rather than top-2 because late-cycle reflation favors energy and metals more directly; oil and copper face tighter physical constraints with more explosive momentum. WEAT is near 52W highs and stochastic RSI is maxed at 1.00, which introduces timing risk despite strong technicals. To earn a top-2 slot, WEAT would need to pull back into support around 25.50 and establish a secondary consolidation with improving volume, building a lower-risk entry for the strong macro case. The 5% slot captures the category's legitimate value without overstaying a stretched setup.
AI — BOTZ
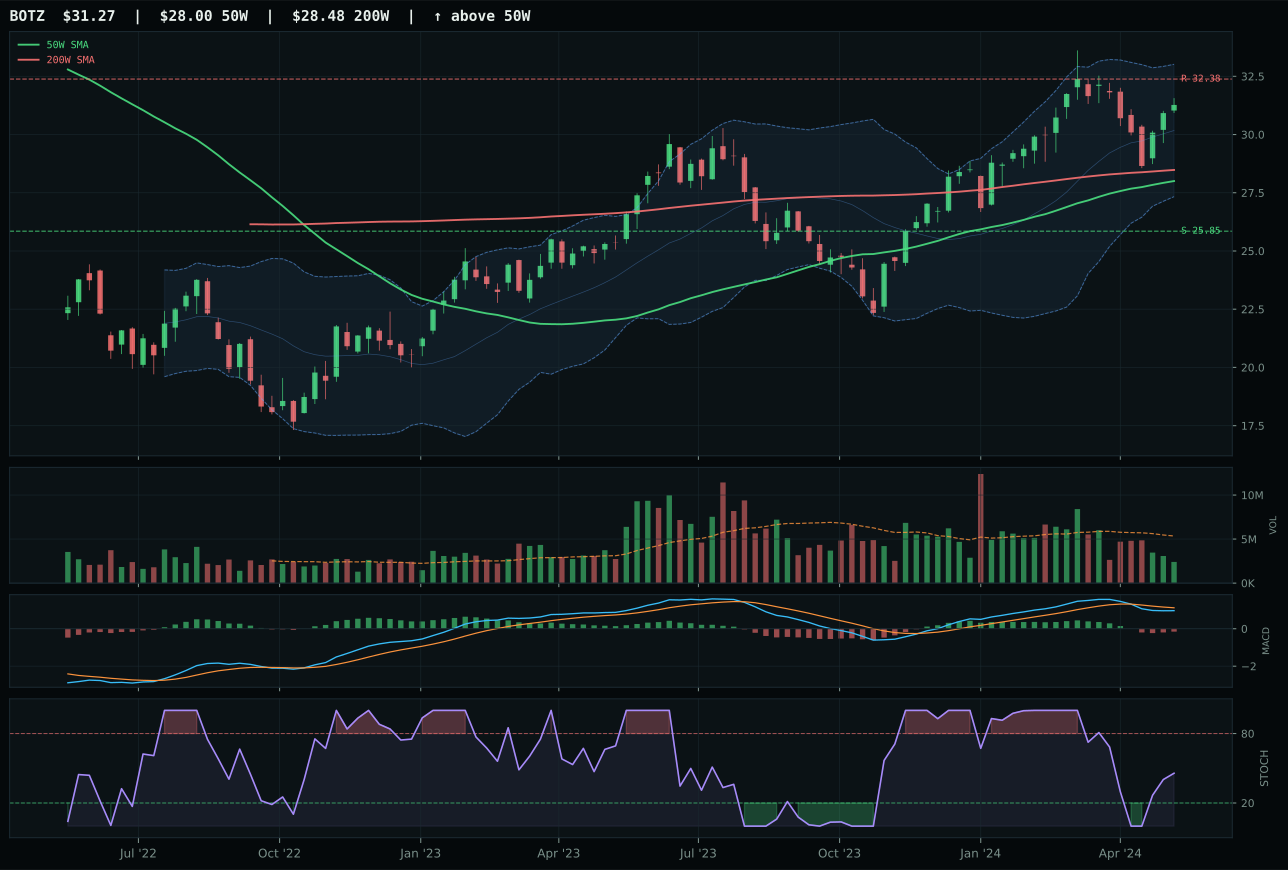
BOTZ has a neutral structure profile with 0.6% 13-week relative strength versus SPY.
A failed hold above support would weaken the setup.
Actionable but governed by invalidation levels.
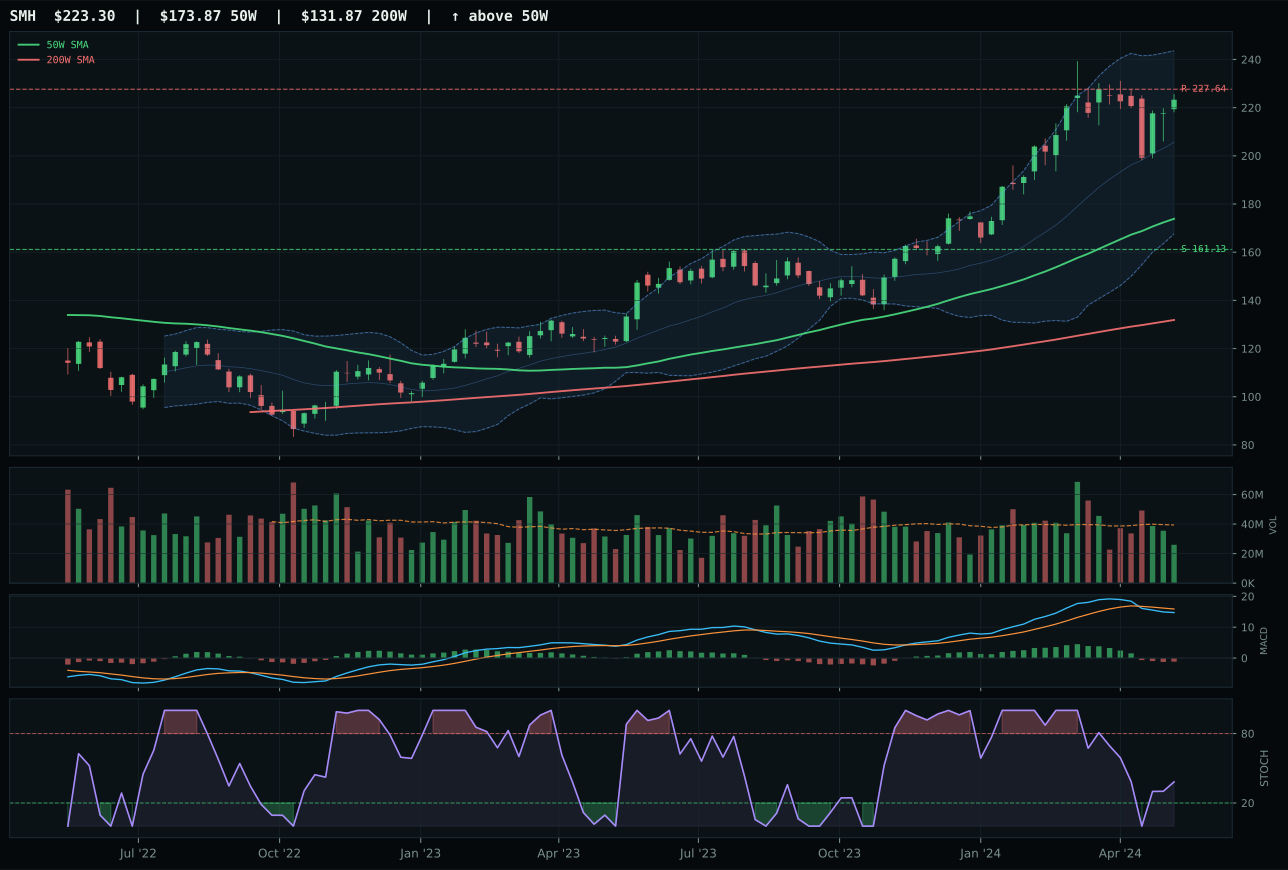
SMH has a vertical extension profile with 5.6% 13-week relative strength versus SPY.
A failed hold above support would weaken the setup.
Actionable but governed by invalidation levels.
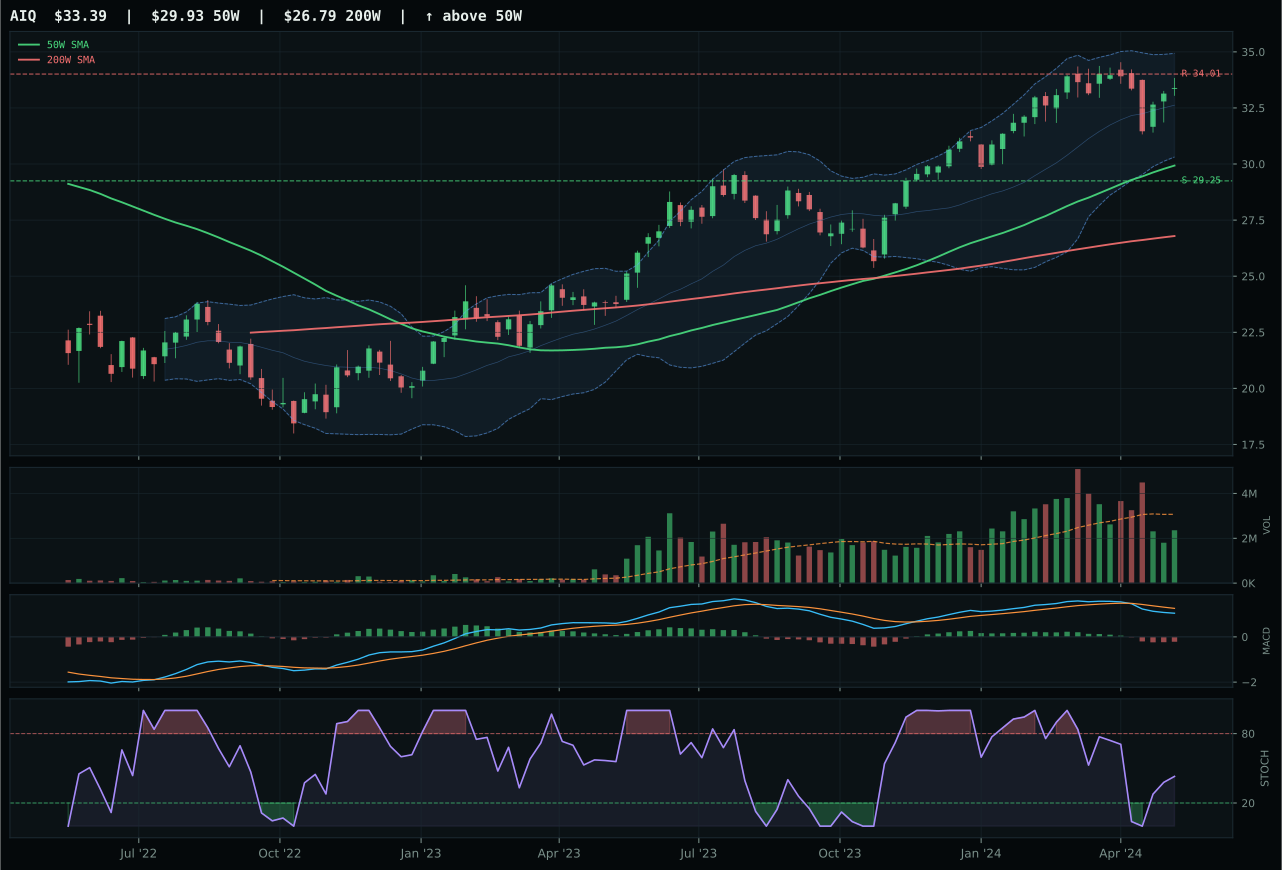
AIQ has a neutral structure profile with -2.6% 13-week relative strength versus SPY.
A failed hold above support would weaken the setup.
Actionable but governed by invalidation levels.
BOTZ defeats SMH by 13.3 points through tighter setup discipline and better timing for entry. While SMH boasts a trend score of 90 and stronger 13W momentum at 9.5%, it has already moved 28.4% away from its 50W—nearly 2.5x the distance of BOTZ at 11.7%—which punishes late-stage participation. BOTZ's neutral structure scores 72.0 versus SMH's 69.5, and its stochastic RSI at 0.46 in the rising mid-zone is preferable to SMH's overbought momentum territory. The risk/reward is also tighter: BOTZ offers 21.0% downside to support against just -3.4% upside to resistance, whereas SMH's -1.4% upside cushion leaves no margin for error. Both names face bearish/weakening MACD and thin volume, but BOTZ's 4.5% 13W return and flat category-relative strength suggest orderly accumulation rather than momentum-driven extension.
AI ranks tier-2 at 5% allocation. The category score of 44.9 sits in the middle tier, above the excluded 9th and 10th slots but below the top-2 overweights. Macro fit of 44.0 is neutral-to-weak: while AI growth sponsorship is active at +14, liquidity stress (-12) and credit stress (-8) clip the category's upside. Technical evidence of 49.8 reflects BOTZ's solid chart—trend at 82.9, momentum confirmation at 43.2, and persistence at 50.5—but the late-cycle macro regime offers richer risk-adjusted opportunities in energy and metals. BOTZ would need either a cleaner pullback to reset timing or a macro flip toward liquidity to graduate to tier-1. For now, the 5% slot acknowledges the robotics and physical AI trade is live, but execution risk and macro headwinds prevent a larger commitment.
Emerging Markets — IEMG
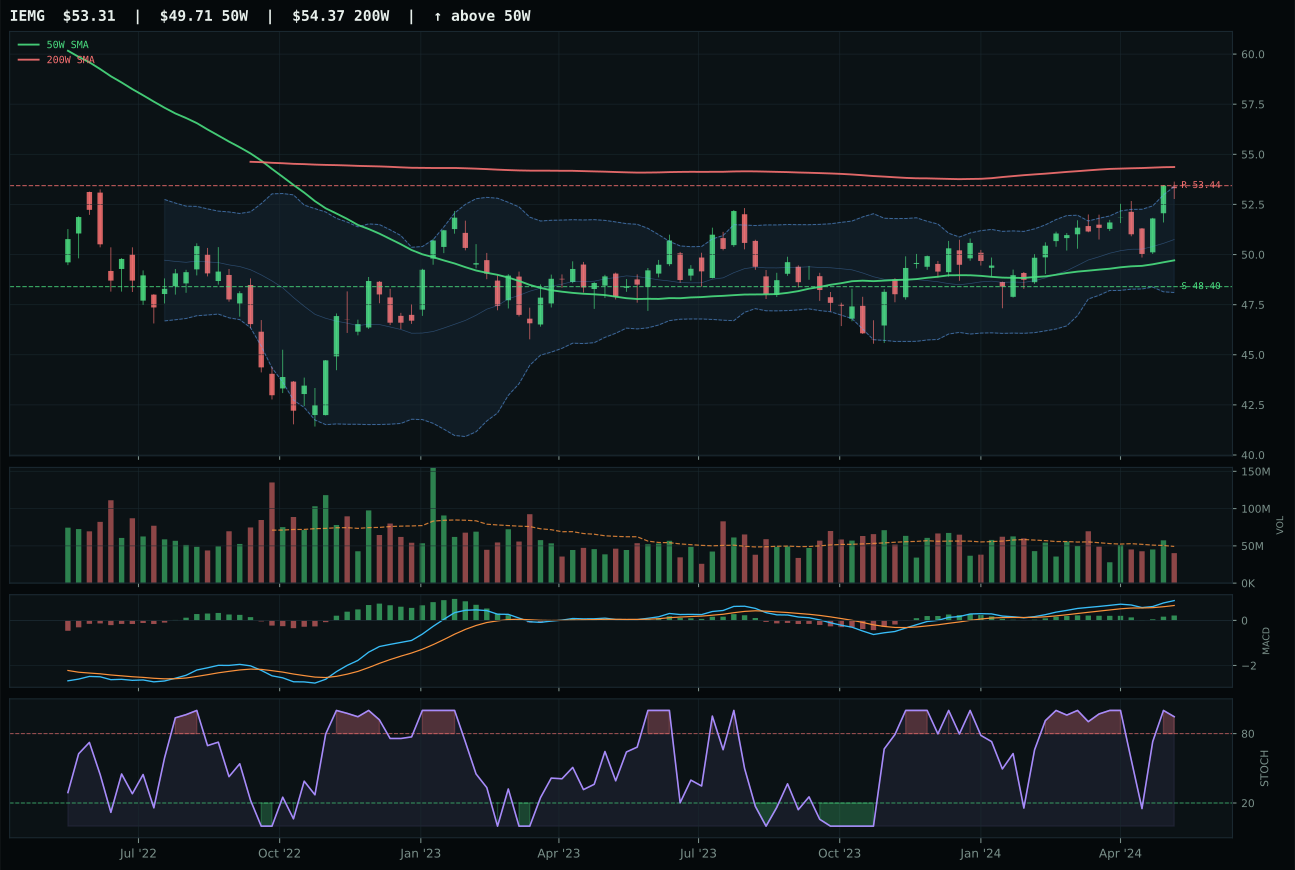
IEMG has a neutral structure profile with 3.0% 13-week relative strength versus SPY.
A failed hold above support would weaken the setup.
Actionable but governed by invalidation levels.
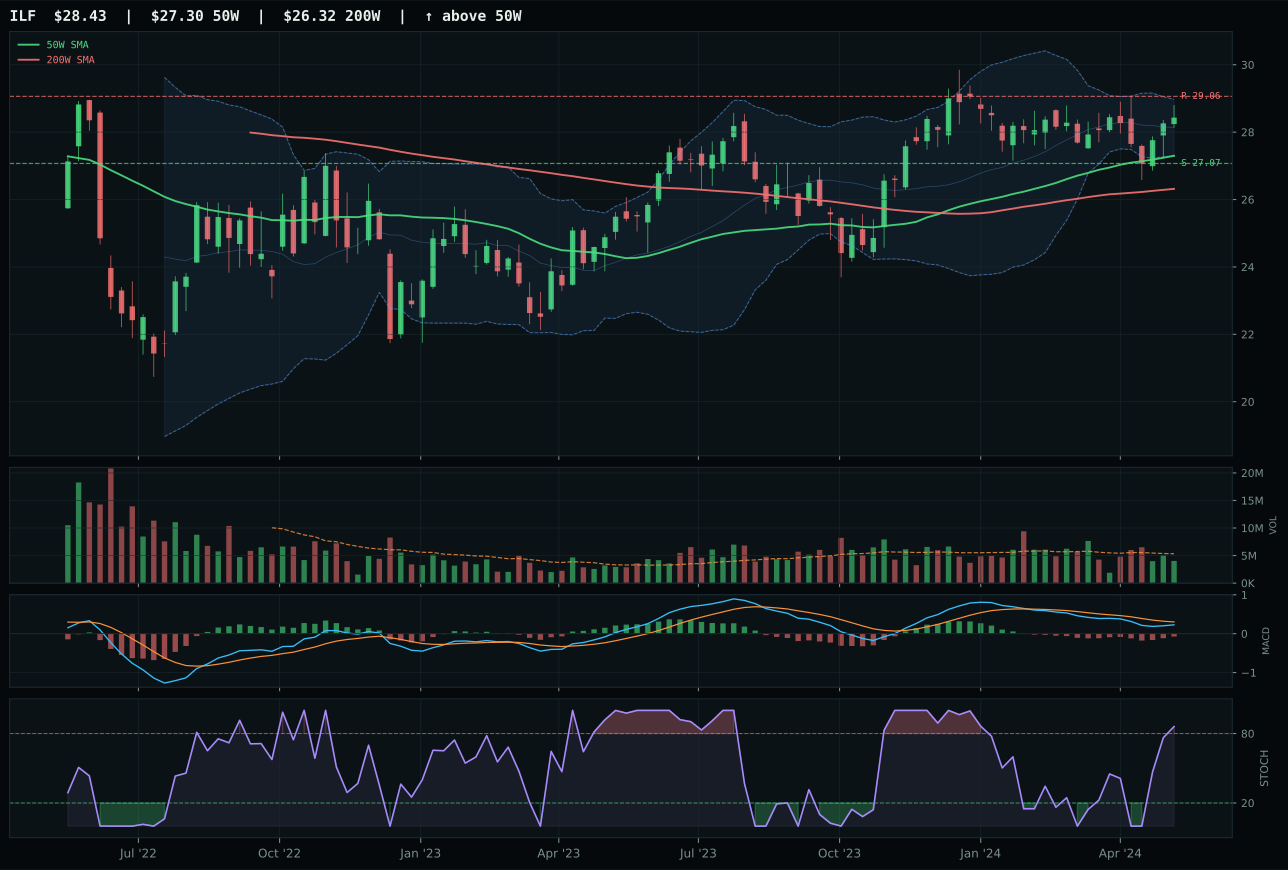
ILF has a neutral structure profile with -2.6% 13-week relative strength versus SPY.
A failed hold above support would weaken the setup.
Actionable but governed by invalidation levels.
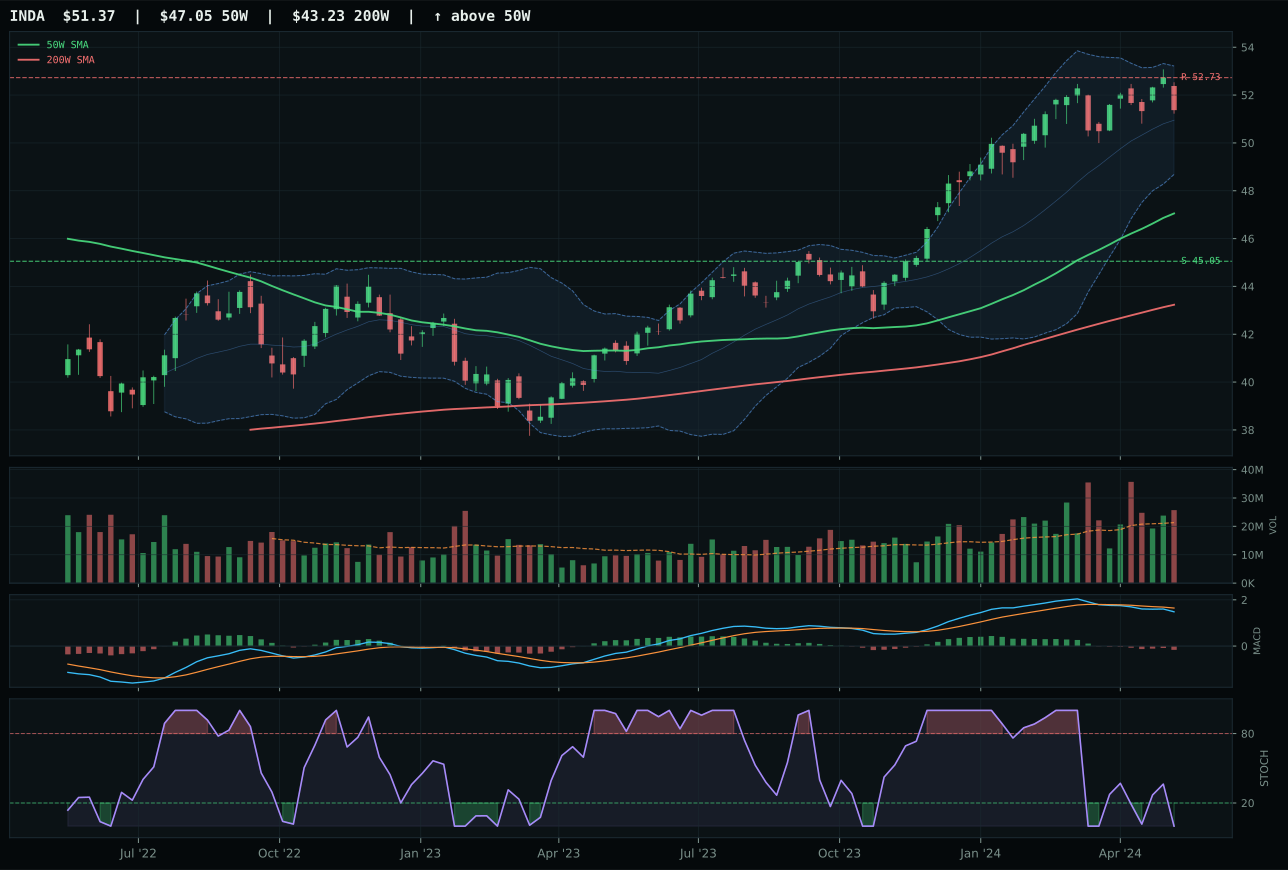
INDA has a neutral structure profile with -2.6% 13-week relative strength versus SPY.
A failed hold above support would weaken the setup.
Actionable but governed by invalidation levels.
IEMG defeats ILF by 2.8 points on the strength of superior momentum confirmation (90.0 vs 54.0) and bullish MACD quality (bullish and improving vs bearish but improving). Both names sit near 52W highs in neutral structure with overbought stochastic RSI at 0.95 for IEMG and 1.00 for ILF, but IEMG's 7.0% 13W return and 5.6% category-relative strength indicate fresher institutional participation in broad emerging-market beta, while ILF's 1.3% 13W return and 0.0% category-relative strength suggest Latin America is unloved within the cohort. ILF benefits from stronger macro narrative fit (59.0 vs 34.0) due to commodity and real-asset support, yet the technicals reveal exhaustion: MACD is bearish but improving rather than bullish and improving, and ILF's structure cleanliness is weaker at 75.1. IEMG's upside to resistance is only -0.2%, a razor-thin margin, but its momentum and MACD quality edge out ILF in a category that lacks conviction.
Emerging Markets receives 0% allocation, ranked 9th or 10th, and excluded entirely from the portfolio. The macro fit of 30.0 is disqualifying: credit stress (-10) and liquidity stress (-10) are the two most potent headwinds in the current regime, and they hit emerging markets harder than developed equities. IEMG's technical evidence of 81.7 is respectable—trend at 94.6, momentum at 90.0—but it cannot overcome the structural macro headwinds. Even IEMG's bullish MACD and rising 13W momentum at 7.0% feel defensive rather than offensive; this is emerging-market upside despite macro pressure, not because of tailwinds. For Emerging Markets to earn a tier-2 slot, either credit stress or liquidity stress would need to flip from active to inactive, or a macro pivot toward growth sponsorship would be required. In the current late-cycle reflation regime, both seem unlikely near term. The category's exclusion frees capital for energy, metals, and gold—all of which offer superior risk-adjusted returns in an inflation-and-scarcity macro backdrop.
Technology — XLK
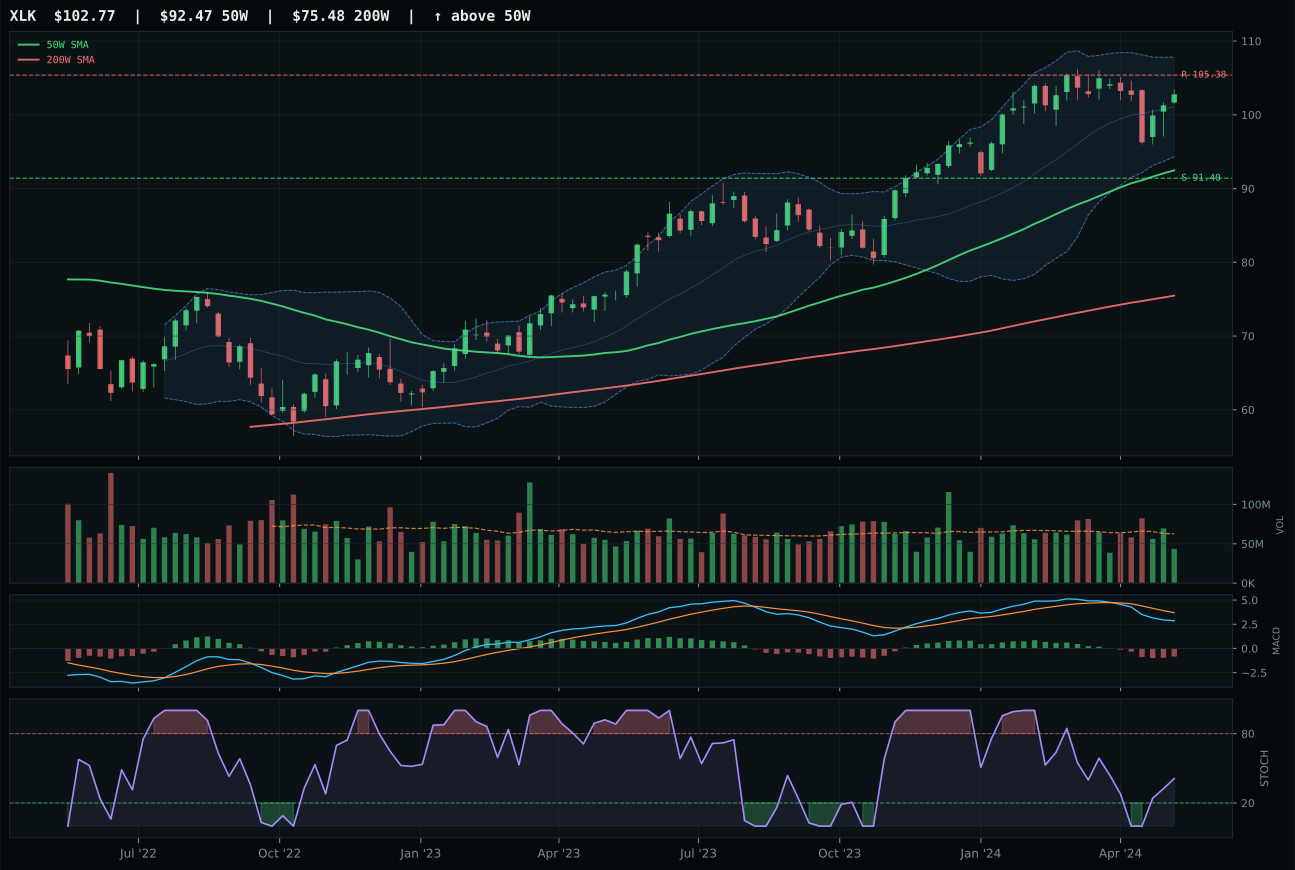
XLK has a neutral structure profile with -5.0% 13-week relative strength versus SPY.
A failed hold above support would weaken the setup.
Actionable but governed by invalidation levels.
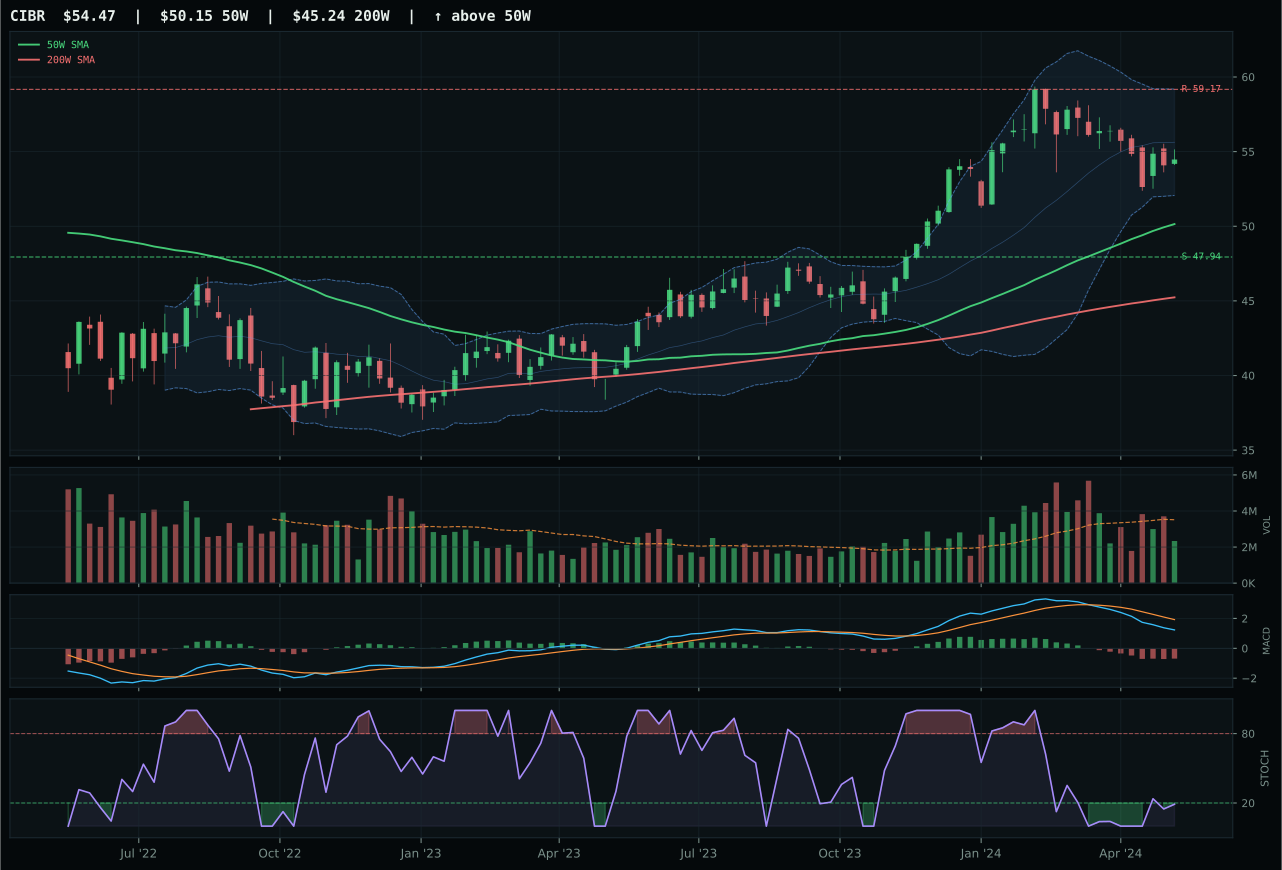
CIBR has a neutral structure profile with -11.9% 13-week relative strength versus SPY.
A failed hold above support would weaken the setup.
Actionable but governed by invalidation levels.
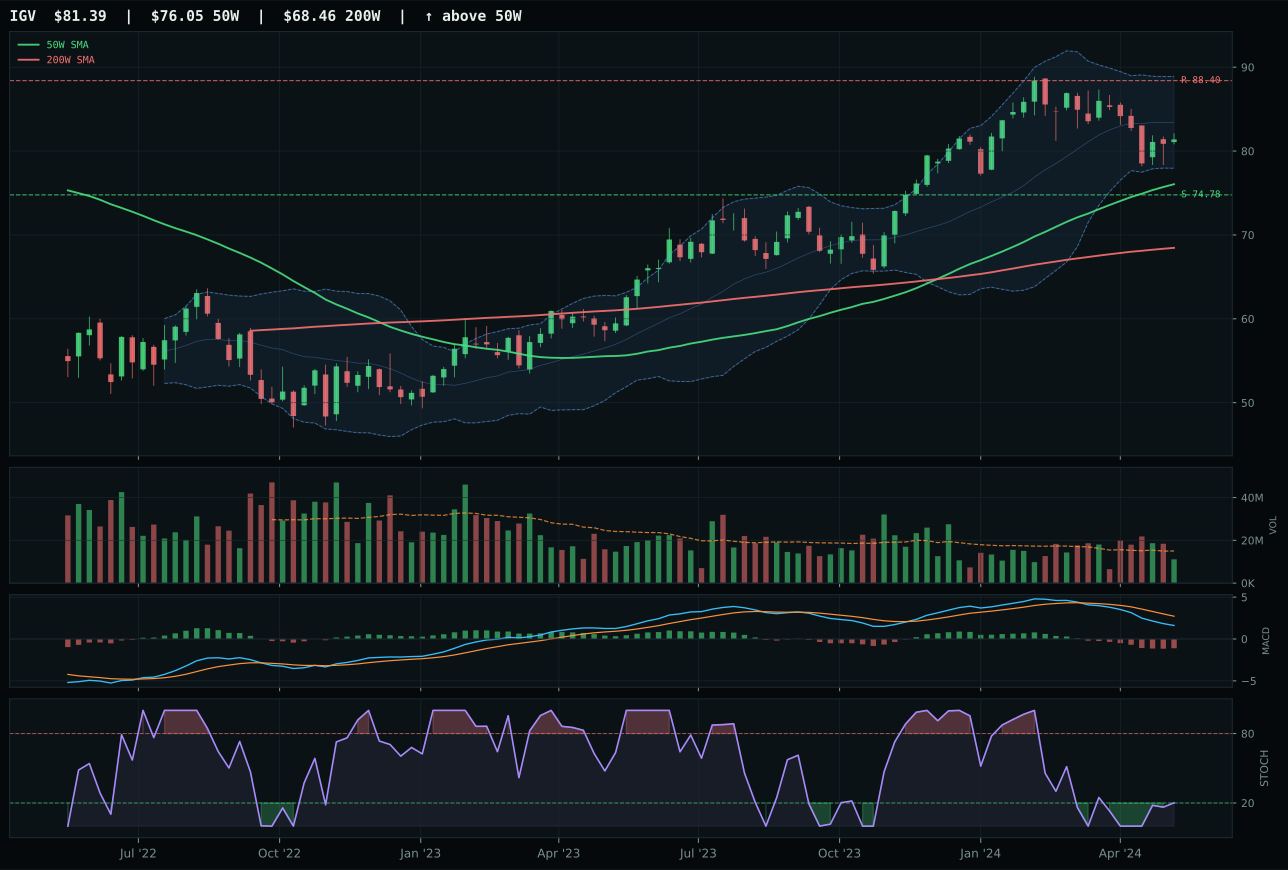
IGV has a neutral structure profile with -11.9% 13-week relative strength versus SPY.
A failed hold above support would weaken the setup.
Actionable but governed by invalidation levels.
XLK wins the category with a 4.6-point margin over CIBR by virtue of superior relative strength inside its own basket—6.8% versus category median against CIBR's flat 0.0%—paired with better momentum confirmation at 31.8 versus 7.0. The trend score of 74.5 reflects price holding above both the 50W and 200W, but the real advantage lies in XLK's timing: stochastic RSI is rising through the mid-zone at 0.41, suggesting room for follow-through, whereas CIBR is oversold turning up—a more fragile entry. Volume participation remains thin across the basket at 0.70x 20W average, which caps conviction on all three names, but XLK's 13W return of -1.1% is materially better than CIBR's -7.9%, indicating selective accumulation in a sector grinding sideways.
Technology ranks 9th or 10th this week and receives 0% allocation. The category's macro fit of 35.0 is dragged down by active liquidity stress (-10) and credit stress (-7) descriptors that override a modest AI growth sponsorship boost of +6. Late-Cycle Reflation favors real assets and energy over capital-intensive tech, and the technical evidence score of only 46.9 cannot compensate when macro headwinds are this explicit. XLK's own macro narrative fit is just 35.0, confirming the category lacks the structural tailwind to justify a slot in a ten-category choice set. For Technology to earn a position, either the liquidity or credit stress flags would need to flip, or a clean breakout with volume confirmation above 1.0x the 20W average would need to establish institutional re-entry. Neither condition is present.