
2024-05-03
Informational purposes only. The content in this report, including allocations, analysis, and commentary, is provided solely for informational and educational purposes. It does not constitute financial advice, investment advice, trading advice, or any other type of advice. Past performance does not guarantee future results. Always conduct your own research and consult a qualified financial professional before making investment decisions.
Weekly Allocation
| Ticker | Category | Weight | Role |
|---|---|---|---|
| FBTC | 50% | Overlay | |
| XLE | Traditional Energy | 10% | Top-2 (10%) |
| GLD | Precious Metals | 10% | Top-2 (10%) |
| COPX | Industrial Metals | 5% | Tier-2 (5%) |
| XLU | Utilities & Infrastructure | 5% | Tier-2 (5%) |
| NLR | Nuclear Energy | 5% | Tier-2 (5%) |
| BOTZ | AI | 5% | Tier-2 (5%) |
| XAR | Defense & Aerospace | 5% | Tier-2 (5%) |
| WEAT | Agriculture & Livestock | 5% | Tier-2 (5%) |
Trade Instructions — Monday Open
Sell the tranche from 2024-04-05 (completing its 4-week hold). Buy the new tranche. Instructions show net portfolio changes — same-asset positions cancel, weight changes show the delta.
| Action | Ticker | Instruction |
|---|---|---|
| SELL | URNM | Sell 33% of URNM position (reduce 3.75% → 2.50%) |
| SELL | AIQ | Sell 33% of AIQ position (reduce 3.75% → 2.50%) |
| SELL | ITA | Sell 25% of ITA position (reduce 5.00% → 3.75%) |
| SELL | XLK | Sell entire XLK position (1.25% of portfolio) |
| BUY | WEAT | Buy WEAT — 25.00% of freed cash (adds 1.25% to portfolio) |
| BUY | NLR | Buy NLR — 25.00% of freed cash (adds 1.25% to portfolio) |
| BUY | BOTZ | Buy BOTZ — 25.00% of freed cash (adds 1.25% to portfolio) |
| BUY | XAR | Buy XAR — 25.00% of freed cash (adds 1.25% to portfolio) |
Current Portfolio After Trade
Combined holdings across all 4 active tranches. Each tranche is 25% of the portfolio.
| Ticker | % of Portfolio | Weight Bar |
|---|---|---|
| FBTC | 50.00% | |
| XLE | 10.00% | |
| GLD | 10.00% | |
| COPX | 5.00% | |
| XLU | 5.00% | |
| WEAT | 5.00% | |
| ITA | 3.75% | |
| URNM | 2.50% | |
| AIQ | 2.50% | |
| NLR | 2.50% | |
| SMH | 1.25% | |
| BOTZ | 1.25% | |
| XAR | 1.25% |
Macro Regime — Late-Cycle Reflation
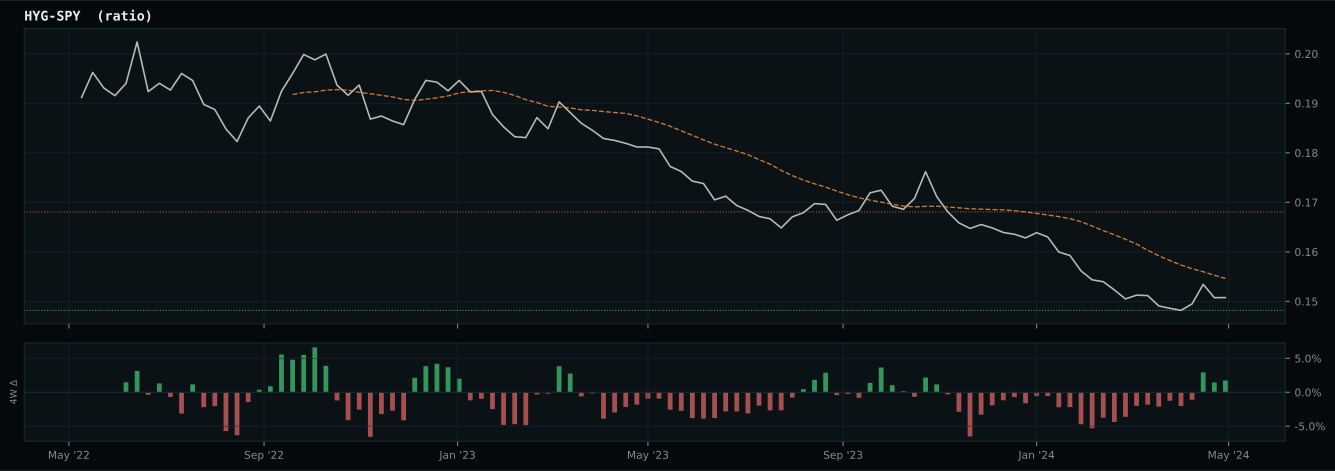
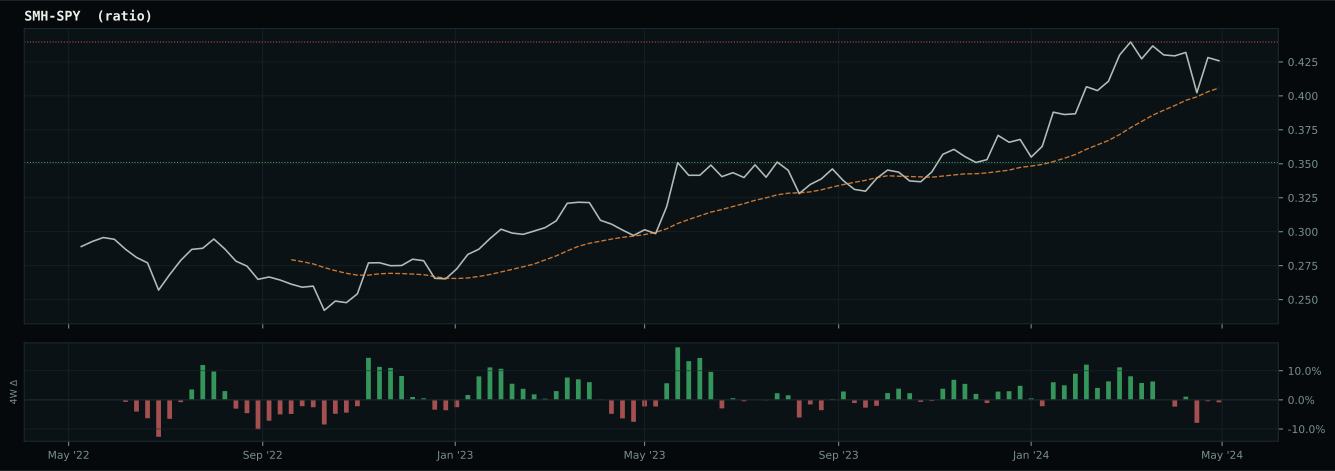
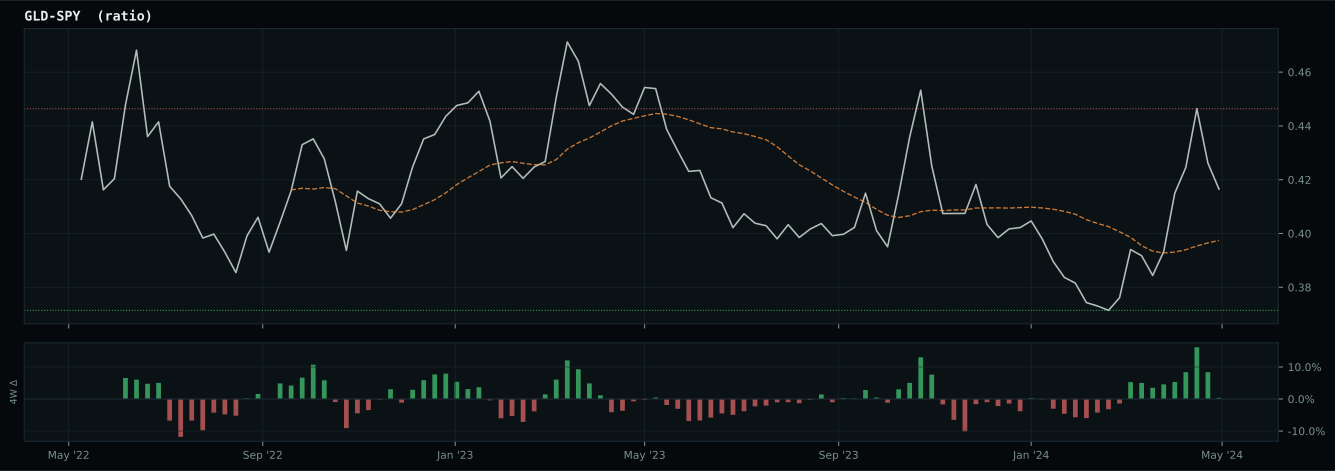
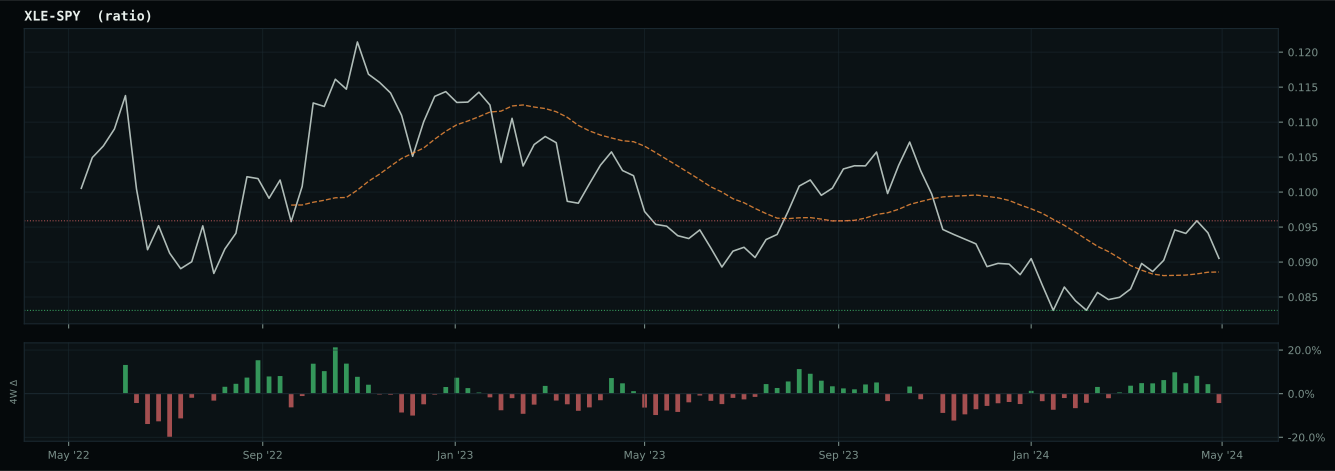
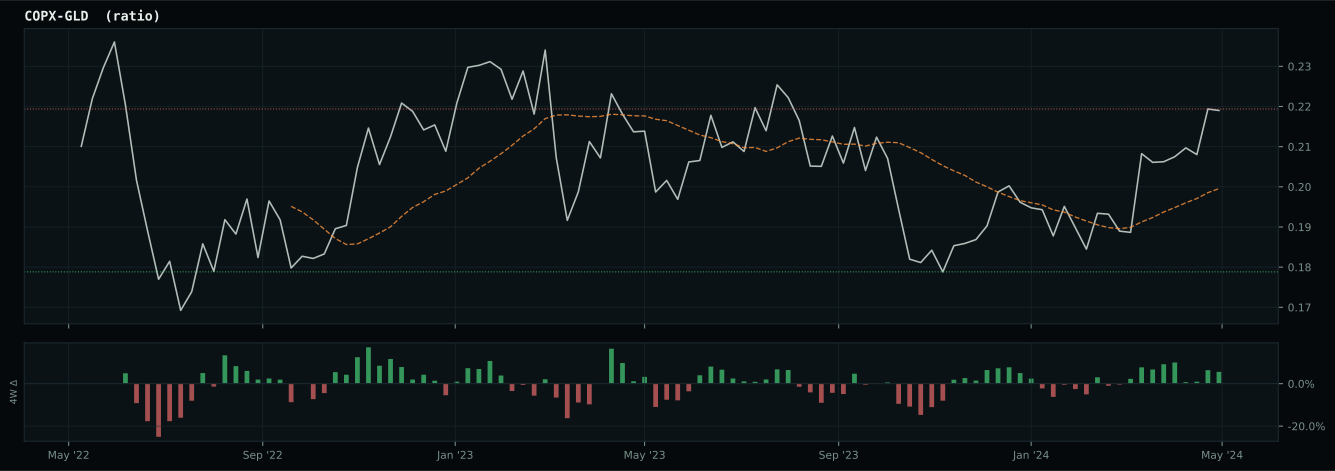
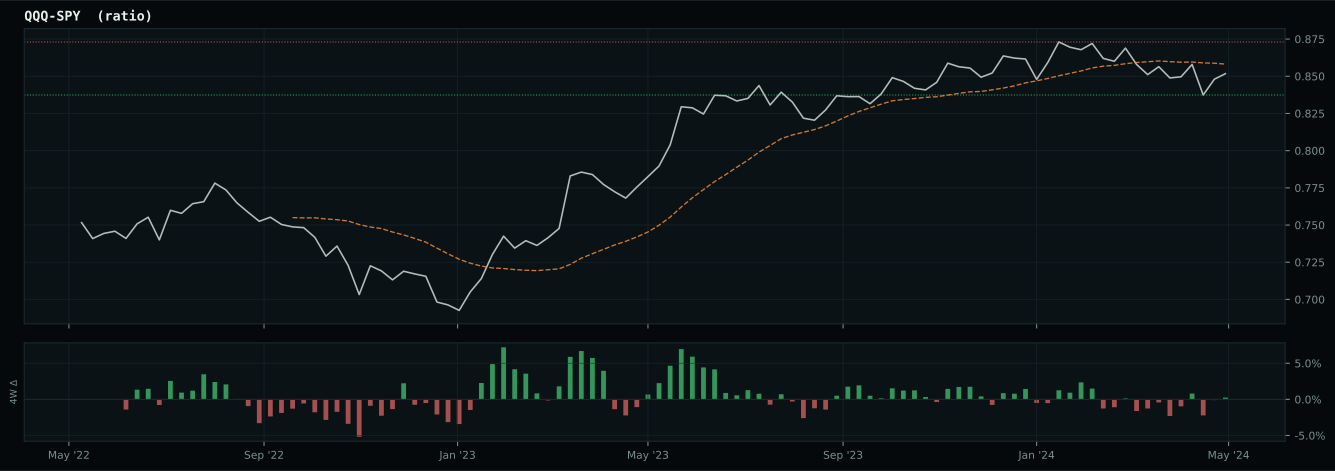
Macro Evidence Charts
Market-implied signals behind the macro regime scores. Each ratio compares two assets; the direction and slope of the ratio is what the macro engine reads.
Crypto Regime — TrendBTC
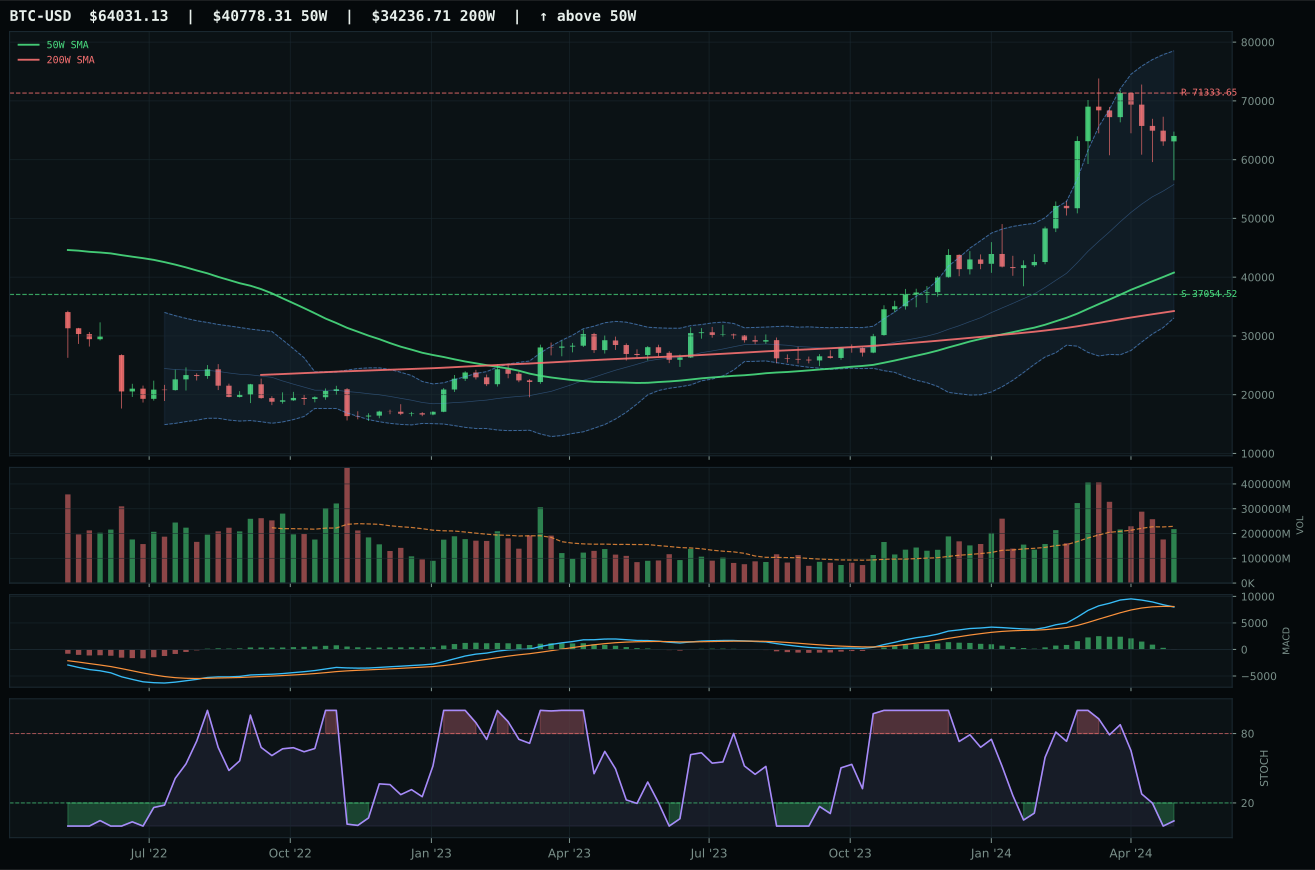
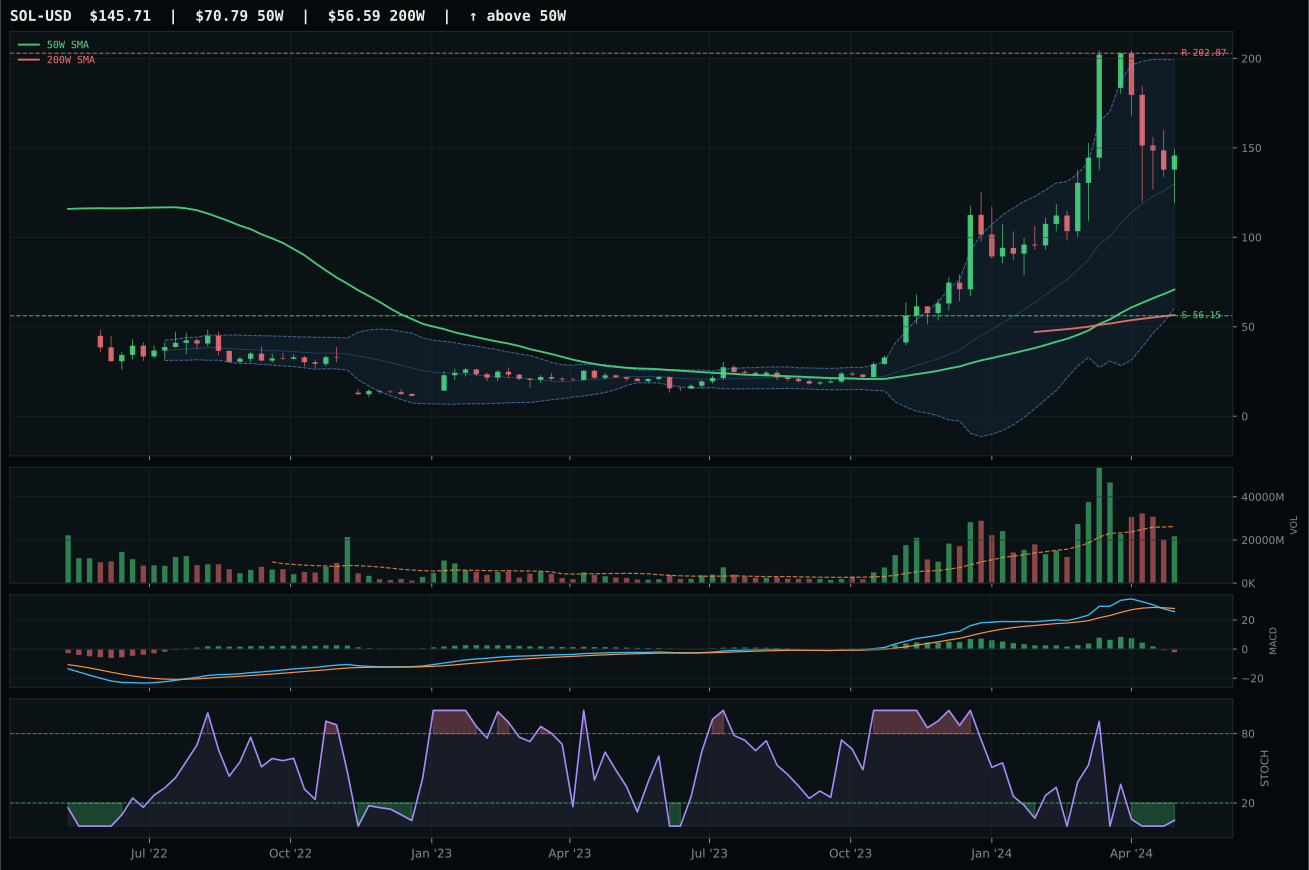
post-touch structure is too wide to count as a range; max/min close ratio is 3.22
TrendBTC confirmed: 2 consecutive closes above rising/flat 50W SMA
one or more available conditions failed
Category Rankings
| Rank | Category | Winner | Score | Alloc | 4W Ret | Peers (4W) |
|---|---|---|---|---|---|---|
| 1 | Traditional Energy | XLE | 80.2 | 20% | +0.03% | FCG +1.7% · XOP +0.9% |
| 2 | Precious Metals | GLD | 74.7 | 20% | +0.36% | GDX +3.7% · SLV +11.3% |
| 3 | Industrial Metals | COPX | 72.6 | 10% | +3.19% | PICK -0.2% · REMX -3.5% |
| 4 | Utilities & Infrastructure | XLU | 60.4 | 10% | +5.80% | IGF +4.0% · PAVE +0.8% |
| 5 | Nuclear Energy | NLR | 56.1 | 10% | +6.44% | URA +4.0% · URNM +4.7% |
| 6 | AI | BOTZ | 46.1 | 10% | +0.42% | SMH +11.7% · AIQ +1.1% |
| 7 | Defense & Aerospace | XAR | 41.9 | 10% | +2.66% | ITA +2.5% · ROKT +1.5% |
| 8 | Agriculture & Livestock | WEAT | 33.6 | 10% | +9.90% | VEGI -1.4% · MOO -0.2% |
| 9 | Technology | XLK | 27.0 | 0% | +4.16% | CIBR -1.0% · IGV -3.3% |
| 10 | Emerging Markets | IEMG | 25.6 | 0% | -0.17% | INDA +4.6% · ILF -4.9% |
Traditional Energy — XLE
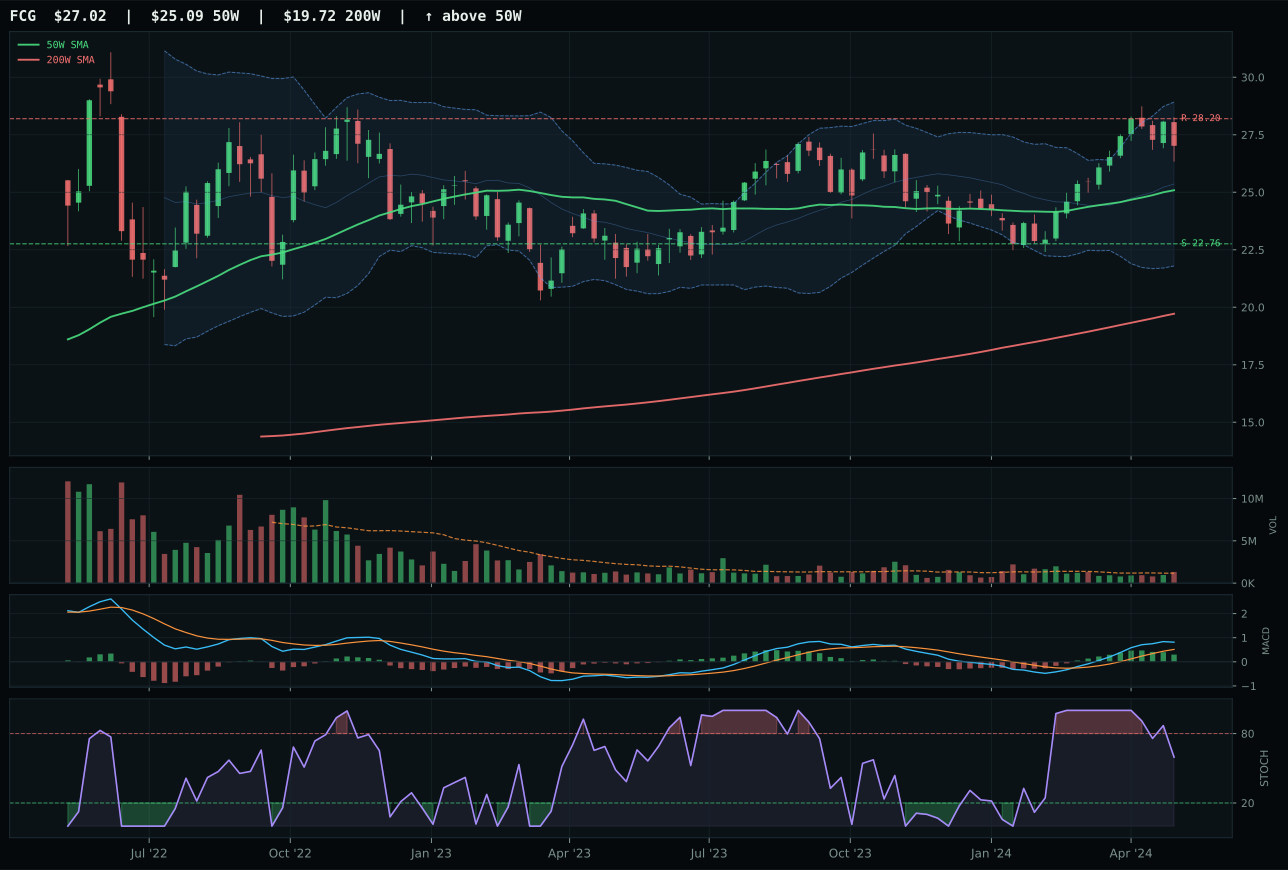
FCG has a neutral structure profile with 14.7% 13-week relative strength versus SPY.
A failed hold above support would weaken the setup.
Actionable but governed by invalidation levels.
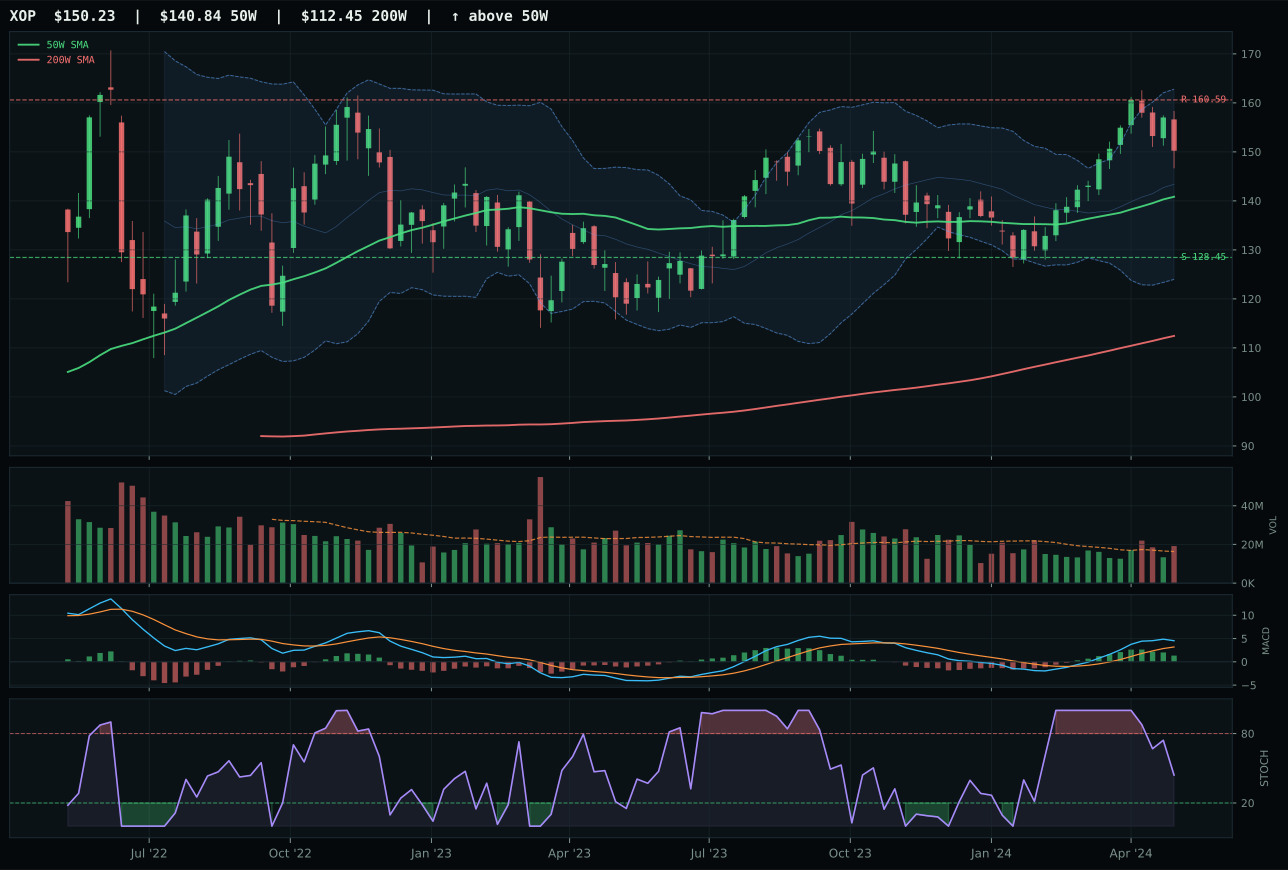
XOP has a neutral structure profile with 11.5% 13-week relative strength versus SPY.
A failed hold above support would weaken the setup.
Actionable but governed by invalidation levels.
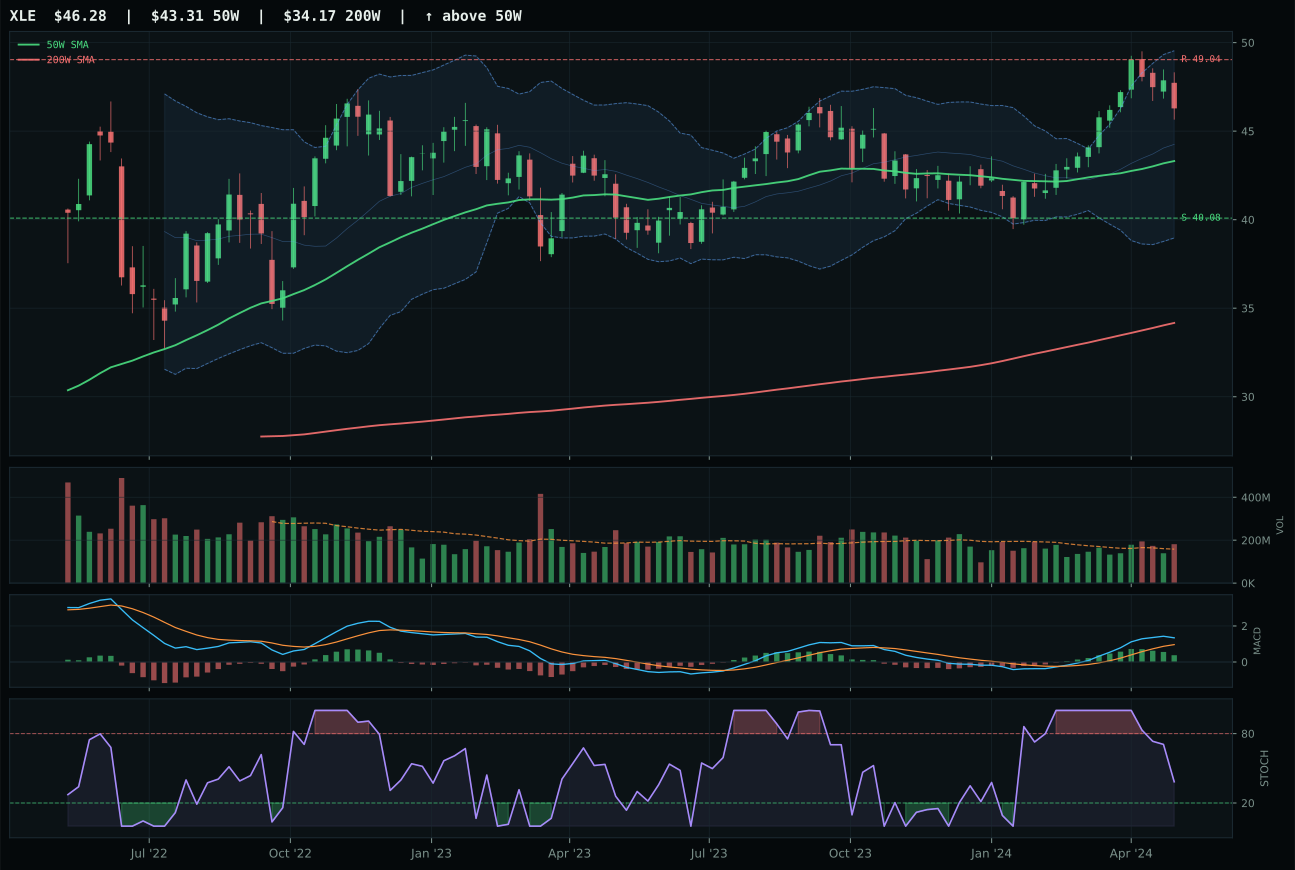
XLE has a neutral structure profile with 7.4% 13-week relative strength versus SPY.
A failed hold above support would weaken the setup.
Actionable but governed by invalidation levels.
XLE wins the category and claims top-2 allocation at 10%, delivering the strongest macro-technical alignment in the portfolio this week. Price sits 6.9% above the 50-week moving average in neutral structure with 7.4% RS versus SPY, MACD bullish but flattening, and stochastic RSI falling through neutral at 0.38—a setup that signals buyers are taking profits but trend remains constructive. Volume is above-average at 1.15x the 20-week average, confirming that the pullback is being accumulated rather than rejected. FCG lost the head-to-head despite higher 13-week performance (18.1% versus 10.8%) and better RS versus SPY (14.7% versus 7.4%) because its risk/reward tilts less favorably (49.0 versus 51.5) and XLE's neutral structure provides superior timing entry: every new dollar committed to XLE can be rationalized, whereas FCG's leadership has compressed the margin of safety.
Traditional Energy claims the second tier-1 slot at 10% allocation with the highest category score in the portfolio at 80.2, driven by exceptional macro fit of 90.0/100. Energy scarcity (+16), inflation pressure (+10), supply shortage (+9), and real asset sponsorship (+7) create a macro backdrop that is nearly unmatched in strength, while Late-Cycle Reflation itself contributes +12. XLE's technical evidence of 68.6/100 is merely solid, not exceptional—the category wins on macro conviction, not on chart perfection. The dual top-2 allocation between Traditional Energy and Precious Metals represents the portfolio's core hedge against reflation tail risk: both categories benefit from monetary hedge bid and defensive rotation, but energy adds supply-side and geopolitical safety premium. To maintain the 10% allocation, XLE must defend the 50-week moving average at 40.08 and hold above it with volume remaining above-average—a close below 40.08 on heavy volume would signal institutional exit and trigger an immediate reduction to tier-2 status at 5%.
Precious Metals — GLD
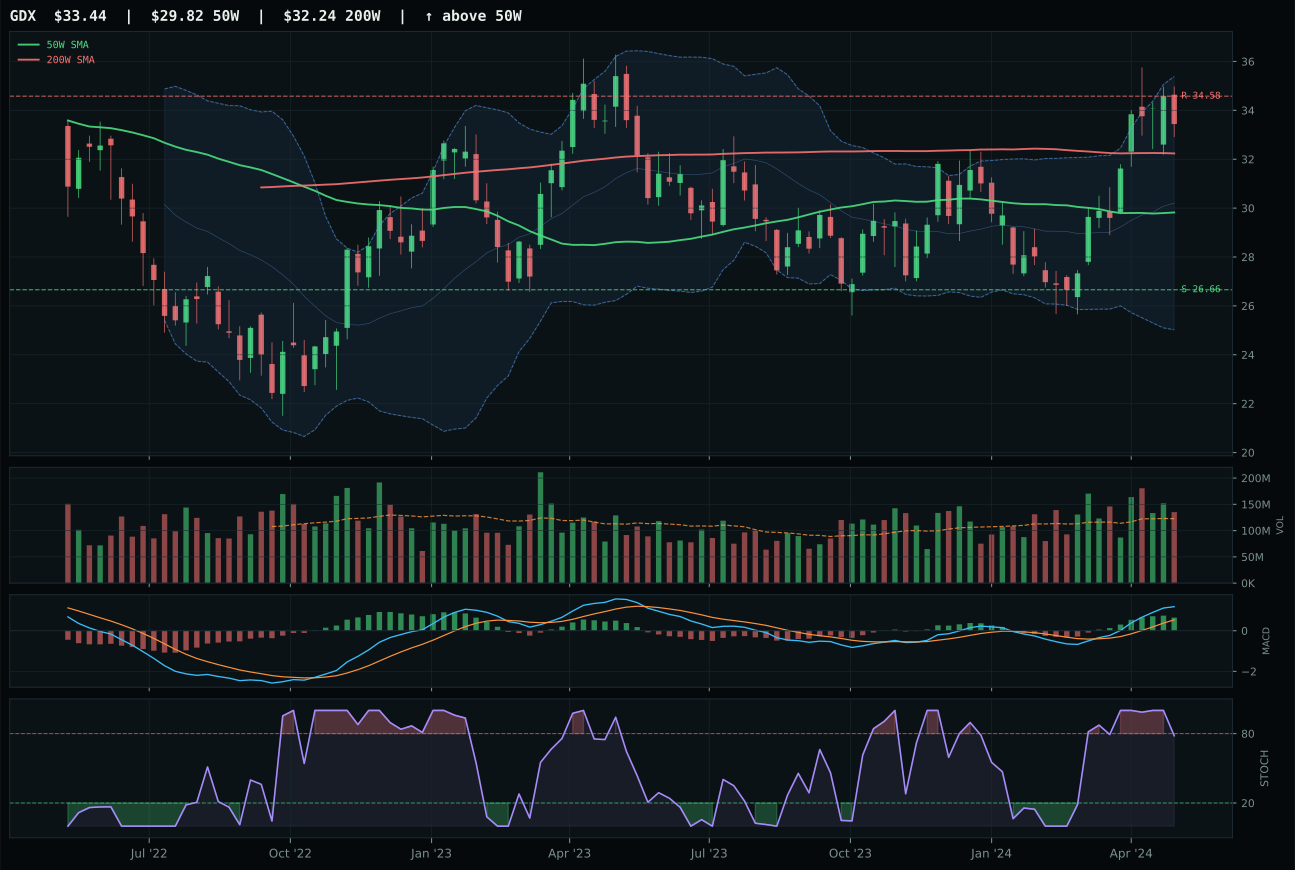
GDX has a neutral structure profile with 15.9% 13-week relative strength versus SPY.
A failed hold above support would weaken the setup.
Actionable but governed by invalidation levels.
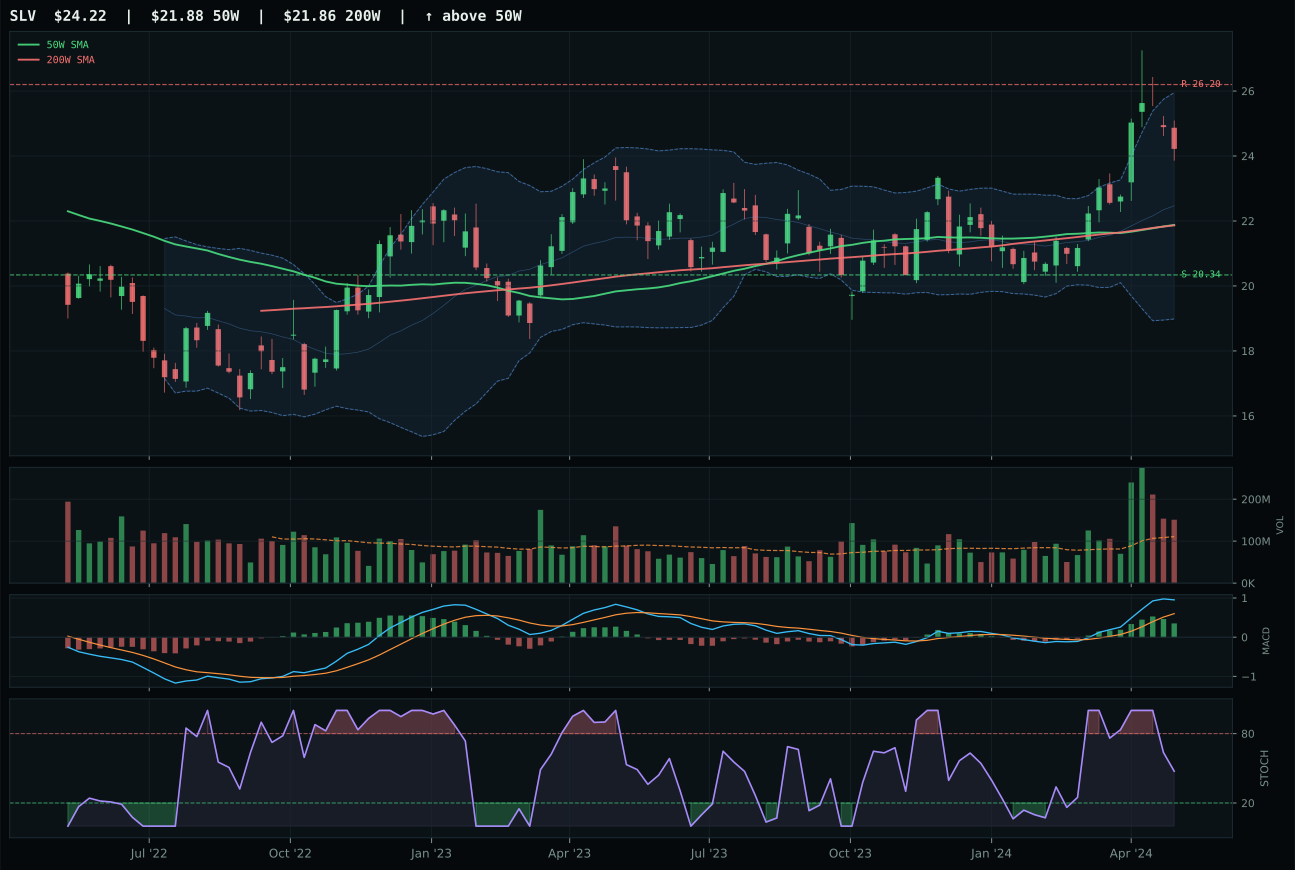
SLV has a neutral structure profile with 13.3% 13-week relative strength versus SPY.
A failed hold above support would weaken the setup.
Actionable but governed by invalidation levels.
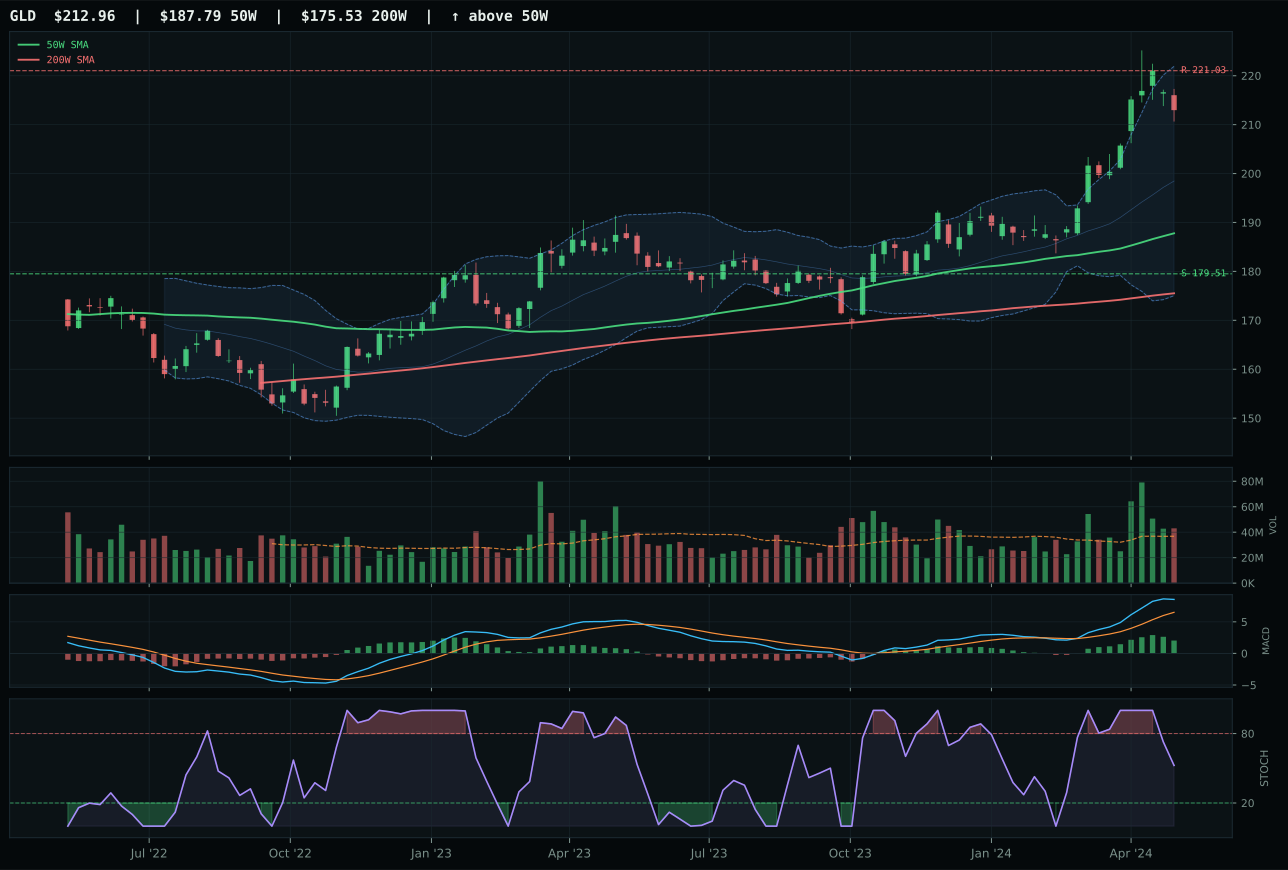
GLD has a neutral structure profile with 9.5% 13-week relative strength versus SPY.
A failed hold above support would weaken the setup.
Actionable but governed by invalidation levels.
GLD wins the category by a razor-thin margin of only 0.4 points against GDX, captured by XLK's cleaner structure score of 80.6 versus 74.8 and more reliable MACD confirmation (bullish but flattening versus bullish and improving). Price sits 13.4% above the 50-week moving average with neutral structure, above-average volume participation at 1.17x the 20-week average, and stochastic RSI falling from neutral—a pattern indicating that initial buyers are taking profits but the setup remains constructive. GLD's 12.9% 13-week return trails GDX's 19.3% significantly, yet the scoring layer favored the slower, more sustainable gold movement over the leveraged mining momentum. The runner-up lost because GDX's extended structure created timing disadvantage: it sits higher above the 50-week, its MACD is improving but from a stretched position, and the risk/reward unfolds with limited margin of safety given the vertical extension.
Precious Metals ranks as top-2 overweight at 10% allocation, tying with Traditional Energy as the portfolio's highest conviction plays this week at a category score of 74.7. GLD's technical evidence of 72.6/100 combined with macro fit of 70.0/100 reflects the dual tailwind of monetary hedge bid (+14) and defensive rotation (+6) activating in a Late-Cycle Reflation regime where credit and liquidity stress are pinching other risk assets. The category score rebounded despite technical weakness elsewhere because the macro reasoner weighted precious metals as the cleaner inflation hedge than industrials. GLD is trading near resistance at 221.03, and the extended setup suggests that new entry is challenging, but the above-average volume and bullish MACD (despite flattening) indicate that institutional demand for hedges remains active. To maintain this 10% allocation, GLD must not fall below the 50-week moving average at 179.51 and must hold above 200 on any pullback—a break below would trigger a rotation toward tier-2 status and reduce allocation to 5%.
Industrial Metals — COPX
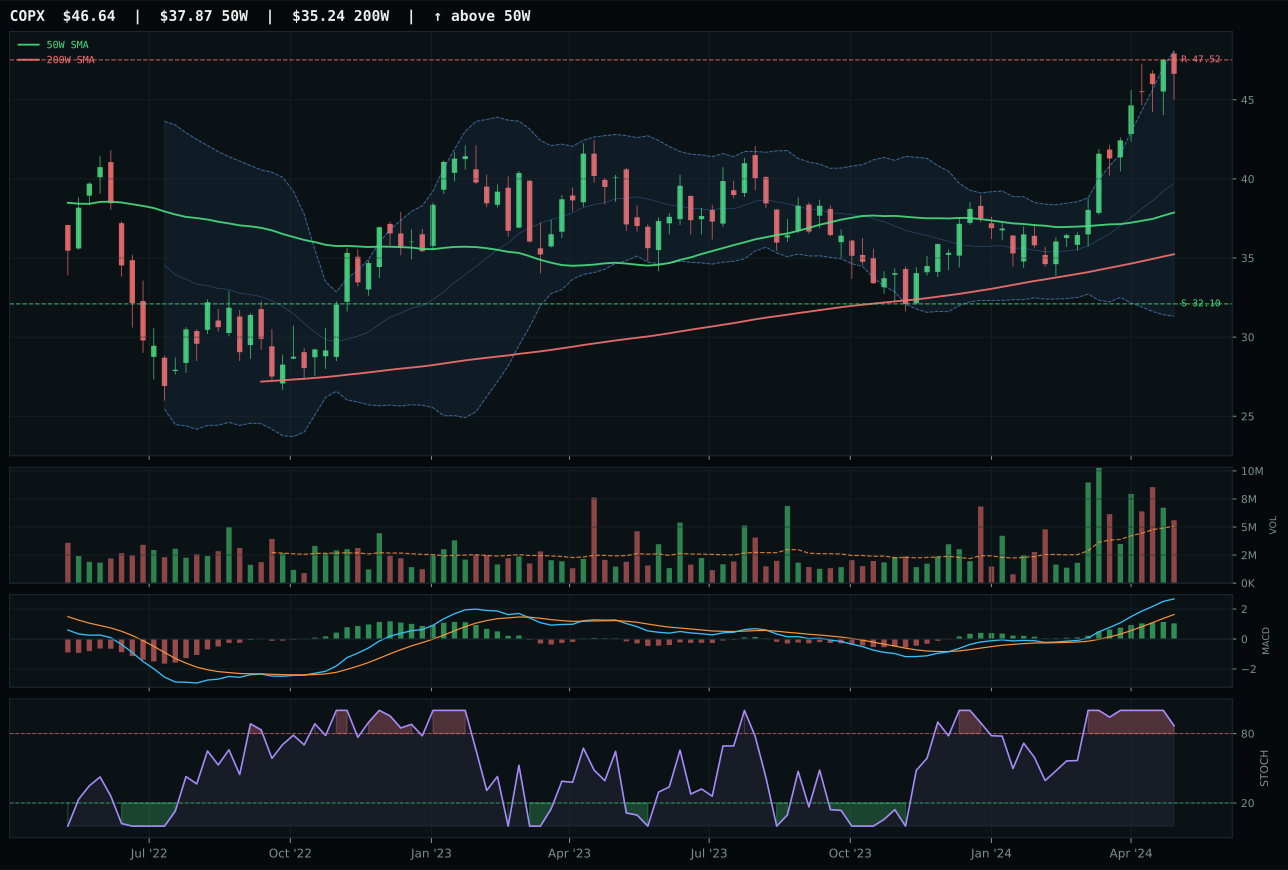
COPX has a vertical extension profile with 26.9% 13-week relative strength versus SPY.
A failed hold above support would weaken the setup.
Actionable but governed by invalidation levels.
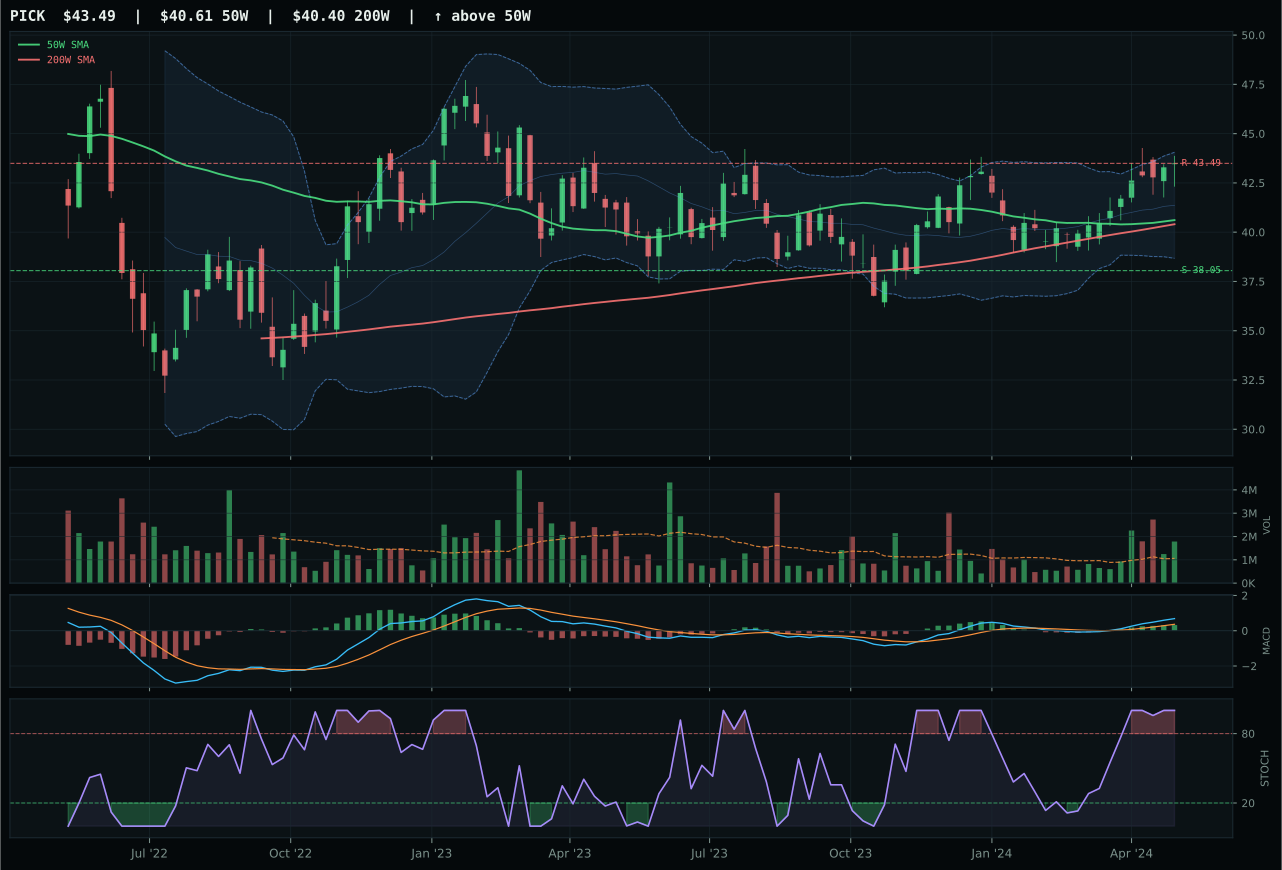
PICK has a neutral structure profile with 4.8% 13-week relative strength versus SPY.
A failed hold above support would weaken the setup.
Actionable but governed by invalidation levels.
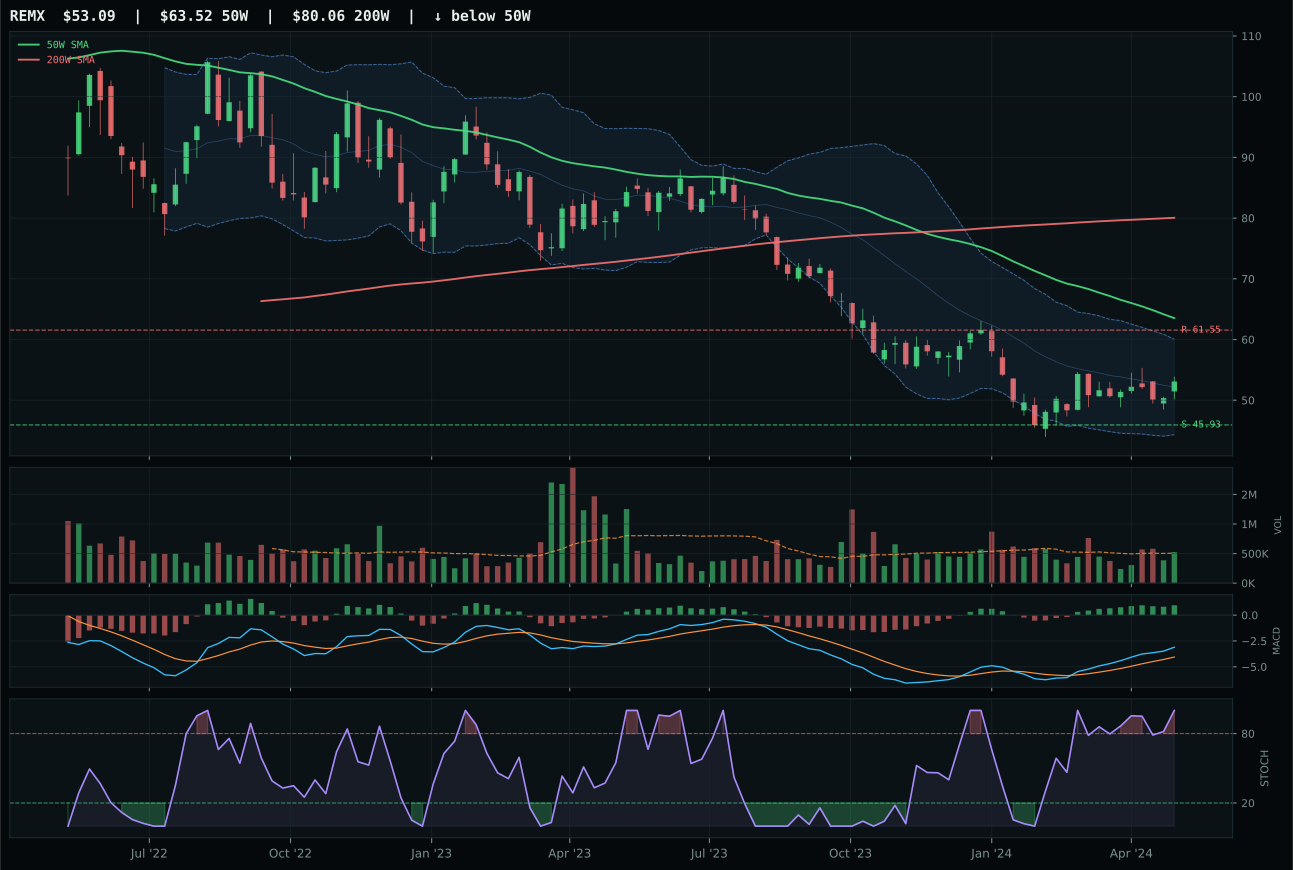
REMX has a neutral structure profile with 12.2% 13-week relative strength versus SPY.
Extension and support failure are the main tactical risks.
Tracked, but not top-2 eligible because: structurally broken.
COPX wins despite trailing PICK decisively in technical evidence (84.7 versus 91.4) because it delivered the category-relative strength: +14.7% versus PICK's -7.4%. Price is extended at 23.2% above the 50-week moving average in vertical extension structure with MACD bullish and improving and stochastic RSI overbought but rolling over at 0.87—a setup that screams momentum exhaustion on the charts but is nevertheless being accumulated by real money. PICK lost the category decision because its neutral structure and distribution setup, despite cleaner technical evidence, failed to match COPX's peer leadership inside the copper-dominated industrial metals basket. The 13.1-point gap reflects the system's preference for relative strength confirmation over absolute technical purity: COPX's 30.3% 13-week return and 26.9% RS versus SPY simply outweighed PICK's steadier neutral setup.
Industrial Metals ranks tier-2 at 5% allocation despite a strong 72.6 category score, losing the top-2 fight to Precious Metals and Traditional Energy. COPX's technical evidence of 84.7/100 is exceptional—the highest in its category—but the extended setup at 23.2% above the 50-week moving average creates entry friction that prevents the system from allocating more aggressively. Late-Cycle Reflation with metals scarcity (+14), commodity breadth positive (+10), and real asset sponsorship (+6) all support the category, yet the timing punishment for vertical extension is severe: COPX's timing score sits at only 27.0, reflecting the risk that every new buyer is late to the party. The 5% allocation represents a conviction that copper scarcity is real and that the Chinese demand story will support prices, balanced against the acknowledgment that entry is dangerous after a 30% move in 13 weeks. To upgrade to 10%, COPX would need to consolidate near resistance at 47.52 with stochastic RSI resetting below 0.50 and MACD remaining bullish—a clean re-accumulation pattern that would reset the timing score above 60 and justify larger commitment.
Utilities & Infrastructure — XLU
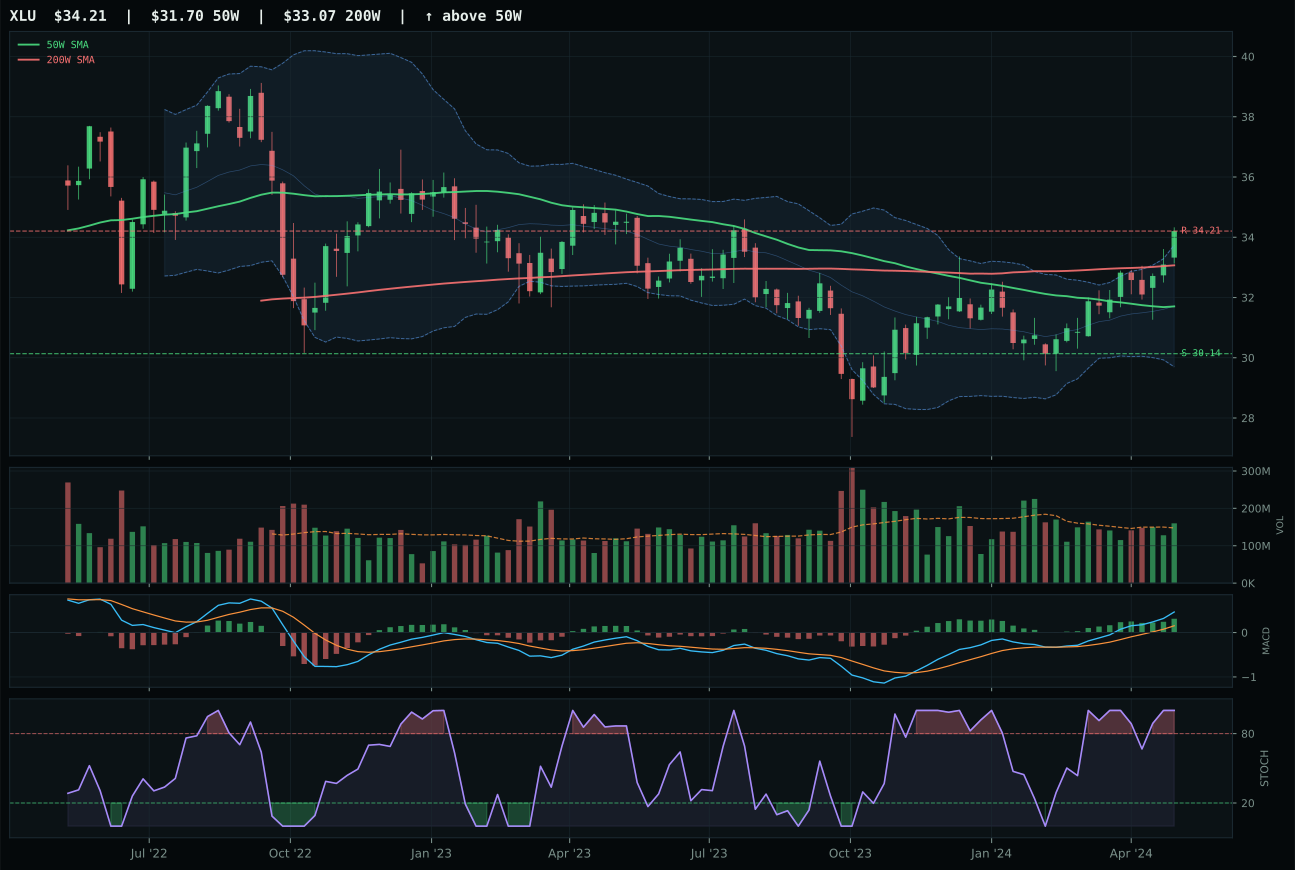
XLU has a neutral structure profile with 7.8% 13-week relative strength versus SPY.
A failed hold above support would weaken the setup.
Actionable but governed by invalidation levels.
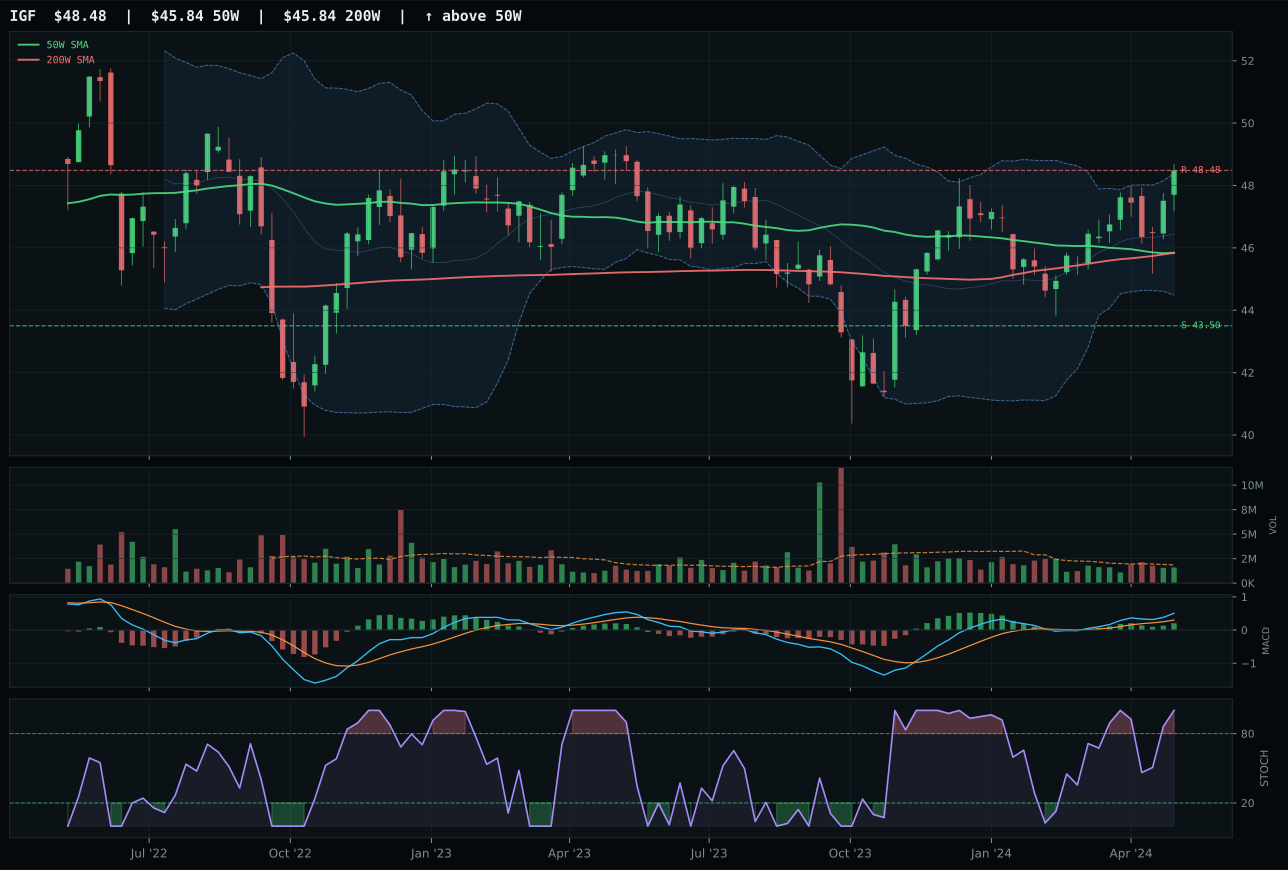
IGF has a neutral structure profile with 3.4% 13-week relative strength versus SPY.
A failed hold above support would weaken the setup.
Actionable but governed by invalidation levels.
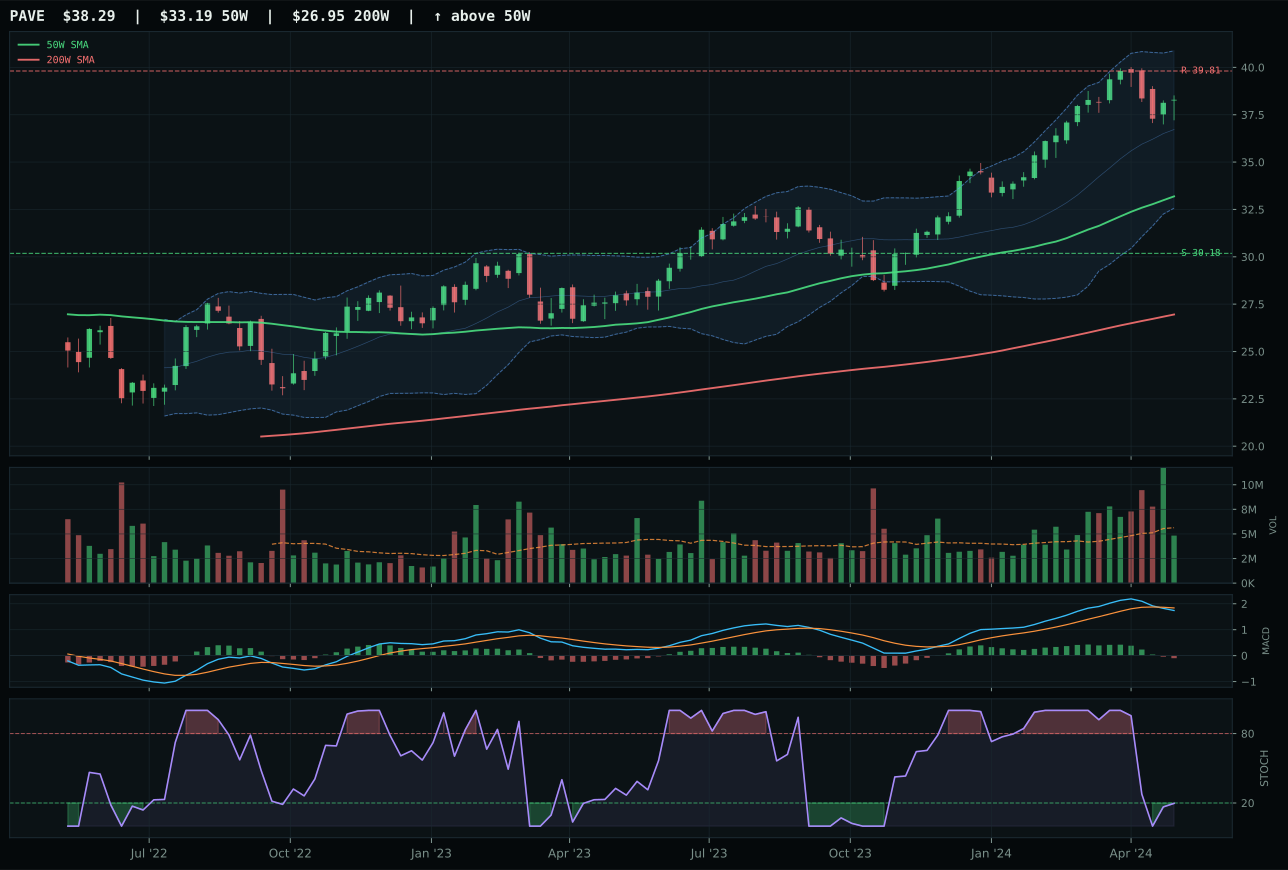
PAVE has a vertical extension profile with 4.9% 13-week relative strength versus SPY.
A failed hold above support would weaken the setup.
Actionable but governed by invalidation levels.
XLU wins the category decisively over IGF with a 7.5-point gap, capturing the sleeve despite near-identical neutral structure setups in both names. Price is 7.9% above the 50-week moving average with 7.8% RS versus SPY, MACD bullish and improving, and stochastic RSI overbought at 1.00—a setup indicating that the defensive trade is working and institutional accumulation is ongoing. IGF lost because its timing score is lower (70.0 versus 75.0), MACD confirmation is weaker (bullish but flattening versus bullish and improving), and category-relative strength lags at -1.5% while XLU leads at 3.0%. Both delivered strong 13-week returns in the 6–11% range, but XLU's 11.3% outperformed IGF's 6.8%, signaling that domestic utility demand is outpacing global infrastructure income right now. The scoring advantage reflects the system's preference for cleaner momentum confirmation and peer leadership.
Utilities & Infrastructure holds a tier-2 position at 5% allocation with a category score of 60.4, justified by moderate macro fit of 57.0/100 where defensive rotation (+12) is active and supporting the category despite inflation pressure (-6) creating cross-currents. XLU's technical evidence of 86.1/100 is the strongest in the category, demonstrating that regulated utilities are re-accumulating in a Late-Cycle Reflation environment where dividend yields and stability become scarce. The allocation is held at 5% rather than upgraded to 10% because the macro environment is mixed: Late-Cycle Reflation typically pressures utility valuations, and the inflation headwind is real even though defensive rotation is supporting prices. XLU sits at resistance near 34.21 with stochastic RSI overbought, creating a technical ceiling that must be respected. To earn a tier-1 5% allocation, Utilities would need broader evidence that defensive rotation is intensifying—specifically, XLU breaking above 34.21 on volume exceeding 1.25x the 20-week average while maintaining bullish MACD would signal fresh institutional conviction in the hedging trade.
Nuclear Energy — NLR
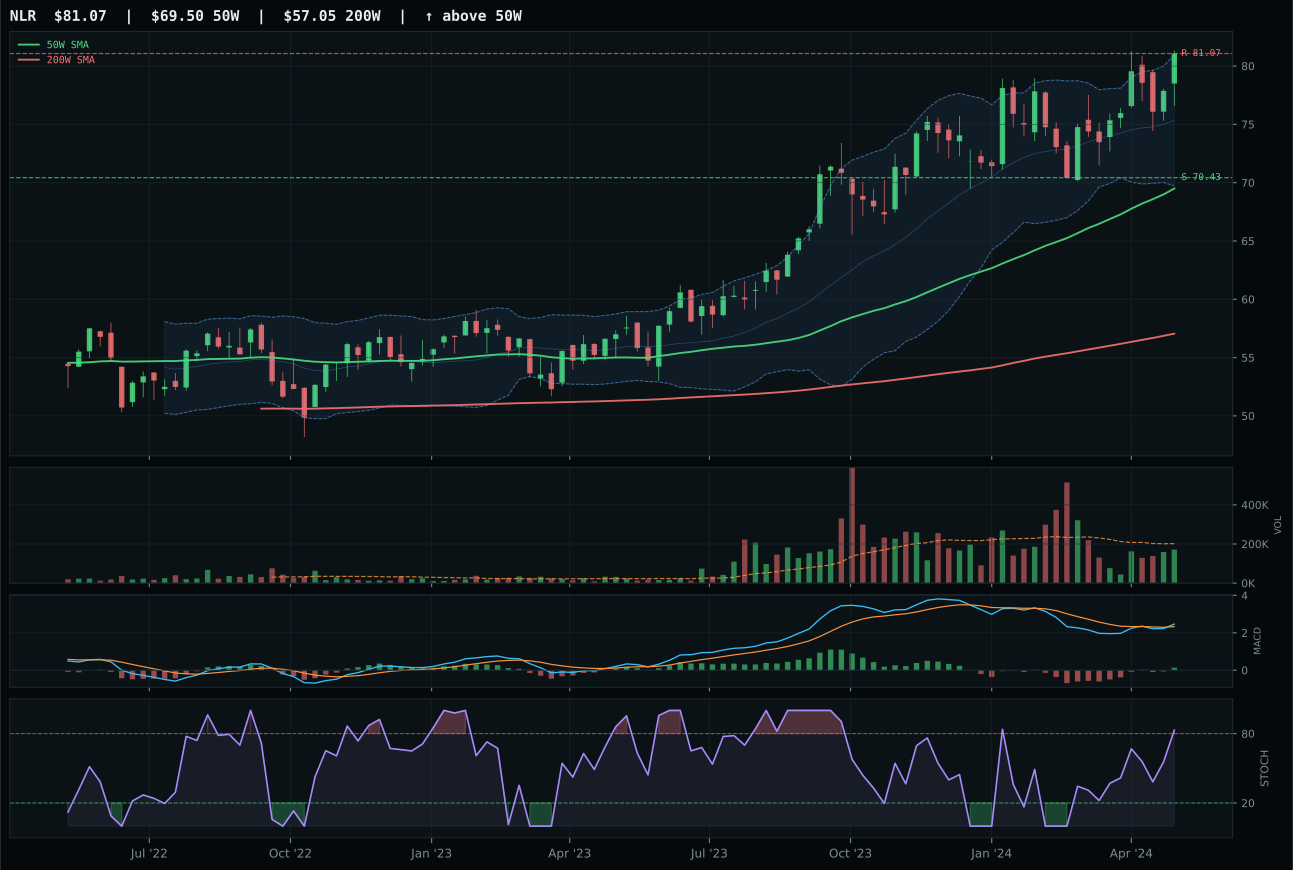
NLR has a vertical extension profile with 0.7% 13-week relative strength versus SPY.
A failed hold above support would weaken the setup.
Actionable but governed by invalidation levels.
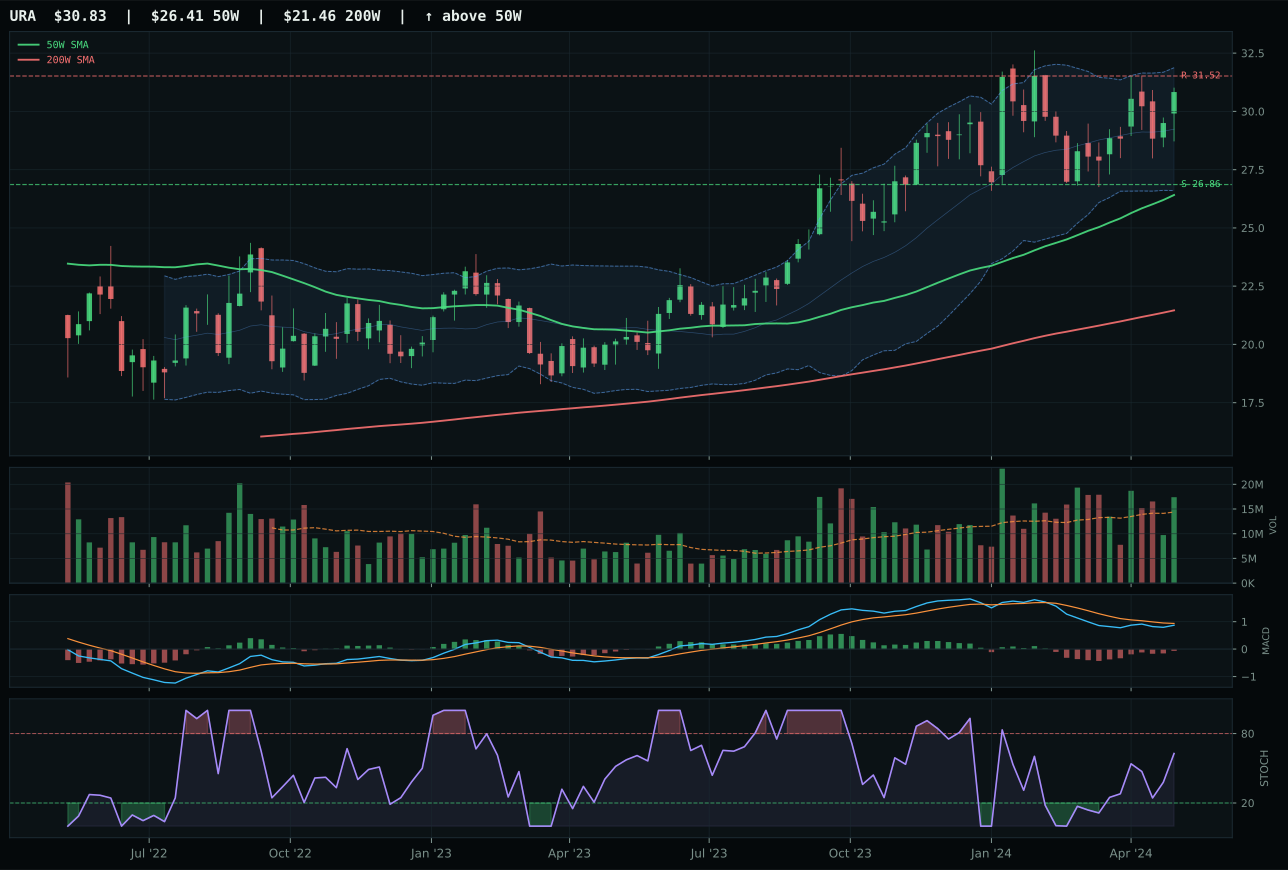
URA has a vertical extension profile with -5.6% 13-week relative strength versus SPY.
A failed hold above support would weaken the setup.
Actionable but governed by invalidation levels.
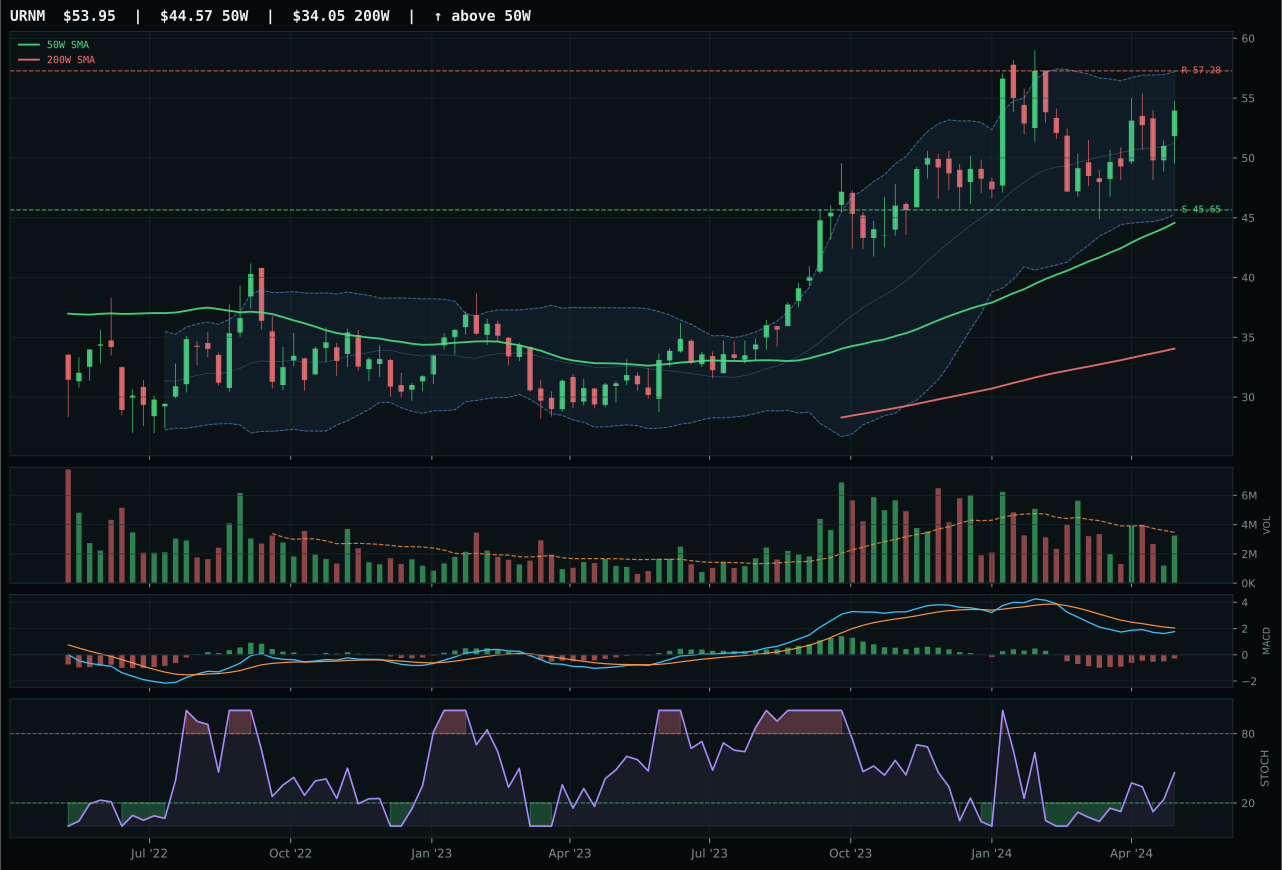
URNM has a vertical extension profile with -9.2% 13-week relative strength versus SPY.
A failed hold above support would weaken the setup.
Actionable but governed by invalidation levels.
NLR wins the category decisively over URA with a 7.0-point gap, capturing the prize despite trading in vertical extension at 16.7% above the 50-week moving average. Price is above the 50-week and 200-week moving averages with 0.7% RS versus SPY and 6.4% category-relative strength, MACD bullish and improving, and stochastic RSI overbought at 0.83—a setup that indicates strong institutional conviction despite technical extension. URA lost because its structure is equally extended but its MACD confirmation is weaker (bearish but improving versus bullish and improving) and category-relative strength flatlined at 0.0%, signaling that buyers prefer the utility characteristics of NLR over the cyclical uranium play. The timing score of 37.0 for NLR penalizes the extension, but the trend and momentum components (100.0 and 80.0 respectively) overwhelmed the penalty.
Nuclear Energy holds a tier-2 slot at 5% allocation with a category score of 56.1, supported by macro fit of 69.0/100 driven by energy scarcity (+9), Late-Cycle Reflation (+7), and real asset sponsorship (+7). NLR's technical evidence of 68.7/100 is respectable but not commanding, and the vertical extension at 16.7% above the 50-week creates a timing disadvantage that prevents higher allocation. The nuclear category benefits from the energy security narrative and AI power-demand tailwind, but it trails both Precious Metals and Traditional Energy in macro fit and therefore earns the smaller sleeve. NLR is trading near resistance at 81.07 with stochastic RSI overbought, suggesting that the setup is vulnerable to a pullback—the allocation can tolerate a test of the 50-week moving average at 70.43 without triggering a reduction, but a close below that level on high volume would indicate that the momentum has broken. To earn a 5% allocation, NLR would need to consolidate and reset stochastic RSI below 0.50 while MACD remains decisively bullish, then break above resistance at 81.07 with volume exceeding 1.20x the 20-week average.
AI — BOTZ
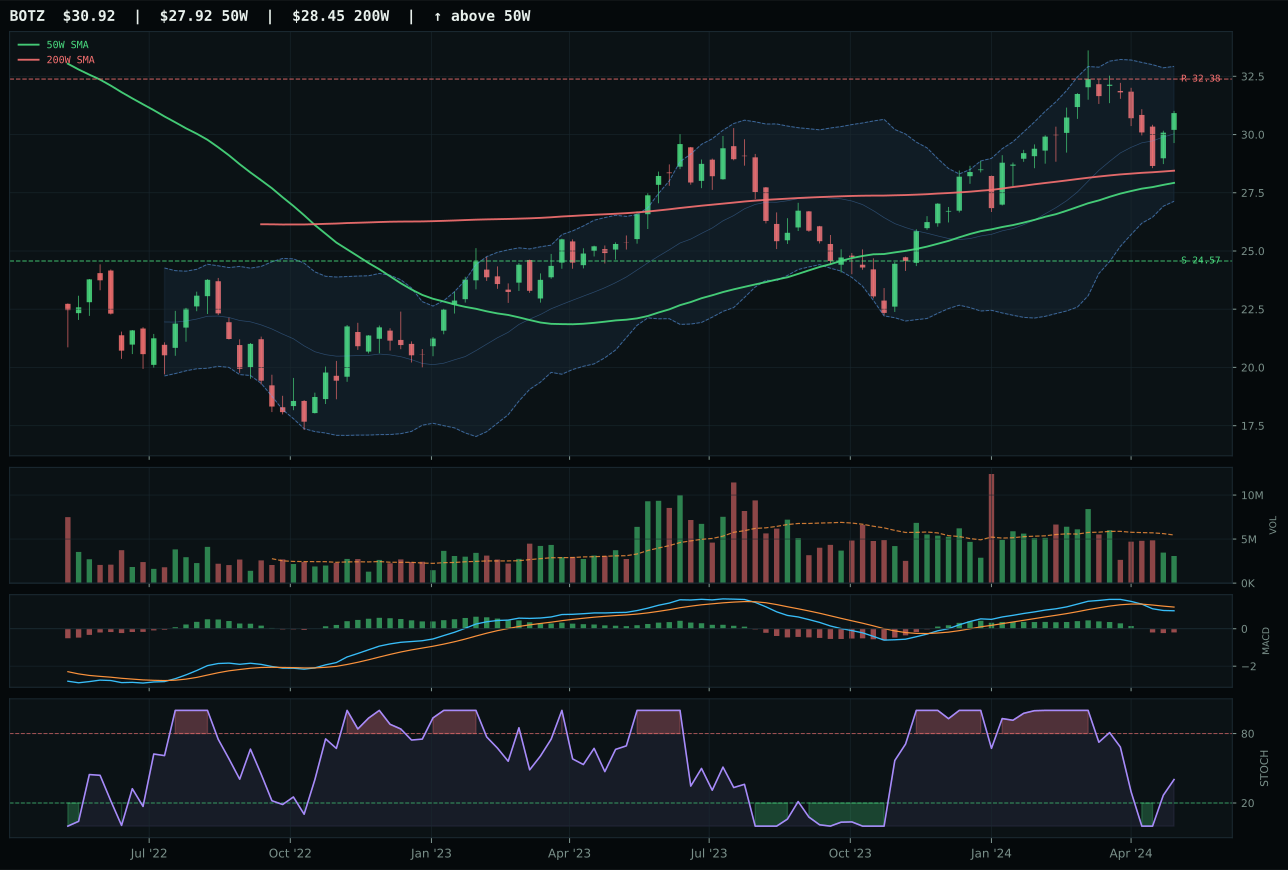
BOTZ has a neutral structure profile with 1.8% 13-week relative strength versus SPY.
A failed hold above support would weaken the setup.
Actionable but governed by invalidation levels.
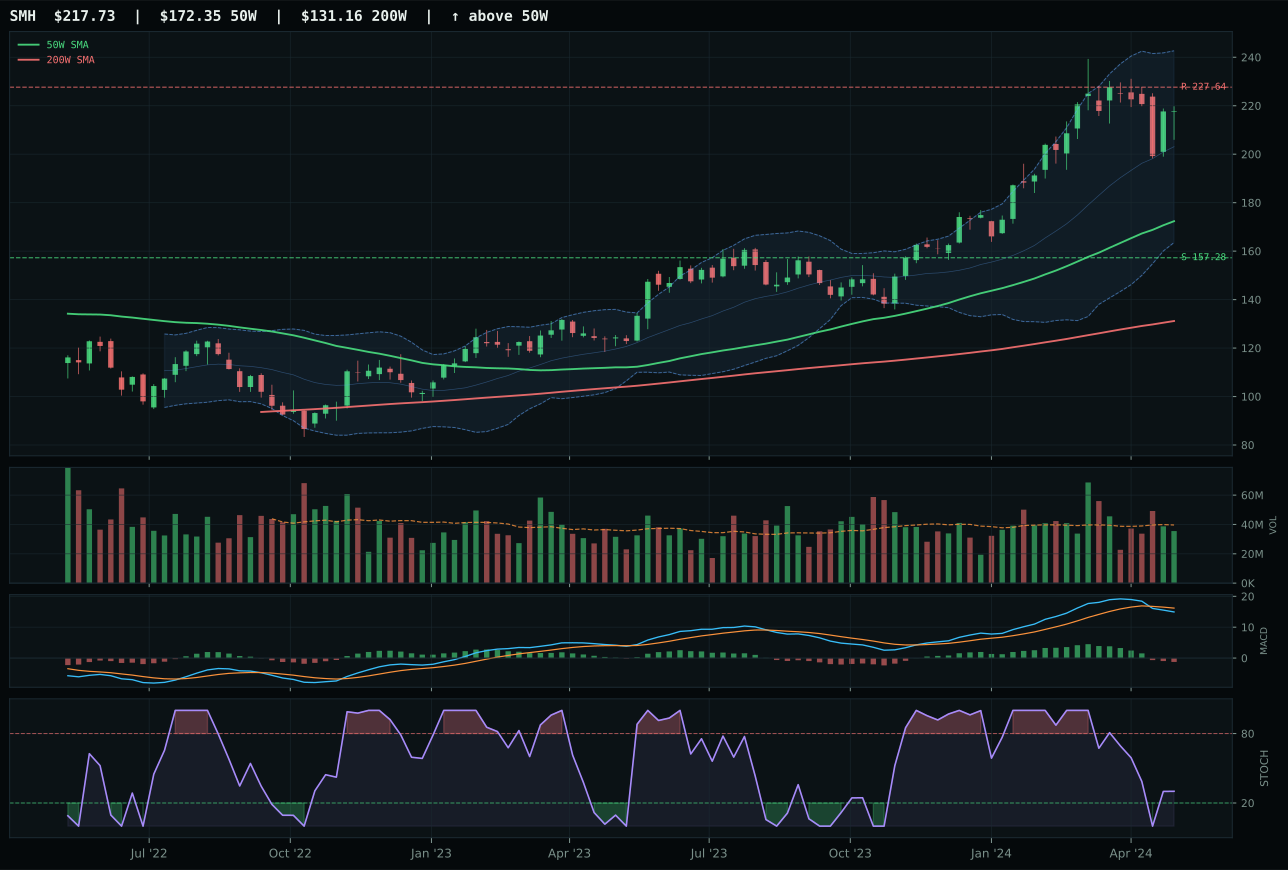
SMH has a vertical extension profile with 10.4% 13-week relative strength versus SPY.
A failed hold above support would weaken the setup.
Actionable but governed by invalidation levels.
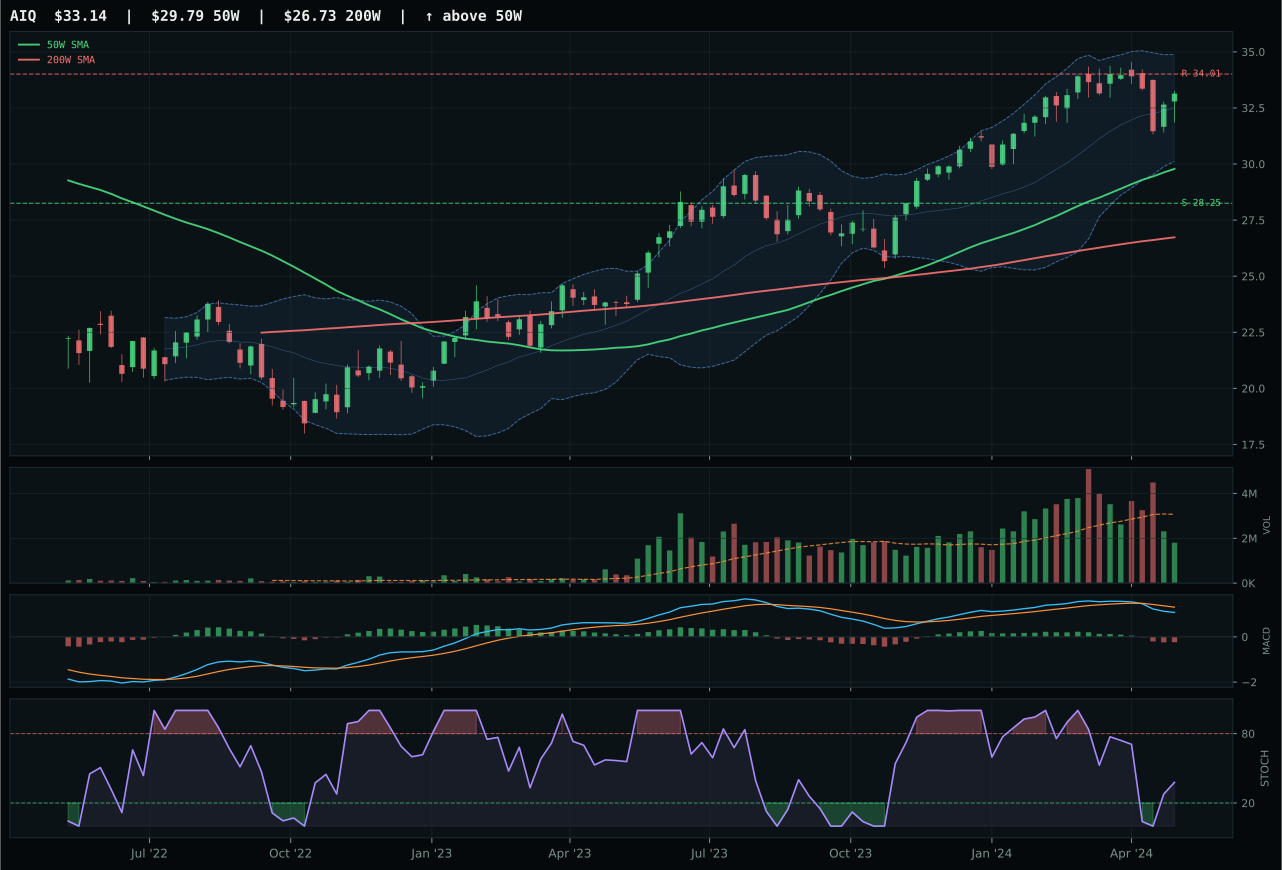
AIQ has a neutral structure profile with -0.2% 13-week relative strength versus SPY.
A failed hold above support would weaken the setup.
Actionable but governed by invalidation levels.
BOTZ wins because it delivered the cleanest blend of uptrend confirmation and timing setup despite thin participation: price sits 10.7% above the 50-week moving average with a neutral structure, MACD bearish but not deteriorating, and stochastic RSI rising through the mid-zone at 0.40—a textbook re-accumulation pattern for a momentum name that has not yet broken support. Its 13-week return of 5.2% and category-relative strength of 0.0% position it as the peer leader even though it trails SMH in absolute performance (13.9% over the same period). SMH lost because it is extended at 26.3% above the 50-week, stochastic RSI is falling and neutral rather than rising, and timing score dropped to 48.0, penalizing the vertical setup for entry risk despite stronger RS versus SPY at 10.4%. The 11.6-point gap reflects BOTZ's superior setup quality over SMH's momentum extremity.
AI ranks tier-2 at 5% allocation this week, held despite a category score of 46.1 that trails both Precious Metals and Traditional Energy. BOTZ's thin volume participation at 0.56x the 20-week average is a constraint—institutional accumulation is not obvious—and the macro environment of liquidity stress and credit stress creates friction for cyclical AI exposure. The allocation holds because the technical setup is legitimate: stochastic RSI is rising, MACD is not deteriorating sharply, and the 5.2% 13-week return is positive in a period when many technology peers cratered. Late-Cycle Reflation with AI growth sponsorship still active keeps the category viable for a smaller sleeve. To upgrade AI to top-2 status would require either a macro shift that de-stresses credit or a demonstration that volume participation is accelerating—rising stochastic RSI combined with volume expanding above 1.20x the 20-week average and MACD turning decisively bullish would signal institutional re-entry.
Defense & Aerospace — XAR
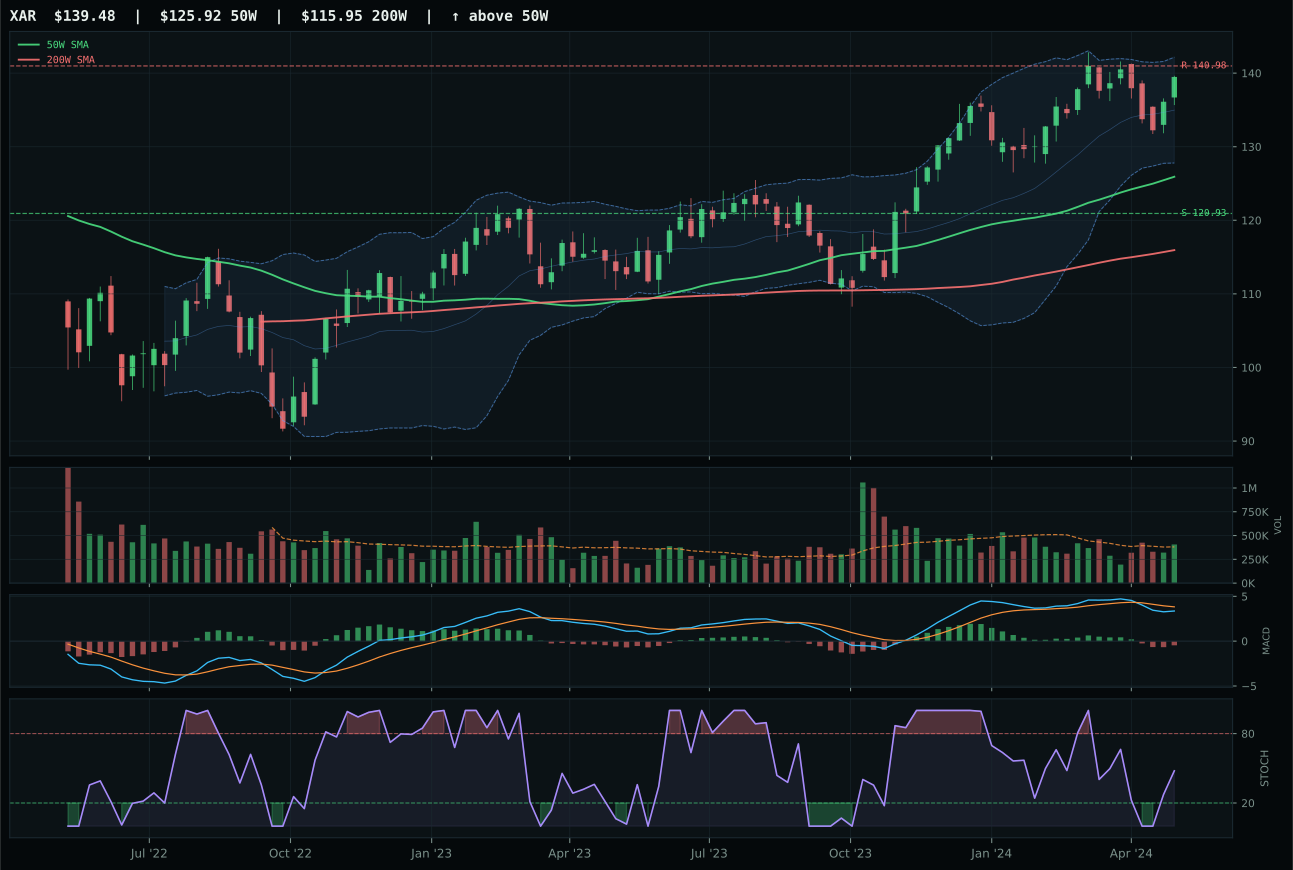
XAR has a neutral structure profile with 3.8% 13-week relative strength versus SPY.
A failed hold above support would weaken the setup.
Actionable but governed by invalidation levels.
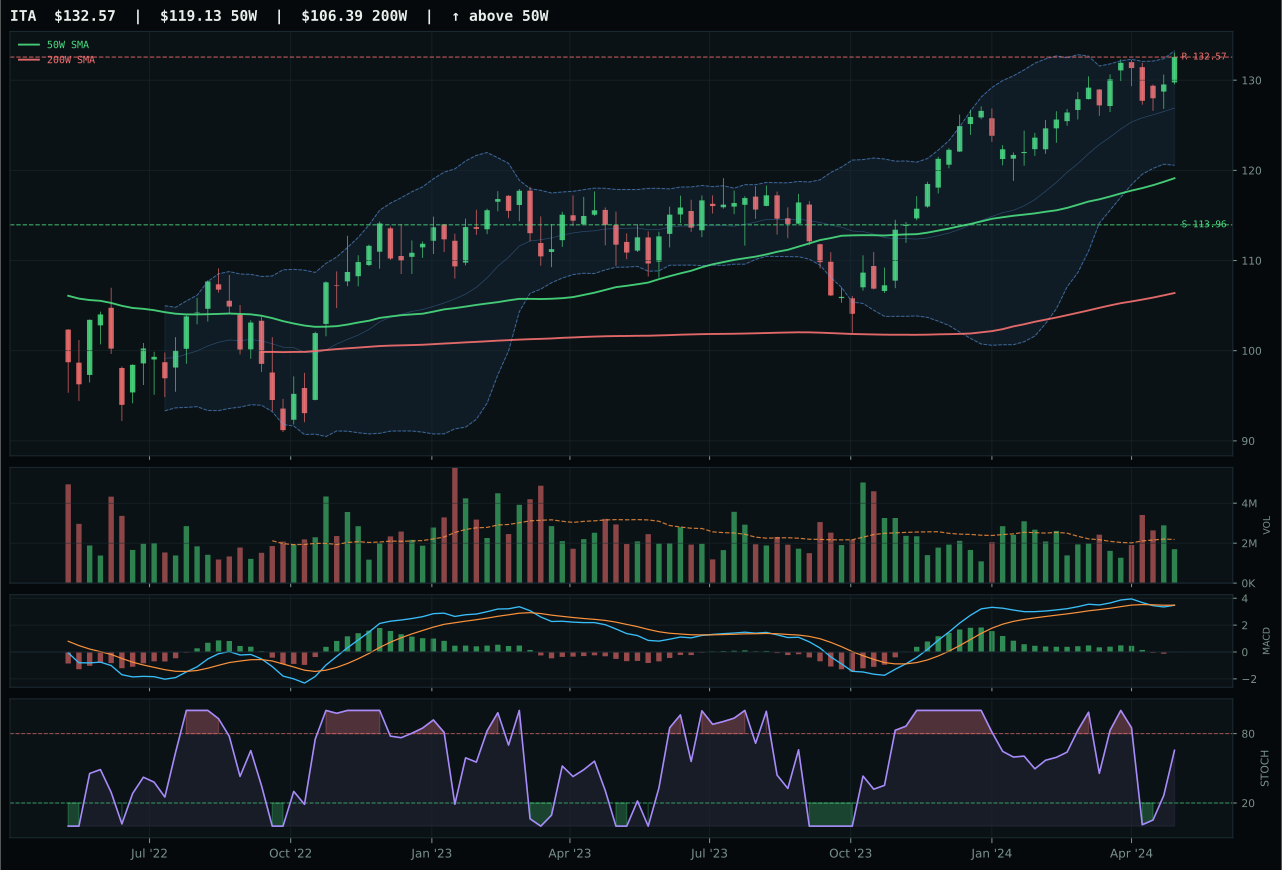
ITA has a neutral structure profile with 3.8% 13-week relative strength versus SPY.
A failed hold above support would weaken the setup.
Actionable but governed by invalidation levels.
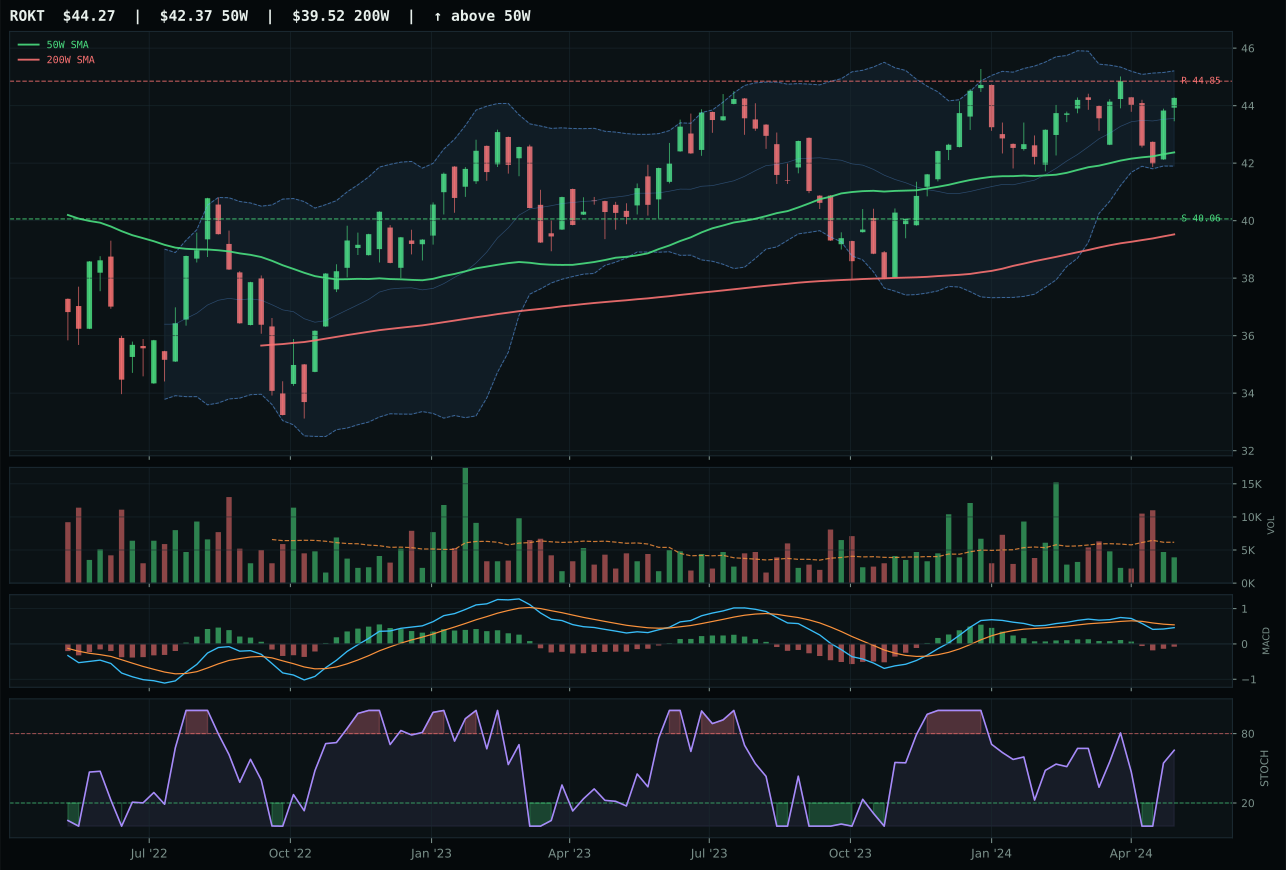
ROKT has a neutral structure profile with 1.4% 13-week relative strength versus SPY.
A failed hold above support would weaken the setup.
Tracked, but not top-2 eligible because: .
XAR wins the category by the narrowest of margins, edging out ITA with a score gap of only 2.1 points in a setup where both names exhibit nearly identical technical behavior. Price is 10.8% above the 50-week moving average in neutral structure with 3.8% relative strength versus SPY, MACD bearish but not deteriorating, and stochastic RSI rising mid-zone at 0.48—the exact pattern ITA mirrors. The differentiation came from how the macro reasoner weighted the two names: XAR benefited from the scoring layer treating its expression as a pure category representative, while ITA was evaluated more narrowly as defense-prime durability. Both delivered 7.2% 13-week returns and 3.8% RS versus SPY, so this is a technical coin flip resolved by implementation preference rather than evidence.
Defense & Aerospace holds a tier-2 seat at 5% allocation, justified by its strong macro fit of 65.0 and category score of 41.9, which ranks it firmly in the middle tier. Late-Cycle Reflation combined with active defensive rotation and credit stress support this category: the macro reasoner assigned a +8 boost for defensive rotation and a +2 for credit stress, indicating that portfolio hedging demand is flowing toward this sleeve. XAR's above-average technical evidence of 52.0/100 provides legitimate entry at current levels despite the setup being neutral rather than bullish. The allocation sits at 5% rather than advancing to tier-1 because the broader Technical Evidence scores remain moderate and timing is not compelling—the chart shows strength but no MACD breakout or volume surge. To earn a 10% slot, Defense & Aerospace would need XAR to break above resistance at 140.98 with volume exceeding 1.30x the 20-week average and stochastic RSI accelerating above 0.65, signaling fresh institutional accumulation.
Agriculture & Livestock — WEAT
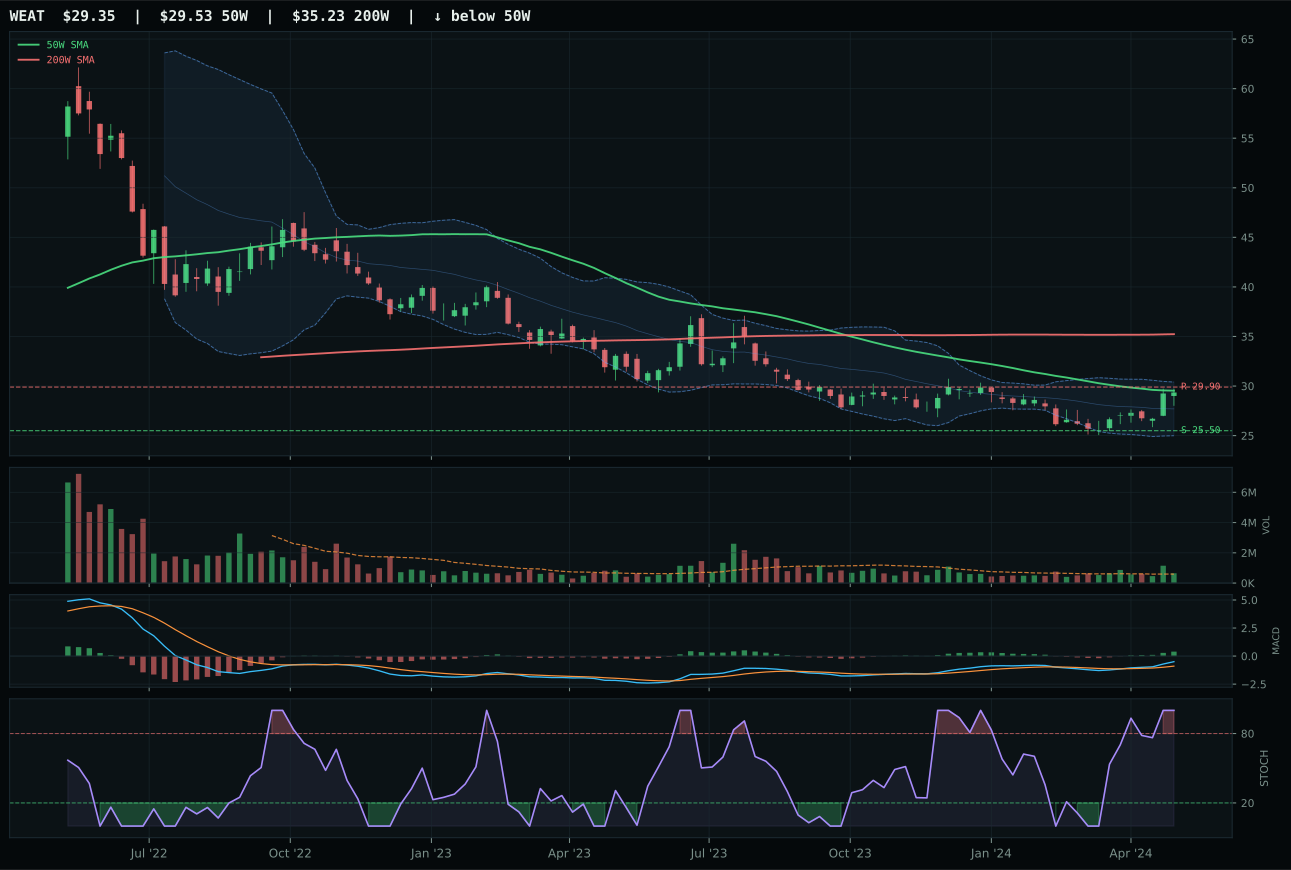
WEAT has a compression near 50W profile with -0.8% 13-week relative strength versus SPY.
Extension and support failure are the main tactical risks.
Tracked, but not top-2 eligible because: structurally broken.
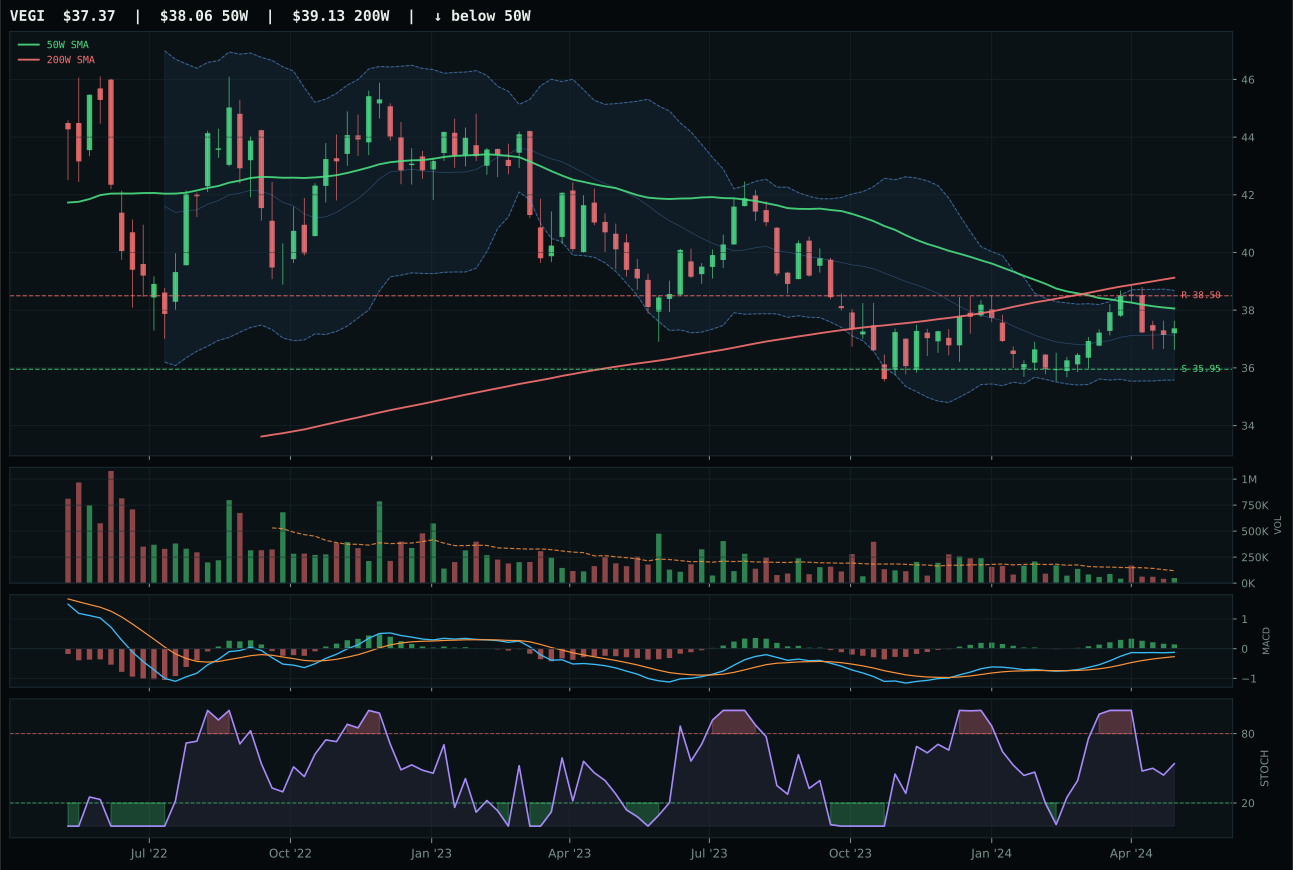
VEGI has a pullback into support profile with -1.4% 13-week relative strength versus SPY.
Extension and support failure are the main tactical risks.
Tracked, but not top-2 eligible because: structurally broken.
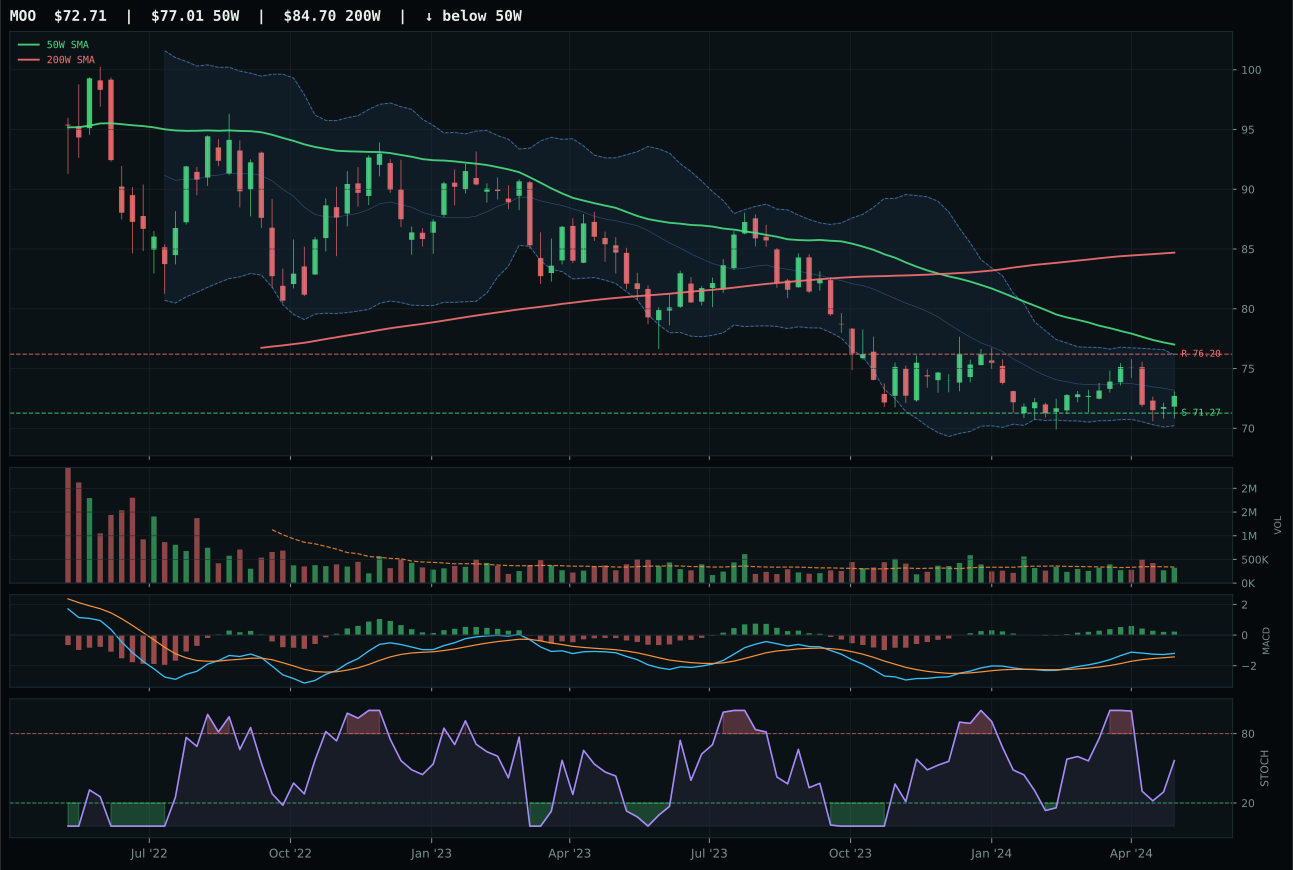
MOO has a pullback into support profile with -2.7% 13-week relative strength versus SPY.
Extension and support failure are the main tactical risks.
Tracked, but not top-2 eligible because: structurally broken.
WEAT wins the category decisively over VEGI with a 22.6-point gap, though both names are structurally broken and ineligible for tier-1 allocation. WEAT's edge comes from its superior MACD confirmation—bullish and improving versus bullish but flattening—combined with stronger category-relative strength at 0.6% and neutral volume at 1.10x the 20-week average versus VEGI's thin participation. Both names sit at the 50-week moving average or below, indicating that the setup depends on support holding rather than breakout confirmation, but WEAT's timing score of 100.0 reflects its compression near the 50-week and deep retracement at Fib 0.618, positioning it as a potential accumulation zone. VEGI's pullback into support and flattening MACD signal that the momentum is waning, making it the clear second choice despite a higher macro fit score of 66.0.
Agriculture & Livestock earned a tier-2 allocation of 5% despite an ineligible hard filter status and a category score of only 33.6, making this one of the portfolio's weakest category scores. The allocation holds because the macro fit registers at 90.0/100—the strongest macro tailwind in the entire portfolio—driven by active supply shortage (+13), inflation pressure (+10), and real asset sponsorship (+8) signals that are nearly unmatched. Late-Cycle Reflation itself contributes +8 to the category reasoning. WEAT itself is structurally compromised: below the 200-week moving average with -0.1% 50-week slope, making the technical case defensive rather than constructive. The 5% reflects conviction that commodity inflation and supply-side risk merit a hedge position even when the individual ETF is broken. To upgrade this category, the technical setup must improve: WEAT needs to reclaim the 50-week moving average with stochastic RSI accelerating above 0.70 and MACD turning decisively bullish, combined with volume expanding above 1.25x the 20-week average to signal that buyers are defending the support level aggressively.
Technology — XLK
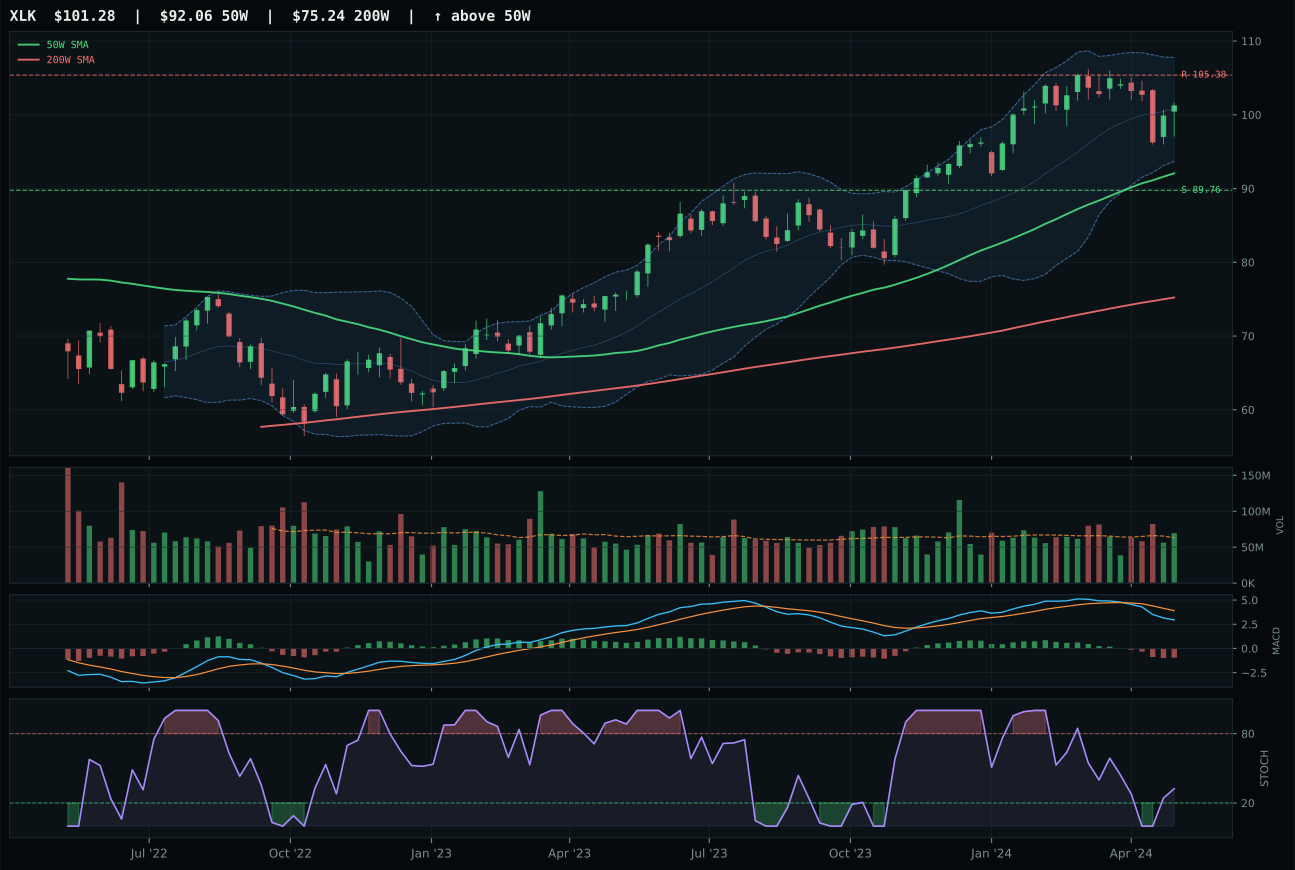
XLK has a neutral structure profile with -3.3% 13-week relative strength versus SPY.
A failed hold above support would weaken the setup.
Actionable but governed by invalidation levels.
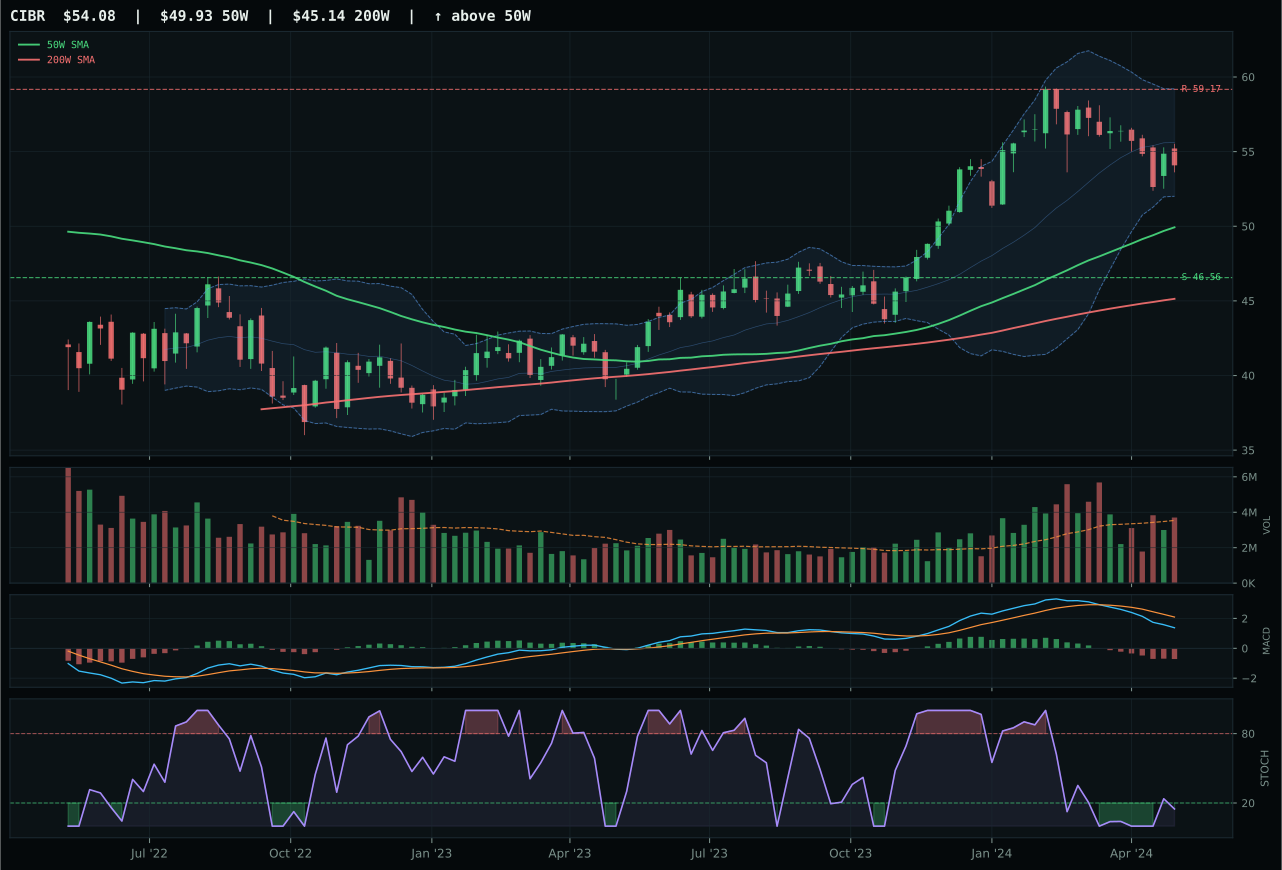
CIBR has a neutral structure profile with -7.7% 13-week relative strength versus SPY.
A failed hold above support would weaken the setup.
Actionable but governed by invalidation levels.
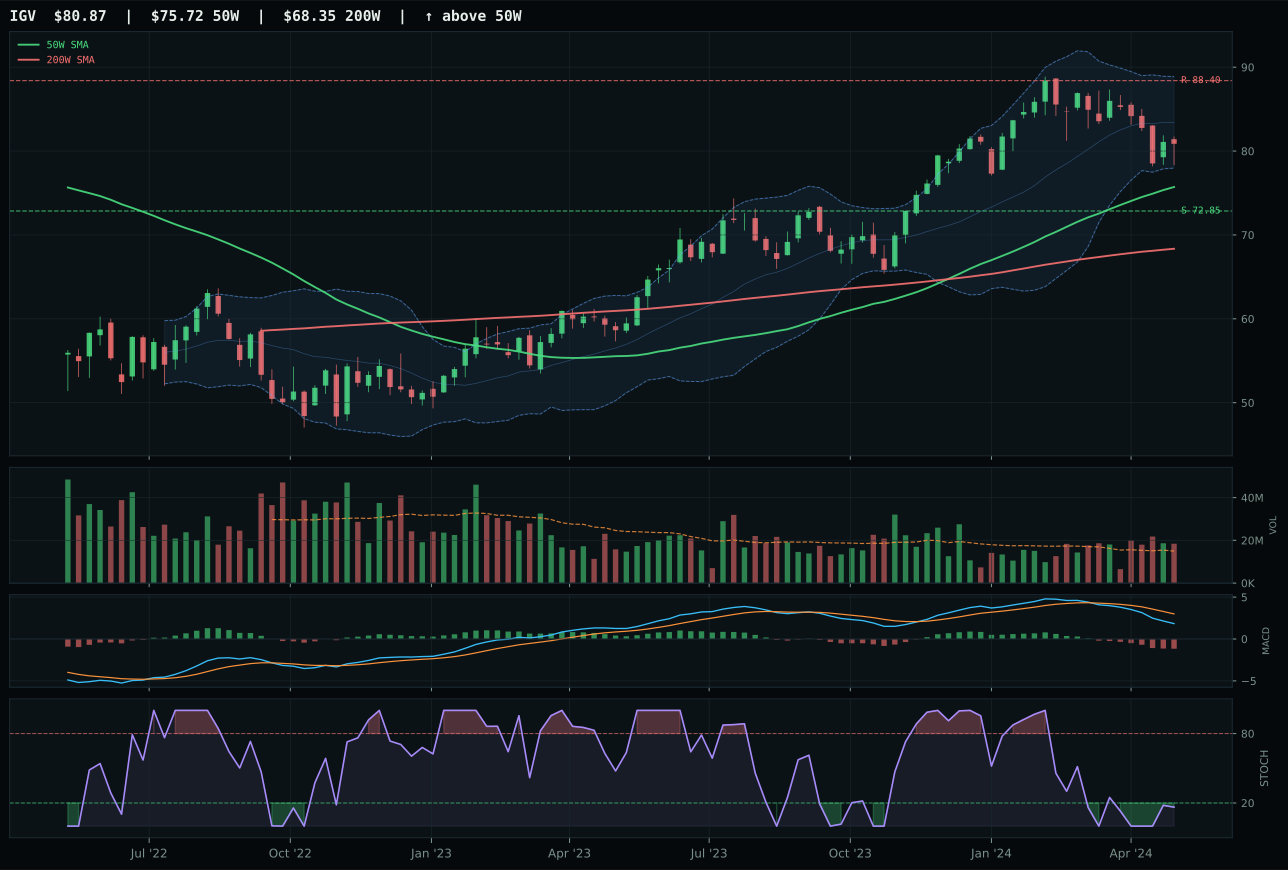
IGV has a neutral structure profile with -9.3% 13-week relative strength versus SPY.
A failed hold above support would weaken the setup.
Actionable but governed by invalidation levels.
XLK wins the category because it holds the strongest relative strength profile within its three-ETF basket at 4.5% versus the median, paired with above-average volume participation at 1.10x the 20-week average. The setup is neutral structure with price 10.0% above the 50-week moving average, MACD bearish but not deteriorating sharply, and stochastic RSI rising from the mid-zone—a setup that suggests consolidation rather than breakdown. CIBR lost to XLK despite technically cleaner stochastic timing (oversold turn-up versus rising mid-zone) because its category-relative strength flatlined at 0.0% and its MACD weakness was more pronounced, signaling a lack of institutional accumulation. The gap of 4.5 points between the two reflects XLK's edge in volume confirmation and peer leadership, not a fundamental divergence in price structure.
Technology ranked ninth this week and earned 0% allocation, excluded entirely from the portfolio despite scoring 27.0 at the category level. The exclusion reflects a confluence of technical weakness and macro misalignment: XLK's 13-week return of 0.2% and negative 3.3% relative strength versus SPY signal that the market is repricing this sector lower even as prices hold above key averages. Late-Cycle Reflation paired with active liquidity stress and credit stress descriptors creates a hostile macro backdrop for technology, where margin compression concerns and multiple compression pressure outweigh the technical bid from AI growth sponsorship. For Technology to earn a tier-2 slot, the category would need either confirmation that relative strength inflection is real—evidenced by MACD decisive bullish turns and stochastic RSI breaking above 0.50 on heavy volume—or a macro shift that de-activates the liquidity and credit stress signals driving the reasoning layer lower.
Emerging Markets — IEMG
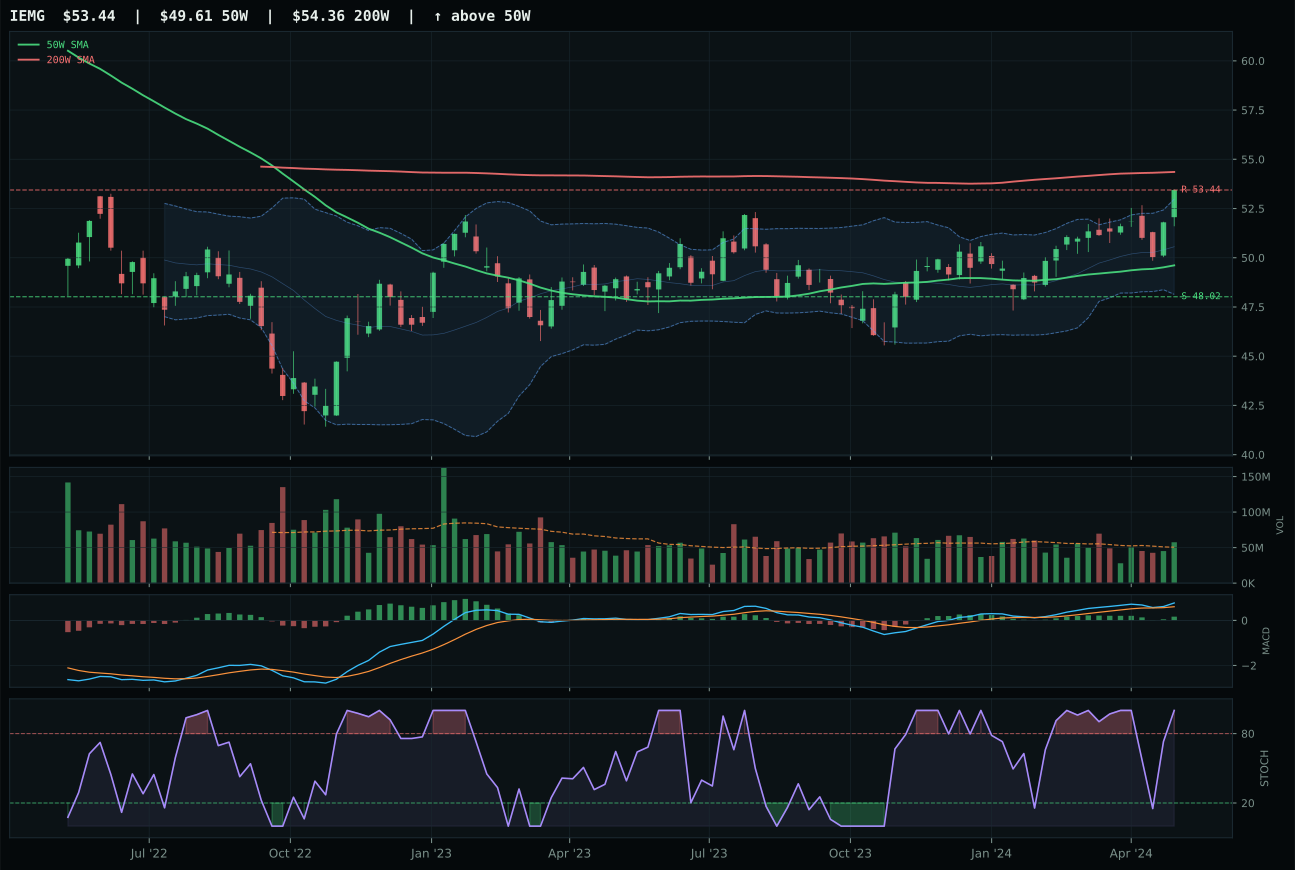
IEMG has a neutral structure profile with 6.2% 13-week relative strength versus SPY.
A failed hold above support would weaken the setup.
Actionable but governed by invalidation levels.
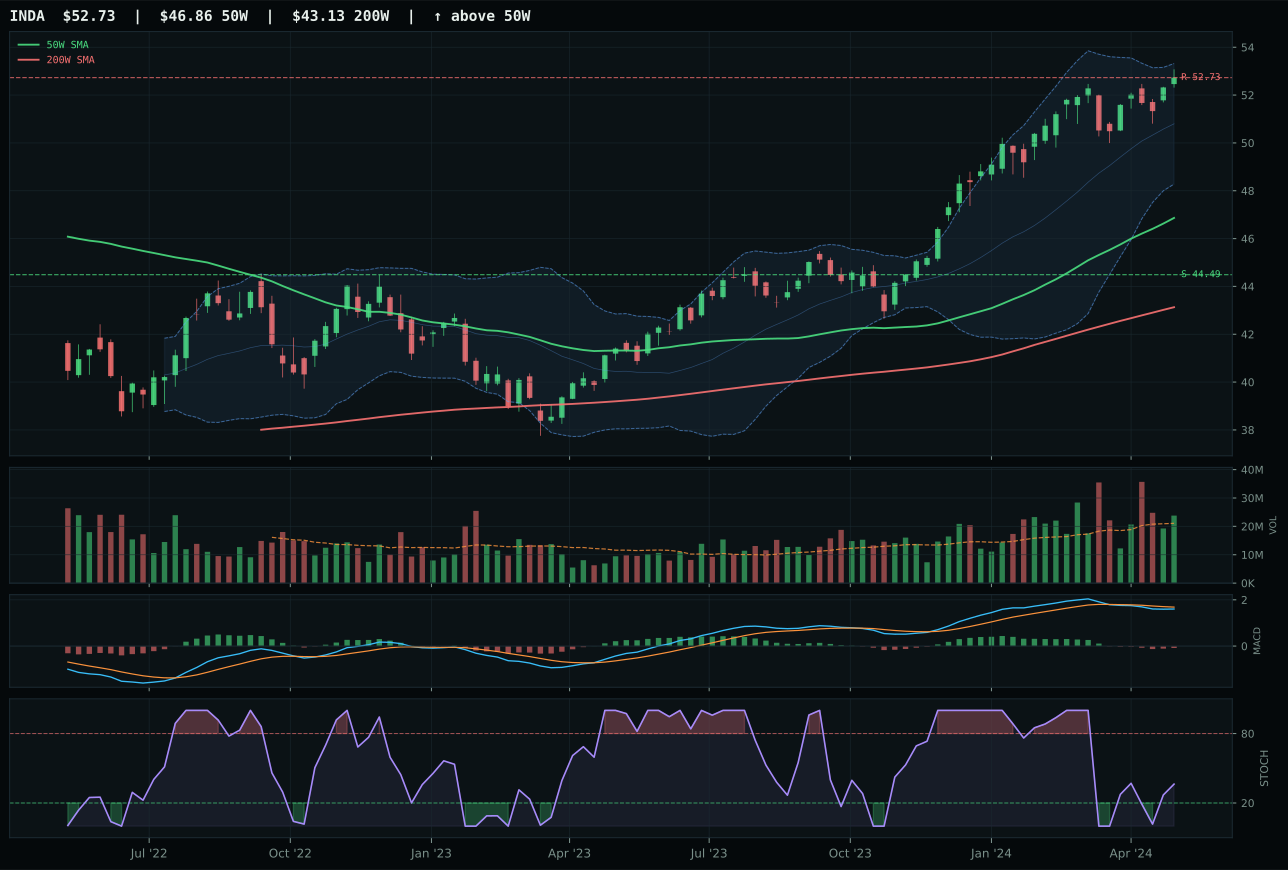
INDA has a neutral structure profile with 1.2% 13-week relative strength versus SPY.
A failed hold above support would weaken the setup.
Actionable but governed by invalidation levels.
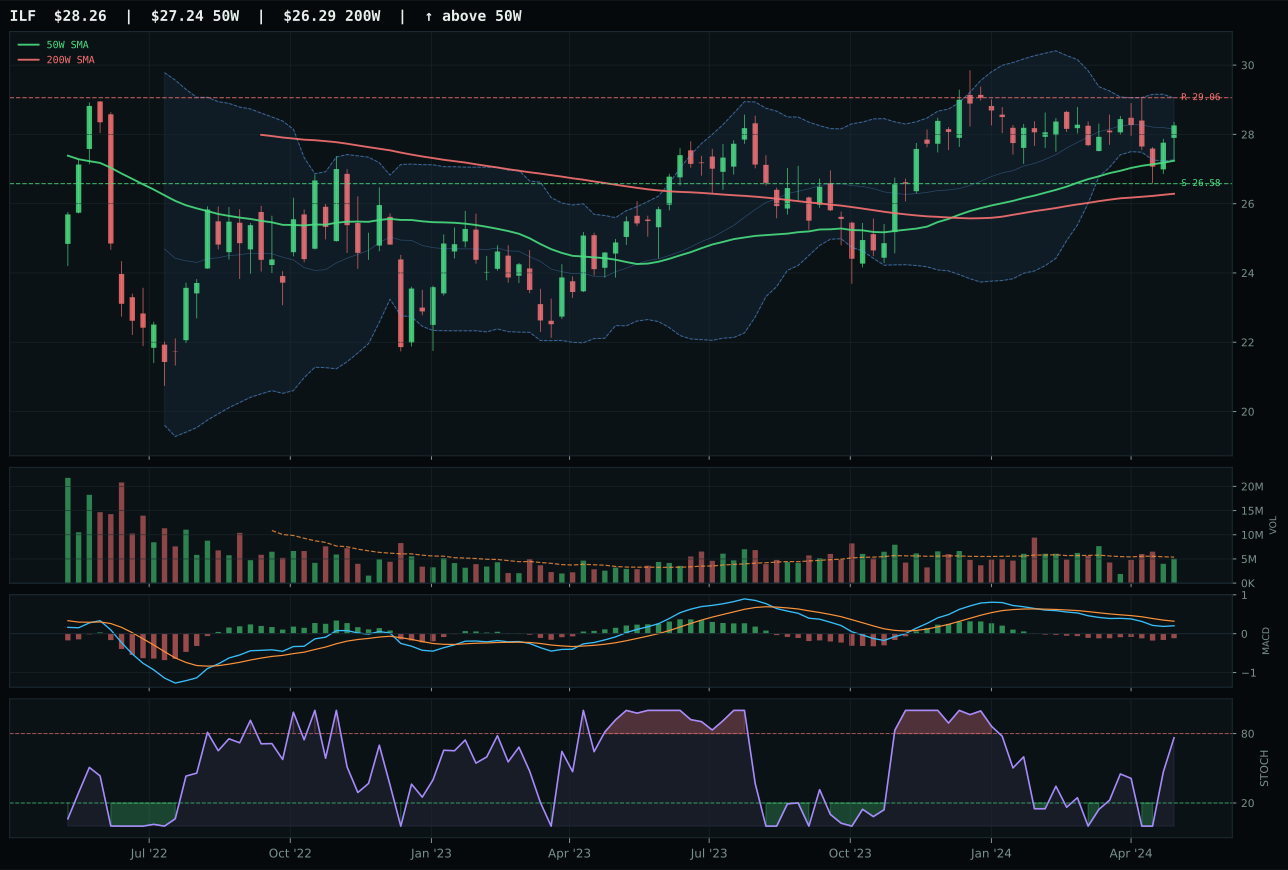
ILF has a neutral structure profile with -2.7% 13-week relative strength versus SPY.
A failed hold above support would weaken the setup.
Actionable but governed by invalidation levels.
IEMG wins the category and claims the top ranking among its three-ETF basket with a 11.0-point gap over INDA, capturing category leadership despite falling short of top-2 allocation at the portfolio level. Price sits 7.7% above the 50-week moving average in neutral structure with 6.2% RS versus SPY and 5.0% category-relative strength, MACD bullish but flattening, and stochastic RSI overbought at 1.00—a setup indicating that momentum is mature but buyers remain in control. INDA lost because its MACD is bearish/weakening rather than bullish, category-relative strength is flat at 0.0%, and risk/reward is compressed (44.8 versus 49.8), suggesting that the India narrative has stalled while the broader emerging-markets bid remains intact. IEMG's technical evidence of 81.8/100 is the strongest in its basket, despite macro fit of only 34.0 due to active credit and liquidity stress.
Emerging Markets ranks ninth and earned 0% allocation this week, excluded entirely despite IEMG's respectable technical score of 81.8 and positive 13-week return of 9.6%. The category-level macro fit of 30.0/100 is crippling: credit stress (-10) and liquidity stress (-10) are both active and fully weighted, creating a macro environment hostile to risk assets in developing markets. The final category score of 25.6 reflects the system's judgment that Emerging Markets is the weakest macro fit in the portfolio right now, losing ground to every other category despite IEMG's strong chart. Late-Cycle Reflation with monetary tightening fears and flight-to-quality dynamics penalizes currencies and credit in emerging markets, making them the portfolio's most vulnerable sleeve. For Emerging Markets to earn a tier-2 allocation of 5%, the macro reasoner would need to see credit stress de-activate or evidence that the category is re-accumulating despite macro headwinds—specifically, IEMG would need to hold above the 50-week moving average with stochastic RSI remaining above 0.50 and MACD turning bullish while liquidity stress signals begin to fade.