
2024-04-26
Informational purposes only. The content in this report, including allocations, analysis, and commentary, is provided solely for informational and educational purposes. It does not constitute financial advice, investment advice, trading advice, or any other type of advice. Past performance does not guarantee future results. Always conduct your own research and consult a qualified financial professional before making investment decisions.
Weekly Allocation
| Ticker | Category | Weight | Role |
|---|---|---|---|
| FBTC | 50% | Overlay | |
| XLE | Traditional Energy | 10% | Top-2 (10%) |
| GLD | Precious Metals | 10% | Top-2 (10%) |
| COPX | Industrial Metals | 5% | Tier-2 (5%) |
| URNM | Nuclear Energy | 5% | Tier-2 (5%) |
| XLU | Utilities & Infrastructure | 5% | Tier-2 (5%) |
| ITA | Defense & Aerospace | 5% | Tier-2 (5%) |
| SMH | AI | 5% | Tier-2 (5%) |
| WEAT | Agriculture & Livestock | 5% | Tier-2 (5%) |
Trade Instructions — Monday Open
Sell the tranche from 2024-03-29 (completing its 4-week hold). Buy the new tranche. Instructions show net portfolio changes — same-asset positions cancel, weight changes show the delta.
| Action | Ticker | Instruction |
|---|---|---|
| SELL | URA | Sell entire URA position (2.50% of portfolio) |
| SELL | MOO | Sell entire MOO position (1.25% of portfolio) |
| BUY | GLD | Buy GLD — 33.33% of freed cash (adds 1.25% to portfolio) |
| BUY | URNM | Buy URNM — 33.33% of freed cash (adds 1.25% to portfolio) |
| BUY | WEAT | Buy WEAT — 33.33% of freed cash (adds 1.25% to portfolio) |
Current Portfolio After Trade
Combined holdings across all 4 active tranches. Each tranche is 25% of the portfolio.
| Ticker | % of Portfolio | Weight Bar |
|---|---|---|
| FBTC | 50.00% | |
| XLE | 10.00% | |
| GLD | 10.00% | |
| ITA | 5.00% | |
| XLU | 5.00% | |
| COPX | 5.00% | |
| URNM | 3.75% | |
| AIQ | 3.75% | |
| WEAT | 3.75% | |
| XLK | 1.25% | |
| NLR | 1.25% | |
| SMH | 1.25% |
Macro Regime — Late-Cycle Reflation
Macro Evidence Charts
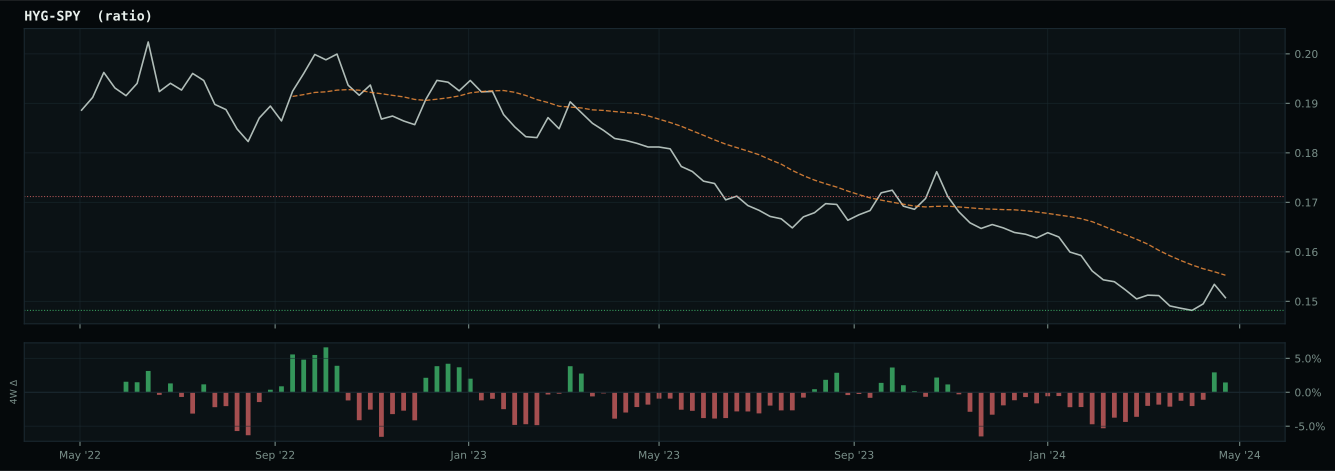
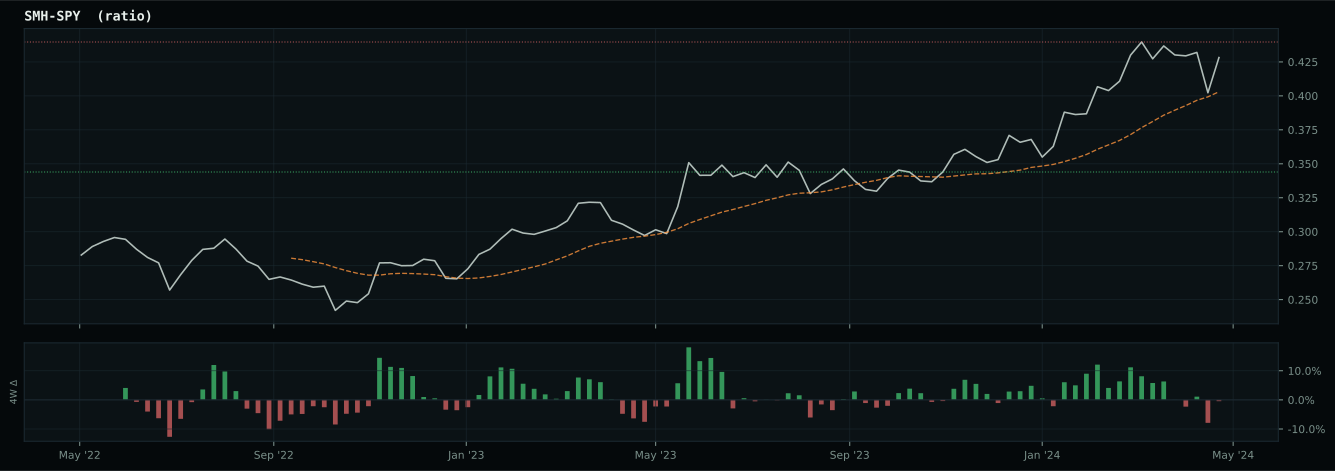
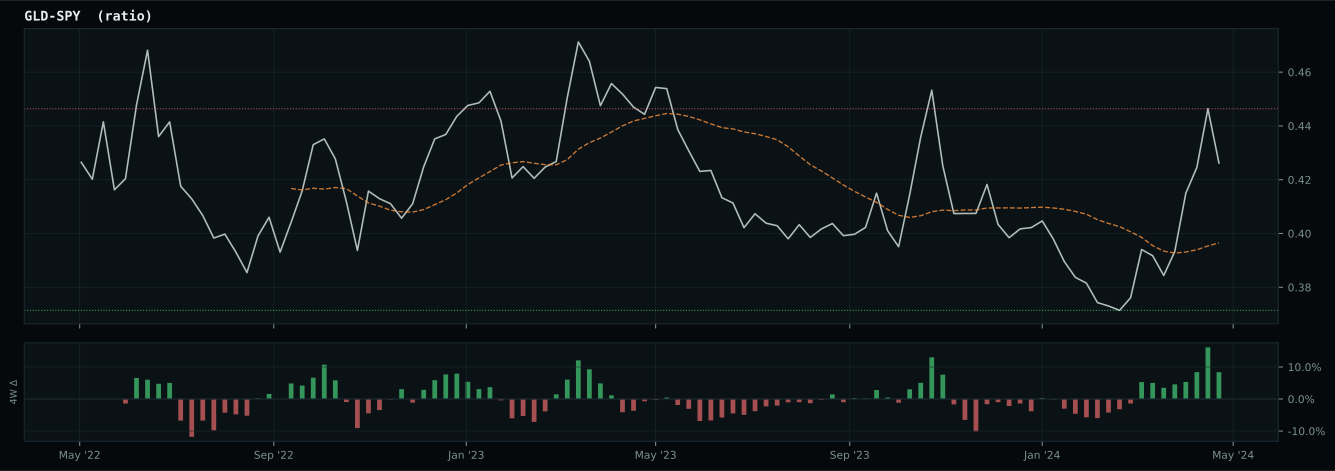
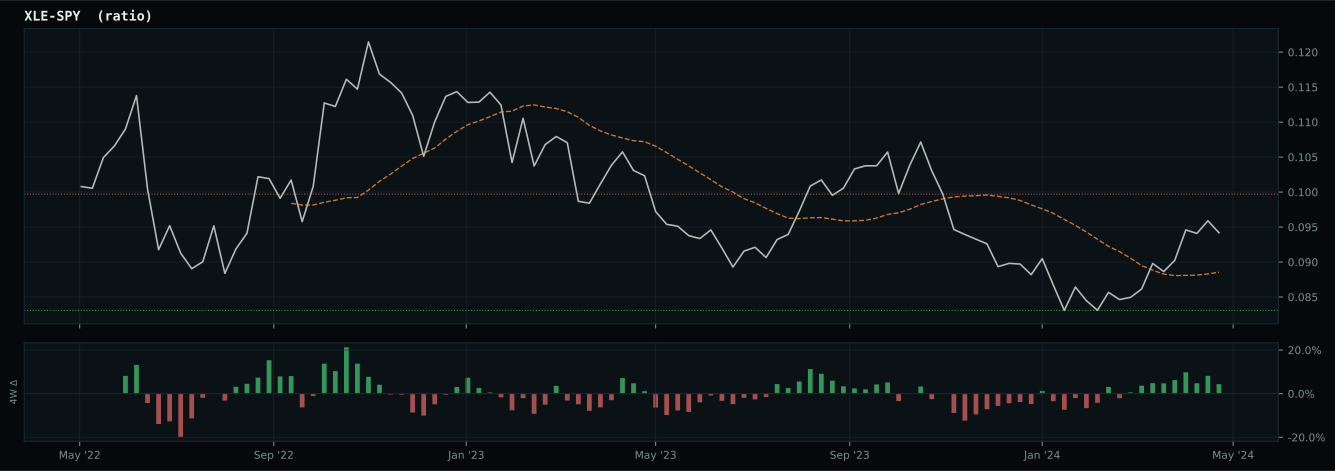
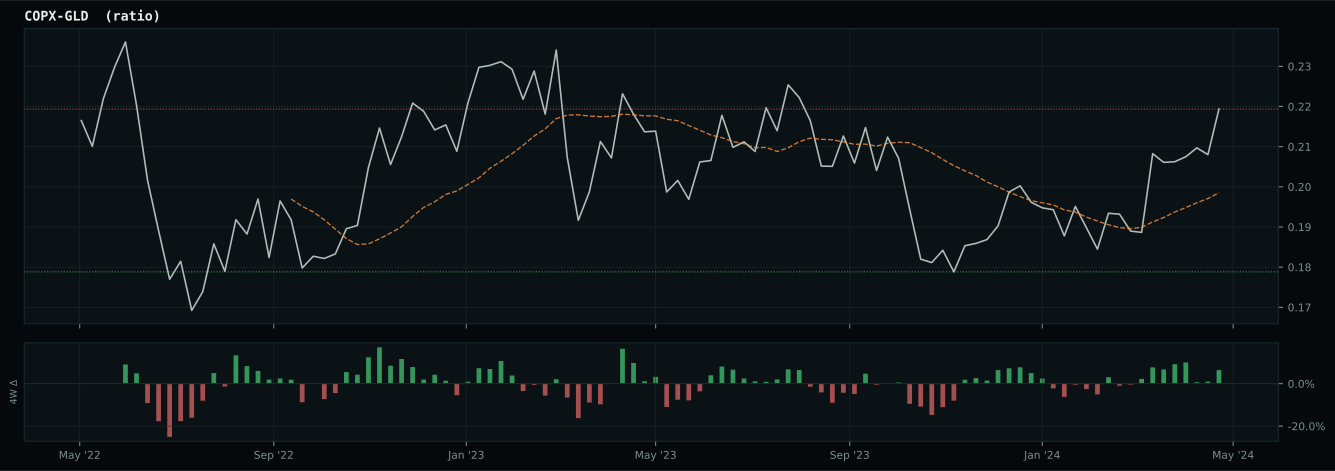
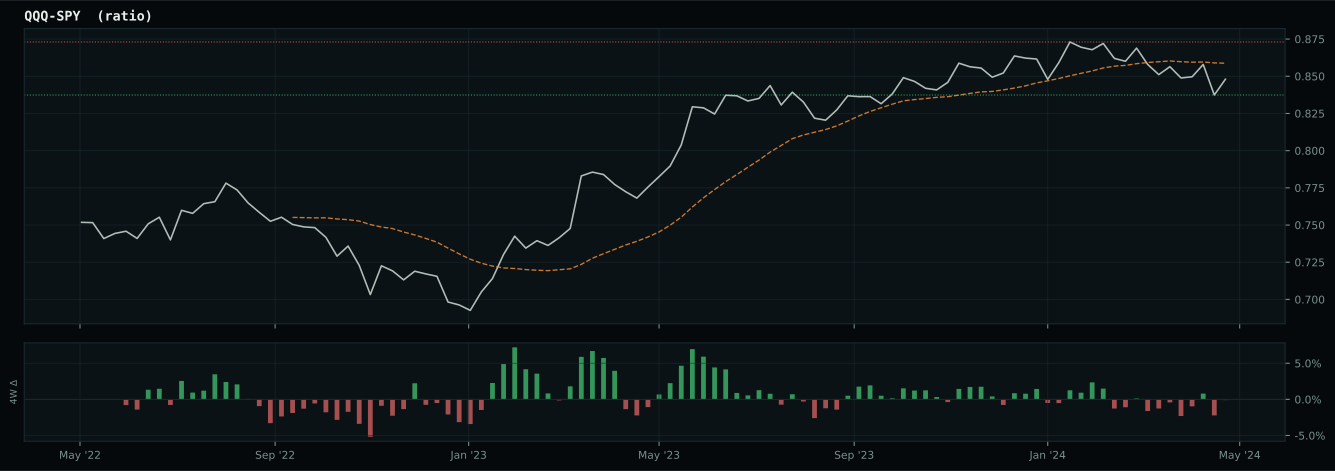
Market-implied signals behind the macro regime scores. Each ratio compares two assets; the direction and slope of the ratio is what the macro engine reads.
Crypto Regime — TrendBTC
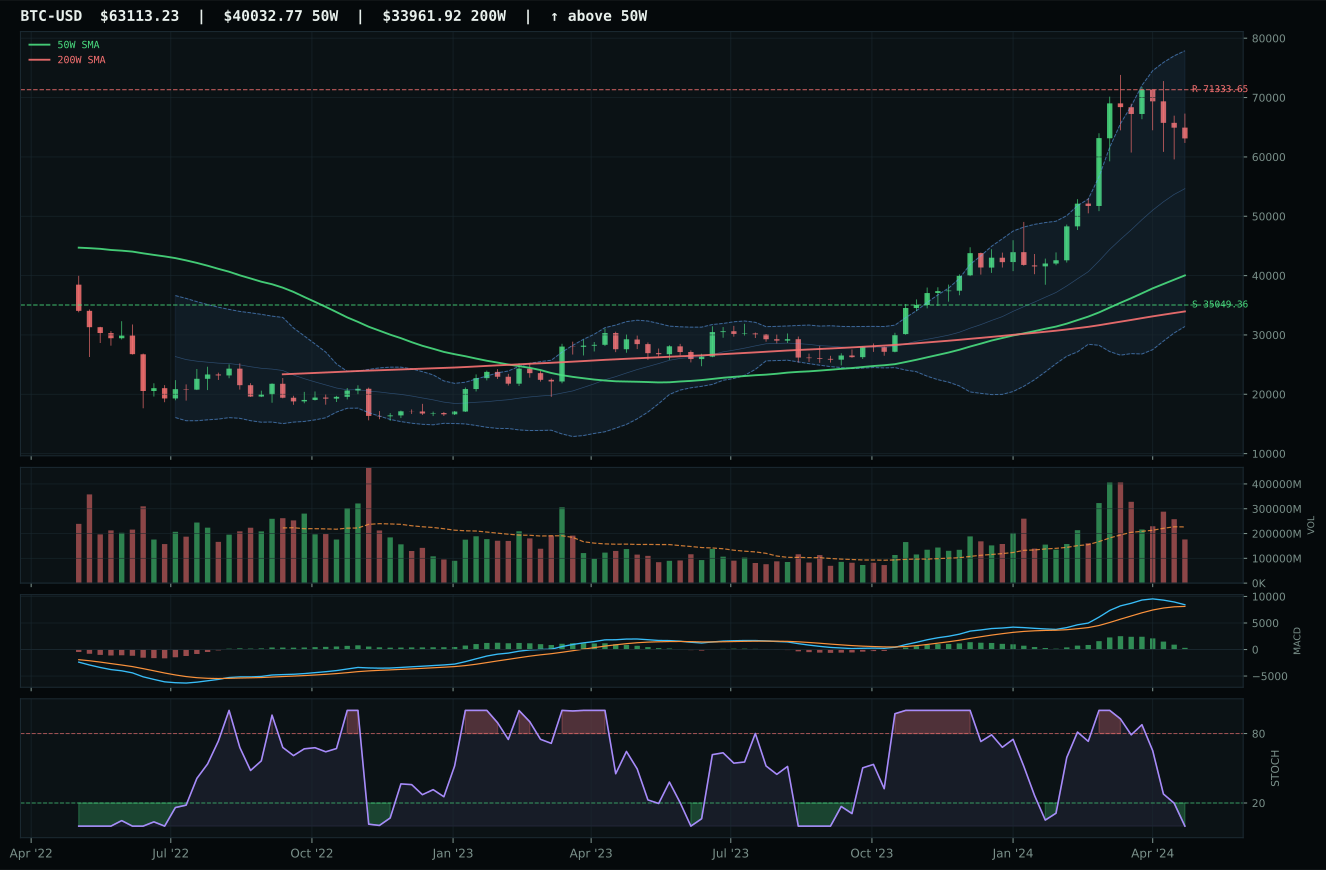
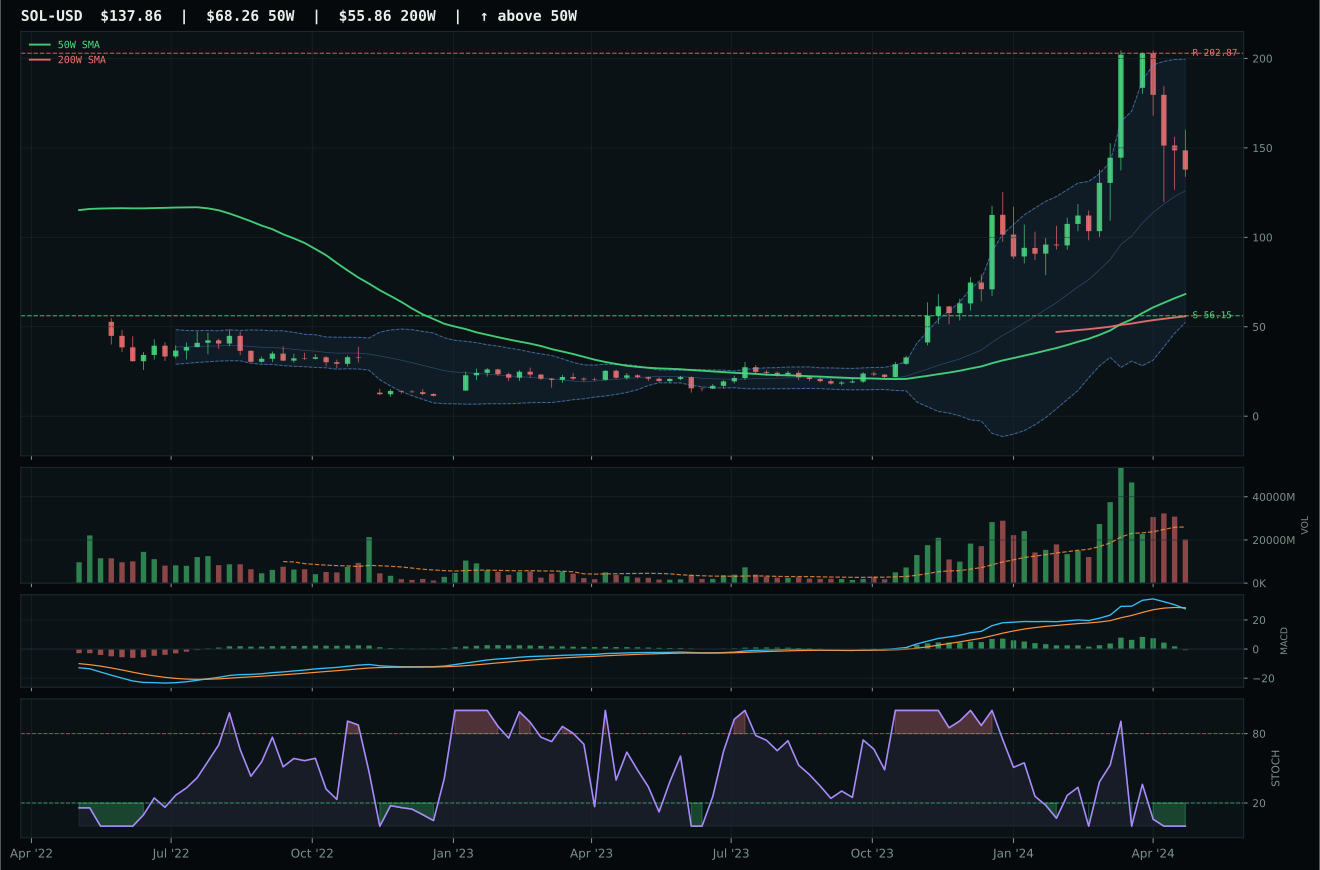
post-touch structure is too wide to count as a range; max/min close ratio is 3.22
TrendBTC confirmed: 2 consecutive closes above rising/flat 50W SMA
one or more available conditions failed
Category Rankings
| Rank | Category | Winner | Score | Alloc | 4W Ret | Peers (4W) |
|---|---|---|---|---|---|---|
| 1 | Traditional Energy | XLE | 81.7 | 20% | -3.95% | XOP -4.8% · FCG -3.7% |
| 2 | Precious Metals | GLD | 81.1 | 20% | +1.12% | GDX +4.0% · SLV +17.8% |
| 3 | Industrial Metals | COPX | 67.4 | 10% | +4.34% | PICK +3.3% · REMX +3.4% |
| 4 | Nuclear Energy | URNM | 55.7 | 10% | +8.65% | NLR +10.8% · URA +8.3% |
| 5 | Utilities & Infrastructure | XLU | 48.3 | 10% | +7.38% | PAVE +2.4% · IGF +4.9% |
| 6 | Defense & Aerospace | ITA | 44.1 | 10% | +4.49% | XAR +5.2% · ROKT +3.8% |
| 7 | AI | SMH | 34.0 | 10% | +13.89% | AIQ +5.5% · BOTZ +4.5% |
| 8 | Agriculture & Livestock | WEAT | 33.9 | 10% | +10.86% | VEGI -0.4% · MOO +1.5% |
| 9 | Technology | CIBR | 28.5 | 0% | +1.03% | IGV +1.7% · XLK +7.7% |
| 10 | Emerging Markets | IEMG | 15.3 | 0% | +4.09% | INDA +2.5% · ILF -0.8% |
Traditional Energy — XLE
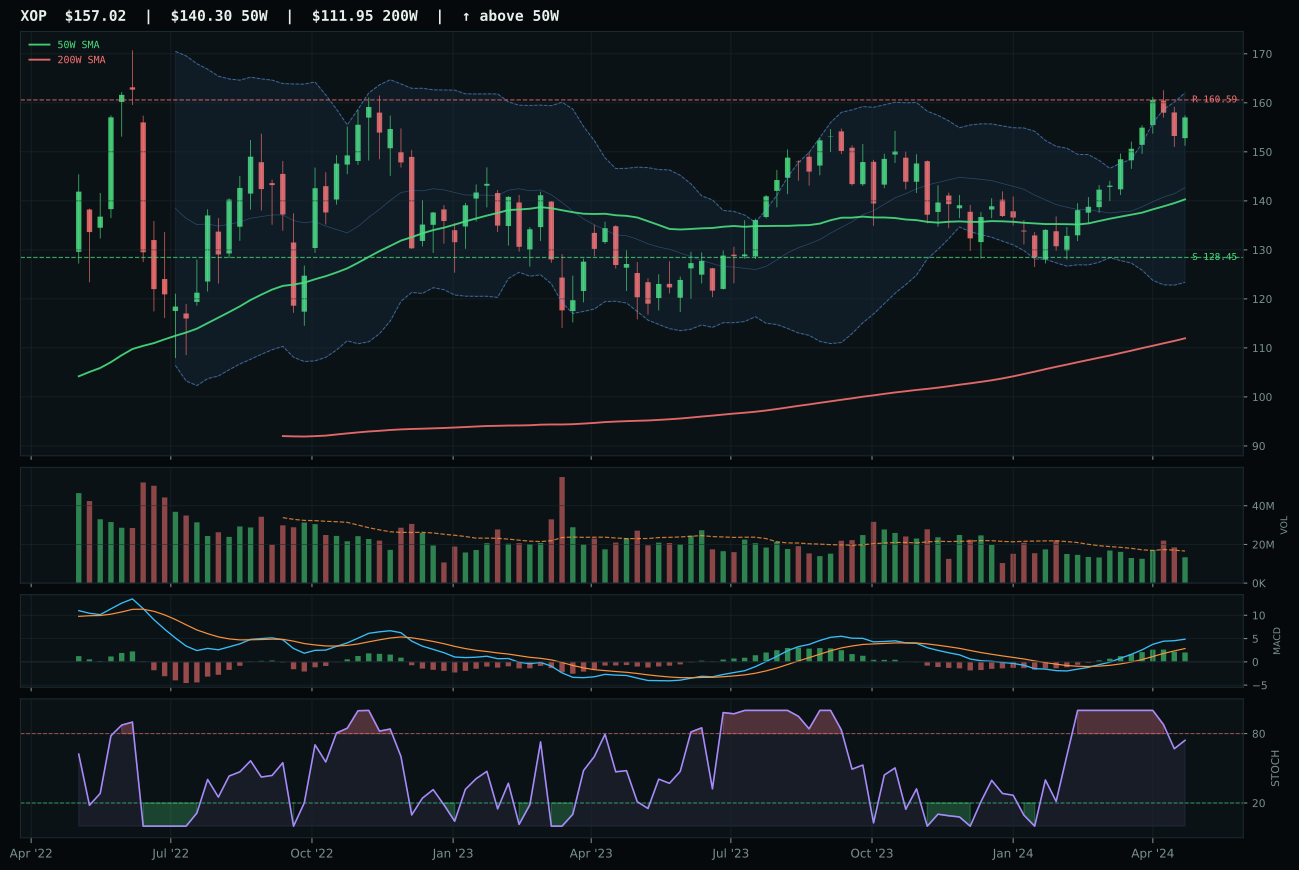
XOP has a neutral structure profile with 12.8% 13-week relative strength versus SPY.
A failed hold above support would weaken the setup.
Actionable but governed by invalidation levels.
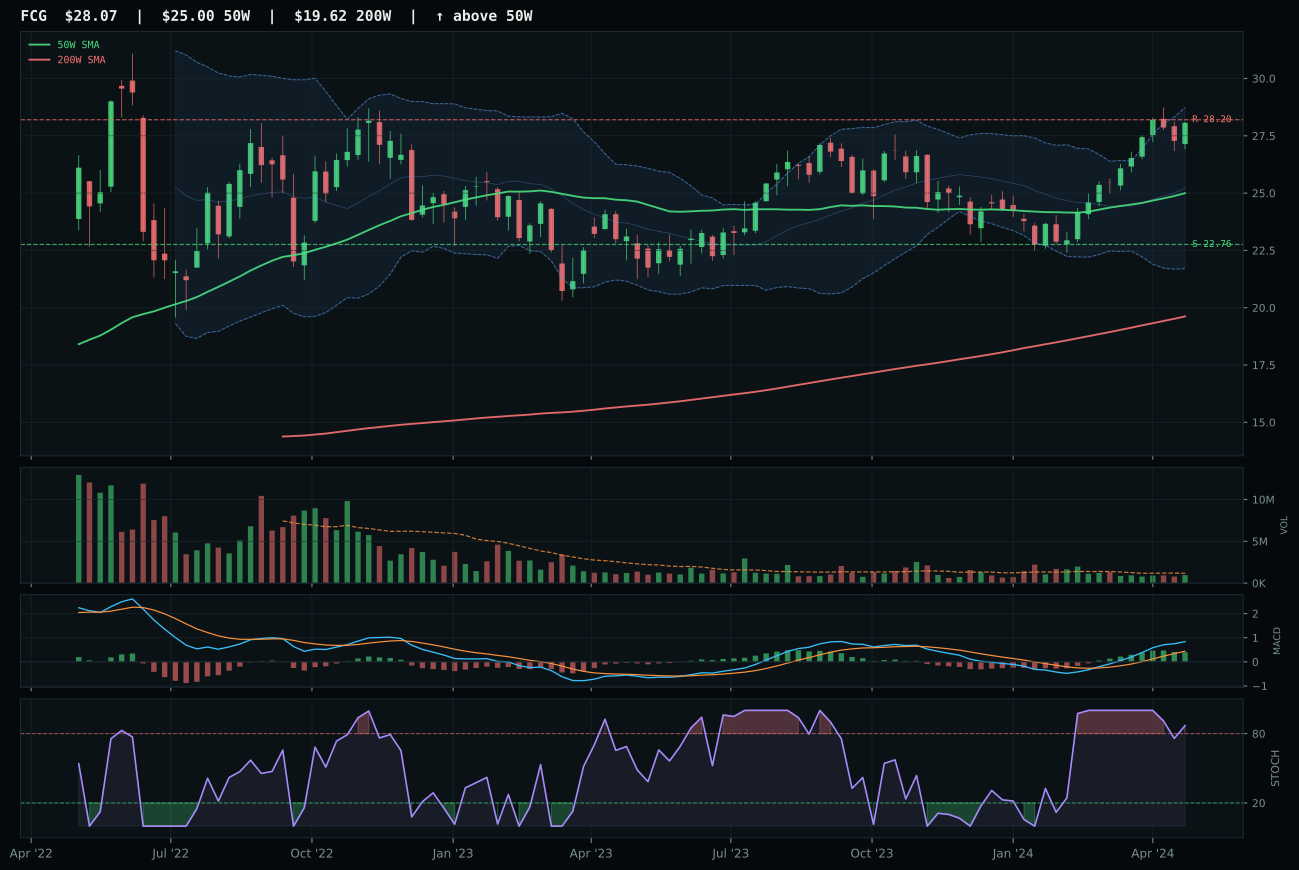
FCG has a neutral structure profile with 14.4% 13-week relative strength versus SPY.
A failed hold above support would weaken the setup.
Actionable but governed by invalidation levels.
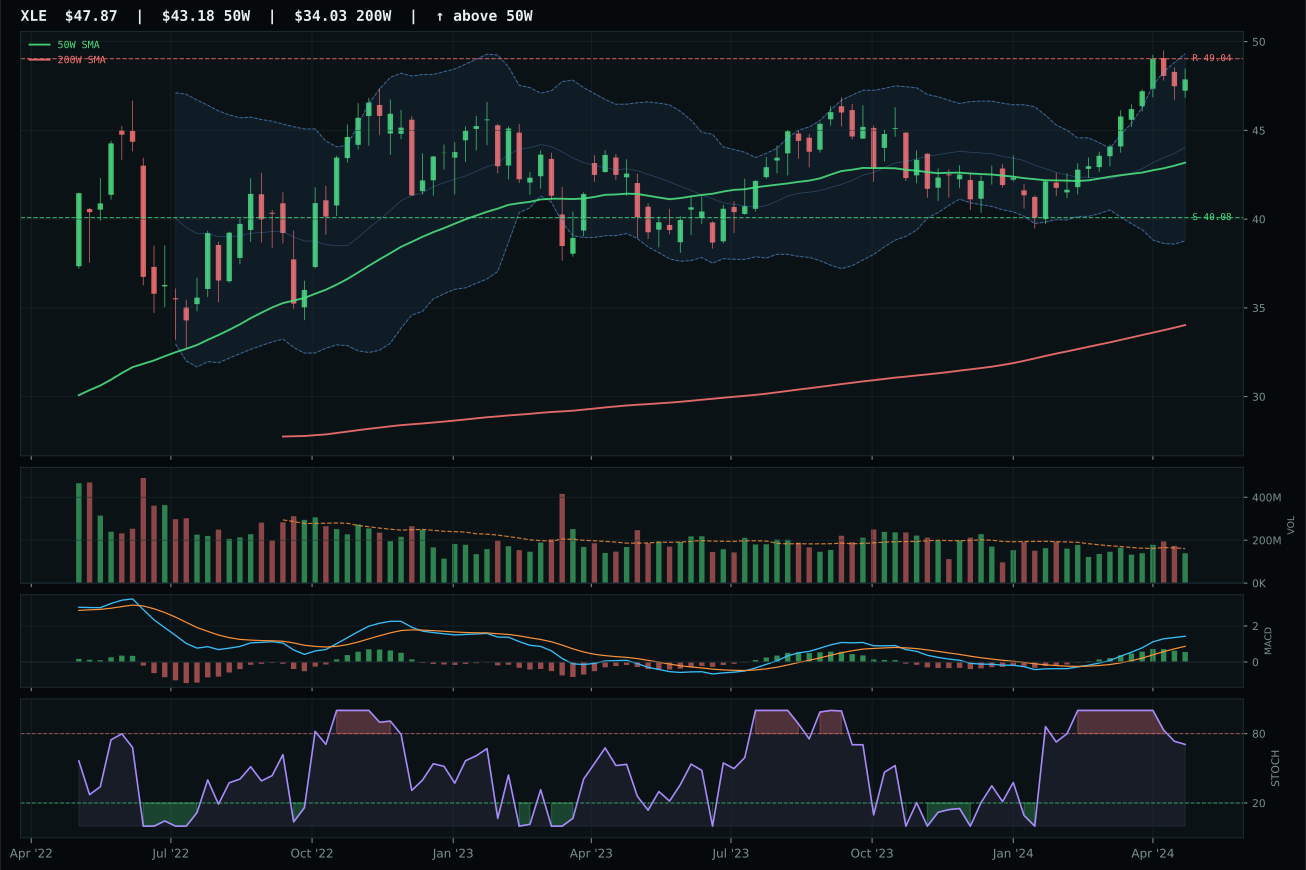
XLE has a neutral structure profile with 9.4% 13-week relative strength versus SPY.
A failed hold above support would weaken the setup.
Actionable but governed by invalidation levels.
XLE claimed the second 20% top-2 slot by delivering perfect 100.0 trend confirmation with SPY-relative strength of 9.4% and 13.6% 13-week returns on neutral volume, signaling that energy scarcity was being repriced through the integrated oil-and-gas cash-flow model rather than squeezed on thin participation. The 79.8 structure score and 82.5 momentum confirmation reflected institutional accumulation of integrated energy assets, while the 70.8 timing score and falling-neutral stochastic RSI at 0.71 proved this was neither overbought nor exhausting—the 10.9% distance to the 50-week was within reasonable extension for a macro-supported theme. XOP lost by just 2.4 points despite 12.8% SPY-relative strength and 17.1% 13-week returns because its 46.8 risk-reward lagged XLE's 47.2, and MACD was bullish-but-flattening rather than bullish-improving—subtle deterioration that mattered in a crowded category decision where two contenders had nearly identical technical evidence scores.
Traditional Energy scores 81.7 and ranks as one of the two top-2 categories this week, earning full 10% allocation alongside Precious Metals. The 90.0 category-level macro fit is exceptional—late-cycle reflation helps this exposure (+12), energy scarcity is the second-most-active descriptor in the regime (+16), inflation pressure is strong (+10), and supply shortage adds further conviction (+9). XLE's 73.5 technical evidence and 86.0 macro/narrative fit combine to create the strongest risk-adjusted case in the portfolio for sustained late-cycle positioning. The energy sector's status as a real asset producer with pricing power into inflation makes it the natural counterpart to precious metals for late-cycle reflation allocation. The only material headwind is the bullish-but-flattening MACD on XLE, which suggests that momentum is not accelerating—this is acceptable because the macro tailwinds are sufficient to drive continued strength. The 10% allocation acknowledges that energy represents one of the two most conviction-worthy bets available in the current macro regime.
Precious Metals — GLD
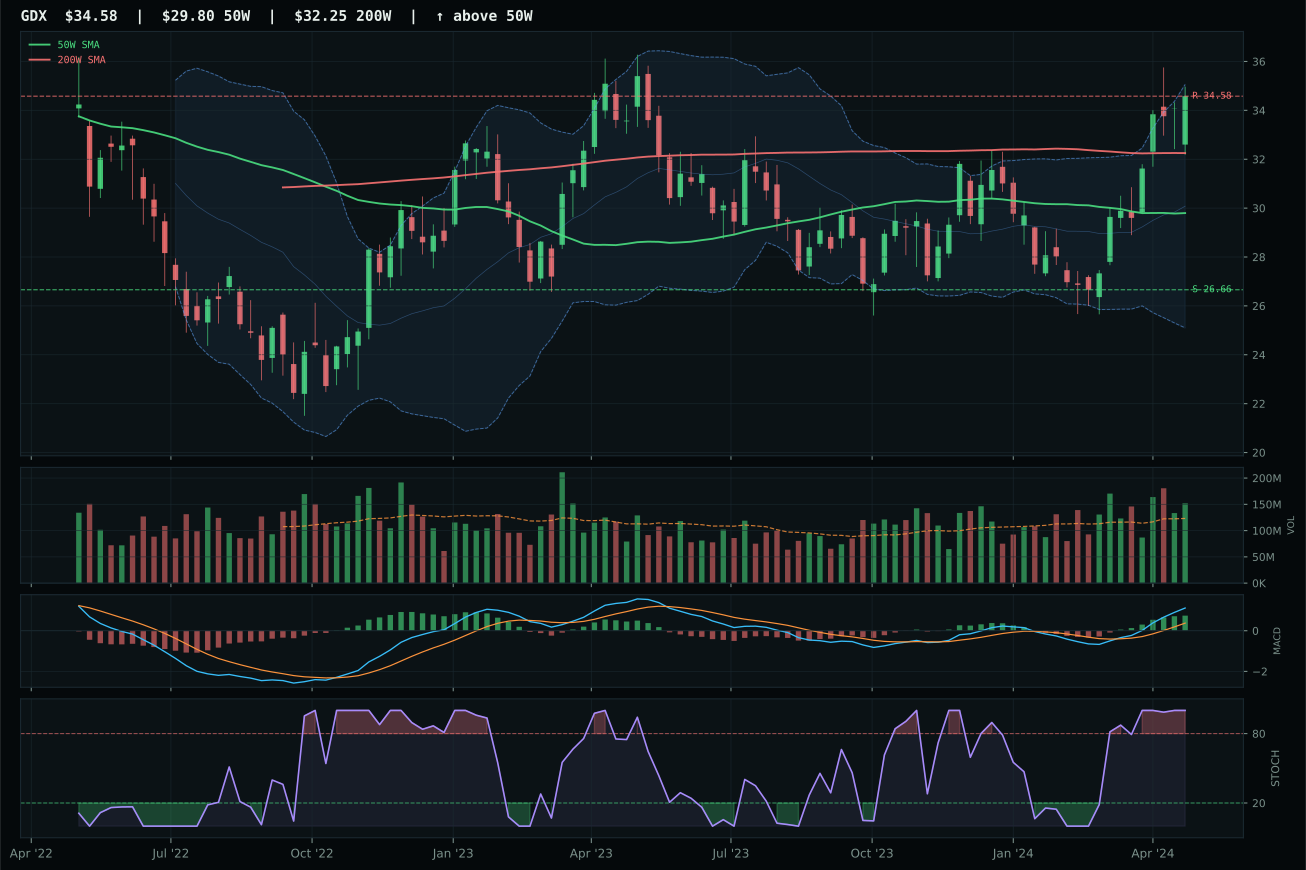
GDX has a vertical extension profile with 18.9% 13-week relative strength versus SPY.
A failed hold above support would weaken the setup.
Actionable but governed by invalidation levels.
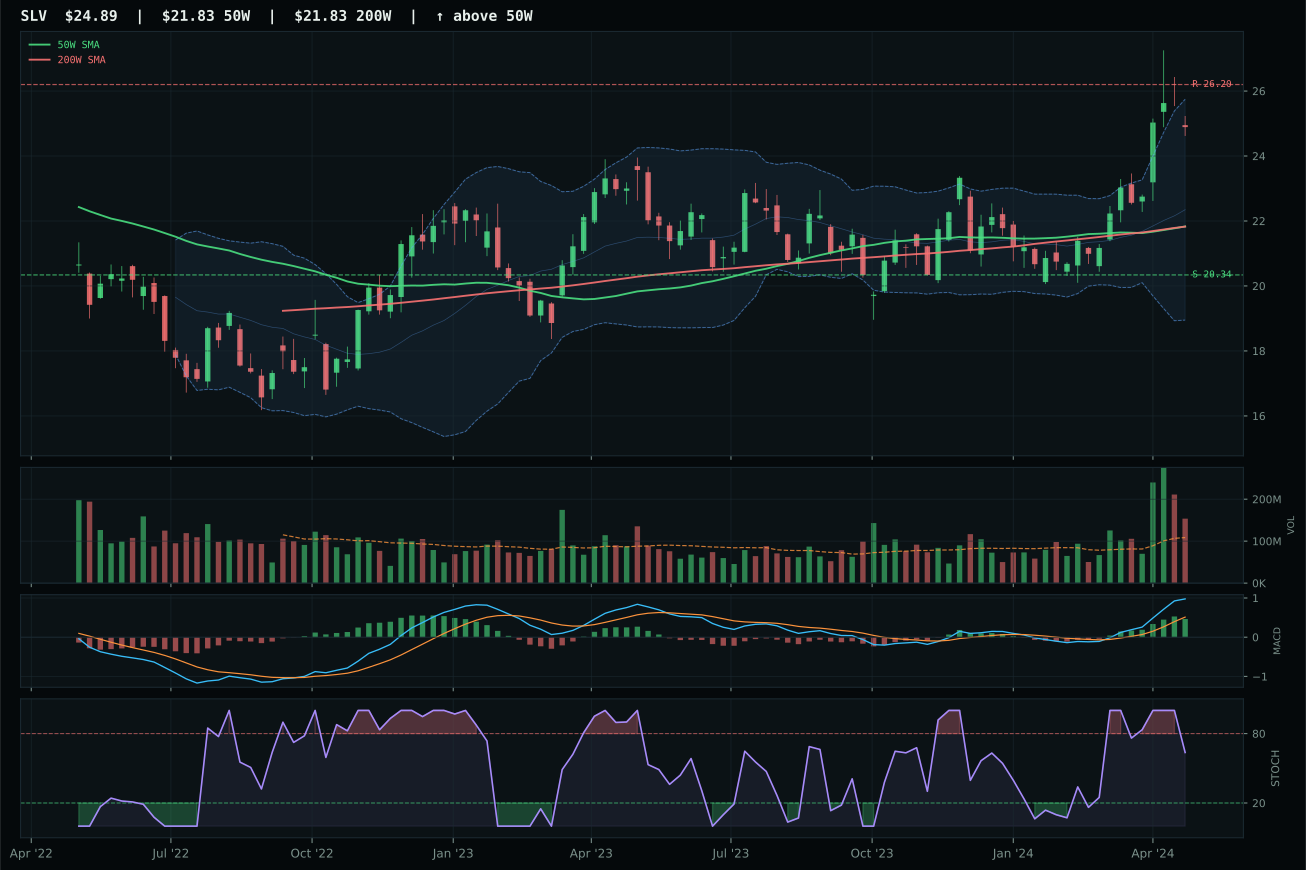
SLV has a neutral structure profile with 15.0% 13-week relative strength versus SPY.
A failed hold above support would weaken the setup.
Actionable but governed by invalidation levels.
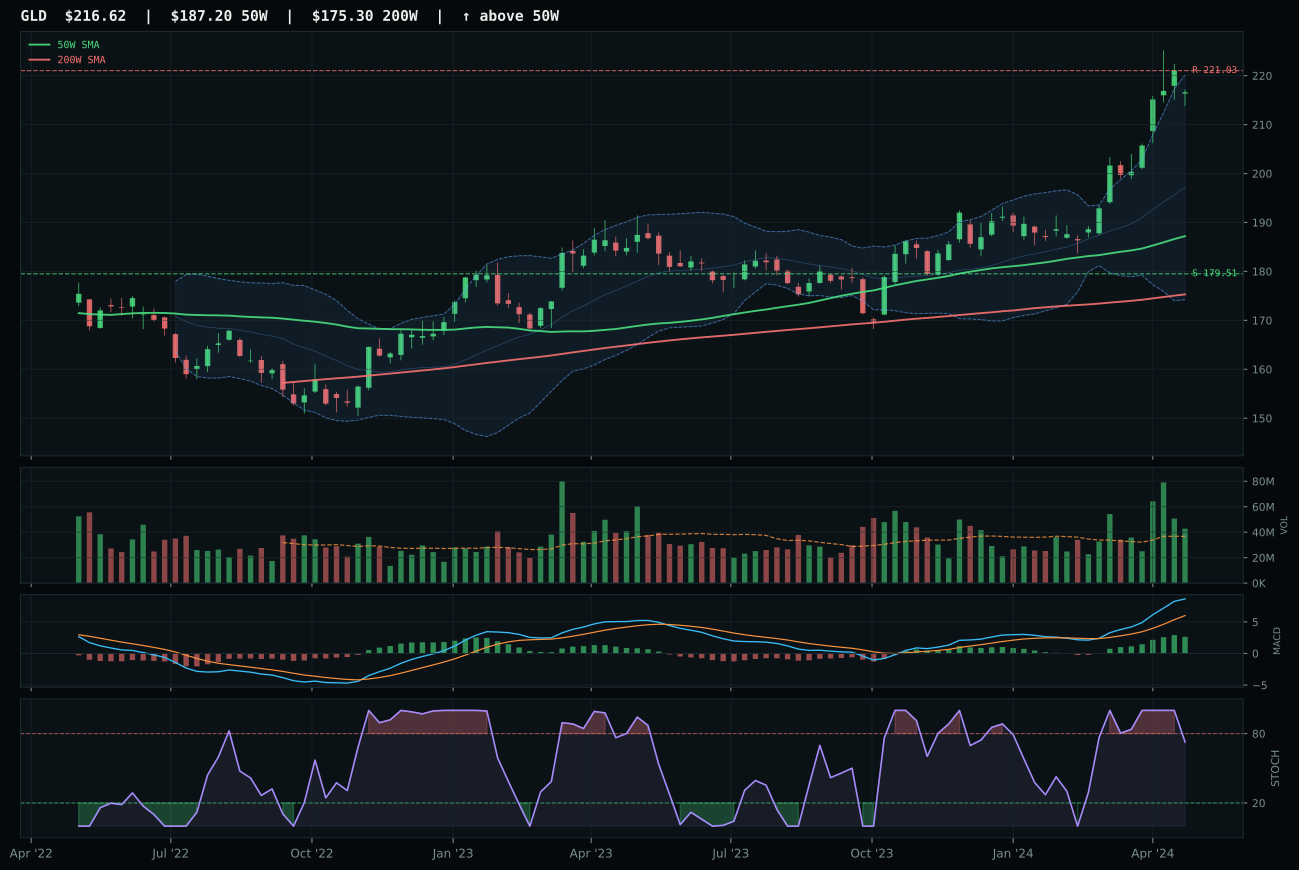
GLD has a vertical extension profile with 11.6% 13-week relative strength versus SPY.
A failed hold above support would weaken the setup.
Actionable but governed by invalidation levels.
GLD secured the top-2 allocation by delivering perfect trend confirmation (100.0) with above-average volume participation and bullish-improving MACD in a vertical extension setup 15.7% above the 50-week, signaling that the monetary hedge bid had shifted from whispered accumulation to institutional sponsorship. The 11.6% SPY-relative strength and 15.8% 13-week return proved this was not a defensive rotation into yield but genuine real-asset demand, while the 80.8 structure score and 73.0 volume-price confirmation revealed buyers were willing to chase price rather than wait for pullbacks. GDX lost despite superior momentum at 100.0 and category-relative strength of 3.9% because its 45.0 timing score lagged GLD's 53.0—the more volatile miners were overbought-momentum-rolling with stochastic RSI reading 1.00, while GLD's falling-neutral stochastic at 0.73 offered cleaner entry discipline. The 5-point margin reflected execution precision: GLD was the clean monetary hedge, while GDX was the leveraged expression with higher beta risk at exactly the wrong moment of the setup.
Precious Metals scores 81.1 and ranks as one of the two top-2 categories this week, earning full 10% allocation alongside Traditional Energy. The 70.0 category-level macro fit is powered by the monetary hedge bid (+14 points)—a signal that is exceptionally strong in late-cycle reflation when dollar pressure and defensive rotation expectations rise simultaneously. GLD's technical evidence of 86.5% combined with the macro tailwind creates a fortress case for overweight exposure. The positioning acknowledges that gold's upside is becoming crowded (only 2.0% to resistance, 20.7% downside to support), but the volume profile and MACD improvement signal that institutions are rotating into duration hedges. The only material risk to this allocation is a sudden credit impulse or liquidity flush that would reverse the monetary hedge bid; such a reversal would need to be dramatic to overcome the 73.0% volume-price confirmation score that suggests accumulation is orderly and professional rather than panic-driven.
Industrial Metals — COPX
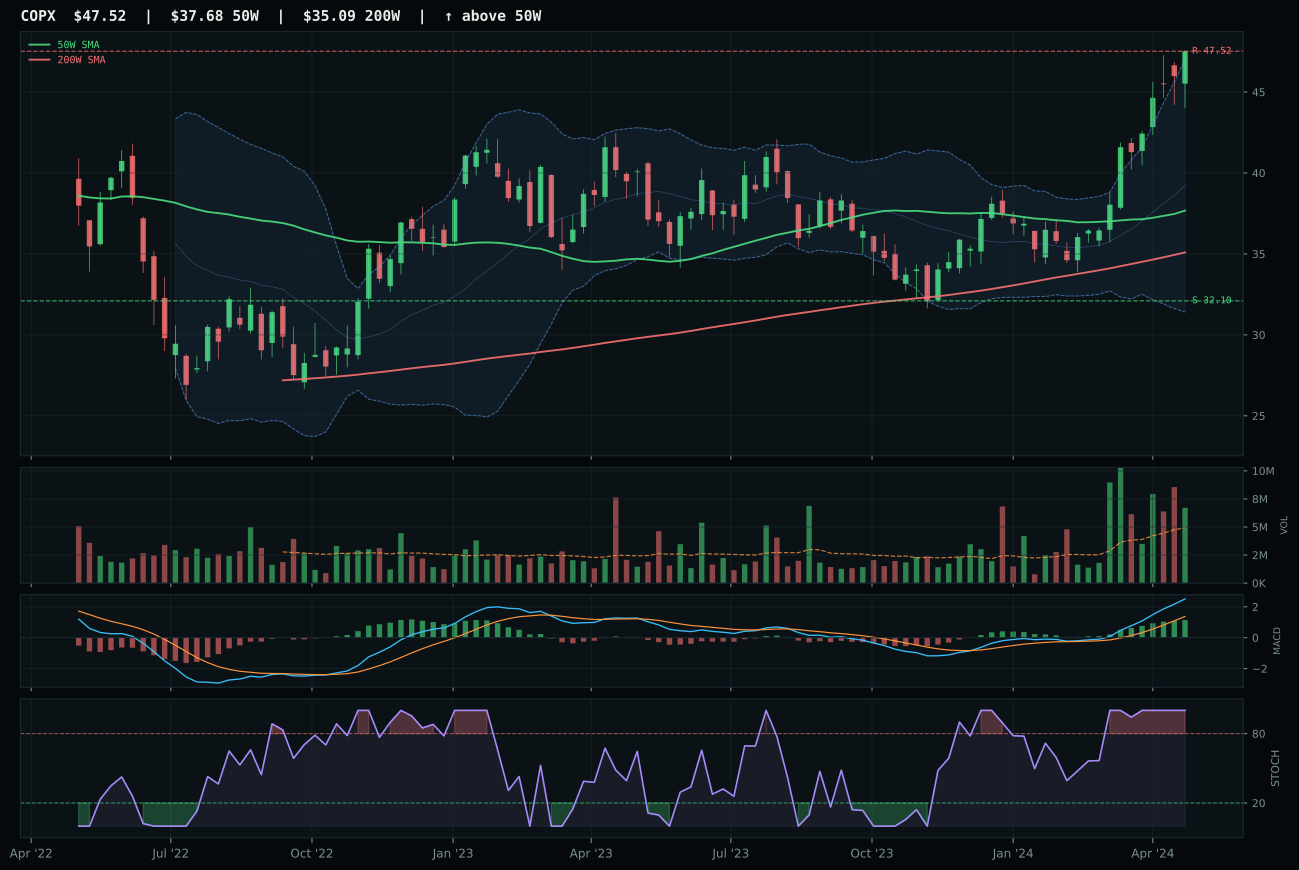
COPX has a vertical extension profile with 25.9% 13-week relative strength versus SPY.
A failed hold above support would weaken the setup.
Actionable but governed by invalidation levels.
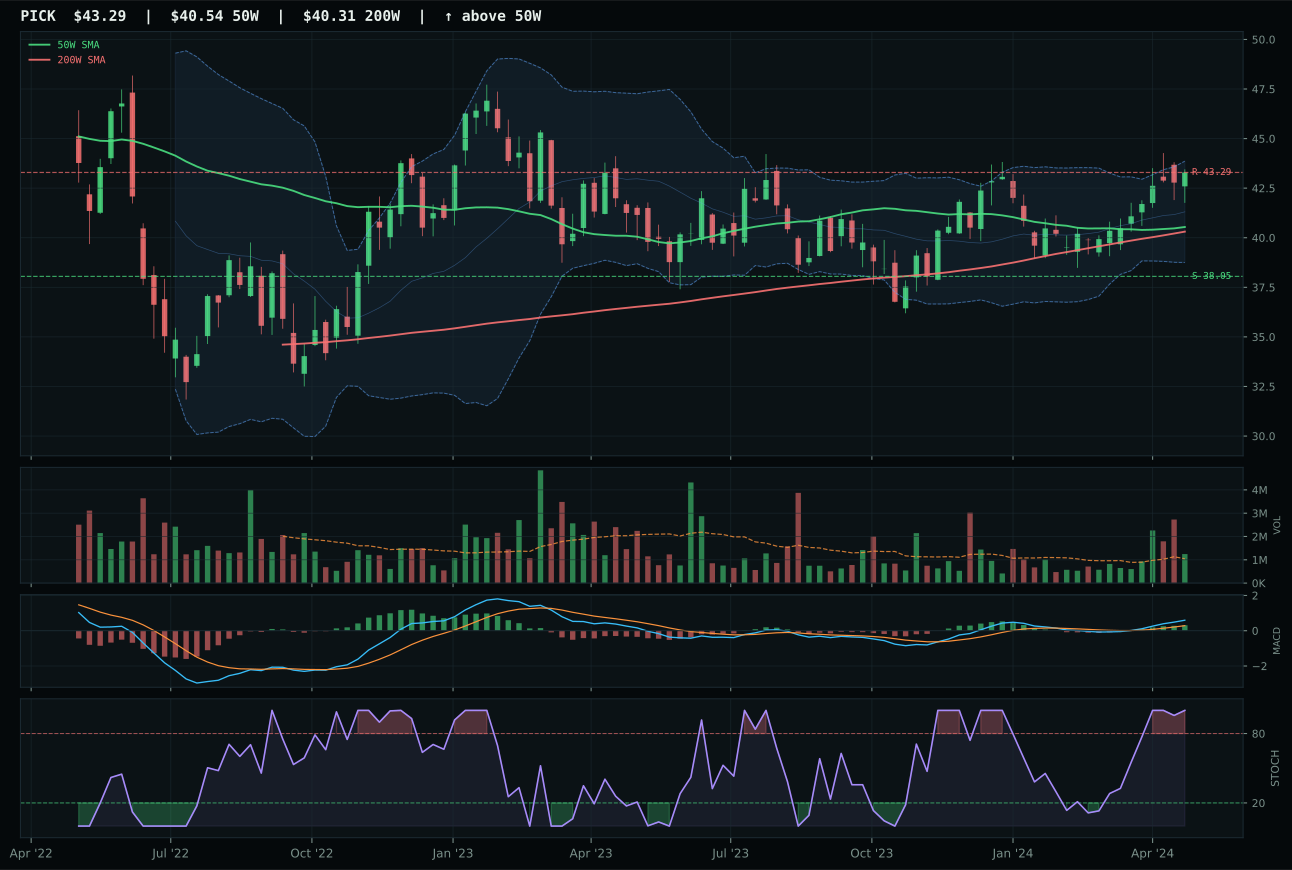
PICK has a neutral structure profile with 2.7% 13-week relative strength versus SPY.
A failed hold above support would weaken the setup.
Actionable but governed by invalidation levels.
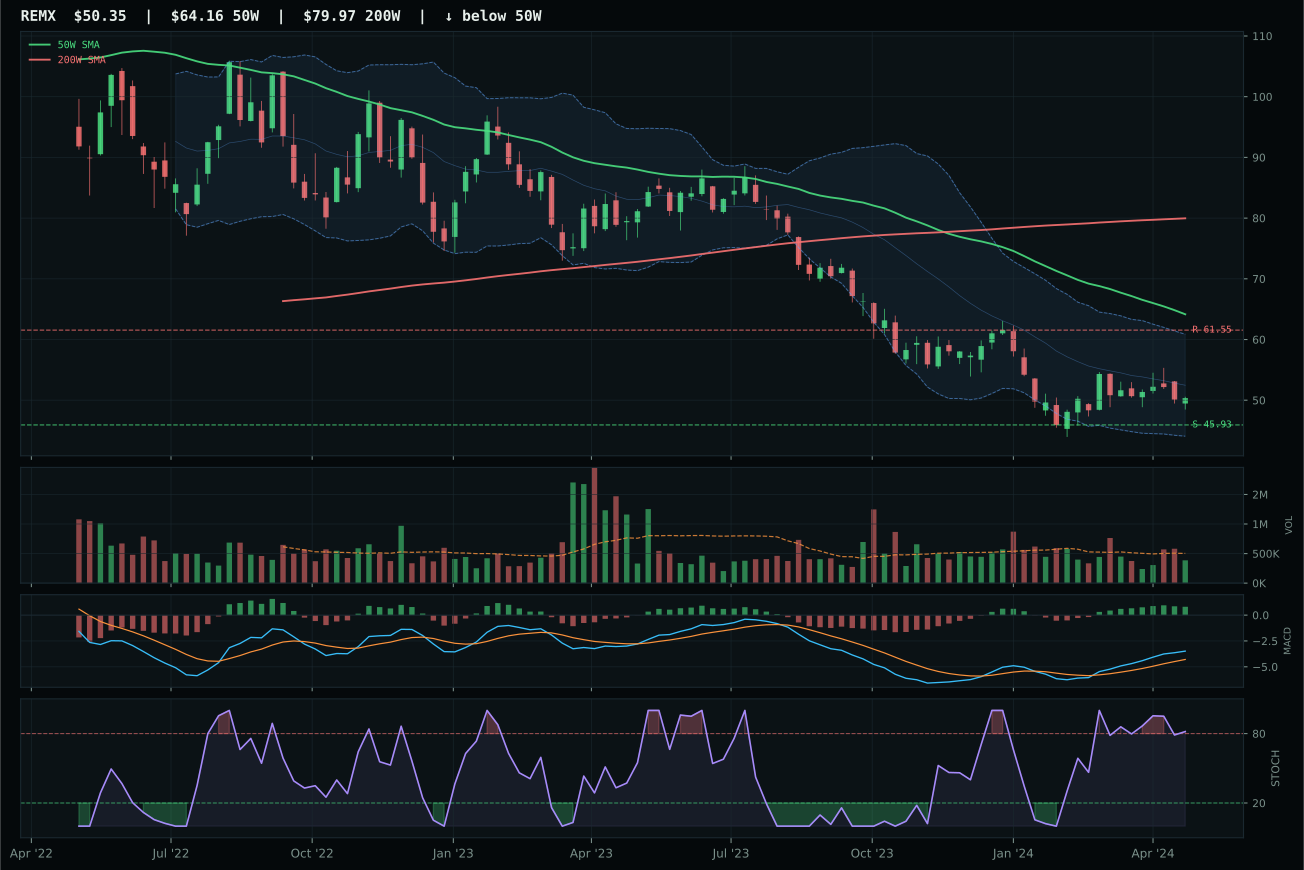
REMX has a neutral structure profile with -2.8% 13-week relative strength versus SPY.
Extension and support failure are the main tactical risks.
Tracked, but not top-2 eligible because: structurally broken.
COPX dominated Industrial Metals by capturing copper scarcity beta through 25.9% SPY-relative strength and 30.2% 13-week returns, paired with perfect 100.0 momentum confirmation and 100.0 persistence scores that proved the move was being accumulated across institutions rather than fading into distribution. The 83.3 structure score reflected vertical extension cleanliness and a perfect near-52W-high setup that signaled structural demand, while 87.8 volume-price confirmation showed above-average participation throughout the run rather than climactic exhaustion. PICK lost by 17.5 points despite 100.0 trend confirmation because its 0.0% category-relative strength revealed that while diversified mining breadth was supported, copper-specific scarcity was the true leadership—COPX's 23.3% category-relative advantage proved sophisticated buyers were rotating into the more specific and scarce input. The timing difference was decisive: COPX's 37.0 timing reflected massive overextension (26.1% above the 50W), which normally would penalize entry, but the persistence at 100.0 and volume sponsorship showed this was not a late-stage squeeze but a structural supply-demand imbalance being repriced.
Industrial Metals scores 67.4 and earns a 5% allocation as the fifth-ranked category this week. The positioning reflects COPX's exceptional momentum confirmation and macro tailwinds (metals scarcity +12, commodity breadth positive +7, late-cycle reflation +10) that create a compelling late-cycle demand narrative. However, the 26.1% extension above the 50-week and 37.0 timing score prevent this category from claiming a top-2 or even 10% position despite the technical momentum. Risk-reward is deteriorating sharply—only 0.0% upside to resistance at 47.52 versus 48.0% downside to support at 32.10—making this a classic case of maximum bullish positioning with minimal margin for error. For Industrial Metals to reach 5% allocation, either the setup needs consolidation to reset timing risk, or COPX needs a pullback that resets the entry without breaking the structural uptrend. At 5%, this category provides exposure to the scarcity narrative while respecting the technical risk that has accumulated through the 30%+ move.
Nuclear Energy — URNM
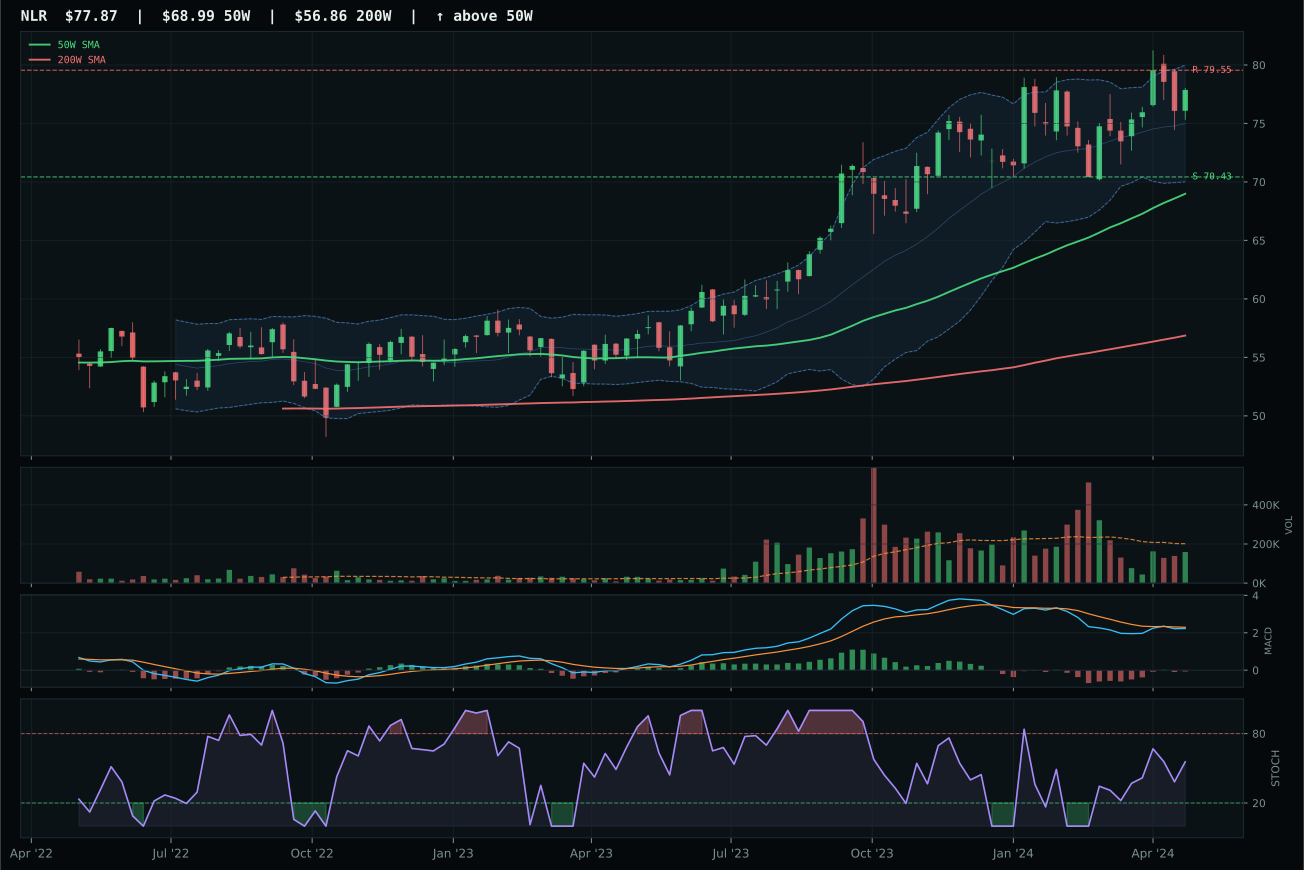
NLR has a neutral structure profile with -0.4% 13-week relative strength versus SPY.
A failed hold above support would weaken the setup.
Actionable but governed by invalidation levels.
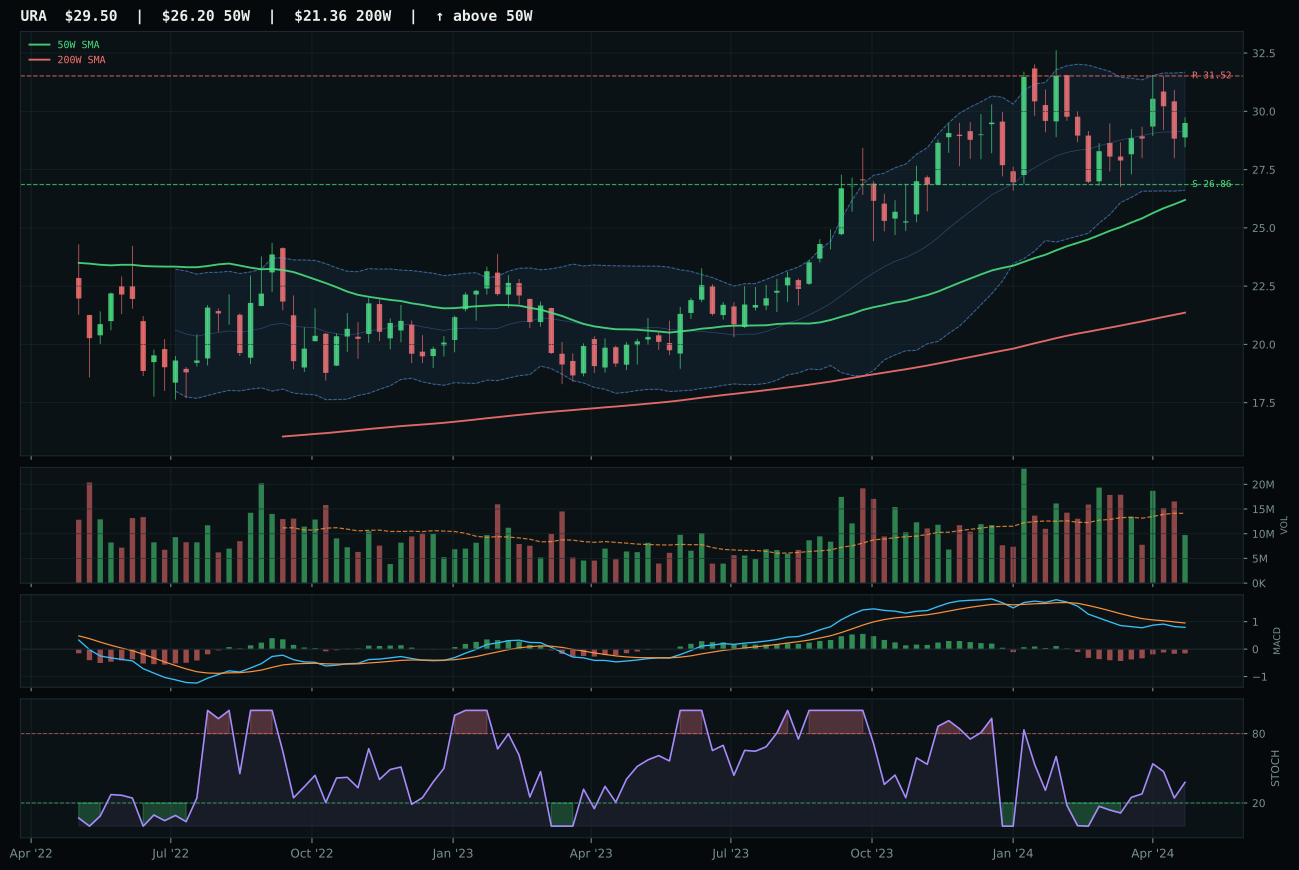
URA has a neutral structure profile with -4.6% 13-week relative strength versus SPY.
A failed hold above support would weaken the setup.
Actionable but governed by invalidation levels.
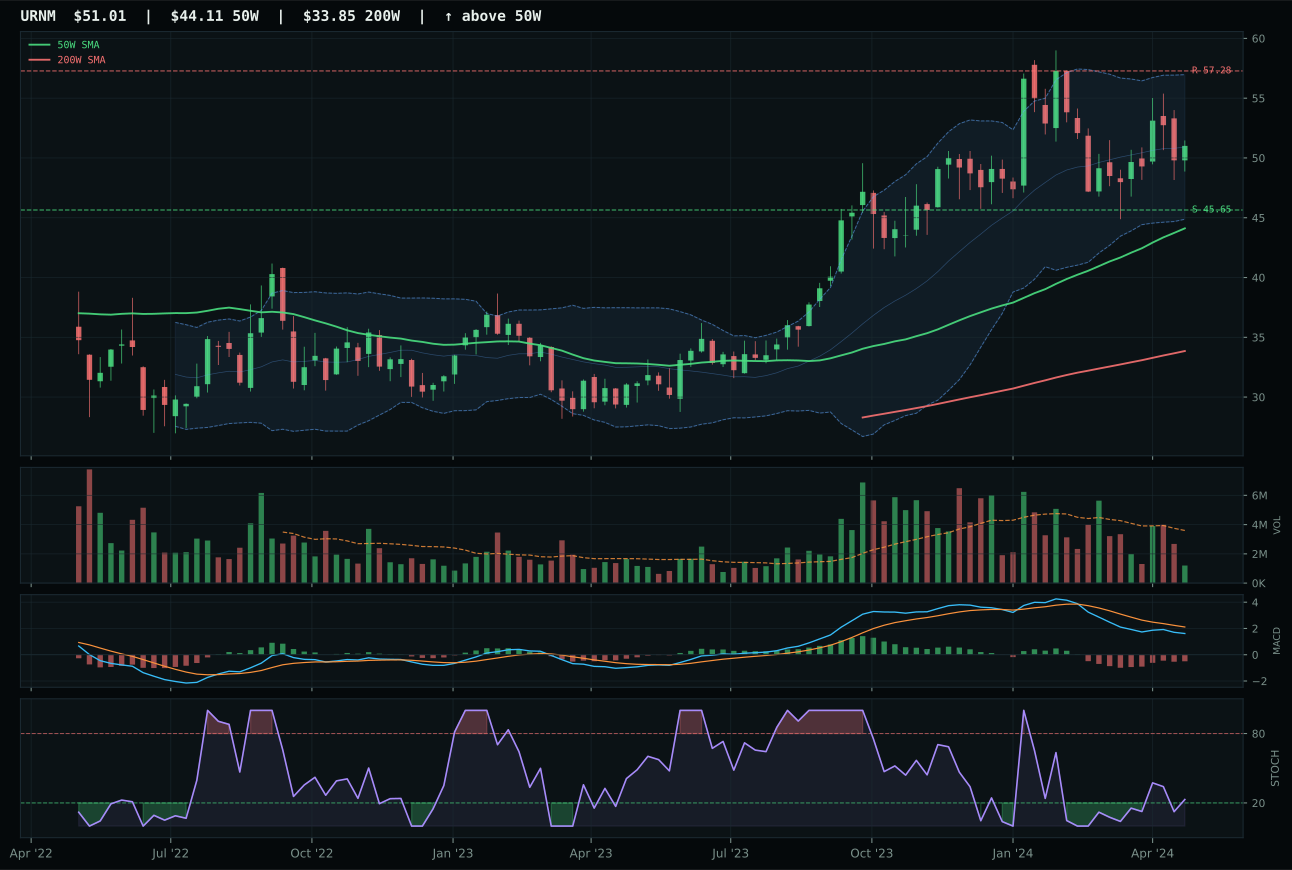
URNM has a vertical extension profile with -7.8% 13-week relative strength versus SPY.
A failed hold above support would weaken the setup.
Actionable but governed by invalidation levels.
URNM won Nuclear Energy despite weak technical signals because the category's three-ETF basket (NLR, URA, URNM) was so evenly matched that even the weakest link could lead on a 3-2-1 weighting after category-level filtering. URNM's 81.3 trend score and 15.6% distance to 50W were offset by thin participation (0.33x volume), bearish-but-improving MACD, and momentum confirmation at just 32.0, making this a category where every name was structurally wounded by macro headwinds. NLR lost to URNM because the category reasoner determined URNM's 48.8 reasoned proof score edged NLR's broader stability—a decision that highlighted the category's core problem: technical evidence was insufficient to overcome the macro regime's active headwinds, making the win a Pyrrhic victory. The uranium-miner scarcity narrative was present in the thesis, but execution was halting; volume confirmation at 39.8 and persistence at 50.1 proved buyers were cautious rather than committed.
Nuclear Energy scores 55.7 and earns a 5% allocation as the sixth-ranked category. The 69.0 macro fit is solid (energy scarcity +9, real asset sponsorship +7), and the 41.7 technical evidence is respectable for a transitional energy bet. However, the -3.5% 13-week return on the winner URNM and thin 0.33x volume participation signal that institutional commitment is limited—this is a narrative play rather than a conviction technical setup. The positioning acknowledges that nuclear energy offers legitimate late-cycle tailwinds (ai-driven electricity demand, energy scarcity) without committing excess capital to a setup with limited sponsorship. For Nuclear Energy to earn 5% allocation, URNM would need to reclaim positive relative strength and establish volume participation above 0.7x the 20-week average. At 5%, this category provides thematic exposure to energy transition and scarcity without overweighting an ETF that is technically underfunded relative to its fundamental case.
Utilities & Infrastructure — XLU
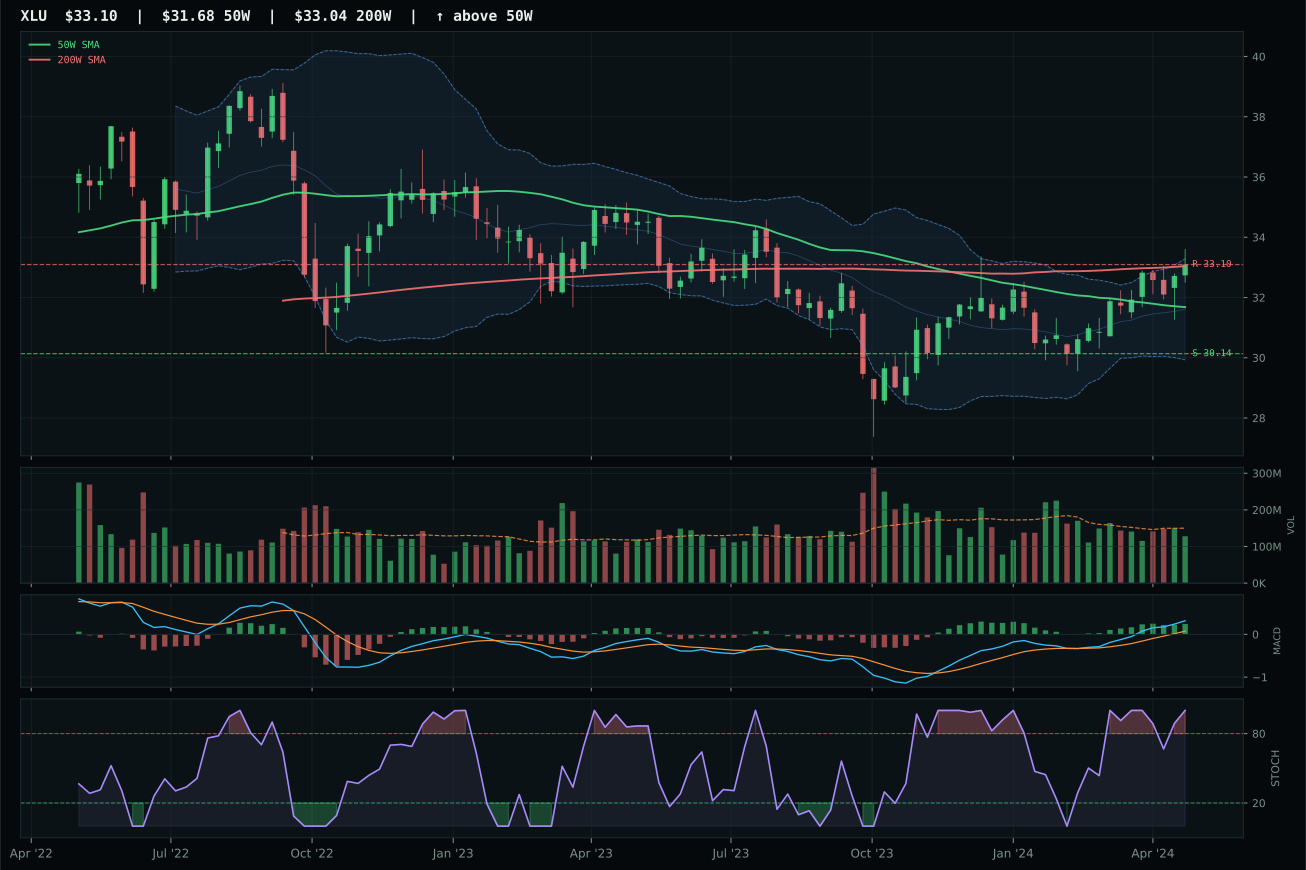
XLU has a neutral structure profile with 3.9% 13-week relative strength versus SPY.
A failed hold above support would weaken the setup.
Actionable but governed by invalidation levels.
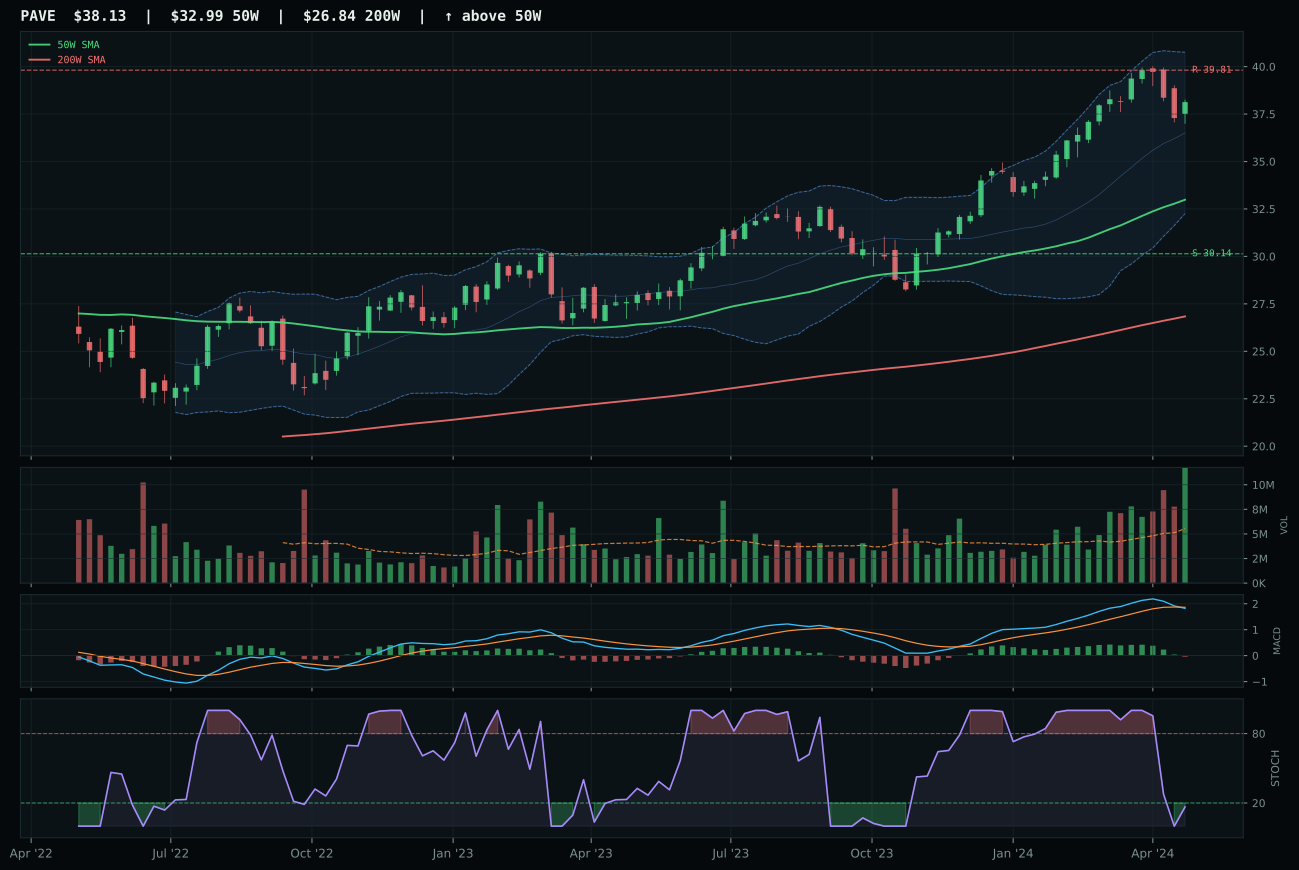
PAVE has a vertical extension profile with 7.2% 13-week relative strength versus SPY.
A failed hold above support would weaken the setup.
Actionable but governed by invalidation levels.
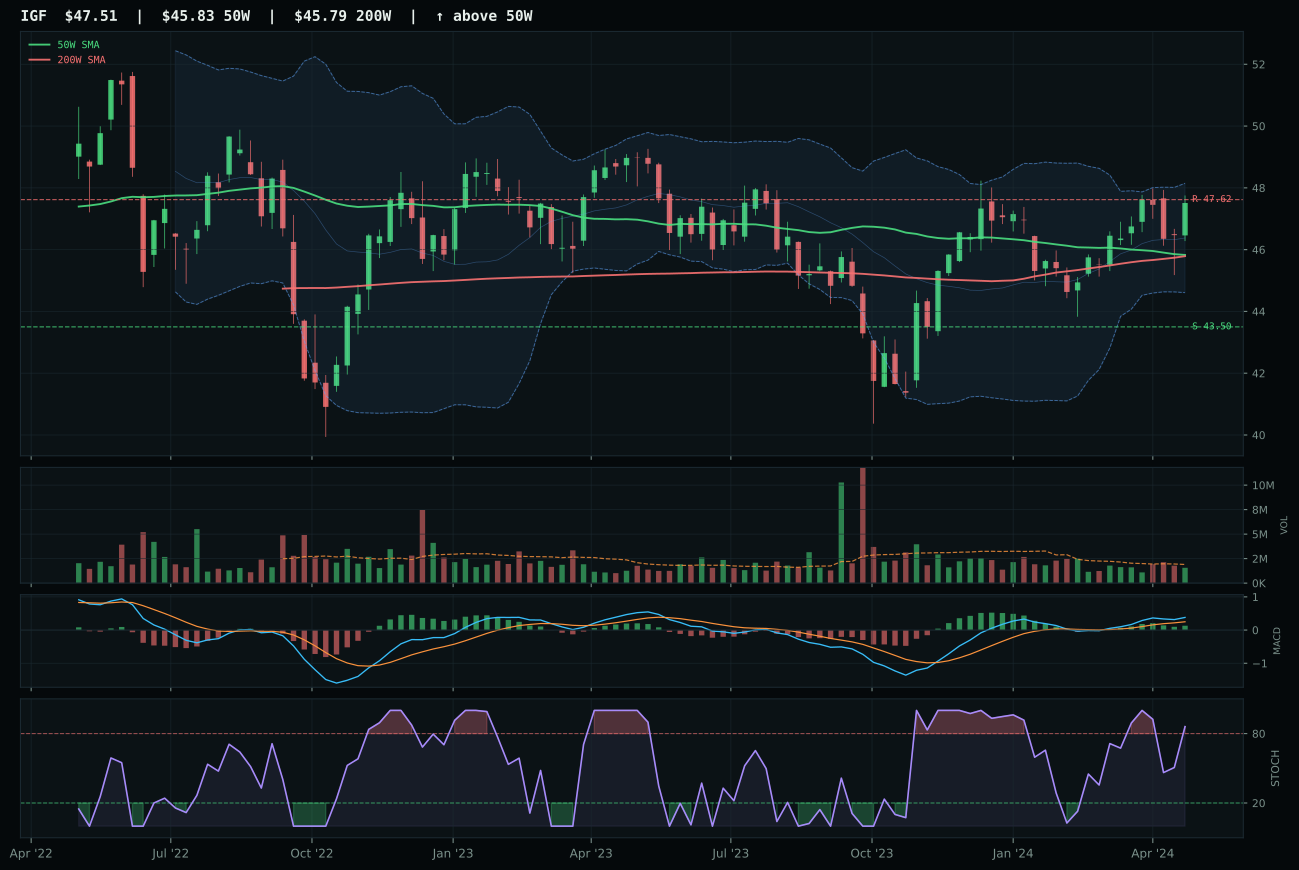
IGF has a neutral structure profile with -0.2% 13-week relative strength versus SPY.
A failed hold above support would weaken the setup.
Actionable but governed by invalidation levels.
XLU won Utilities & Infrastructure by claiming perfect 90.0 timing scores paired with 85.8 trend confirmation and overbought-momentum stochastic RSI at 1.00 in the value zone, proving defensive rotation demand was being accumulated at the exact moment when risk appetite was still sufficient to justify equity positioning over pure fixed income. The 75.2 structure score and 66.8 volume-price confirmation showed neutral participation throughout the move—not the aggressive sponsorship of growth names, but the steady institutional rotation that characterizes genuine defensive positioning. PAVE lost by 12.8 points despite 92.0 trend confirmation because it was extended 15.6% from the 50W into vertical extension territory, its timing score dropped to 48.0 due to MACD bearish-weakening, and stochastic RSI was oversold—technical deterioration that marked a late-stage entry rather than a constructive one. XLU was close to resistance at 0.0% upside, but the compressed risk-reward reflected fair pricing for a mature move with institutional demand, not a breakdown in the setup.
Utilities & Infrastructure scores 48.3 and earns a 5% allocation as the seventh-ranked category. The 59.0 macro fit is moderate (defensive rotation +12 points offset by inflation pressure -6 points), and the 78.3 technical evidence on XLU reflects solid but not exceptional quality. The positioning acknowledges that utilities offer meaningful defensive rotation exposure without the exceptional macro tailwinds that power precious metals and traditional energy. XLU's overbought status at resistance creates genuine mean-reversion risk that prevents a higher allocation—the setup has matured to the point where entries are being offered only at maximum extension. For Utilities to earn 5% allocation, either the price would need to consolidate and reset the overbought condition while holding above the 50-week, or the macro descriptor for broad market bear would need to strengthen further to provide additional defensive urgency. At 5%, this category provides practical diversification into the defensive narrative while respecting that the current entry risk is elevated relative to reward potential.
Defense & Aerospace — ITA
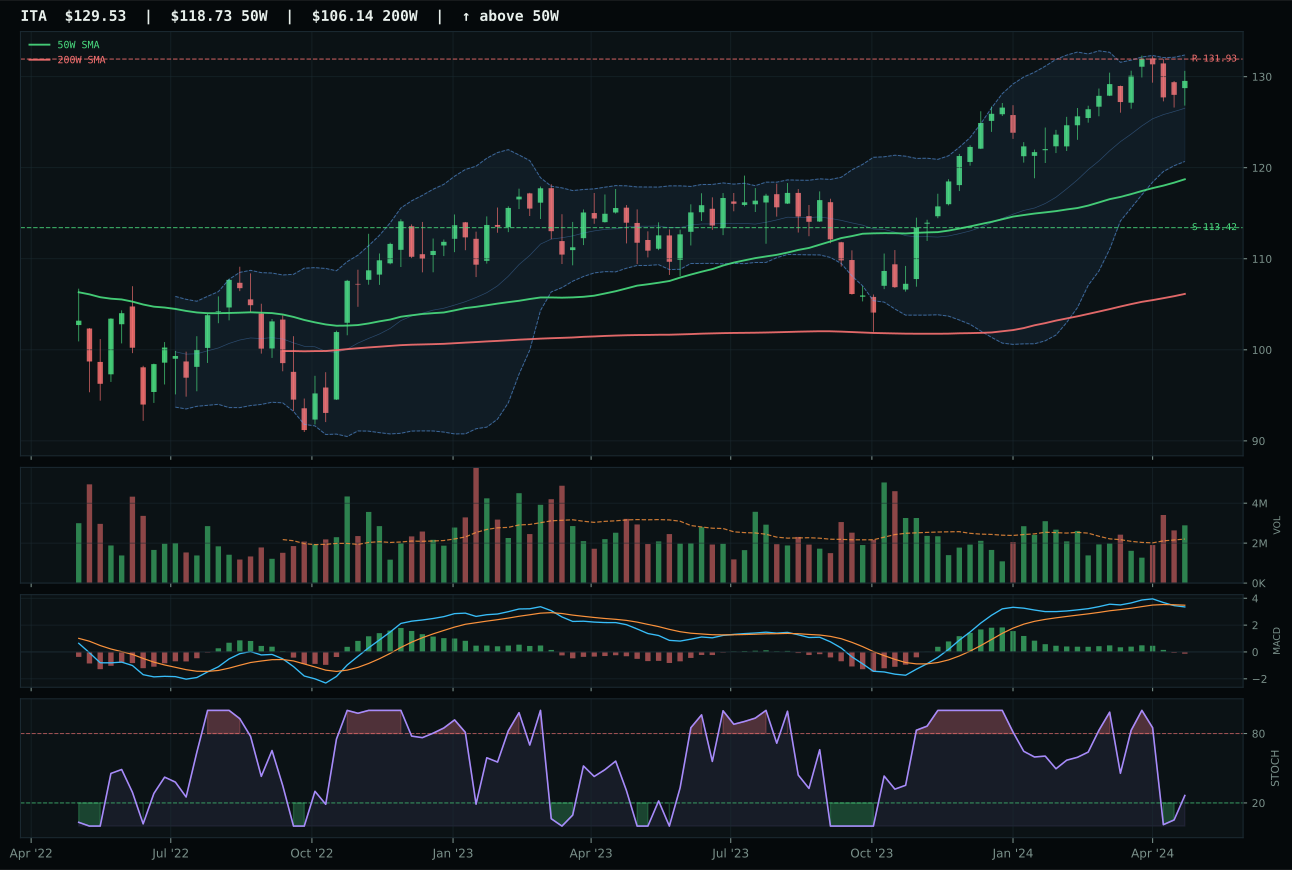
ITA has a neutral structure profile with 1.9% 13-week relative strength versus SPY.
A failed hold above support would weaken the setup.
Actionable but governed by invalidation levels.
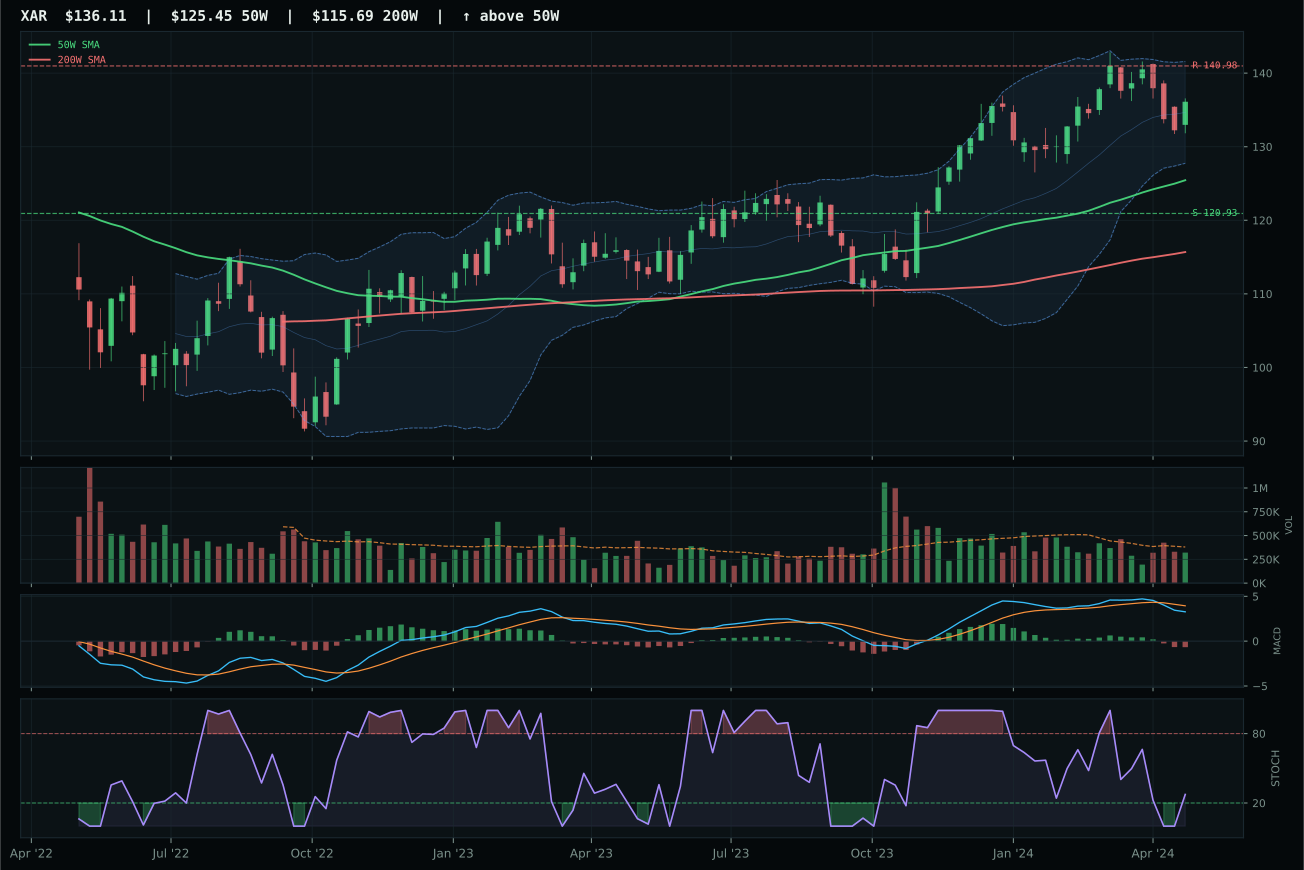
XAR has a neutral structure profile with 0.7% 13-week relative strength versus SPY.
A failed hold above support would weaken the setup.
Actionable but governed by invalidation levels.
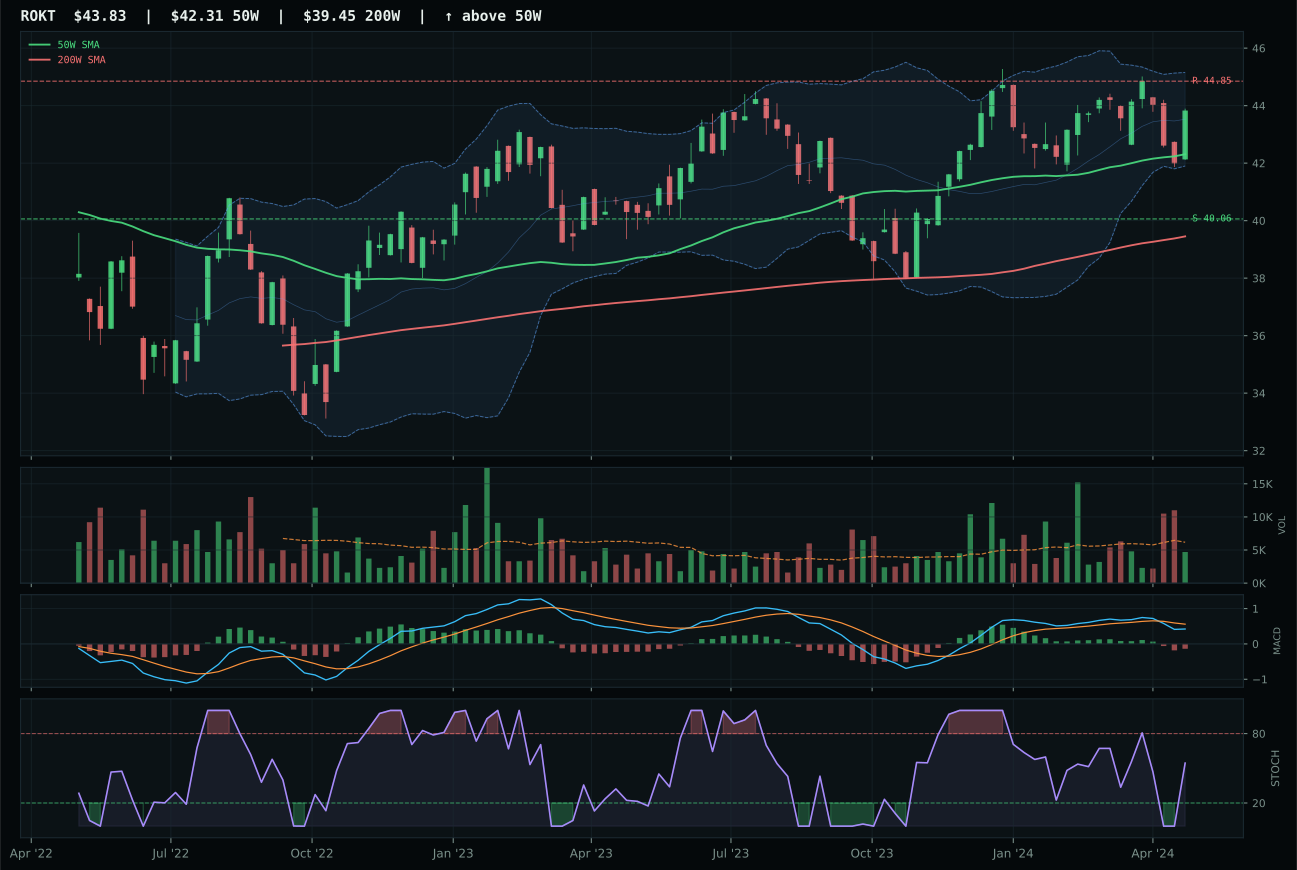
ROKT has a neutral structure profile with -1.5% 13-week relative strength versus SPY.
A failed hold above support would weaken the setup.
Tracked, but not top-2 eligible because: .
ITA won Defense & Aerospace by combining neutral structure with above-average participation (1.31x 20-week volume) and 1.2% category-relative strength, proving that defensive rotation demand was being genuinely accumulated rather than frontrun. The 84.8 trend score reflected price above both major moving averages with a non-deteriorating 50-week slope of 0.3%, while the 83.5 structure score—driven by 75.0 cleanliness and 87.9 compression—signaled a technical setup clean enough to sustain the move. Volume-price confirmation at 45.4 was modest but meaningful in the context of -1.8% four-week returns and 6.1% 13-week gains: buyers were defending rather than chasing, which favored the steadier thesis. XAR lost by just 1.0 point because its structure score (75.1) lagged and its rising mid-zone stochastic RSI lacked the falling-neutral precision of ITA's setup, while volume remained at neutral participation rather than accumulation.
Defense & Aerospace scores 44.1 and earns a 5% allocation as the fourth-ranked category. The 74.0 category-level macro fit—the highest in the entire portfolio after precious metals and traditional energy—combined with 47.0 technical evidence explains its traction despite not reaching top-2 status. Late-cycle reflation helps this exposure (+6), and defensive rotation is highly active (+8), creating a durable case for steady exposure. The positioning reflects a practical tension: the technical setup is sound but not stretched enough to attract aggressive capital, and XLE's energy dominance plus GLD's precious metals strength already fulfill the late-cycle defensive mandate more decisively. For ITA to earn a 10% slot, the relative strength would need to accelerate above 3.0% and the momentum confirmation score would need to rise above 47.2%. At 5%, this category provides meaningful diversification into the defense narrative without overweighting a setup that is clean but not compelling.
AI — SMH
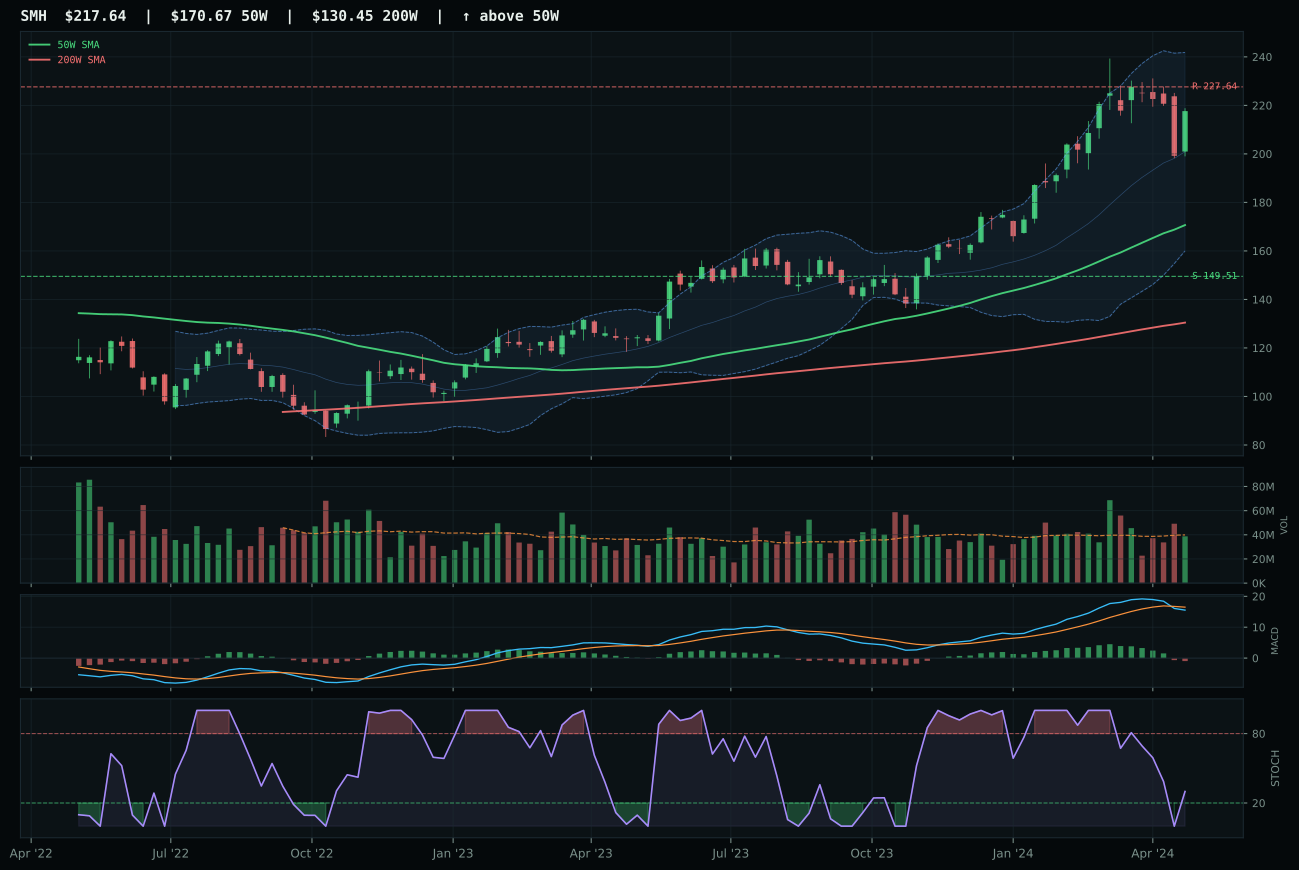
SMH has a vertical extension profile with 11.3% 13-week relative strength versus SPY.
A failed hold above support would weaken the setup.
Actionable but governed by invalidation levels.
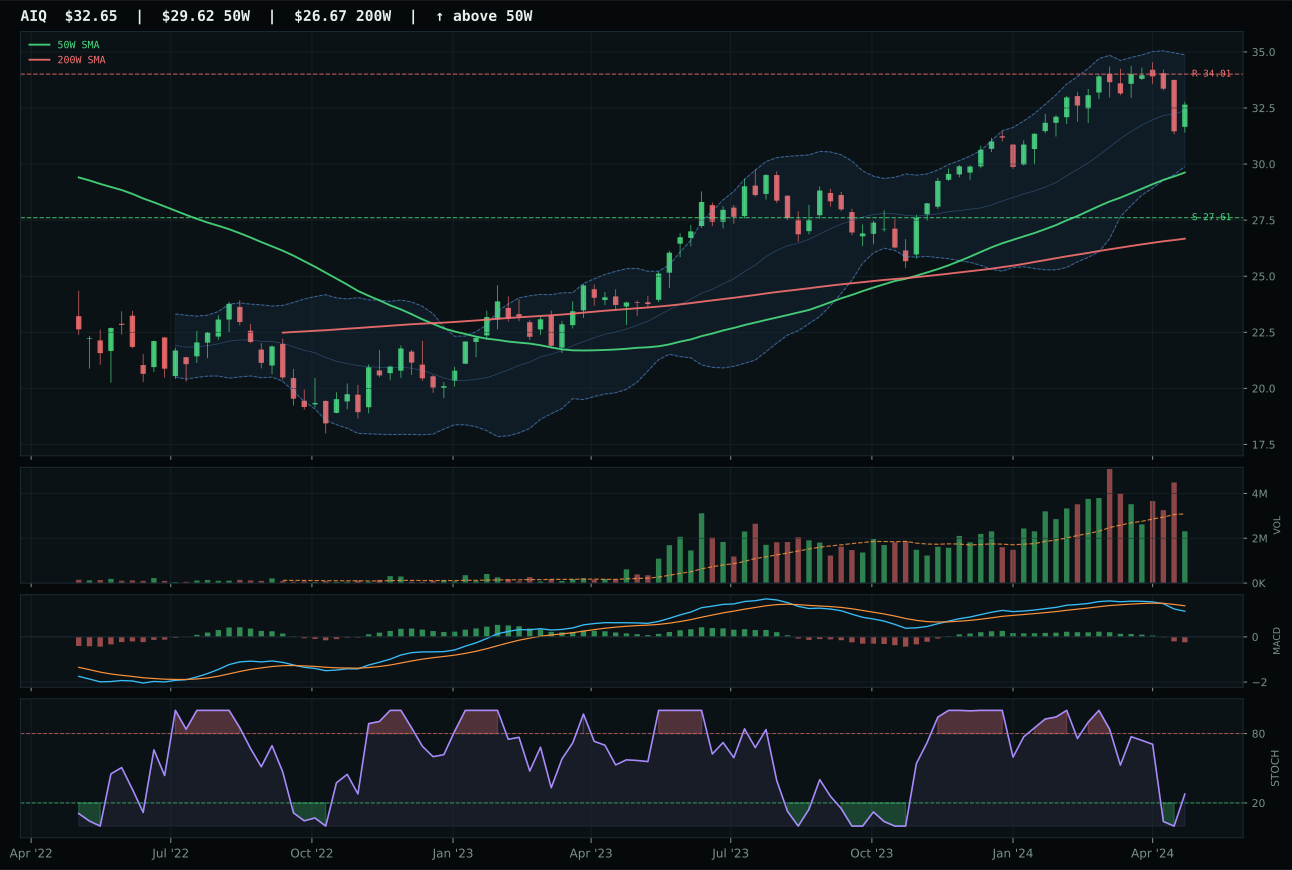
AIQ has a neutral structure profile with -1.7% 13-week relative strength versus SPY.
A failed hold above support would weaken the setup.
Actionable but governed by invalidation levels.
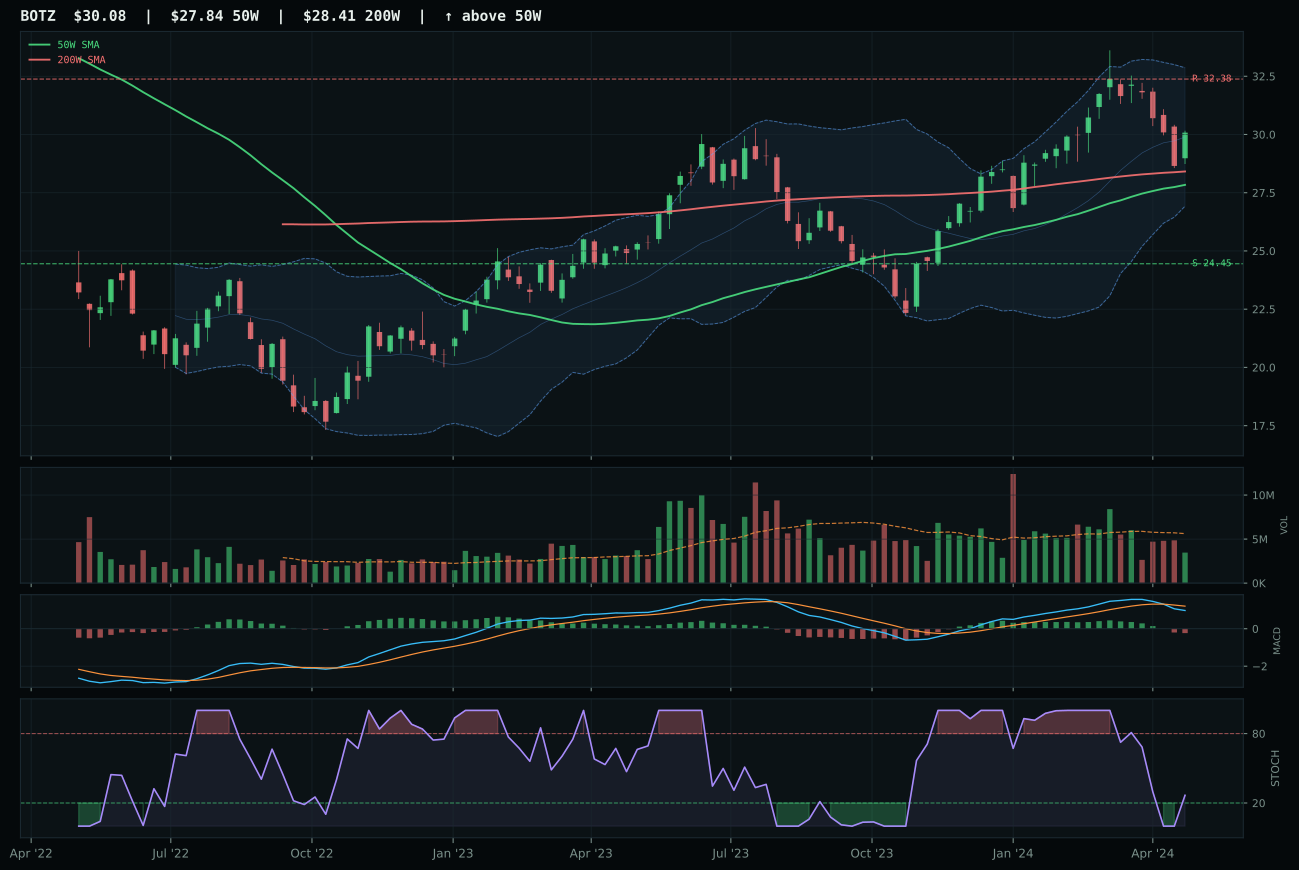
BOTZ has a neutral structure profile with -1.3% 13-week relative strength versus SPY.
A failed hold above support would weaken the setup.
Actionable but governed by invalidation levels.
SMH dominated AI because semiconductor leadership captured the full force of AI compute demand through a 12.6% category-relative strength advantage and 15.6% 13-week return, delivering momentum confirmation at 82.3 versus AIQ's 23.0 despite being extended 27.5% above the 50-week moving average. The vertical extension setup would normally penalize entry risk heavily, but volume-price confirmation at 60.6 and persistence at 60.9 proved buyers were still accumulating rather than exhausting, with above-average relative strength versus the category basket justifying the 4.5-point score gap over AIQ. MACD remained bearish-weakening across all three names, but SMH's falling-neutral stochastic RSI at 0.30 provided cleaner timing than AIQ's thin participation and weak breadth. The 92.0 trend score and 82.3 momentum confirmation reflected genuine sponsorship: this was not a tired short-squeeze but an extension into new demand, marked by positive 4-week returns despite negative 13-week category context.
AI scores 34.0 and earns a 5% allocation slot as the third-ranked category behind the two top-2 picks. The positioning reflects a legitimate case despite ranking outside the primary duo: SMH's 92.0% trend score and 15.6% 13-week return align with the 42.0 category-level macro fit, where AI growth sponsorship adds +14 points and risk appetite remains positive. However, the 48.0 timing score—driven by extreme 27.5% extension above the 50-week—creates real mean-reversion risk that prevents this category from claiming a top-2 slot. For AI to move into the 20% tier, either the extension needs to be worked off through consolidation near the 50-week, or the 13-week return needs to accelerate further to justify the entry risk. At current levels, 5% is the right size: enough exposure to the narrative without overweighting a stretched technical setup in an environment where liquidity stress is active (-12 points).
Agriculture & Livestock — WEAT
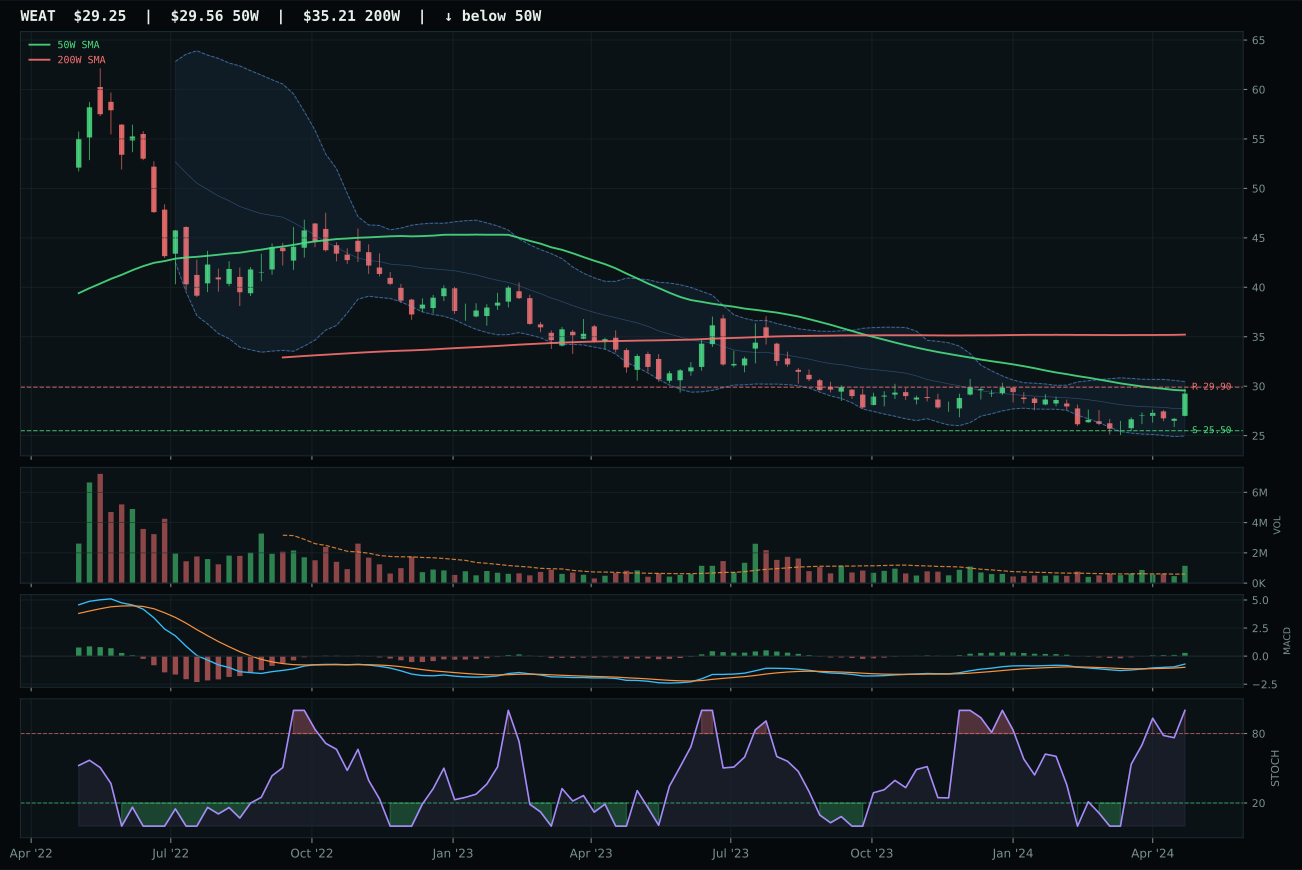
WEAT has a compression near 50W profile with -2.2% 13-week relative strength versus SPY.
Extension and support failure are the main tactical risks.
Tracked, but not top-2 eligible because: structurally broken.
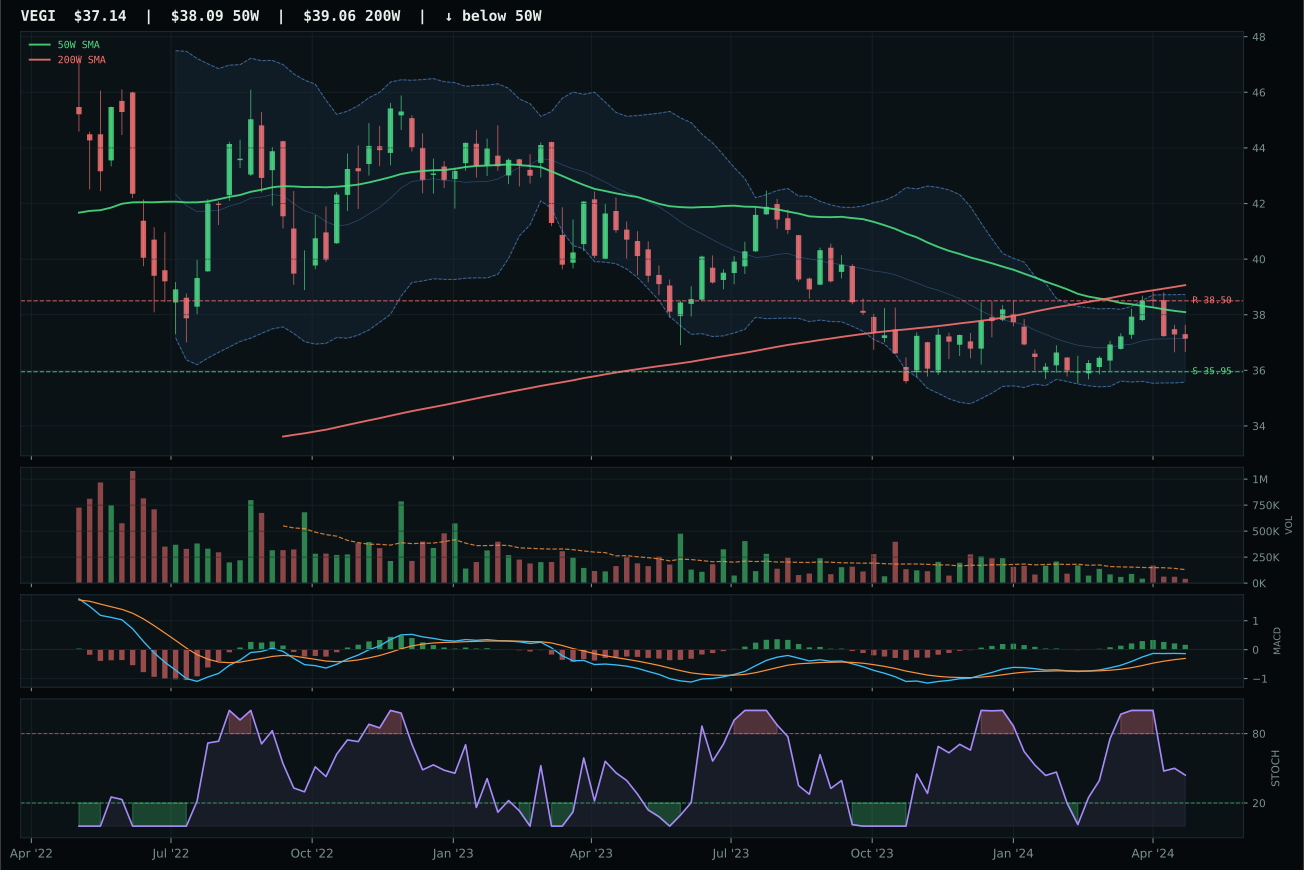
VEGI has a pullback into support profile with -1.5% 13-week relative strength versus SPY.
Extension and support failure are the main tactical risks.
Tracked, but not top-2 eligible because: structurally broken.
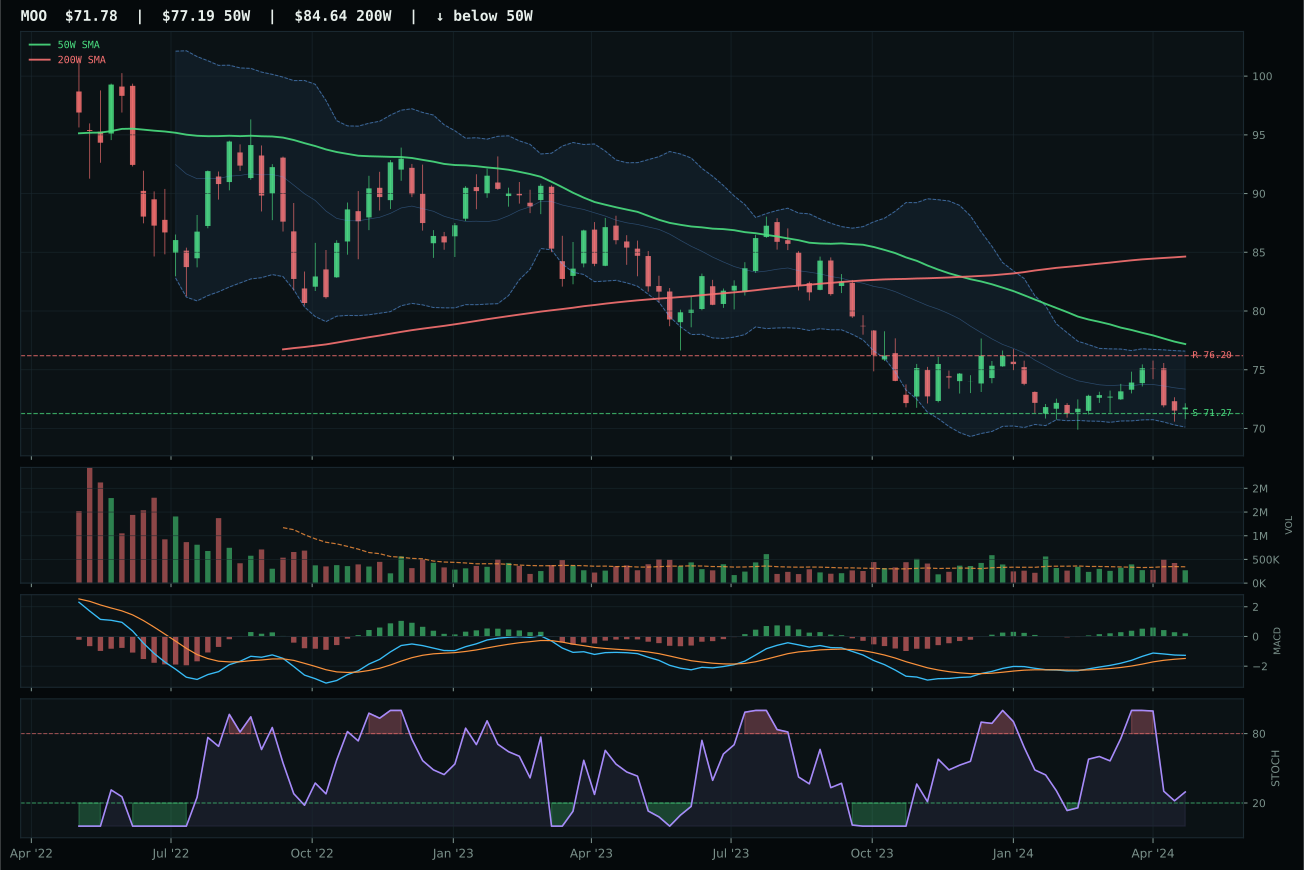
MOO has a pullback into support profile with -4.3% 13-week relative strength versus SPY.
Extension and support failure are the main tactical risks.
Tracked, but not top-2 eligible because: structurally broken.
WEAT won Agriculture & Livestock despite structurally broken chart conditions because its 100.0 timing score—driven by distance to the 50-week at just -1.1%, bullish-improving MACD, and overbought stochastic RSI reading at 1.00 in the deep retracement zone—captured the exact moment of reversal potential that the category offered. Compression near the 50-week at 44.6 structure score and heavy volume accumulation at 1.92x the 20-week average proved institutional buyers were defending support rather than selling into rallies, generating 82.8 momentum confirmation despite price action below trend. VEGI lost by 26.2 points because its setup was pullback-into-support rather than compression-near-moving-average, MACD was bullish-but-flattening rather than bullish-improving, and stochastic timing scored 95.0 rather than 100.0—minor technical degradation that compounded across the scoring framework. The hard filter that rendered WEAT ineligible for top-2 consideration was structural: the chart was genuinely broken with price below both the 50W and 200W, limiting its appeal as a top-priority allocation despite tactically clean entry signals.
Agriculture & Livestock scores 33.9 but receives zero allocation due to an ineligible hard-filter designation (structurally broken category). Despite the 90.0 macro fit—driven by supply shortage (+13), inflation pressure (+10), and real asset sponsorship (+8)—the technical evidence floor of 42.0 fails the composite eligibility gate. The three-ETF basket (MOO, VEGI, WEAT) all tied at 42.0 technical evidence, signaling that no clear leader exists to carry the macro tailwinds. WEAT's perfect timing cannot override the fact that it sits below both the 50-week and 200-week moving averages, a structural flaw that disqualifies it from serious allocation in a late-cycle environment. The category offers tactical hedging appeal if inflation surprises accelerate, but the current technical disrepair—no ETF above key moving averages, all with stalled momentum—makes it unsuitable for the 5% minimum allocation. For Agriculture to earn portfolio weight, either price needs to reclaim the 50-week with volume confirmation, or macro tailwinds need to accelerate so dramatically that they overcome the technical break.
Technology — CIBR
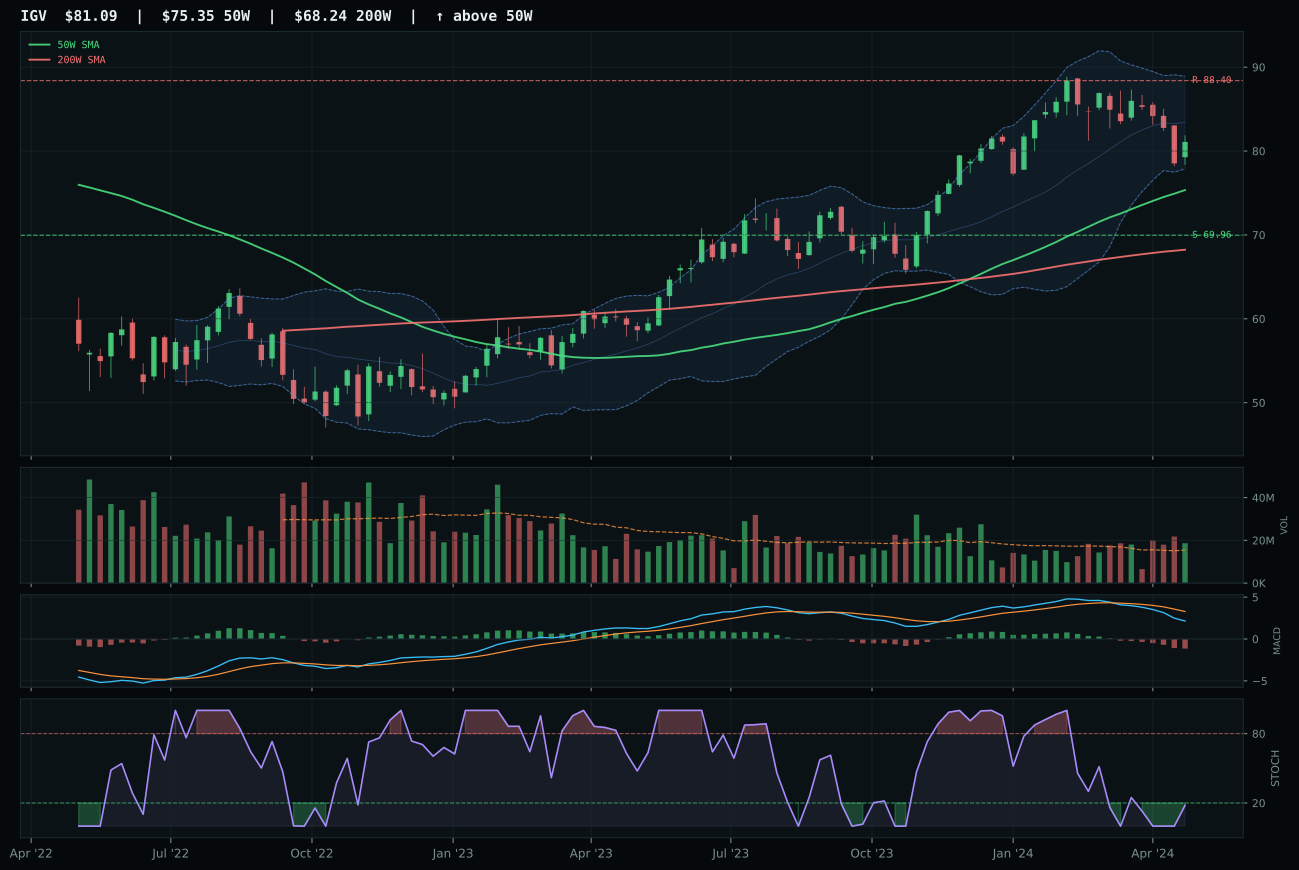
IGV has a neutral structure profile with -8.5% 13-week relative strength versus SPY.
A failed hold above support would weaken the setup.
Actionable but governed by invalidation levels.
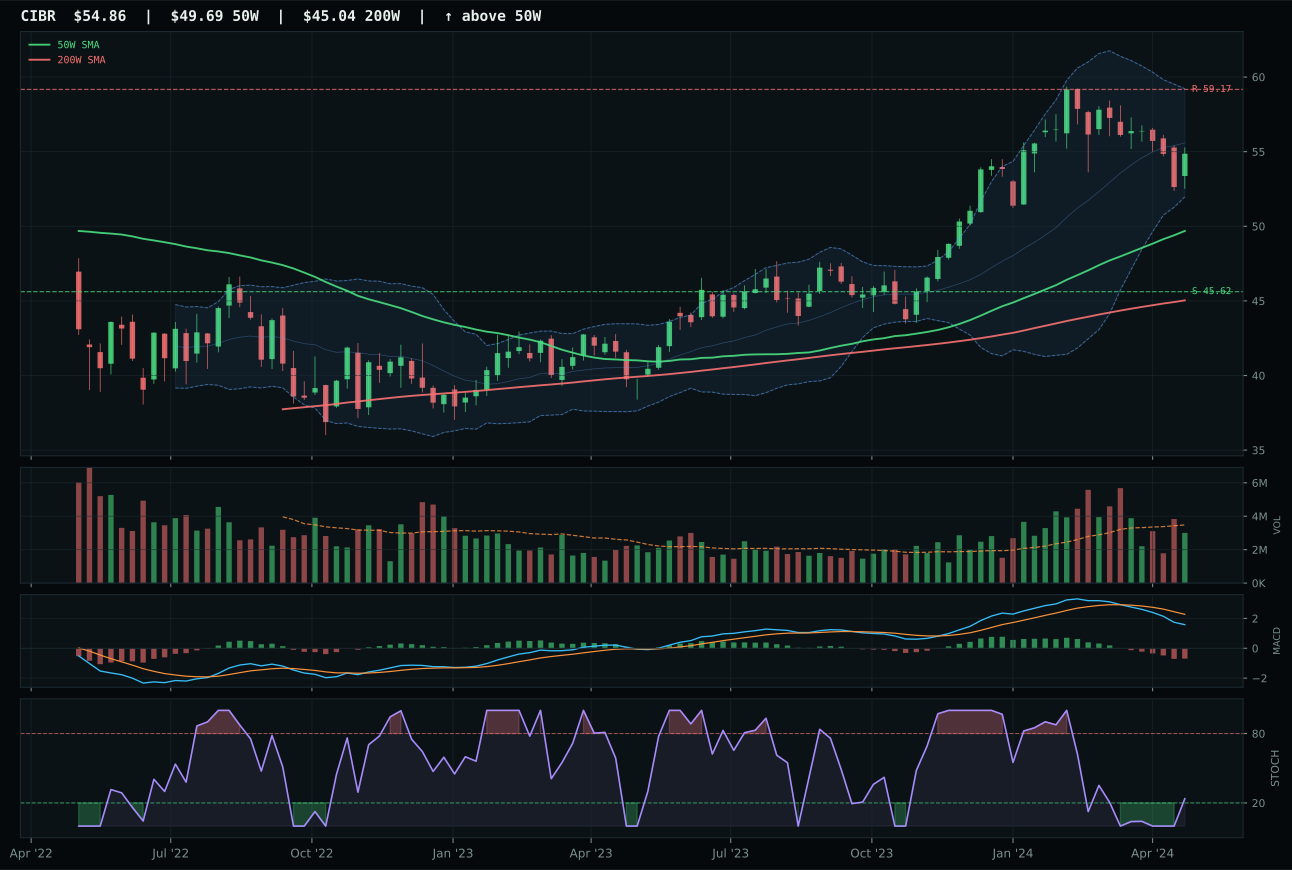
CIBR has a neutral structure profile with -7.0% 13-week relative strength versus SPY.
A failed hold above support would weaken the setup.
Actionable but governed by invalidation levels.
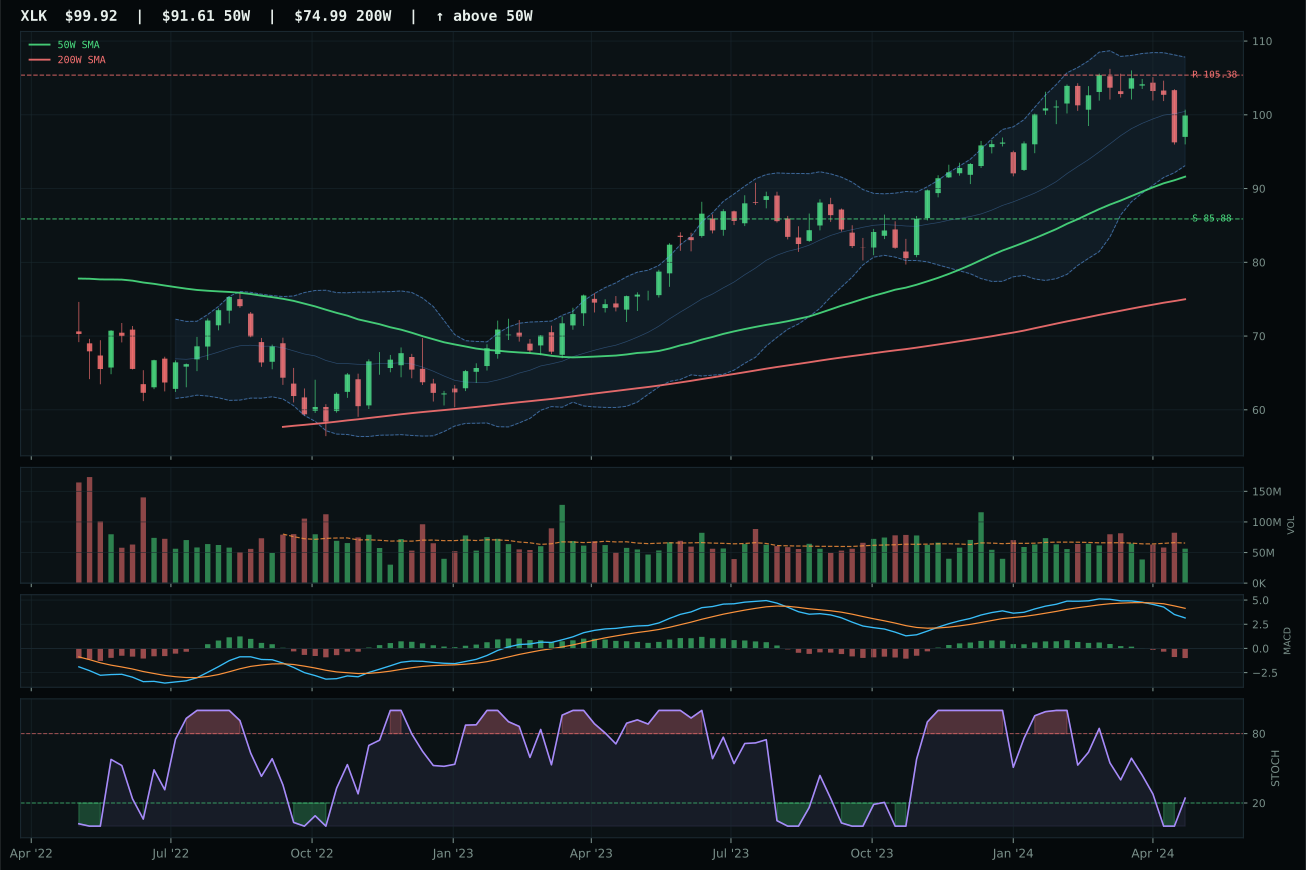
XLK has a neutral structure profile with -5.2% 13-week relative strength versus SPY.
A failed hold above support would weaken the setup.
Actionable but governed by invalidation levels.
CIBR won the category by holding price above both the 50-week and 200-week moving averages with neutral volume confirmation, edging IGV on relative strength parity and timing discipline. The cybersecurity thesis carried a 0.0% category-relative strength advantage over IGV's -1.5%, while CIBR's stochastic RSI sat in the rising mid-zone compared to IGV's less favorable oversold turn-up—a technical nuance that favored the cleaner entry setup. Both carried the same bearish-weakening MACD, but CIBR's neutral volume participation and tighter 50-week proximity (10.4% vs IGV's implied stretch) made it the defensive representative in a regime where liquidity stress and credit conditions were actively penalizing duration. The 71.5 trend score reflects price structure remaining intact despite a negative 13-week return of -2.7%, preserving the category's right to a 10% allocation slot rather than zero weight.
Technology ranks ninth among the ten categories this week and receives zero allocation as a result. The 28.5 composite score suffers from -7.0% relative strength versus SPY and only 16.7% momentum confirmation—a deadly combination in late-cycle reflation when defensive rotation and broad-market bear signals are active. Credit stress and liquidity stress headwinds subtract 17 points from category-level macro fit, leaving the 39.0 macro reading unable to offset the 41.0 technical evidence floor. For Technology to earn a 5% slot, it would need either meaningful positive category-relative strength (currently zero for the winner) or momentum confirmation above 40%, neither of which is present. The macro regime actively penalizes growth exposure that lacks relative strength, and this category fails that test decisively.
Emerging Markets — IEMG
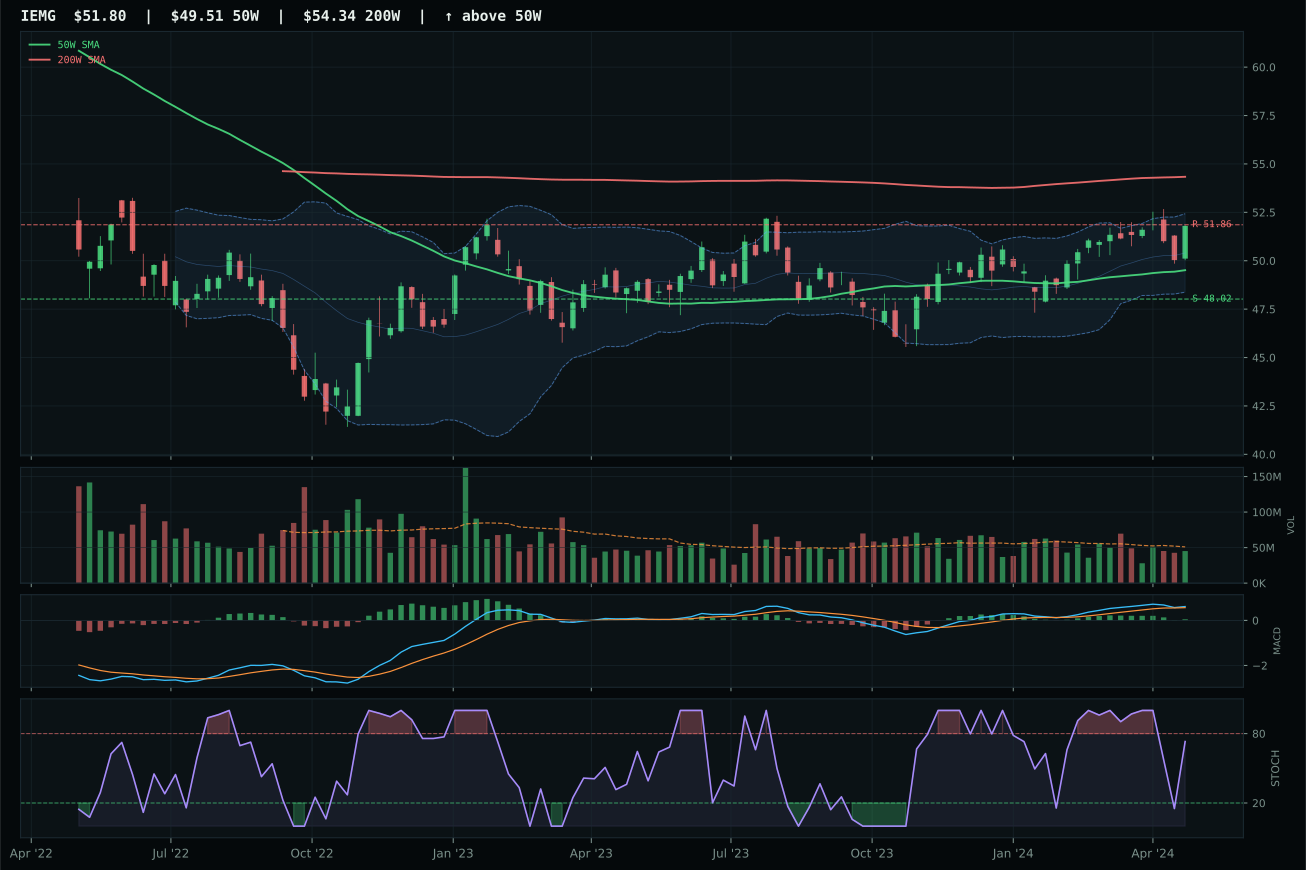
IEMG has a neutral structure profile with 1.5% 13-week relative strength versus SPY.
A failed hold above support would weaken the setup.
Actionable but governed by invalidation levels.
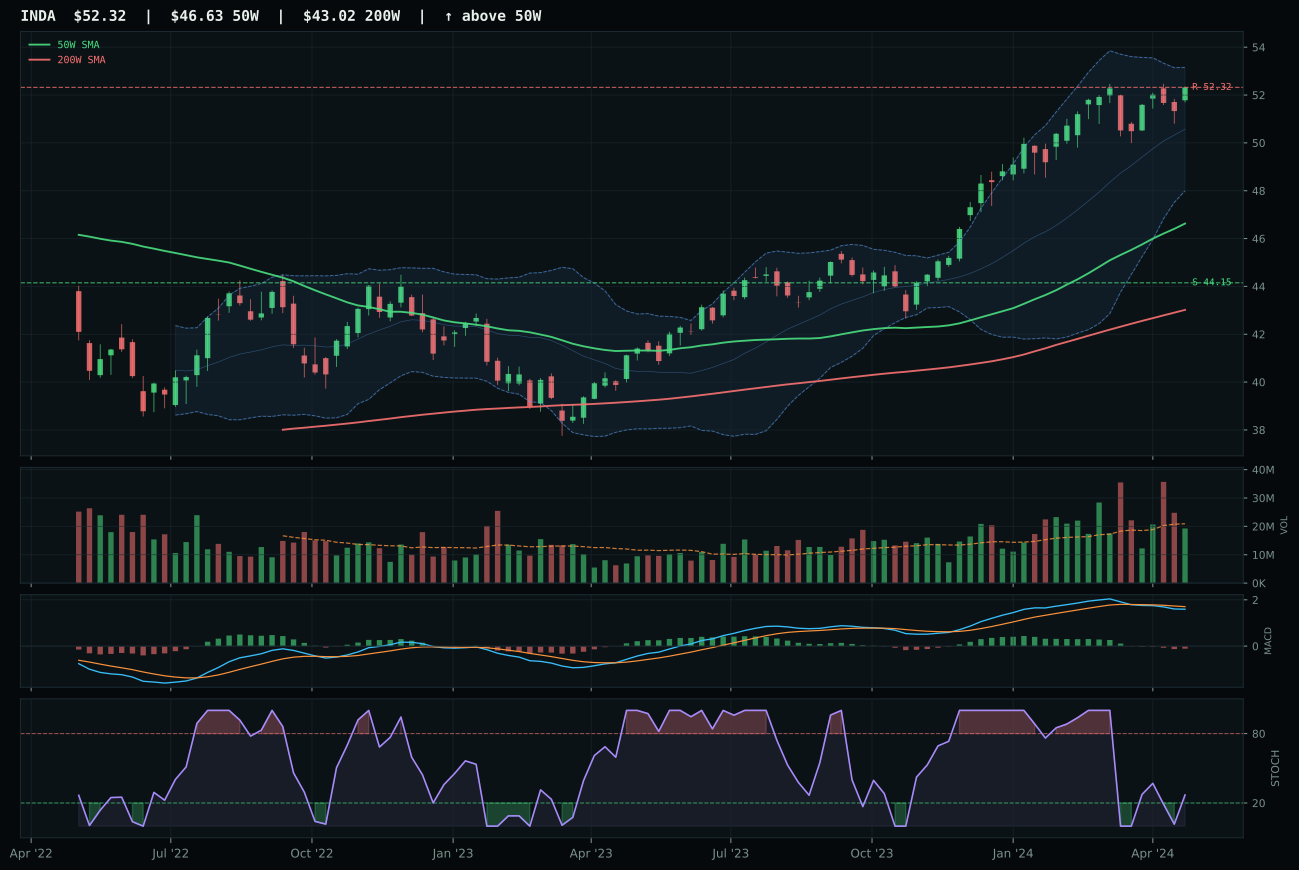
INDA has a neutral structure profile with 2.1% 13-week relative strength versus SPY.
A failed hold above support would weaken the setup.
Actionable but governed by invalidation levels.
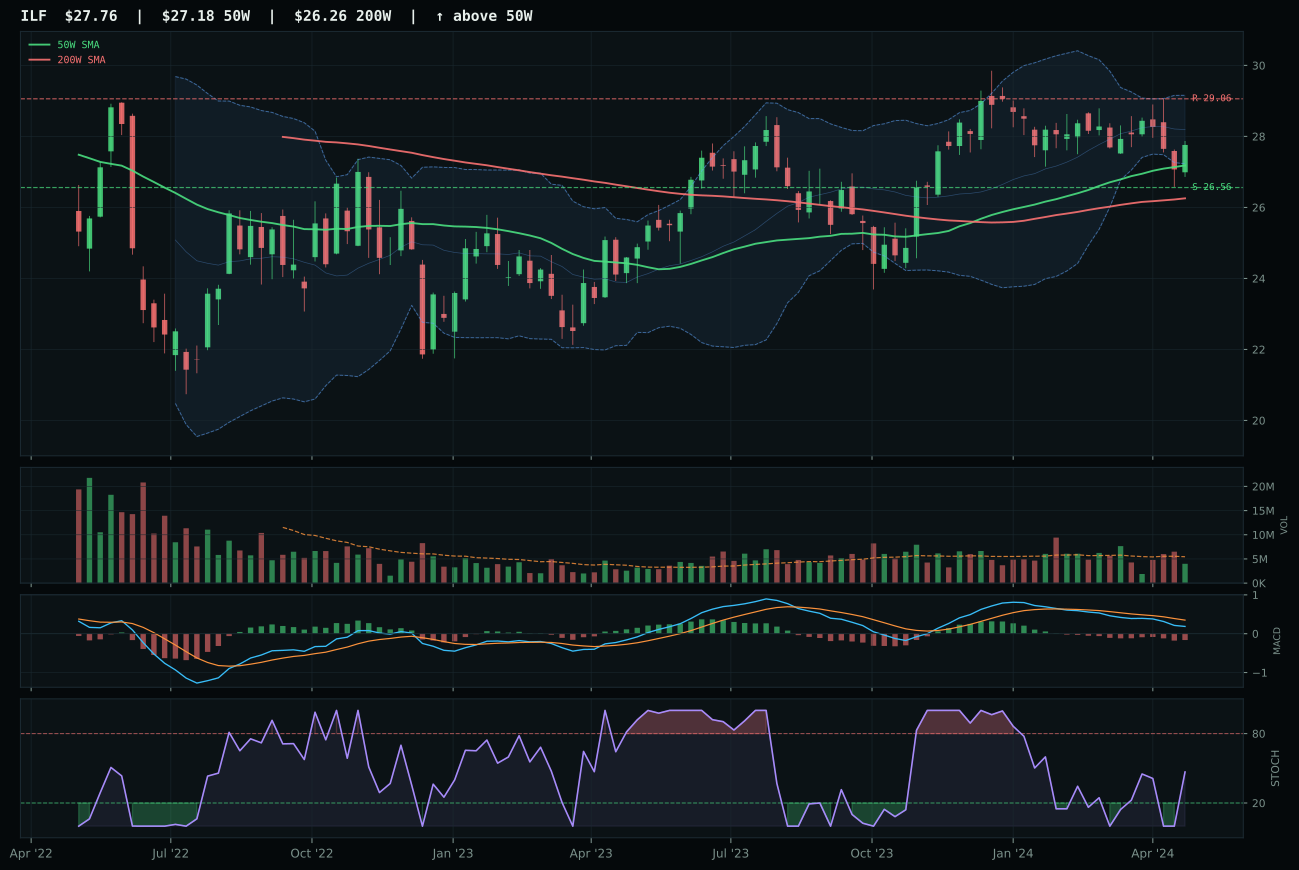
ILF has a pullback into support profile with -5.8% 13-week relative strength versus SPY.
A failed hold above support would weaken the setup.
Actionable but governed by invalidation levels.
IEMG won Emerging Markets through superior timing (85.0 vs INDA's 62.0) and MACD confirmation (bullish-but-flattening vs INDA's bearish-weakening), capturing broad emerging-market beta at the most constructive entry point despite being extended only 4.6% from the 50-week moving average. The 88.2 trend score reflected price above the 50W but below the 200W—a recoverable setup rather than a confirmed new trend, but one that IEMG held with 1.5% SPY-relative strength and genuine breadth confirmation through 0.89x neutral volume. The 7-point margin over INDA reflected precise entry timing: IEMG was closer to support, showing less overextension, while INDA had run 12.2% from the 50W into near-52W-high territory, creating timing risk precisely where risk-reward was already compressed to 45.3. IEMG's 65.2 persistence score proved the move was consolidating rather than exhausting, offering a clean entry relative to market dynamics.
Emerging Markets scores 15.3 and receives zero allocation this week, ranking ninth among ten categories. The 30.0 category-level macro fit is the lowest in the portfolio, dragged down by dollar pressure (-10 points), credit stress (-10 points), and liquidity stress (-10 points)—a toxic combination for currency-sensitive emerging assets in a late-cycle regime. Even IEMG's respectable 67.8 technical evidence cannot overcome the headwind when macro fit is cut by more than half. For Emerging Markets to earn a 5% allocation, either the dollar-pressure active descriptor would need to reverse, or the category's technical evidence would need to reach 85%+ with genuine momentum confirmation above 70%—currently IEMG shows only 65.5% momentum confirmation despite the benign timing score. The late-cycle reflation regime is inherently dollar-supportive and China-skeptical, making this category structurally disadvantaged. Emerging markets can re-enter the portfolio only after either a sustained dollar weakness signal or a breakthrough in Chinese fiscal stimulus that is credible enough to reverse the credit stress signal.