
2024-04-19
Informational purposes only. The content in this report, including allocations, analysis, and commentary, is provided solely for informational and educational purposes. It does not constitute financial advice, investment advice, trading advice, or any other type of advice. Past performance does not guarantee future results. Always conduct your own research and consult a qualified financial professional before making investment decisions.
Weekly Allocation
| Ticker | Category | Weight | Role |
|---|---|---|---|
| FBTC | 50% | Overlay | |
| XLE | Traditional Energy | 10% | Top-2 (10%) |
| GLD | Precious Metals | 10% | Top-2 (10%) |
| XLU | Utilities & Infrastructure | 5% | Tier-2 (5%) |
| NLR | Nuclear Energy | 5% | Tier-2 (5%) |
| COPX | Industrial Metals | 5% | Tier-2 (5%) |
| ITA | Defense & Aerospace | 5% | Tier-2 (5%) |
| WEAT | Agriculture & Livestock | 5% | Tier-2 (5%) |
| AIQ | AI | 5% | Tier-2 (5%) |
Trade Instructions — Monday Open
Sell the tranche from 2024-03-22 (completing its 4-week hold). Buy the new tranche. Instructions show net portfolio changes — same-asset positions cancel, weight changes show the delta.
| Action | Ticker | Instruction |
|---|---|---|
| SELL | PAVE | Sell entire PAVE position (2.50% of portfolio) |
| SELL | SMH | Sell 50% of SMH position (reduce 2.50% → 1.25%) |
| SELL | SLV | Sell entire SLV position (1.25% of portfolio) |
| SELL | XAR | Sell entire XAR position (1.25% of portfolio) |
| SELL | XLK | Sell 50% of XLK position (reduce 2.50% → 1.25%) |
| BUY | ITA | Buy ITA — 16.67% of freed cash (adds 1.25% to portfolio) |
| BUY | XLU | Buy XLU — 16.67% of freed cash (adds 1.25% to portfolio) |
| BUY | GLD | Buy GLD — 33.33% of freed cash (adds 2.50% to portfolio) |
| BUY | AIQ | Buy AIQ — 16.67% of freed cash (adds 1.25% to portfolio) |
| BUY | WEAT | Buy WEAT — 16.67% of freed cash (adds 1.25% to portfolio) |
Current Portfolio After Trade
Combined holdings across all 4 active tranches. Each tranche is 25% of the portfolio.
| Ticker | % of Portfolio | Weight Bar |
|---|---|---|
| FBTC | 50.00% | |
| XLE | 10.00% | |
| GLD | 8.75% | |
| COPX | 5.00% | |
| ITA | 5.00% | |
| XLU | 5.00% | |
| AIQ | 3.75% | |
| URA | 2.50% | |
| URNM | 2.50% | |
| WEAT | 2.50% | |
| SMH | 1.25% | |
| XLK | 1.25% | |
| MOO | 1.25% | |
| NLR | 1.25% |
Macro Regime — Late-Cycle Reflation
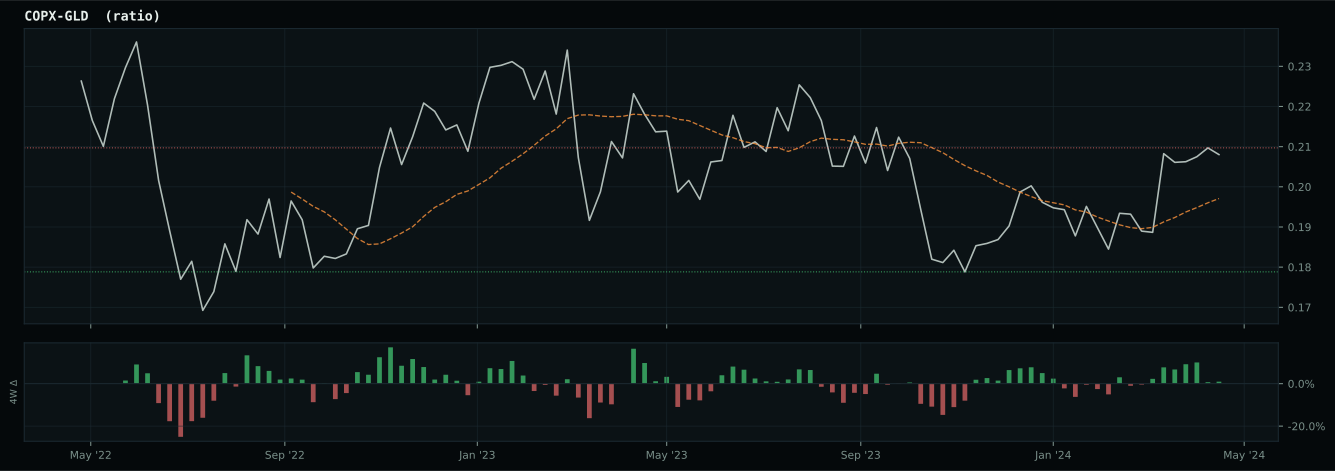
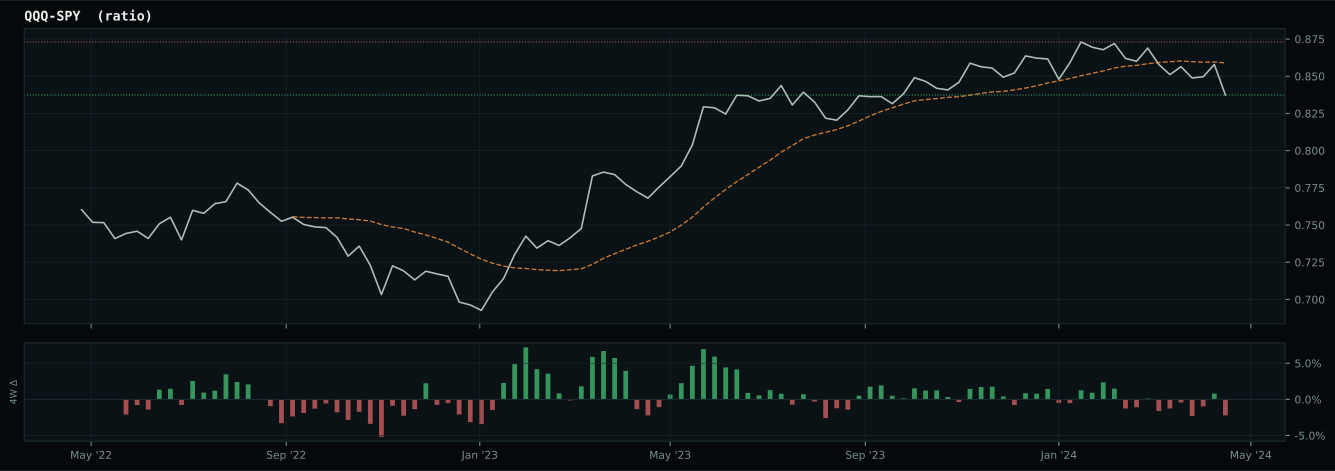
Macro Evidence Charts
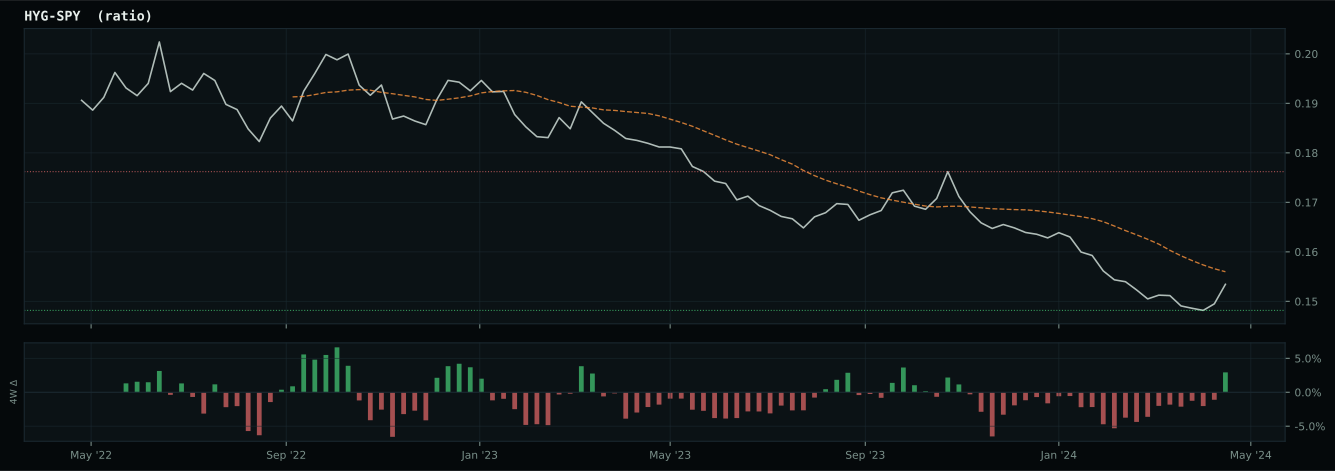
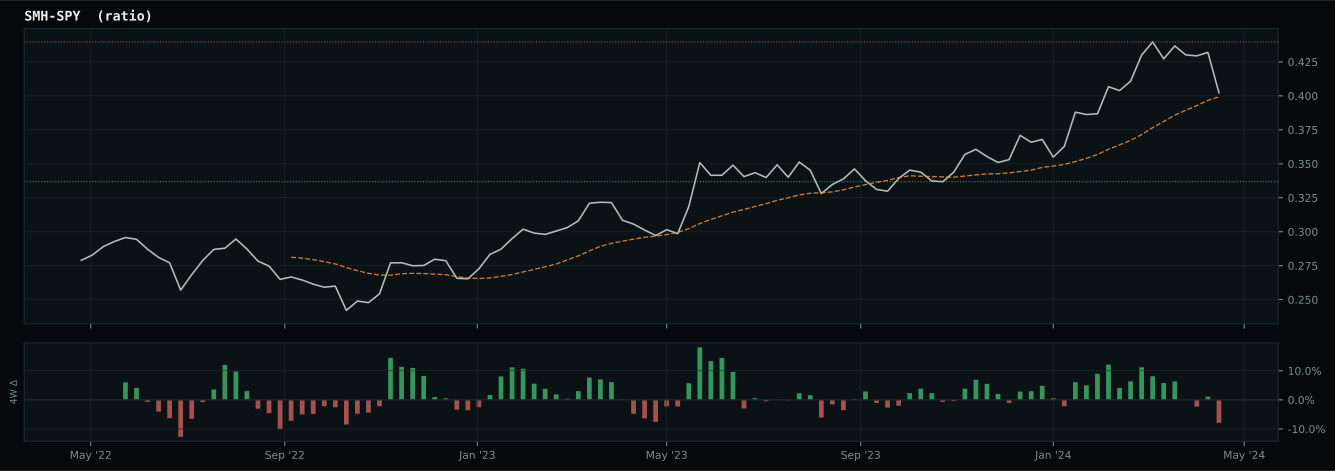
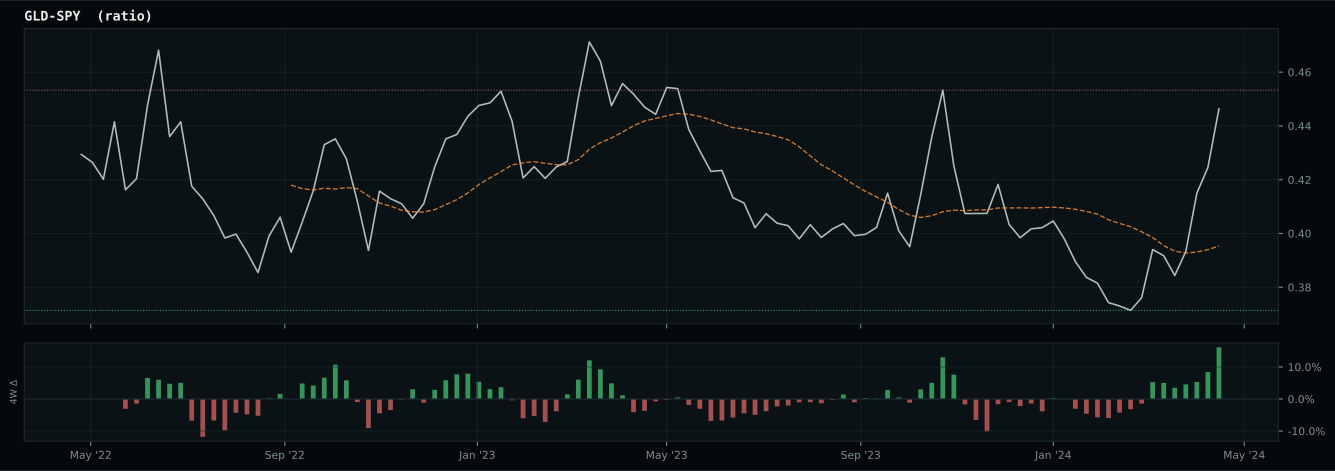
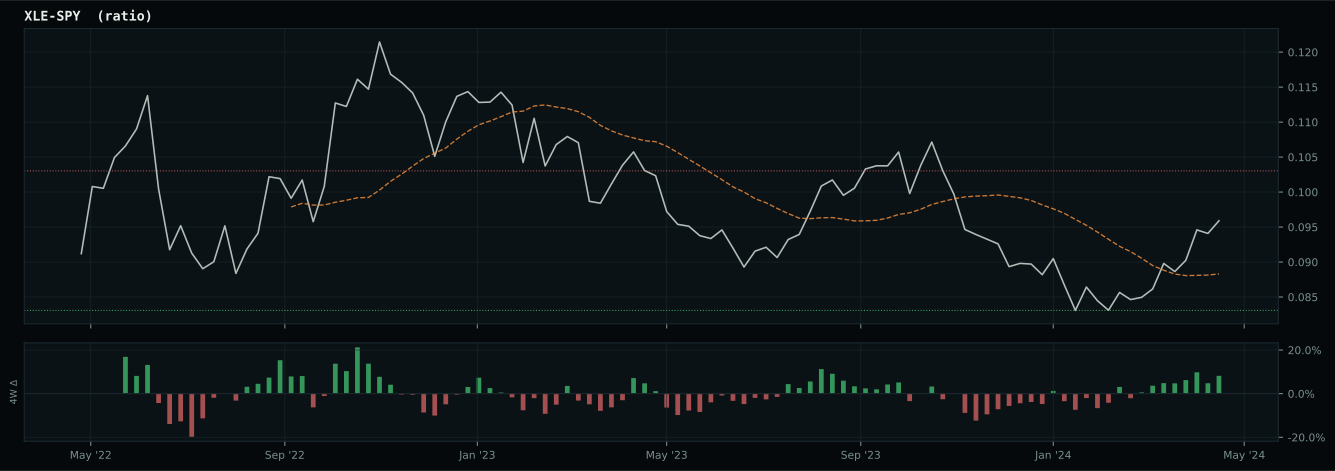
Market-implied signals behind the macro regime scores. Each ratio compares two assets; the direction and slope of the ratio is what the macro engine reads.
Crypto Regime — TrendBTC
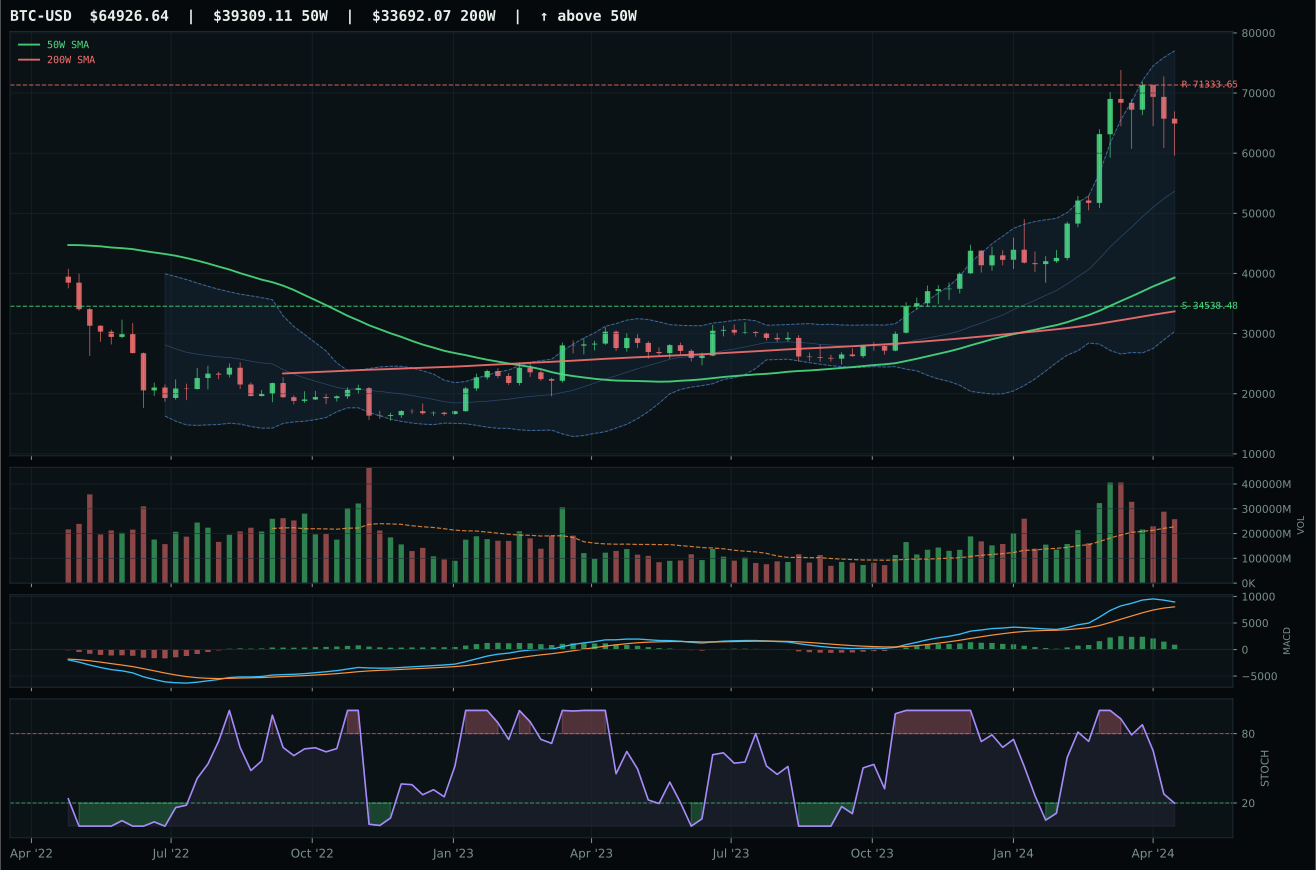
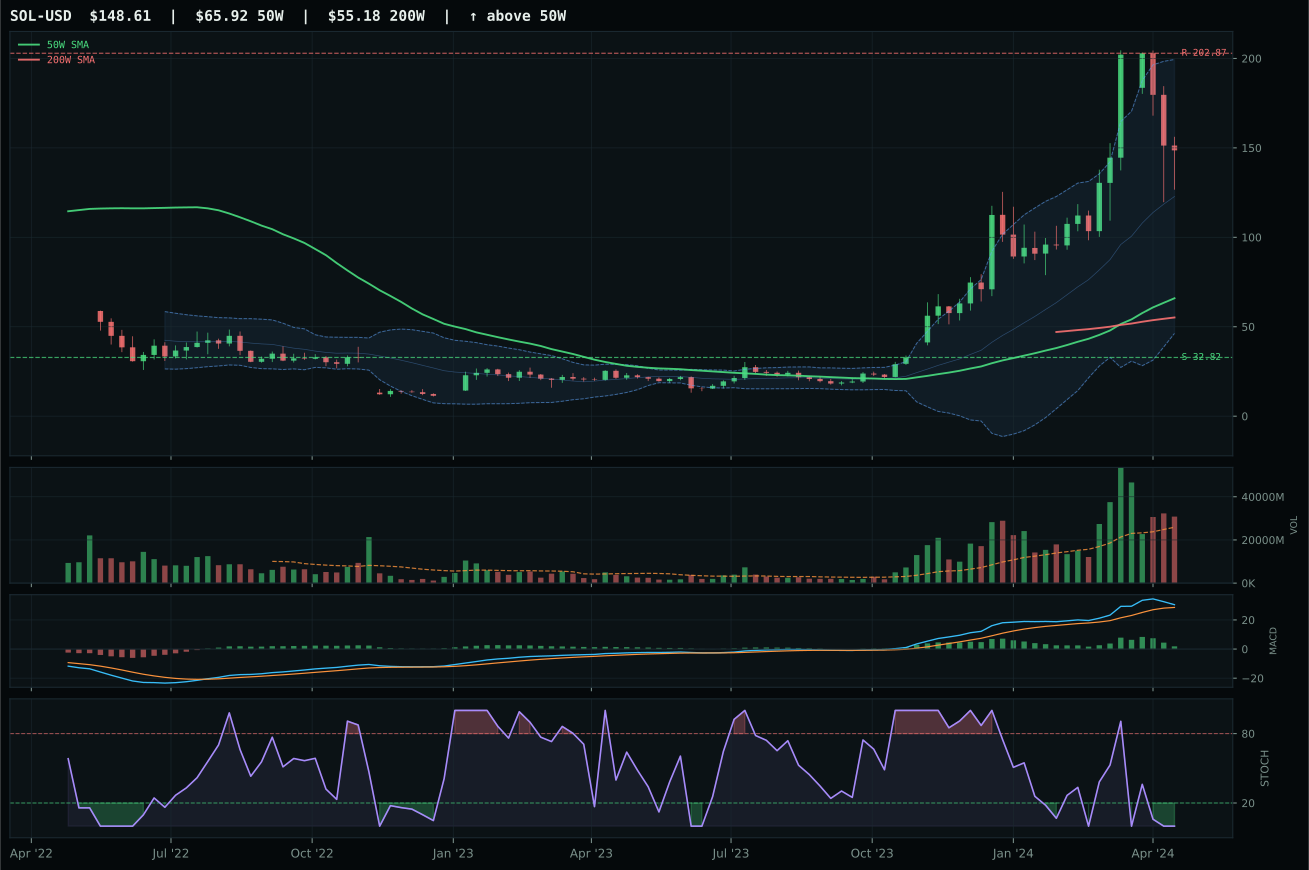
post-touch structure is too wide to count as a range; max/min close ratio is 3.22
TrendBTC confirmed: 2 consecutive closes above rising/flat 50W SMA
one or more available conditions failed
Category Rankings
| Rank | Category | Winner | Score | Alloc | 4W Ret | Peers (4W) |
|---|---|---|---|---|---|---|
| 1 | Traditional Energy | XLE | 86.0 | 20% | +0.56% | FCG +1.3% · XOP -0.2% |
| 2 | Precious Metals | GLD | 83.5 | 20% | +3.44% | SLV +16.0% · GDX +13.3% |
| 3 | Utilities & Infrastructure | XLU | 59.0 | 10% | +10.74% | IGF +9.1% · PAVE +4.0% |
| 4 | Nuclear Energy | NLR | 54.5 | 10% | +15.65% | URA +14.5% · URNM +17.5% |
| 5 | Industrial Metals | COPX | 49.2 | 10% | +14.46% | PICK +8.2% · REMX +15.2% |
| 6 | Defense & Aerospace | ITA | 38.6 | 10% | +5.45% | XAR +8.1% · ROKT +8.6% |
| 7 | Agriculture & Livestock | WEAT | 32.6 | 10% | +15.00% | VEGI +1.6% · MOO +3.8% |
| 8 | AI | AIQ | 27.4 | 10% | +8.43% | SMH +15.2% · BOTZ +9.7% |
| 9 | Technology | CIBR | 22.1 | 0% | +4.82% | XLK +9.3% · IGV +6.4% |
| 10 | Emerging Markets | IEMG | 8.8 | 0% | +9.08% | INDA +2.6% · ILF +5.2% |
Traditional Energy — XLE
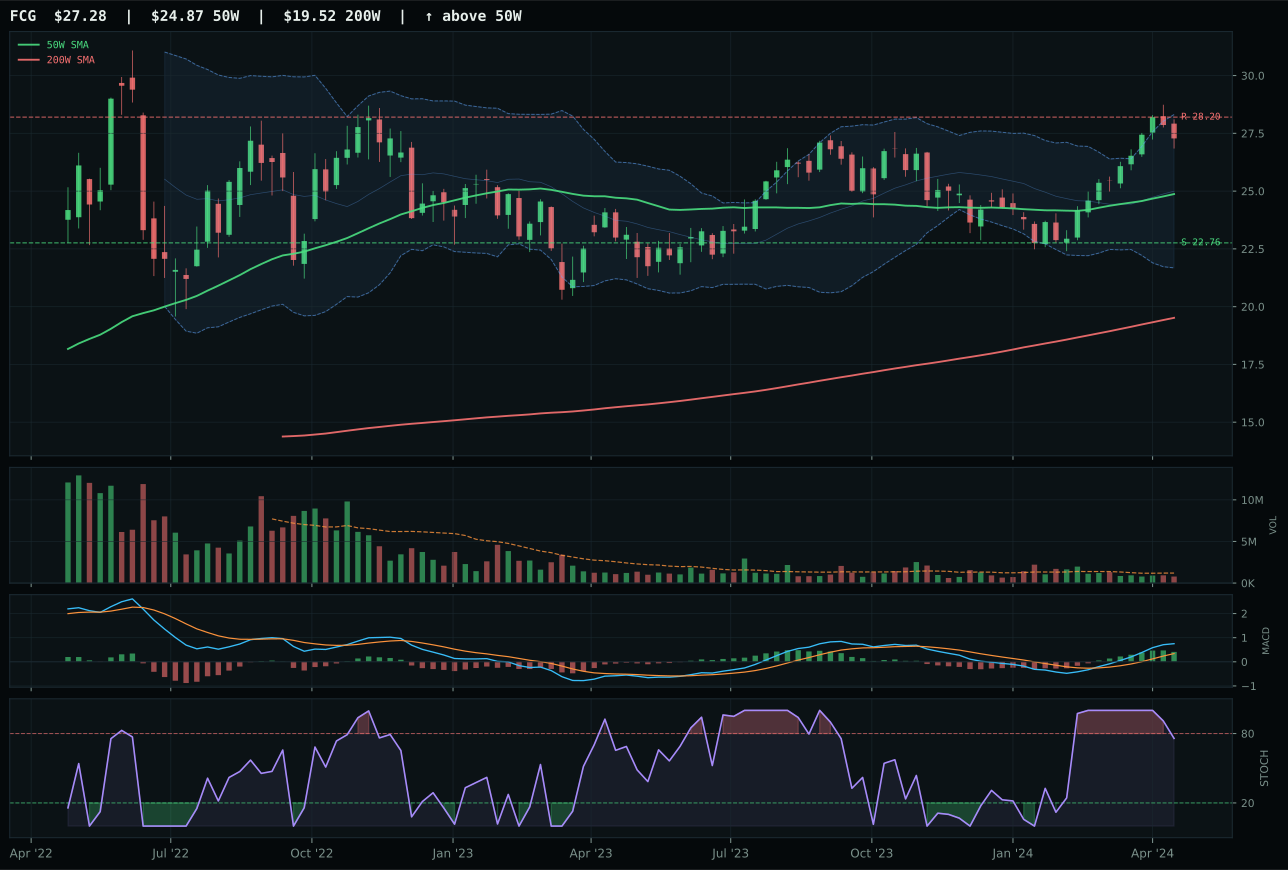
FCG has a neutral structure profile with 17.2% 13-week relative strength versus SPY.
A failed hold above support would weaken the setup.
Actionable but governed by invalidation levels.
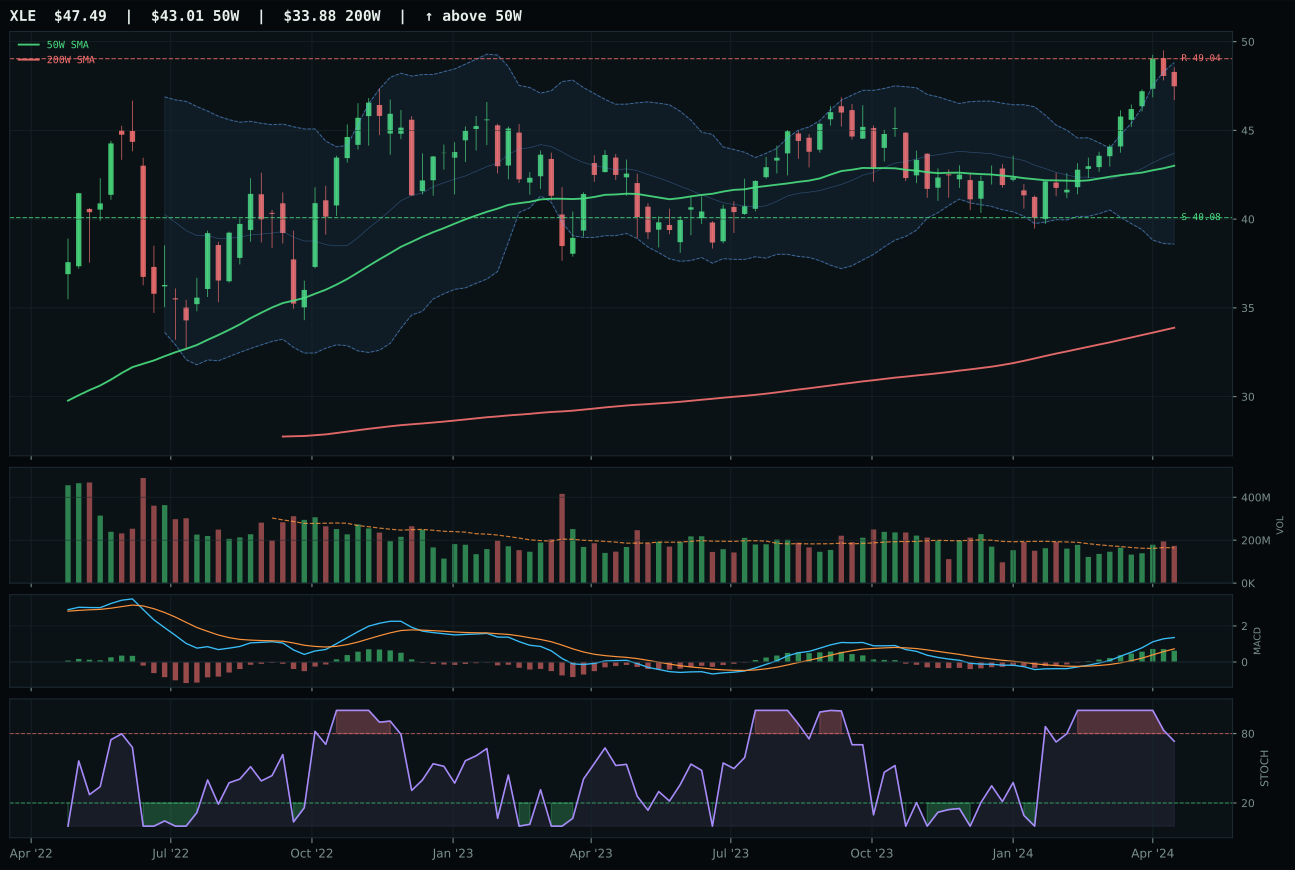
XLE has a neutral structure profile with 15.8% 13-week relative strength versus SPY.
A failed hold above support would weaken the setup.
Actionable but governed by invalidation levels.
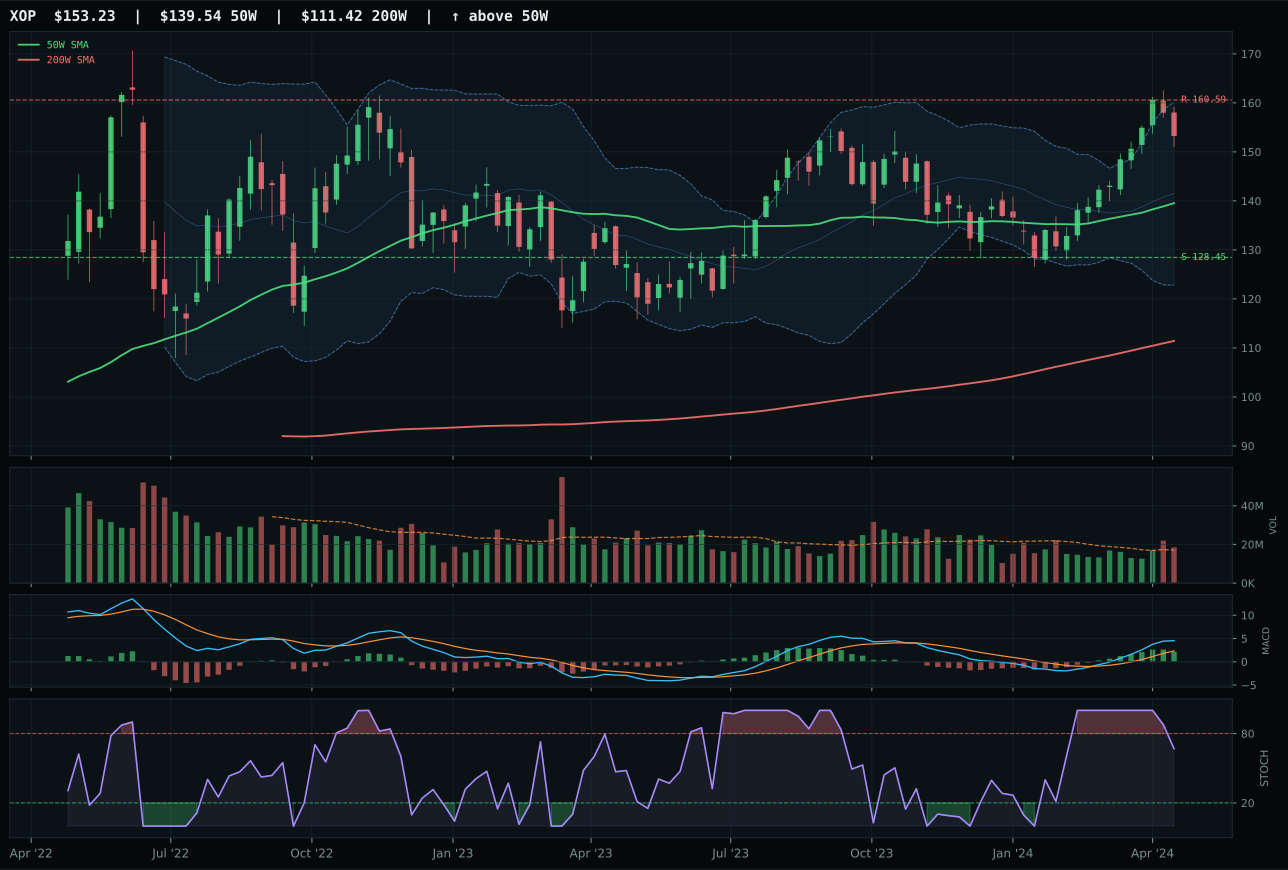
XOP has a neutral structure profile with 16.7% 13-week relative strength versus SPY.
A failed hold above support would weaken the setup.
Actionable but governed by invalidation levels.
XLE edges into the top-2 winner slot with the most durable combination of macro sponsorship and technical discipline, posting identical trend scores to FCG and XOP but claiming victory through tighter timing and volume structure. The 10.4% distance to the 50-week moving average provides entry flexibility compared to COPX or GLD's aggressive extensions, and that margin of safety matters when stochastic RSI is merely falling-neutral rather than overbought. XLE's 15.8% SPY-relative strength and 18.5% thirteen-week return prove the move is real, and volume at 1.06x confirms rather than rejects. FCG's superior 17.2% SPY-relative strength tempts, but thin participation and a -0.1 point risk/reward deficit tell the story: XLE is the institutional energy trade, FCG is the tactical positioning.
Traditional Energy earns 10% in the top-2 overweight alongside Precious Metals, justified by a commanding 86.0 category score that represents the strongest macro fit in the entire portfolio at 90.0. Energy scarcity, inflation pressure, supply shortage, and real asset sponsorship are firing at combined +46, and that firepower is structural, not speculative. Late-Cycle Reflation explicitly favors energy because it compresses margins but inflates nominal revenues and cash flow yields, creating a defensive yield story dressed in inflation alpha. XLE's 100.0 trend score, 100.0 momentum confirmation, and 79.7 volume-price confirmation are elite technical grades, and the category's 75.5 persistence score proves the move is not a flash bounce. The 10% allocation represents a dual conviction: macro regime tailwinds are durable and technical execution is clean. For energy to maintain top-2 status, energy scarcity must remain active and MACD must hold bullish; if supply suddenly increases or inflation expectations crack, the thesis inverts.
Precious Metals — GLD
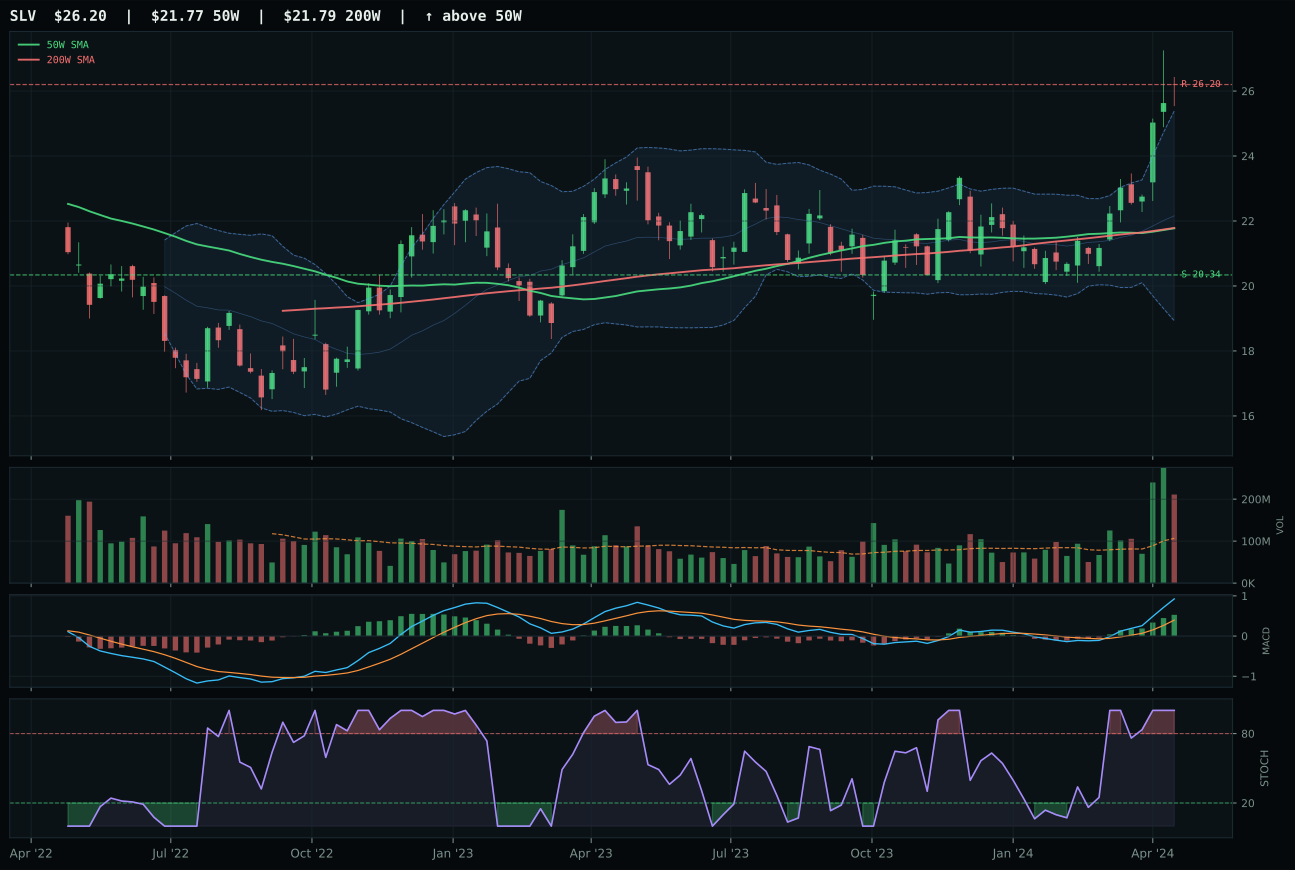
SLV has a vertical extension profile with 24.1% 13-week relative strength versus SPY.
A failed hold above support would weaken the setup.
Actionable but governed by invalidation levels.
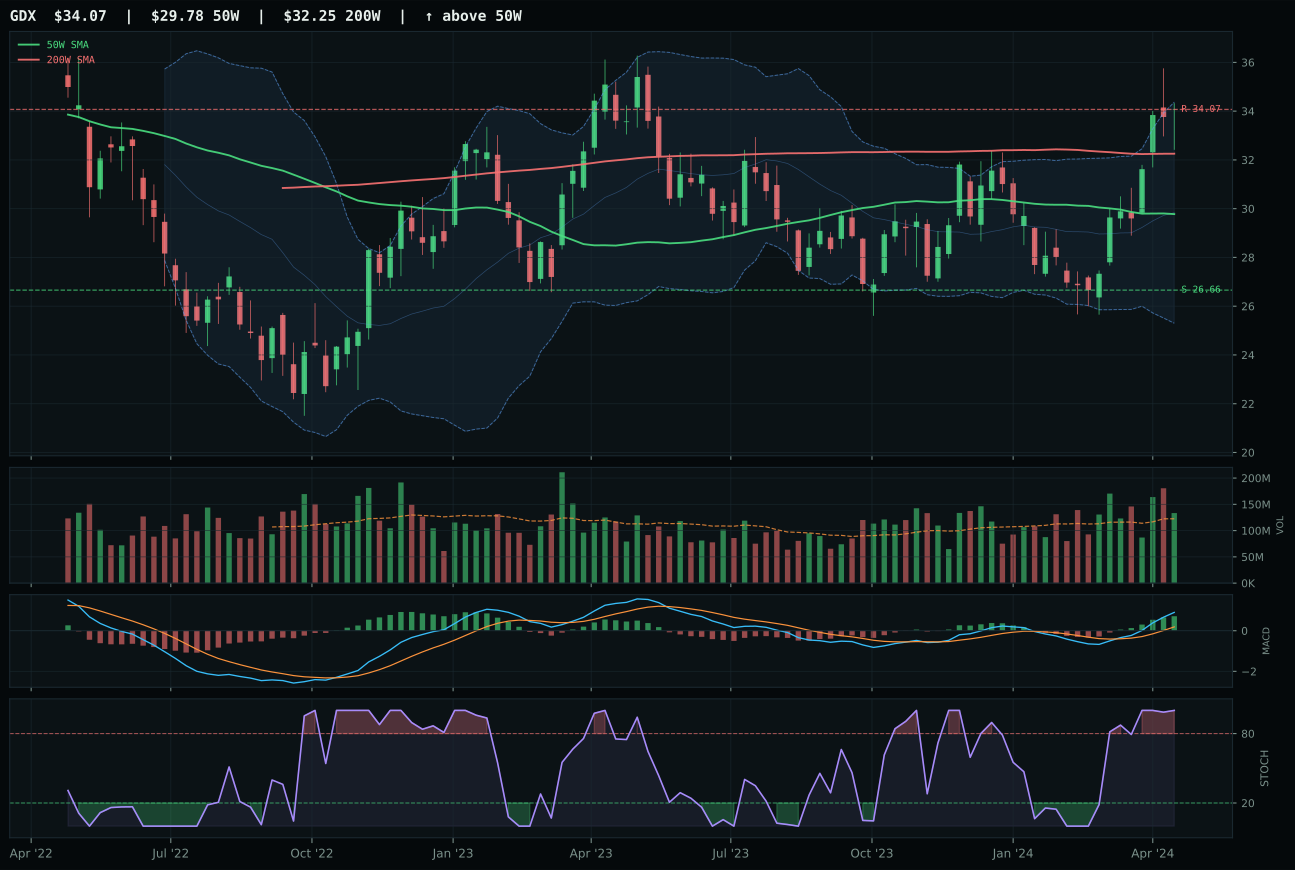
GDX has a neutral structure profile with 20.4% 13-week relative strength versus SPY.
A failed hold above support would weaken the setup.
Actionable but governed by invalidation levels.
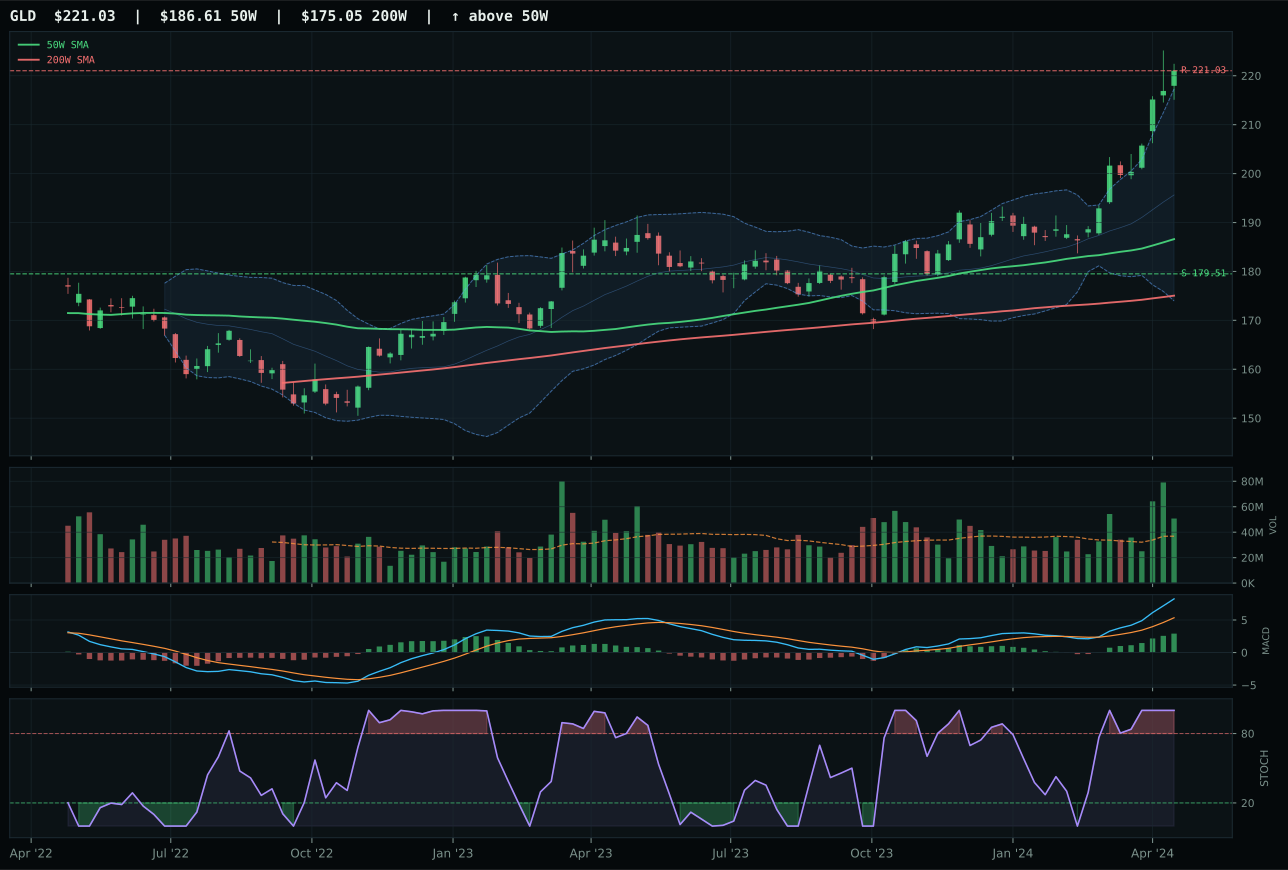
GLD has a vertical extension profile with 15.0% 13-week relative strength versus SPY.
A failed hold above support would weaken the setup.
Actionable but governed by invalidation levels.
GLD claims the top-2 slot by delivering the most sustainable trend structure among precious metals, trading cleanly 18.4% above its 50-week moving average with bullish MACD and 1.38x volume confirmation—proof that buyers are committed, not just rolling. Its 100.0 trend score reflects perfect alignment (price above 50W and 200W, slope positive at 0.4%, SPY-relative strength at 15.0%), and the 17.6% thirteen-week return is real accumulation, not sentiment. SLV's superior 26.8% thirteen-week return and 24.1% SPY-relative strength are tempting, but they come with a structure penalty (82.6 cleanliness versus 83.4) and aggressive extension that has already priced in the fear trade. The margin of victory is tight at -2.8 points, signaling both are valid long candidates, but GLD's steadier accumulation pattern edges SLV's more speculative momentum.
Precious Metals earns 10% in the top-2 overweight slot, justified by the category's exceptional 83.5 final score and dominant macro regime fit at 74.0. Monetary hedge bid, defensive rotation, and dollar pressure are all active at combined +23, creating a structural bid beneath gold that persists regardless of near-term price action. The category is extended—both GLD and SLV are 18-24% above key moving averages with risk/reward scores in the 43-55 range—but that extension is sustainable because the macro drivers are structural, not cyclical. The 10% allocation reflects a conviction that deflation fears, credit stress, and currency debasement will keep precious metals in demand throughout the late-cycle phase. For the category to maintain top-2 status, monetary hedge sponsorship and dollar pressure must remain active; if the Fed signals a pause or credit stress eases sharply, both would evaporate.
Utilities & Infrastructure — XLU
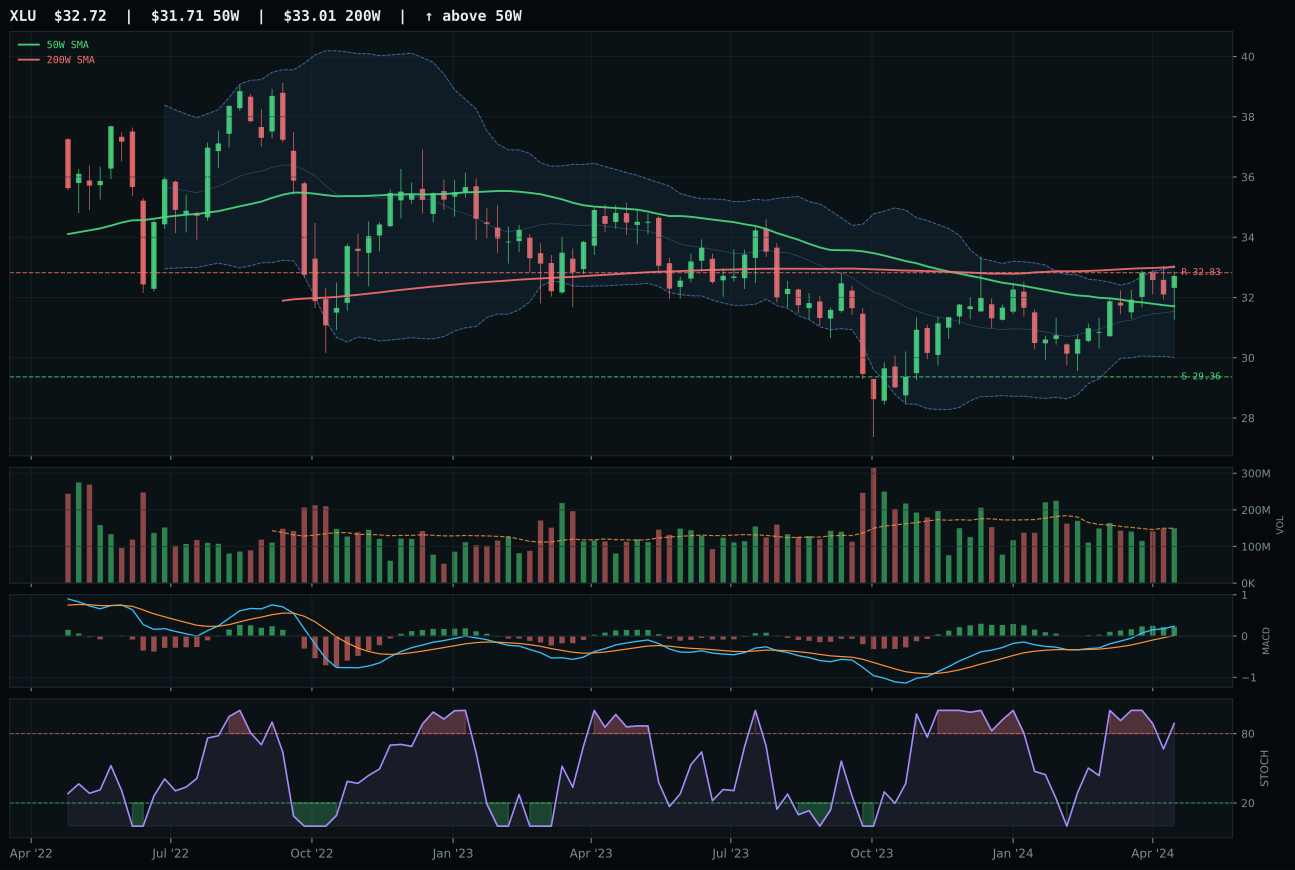
XLU has a neutral structure profile with 4.7% 13-week relative strength versus SPY.
A failed hold above support would weaken the setup.
Actionable but governed by invalidation levels.
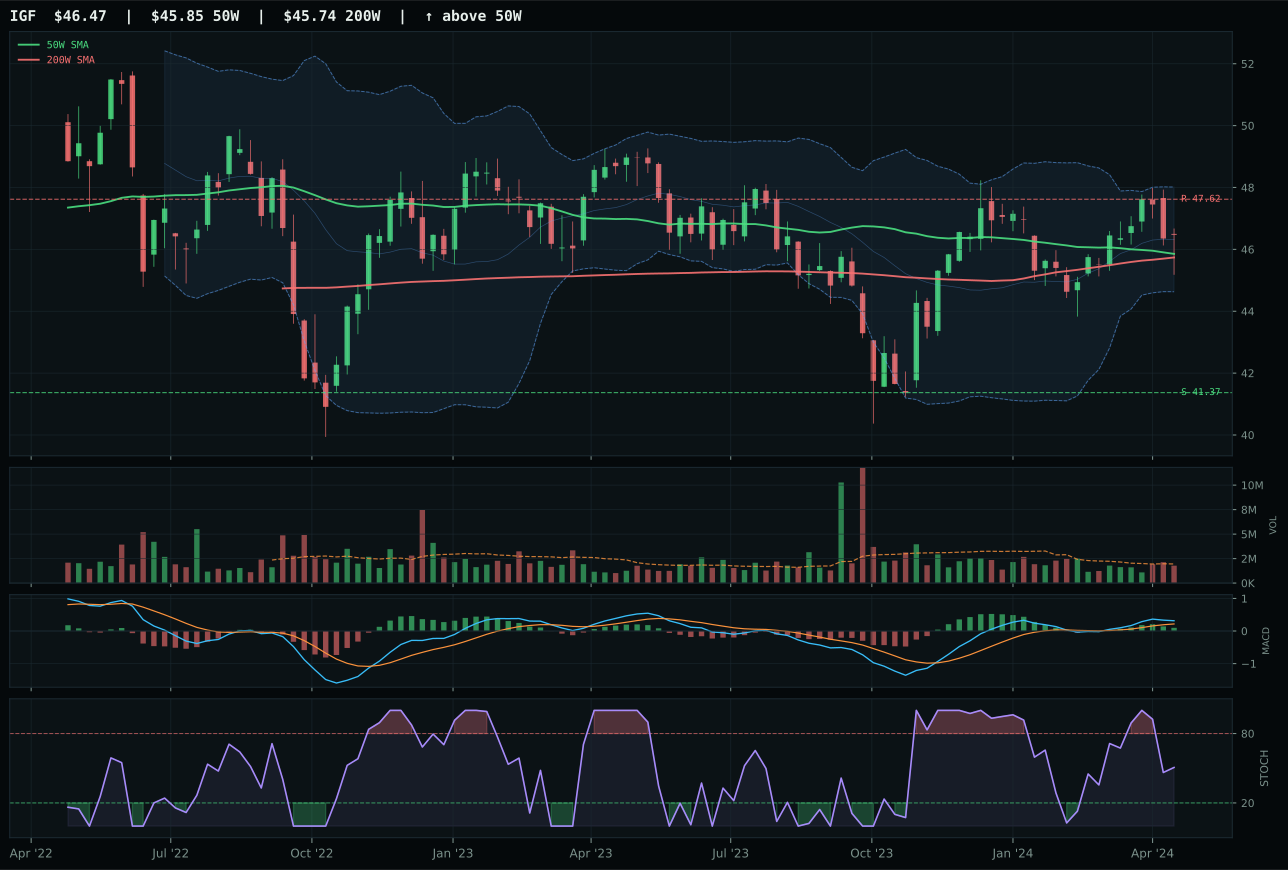
IGF has a compression near 50W profile with -0.1% 13-week relative strength versus SPY.
A failed hold above support would weaken the setup.
Actionable but governed by invalidation levels.
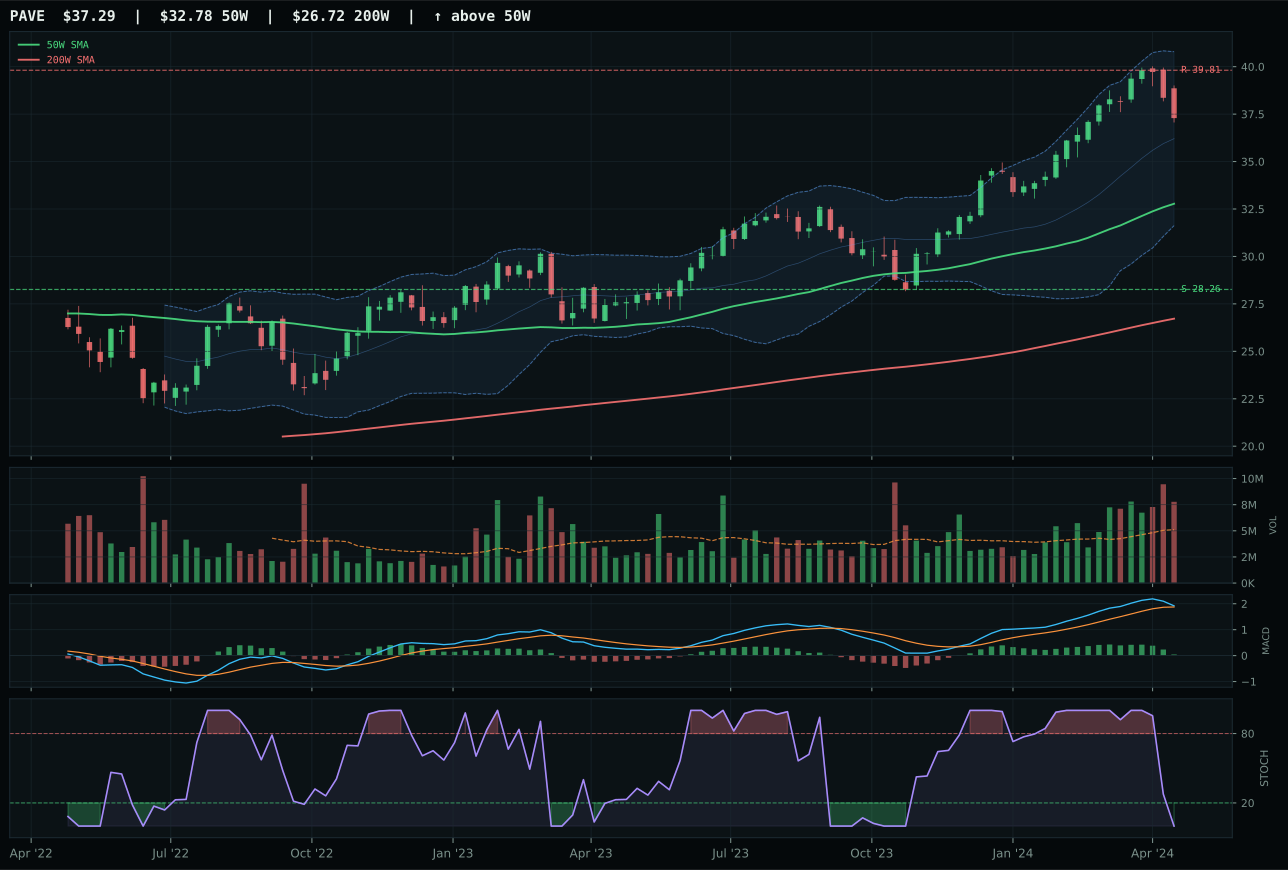
PAVE has a neutral structure profile with 7.5% 13-week relative strength versus SPY.
A failed hold above support would weaken the setup.
Actionable but governed by invalidation levels.
XLU claims the utilities lead with the cleanest relative strength execution in its peer group, posting 4.7% SPY-relative strength and 7.3% thirteen-week returns that prove institutional demand for the defensive utility trade. The 3.2% distance to the 50-week and neutral structure offer a stable entry point without demanding a breakout, and MACD bullish-and-improving confirms the move. IGF's superior timing score (95 versus 72) and 86 trend score tempt, but its -4.7% category-relative strength and bullish-but-flattening MACD reveal deterioration in the accumulation pattern. XLU's -0.3% upside to resistance is tight, but that reflects the category's maturity in the defensive rotation: price is already accurately priced relative to support, and the risk/reward is balanced, not aggressive.
Utilities & Infrastructure earns 5% allocation in tier-2 with a solid 59.0 category score that reflects balanced technical evidence (61.6) and macro fit (61.0). Defensive rotation and broad market bear are active at combined +16, and Transition-Mixed regime benefits add +4, creating a structural case for utility yield in a risk-off environment. What prevents this category from reaching top-2 status is the tight risk/reward at 45.5, the slight MACD weakening signal (bullish-and-improving is weaker than bullish-and-strong), and the category's moderate 65.3 persistence score. Utilities serve as the ultimate defensive sleeve in a portfolio tilting toward energy and metals, but they do not command the macro conviction of top-2 categories like Precious Metals or Energy. For XLU to claim top-2, either a new breakdown in equities would need to trigger fresh capital reallocation to yield, or the stochastic RSI rolling over would need to reverse and confirm fresh accumulation into support.
Nuclear Energy — NLR
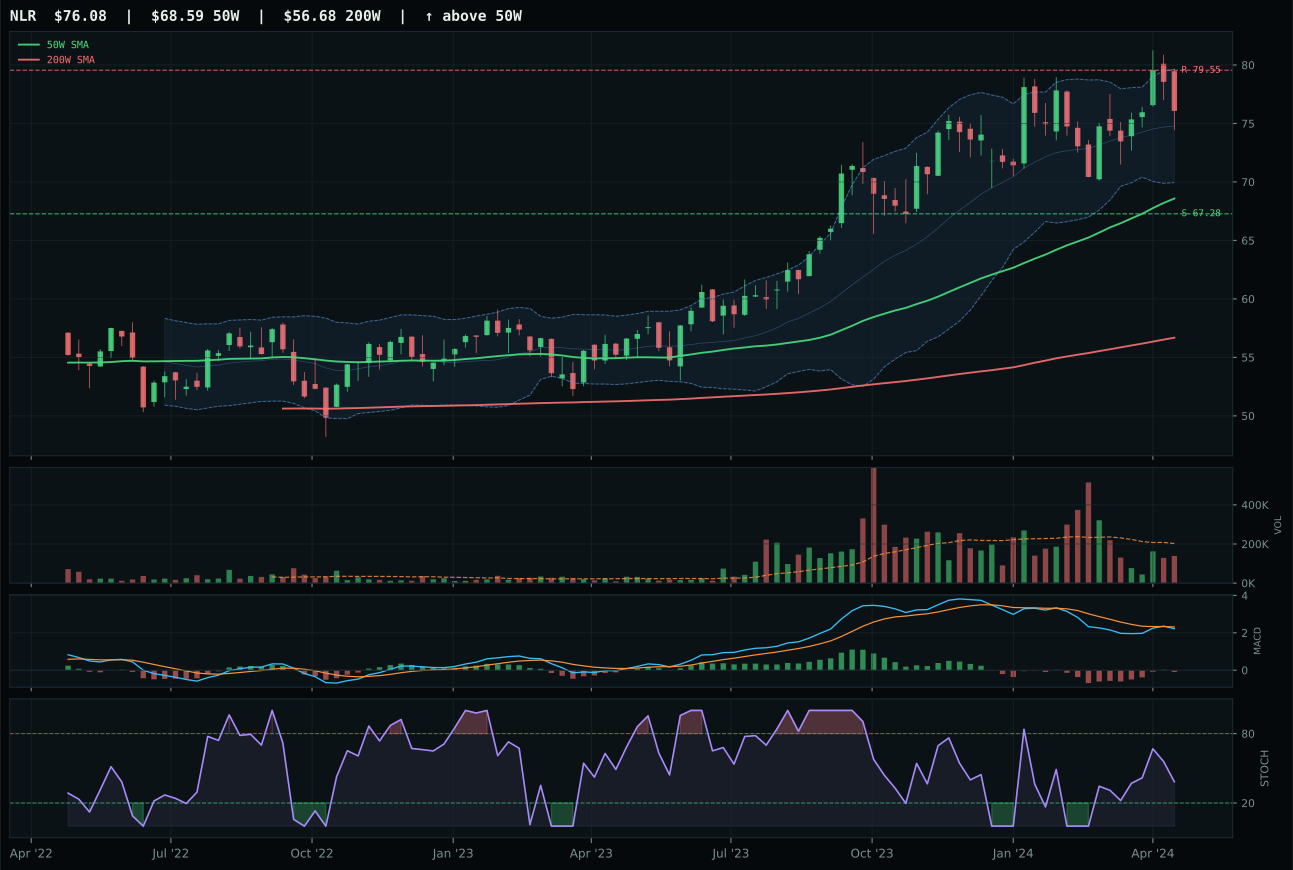
NLR has a neutral structure profile with -2.4% 13-week relative strength versus SPY.
A failed hold above support would weaken the setup.
Actionable but governed by invalidation levels.
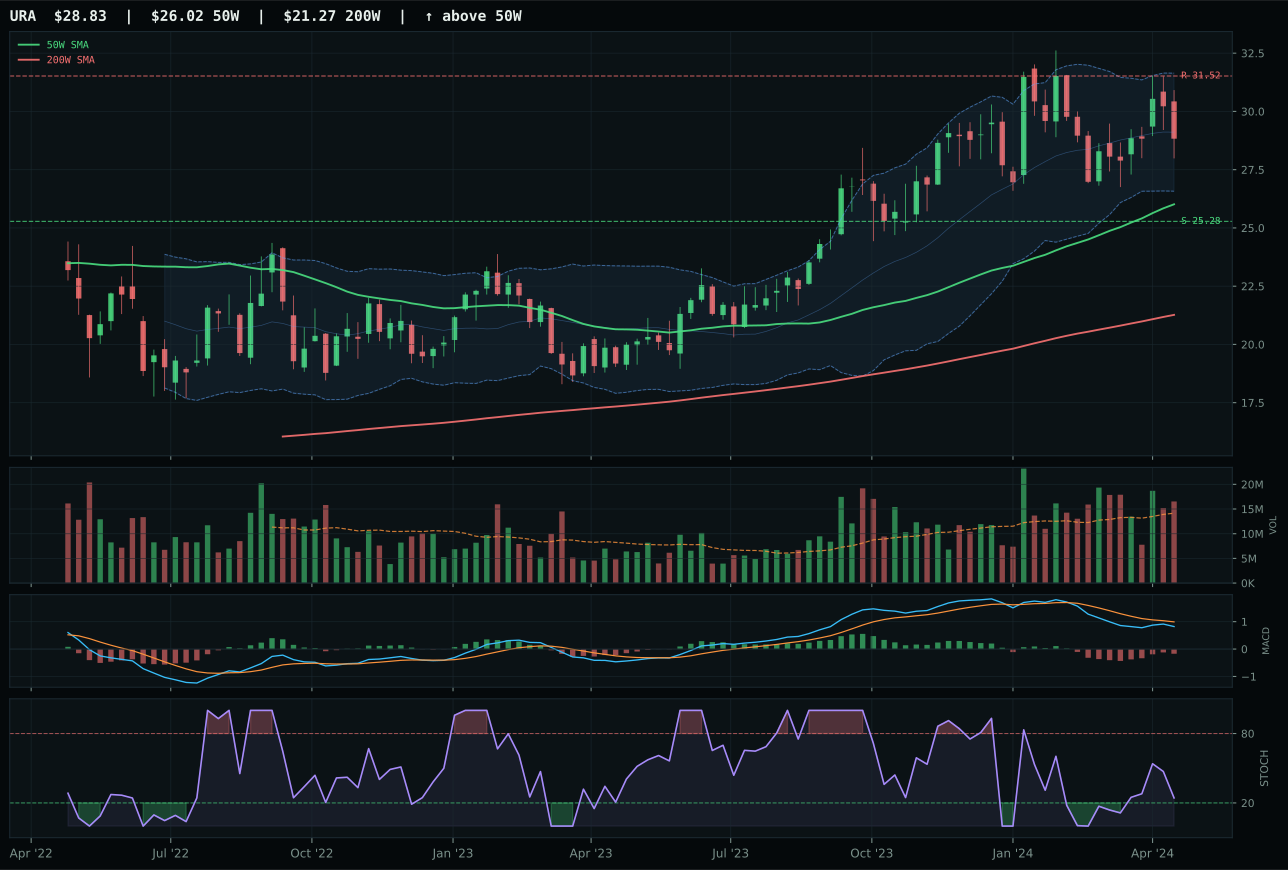
URA has a neutral structure profile with -7.9% 13-week relative strength versus SPY.
A failed hold above support would weaken the setup.
Actionable but governed by invalidation levels.
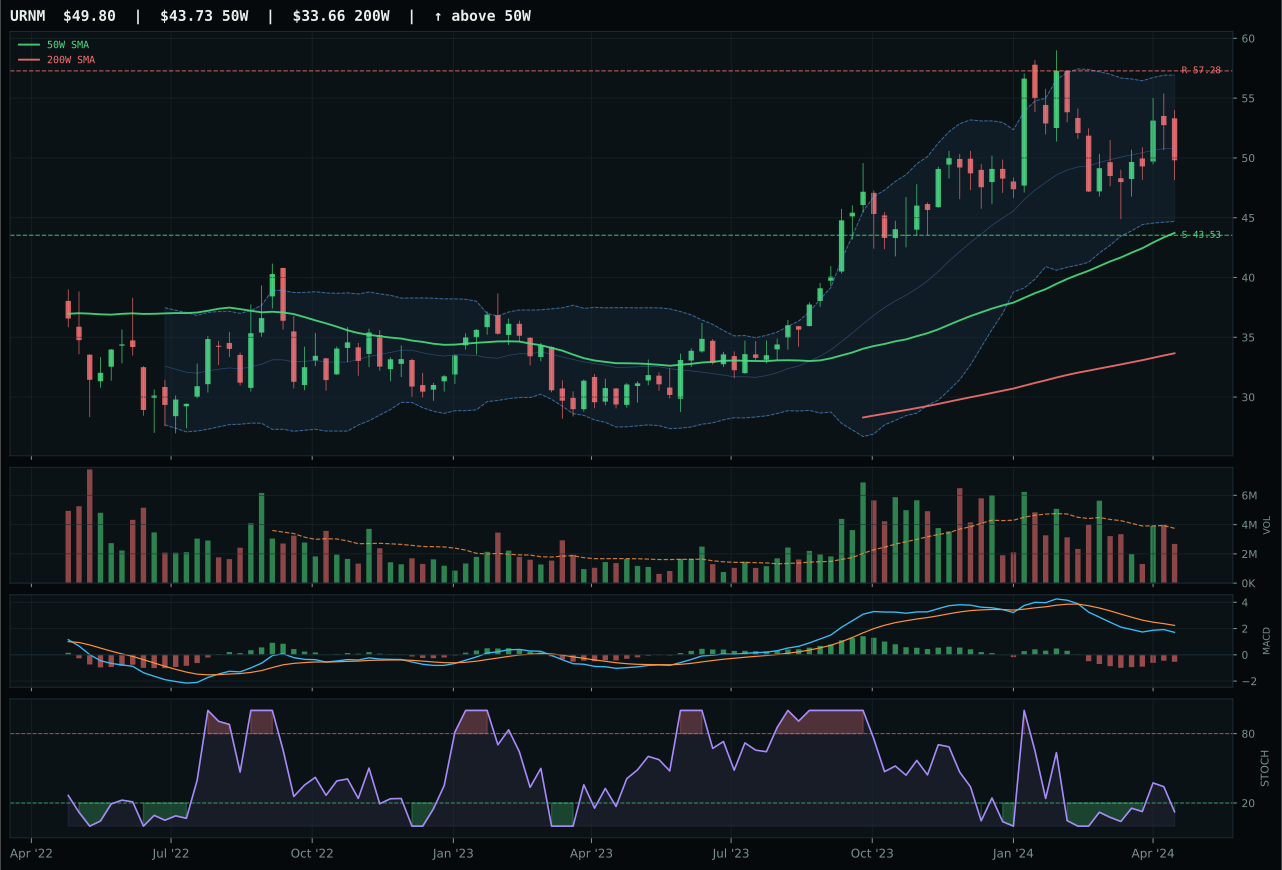
URNM has a neutral structure profile with -12.1% 13-week relative strength versus SPY.
A failed hold above support would weaken the setup.
Actionable but governed by invalidation levels.
NLR wins the nuclear category on the strength of its 89.4 trend score and 5.5% category-relative strength advantage over URA's flat 0.0%, proving that nuclear utilities are being rotated into relative to other energy and defensive exposures. The 10.9% distance to the 50-week and MACD bullish-but-improving setup offer a measured entry point that doesn't demand a breakout to justify holding. URA's -7.9% SPY-relative strength and -5.3% thirteen-week return are disqualifying, despite above-average volume participation; the volume is selling, not buying. NLR's thin participation (0.69x) is a weakness, but neutral capital flows in a defensive rotation context are preferable to active distribution in a momentum-dependent play.
Nuclear Energy earns 5% allocation in tier-2 with a moderate 54.5 category score that reflects solid technical evidence (64.4) paired with strong but not exceptional macro fit (65.0). Energy scarcity, real asset sponsorship, and defensive rotation are all active at combined +22, creating a structural case for utilities-oriented energy plays in a late-cycle regime. What prevents nuclear from reaching top-2 status is the thin volume participation (0.69x 20W average), the MACD condition (bullish but improving, not fully confirmed), and the category's overall momentum confirmation at just 53.1 versus 100.0 for energy and metals leaders. NLR sits 10.9% above support with limited downside (13.1%) but also limited upside (4.4%), making it a core holding for defensive rotators rather than a conviction trade. For nuclear to climb to tier-1 status, either MACD would need to complete its recovery and flip fully bullish, or institutional volume would need to confirm the defensive story with >1.0x participation.
Industrial Metals — COPX
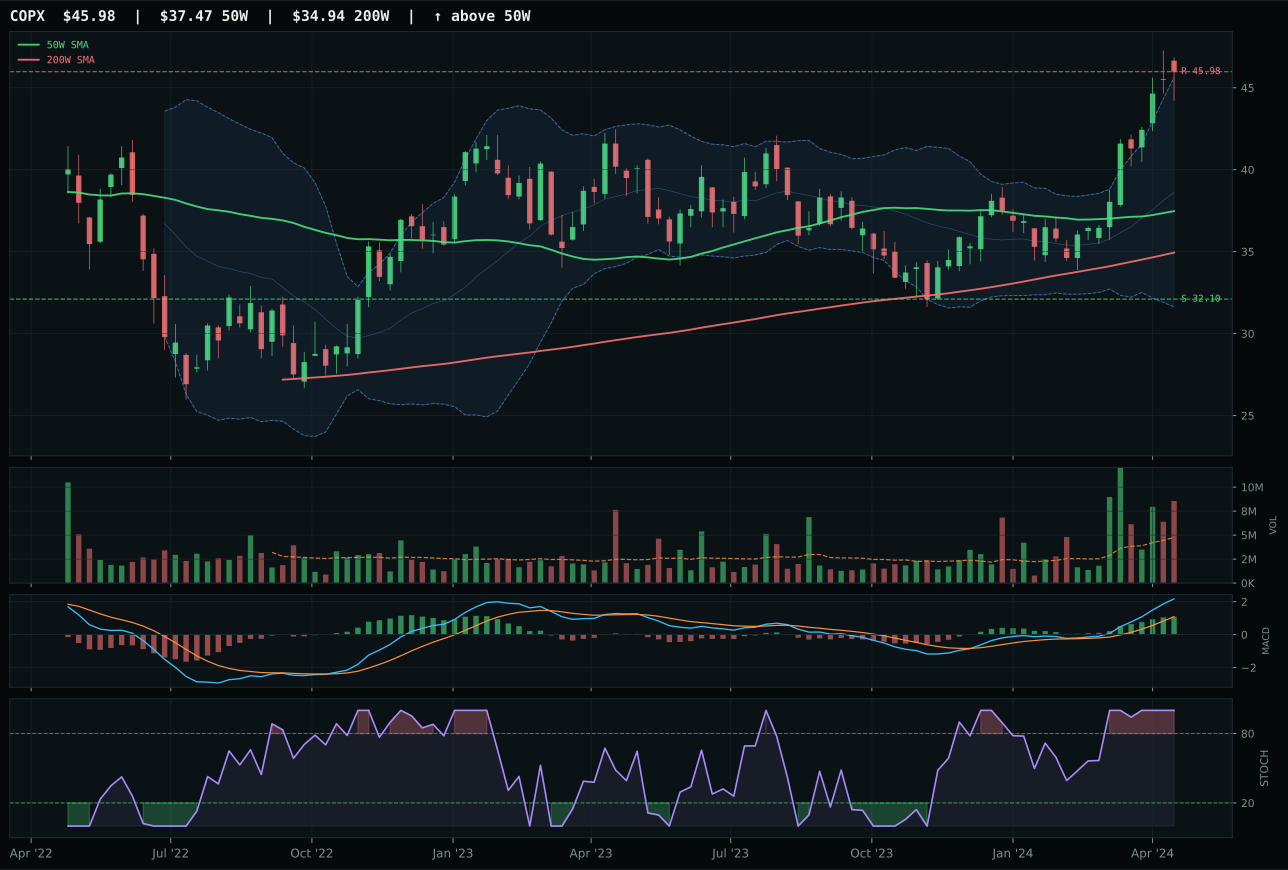
COPX has a vertical extension profile with 27.7% 13-week relative strength versus SPY.
A failed hold above support would weaken the setup.
Actionable but governed by invalidation levels.
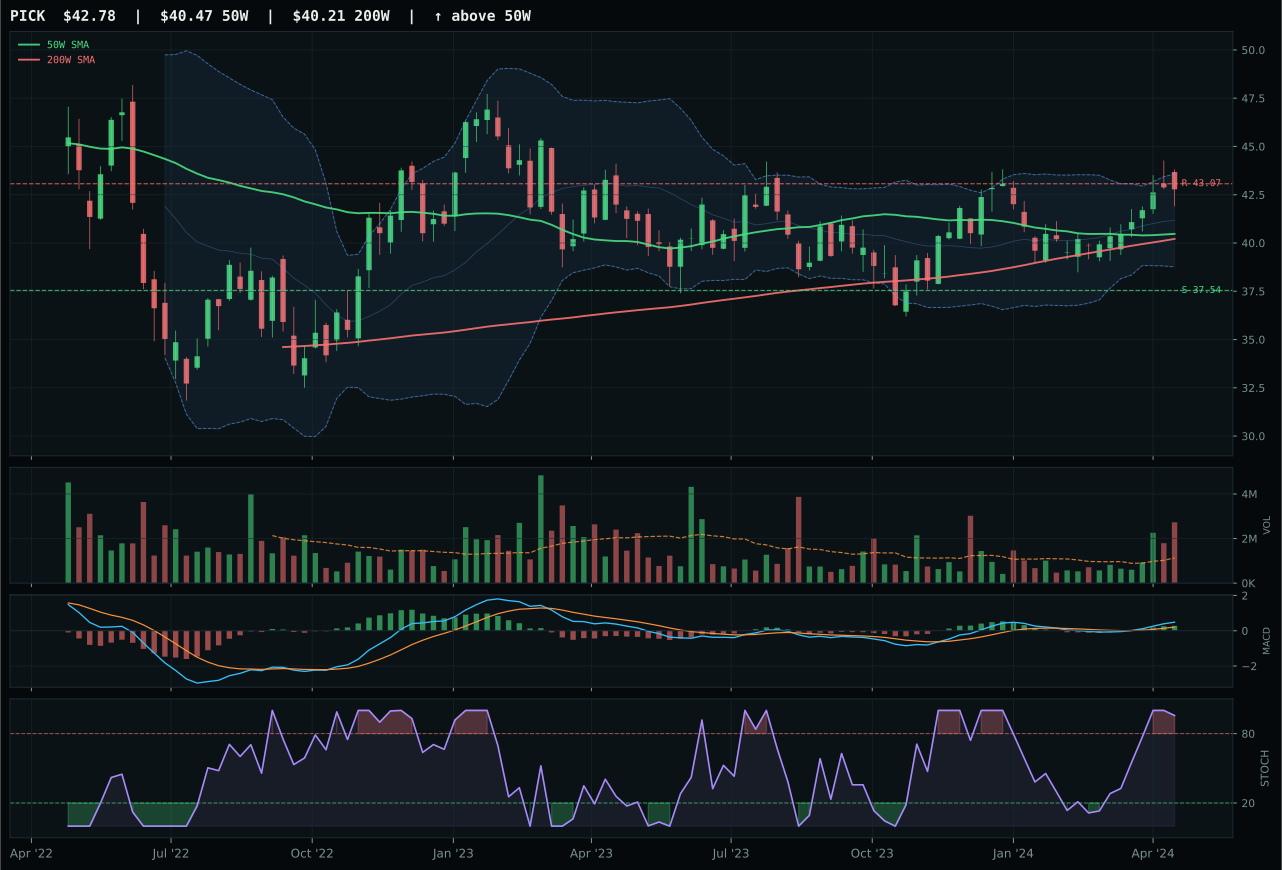
PICK has a neutral structure profile with 5.4% 13-week relative strength versus SPY.
A failed hold above support would weaken the setup.
Actionable but governed by invalidation levels.
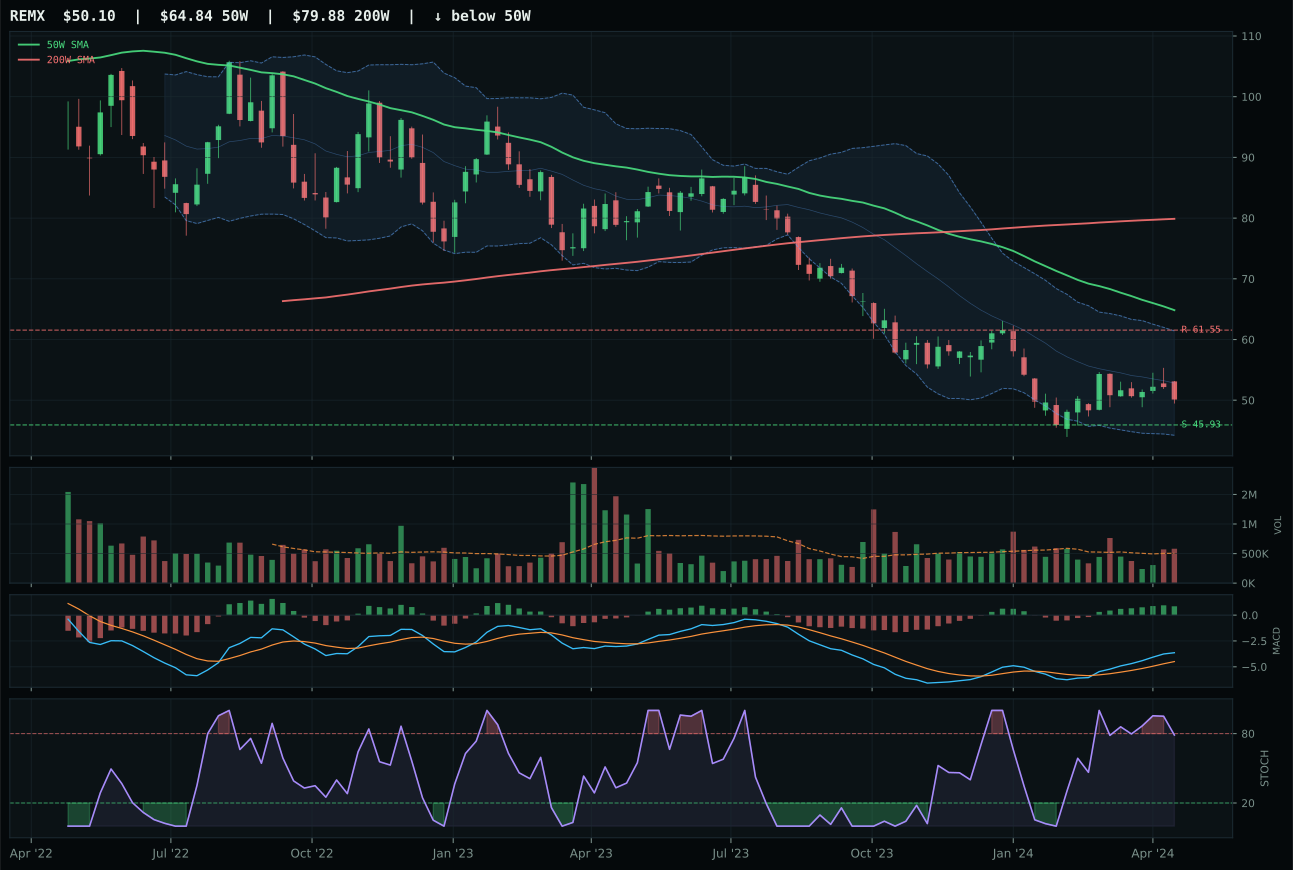
REMX has a neutral structure profile with -2.0% 13-week relative strength versus SPY.
Extension and support failure are the main tactical risks.
Tracked, but not top-2 eligible because: structurally broken.
COPX dominates its peer group with the sharpest combination of technical momentum and volume confirmation, posting a 100.0 trend score and 100.0 momentum confirmation score that is the highest in the entire portfolio. The 30.3% thirteen-week return is earned at 1.80x volume—accumulation, not speculation—and the 27.7% SPY-relative strength shows institutional participation. Copper's scarcity narrative is hitting supply constraints in a real-asset macro, and COPX's price action reflects that: 22.7% above the 50-week with MACD bullish and improving, stochastic RSI overbought but not rolling over yet. PICK's 5.4% SPY-relative strength and distribution pressure (volume rejecting the move) reveal hesitation, and that hesitation is fatal when the leadership play is this clean.
Industrial Metals earns 5% allocation in tier-2 with a strong 49.2 category score, powered by exceptional macro fit (68.0) that includes metals scarcity and commodity breadth positive firing at combined +24. Late-Cycle Reflation, real asset sponsorship, and inflation pressure all favor the industrial metals complex in an environment where dollar strength is ebbing and supply constraints are real. COPX's 100.0 volume-price confirmation and 100.0 persistence scores are elite-tier technical evidence, yet the category still ranks below precious metals and traditional energy because its macro fit, while strong, trails the defensive rotation theme. For Industrial Metals to crack top-2, either commodity breadth would need to exceed its current positive signal strength or the category would need to prove that copper demand from AI compute and energy transition will sustain above current supply. The 5% holds because the setup is clean and macro-eligible, but extended positioning argues for patience on adding more.
Defense & Aerospace — ITA
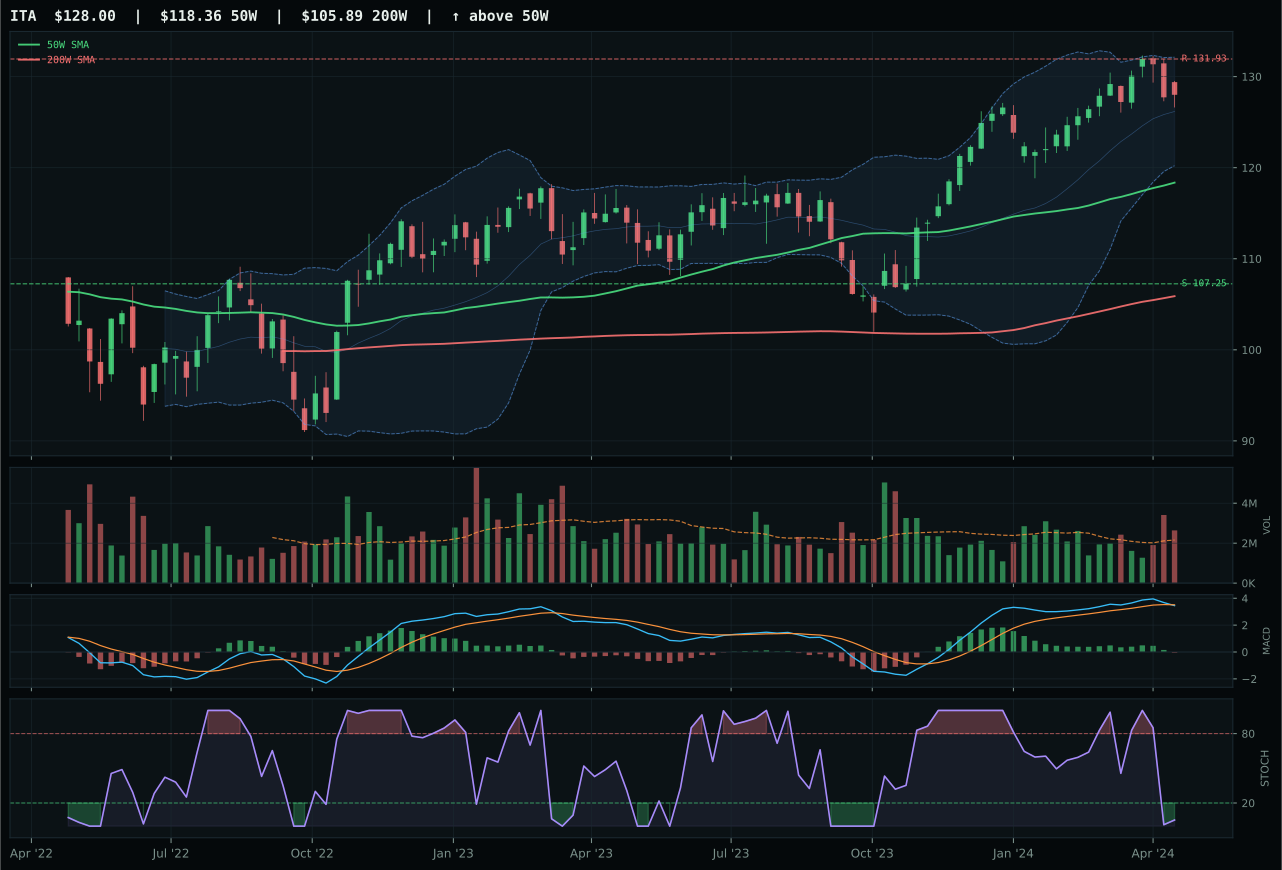
ITA has a neutral structure profile with 2.5% 13-week relative strength versus SPY.
A failed hold above support would weaken the setup.
Actionable but governed by invalidation levels.
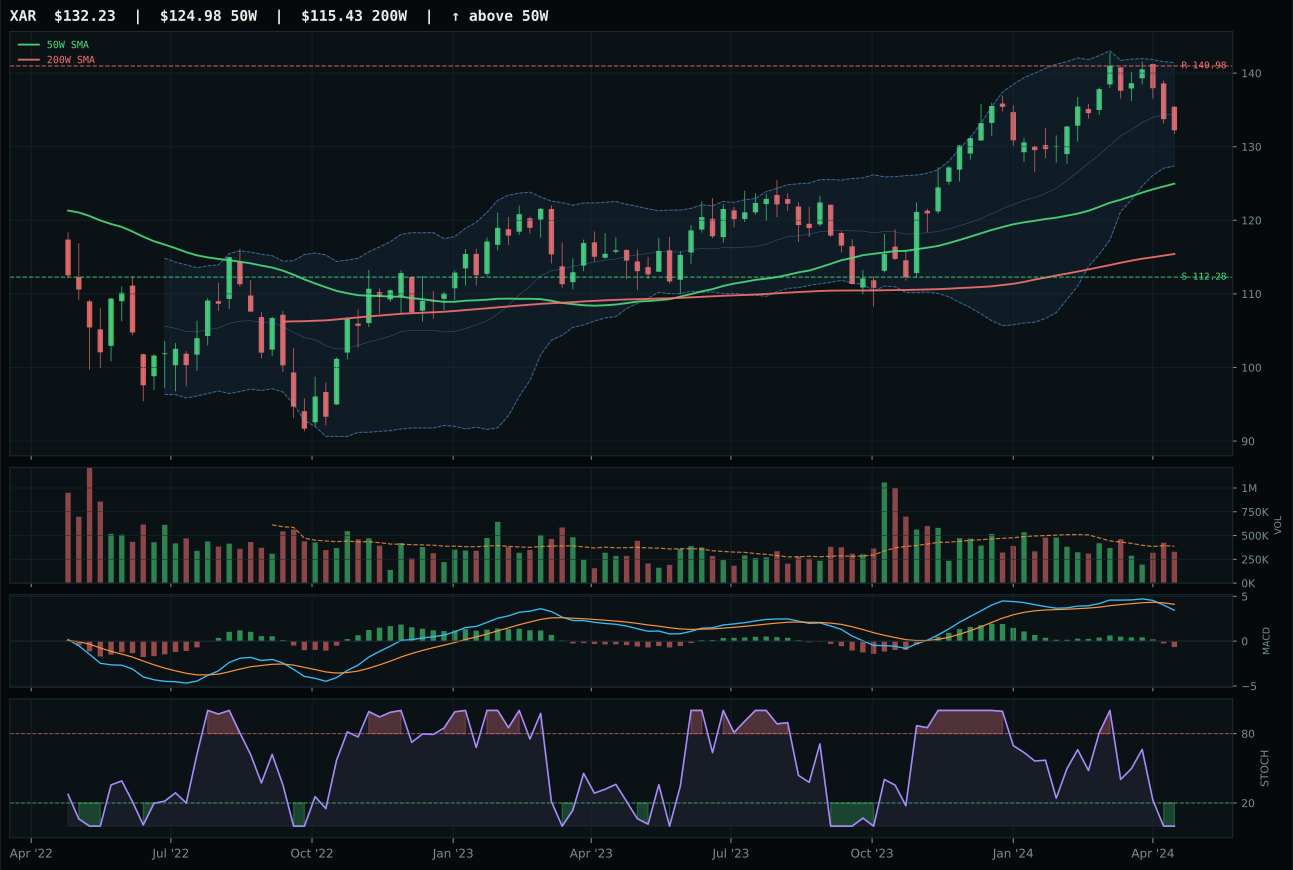
XAR has a neutral structure profile with -0.6% 13-week relative strength versus SPY.
A failed hold above support would weaken the setup.
Actionable but governed by invalidation levels.
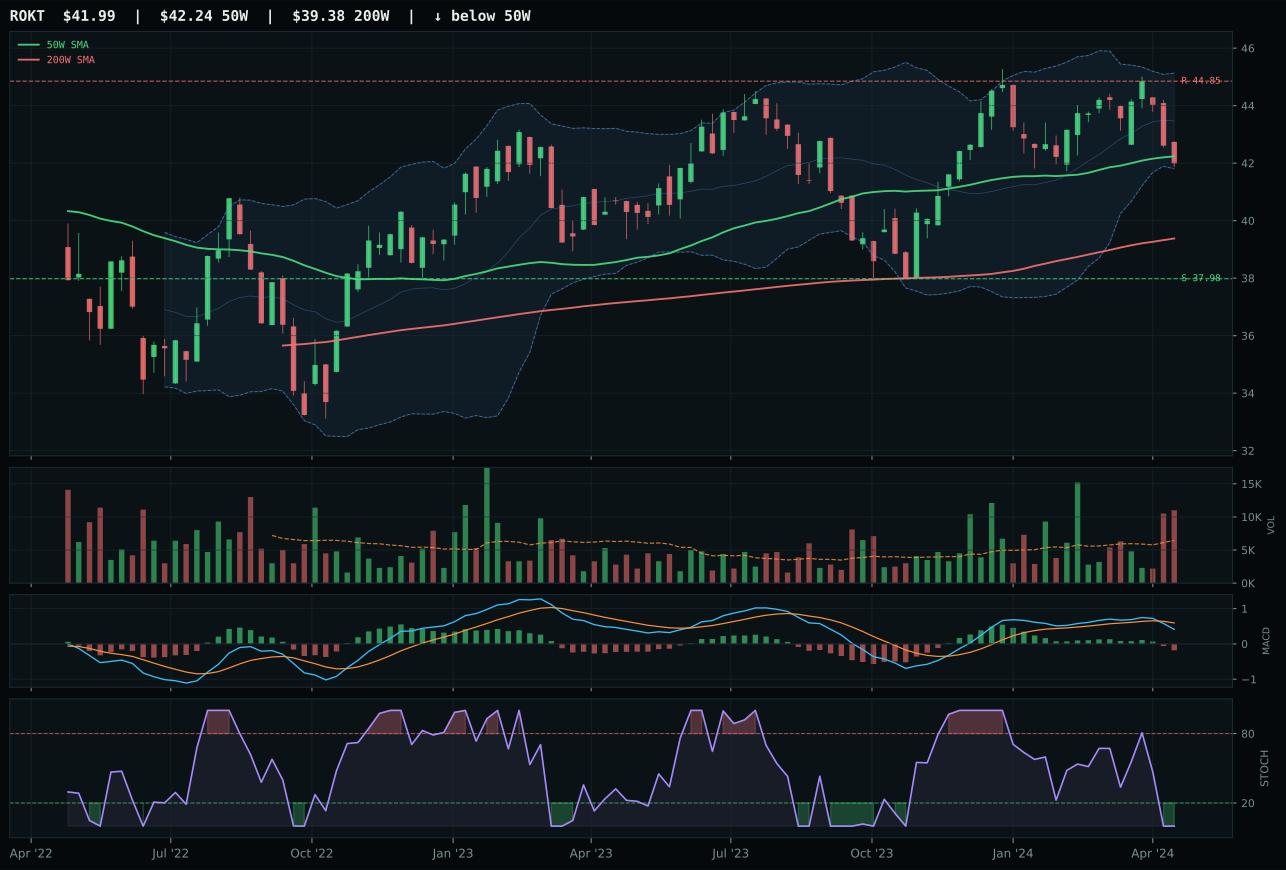
ROKT has a compression near 50W profile with -3.9% 13-week relative strength versus SPY.
A failed hold above support would weaken the setup.
Tracked, but not top-2 eligible because: .
ITA wins cleanly with the sharpest technical setup in its peer group, combining the strongest trend evidence (85.8) and structure quality (83.5) with category-relative outperformance. The 2.5% SPY-relative strength and 3.1% category-relative strength place it ahead of XAR's flat 0.0% internal relative strength, and that matters in a defensive rotation where relative leadership determines future capital flows. ITA's 5.2% thirteen-week return against XAR's 2.1% shows actual accumulation, not just sentiment. Volume at 1.22x participation confirms the move rather than questioning it, and the 107.25 support level holds firm with 19.3% downside buffer. XAR's neutral volume and -0.6% SPY-relative strength suggest it is being held tactically, not accumulated.
Defense & Aerospace receives 5% allocation in tier-2, justified by a strong 38.6 category score that reflects both solid technical evidence (49.4) and powerful macro tailwinds (63.0 macro fit). Late-Cycle Reflation, defensive rotation, and broad market bear are all active with combined +19 benefit, creating a regime where durability and cash defense trump growth. The category would need a move above 50 on the final score to crack the top-2 overweights, which would require either broader SPY-relative leadership across the basket or a shift where the compression near support breaks upward with heavy accumulation. For now, the 5% holds its position as a steady defensive sleeve in a portfolio that is tilting meaningfully toward real assets and avoiding duration risk.
Agriculture & Livestock — WEAT
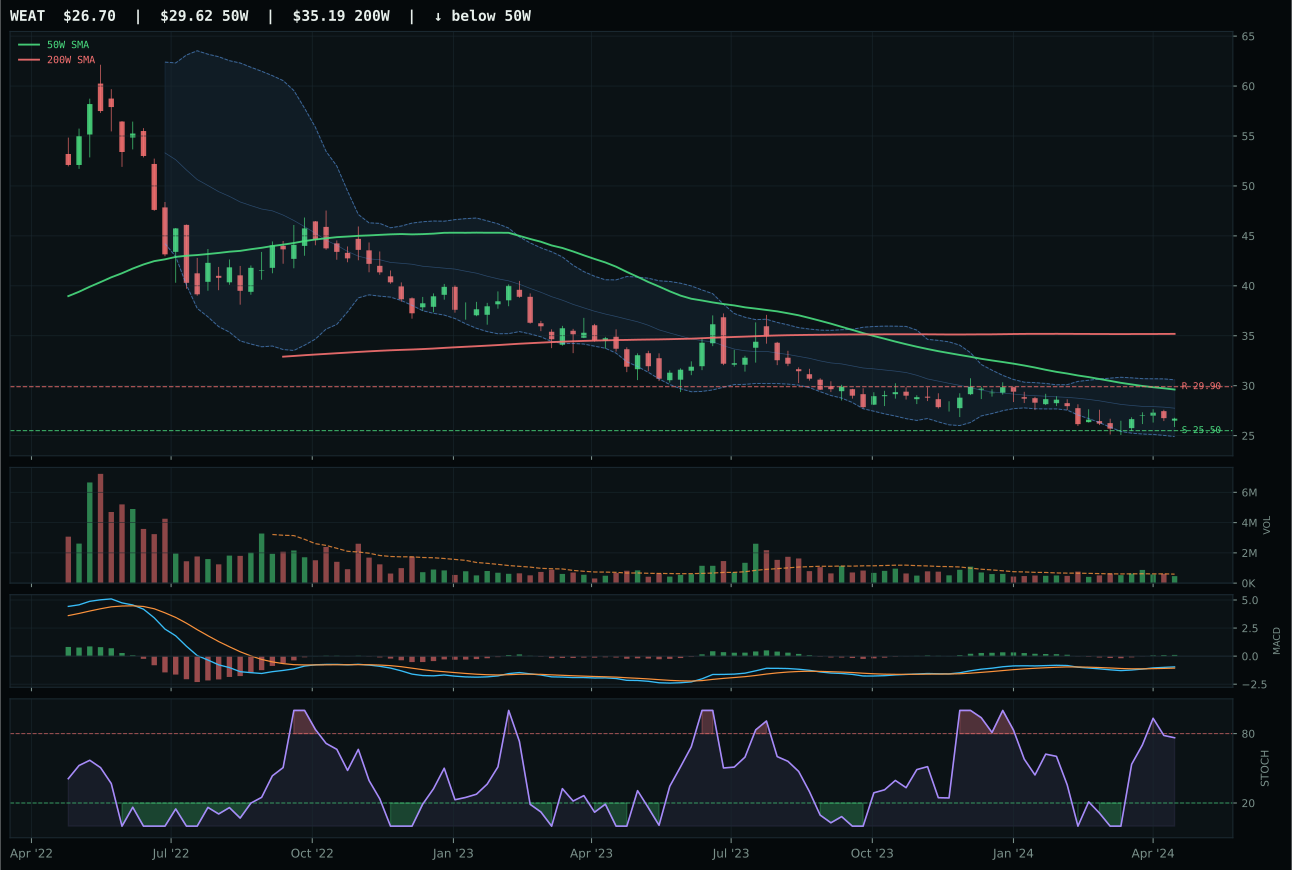
WEAT has a pullback into support profile with -8.3% 13-week relative strength versus SPY.
Extension and support failure are the main tactical risks.
Tracked, but not top-2 eligible because: structurally broken.
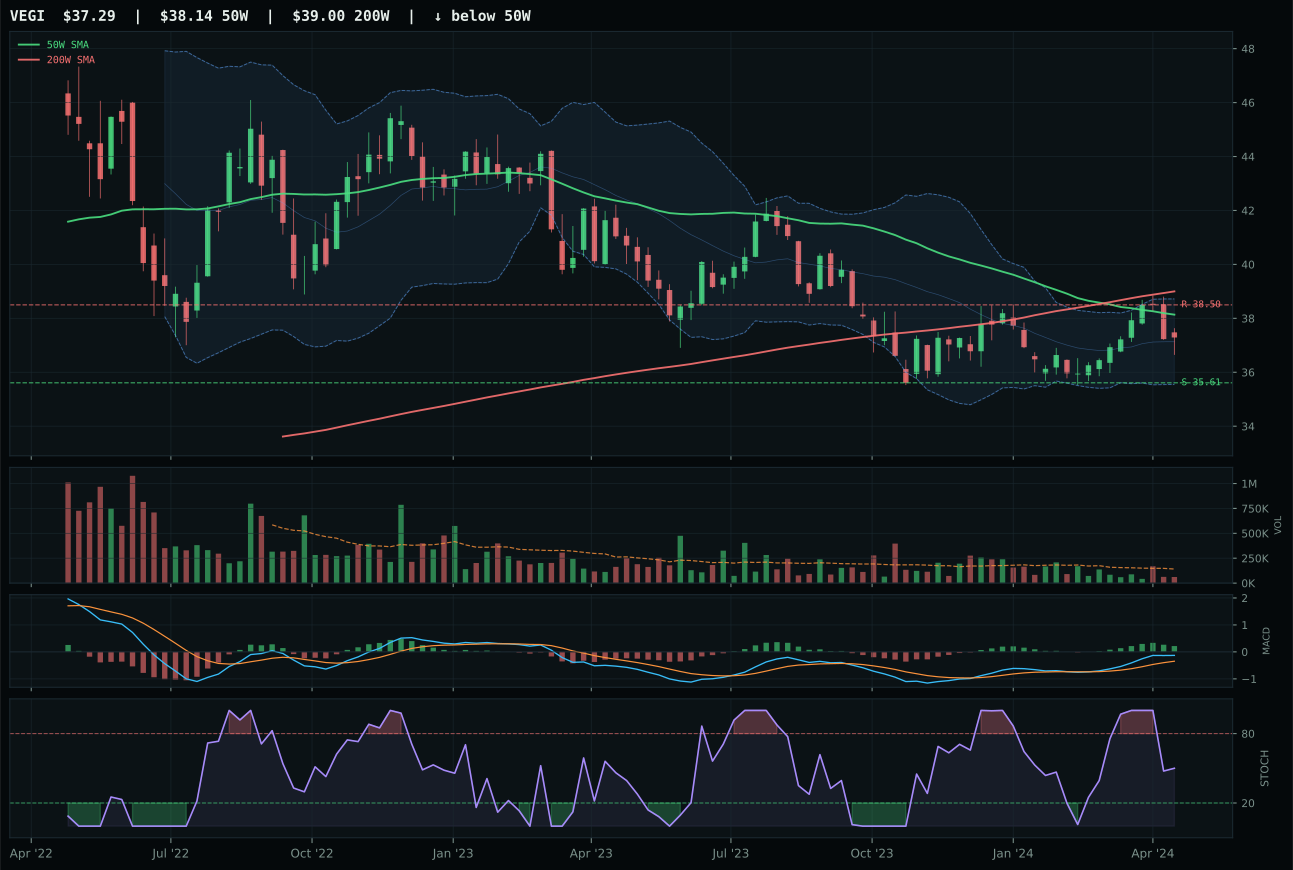
VEGI has a pullback into support profile with -0.4% 13-week relative strength versus SPY.
Extension and support failure are the main tactical risks.
Tracked, but not top-2 eligible because: structurally broken.
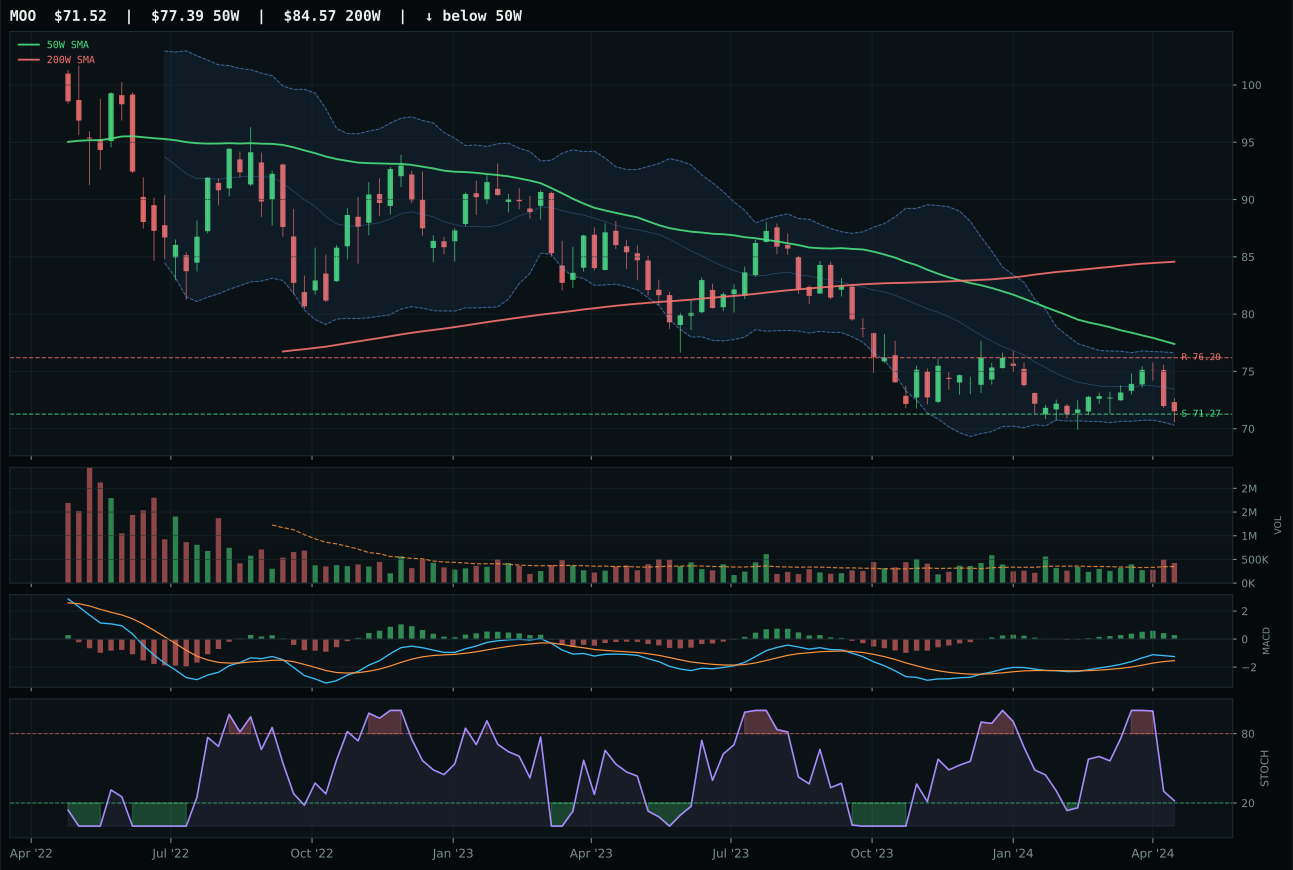
MOO has a pullback into support profile with -3.6% 13-week relative strength versus SPY.
Extension and support failure are the main tactical risks.
Tracked, but not top-2 eligible because: structurally broken.
WEAT wins by default among a basket of structurally challenged setups, and it earns the category representative slot on the strength of its 85.9 risk/reward score—a stark 20-point advantage over VEGI's 65.0. The trade here is asymmetric: price sits 9.8% below the 50-week moving average pulling into hard support at 25.50, with only 4.7% downside if support breaks but 10.7% upside to resistance. MACD is bullish and improving, stochastic RSI is rising mid-zone at 0.76, and the setup screams mean reversion. VEGI and MOO both fail the hard filter check marked structurally broken, leaving WEAT as the only eligible representative despite its own structural limitations. Volume is neutral, not confirming, so this is a support-hold thesis rather than an accumulation thesis.
Agriculture & Livestock earns 5% allocation in tier-2, despite the category flagging as ineligible for top-2 consideration due to structural weakness in its primary representative. The final score of 32.6 masks the exceptional macro tailwind: commodity breadth positive, inflation pressure, and supply shortage are firing at combined +28, and Late-Cycle Reflation helps at +8. That 90.0 macro fit score is the second-highest across all ten categories. The technical execution is poor—WEAT sits below the 200-week moving average and is offering a bounce-into-resistance trade, not a breakout—but the macro regime is so favorable that holding the 5% sleeve makes sense as a hedge against persistent inflation and dollar weakness. For WEAT to become a top-2 candidate, it would need to hold support, close above the 50-week, and prove volume is accumulating rather than just rolling over near resistance.
AI — AIQ
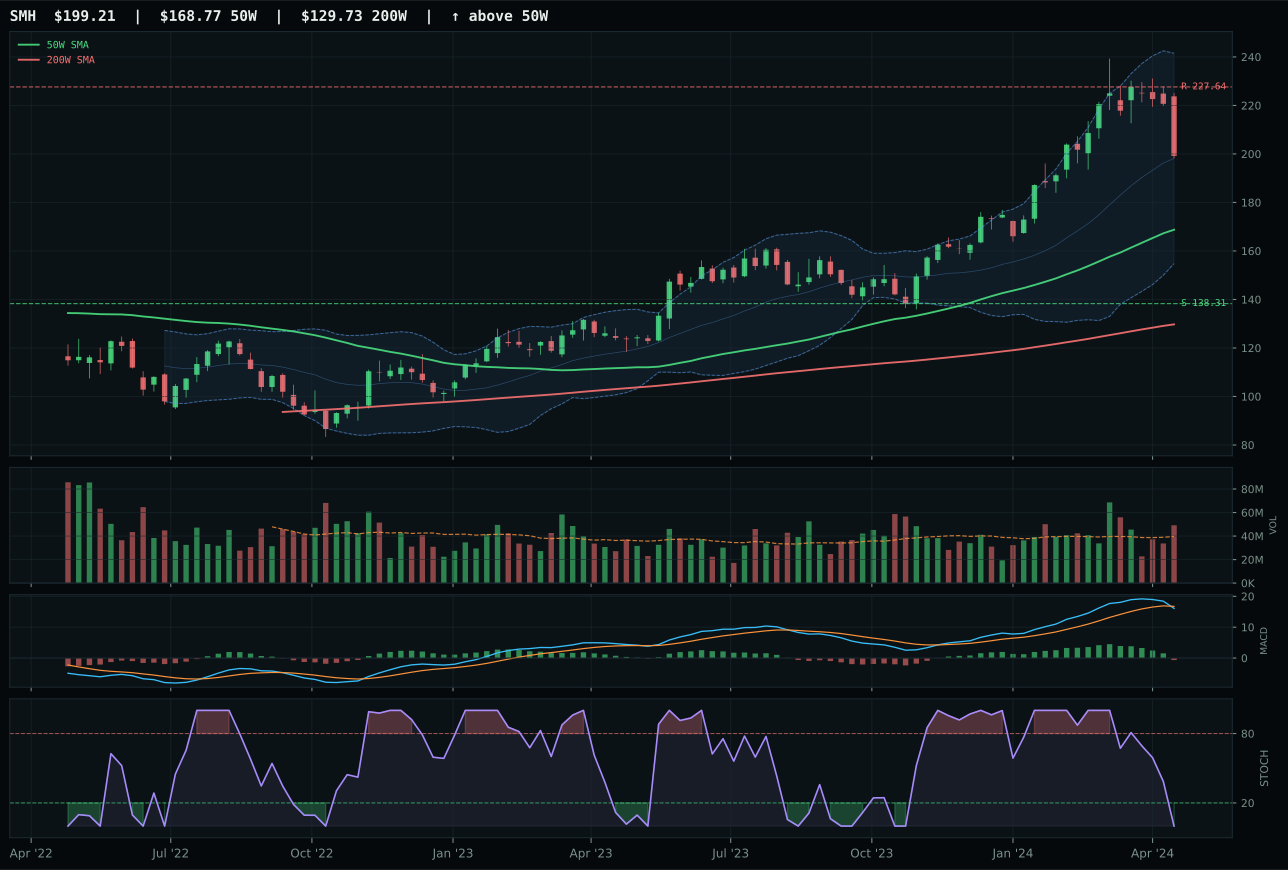
SMH has a vertical extension profile with 3.8% 13-week relative strength versus SPY.
A failed hold above support would weaken the setup.
Actionable but governed by invalidation levels.
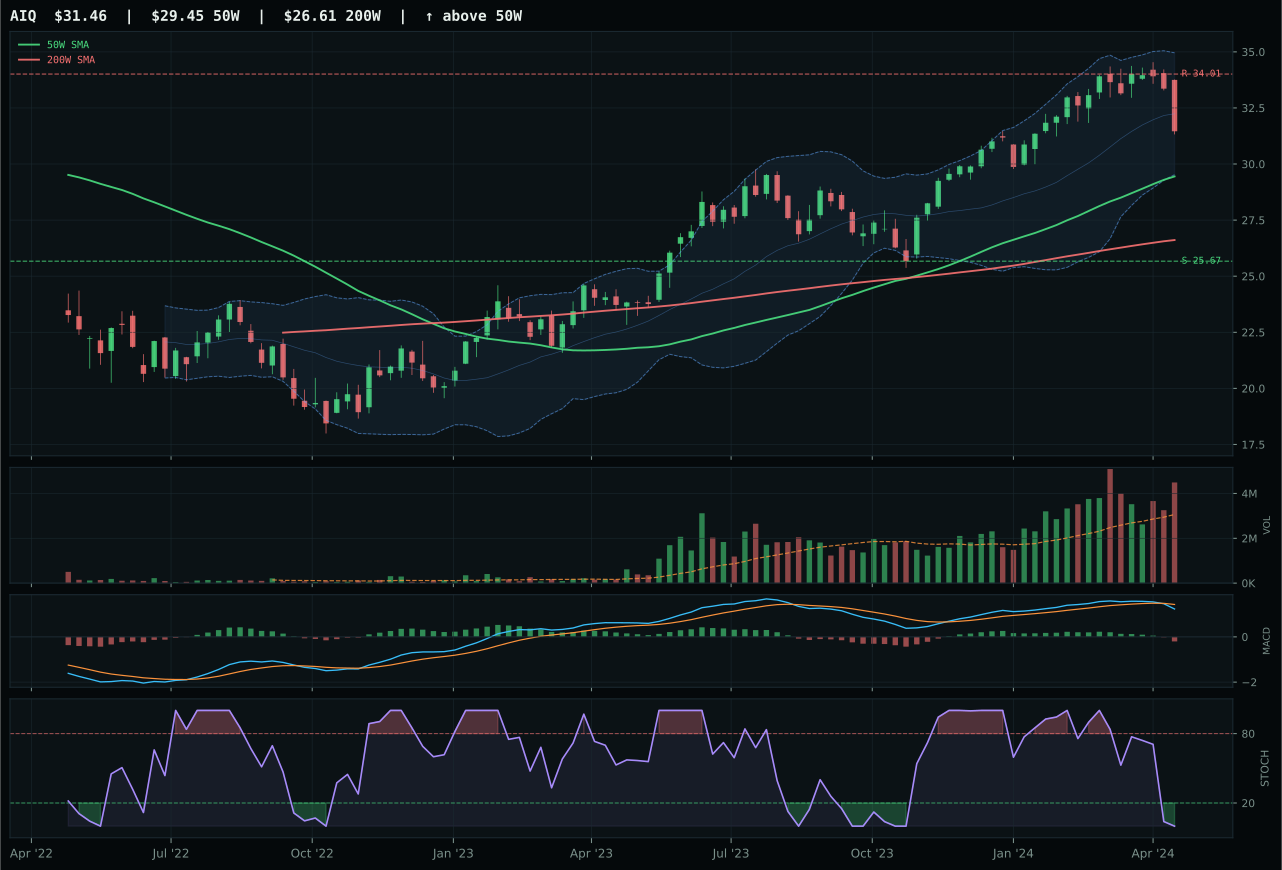
AIQ has a neutral structure profile with -2.3% 13-week relative strength versus SPY.
A failed hold above support would weaken the setup.
Actionable but governed by invalidation levels.
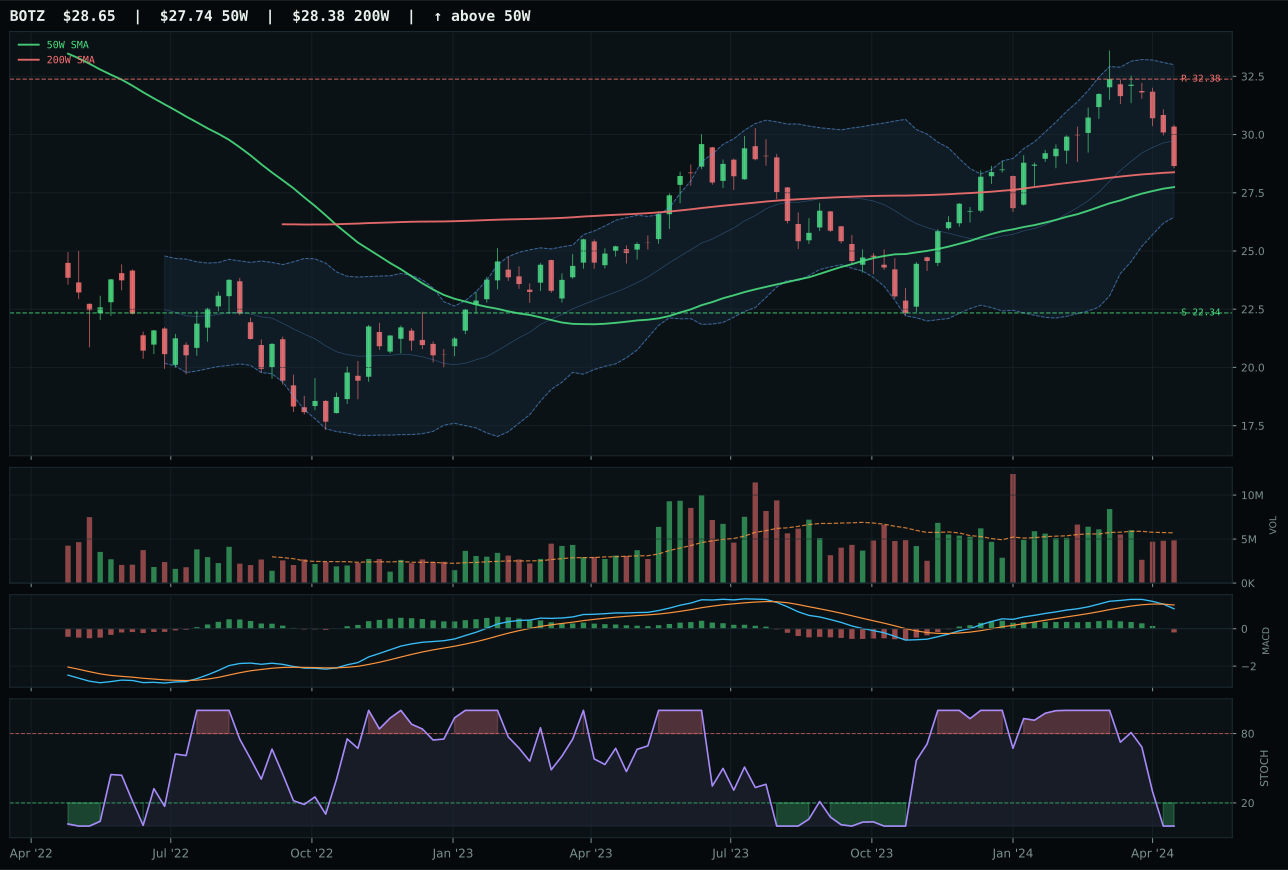
BOTZ has a neutral structure profile with -2.8% 13-week relative strength versus SPY.
A failed hold above support would weaken the setup.
Actionable but governed by invalidation levels.
AIQ edges the category with a cleaner, less extended setup that rewards discipline over performance chasing. The 6.8% distance to the 50-week moving average and -2.3% SPY-relative strength represents a measured hold rather than a breakout, and that margin of safety matters in an environment where SMH's 18.0% extension has already taxied away from the gate. SMH's superior 6.4% thirteen-week return and 3.8% SPY-relative strength tempt, but the timing score penalty (48.0 versus 70.0) is decisive: at extreme distance from support and with stochastic RSI already overbought, the risk/reward skews against fresh entry. AIQ's neutral structure, 72.0 cleanliness score, and 0.4% thirteen-week return position it as the measured vote, not the momentum statement.
AI earns 5% allocation in tier-2, reflecting its structural adequacy despite a category score of only 27.4 that trails six other eligible exposures. The macro headwinds are severe—liquidity stress, credit stress, and a broad market bear are all active—and they drag the category's macro fit score to just 32.0 out of 100. However, AI growth sponsorship is active at +14, and that kernel of demand prevents the category from zeroing out entirely. What would elevate AI to top-2 status is a sustained move above 38 or 40 on the final score, which would require either MACD bullish confirmation across the basket, compression into support that can prove accumulation, or a regime shift where credit stress eases. For now, the 5% slot serves as a measured hedge to growth skepticism rather than a conviction bet.
Technology — CIBR
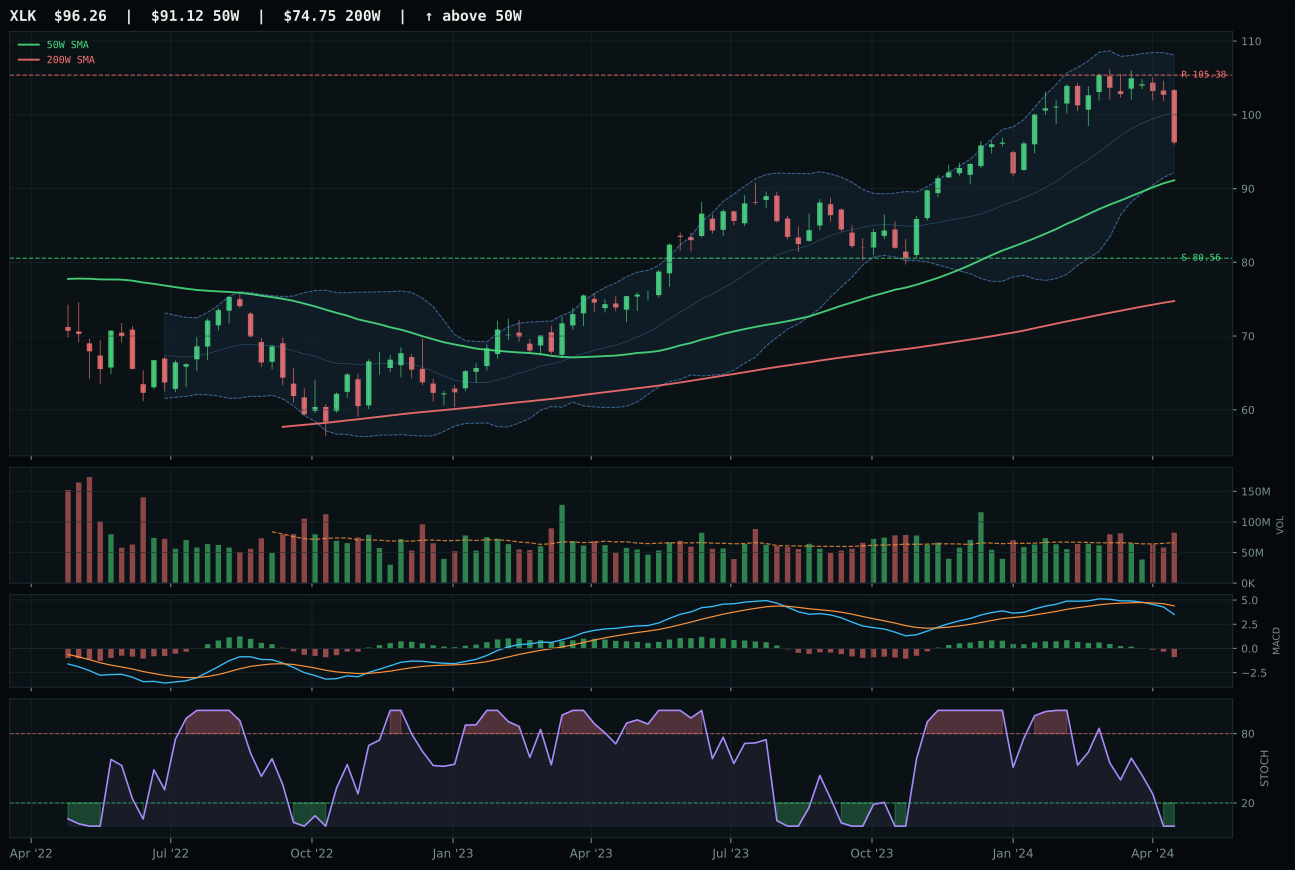
XLK has a neutral structure profile with -6.5% 13-week relative strength versus SPY.
A failed hold above support would weaken the setup.
Actionable but governed by invalidation levels.
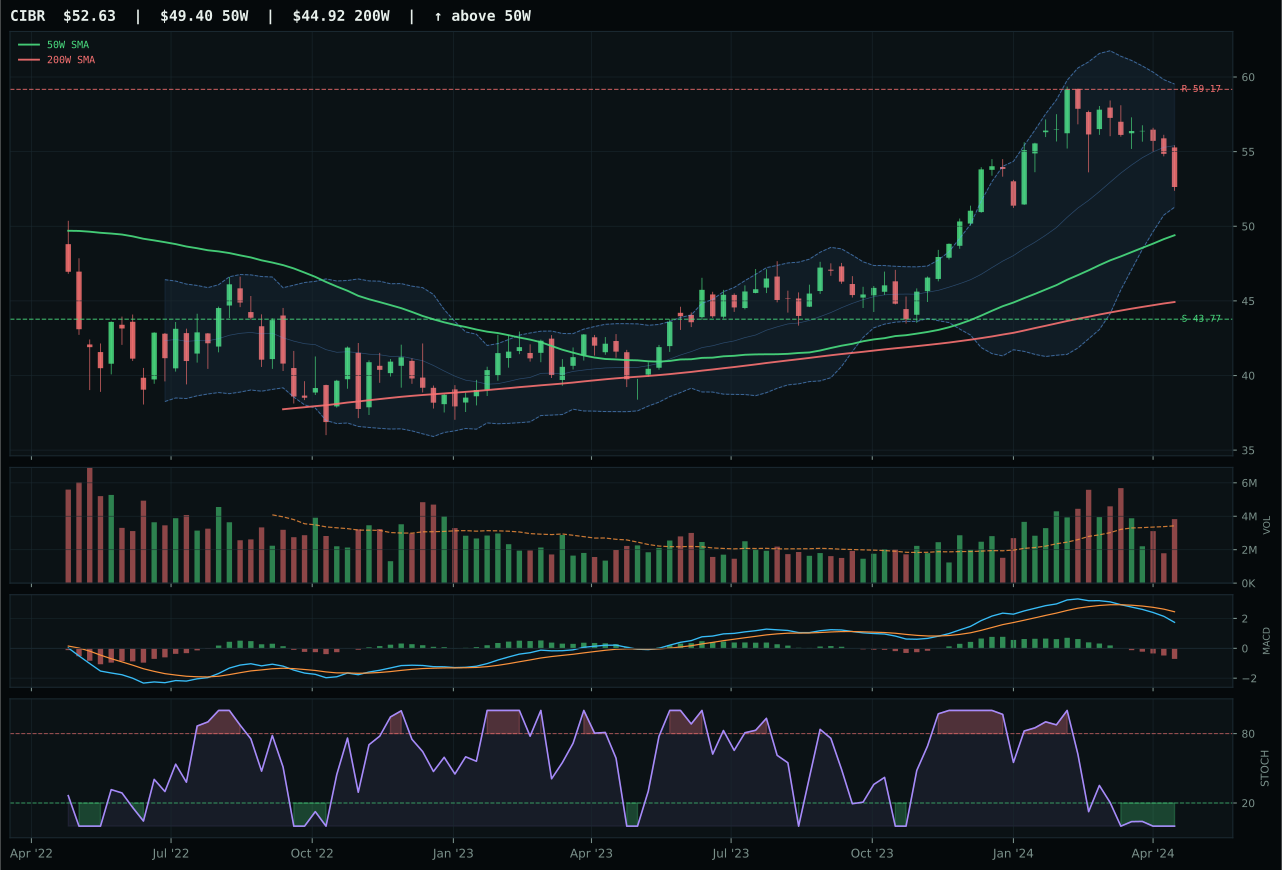
CIBR has a neutral structure profile with -7.9% 13-week relative strength versus SPY.
A failed hold above support would weaken the setup.
Actionable but governed by invalidation levels.
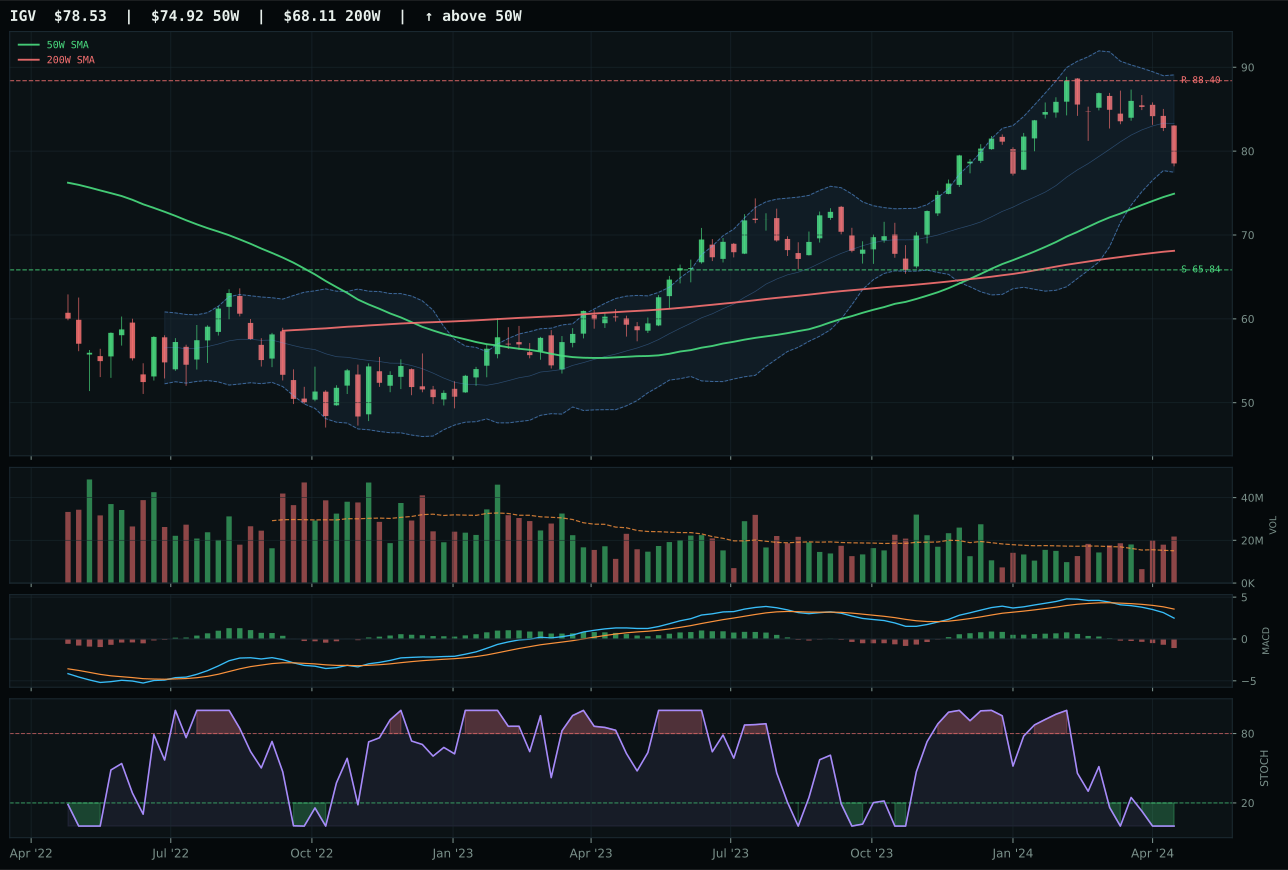
IGV has a neutral structure profile with -8.8% 13-week relative strength versus SPY.
A failed hold above support would weaken the setup.
Actionable but governed by invalidation levels.
CIBR claims the category despite a razor-thin margin over XLK, winning on the quality of its relative strength positioning within the cybersecurity subset rather than absolute momentum. The 0.0% category-relative strength and -7.9% SPY-relative RS tells the story: this is a defensive technology play holding its own against a broad sector selloff, not chasing price. XLK's 1.4% internal edge and -6.5% SPY lag proved insufficient because its broader profit-center exposure leaves it more vulnerable to the macro headwinds that are actively suppressing growth multiples. Both sit oversold on stochastic RSI with neutral structures 6-7% above their 50-week moving averages, but CIBR's 55.0 risk/reward versus XLK's 53.0 reflects a tighter setback relative to support—the setup is cleaner and the invalidation zone is tighter.
Technology receives 0% allocation this week, ranked outside the top eight and therefore excluded entirely from the portfolio. The category score of 22.1 reflects a macro environment that is actively hostile to growth and innovation equity: liquidity stress, credit stress, and dollar pressure are all firing as headwinds, and AI sponsorship cannot overcome the structural damage. Late-Cycle Reflation should favor durable cash flows and real assets, not multiple expansion or software licensing. For Technology to earn a position next week, either two tier-2 categories would need to collapse materially, or MACD would need to flip to bullish across the entire three-ETF basket and prove volume is accumulating rather than just bouncing. The setup quality is acceptable—both CIBR and XLK are cleanly positioned near Fibonacci levels—but the macro regime and momentum divergence make this a wait.
Emerging Markets — IEMG
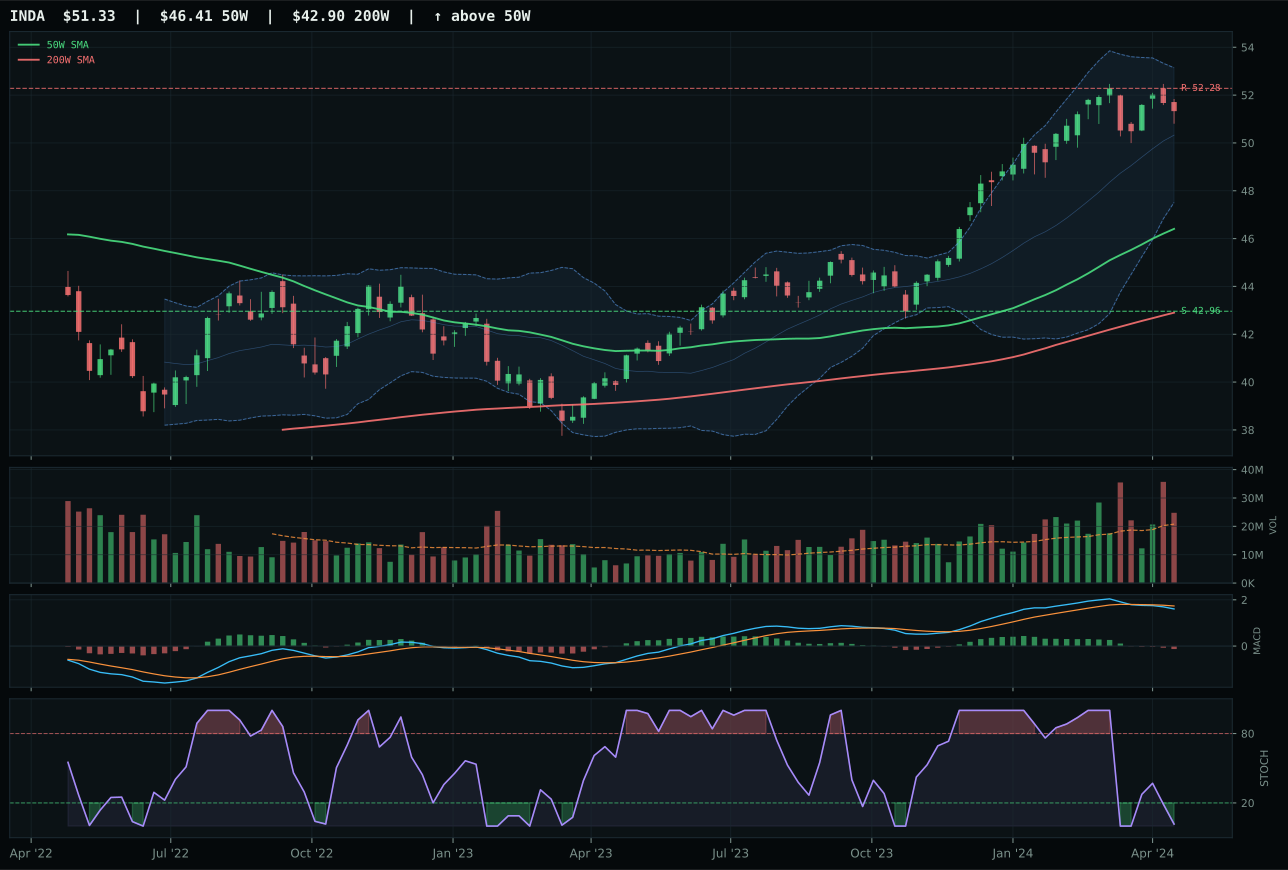
INDA has a neutral structure profile with 0.9% 13-week relative strength versus SPY.
A failed hold above support would weaken the setup.
Actionable but governed by invalidation levels.
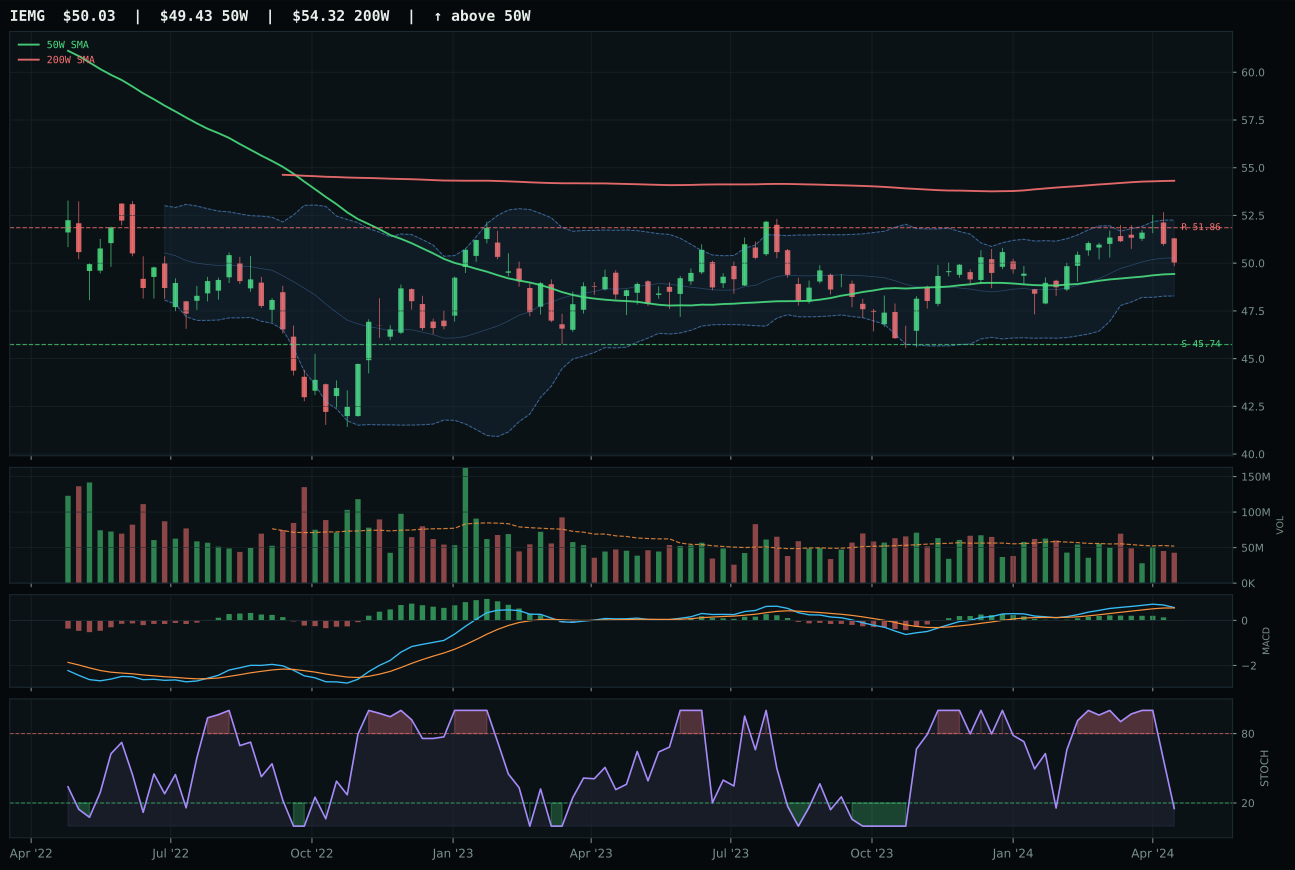
IEMG has a compression near 50W profile with 0.7% 13-week relative strength versus SPY.
A failed hold above support would weaken the setup.
Actionable but governed by invalidation levels.
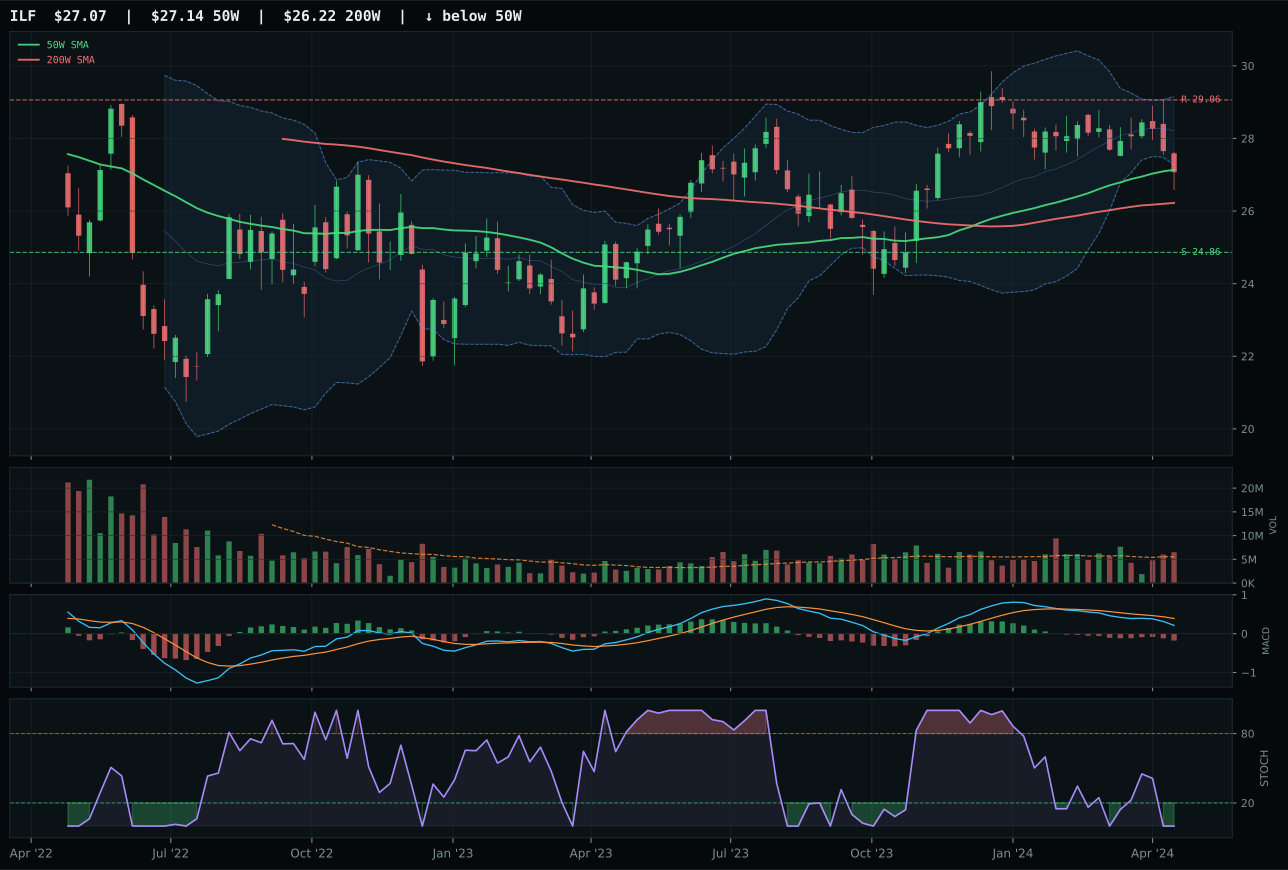
ILF has a compression near 50W profile with -5.1% 13-week relative strength versus SPY.
A failed hold above support would weaken the setup.
Actionable but governed by invalidation levels.
IEMG wins by virtue of the least-damaged technical setup in a deeply challenged category, with the only bullish MACD reading and the tightest compression (just 1.2% from the 50-week) that offers a defined inflection point. Stochastic RSI at 0.15 oversold is the critical edge: if support at 45.74 holds, the risk/reward inverts sharply in favor of compression breakout. INDA's 10.6% extension to the 50-week and bearish-weakening MACD condemn it as an extended bear-case short rather than a recovery candidate. The score gap of 12.5 points is decisive, but it reflects the depth of this category's damage: 66.6 technical evidence against macro fit of only 24.0 is not a winning combination in any regime.
Emerging Markets receives 0% allocation and is ranked outside the top eight, excluded entirely from the portfolio. The category score of 8.8 is the lowest in the entire ten-slot universe, destroyed by a macro fit score of just 7.0. Dollar pressure, credit stress, liquidity stress, and broad market bear are firing at combined -43, creating a structural headwind that overwhelms any technical setup quality. IEMG's 95.0 timing score—the highest in the category—offers some scaffolding, but one strong timing component cannot carry a category when the macro regime is explicitly hostile to emerging market flows. For Emerging Markets to earn even tier-2 allocation, either the dollar would need to break its strength narrative sharply, or credit stress would need to ease with visible capital flows returning to EM. Until one of those two conditions flips, IEMG will remain a short candidate for active traders, not a portfolio holding.