
2024-04-12
Informational purposes only. The content in this report, including allocations, analysis, and commentary, is provided solely for informational and educational purposes. It does not constitute financial advice, investment advice, trading advice, or any other type of advice. Past performance does not guarantee future results. Always conduct your own research and consult a qualified financial professional before making investment decisions.
Weekly Allocation
| Ticker | Category | Weight | Role |
|---|---|---|---|
| FBTC | 50% | Overlay | |
| XLE | Traditional Energy | 10% | Top-2 (10%) |
| GLD | Precious Metals | 10% | Top-2 (10%) |
| COPX | Industrial Metals | 5% | Tier-2 (5%) |
| URNM | Nuclear Energy | 5% | Tier-2 (5%) |
| XLU | Utilities & Infrastructure | 5% | Tier-2 (5%) |
| AIQ | AI | 5% | Tier-2 (5%) |
| ITA | Defense & Aerospace | 5% | Tier-2 (5%) |
| WEAT | Agriculture & Livestock | 5% | Tier-2 (5%) |
Trade Instructions — Monday Open
Sell the tranche from 2024-03-15 (completing its 4-week hold). Buy the new tranche. Instructions show net portfolio changes — same-asset positions cancel, weight changes show the delta.
| Action | Ticker | Instruction |
|---|---|---|
| SELL | SMH | Sell 50% of SMH position (reduce 5.00% → 2.50%) |
| SELL | SLV | Sell 50% of SLV position (reduce 2.50% → 1.25%) |
| SELL | XAR | Sell 50% of XAR position (reduce 2.50% → 1.25%) |
| SELL | NLR | Sell 50% of NLR position (reduce 2.50% → 1.25%) |
| SELL | XLK | Sell 33% of XLK position (reduce 3.75% → 2.50%) |
| SELL | PAVE | Sell 33% of PAVE position (reduce 3.75% → 2.50%) |
| BUY | ITA | Buy ITA — 14.29% of freed cash (adds 1.25% to portfolio) |
| BUY | XLU | Buy XLU — 14.29% of freed cash (adds 1.25% to portfolio) |
| BUY | GLD | Buy GLD — 28.57% of freed cash (adds 2.50% to portfolio) |
| BUY | URNM | Buy URNM — 14.29% of freed cash (adds 1.25% to portfolio) |
| BUY | AIQ | Buy AIQ — 14.29% of freed cash (adds 1.25% to portfolio) |
| BUY | WEAT | Buy WEAT — 14.29% of freed cash (adds 1.25% to portfolio) |
Current Portfolio After Trade
Combined holdings across all 4 active tranches. Each tranche is 25% of the portfolio.
| Ticker | % of Portfolio | Weight Bar |
|---|---|---|
| FBTC | 50.00% | |
| XLE | 10.00% | |
| GLD | 6.25% | |
| COPX | 5.00% | |
| ITA | 3.75% | |
| XLU | 3.75% | |
| XLK | 2.50% | |
| PAVE | 2.50% | |
| SMH | 2.50% | |
| URA | 2.50% | |
| URNM | 2.50% | |
| AIQ | 2.50% | |
| SLV | 1.25% | |
| XAR | 1.25% | |
| NLR | 1.25% | |
| MOO | 1.25% | |
| WEAT | 1.25% |
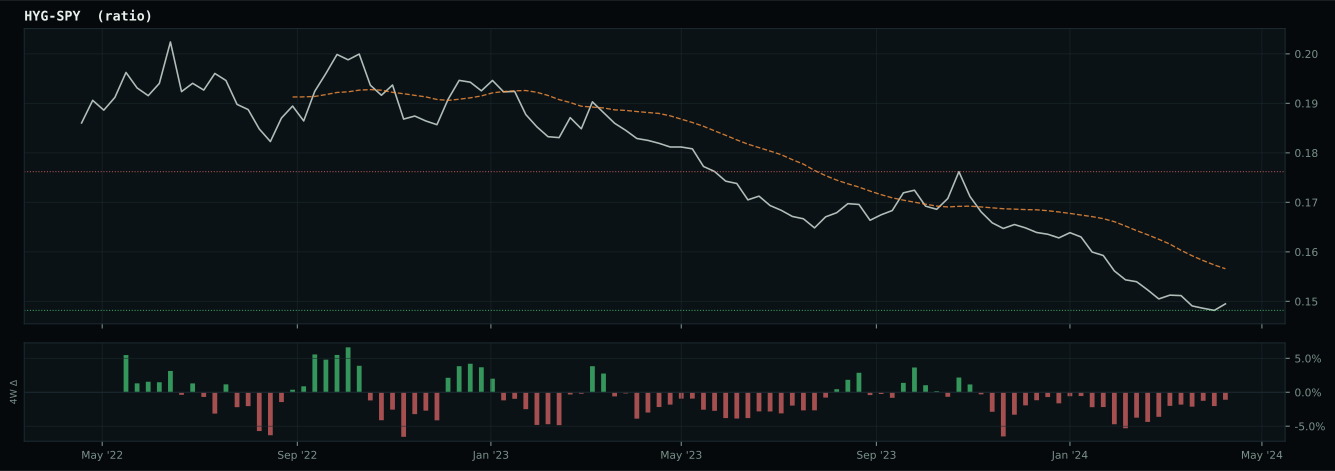
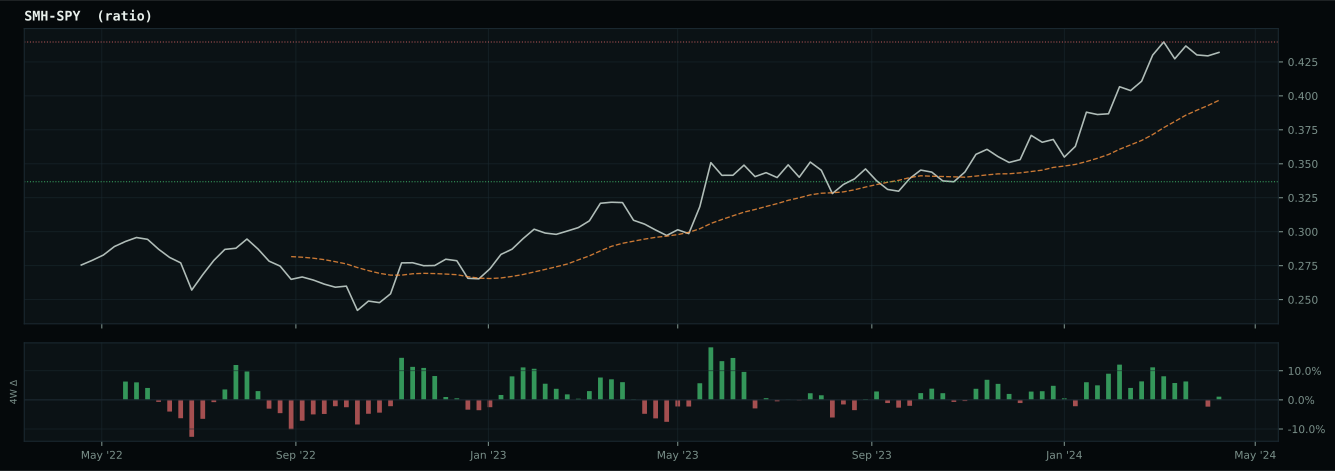
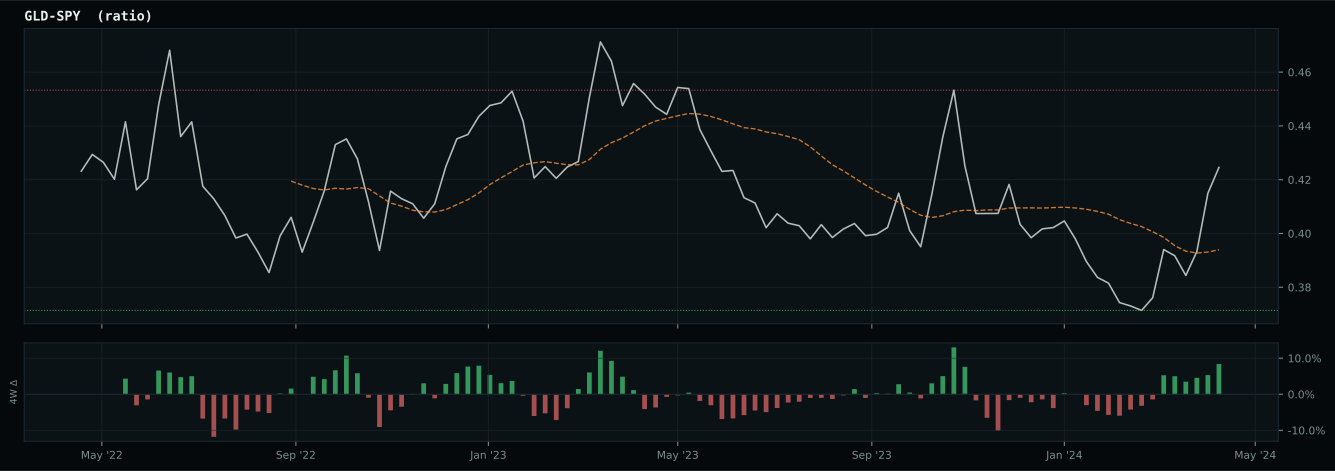
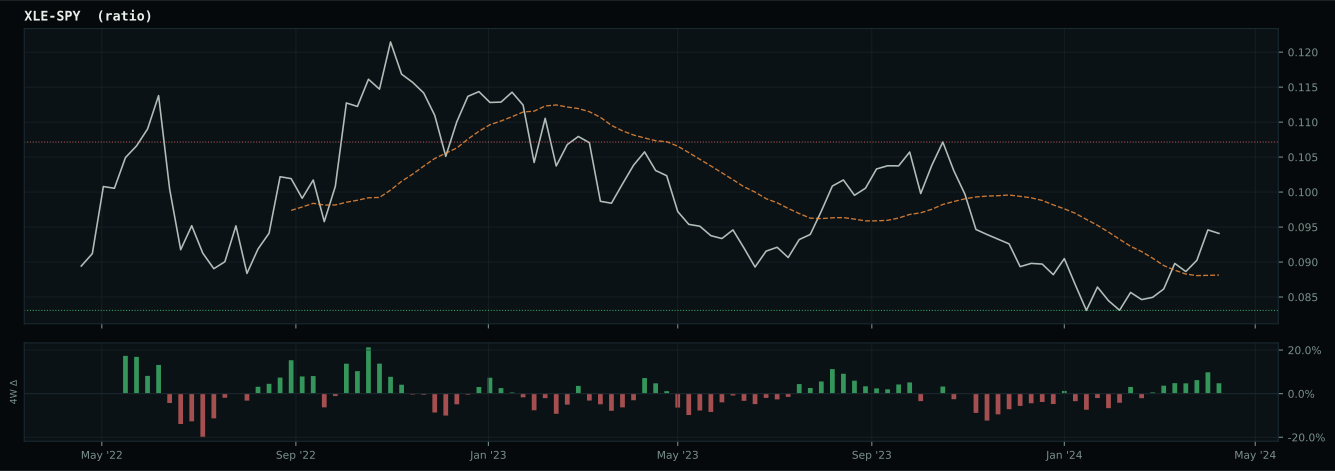
Macro Regime — Late-Cycle Reflation
Macro Evidence Charts
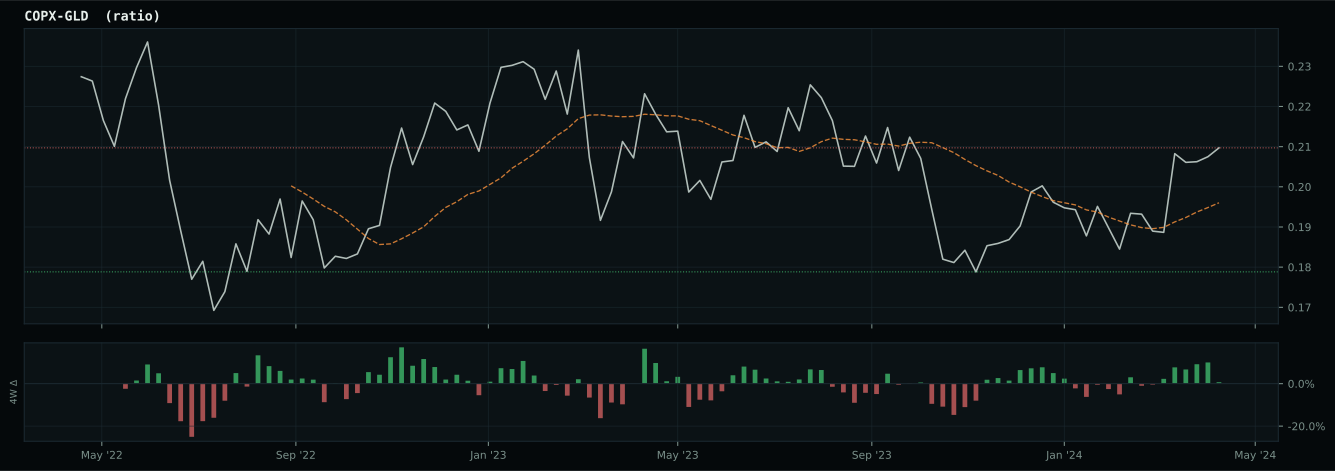
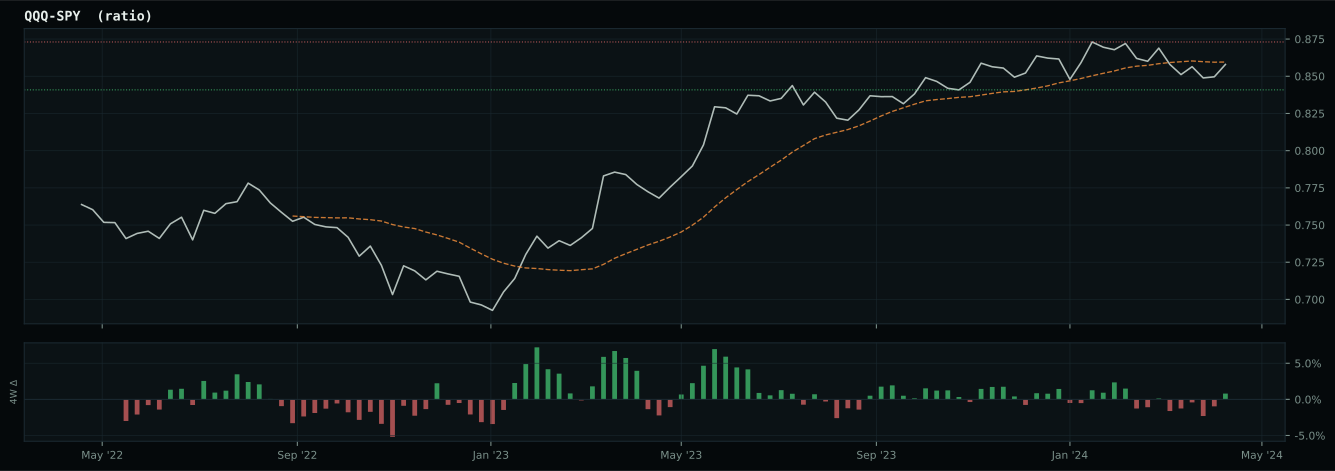
Market-implied signals behind the macro regime scores. Each ratio compares two assets; the direction and slope of the ratio is what the macro engine reads.
Crypto Regime — TrendBTC
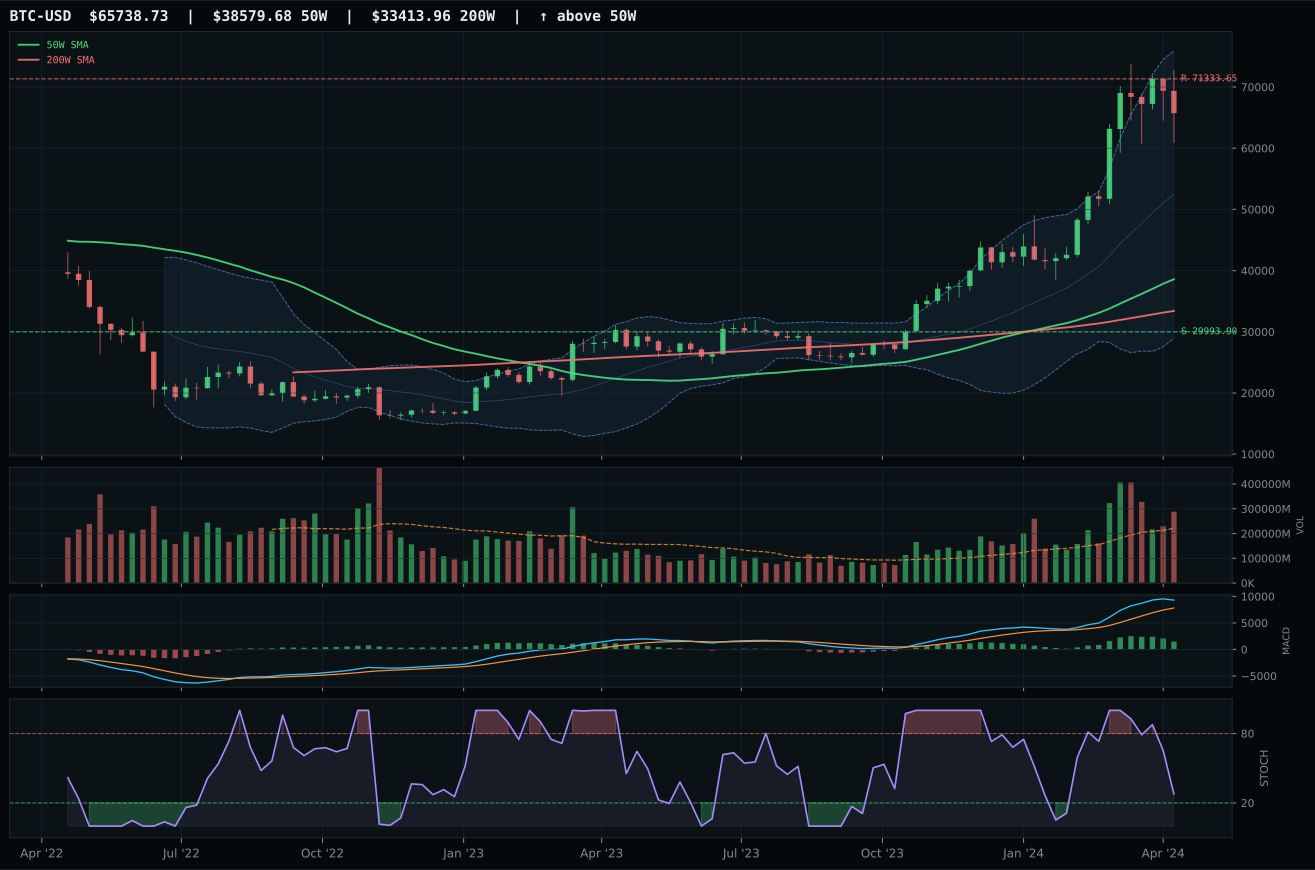
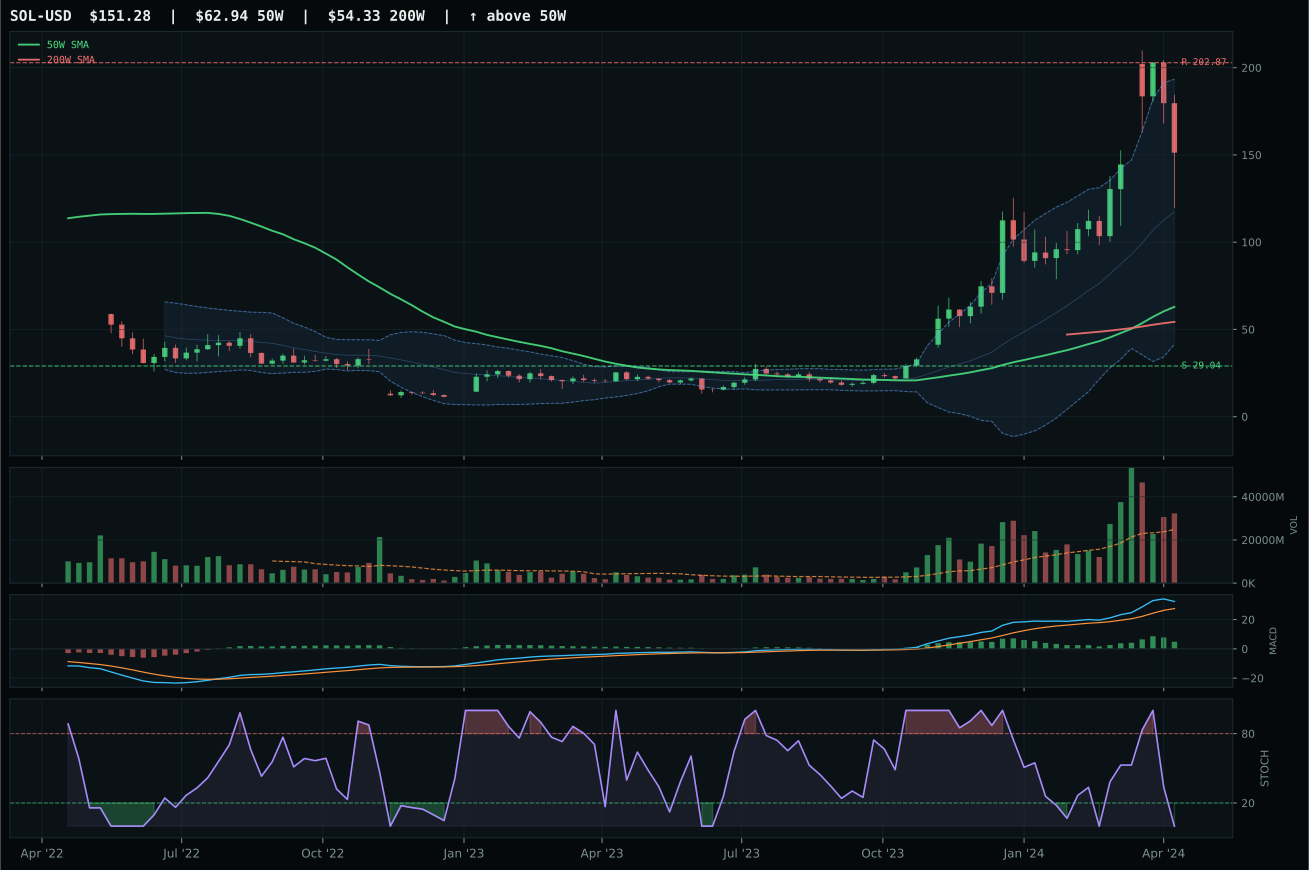
post-touch structure is too wide to count as a range; max/min close ratio is 3.22
TrendBTC confirmed: 2 consecutive closes above rising/flat 50W SMA
one or more available conditions failed
Category Rankings
| Rank | Category | Winner | Score | Alloc | 4W Ret | Peers (4W) |
|---|---|---|---|---|---|---|
| 1 | Traditional Energy | XLE | 84.8 | 20% | -2.63% | XOP -4.4% · FCG -2.4% |
| 2 | Precious Metals | GLD | 79.3 | 20% | -0.40% | SLV -1.4% · GDX +3.1% |
| 3 | Industrial Metals | COPX | 67.7 | 10% | +3.92% | PICK +0.6% · REMX +3.3% |
| 4 | Nuclear Energy | URNM | 51.7 | 10% | +3.17% | NLR +5.9% · URA +3.5% |
| 5 | Utilities & Infrastructure | XLU | 45.4 | 10% | +10.63% | PAVE +1.9% · IGF +8.0% |
| 6 | AI | AIQ | 38.8 | 10% | -0.44% | SMH +0.1% · BOTZ +3.5% |
| 7 | Defense & Aerospace | ITA | 33.4 | 10% | +4.79% | XAR +5.4% · ROKT +6.3% |
| 8 | Agriculture & Livestock | WEAT | 31.3 | 10% | +16.98% | VEGI +1.8% · MOO +3.0% |
| 9 | Technology | XLK | 30.1 | 0% | +0.18% | IGV -1.4% · CIBR -1.0% |
| 10 | Emerging Markets | ILF | 7.6 | 0% | +3.77% | IEMG +4.6% · INDA +0.0% |
Traditional Energy — XLE
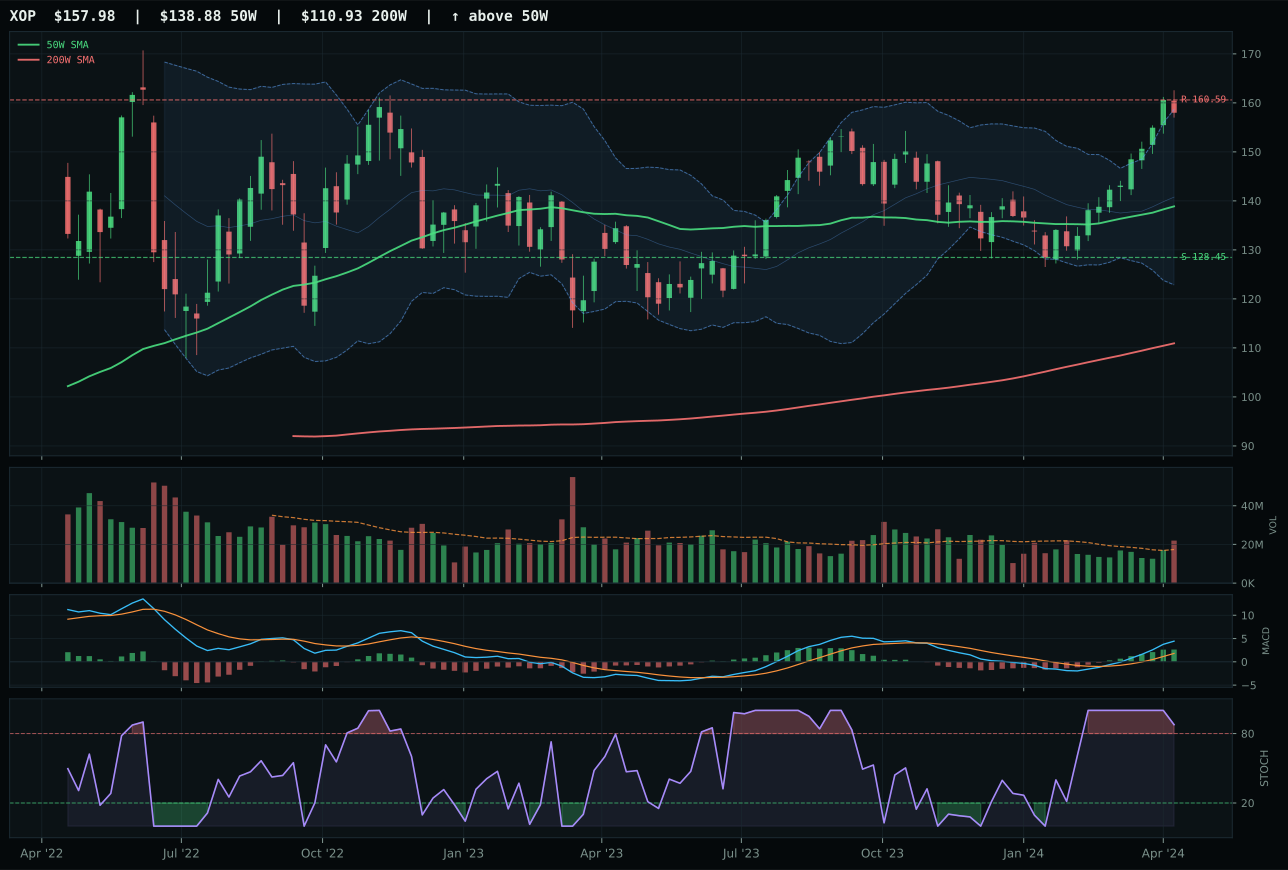
XOP has a neutral structure profile with 10.9% 13-week relative strength versus SPY.
A failed hold above support would weaken the setup.
Actionable but governed by invalidation levels.
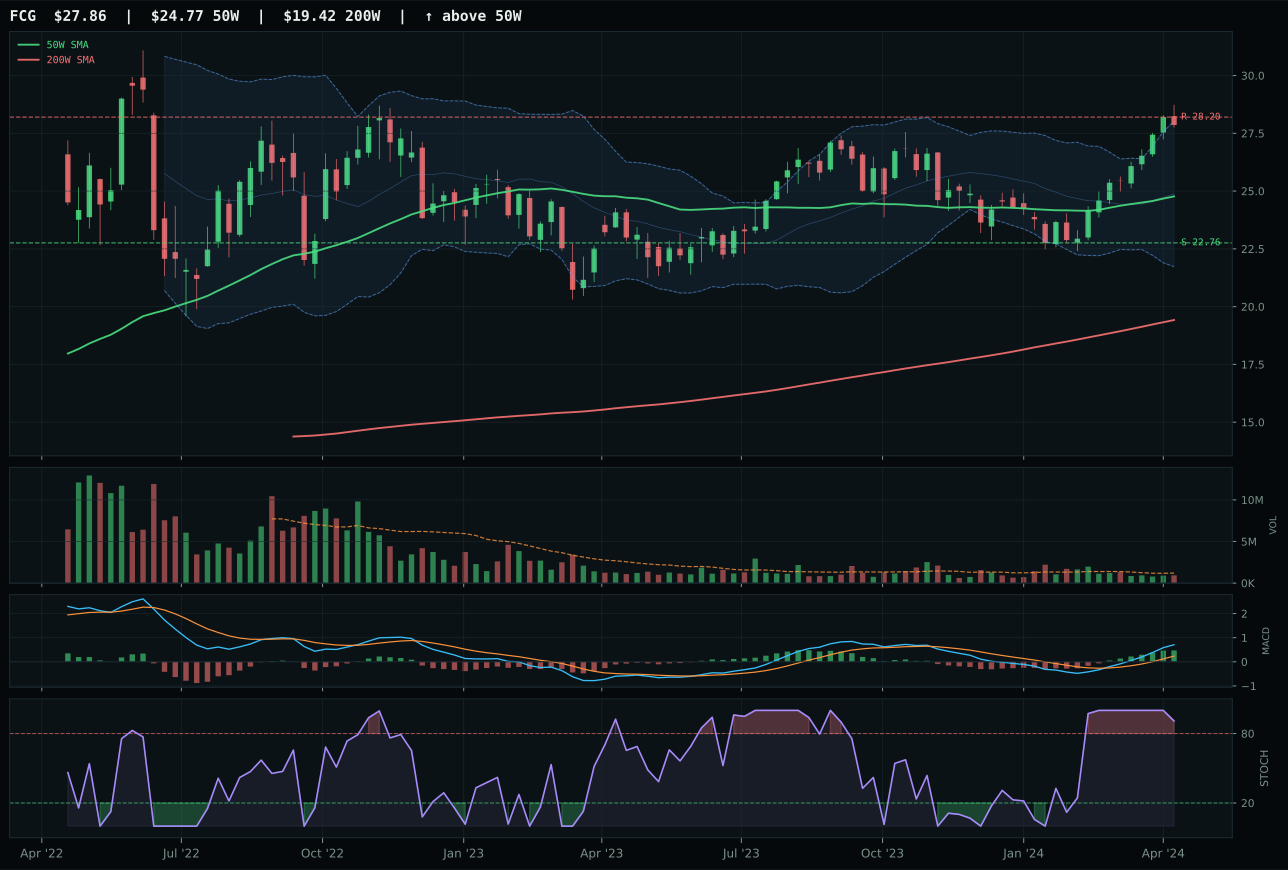
FCG has a neutral structure profile with 10.0% 13-week relative strength versus SPY.
A failed hold above support would weaken the setup.
Actionable but governed by invalidation levels.
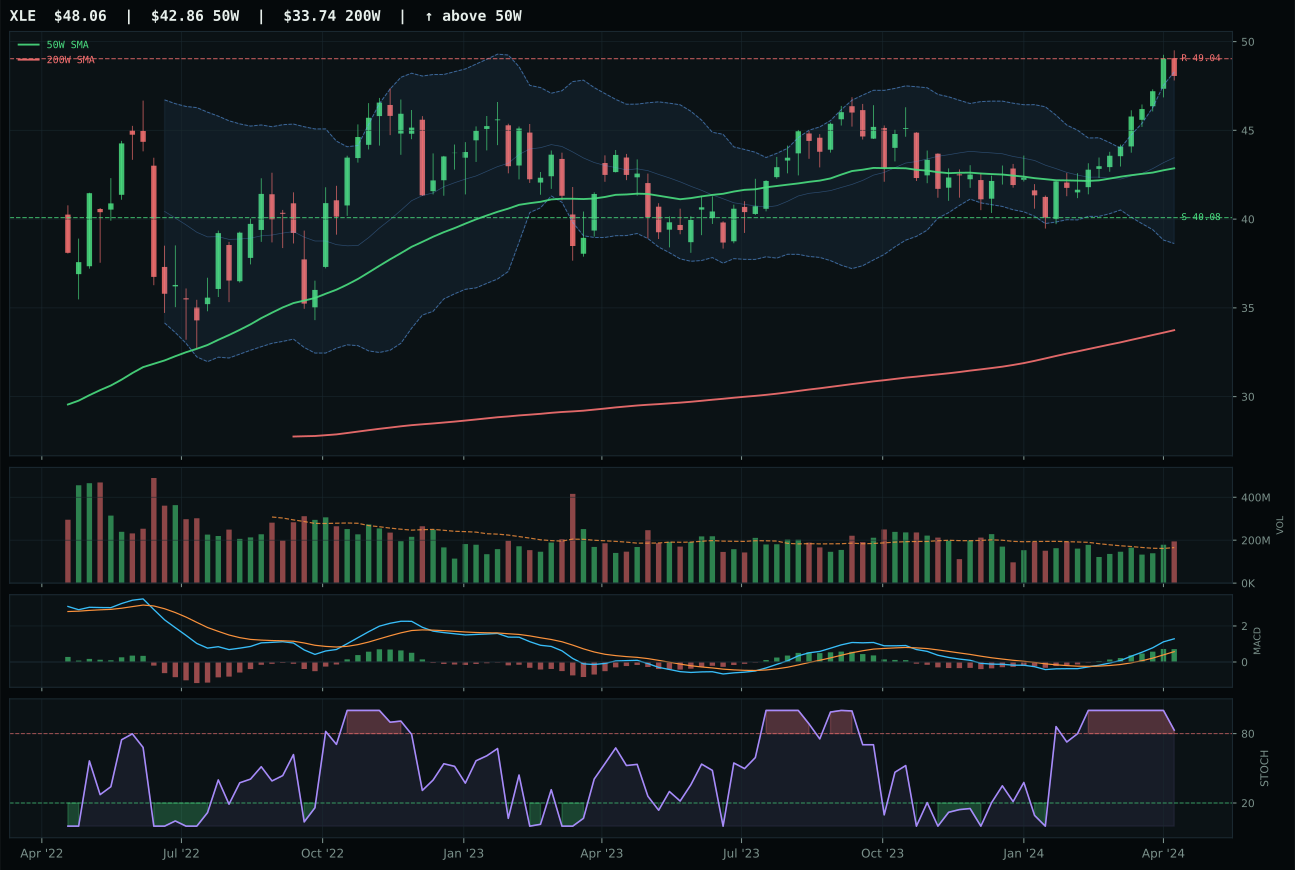
XLE has a neutral structure profile with 9.1% 13-week relative strength versus SPY.
A failed hold above support would weaken the setup.
Actionable but governed by invalidation levels.
XLE wins a tight 1.5-point decision over XOP by defending its timing score (57.0 versus 49.0) and risk-reward (46.8 versus 38.3) despite XOP's superior 13-week return (18.1% versus 16.3%) and category-relative strength (1.0% versus -0.9%). Both ETFs are in the same neutral-structure setup with bullish-and-improving MACD and overbought stochastic RSI rolling over, so the decision is about entry quality and capital preservation. XLE's 12.1% distance from the 50W is tighter than XOP's extension further up, meaning integrated large-cap energy offers a better margin of safety than exploration-beta volatility. XLE's volume at 1.17x average is above-participation but not excessive, whereas XOP's equivalent volume supports its strong move but raises the tail-risk of a distribution unwind. Technical evidence favors XOP at 77.6 versus XLE's 76.6, yet that 1.0-point advantage is overwhelmed by macro fit: XLE's 86.0 macro fit (versus XOP's 57.0) reflects the energy-scarcity and cash-flow-defense themes that define late-cycle leadership. XLE wins because it is the institutional-quality representative of energy strength, not the speculative beta play.
Traditional Energy earns 10% alongside Precious Metals as a top-2 category, scoring 84.8 on the strength of overwhelming macro alignment and real technical confirmation. Energy scarcity is active at +16, late-cycle reflation adds +12, inflation pressure contributes +10, and supply shortage is +9—the category-level macro fit of 90.0/100 is the highest across the portfolio. The technical evidence is solid at 76.6/100 for XLE, with a 77.8-weighted three-ETF basket score that passes all persistence and setup-quality filters. XLE's overbought stochastic RSI (0.83, rolling over) combined with distribution-pressure-free volume and neutral structure makes this a defensible extension entry in a late-cycle regime. At 10%, Traditional Energy is capital allocated to inflation protection, supply shock resilience, and real asset participation. This is the portfolio's core inflation hedge alongside Precious Metals, justified by genuine geopolitical supply constraints and macro-regime tailwinds.
Precious Metals — GLD
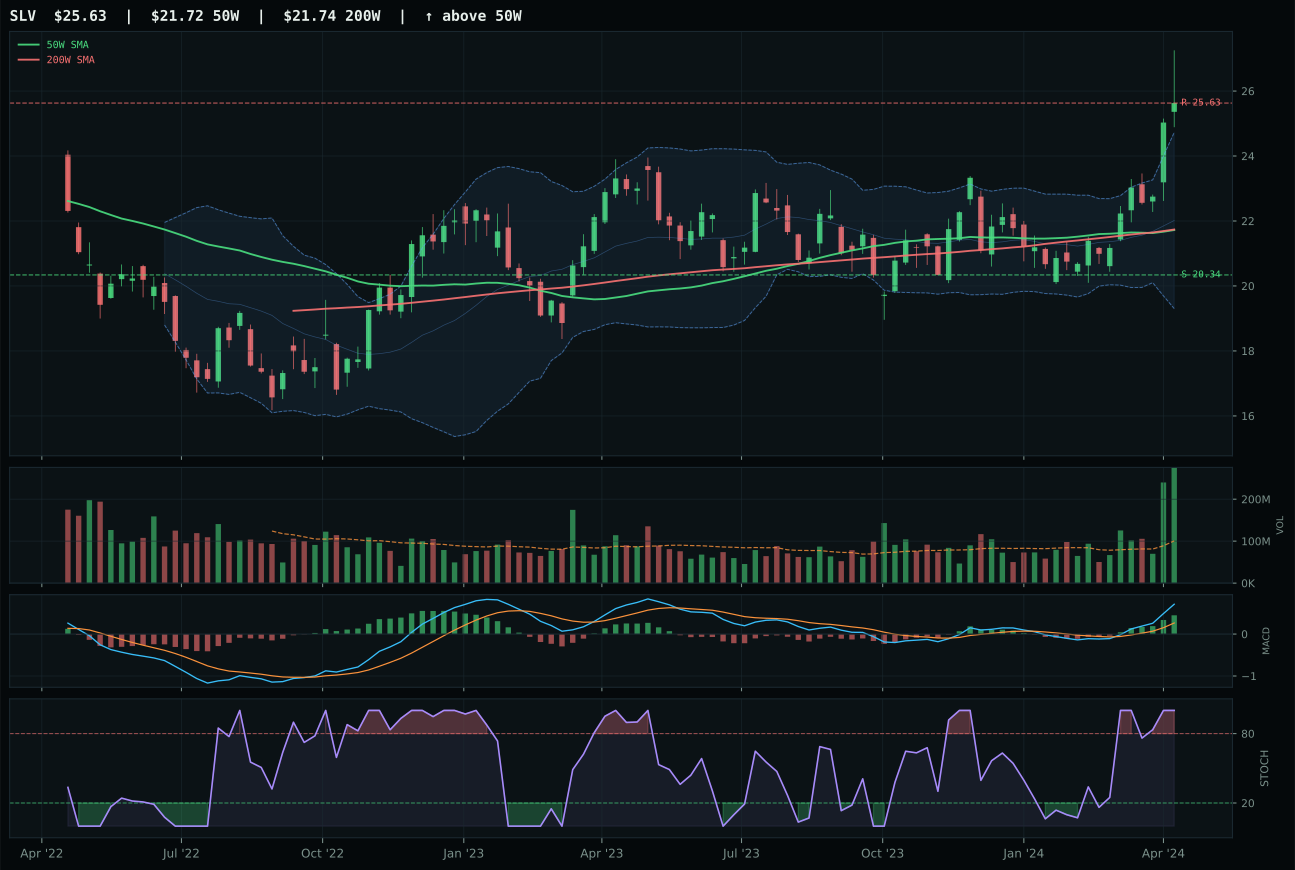
SLV has a vertical extension profile with 13.8% 13-week relative strength versus SPY.
A failed hold above support would weaken the setup.
Actionable but governed by invalidation levels.
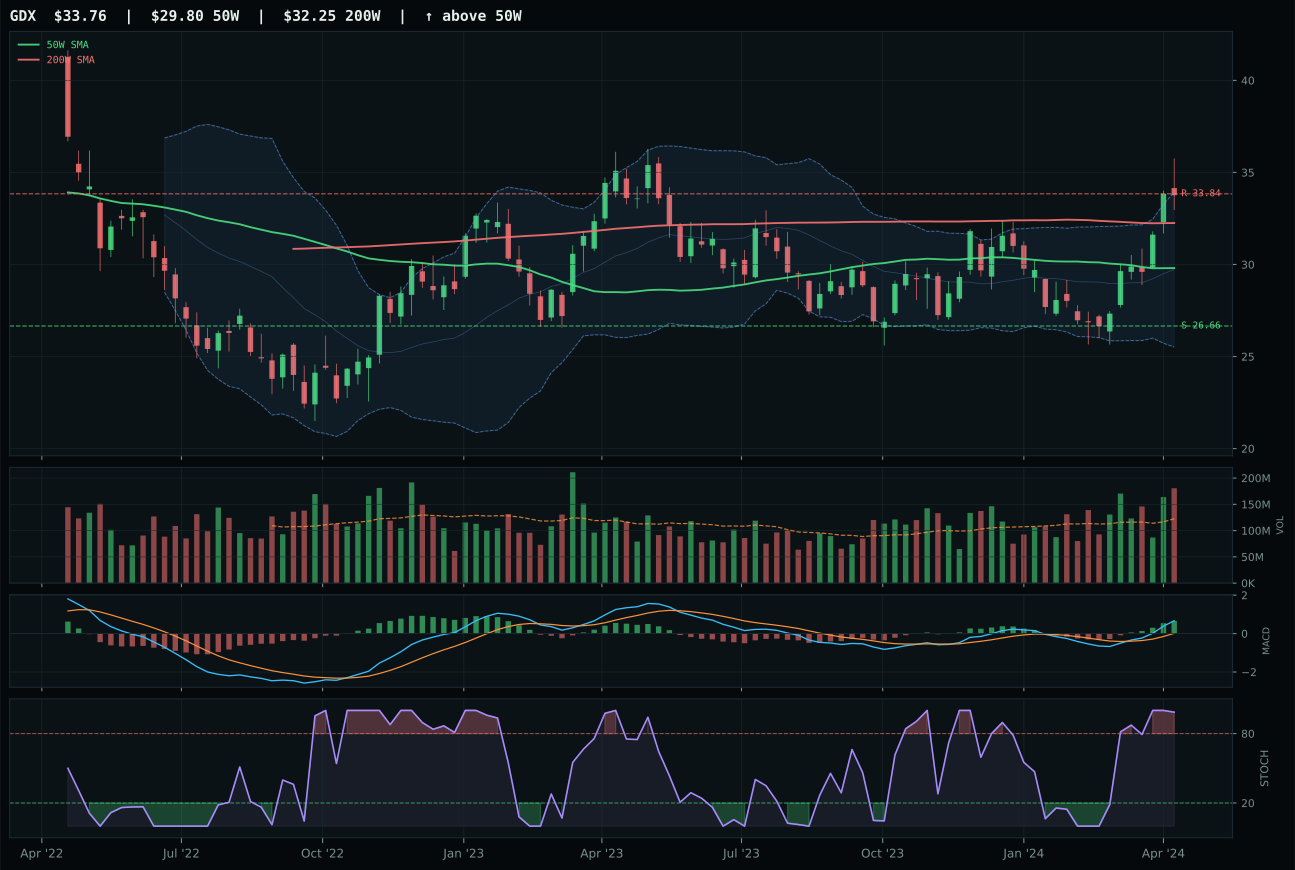
GDX has a neutral structure profile with 6.5% 13-week relative strength versus SPY.
A failed hold above support would weaken the setup.
Actionable but governed by invalidation levels.
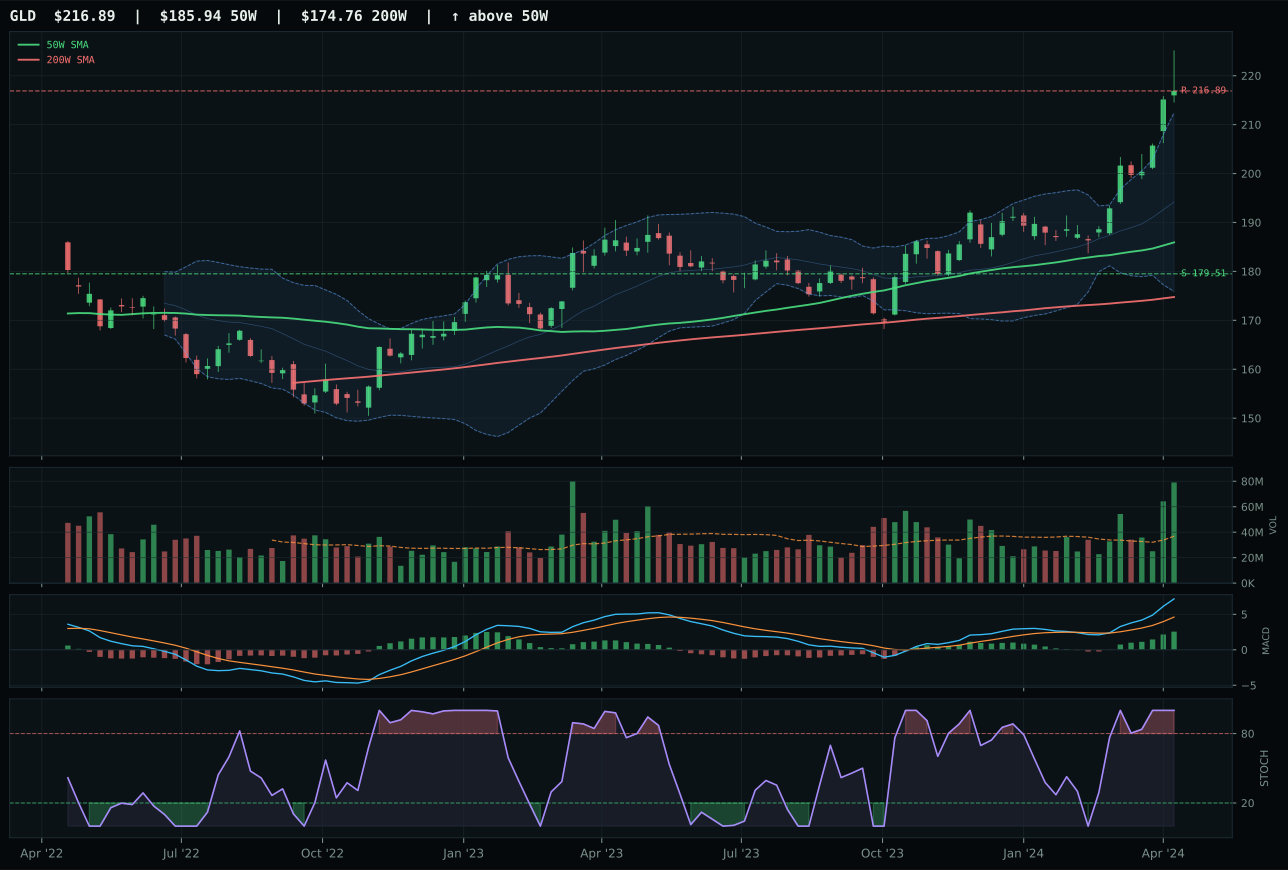
GLD has a vertical extension profile with 7.2% 13-week relative strength versus SPY.
A failed hold above support would weaken the setup.
Actionable but governed by invalidation levels.
GLD wins a razor-thin decision over SLV (0.6-point gap) by trading a slightly cleaner structure (84.6 versus 82.5) and demonstrating category-neutral relative strength rather than SLV's 6.6% outperformance. Both ETFs are in vertical extension—16.6% for GLD, similar distance for SLV—with identical MACD bullish-and-improving and stochastic RSI overbought readings, so the decision hinges on risk-adjusted positioning. GLD's 2.15x volume (accumulation/confirmation) and perfect 100.0 momentum confirmation score reflect genuine fund buying, not a squeeze-driven rally. SLV's 21.0% 13-week return is superior to GLD's 14.3%, yet that outperformance becomes a liability in an extended market where new buyers are late: GLD's category-neutral stance means it is holding current holders while SLV's 6.6% category outperformance suggests speculative flows. The monetary-hedge bid is active (+14 at category level) and applies equally to both, so the decision is purely technical infrastructure: GLD's cleaner structure and volume sponsorship make it the safer vehicle for representing the category's gold-monetization thesis.
Precious Metals earns 10% as the second-highest category score at 79.3, justified by overwhelming macro alignment in a late-cycle reflation environment. The monetary hedge bid is active at +14, supporting both gold and silver inflows; dollar pressure contributes +3, and despite risk appetite still being positive, the category macro fit reaches 63.0/100. The technical evidence across the three-ETF basket (86.3 weighted score) is genuinely strong: all three representatives show bullish MACD setups and overbought momentum confirmation, signaling conviction accumulation rather than speculative overflow. At 10% allocation, Precious Metals serves as the portfolio's primary duration hedge and inflation store-of-value. The only concern is entry risk—GLD sits 16.6% above its 50-week with timing score at just 45.0 due to extension—but the macro regime justifies holding into strength. This is capital allocated to credit stress protection and currency debasement hedging, not tactical oversold bounce.
Industrial Metals — COPX
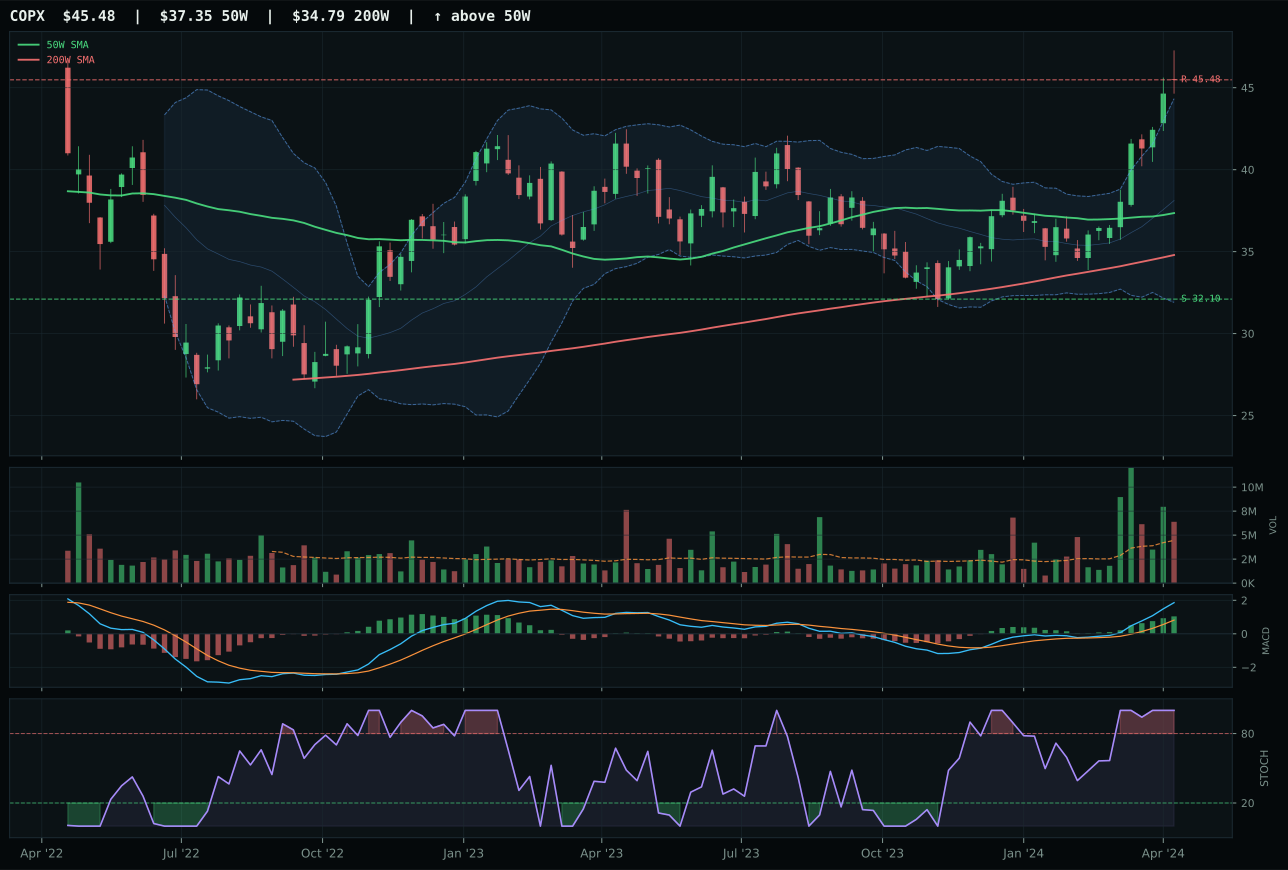
COPX has a vertical extension profile with 16.2% 13-week relative strength versus SPY.
A failed hold above support would weaken the setup.
Actionable but governed by invalidation levels.
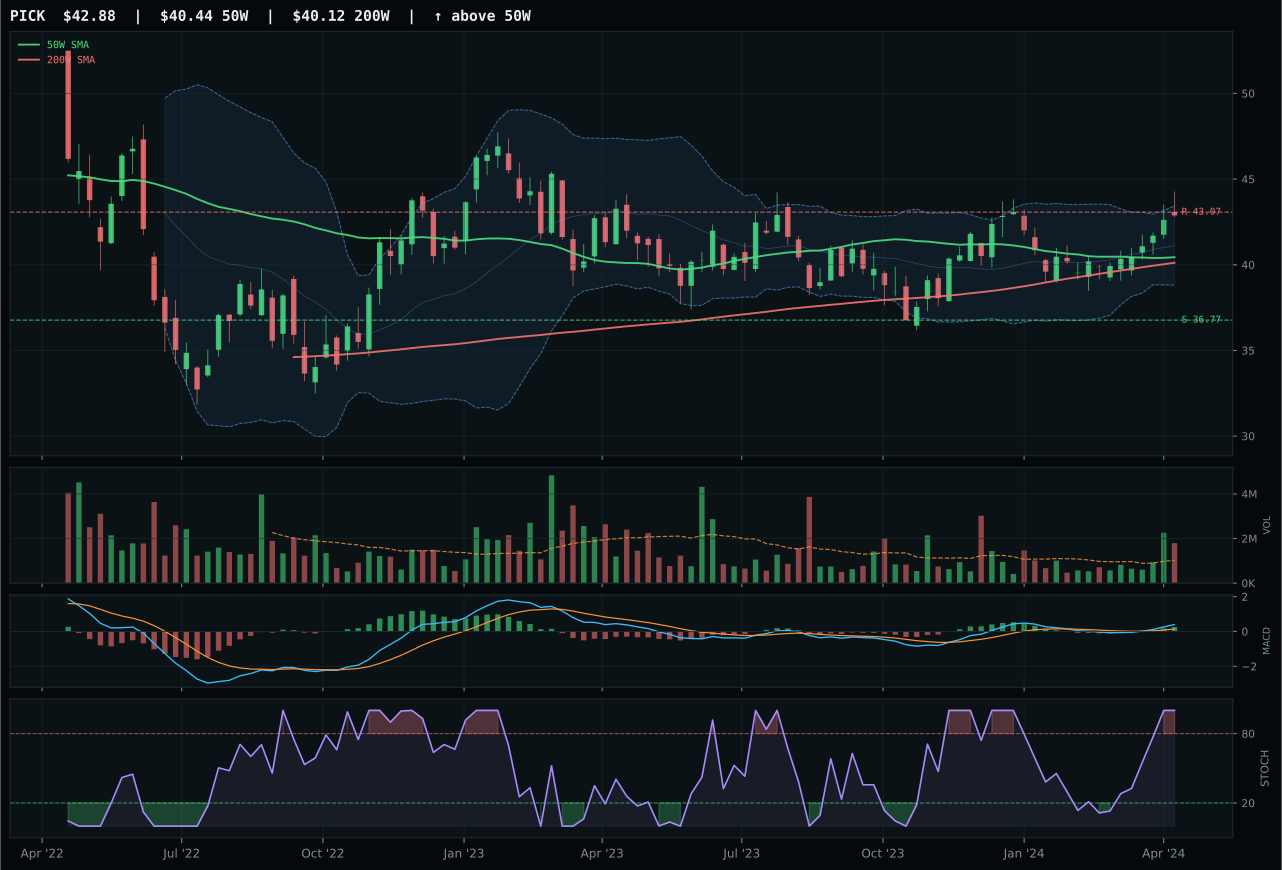
PICK has a neutral structure profile with -2.2% 13-week relative strength versus SPY.
A failed hold above support would weaken the setup.
Actionable but governed by invalidation levels.
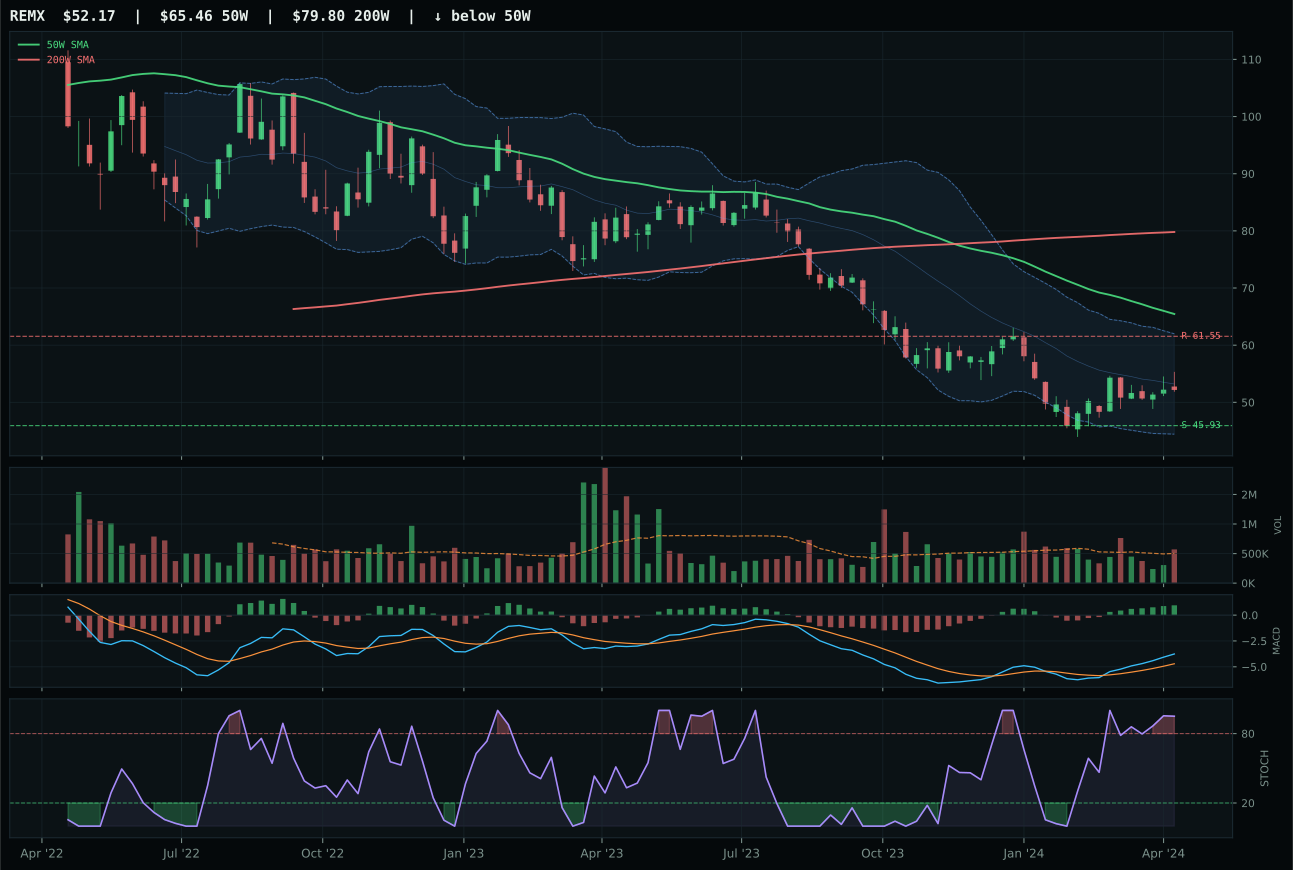
REMX has a neutral structure profile with -10.9% 13-week relative strength versus SPY.
Extension and support failure are the main tactical risks.
Tracked, but not top-2 eligible because: structurally broken.
COPX wins a decisive 5.7-point victory over PICK by demonstrating superior category-relative leadership (18.4% versus 0.0%) despite matching technical infrastructure on trend and momentum. Both ETFs are extended above the 50W (21.8% for COPX, similar for PICK) with bullish-and-improving MACD and overbought stochastic RSI at 1.00, so the technical setups are nearly identical. The differentiation lies in relative strength: COPX's 16.2% SPY-relative outperformance and 18.4% category-relative edge reveal that copper scarcity and industrial demand are capturing the specific sponsorship flows, whereas PICK's broadly-diversified mining approach is getting the macro tailwind but losing the micro selection. COPX's volume at 1.44x confirms above-average participation, and its 23.4% 13-week return (versus PICK's 5.0%) shows that copper futures bidding is translating into ETF fund flows. Structure is marginally cleaner in COPX (81.0 versus an implied lower score in PICK), but the real victory is the demonstration that single-commodity specificity is outperforming diversified-basket breadth in this metals cycle.
Industrial Metals captures 5% allocation with a 67.7 category score ranking outside top-2 but inside the conviction sleeve. The technical evidence is dominant (97.0/100 for COPX alone), and the macro alignment is real: metals scarcity is active at +14, commodity breadth positive at +10, and late-cycle reflation adds +10 to category reasoning. The 68.0/100 category-level macro fit reflects genuine supply constraint sponsorship (lithium, copper, nickel all stressed) combined with late-cycle capex demand. However, COPX's vertical extension and overbought setup mean entry risk is measurable; the upside to resistance is 0.0%, and the downside to support spans 41.7%. This is a position held for commodity scarcity conviction and industrial demand resilience in late-cycle, not for fresh momentum entry. The 5% sleeve acknowledges both the macro strength and the technical warning that new money is paying peak prices.
Nuclear Energy — URNM
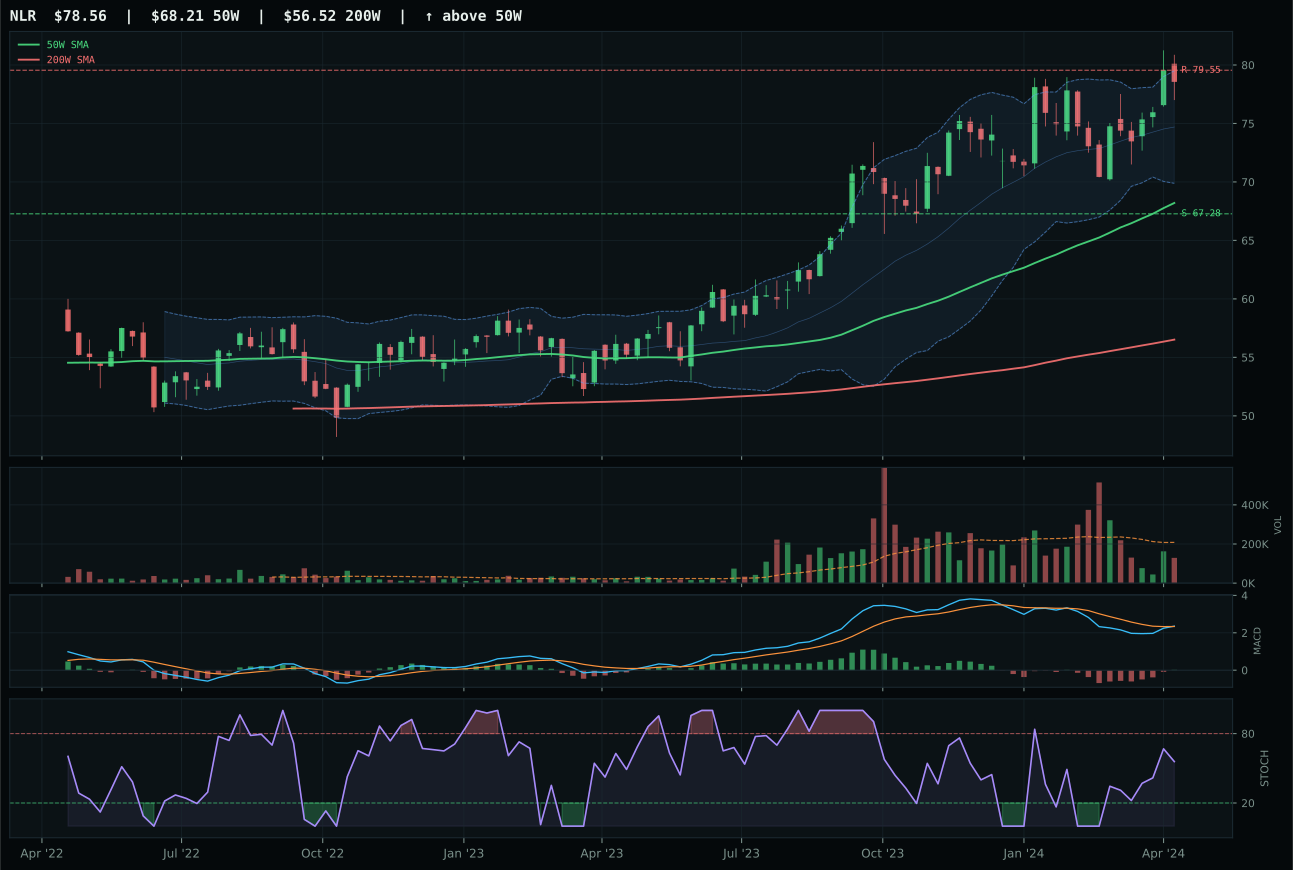
NLR has a vertical extension profile with -6.6% 13-week relative strength versus SPY.
A failed hold above support would weaken the setup.
Actionable but governed by invalidation levels.
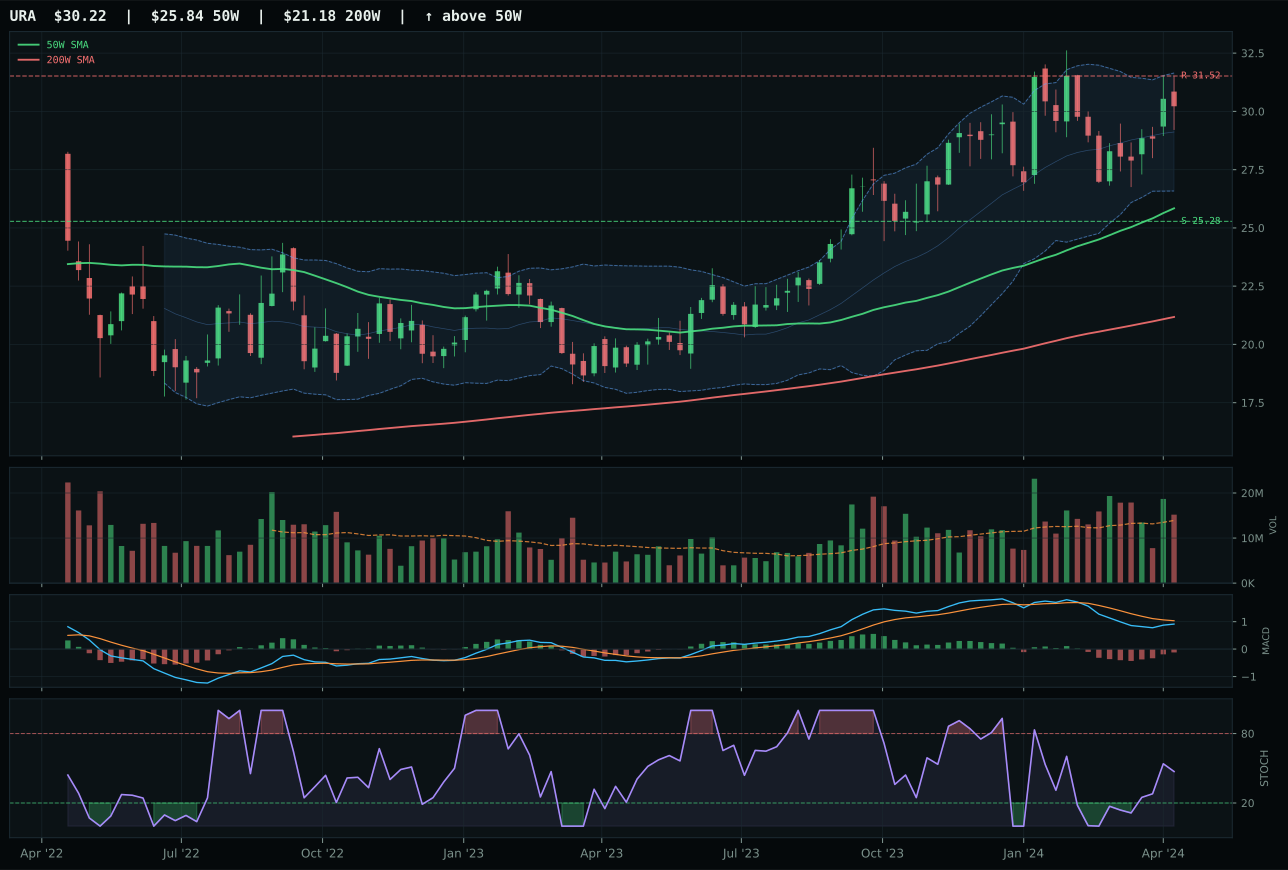
URA has a vertical extension profile with -11.2% 13-week relative strength versus SPY.
A failed hold above support would weaken the setup.
Actionable but governed by invalidation levels.
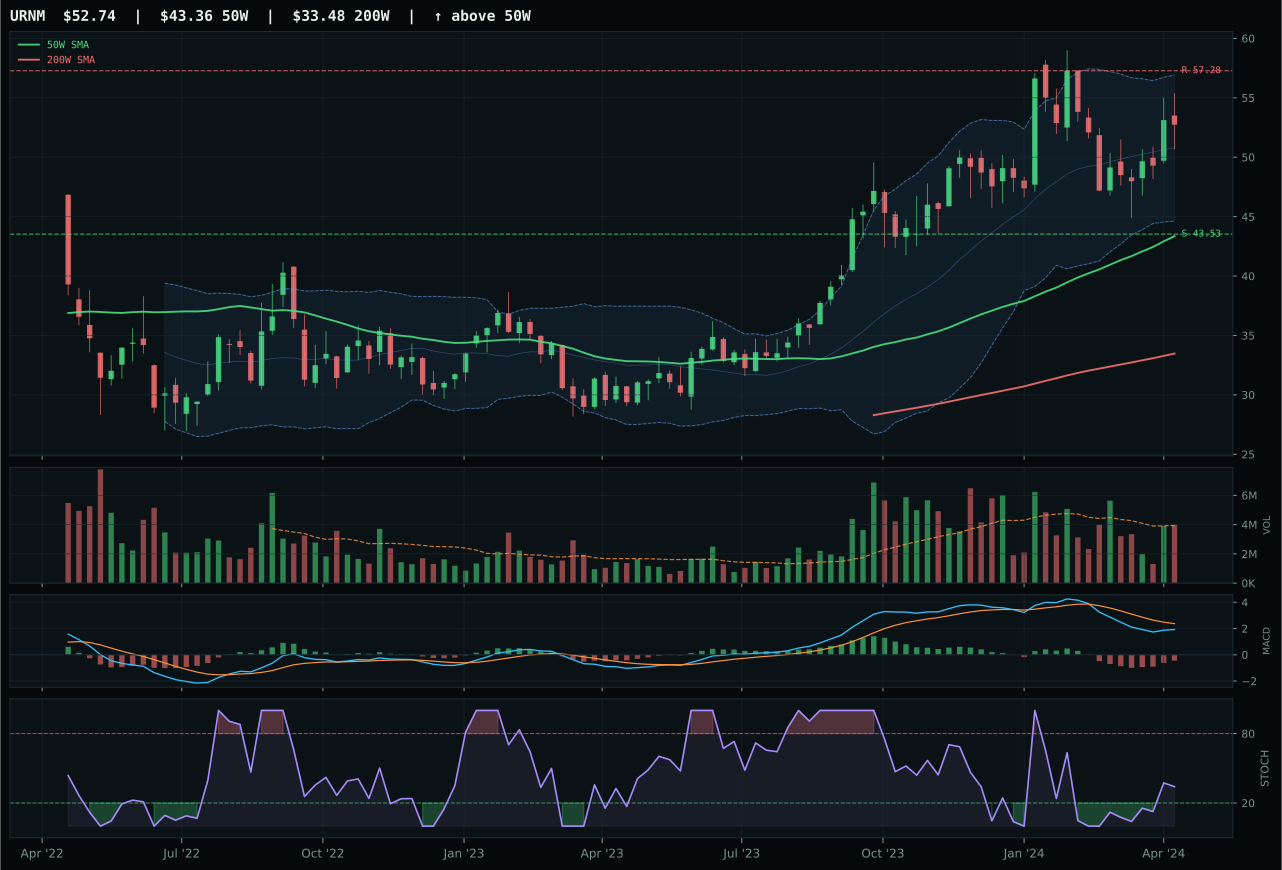
URNM has a vertical extension profile with -14.0% 13-week relative strength versus SPY.
A failed hold above support would weaken the setup.
Actionable but governed by invalidation levels.
URNM wins a clear 8.3-point decision over NLR despite being the weakest technical setup in its category, proving that macro sponsorship drives allocation in a confined sleeve. URNM is extended 21.6% above the 50W with a 13-week return of -6.9% and SPY-relative underperformance of -14.0%, yet it wins because its timing score (61.0 versus NLR's 53.0) reflects MACD bullish-but-improving with stochastic RSI rising mid-zone, signaling early recovery. NLR's superior trend (90 versus URNM's 78) and momentum (66 versus 36) are overmatched by timing disadvantage: NLR's stochastic RSI is also rising but less incisively, and its volume is thin participation versus URNM's neutral, meaning NLR lacks accumulation confirmation. The real defeat is structural: NLR trades at a 79.55 resistance level with only 7.1% upside room before hitting a hard ceiling, whereas URNM has 57.28 resistance 7.9% away but is being repair-timed perfectly by MACD. In a category where all three choices are compromised technically, the portfolio correctly chose the one with the best technical timing signal, even if the absolute setup quality is poor.
Nuclear Energy earns 5% allocation at a 51.7 score, a solidly mid-tier position reflecting balanced macro conviction with elevated technical risk. Energy scarcity is active at +9, real asset sponsorship at +7, and late-cycle reflation adds +7—a respectable 69.0/100 category-level macro fit. However, URNM's technical evidence is weak at 43.5/100; the winner shows MACD improving but price deteriorating (-6.9% 13-week), creating a tension between early-stage recovery setup and ongoing underperformance. This position is macro-driven: you are betting that uranium supply constraints and data-center AI power demand will drive future scarcity. The 5% sleeve acknowledges that bet without over-weighting a technically broken setup. If URNM's MACD continues improving and relative strength stabilizes, this would be promoted. For now, it sits at defensive weight in the energy allocation alongside XLE's stronger technical picture.
Utilities & Infrastructure — XLU
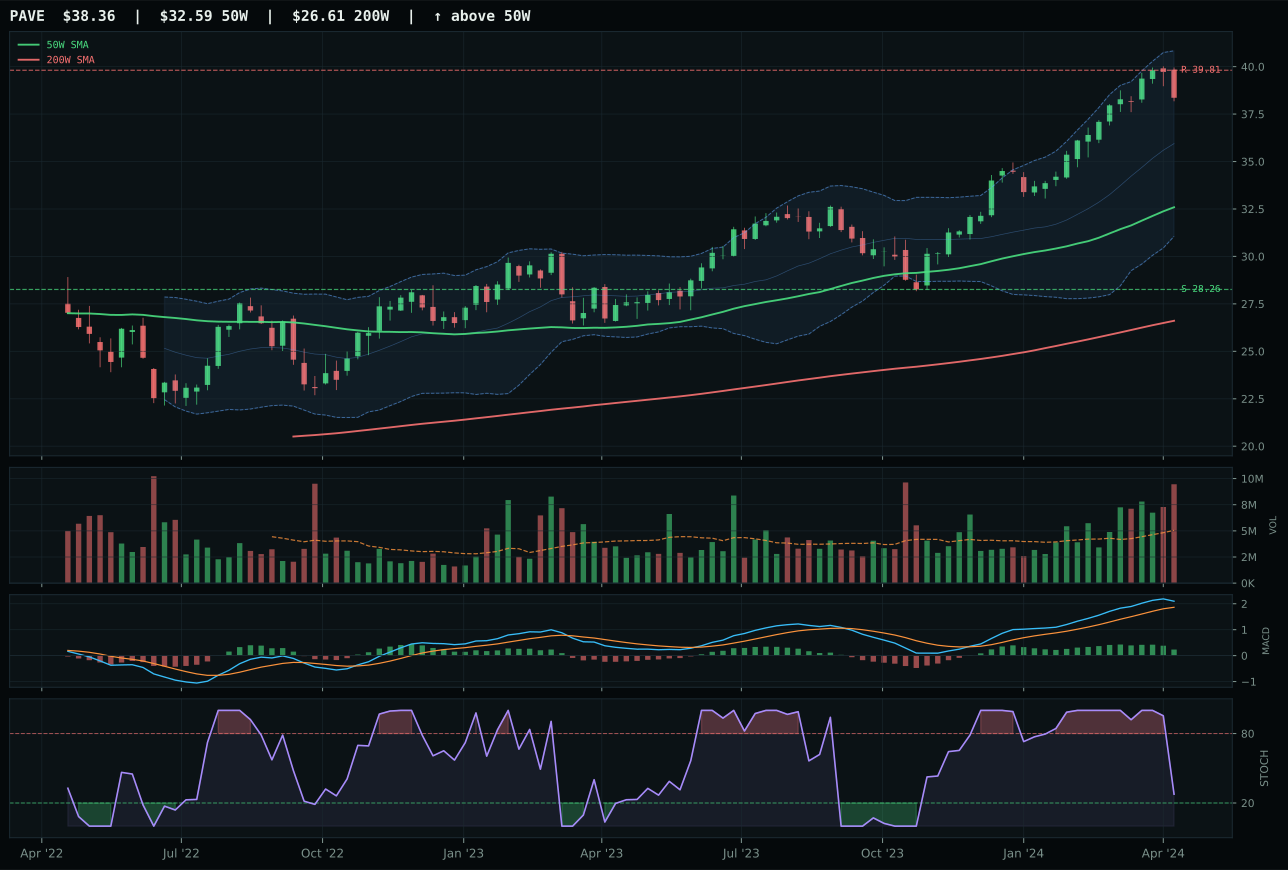
PAVE has a vertical extension profile with 6.7% 13-week relative strength versus SPY.
A failed hold above support would weaken the setup.
Actionable but governed by invalidation levels.
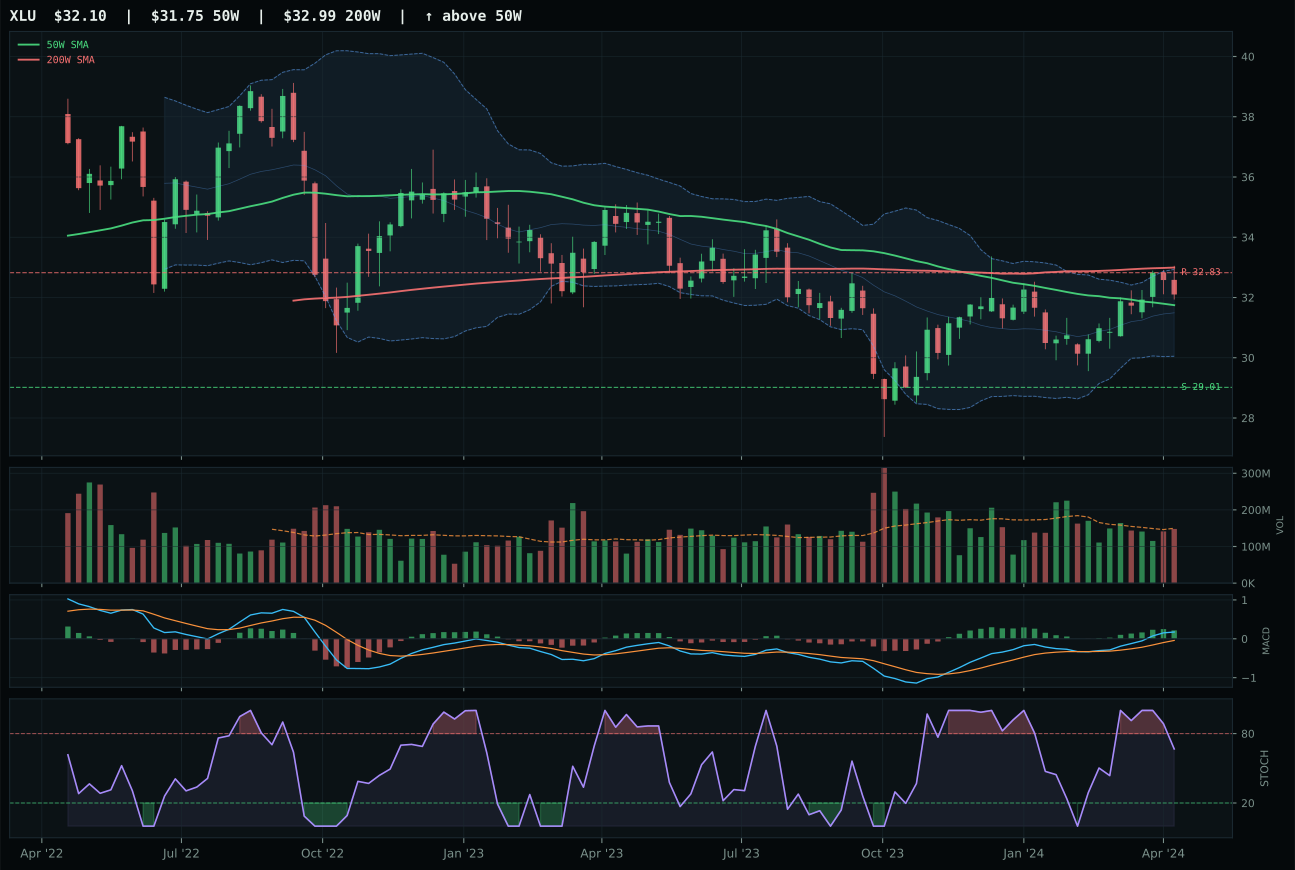
XLU has a compression near 50W profile with -5.8% 13-week relative strength versus SPY.
A failed hold above support would weaken the setup.
Actionable but governed by invalidation levels.
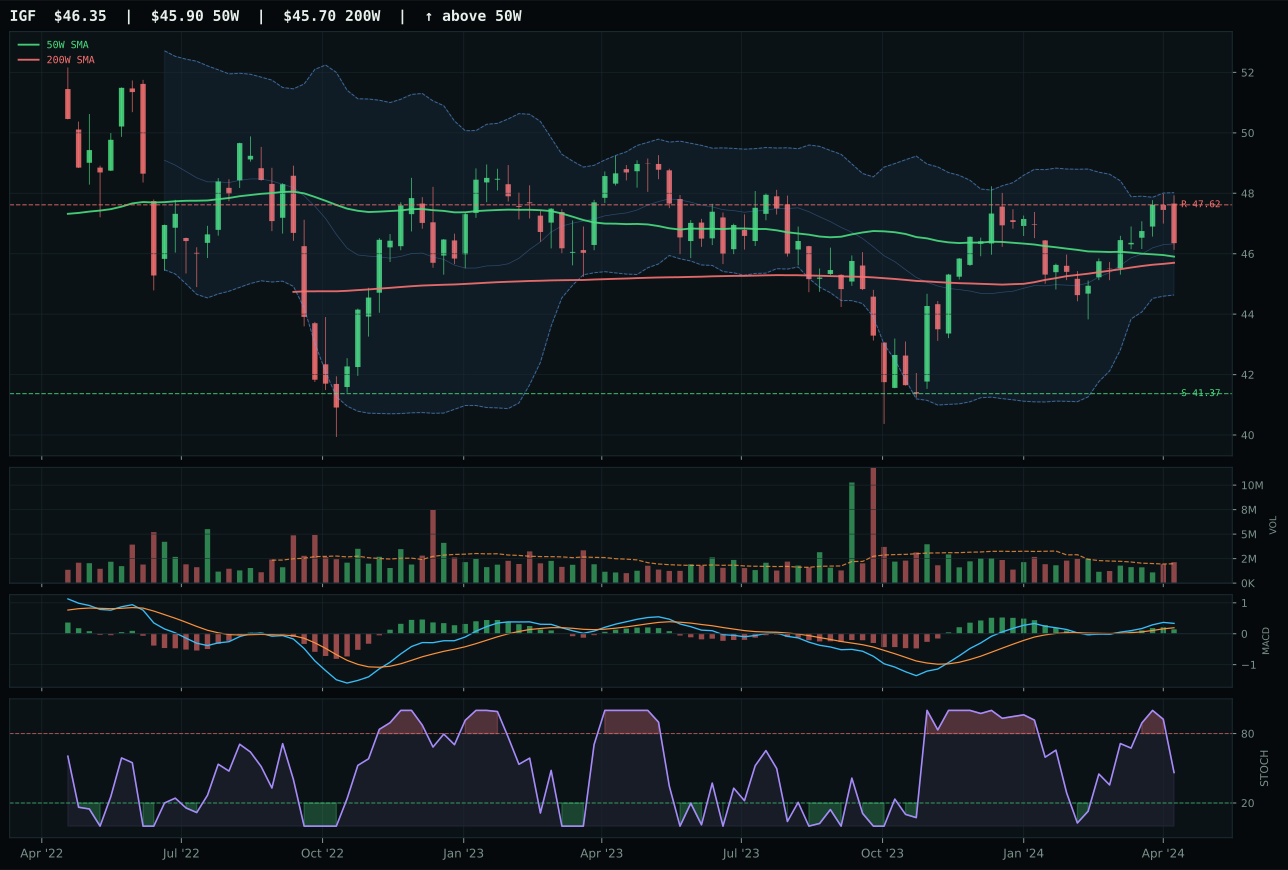
IGF has a compression near 50W profile with -8.4% 13-week relative strength versus SPY.
A failed hold above support would weaken the setup.
Actionable but governed by invalidation levels.
XLU wins by combining a perfect timing score (100.0) with marginally superior structure (75.1 versus PAVE's implied lower score) in a category where defensive income is the only thesis. Price sits 1.1% from the 50W with MACD bullish and improving and stochastic RSI falling/neutral—the definition of a decision-zone entry—giving XLU the only risk-controlled entry point in the category. PAVE's vertical extension at 17.7% above the 50W combined with distribution-pressure volume and bullish-but-flattening MACD creates a momentum cliff; PAVE's 13-week return of 13.9% and 6.7% SPY-relative outperformance are impressive, yet they come at the cost of zero margin of safety for new capital. XLU's 1.4% 13-week return and -5.8% SPY-relative underperformance are weak in absolute terms, but that weakness is precisely why the entry is clean: buyers have abandoned this name, creating compression and timing setup rather than euphoria-driven extension. The technical evidence score (67.0 for XLU versus 42.4 for PAVE) reflects this reality: regulated-utility stability and timing confirmation beat infrastructure-capex beta and momentum divergence every time in late-cycle environments.
Utilities earns 5% allocation at a 45.4 category score, ranking well below top-2 but inside the portfolio for tactical timing and macro regime support. The category-level macro fit is 47.0/100—modest relative to commodities and energy—but broad market bear is active at +4, providing genuine defensive sponsorship. XLU's 100.0 timing score combined with compression setup makes this a mean-reversion candidate: if risk appetite falters in the coming week, Utilities will be a catch for rotating capital. The technical evidence is solid at 67.0/100 for XLU, and the 5% allocation is justified as a risk-off hedge for late-cycle scenarios where equities roll over but bonds cannot rally (stagflationary pressure still active). This is not a conviction position—it is a tactical parking spot with expansion timing if the regime shifts. If broad market bear conditions intensify or credit stress accelerates, this position would likely expand to 10%.
AI — AIQ
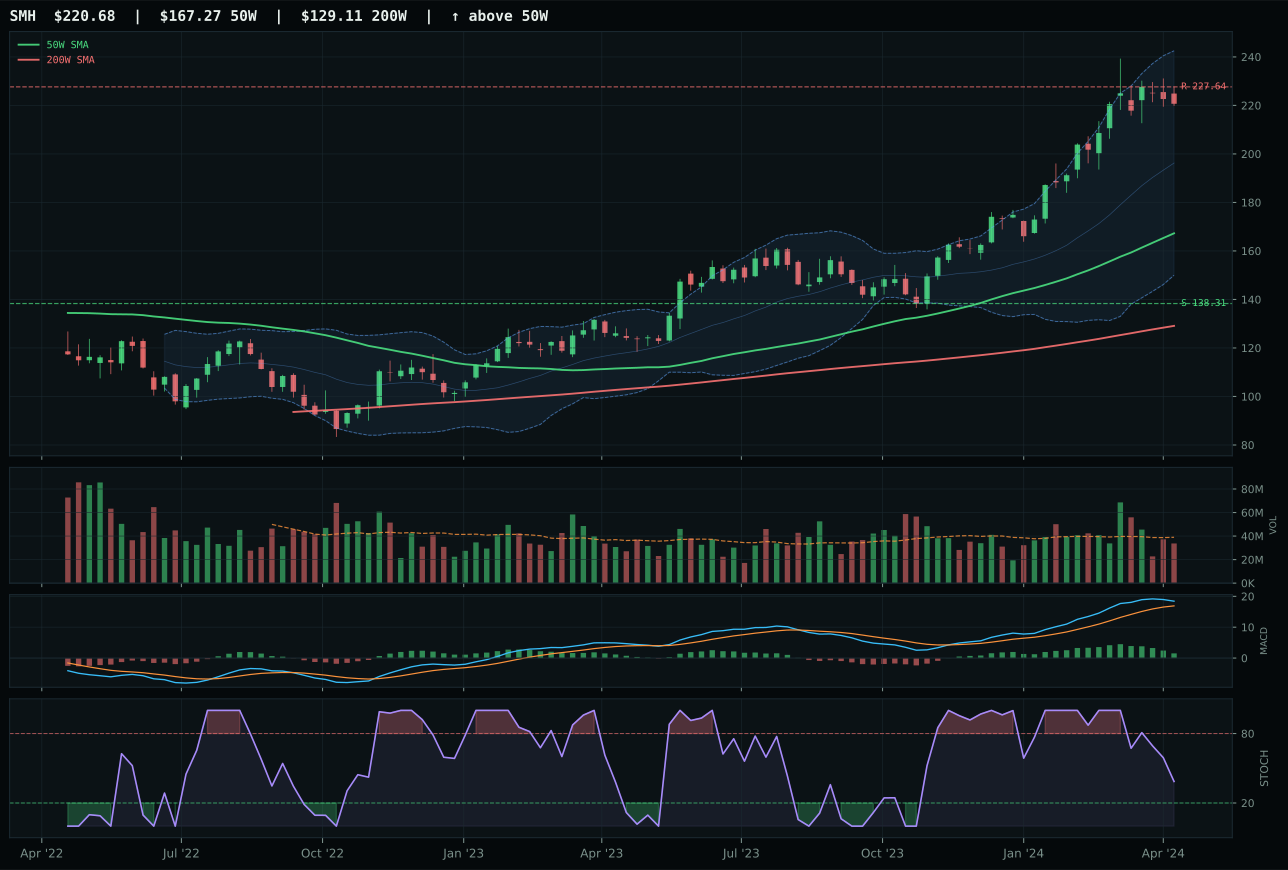
SMH has a vertical extension profile with 20.4% 13-week relative strength versus SPY.
A failed hold above support would weaken the setup.
Actionable but governed by invalidation levels.
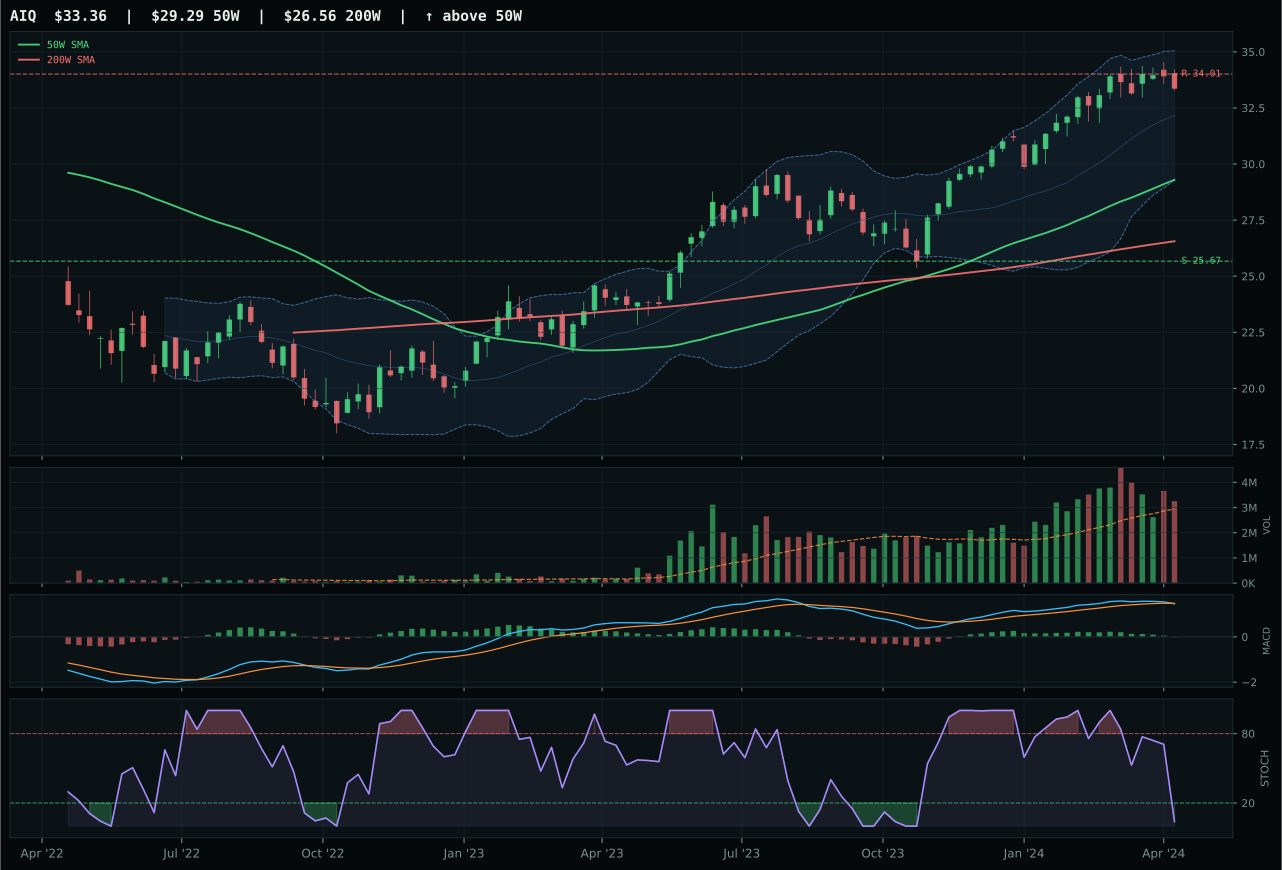
AIQ has a neutral structure profile with 0.9% 13-week relative strength versus SPY.
A failed hold above support would weaken the setup.
Actionable but governed by invalidation levels.
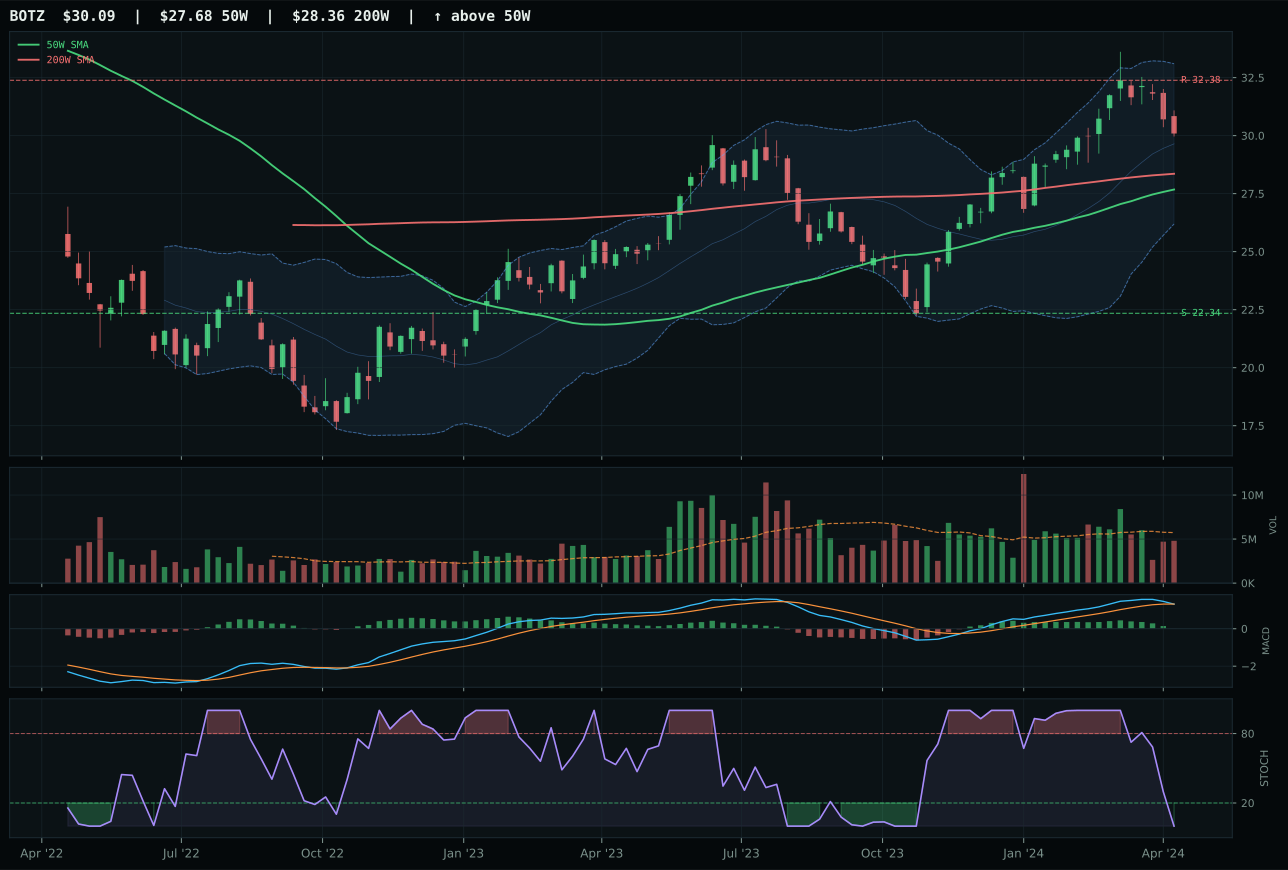
BOTZ has a neutral structure profile with -2.7% 13-week relative strength versus SPY.
A failed hold above support would weaken the setup.
Actionable but governed by invalidation levels.
AIQ edges SMH by trading a cleaner technical setup at half the extension: AIQ sits 13.9% above its 50W while SMH is 31.9% extended, and in a bearish MACD environment, that distance differential is the entire thesis. AIQ's timing score of 62.0 versus SMH's 48.0 reflects the critical difference—proximity to the 50W moving average becomes a timing asset when both charts are rolling over, and AIQ's above-average participation at 1.11x volume confirms accumulation rather than a mechanical squeeze. SMH's composite score of 65 is higher, driven by its vertical-extension trend (100) and 20.4% SPY-relative outperformance over 13 weeks, but that leadership has created an entry problem: every new buyer in SMH is paying 31.9% of the 50W above the 50W, whereas AIQ offers category-neutral relative strength at 0.0% with a margin of safety. The score gap of 0.7 points is tight because SMH's pure technical merit is strong, yet AIQ's risk-adjusted positioning wins because it offers the same AI-growth sponsorship without the vertical-extension liability.
AI captures 5% allocation despite a 38.8 category score that ranks it outside the top-2 tier, making it the third-tier beneficiary of the late-cycle reflation mandate. The macro picture is genuinely supportive: AI growth sponsorship contributes +14 to the category reasoning, and risk appetite remains positive at +10. However, liquidity stress (-12) and credit stress (-8) are mounting headwinds that have dragged the category-level macro fit to just 42.0/100. The real issue is that SMH's technical dominance (65.6 proof order versus AIQ's 46.8) is being artificially suppressed by its vertical extension setup, penalizing the category overall. AIQ gets 5% because its neutral structure and fresh momentum timing make it defensible when the macro regime supports growth, but this is a position for risk appetite stability—not conviction. If credit stress accelerates further or equity volatility spikes, this allocation would be first to trim.
Defense & Aerospace — ITA
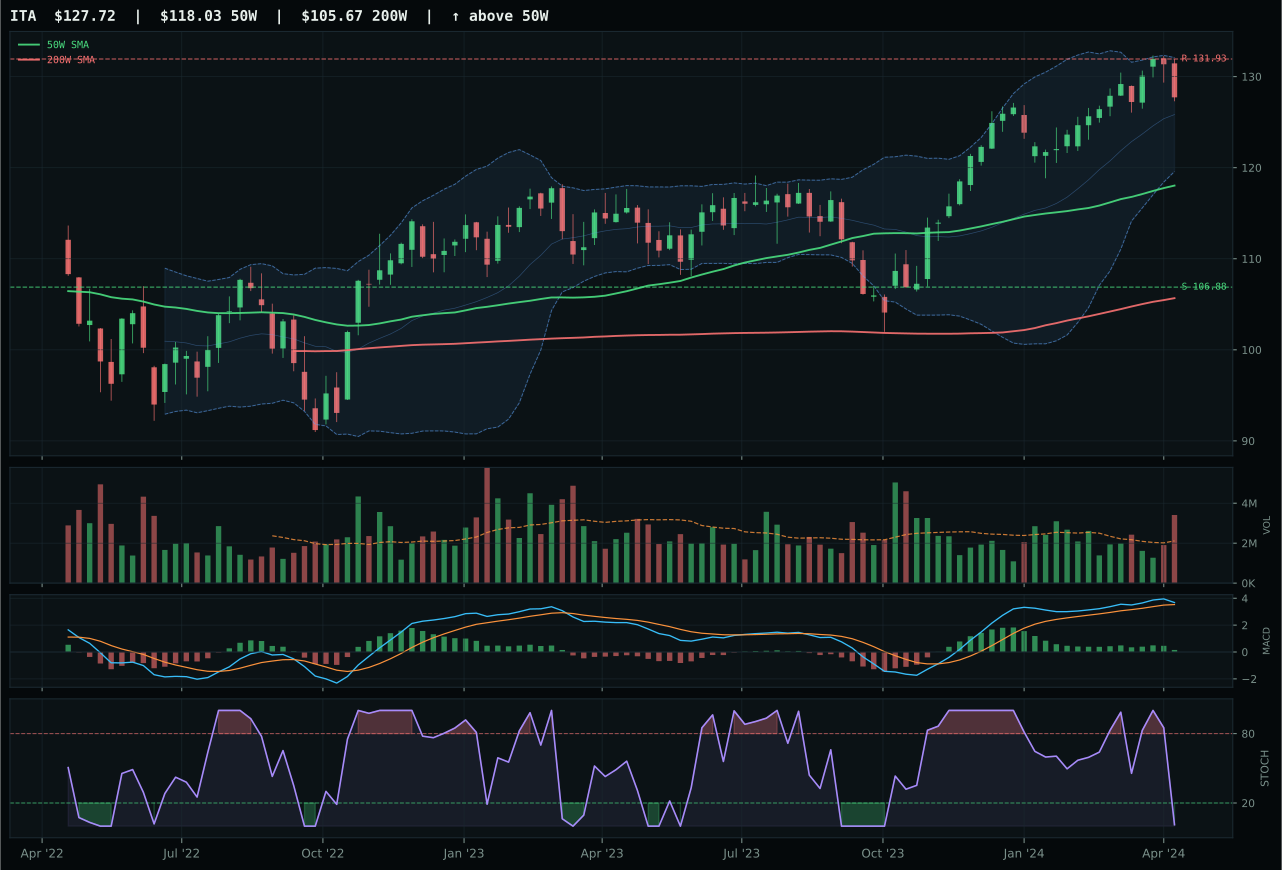
ITA has a neutral structure profile with -2.8% 13-week relative strength versus SPY.
A failed hold above support would weaken the setup.
Actionable but governed by invalidation levels.
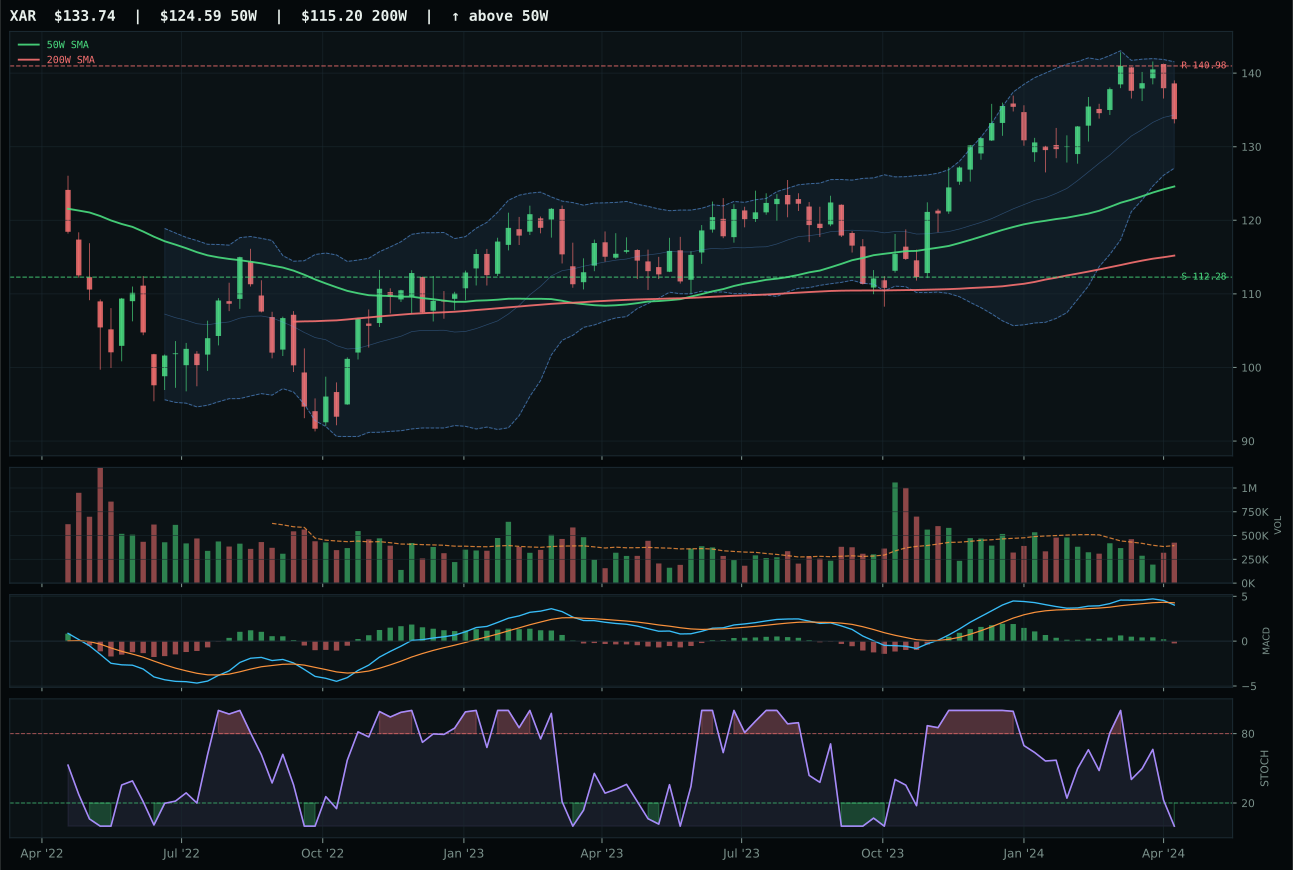
XAR has a neutral structure profile with -4.7% 13-week relative strength versus SPY.
A failed hold above support would weaken the setup.
Actionable but governed by invalidation levels.
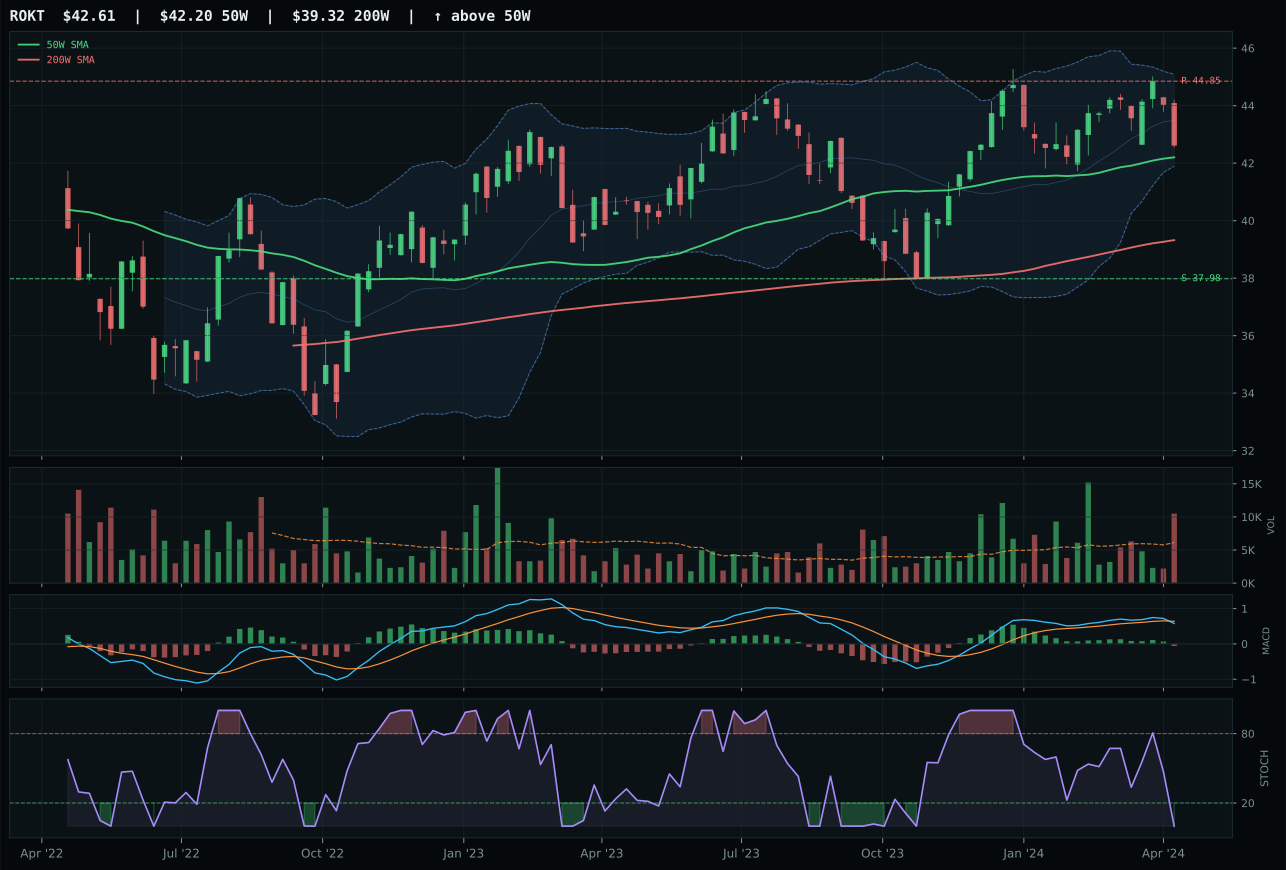
ROKT has a compression near 50W profile with -7.8% 13-week relative strength versus SPY.
A failed hold above support would weaken the setup.
Tracked, but not top-2 eligible because: .
ITA wins a competitive category decision by converting its neutral structure into consistent breadth: the 78.1% structure score reflects cleanliness of 75.0 and compression of 87.7, meaning price action is organized and buyers have been steady. Its 13-week return of 4.4% and category-relative strength of 2.0% are modest numbers, yet they beat XAR's category-relative 0.0% and signal that ITA is the only defensive play picking up incremental sponsorship. The technical evidence gap is not dramatic—ITA at 36.6 versus XAR's 39.7—but the MACD signal is decisive: ITA's bullish-but-flattening MACD is superior to XAR's bearish/weakening cross, meaning the momentum recovery is authentic rather than a bounce. XAR's neutrality on the macro side (50.0 fit versus ITA's 56.0) combined with its structure weakness (77.6 versus 78.1) created just enough daylight for ITA to win despite trading nearly identical support-resistance levels. The 7.5-point category gap reflects ITA's cleaner technical confirmation rather than a substantive directional divergence.
Defense earns 5% allocation at a 33.4 category score, ranking outside the top-2 but inside the core portfolio due to macro regime support. Late-Cycle Reflation adds +6 to this category, and broad market bear conditions (+6) combined with dollar pressure (+3) are creating a genuine safe-haven bid for aerospace and defense durability. The category-level macro fit of 66.0/100 is robust, reflecting real geopolitical premium and relative stability in a volatile late-cycle environment. However, the technical evidence is only 36.6/100 for the category representative, and the ETF basket score languishes at 40.4 after the reasoner applies setup quality, persistence, and risk-reward filters. Defense is allocated because the macro regime demands it and because deflation-hedge exposure is prudent when credit stress is mounting—not because the technicals are clean. This is a strategic conviction sleeve, not a tactical oversold bounce.
Agriculture & Livestock — WEAT
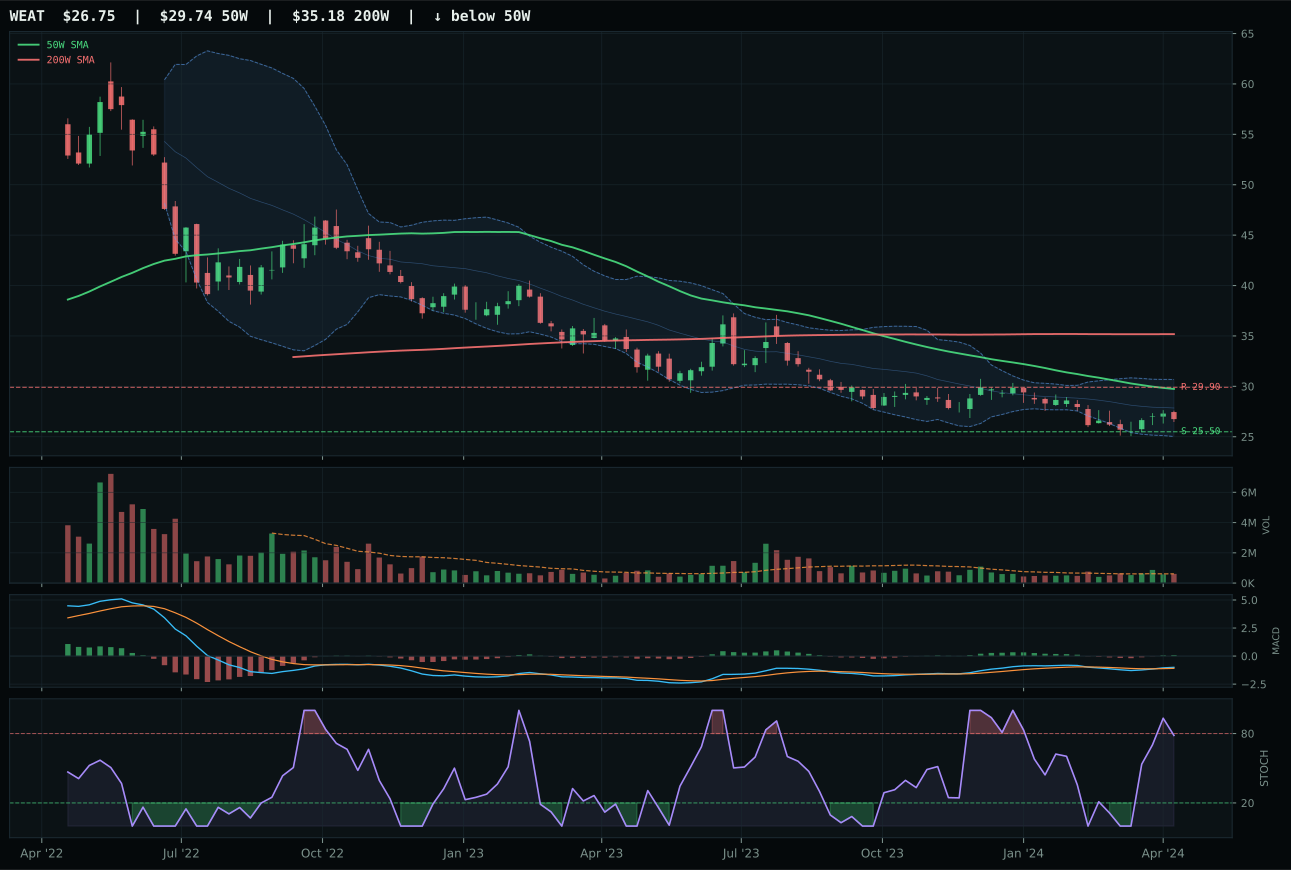
WEAT has a pullback into support profile with -14.0% 13-week relative strength versus SPY.
Extension and support failure are the main tactical risks.
Tracked, but not top-2 eligible because: structurally broken.
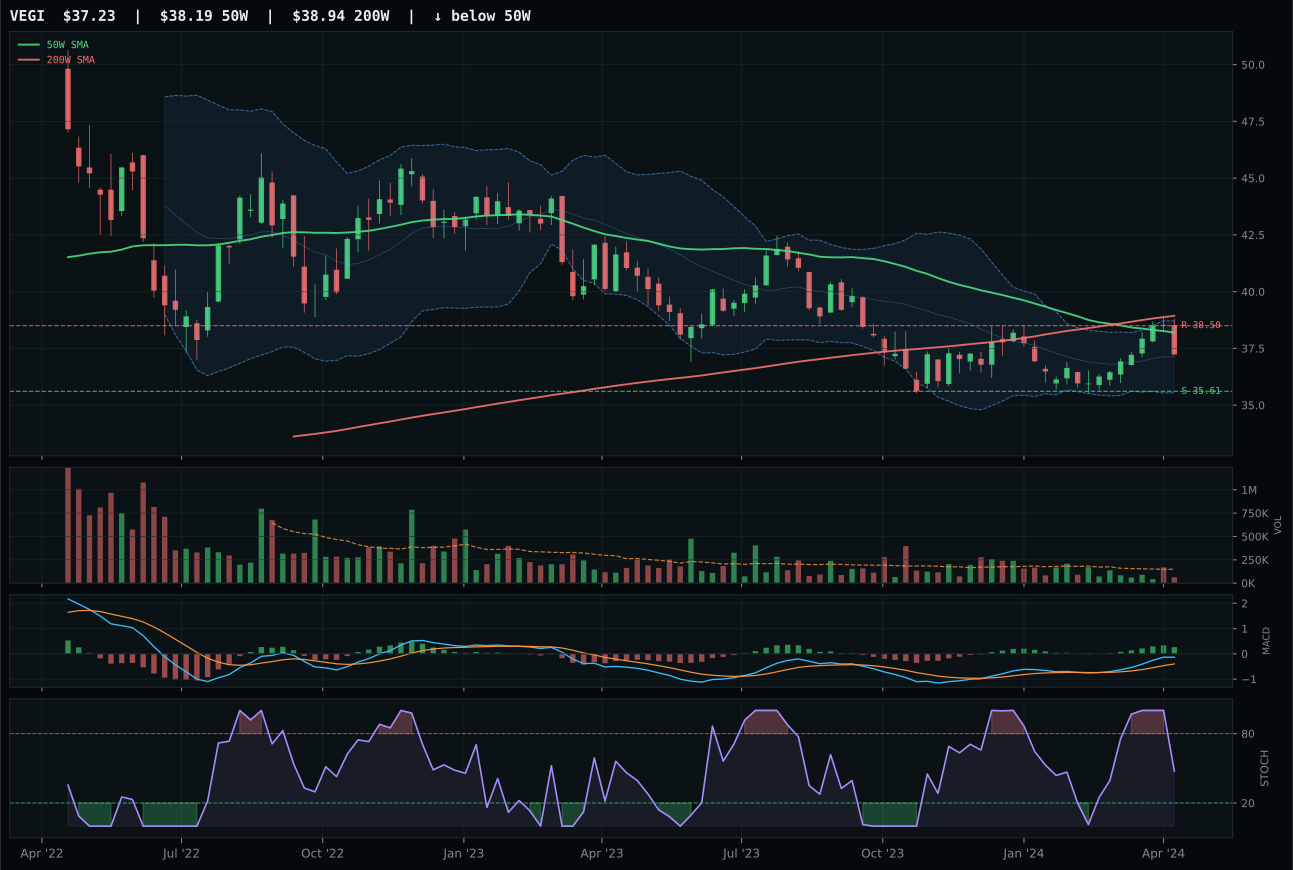
VEGI has a pullback into support profile with -6.4% 13-week relative strength versus SPY.
Extension and support failure are the main tactical risks.
Tracked, but not top-2 eligible because: structurally broken.
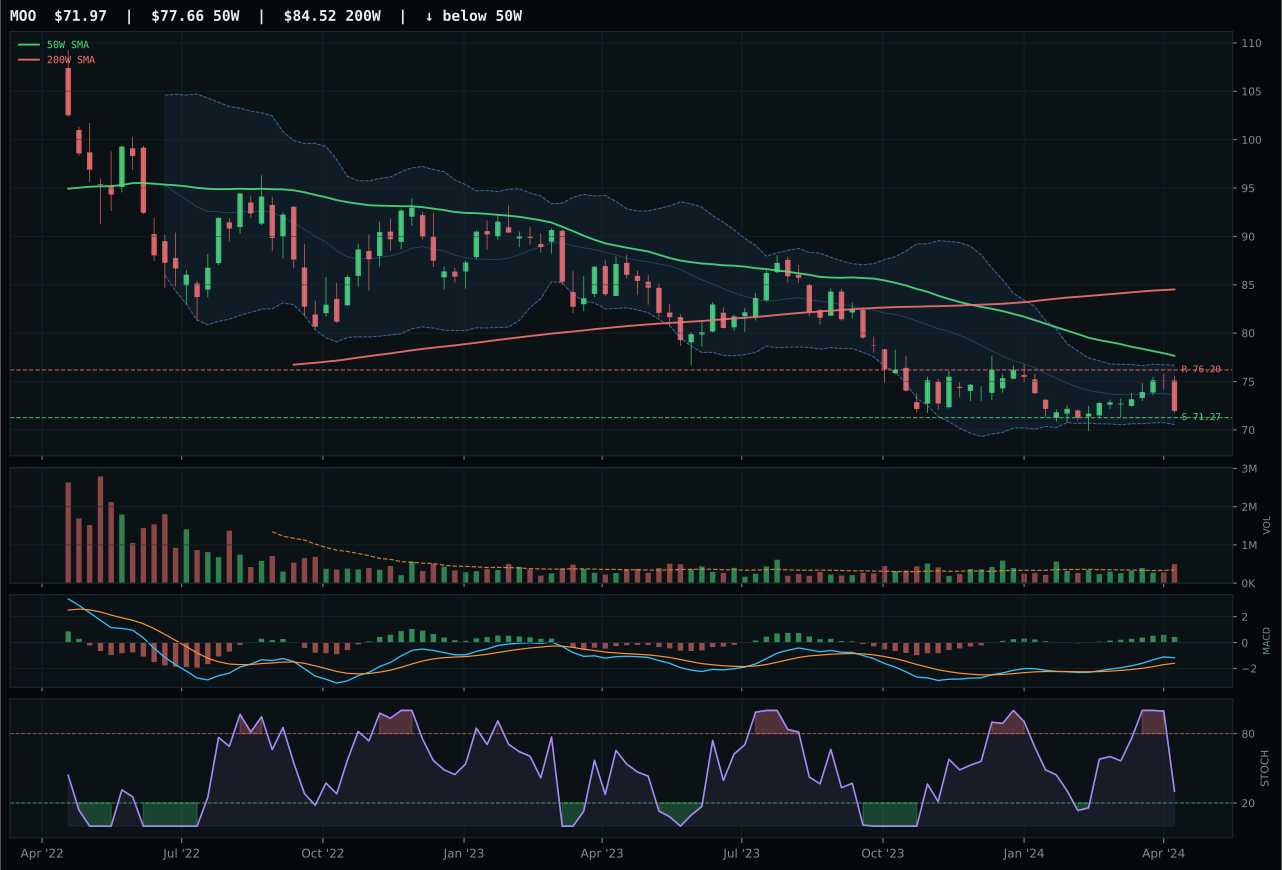
MOO has a pullback into support profile with -9.6% 13-week relative strength versus SPY.
Extension and support failure are the main tactical risks.
Tracked, but not top-2 eligible because: structurally broken.
WEAT wins by offering the category's best risk-reward profile despite being structurally broken: the ETF trades 10.1% below its 50W, below the 200W, yet its risk-reward score of 83.7 is the only reason to hold it at all. Price is pulled into support at 25.50 with only 4.9% downside to invalidation, while upside to resistance sits 10.5% away—asymmetry favoring the long side by more than 2:1. MACD is bullish and improving with stochastic RSI rising mid-zone at 0.78, which means the repair timing is legitimately favorable even though the 13-week return is -6.8% and SPY-relative underperformance is -14.0%. VEGI loses this decision because its risk-reward of 66.0 is 17.7 points lower, and its stochastic RSI is falling/neutral rather than rising, meaning it lacks the same early-impulse confirmation. The gap of 2.7 points between WEAT and VEGI is small because both are broken charts, but WEAT's defined invalidation at 25.50 combined with MACD recovery makes it the only candidate worth the 5% allocation into commodity-breadth tailwinds.
Agriculture scores 31.3 and ranks outside top-2 eligibility (marked ineligible due to structural breaks), yet still claims 5% because the macro case for commodity exposure is overwhelming. Supply shortage is active at +13, real asset sponsorship at +8, and inflation pressure at +10—the highest macro category fit in the portfolio at 90.0/100. WEAT's technical evidence is weak (35.0/100), but the macro math is irrefutable in a late-cycle reflation regime where food price stability has become a portfolio hedge. This allocation is a pure macro conviction trade: you are buying structural agricultural demand and supply imbalances, not WEAT's chart pattern. The ETF sits in a repair zone, MACD is improving, and support is defined—the risk is defined enough that the asymmetry makes sense at 5%. If inflation expectations roll over or dollar strength accelerates, this position scales down immediately.
Technology — XLK
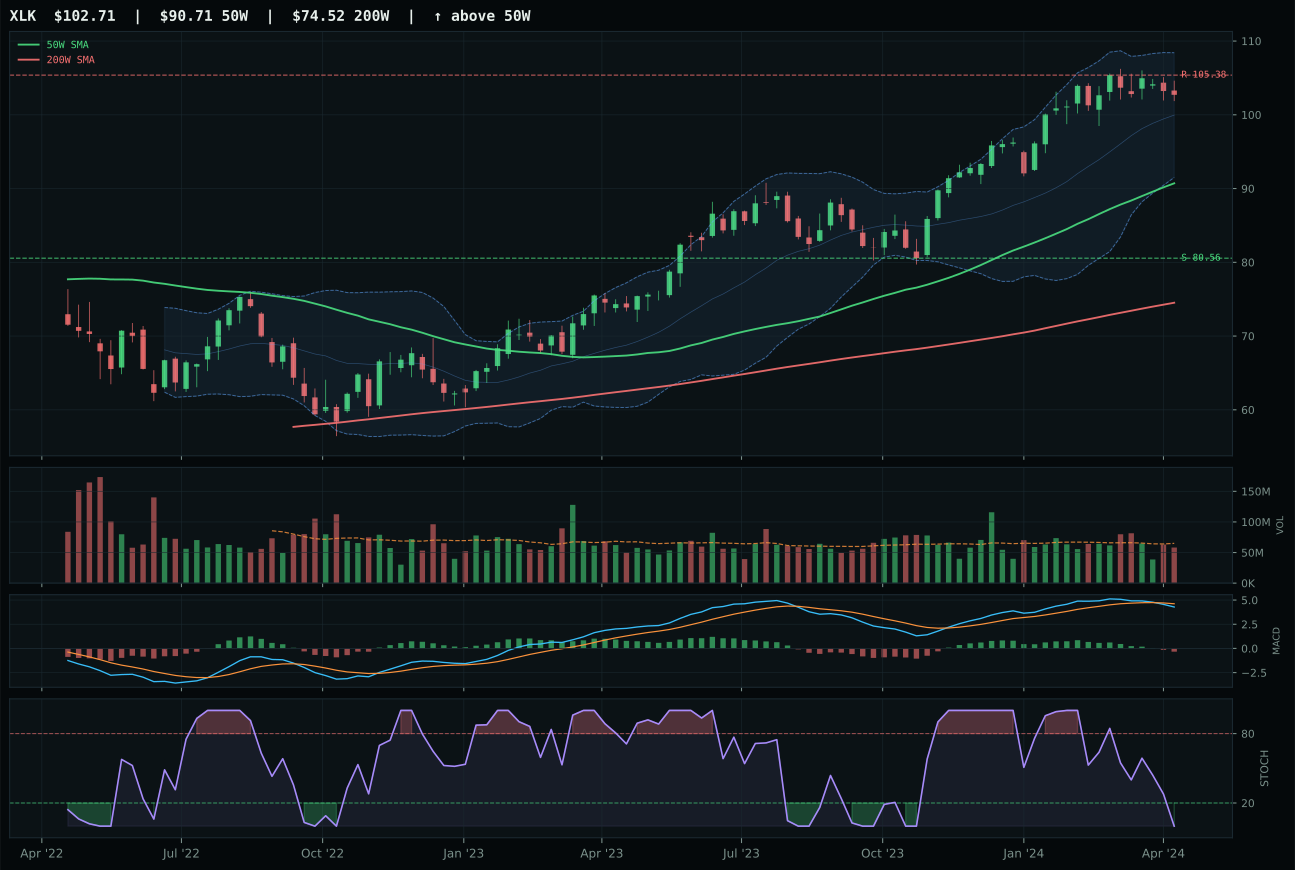
XLK has a neutral structure profile with -0.3% 13-week relative strength versus SPY.
A failed hold above support would weaken the setup.
Actionable but governed by invalidation levels.
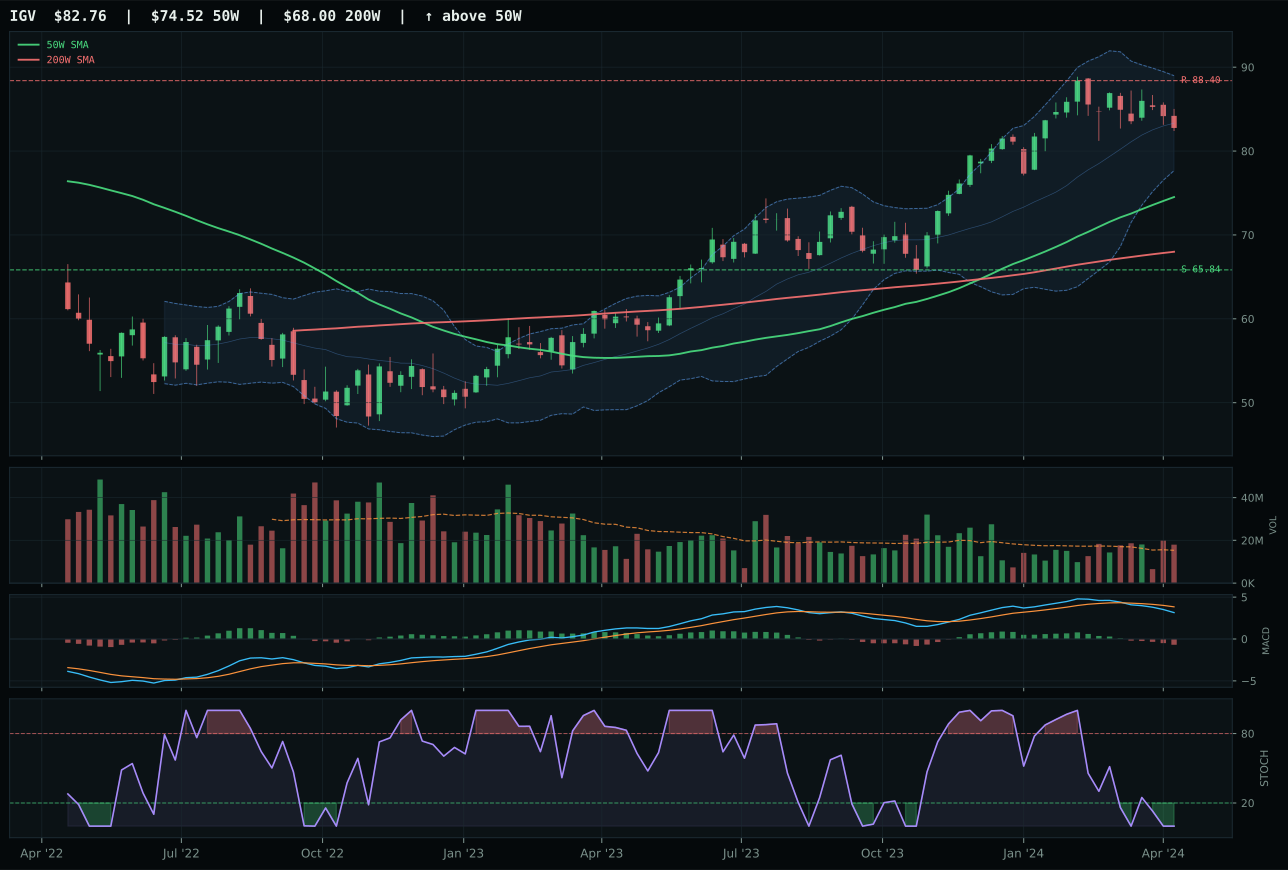
IGV has a neutral structure profile with -5.9% 13-week relative strength versus SPY.
A failed hold above support would weaken the setup.
Actionable but governed by invalidation levels.
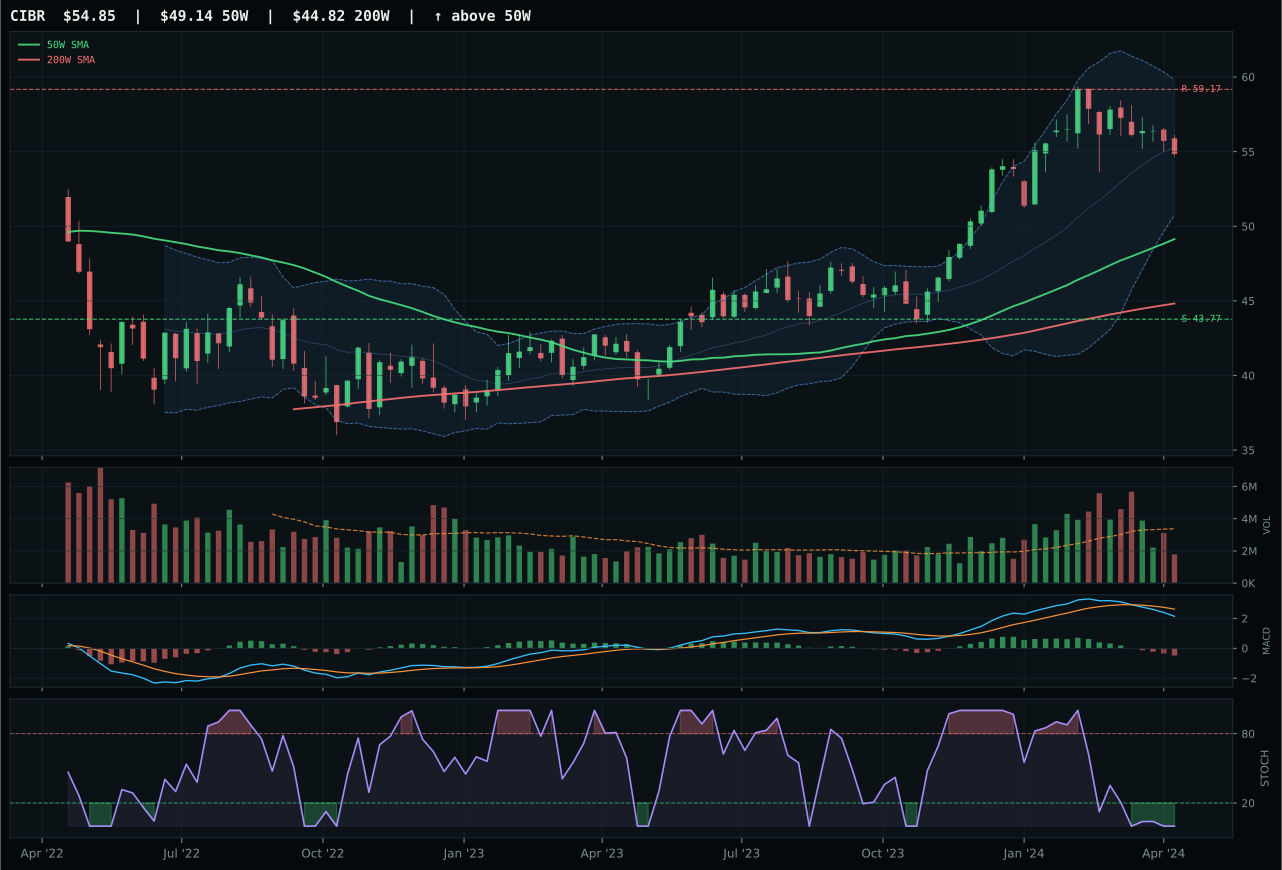
CIBR has a neutral structure profile with -7.6% 13-week relative strength versus SPY.
A failed hold above support would weaken the setup.
Actionable but governed by invalidation levels.
XLK wins the category by demonstrating resilience where its peers faltered. The ETF trades 13.2% above its 50-week moving average with a flat 50W slope, positioning it as a leader rather than a laggard, and its category-relative strength of 5.6% against the sector median confirms buyers are actively selecting XLK over IGV and CIBR. IGV's 5.6-point deficit stems entirely from momentum deterioration: its 13-week return of 1.3% versus XLK's 6.9% shows the enterprise-software exposure has lost sponsorship, while its -5.9% SPY-relative underperformance reveals that duration-sensitive growth is being abandoned in a reflation regime. Volume at 0.89x the 20-week average is neutral for XLK—neither confirming nor rejecting—but that neutrality is precisely what separates it from the bleeding edge; MACD has rolled over bearish across the entire sector, yet XLK's technical evidence score of 48.8 is the only one high enough to justify allocation in a late-cycle environment where cash-generative growth matters more than terminal-value speculation.
Technology ranks 9th in the final allocation at a 30.1 category score, sitting entirely outside the portfolio with 0% committed. The macro environment is working against this sleeve: liquidity stress (active at -10), credit stress (-7), and dollar pressure (-5) are combining to penalize duration-sensitive growth exposure in a late-cycle reflation regime. While risk appetite remains positive (+9) and AI sponsorship is active (+6), the technical evidence only musters 48.8/100 for XLK itself, and the category-level macro fit of 39.0 undercuts any argument for capital allocation. To re-enter the portfolio, Technology would need either a sharp improvement in credit stress metrics or a decisive breakdown in the commodities complex that would restore bond bid—neither is visible in this week's macro checklist. For now, real assets and energy are stealing the allocation oxygen.
Emerging Markets — ILF
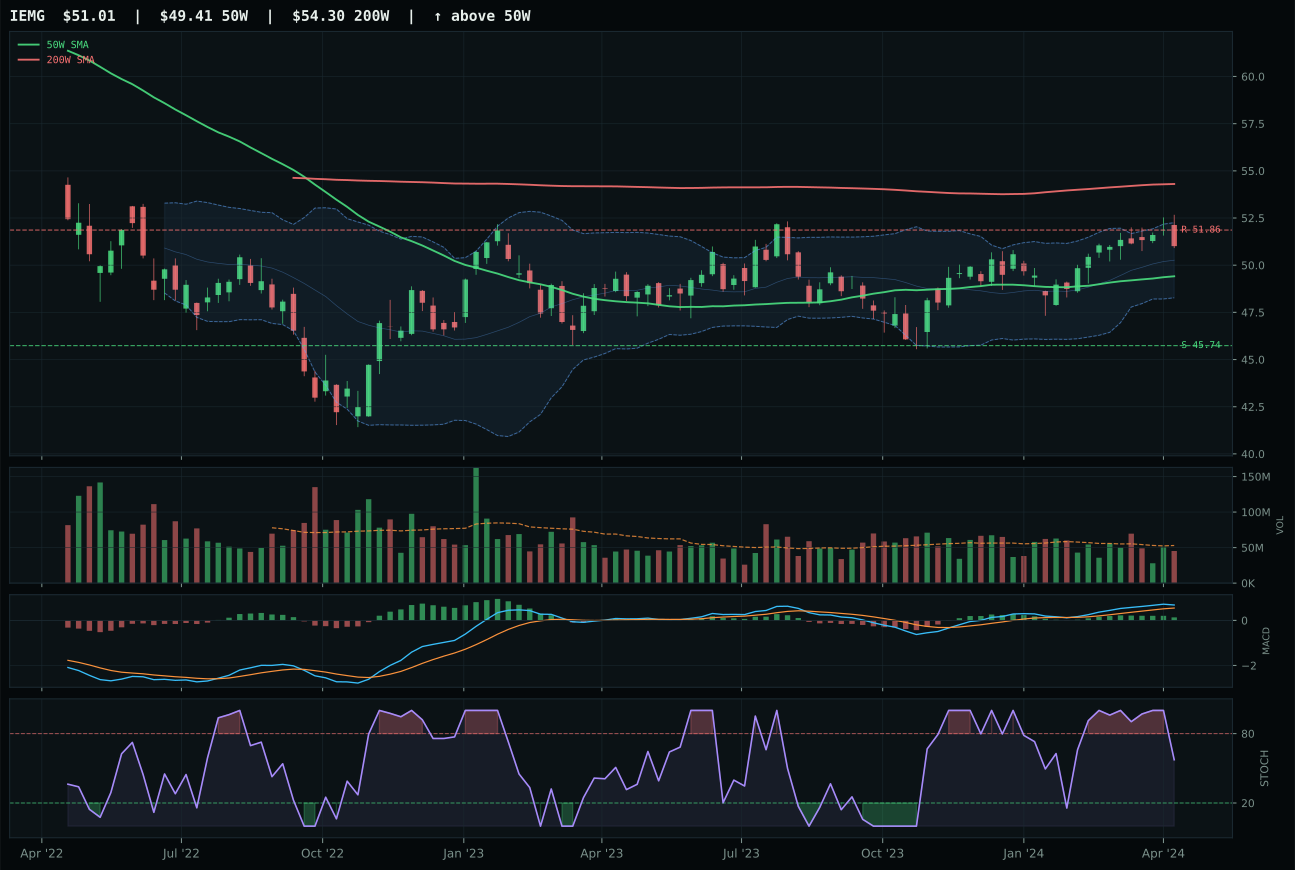
IEMG has a neutral structure profile with -4.0% 13-week relative strength versus SPY.
A failed hold above support would weaken the setup.
Actionable but governed by invalidation levels.
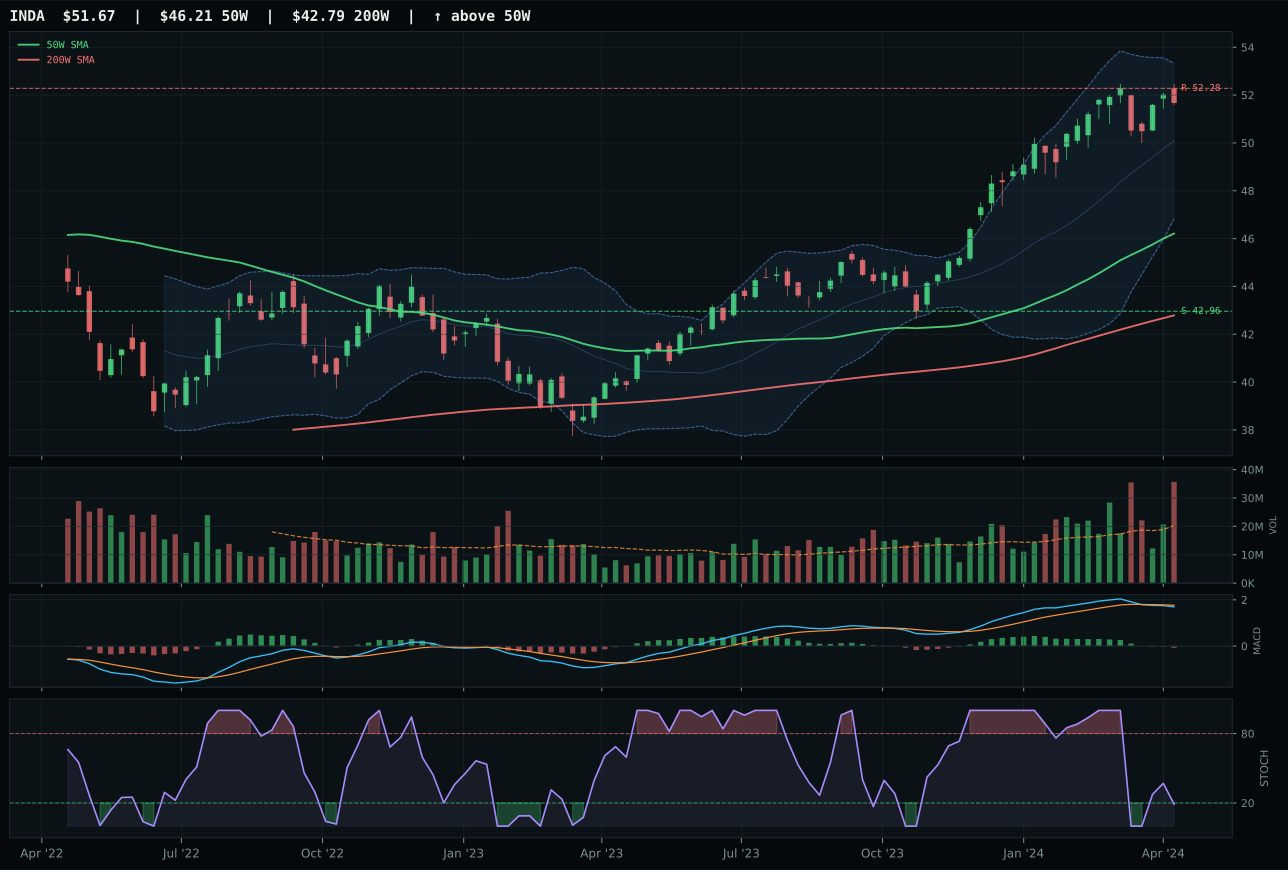
INDA has a neutral structure profile with -3.7% 13-week relative strength versus SPY.
A failed hold above support would weaken the setup.
Actionable but governed by invalidation levels.
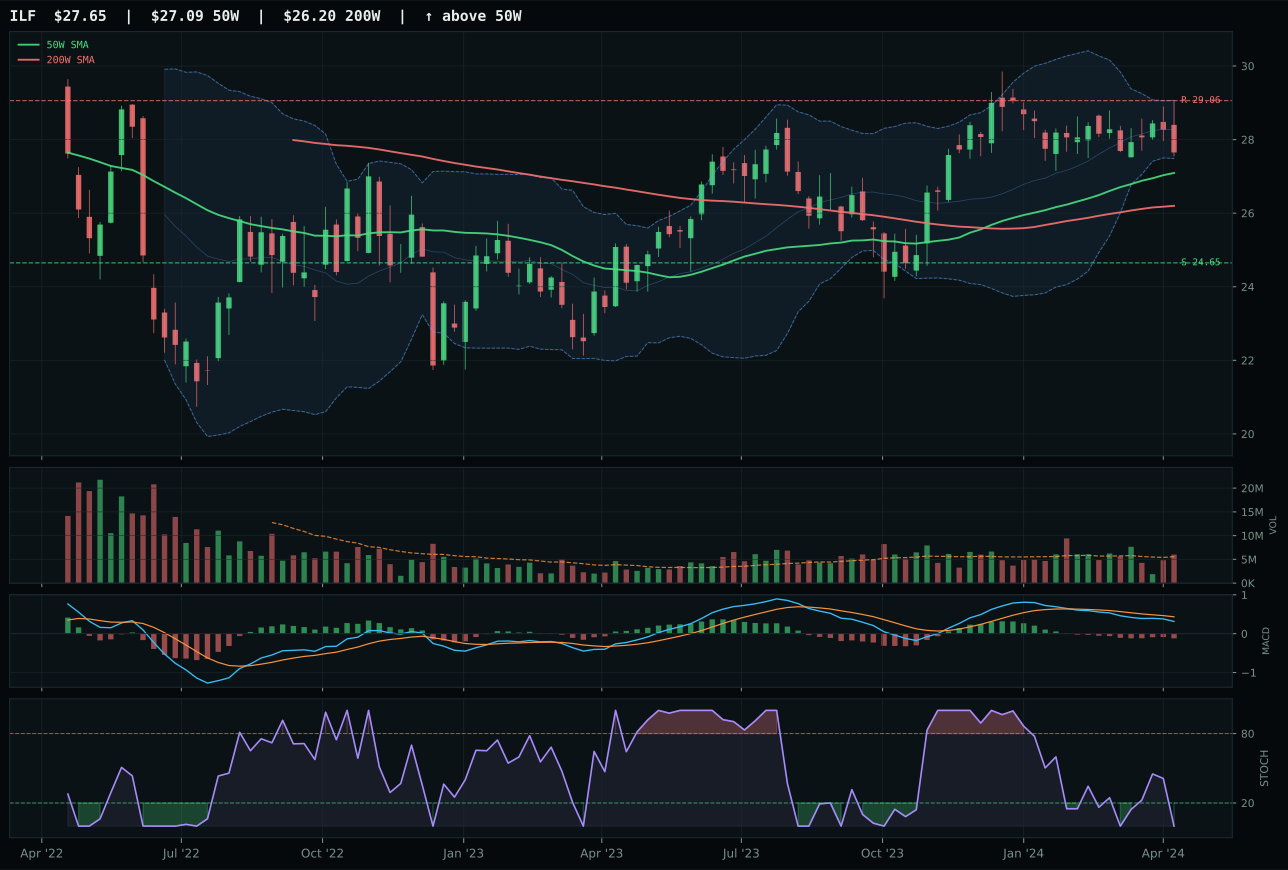
ILF has a compression near 50W profile with -10.2% 13-week relative strength versus SPY.
A failed hold above support would weaken the setup.
Actionable but governed by invalidation levels.
ILF wins a decisive 5.7-point category decision by exploiting a timing advantage in a structurally weak group: price sits 2.1% from the 50W in a compression-near-50W setup, giving ILF a timing score of 95.0 versus IEMG's 85.0. Both charts show MACD bearish/weakening or bullish-but-flattening and stochastic RSI in vulnerable zones, but ILF's proximity to the 50W means it can recover if the 50-week support holds, whereas IEMG at 5.51% above the 50W offers zero margin of safety for new money. ILF's -3.0% 13-week return and -10.2% SPY-relative underperformance are damning for momentum, yet that weakness creates the timing setup: MACD bullish-and-improving paired with deep oversold conditions (-10.2% RS) suggests the worst of the selling may be done. IEMG's superior trend (80 versus 67) and volume confirmation (58 versus 30) reflect better macro positioning and institutional ownership, yet IEMG is priced in—buyers have already positioned—whereas ILF's compression offers a coil-like entry for fresh sponsorship. The decision prioritizes timing risk-reward over momentum magnitude.
Emerging Markets scores 7.6 and ranks 9th or 10th with 0% allocation—it is entirely outside the portfolio this week. The macro alignment is catastrophic: dollar pressure sits at -14, credit stress at -10, liquidity stress at -10, and broad market bear is active at -9, combining for a -33 headwind that overwhelms the modest +8 from commodity breadth positive and +8 from metals scarcity support. The category-level macro fit plummets to 15.0/100, the lowest in the entire allocation framework. ILF's 95.0 timing score and compression setup would normally justify tactical entry, but the macro regime is explicitly long USD and short EM risk appetite—the technical setup is being crushed by macro tide. To re-enter this category, either dollar pressure would need to reverse materially, or credit stress metrics would need to stabilize sharply. Neither is evident in the active descriptor checklist. Emerging Markets will wait on the sidelines until the macro regime shifts.