
2024-04-05
Informational purposes only. The content in this report, including allocations, analysis, and commentary, is provided solely for informational and educational purposes. It does not constitute financial advice, investment advice, trading advice, or any other type of advice. Past performance does not guarantee future results. Always conduct your own research and consult a qualified financial professional before making investment decisions.
Weekly Allocation
| Ticker | Category | Weight | Role |
|---|---|---|---|
| FBTC | 50% | Overlay | |
| XLE | Traditional Energy | 10% | Top-2 (10%) |
| GLD | Precious Metals | 10% | Top-2 (10%) |
| URNM | Nuclear Energy | 5% | Tier-2 (5%) |
| AIQ | AI | 5% | Tier-2 (5%) |
| COPX | Industrial Metals | 5% | Tier-2 (5%) |
| ITA | Defense & Aerospace | 5% | Tier-2 (5%) |
| XLK | Technology | 5% | Tier-2 (5%) |
| XLU | Utilities & Infrastructure | 5% | Tier-2 (5%) |
Trade Instructions — Monday Open
Sell the tranche from 2024-03-08 (completing its 4-week hold). Buy the new tranche. Instructions show net portfolio changes — same-asset positions cancel, weight changes show the delta.
| Action | Ticker | Instruction |
|---|---|---|
| SELL | SMH | Sell 33% of SMH position (reduce 7.50% → 5.00%) |
| SELL | PAVE | Sell 25% of PAVE position (reduce 5.00% → 3.75%) |
| SELL | XAR | Sell 33% of XAR position (reduce 3.75% → 2.50%) |
| SELL | NLR | Sell 33% of NLR position (reduce 3.75% → 2.50%) |
| BUY | XLE | Buy XLE — 20.00% of freed cash (adds 1.25% to portfolio) |
| BUY | ITA | Buy ITA — 20.00% of freed cash (adds 1.25% to portfolio) |
| BUY | XLU | Buy XLU — 20.00% of freed cash (adds 1.25% to portfolio) |
| BUY | URNM | Buy URNM — 20.00% of freed cash (adds 1.25% to portfolio) |
| BUY | AIQ | Buy AIQ — 20.00% of freed cash (adds 1.25% to portfolio) |
Current Portfolio After Trade
Combined holdings across all 4 active tranches. Each tranche is 25% of the portfolio.
| Ticker | % of Portfolio | Weight Bar |
|---|---|---|
| FBTC | 50.00% | |
| XLE | 10.00% | |
| COPX | 5.00% | |
| SMH | 5.00% | |
| GLD | 3.75% | |
| PAVE | 3.75% | |
| XLK | 3.75% | |
| XAR | 2.50% | |
| NLR | 2.50% | |
| SLV | 2.50% | |
| URA | 2.50% | |
| ITA | 2.50% | |
| XLU | 2.50% | |
| MOO | 1.25% | |
| URNM | 1.25% | |
| AIQ | 1.25% |
Macro Regime — Late-Cycle Reflation
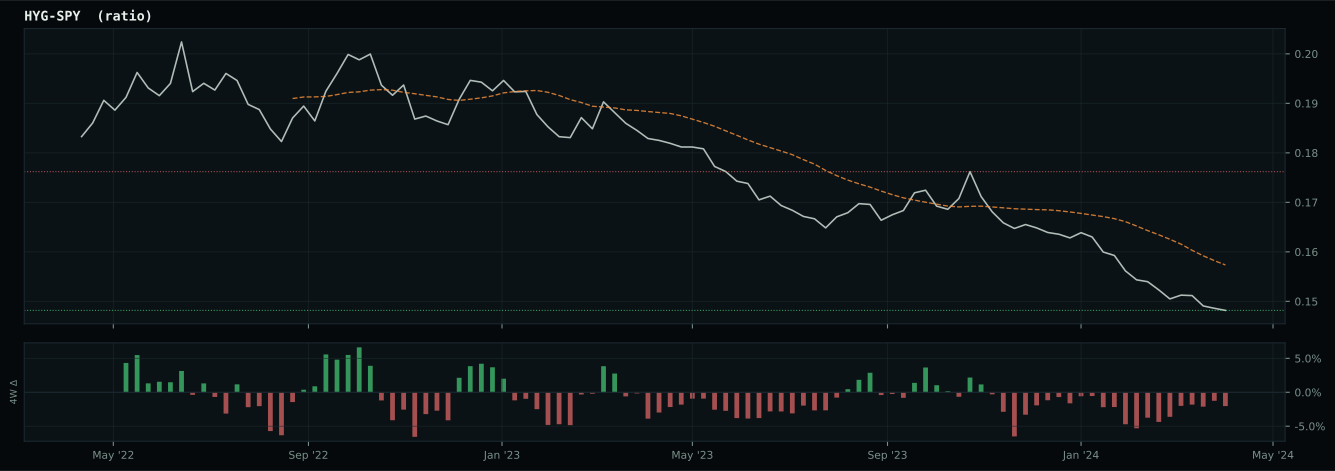
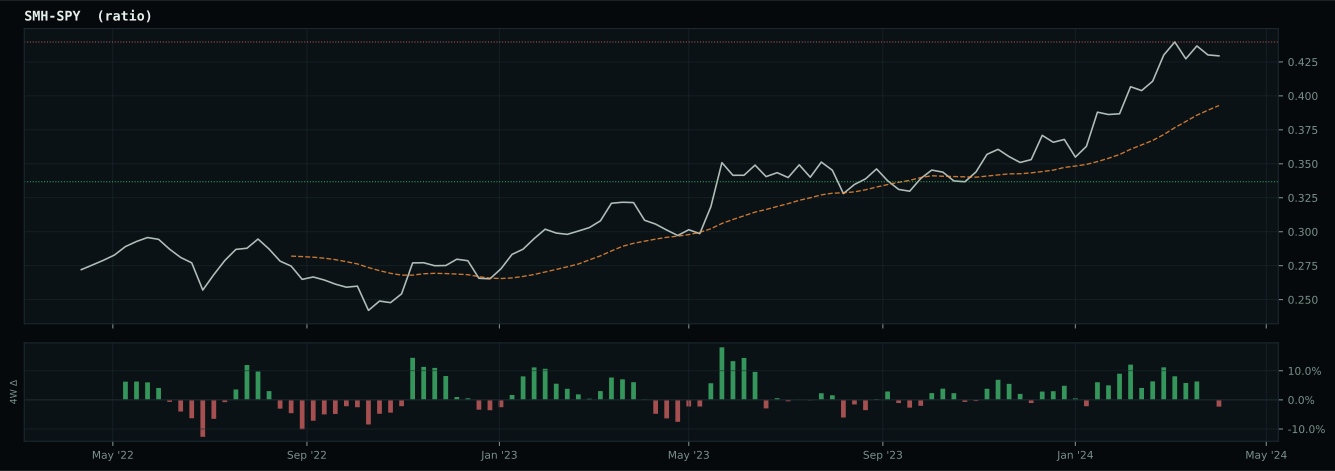
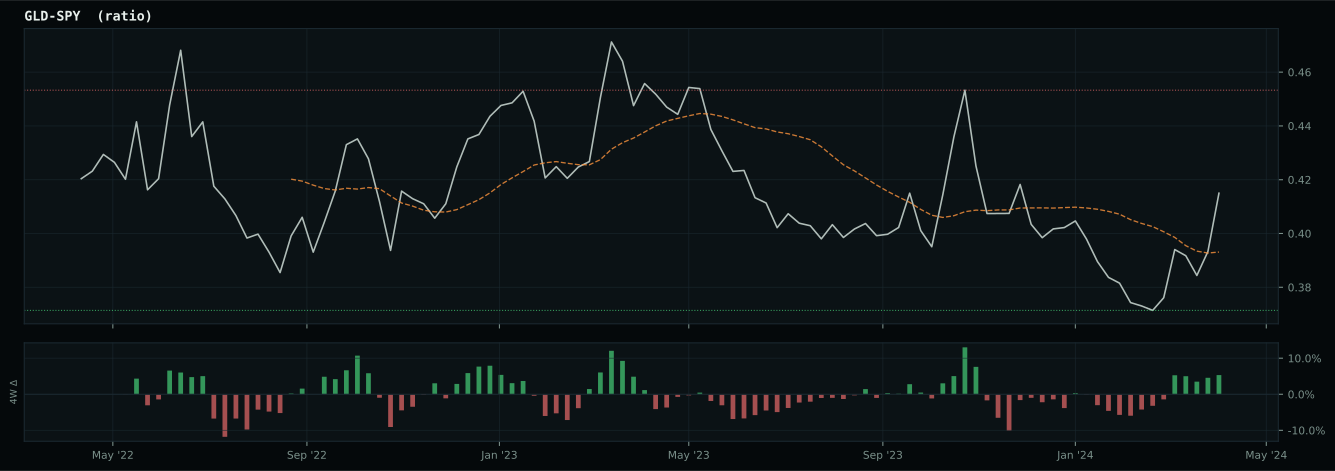
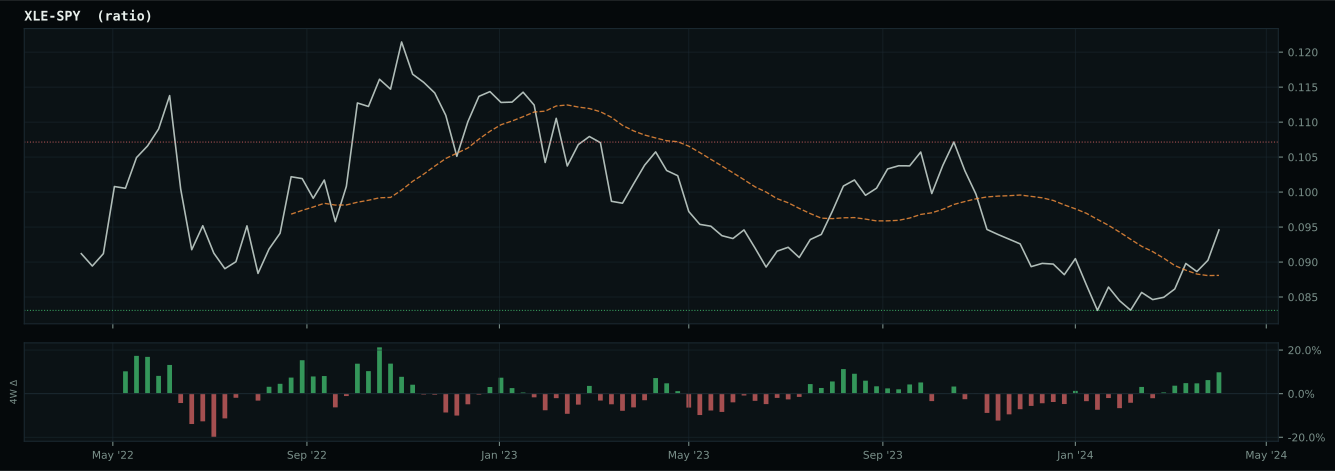
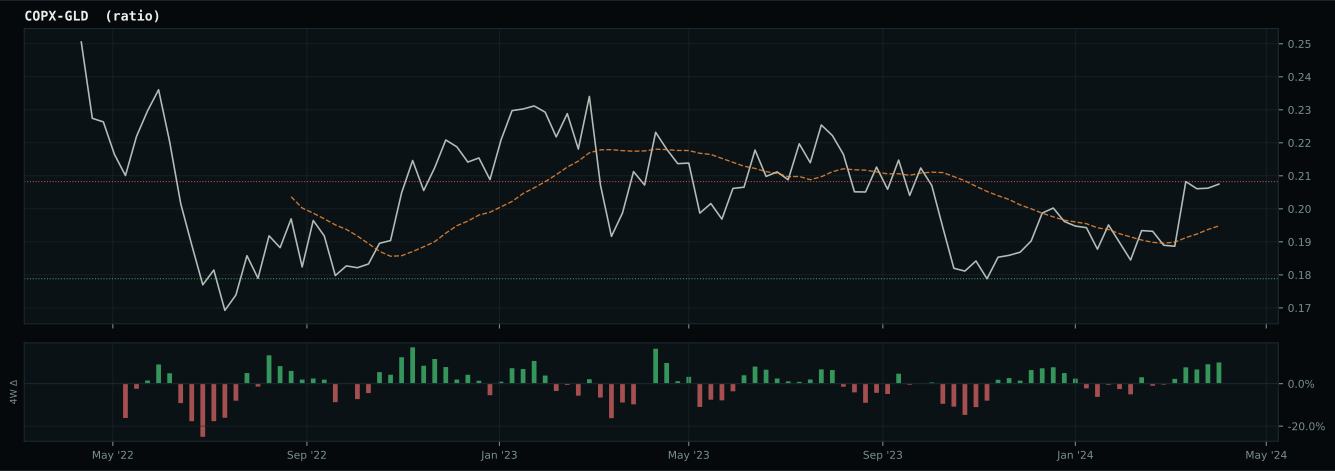
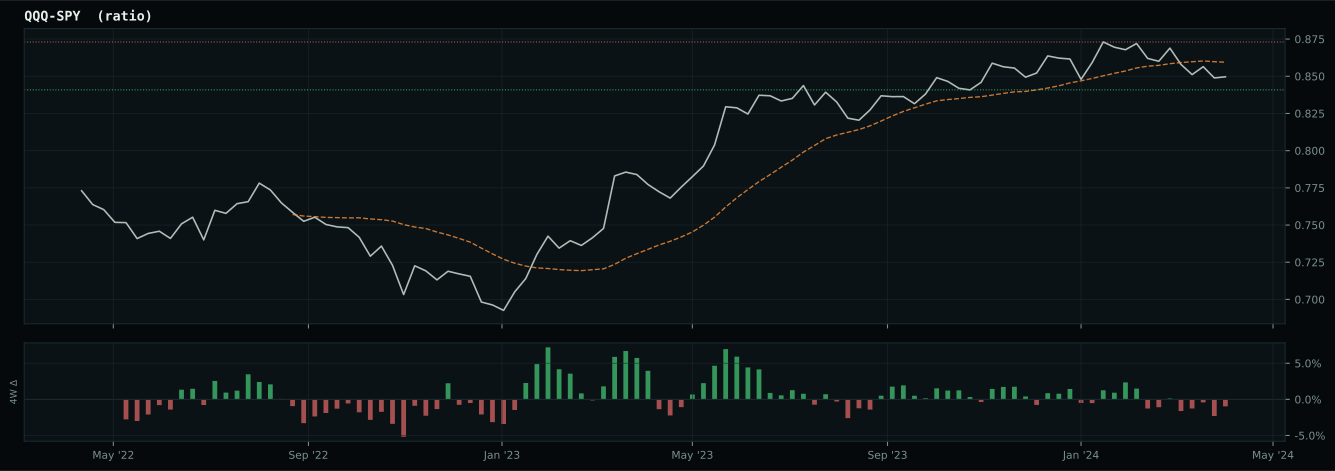
Macro Evidence Charts
Market-implied signals behind the macro regime scores. Each ratio compares two assets; the direction and slope of the ratio is what the macro engine reads.
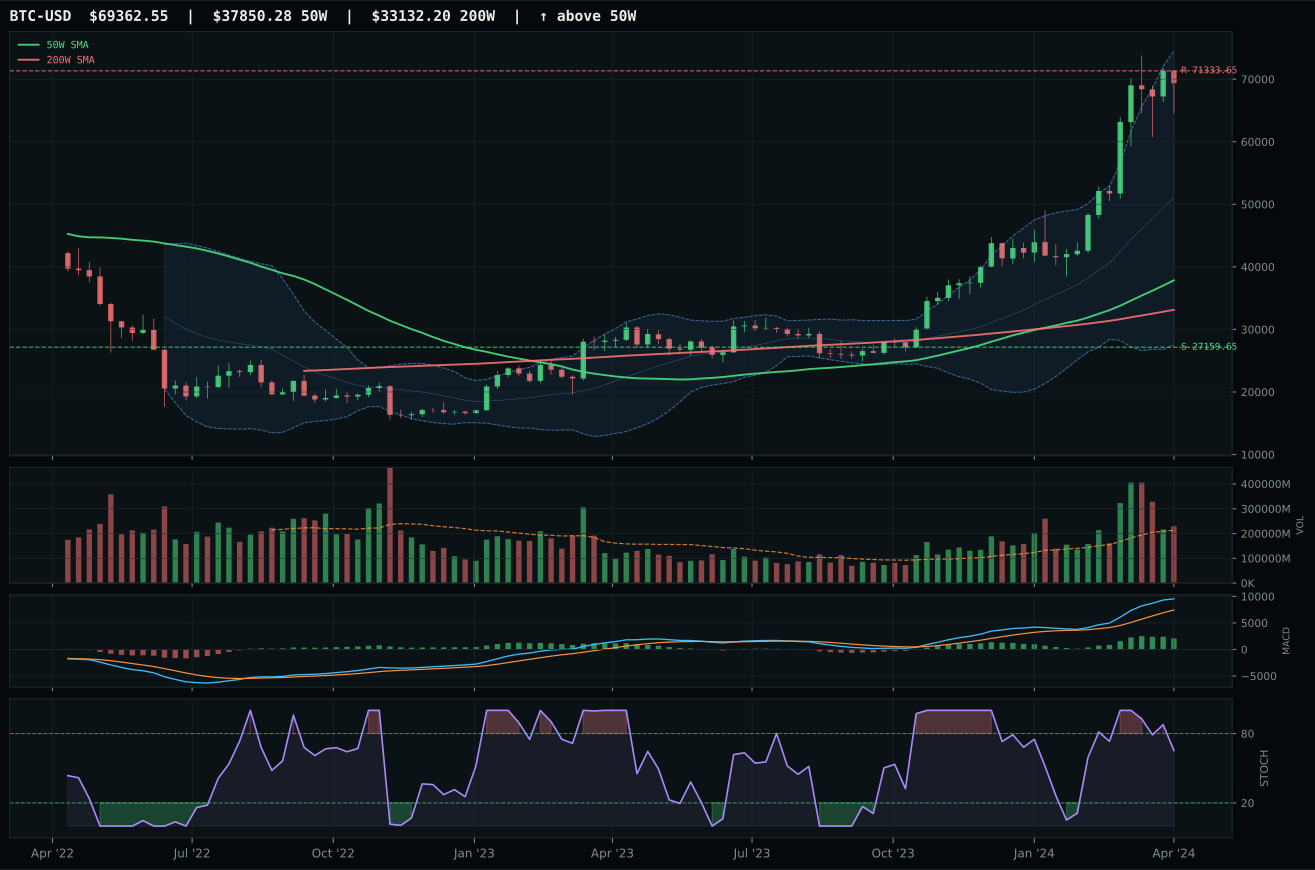
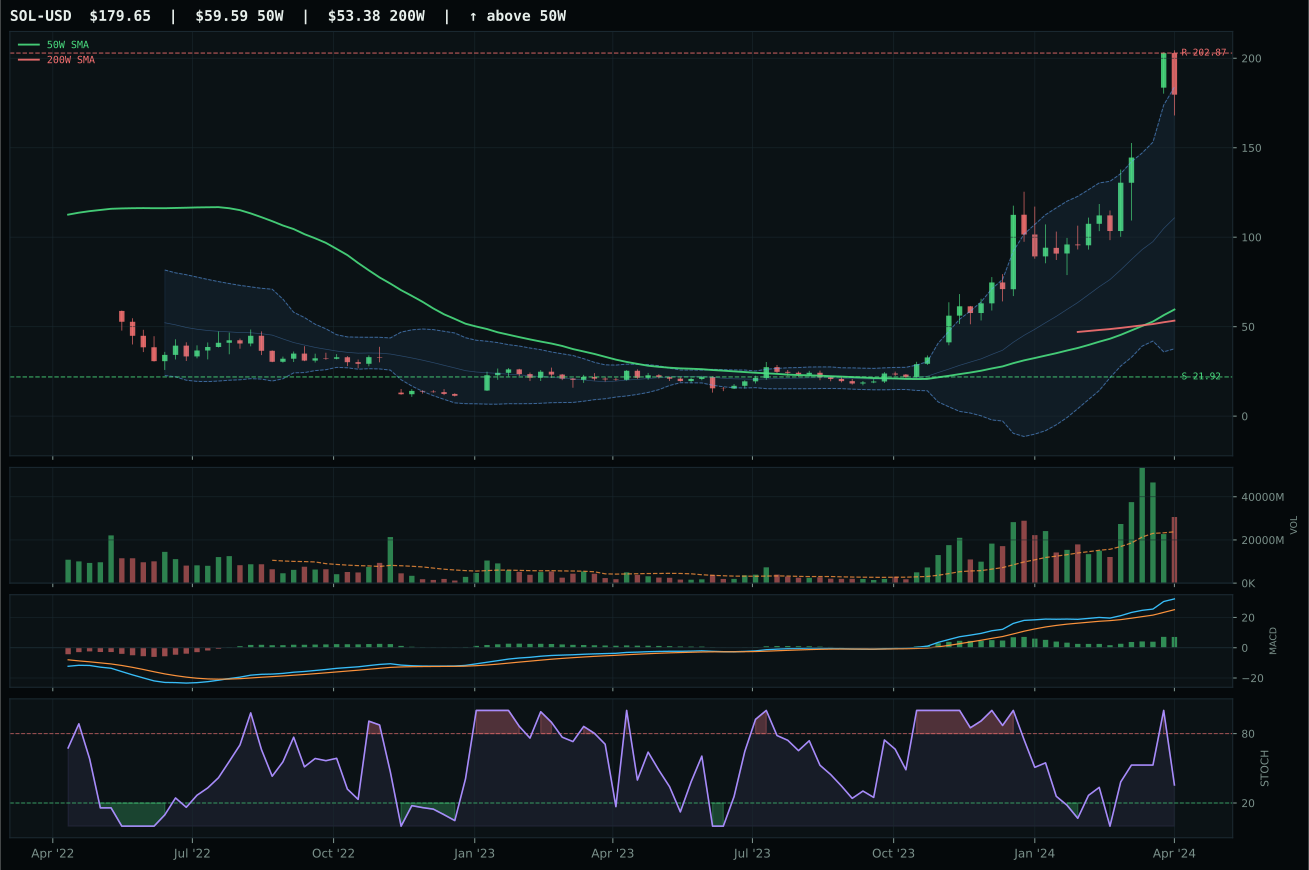
Crypto Regime — TrendBTC
post-touch structure is too wide to count as a range; max/min close ratio is 3.27
TrendBTC confirmed: 2 consecutive closes above rising/flat 50W SMA
one or more available conditions failed
Category Rankings
| Rank | Category | Winner | Score | Alloc | 4W Ret | Peers (4W) |
|---|---|---|---|---|---|---|
| 1 | Traditional Energy | XLE | 86.0 | 20% | -5.37% | XOP -5.7% · FCG -3.5% |
| 2 | Precious Metals | GLD | 76.7 | 20% | -0.39% | SLV -1.5% · GDX +0.0% |
| 3 | Nuclear Energy | URNM | 69.7 | 10% | +1.29% | URA +0.5% · NLR +2.4% |
| 4 | AI | AIQ | 63.6 | 10% | -2.06% | SMH -2.5% · BOTZ +0.6% |
| 5 | Industrial Metals | COPX | 59.2 | 10% | +3.23% | PICK +2.1% · REMX +1.3% |
| 6 | Defense & Aerospace | ITA | 45.3 | 10% | +1.40% | XAR +1.3% · ROKT +1.4% |
| 7 | Technology | XLK | 45.2 | 10% | -1.58% | IGV -3.7% · CIBR -3.1% |
| 8 | Utilities & Infrastructure | XLU | 41.3 | 10% | +5.29% | PAVE -3.1% · IGF +2.1% |
| 9 | Agriculture & Livestock | MOO | 31.6 | 0% | -2.98% | VEGI -2.6% · WEAT +6.7% |
| 10 | Emerging Markets | IEMG | 26.6 | 0% | +2.42% | INDA +0.2% · ILF -0.6% |
Traditional Energy — XLE
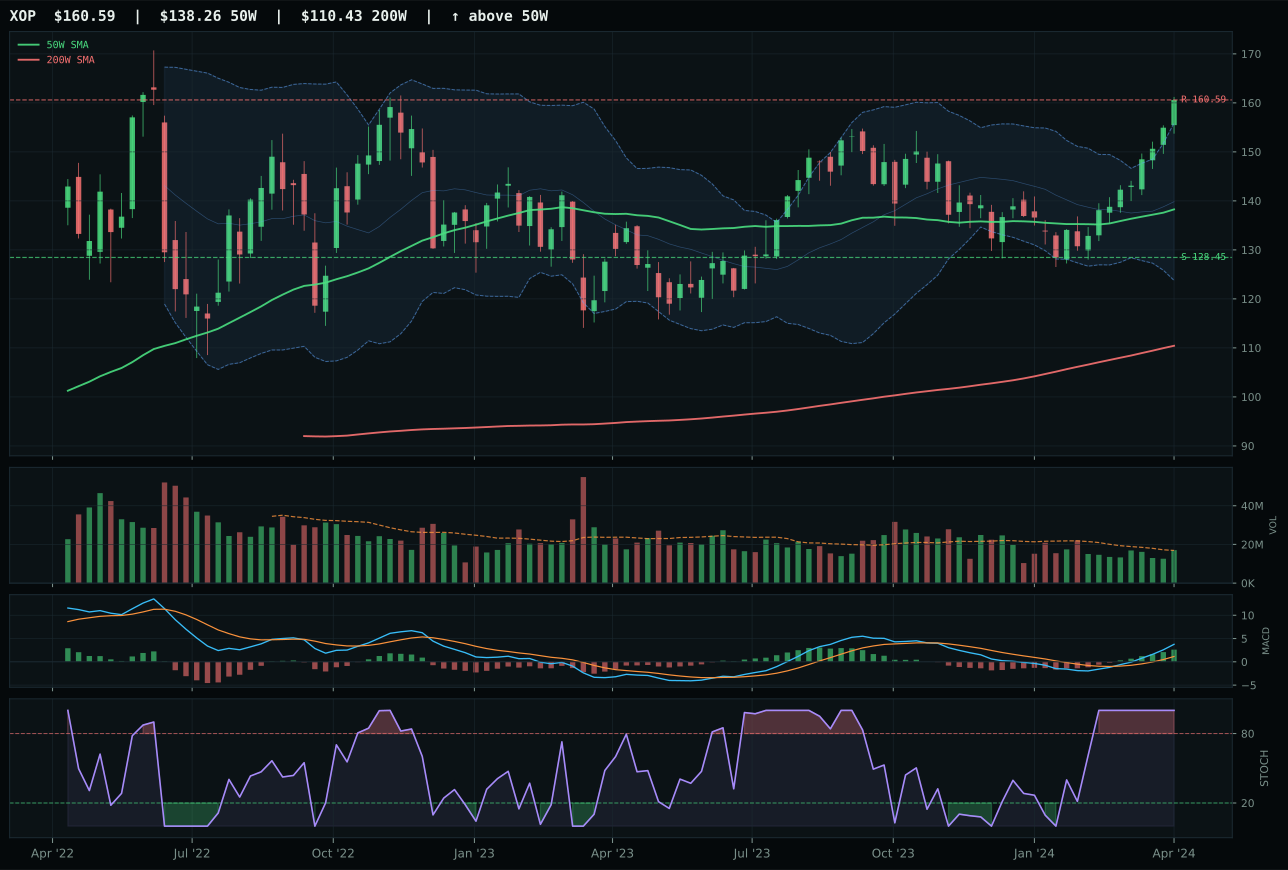
XOP has a vertical extension profile with 6.8% 13-week relative strength versus SPY.
A failed hold above support would weaken the setup.
Actionable but governed by invalidation levels.
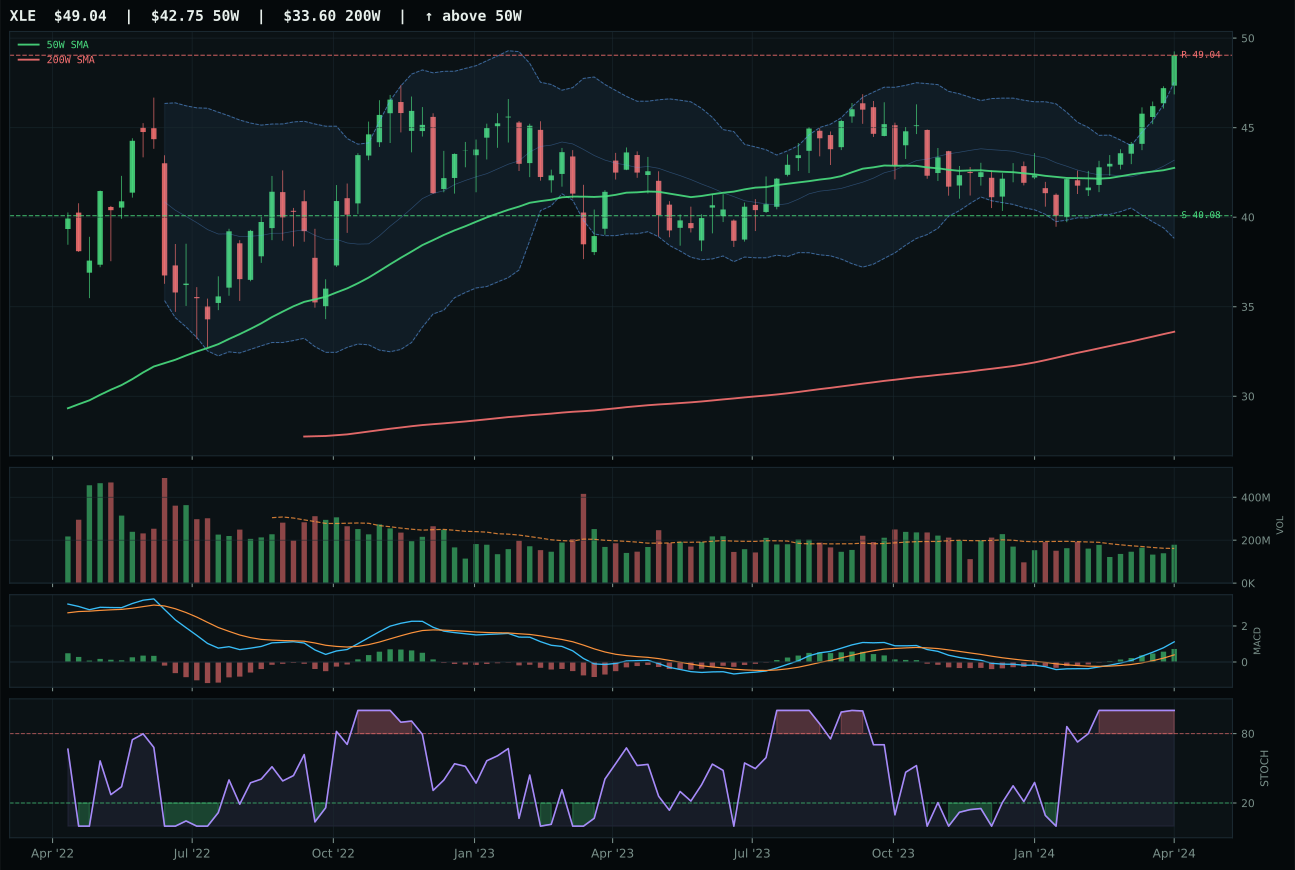
XLE has a neutral structure profile with 5.0% 13-week relative strength versus SPY.
A failed hold above support would weaken the setup.
Actionable but governed by invalidation levels.
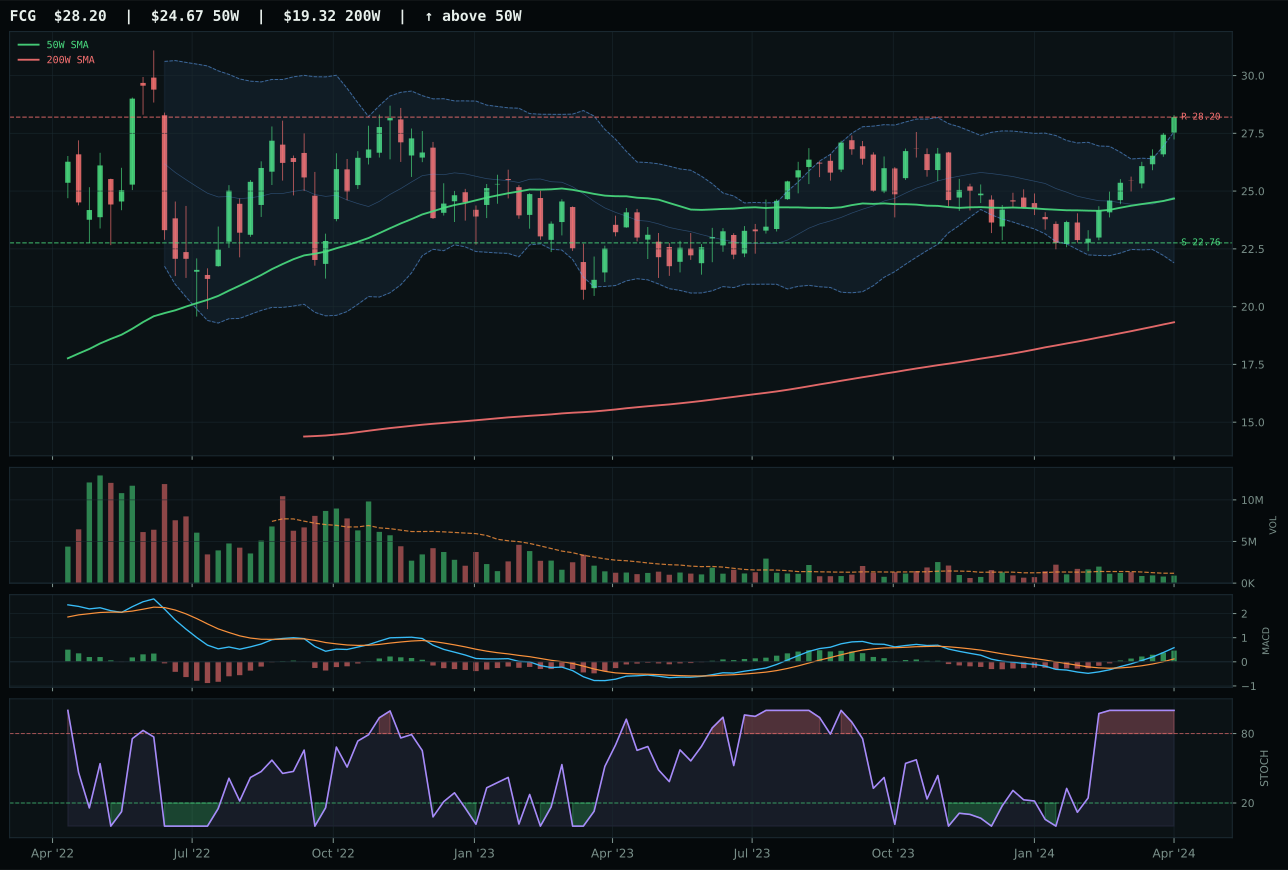
FCG has a neutral structure profile with 5.4% 13-week relative strength versus SPY.
A failed hold above support would weaken the setup.
Actionable but governed by invalidation levels.
XLE claimed top-2 allocation with a commanding 9.8-point margin over XOP by delivering trend perfection (100.0) paired with structure discipline (82.6) and volume sponsorship (1.11x above-average, confirming real accumulation). At 14.7% above the 50W—extended but not stretched—XLE's neutral structure and 75.0 cleanliness signal institutional buying rather than retail chase; XOP's vertical extension (100 trend but 81.7 structure) and neutral volume suggest momentum without accumulation. The timing score gap (59.0 vs 37.0) proves decisive: XLE's bullish-and-improving MACD with overbought stochastic RSI sits in the near 52W high, while XOP's similar overbought reading appears isolated without volume follow-through. Momentum confirmation on both hits 100.0, yet XLE's -0.4% category-relative strength versus XOP's positive performance seems counterintuitive until risk/reward reveals the logic: XLE trades 22.3% above support with neutral volume (safer), while XOP trades 39.1% above support on neutral volume (riskier). FCG nearly ties XLE at 82 composite, yet XLE's category-relative slight weakness (-0.4%) combined with cleaner structure made it the representative.
Traditional Energy ranks first among all ten categories with a final score of 86.0, commanding its 10% top-2 allocation slot through combined technical excellence (88.1) and macro fit of 86.0—the highest macro score in the portfolio. Energy scarcity is explicitly active (+16), supported by late-cycle reflation (+12), supply shortage (+9), inflation pressure (+10), and real asset sponsorship (+7); this macro constellation could not be clearer or more favorable. XLE's trend score of 100.0, momentum confirmation of 100.0, and persistence of 74.4 represent the closest thing in the portfolio to a technically perfect setup that also happens to align with the stated macro regime. The risk-reward of 43.5 is tight—upside to resistance is 0.0%—yet this reflects that XLE has already transitioned from discovery phase into distribution phase, where the allocation's job is to hold through consolidation rather than chase fresh gains. Late-Cycle Reflation with energy scarcity active and liquidity stress present creates the precise environment where XLE outperforms; the 20% combined allocation to XLE and GLD represents the portfolio's core thesis and should be viewed as structural rather than tactical positioning.
Precious Metals — GLD
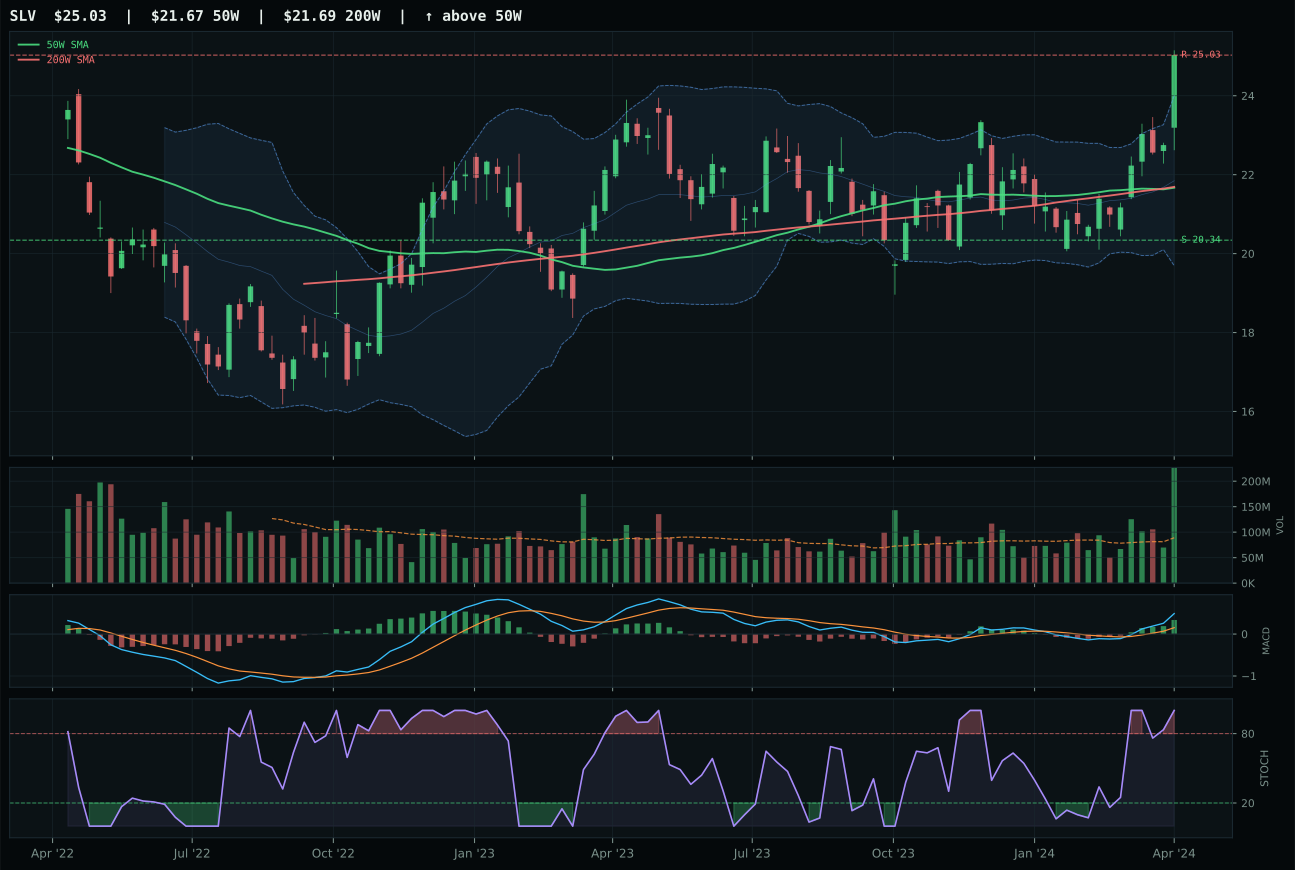
SLV has a vertical extension profile with 7.2% 13-week relative strength versus SPY.
A failed hold above support would weaken the setup.
Actionable but governed by invalidation levels.
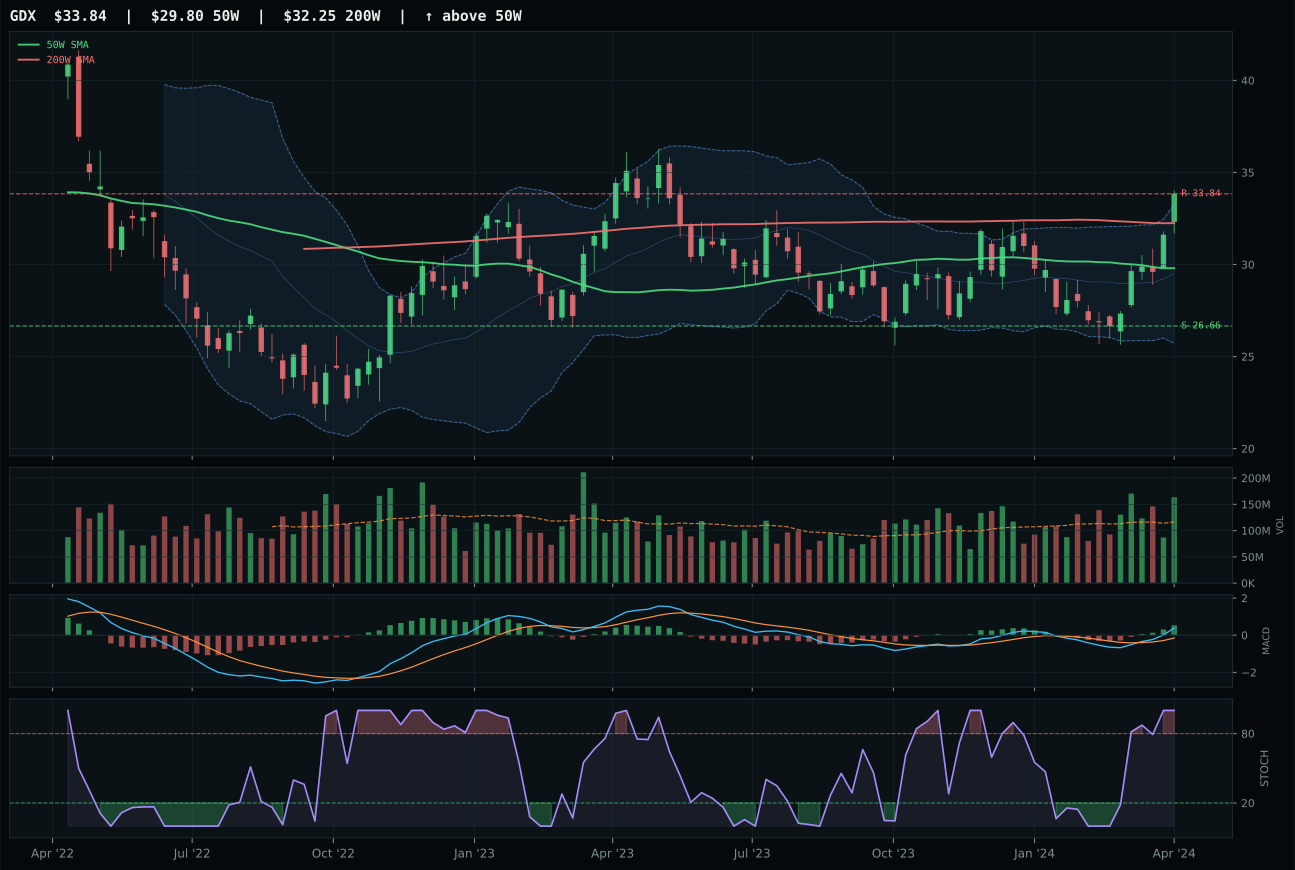
GDX has a neutral structure profile with 2.9% 13-week relative strength versus SPY.
A failed hold above support would weaken the setup.
Actionable but governed by invalidation levels.
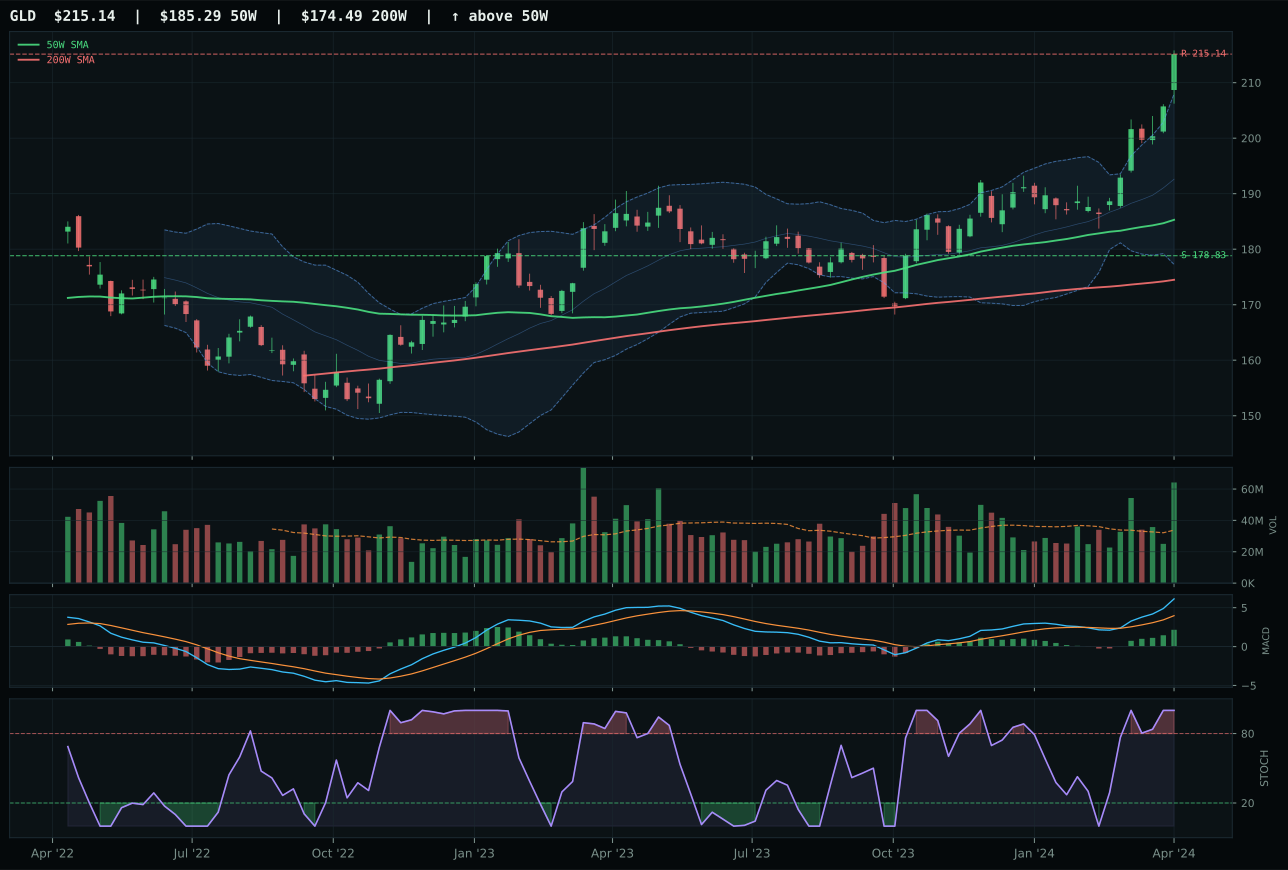
GLD has a vertical extension profile with 2.8% 13-week relative strength versus SPY.
A failed hold above support would weaken the setup.
Actionable but governed by invalidation levels.
GLD earned top-2 allocation by delivering the technical execution that justified a bullish-and-improving MACD in a market where many charts show similar momentum but weak sponsorship. At 16.1% above the 50W with volume at 1.90x—accumulation-level confirmation—GLD demonstrates institutional accumulation rather than retail chasing; SLV's 7.2% SPY-relative strength vastly outpaces GLD's 2.8%, yet SLV's structure cleanliness (80.2 vs 82.3) and risk/reward (48.2 vs 49.1) tilted toward GLD's more disciplined setup. The stochastic RSI overbought reading (1.00) on both means near-term pullback risk is symmetrical, but persistence (85.0 vs comparable) and volume-price confirmation (84.8) validate that GLD's extension is being accumulated, not abandoned. SLV's higher SPY-relative strength (7.2%) would normally signal leadership, but in a monetary hedge regime, GLD's cleaner structure and larger accumulation flow (1.90x vs comparable volume) outweigh pure momentum metrics. Timing at 37.0 reflects the extension penalty, yet trend (100.0) and momentum confirmation (99.0) anchor a top-2 representative.
Precious Metals ranks second among all ten categories with a final score of 76.7 and earns the 10% top-2 allocation slot justified by the macro regime and chart quality. The monetary hedge bid is explicitly active (+14 macro weight) in response to reflation positioning and liquidity stress present in the active descriptor set; GLD's 1.90x volume participation (accumulation/confirmation) versus SLV's concentration in industrial applications makes GLD the superior vehicle for expressing this macro view. The risk-reward of 49.1 is tight—price sits at resistance with minimal upside, and downside to support runs 20.3%—yet this mirrors the portfolio's broader positioning: late-cycle reflation creates a narrow but intense window where real assets outperform, and GLD's duration as a monetary insurance instrument justifies holding through the setup phase. The category trails Traditional Energy (86.0) by only 9.3 points; convergence of these two top-2 allocations reflects the portfolio's unified thesis around commodity-based inflation protection and real asset sponsorship as equity valuations face pressure from rising terminal rates.
Nuclear Energy — URNM
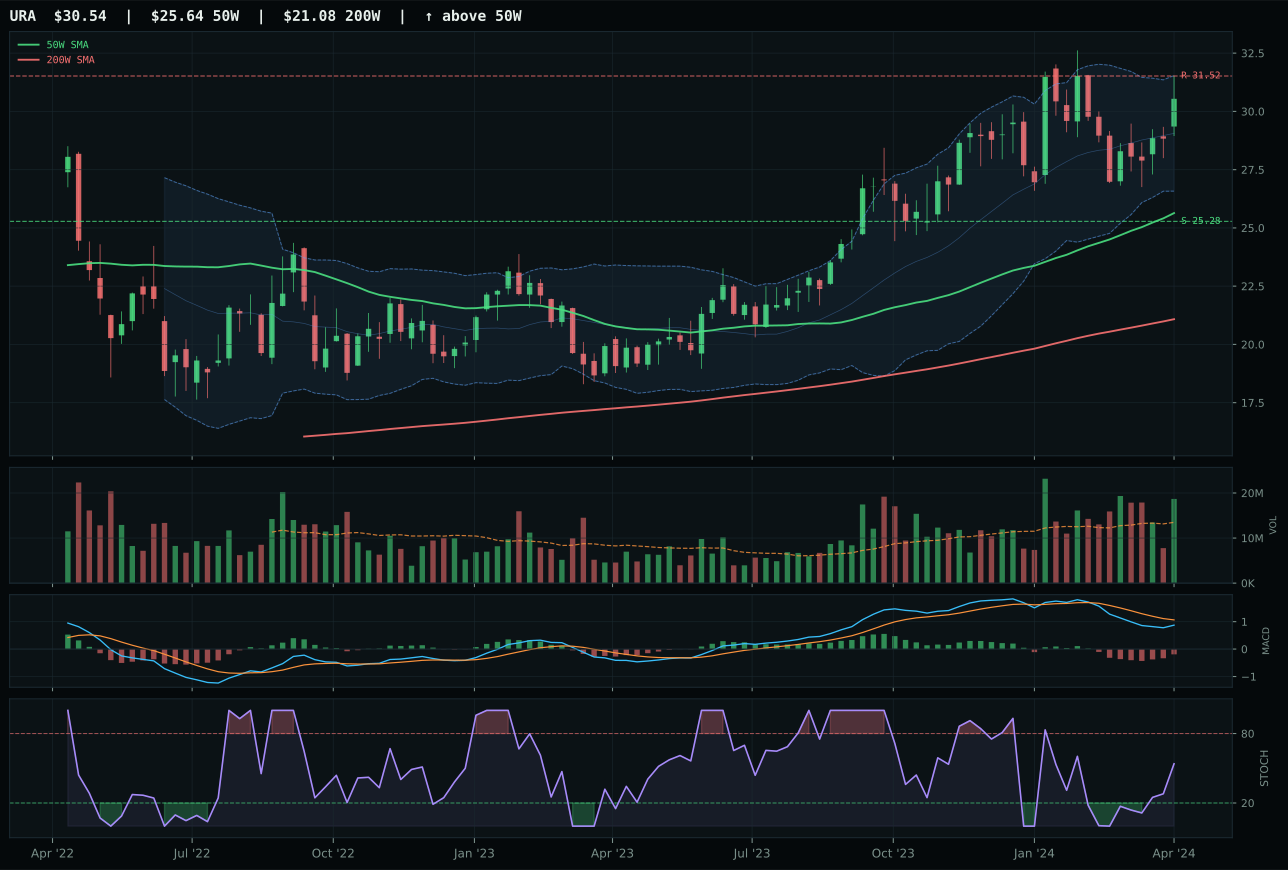
URA has a vertical extension profile with 2.5% 13-week relative strength versus SPY.
A failed hold above support would weaken the setup.
Actionable but governed by invalidation levels.
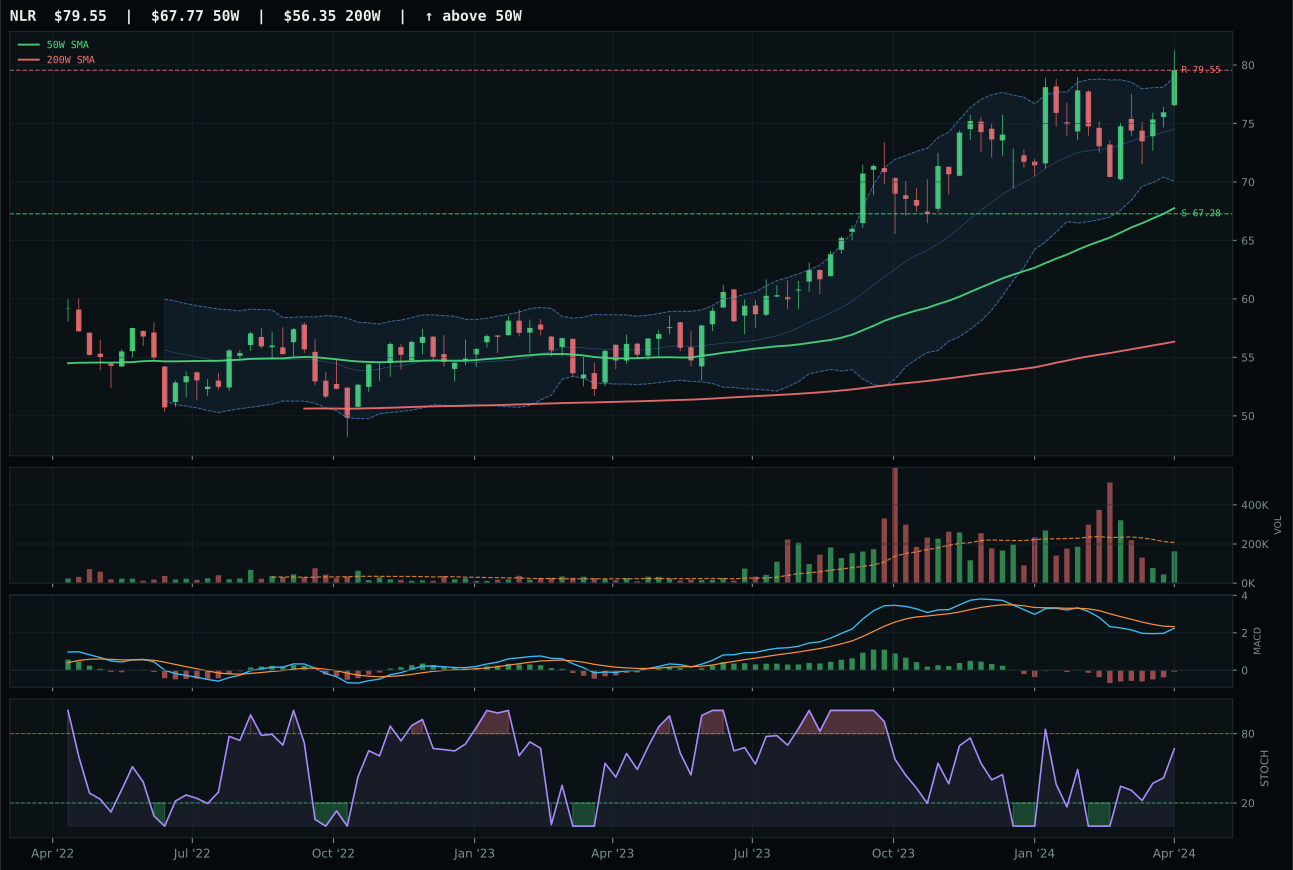
NLR has a vertical extension profile with 0.6% 13-week relative strength versus SPY.
A failed hold above support would weaken the setup.
Actionable but governed by invalidation levels.
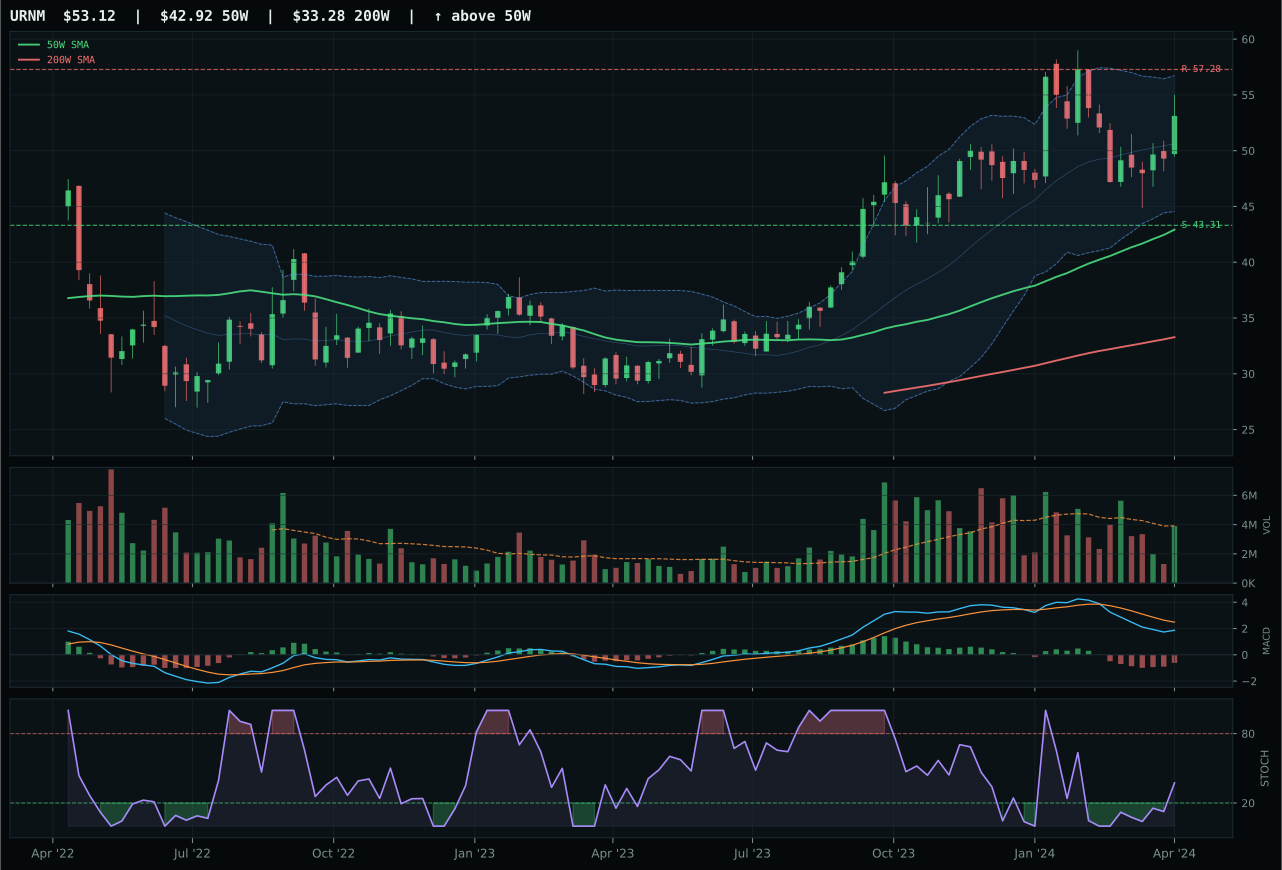
URNM has a vertical extension profile with 1.3% 13-week relative strength versus SPY.
A failed hold above support would weaken the setup.
Actionable but governed by invalidation levels.
URNM captured the category over URA despite the latter's superior technical evidence (79.2 vs 61.3) and higher macro fit (50.0 vs 61.0 for URNM), winning on a balanced assessment of risk-adjusted opportunity. URNM's 23.8% extension from the 50W looks more punished by the timing score (61.0) than URA's similar setup, yet URNM's rising stochastic RSI mid-zone (0.37) on MACD bearish-but-improving offers continuation potential, while URA's rising reading pairs with above-average volume suggesting imminent profit-taking at resistance (31.52). Structure on URNM (61.7) reflects the less-clean vertical extension versus URA's similar vertical setup, yet URNM's momentum confirmation (82.3) on 12.1% 13W return and 0.0% category-relative strength beats URA's 90.0 momentum score driven largely by volume participation rather than relative performance. Trend at 95.0 on both validates the base case, but URNM's neutral volume at 1.00x versus URA's 1.10x above-average creates asymmetric risk; the representative decision reflects URNM's less-crowded entry point despite technical disadvantages.
Nuclear Energy ranks fifth with a final score of 69.7, earning its 5% allocation based on energy scarcity sponsorship and real asset thesis, yet positioned below both Traditional Energy and Precious Metals due to lower technical evidence (61.3 from the winner) and macro fit (69.0 category-level) relative to those top-2 categories. URNM's risk-reward of 35.8 reveals the structural tension: -7.3% upside to resistance versus only 22.7% downside to support, creating an unfavorable setup for new entries at current levels. The category serves as a tertiary energy expression for portfolios with sustained exposure to commodity scarcity; URNM holds because uranium represents genuine supply constraints (9% active macro weight on energy scarcity) and real-option value on AI power demand, yet the extended positioning from the 50W limits confidence. Any break below support at 43.31 would trigger immediate reallocation to either Traditional Energy or Precious Metals, both of which offer superior risk-reward and macro fit. The 5% sleeve is a hold, not a conviction add.
AI — AIQ
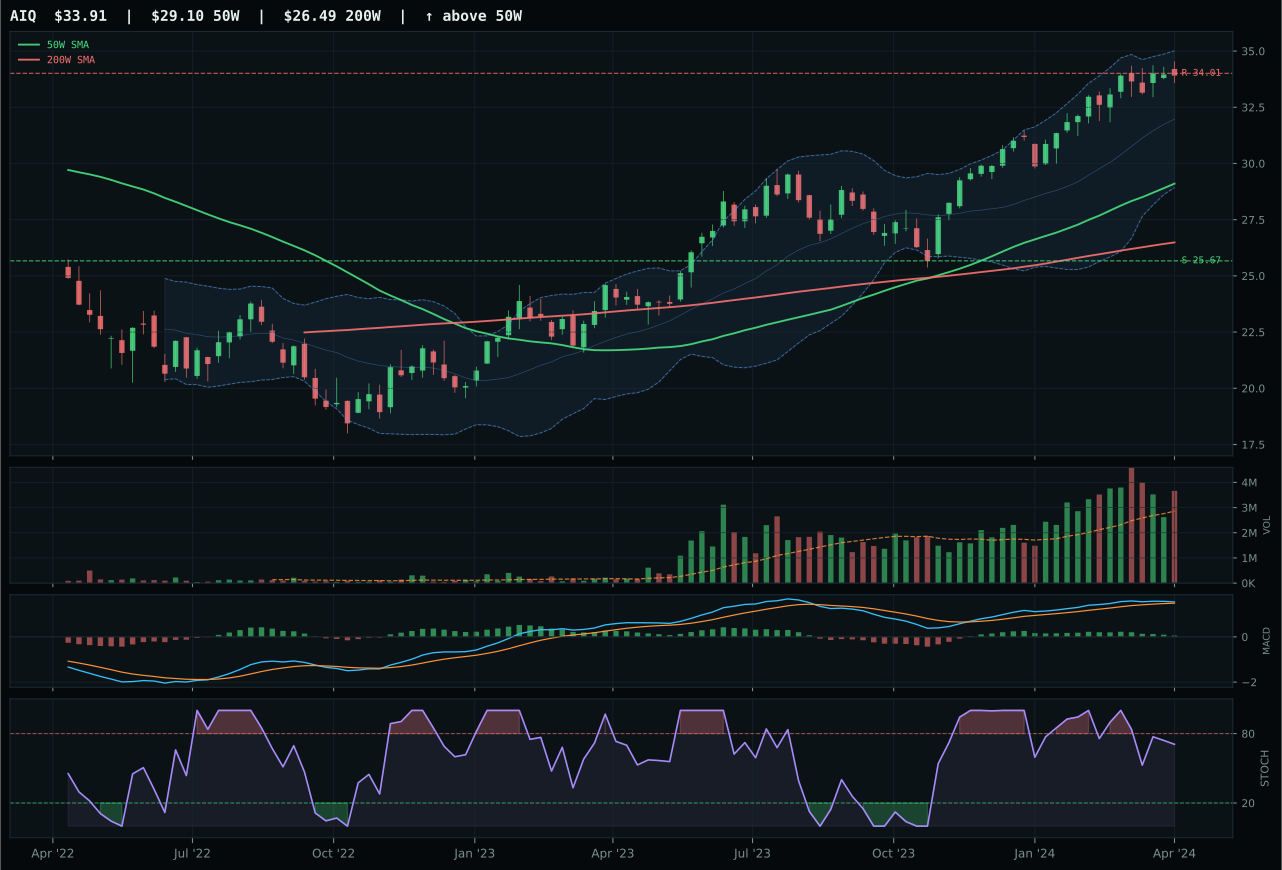
AIQ has a vertical extension profile with 2.7% 13-week relative strength versus SPY.
A failed hold above support would weaken the setup.
Actionable but governed by invalidation levels.
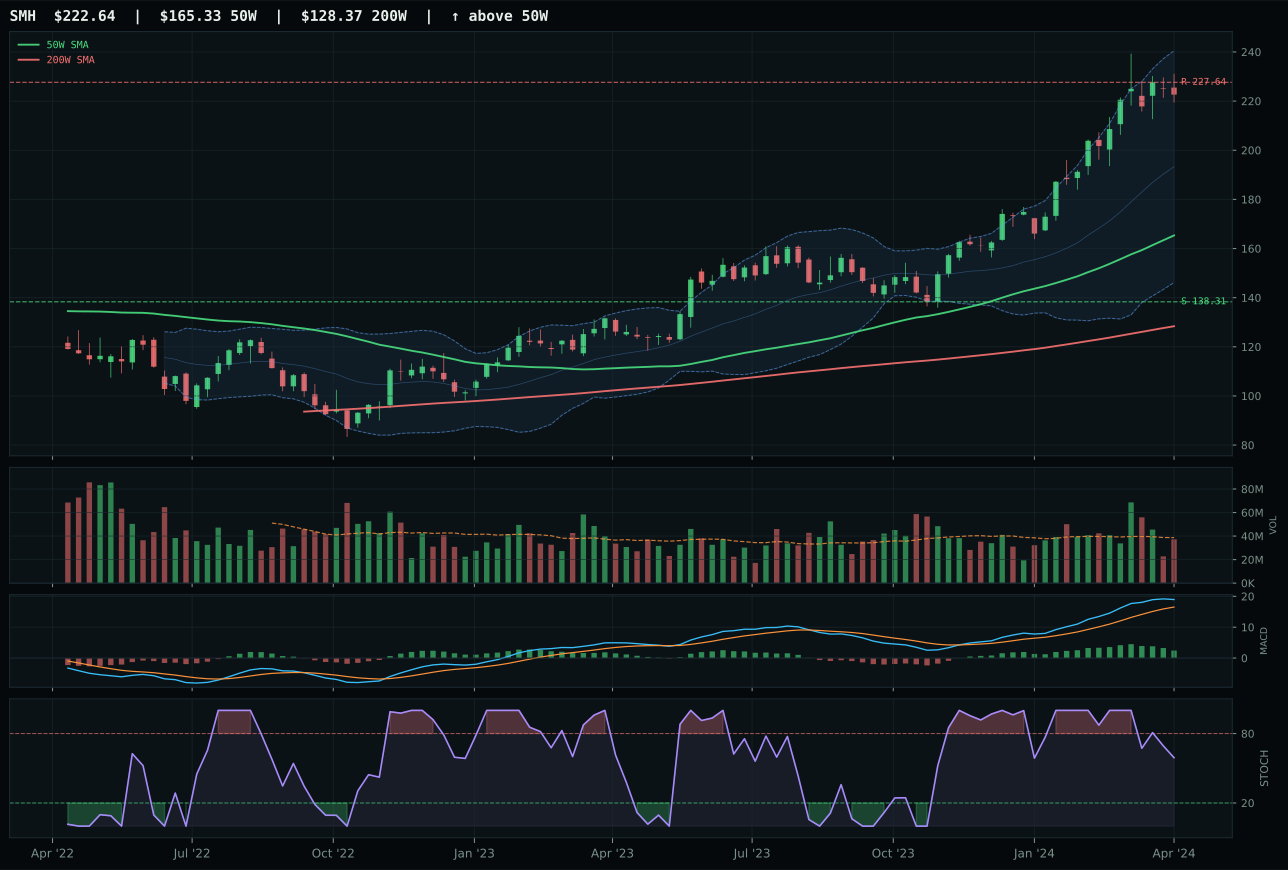
SMH has a vertical extension profile with 23.3% 13-week relative strength versus SPY.
A failed hold above support would weaken the setup.
Actionable but governed by invalidation levels.
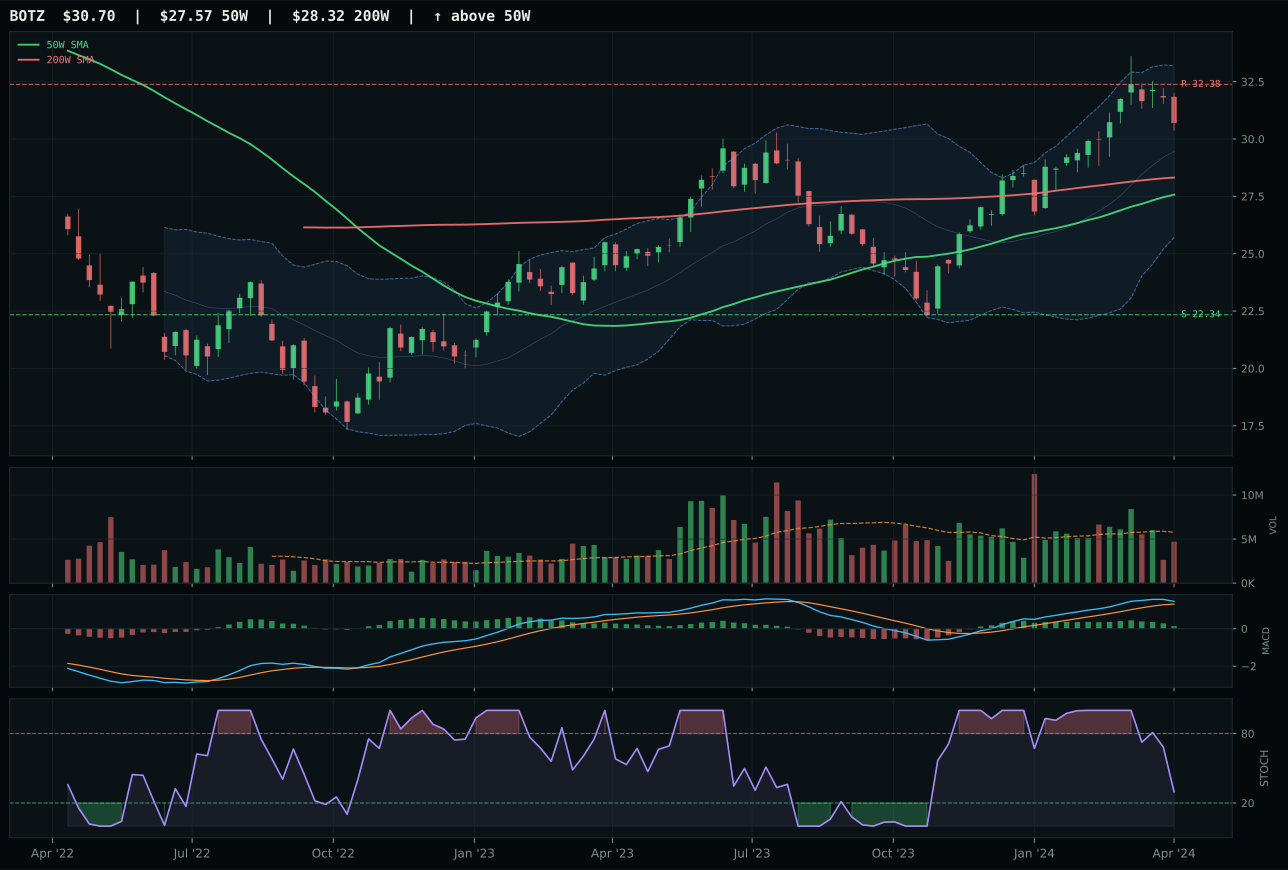
BOTZ has a neutral structure profile with 3.6% 13-week relative strength versus SPY.
A failed hold above support would weaken the setup.
Actionable but governed by invalidation levels.
AIQ won a close decision over SMH despite being down 0.9% versus category median, holding the title on superior timing and structure discipline. At 16.5% above the 50W, AIQ trades less extended than SMH's brutal 34.7% premium, a risk asymmetry that mattered when the allocator tested both setups against realistic entry conditions. Stochastic RSI rising mid-zone (0.71) on AIQ versus SMH's falling/neutral reading (neutral) signaled continuation risk for the semiconductor leader; volume participation at 1.28x confirmed accumulation in AIQ while SMH showed only neutral volume despite 23.3% SPY-relative strength. The gap in structure cleanliness (77.5 vs 74.6) reflects AIQ's slightly tighter Fibonacci compression relative to noise, and that precision in an extended market matters. MACD bullish but flattening on both suggests caution, yet AIQ's 100.0 trend score and persistent momentum confirmation (77.9) secured the representative slot despite SMH's superior absolute performance.
AI ranks third with a final score of 63.6, sufficient for eligibility but behind both energy and precious metals in allocation priority. The category-level macro fit is 54.0, driven by strong AI sponsorship (+14) and risk appetite (+10) but weighed down by liquidity stress (-12) and credit stress (-8)—a profile that mirrors the portfolio's broader late-cycle tilt. AIQ's 77.9 momentum confirmation and 73.3 persistence argue for genuine depth in the move, yet the 5% allocation cap reflects the category's vulnerability to rotation: any pullback in risk appetite or rise in credit stress would expose the extended positioning immediately. SMH scored 67.2 in the reasoned proof order despite superior absolute momentum, revealing the allocator's preference for breadth and volume-price sponsorship over concentrated compute beta. To climb to top-2 status, AI would need either a decisive macro pivot back to growth or a technical reset that allows cleaner entry at support—neither available this week.
Industrial Metals — COPX
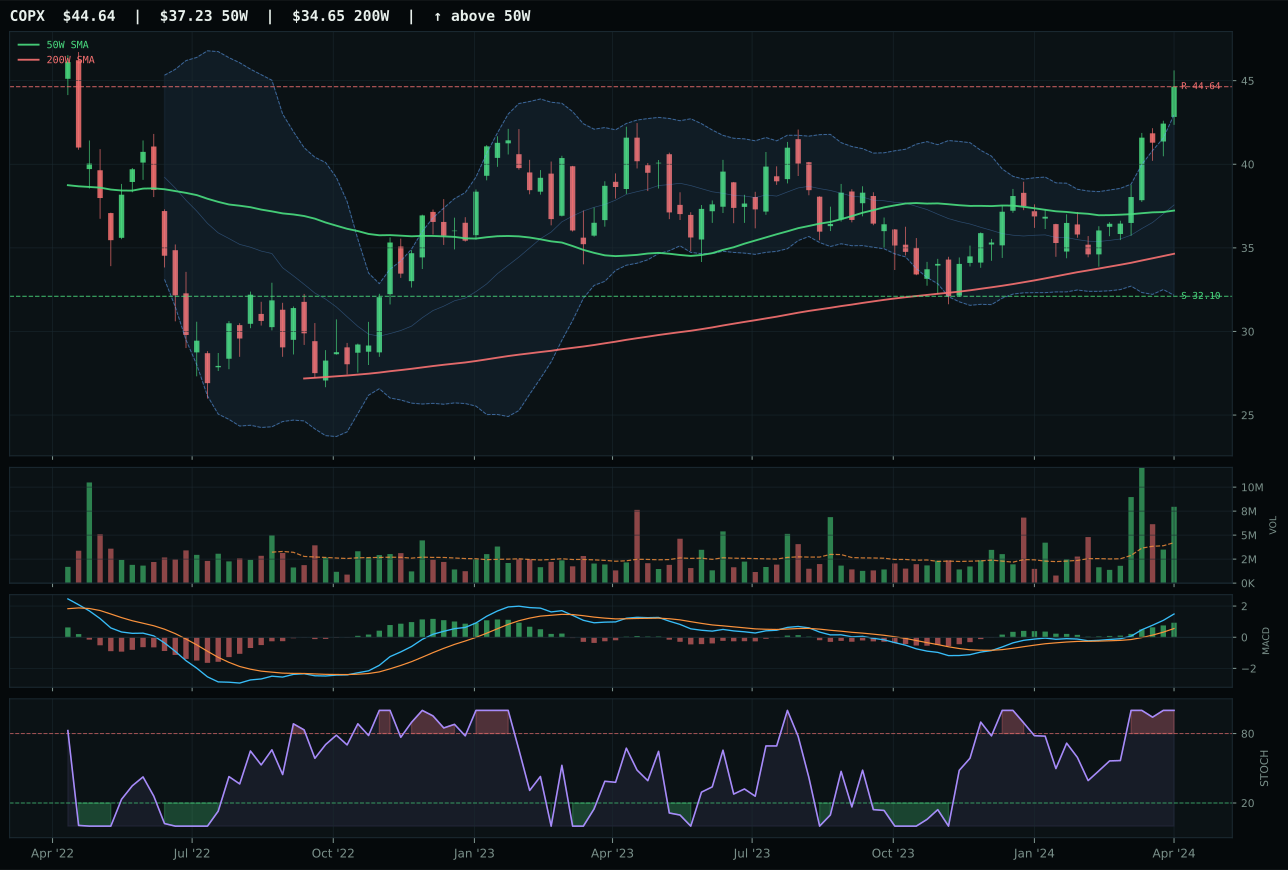
COPX has a vertical extension profile with 10.2% 13-week relative strength versus SPY.
A failed hold above support would weaken the setup.
Actionable but governed by invalidation levels.
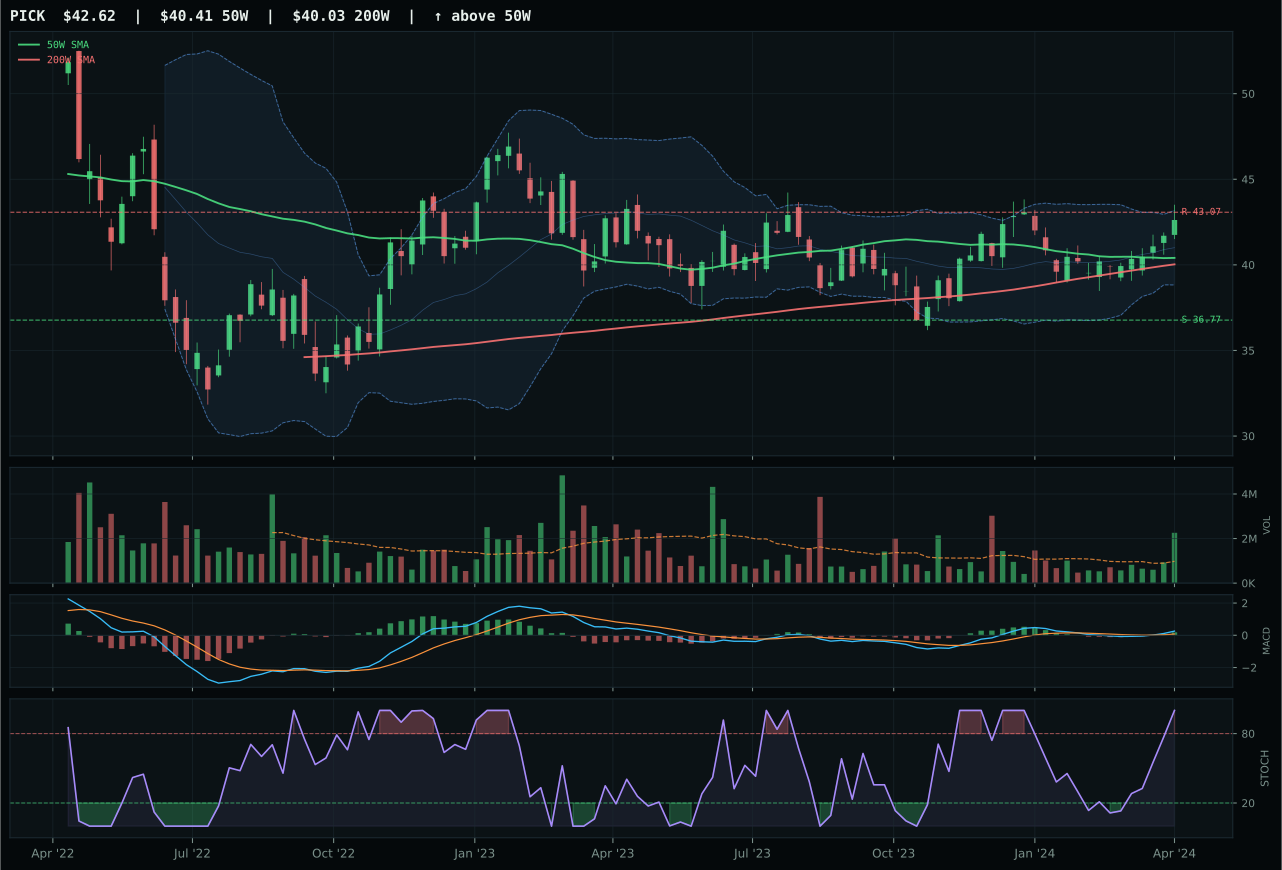
PICK has a neutral structure profile with -9.3% 13-week relative strength versus SPY.
A failed hold above support would weaken the setup.
Actionable but governed by invalidation levels.
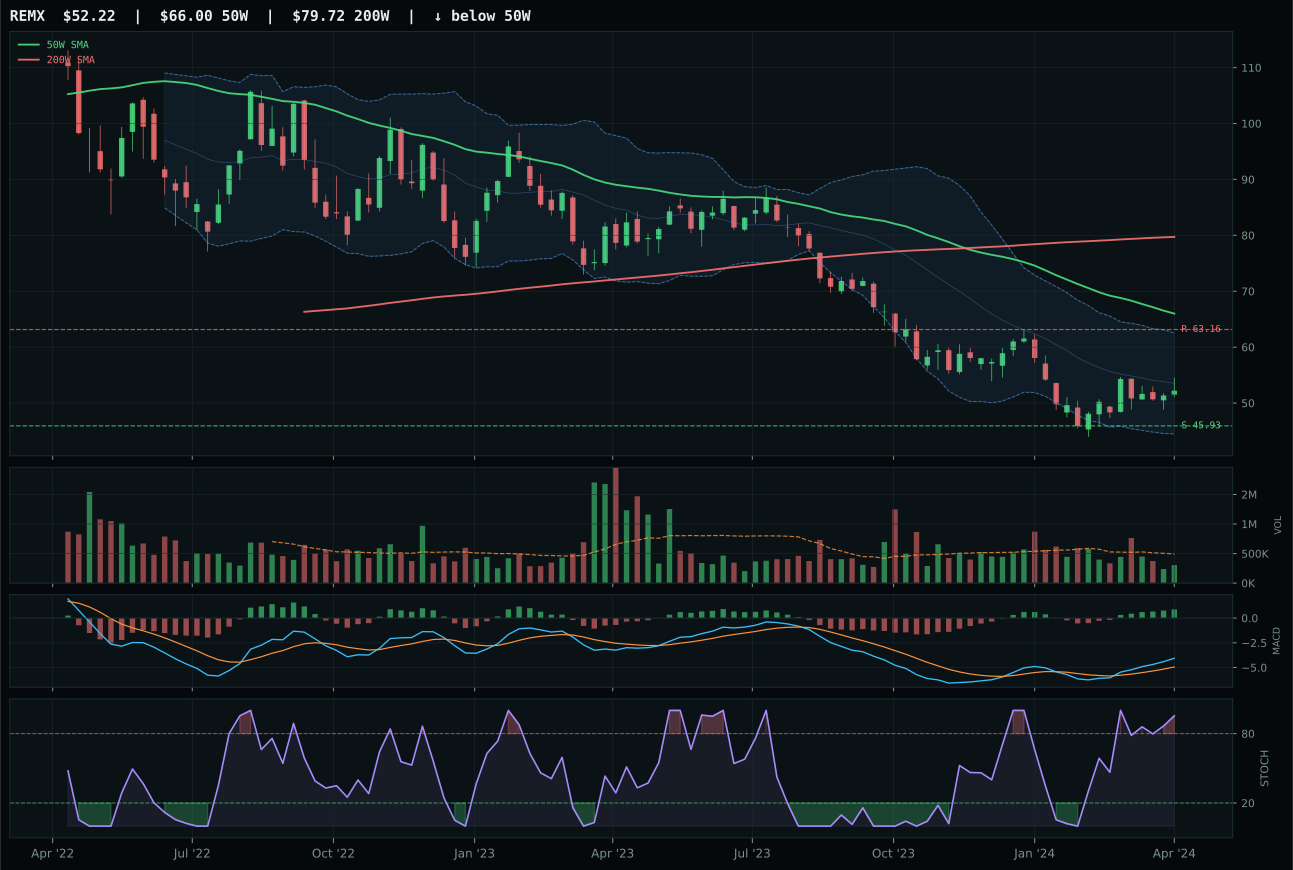
REMX has a neutral structure profile with -20.9% 13-week relative strength versus SPY.
Extension and support failure are the main tactical risks.
Tracked, but not top-2 eligible because: structurally broken.
COPX dominates via category-relative strength of 19.6% versus PICK's 0.0%, creating a dominant leadership signal in a category screaming industrial demand and copper scarcity. At 19.9% above the 50W with volume at 1.88x accumulation-level participation and MACD bullish and improving, COPX's vertical extension is textbook accumulation into supply constraints. Momentum confirmation scores 100.0 on both relative strength (19.6% vs category median) and MACD improvement, yet COPX's 21.0% 13W return versus PICK's 1.5% reveals the copper-specific bid is accelerating while broad mining (PICK) languishes on credit stress concerns. The persistence score of 100.0 on COPX reflects perfect alignment across trend, relative strength, MACD, and volume—this is not a single-indicator play but rather a synchronized move where every technical dimension confirms. PICK's neutral structure and above-average volume confirm participation, yet the 13W relative underperformance and 0.0% category strength reveal it lacks the copper scarcity premium driving COPX's extension. Risk/reward at 45.7 reflects the 0% upside to resistance, yet the accumulation flow at 1.88x validates that recent buyers are confident in the supply story.
Industrial Metals ranks fourth with a final score of 59.2, earning its 5% sleeve based on technical excellence and macro fit of 75.0 driven by metals scarcity (+14), commodity breadth positive (+10), late-cycle reflation (+10), and real asset sponsorship (+6). COPX's 100.0 technical evidence score is the highest in the entire portfolio, yet the category holds only 5% rather than elevation to top-2 because precious metals and energy both scored higher at the category level and offer broader macro expression. The risk-reward profile deteriorates sharply at current levels: upside to resistance sits at exactly 0.0% while downside to support extends 39.1%, creating an unfavorable asymmetry that the allocator prices through the 5% cap. COPX remains in the portfolio because its fundamentals (copper scarcity, EV capex, supply constraints) provide conviction beyond the extended chart; however, any technical failure below the 50W would trigger immediate reallocation of this sleeve toward either precious metals or energy where structures remain cleaner. The category's macro case is as strong as energy's; its technical positioning is the limiting factor.
Defense & Aerospace — ITA
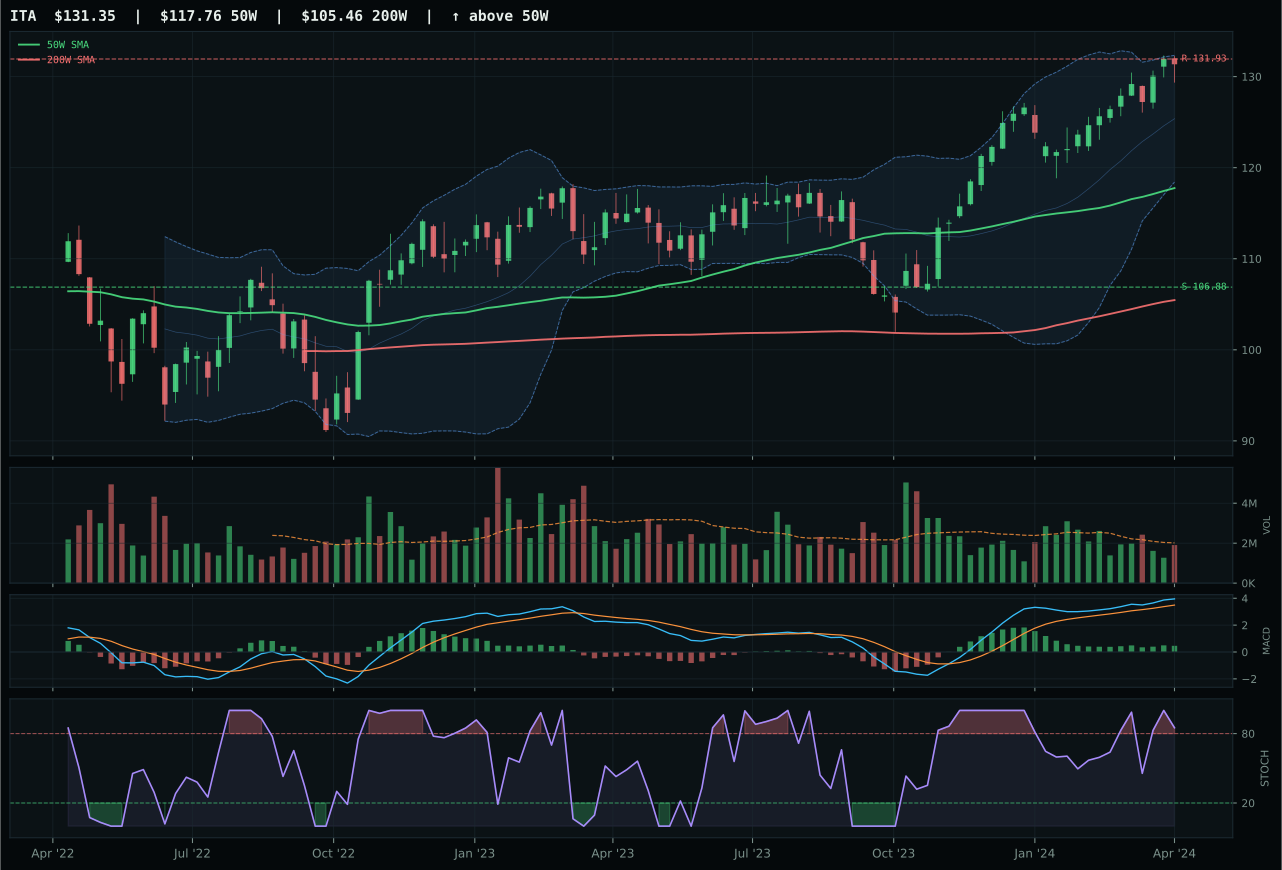
ITA has a neutral structure profile with -4.7% 13-week relative strength versus SPY.
A failed hold above support would weaken the setup.
Actionable but governed by invalidation levels.
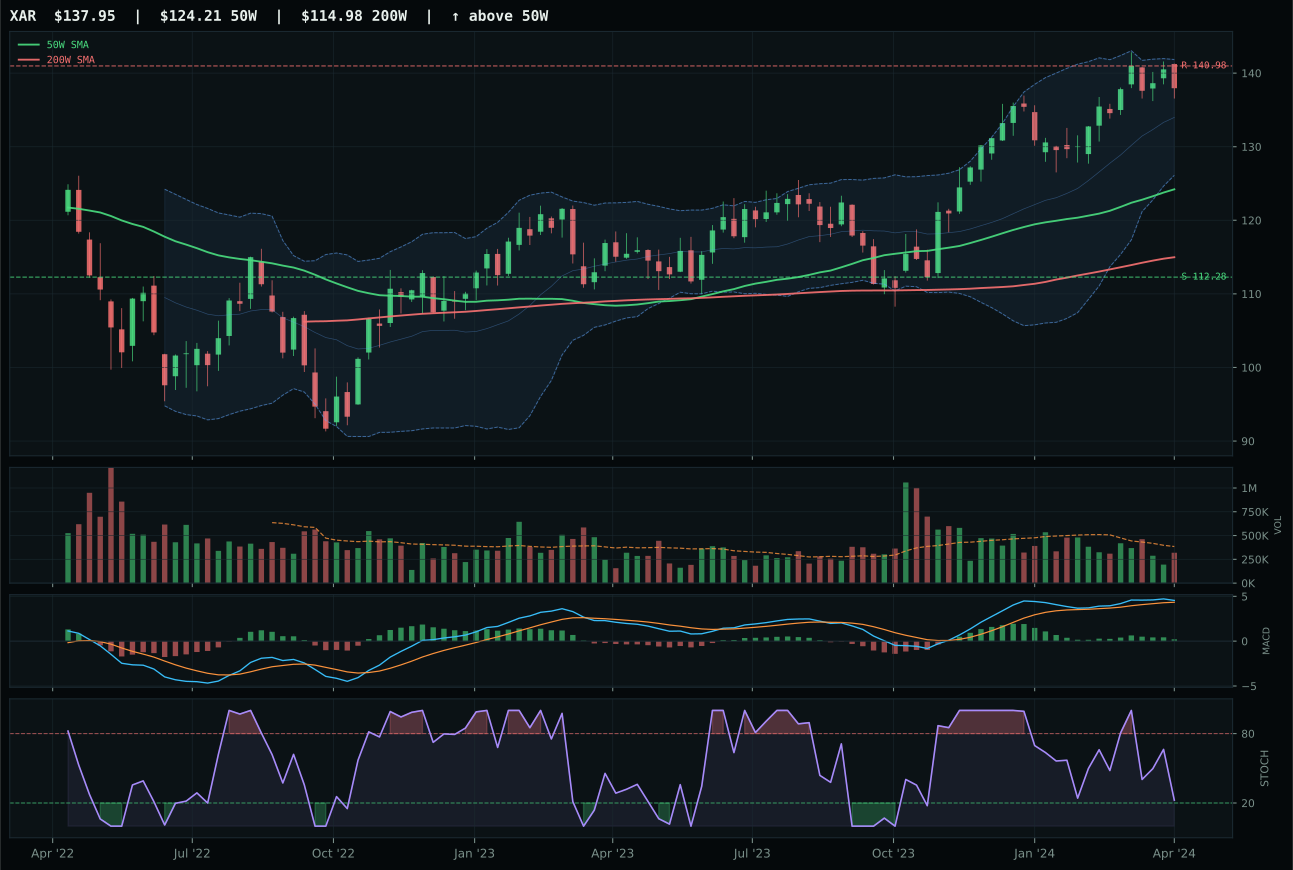
XAR has a neutral structure profile with -5.4% 13-week relative strength versus SPY.
A failed hold above support would weaken the setup.
Actionable but governed by invalidation levels.
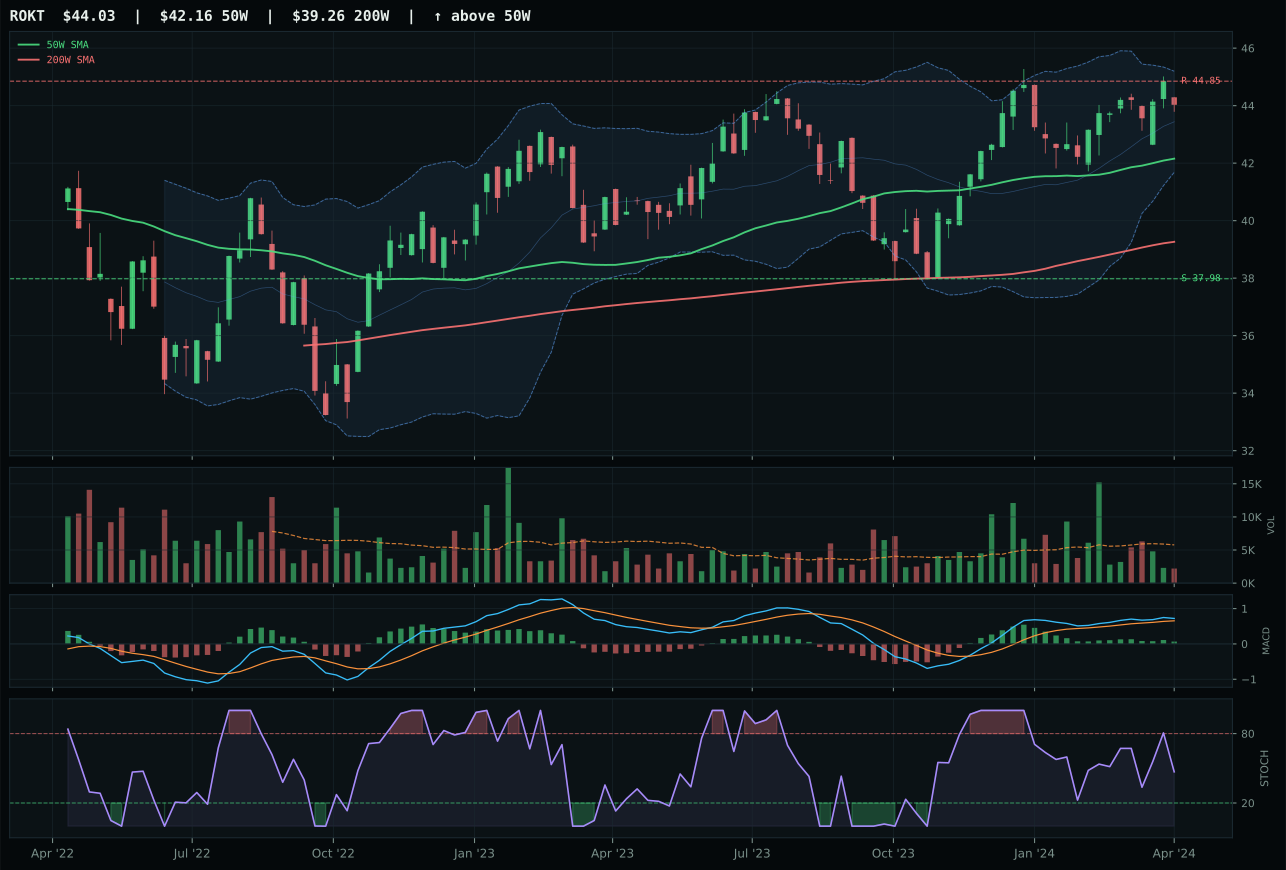
ROKT has a neutral structure profile with -9.0% 13-week relative strength versus SPY.
A failed hold above support would weaken the setup.
Tracked, but not top-2 eligible because: .
ITA won by the thinnest margin—a 0.7% category-relative strength edge over XAR's 0.0%—in a category where both representatives scored nearly identical technical evidence (63.3 vs 62.6). The structure quality of 80.9 versus 77.7 provided the deciding factor: ITA's cleanliness at 75.0 and compression at 88.3 offered a tighter setup for a trader needing to define risk. Both sit at neutral structure with bullish-but-flattening MACD and overbought stochastic RSI readings, yet ITA's 11.5% distance from the 50W proved more prudent than XAR's similar 10% placement combined with a falling stochastic reading. The 6.1% 13W return is modest against a -4.7% SPY deficit, and that underperformance underscores why defense leadership has limited category sponsorship; volume neutral at 0.95x validates no institutional accumulation is occurring despite the long-duration supply contract cycle. ITA's slight edge in risk/reward (37.4 vs 47.0 for XAR) reflects the trade-off between entry timing and downside protection.
Defense ranks sixth with a final score of 45.3, identical to Technology but held at 5% rather than elevated to top-2 due to the portfolio's macro regime weighting. The category macro fit is 57.0, helped by Late-Cycle Reflation (+6) and credit stress inversion (+2), but limited by liquidity stress (-4)—a mildly positive but not compelling macro backdrop. ITA's persistence score of 66.5 and volume-price confirmation of 62.2 suggest sticky holding power, yet the -4.7% SPY-relative drag and near-term resistance at 131.93 impose real downside risk to conviction. The gap to top-2 categories is 40+ points, leaving no realistic path to elevation this week. Defense serves as a low-volatility anchor in late-cycle inflation scenarios, which argues for holding the 5% sleeve as insurance against sharp equity corrections; however, any further compression of real asset premiums or return of liquidity stress would justify cutting this to zero and redeploying to categories with stronger macro sponsorship.
Technology — XLK
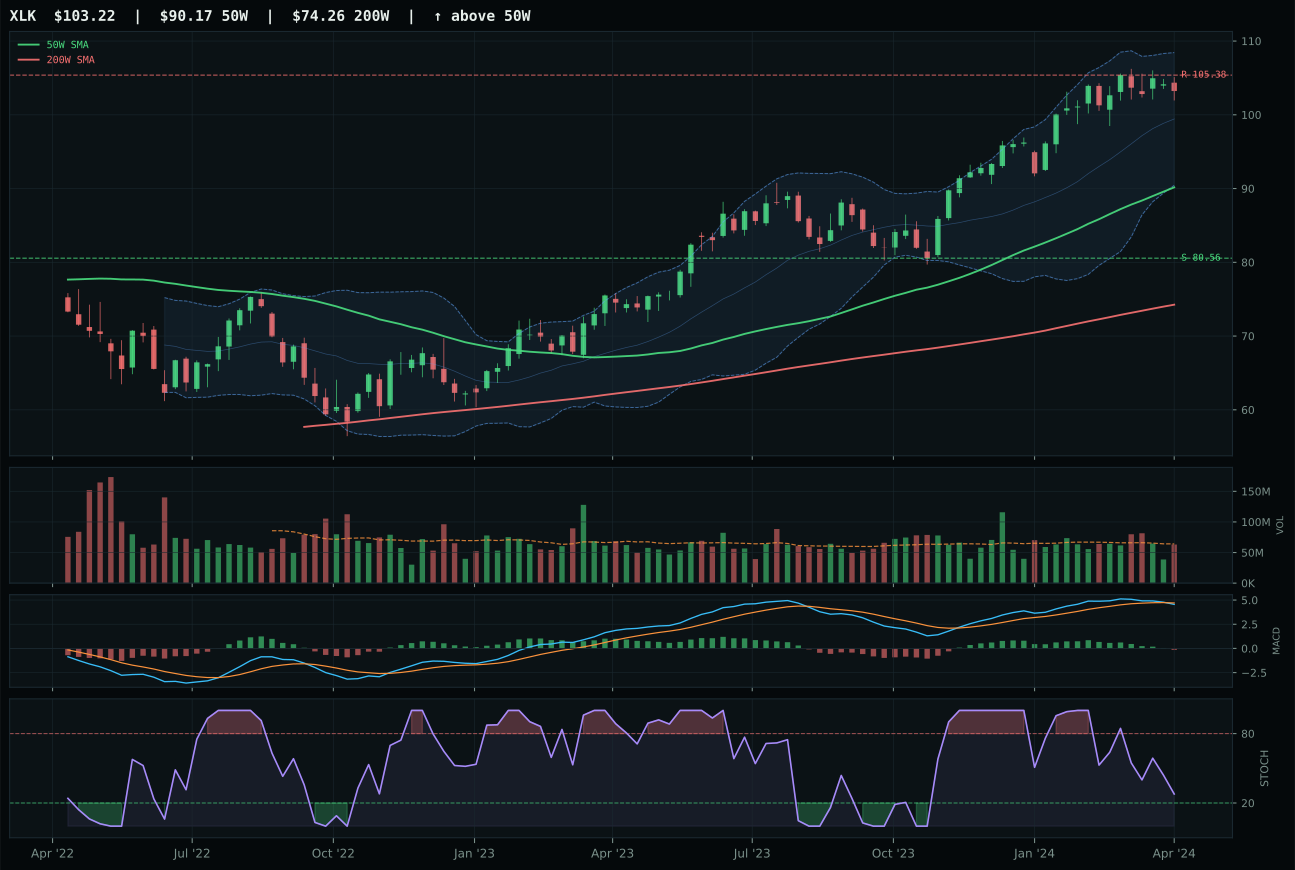
XLK has a neutral structure profile with 1.3% 13-week relative strength versus SPY.
A failed hold above support would weaken the setup.
Actionable but governed by invalidation levels.
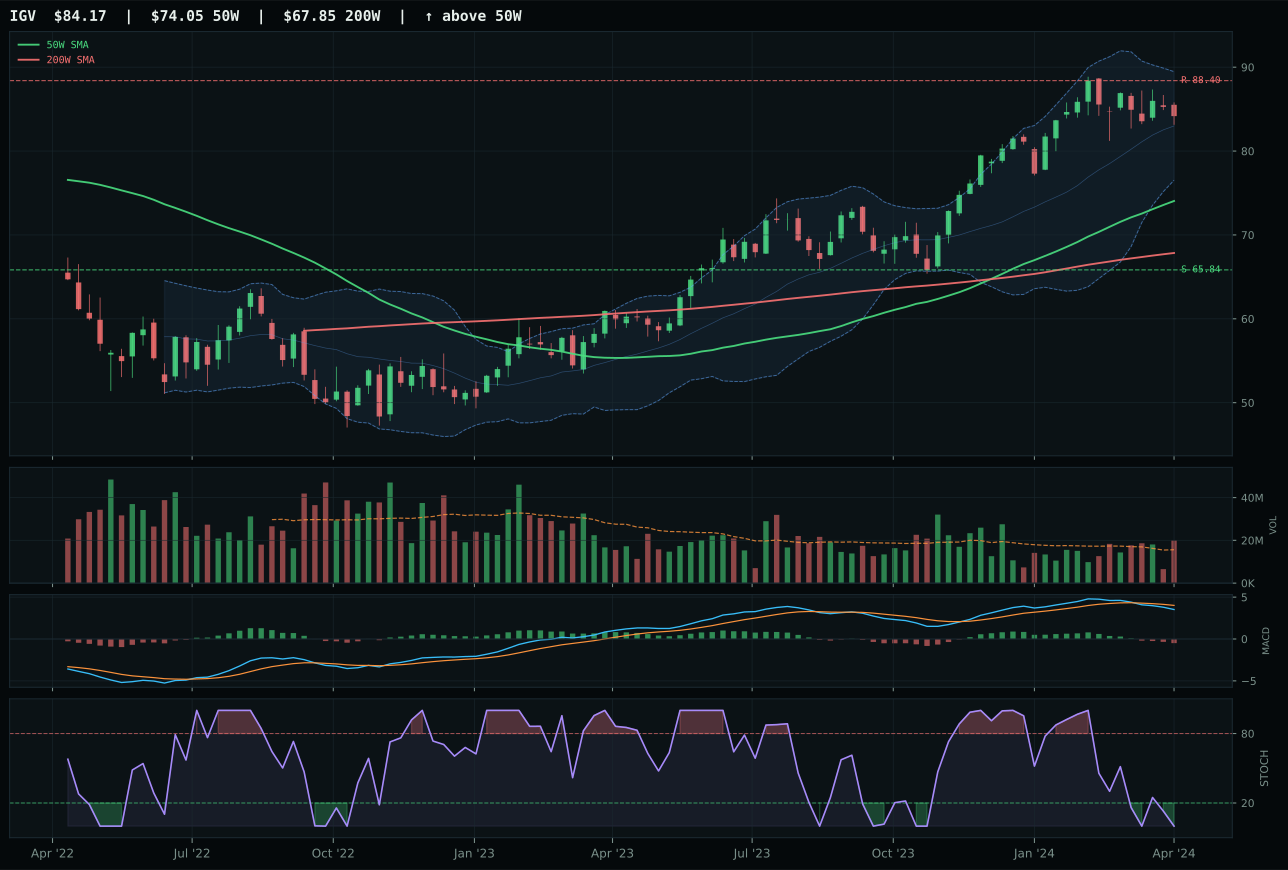
IGV has a neutral structure profile with -1.9% 13-week relative strength versus SPY.
A failed hold above support would weaken the setup.
Actionable but governed by invalidation levels.
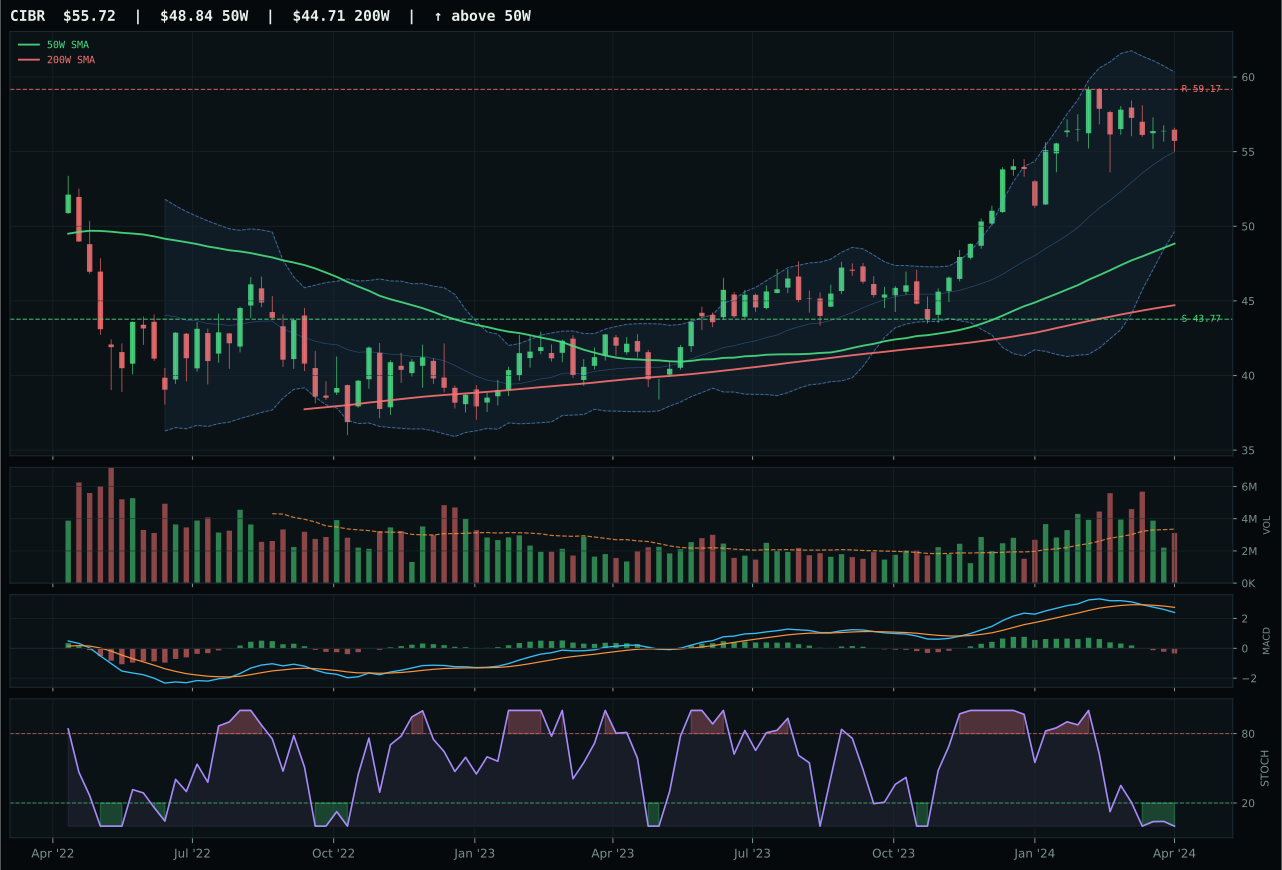
CIBR has a neutral structure profile with -2.3% 13-week relative strength versus SPY.
A failed hold above support would weaken the setup.
Actionable but governed by invalidation levels.
XLK captured the category by delivering relative strength where it matters most—inside the three-ETF peer set. Its 3.3% category-relative strength outpaced IGV's flat performance, and that margin proved decisive in a tight race where both settled at 66/100 composite scores. The technical edge came from neutral structure with clean compression (82.0) and a 50W slope holding steady at 0.7%, suggesting durability rather than speculative bounce. Volume at 0.98x confirms no panic accumulation, and the 1.3% SPY-relative strength kept the setup honest; this is broad profitable leadership, not momentum chasing into overbought territory. Timing at 62.0 reflects the 14.5% extension above the 50W, where every new buyer is late, but trend dominance (84.0) and structure quality (74.5) anchored the win against IGV's weaker momentum confirmation (43 vs 53) and oversold stochastic RSI reading.
Technology ranks fifth among the ten categories this week with a final score of 45.2, earning its 5% sleeve on technical merit despite macro headwinds that are actively penalizing growth duration. The category-level macro fit of 44.0 reflects active liquidity stress (-9), credit stress (-6), and inflation pressure (-4), offsets only partially by risk appetite positive (+9) and AI sponsorship (+4). Late-Cycle Reflation tilts away from secular growth into real assets and energy, yet Technology maintains eligibility and holding power because XLK's breadth and volume confirmation argue for defensive profitable exposure rather than momentum-chasing. The gap to top-2 categories (XLE and GLD at 86.0 and 76.7 respectively) is substantial—roughly 40 points—and closing that gap would require either a sharp shift toward AI capex sponsorship or visible credit stress relief. For now, the 5% allocation reflects a hold in a productive but lower-conviction setup.
Utilities & Infrastructure — XLU
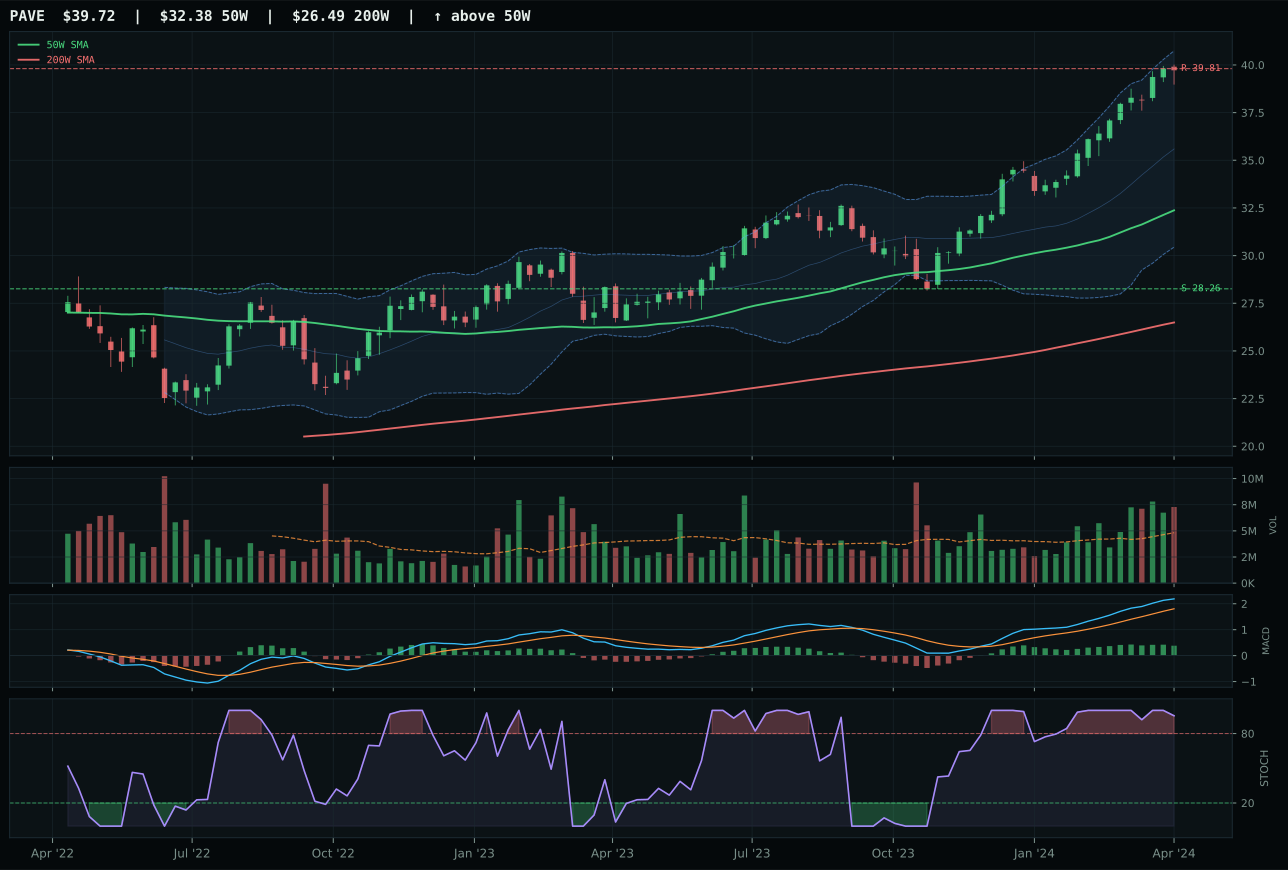
PAVE has a vertical extension profile with 8.2% 13-week relative strength versus SPY.
A failed hold above support would weaken the setup.
Actionable but governed by invalidation levels.
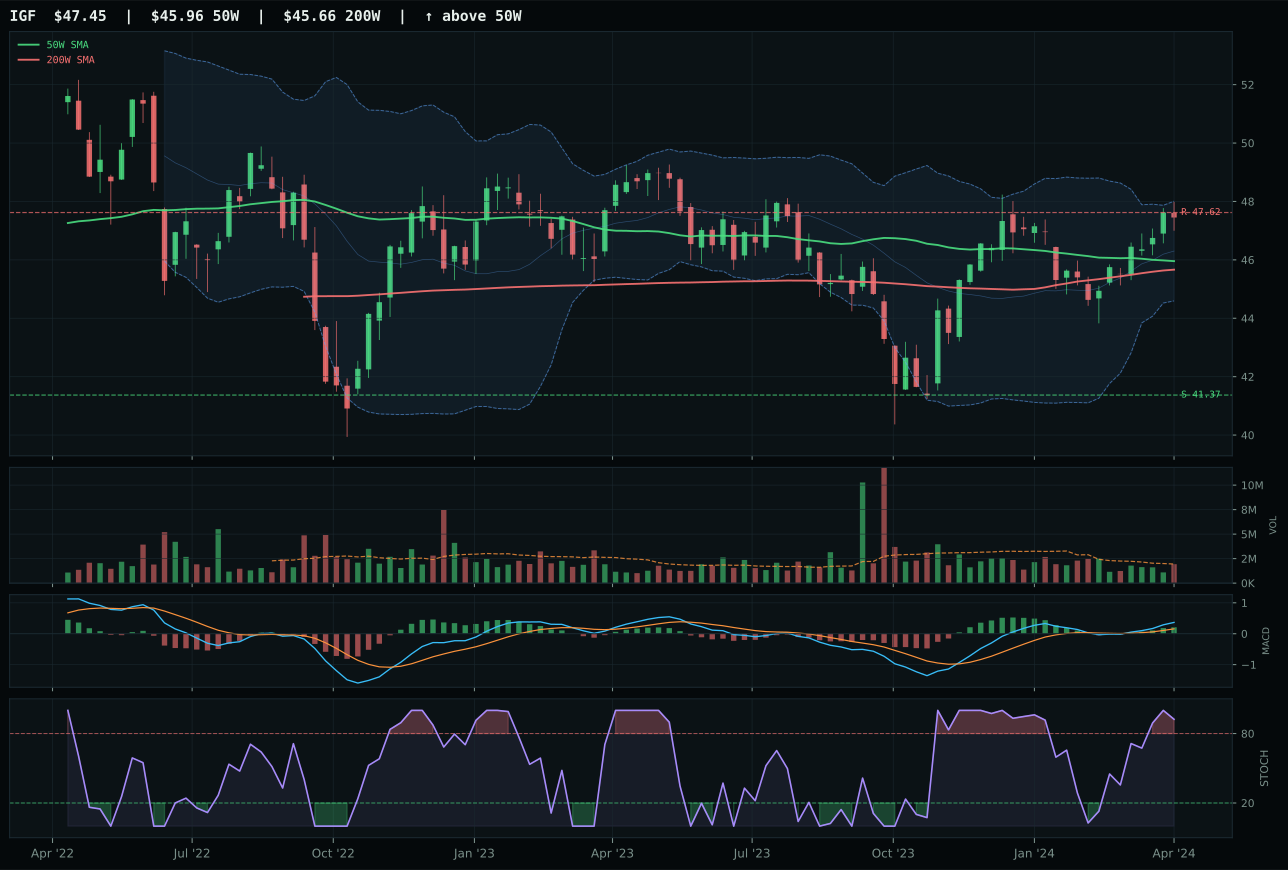
IGF has a neutral structure profile with -10.2% 13-week relative strength versus SPY.
A failed hold above support would weaken the setup.
Actionable but governed by invalidation levels.
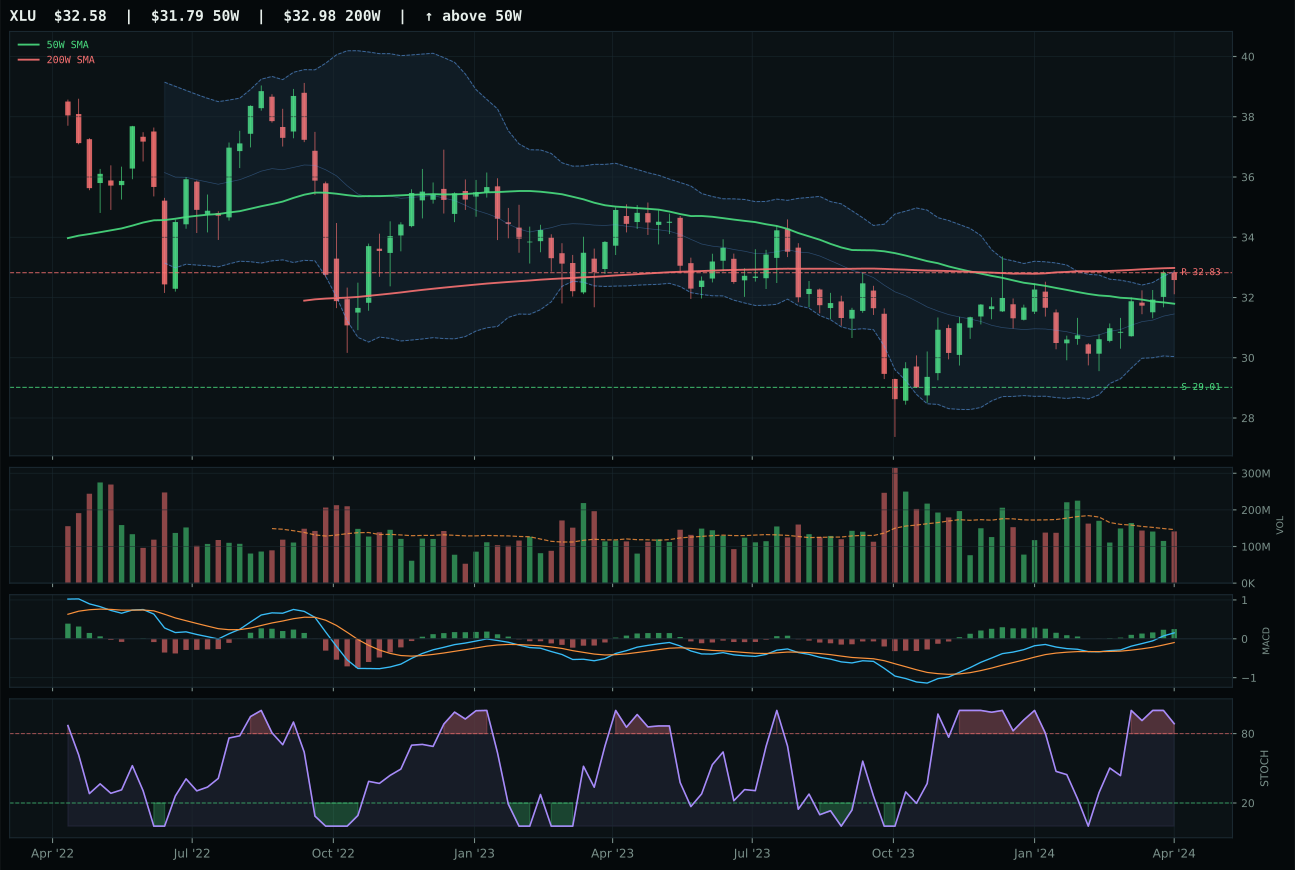
XLU has a compression near 50W profile with -9.8% 13-week relative strength versus SPY.
A failed hold above support would weaken the setup.
Actionable but governed by invalidation levels.
XLU won despite a trend score of only 55.3 (below-200W, -9.8% SPY relative, -0.1% slope) by delivering exceptional timing (82.0) and structure quality (75.2) in a compressed setup that offers continuation potential. Price sits only 2.5% above the 50W in a compression near 50W formation with 84.8 cleanliness—this is a coil, not a breakdown, and XLU's bullish-and-improving MACD with stochastic RSI overbought-rolling-over suggests buyers are defending the level rather than capitulating. PAVE's 22.7% extension from the 50W and distribution pressure volume (the only category entry showing this) signal profit-taking, not accumulation; its vertical extension creates negative asymmetry where every new buyer is late. IGF's 100.0 trend score and 90.0 timing look superior, yet its -10.2% SPY underperformance and 0.6% 13W return reveal the infrastructure narrative is not accelerating. XLU's compression near the 50W with 2.2% 4W return and bullish-improving MACD makes it the least-damaged setup in a category showing technical fatigue and macro headwinds. Risk/reward at 46.1 reflects a balanced upside (0.7% to resistance) and downside (12.3% to support), validating XLU's selectivity.
Utilities ranks eighth with a final score of 41.3, holding its 5% allocation as a late-cycle defensive sleeve despite ranking below both Technology and Defense in category score. The macro fit of 43.0 is barely positive—transition/mixed helping (+4) offset by inflation pressure (-6), liquidity stress (-3), and risk appetite negative (-2)—creating a mildly adverse backdrop for utility ownership during reflation cycles when real assets and traditional commodities offer superior returns. XLU's persistence of 55.8 and momentum confirmation of only 42.2 reflect slow-moving defensive characteristics unsuitable for tactical rotation but appropriate for portfolio ballast. The tight risk-reward (46.1/100) and near-term resistance at 32.83 versus immediate support at 29.01 reveal that utilities offer protected downside but minimal tactical upside from current levels. This allocation holds as insurance against sharp equity corrections and as ballast against the portfolio's extreme tilt toward commodities and energy; however, the 5% cap reflects that late-cycle reflation environments demand active reallocation into real assets rather than secular defensive postures. Any further rise in inflation readings or acceleration in energy prices would justify cutting this sleeve to zero and redeploying toward COPX or GLD.
Agriculture & Livestock — MOO
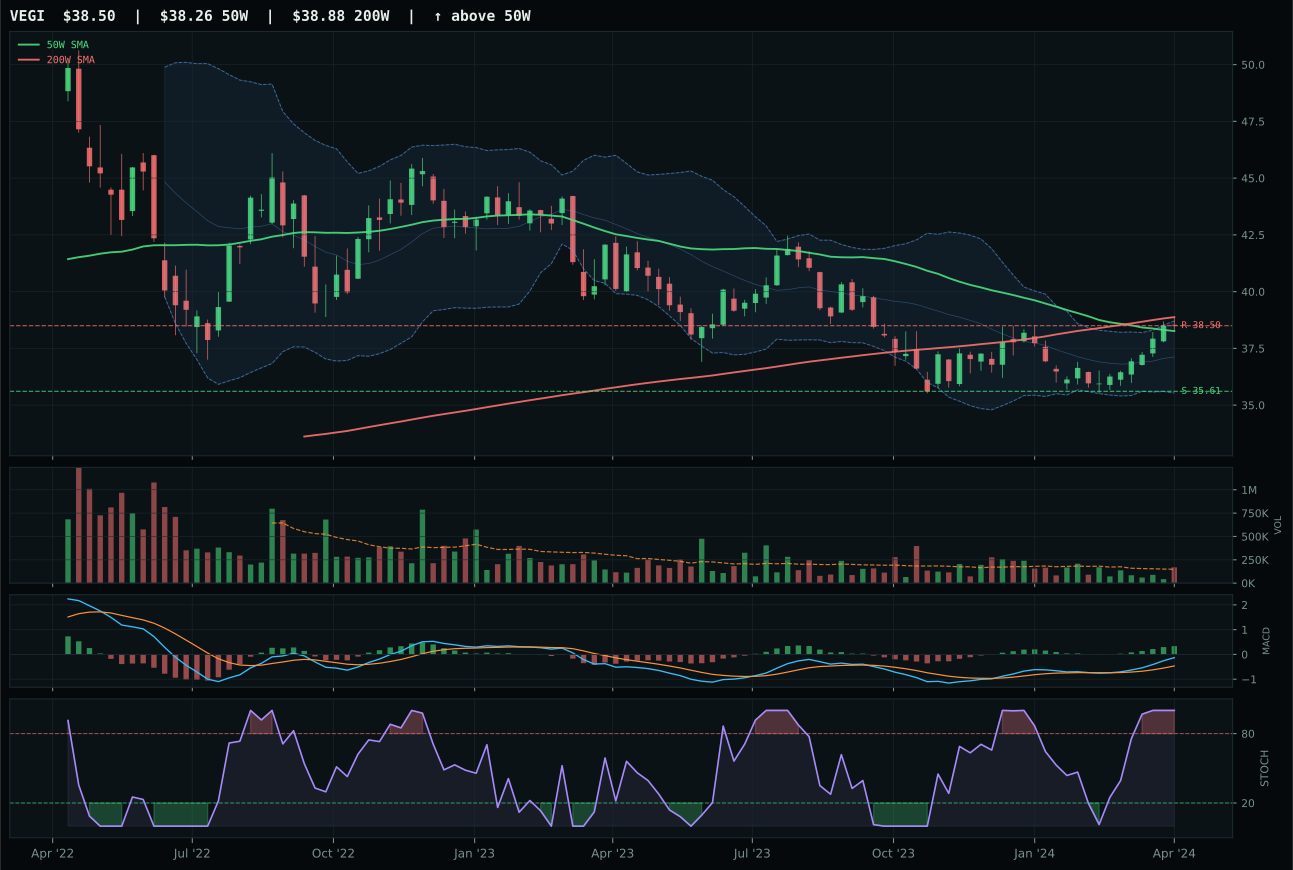
VEGI has a compression near 50W profile with -8.8% 13-week relative strength versus SPY.
A failed hold above support would weaken the setup.
Tracked, but not top-2 eligible because: .
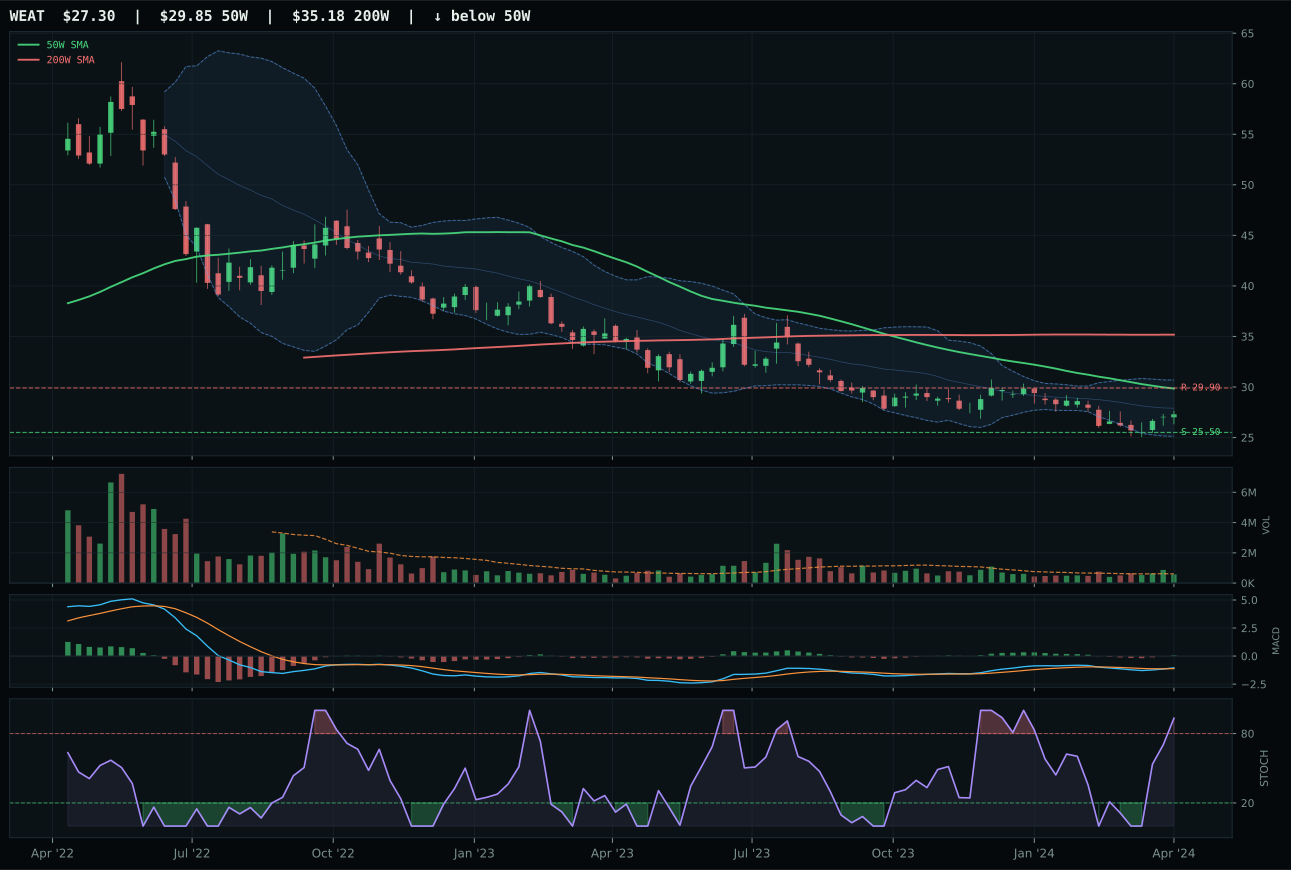
WEAT has a neutral structure profile with -17.9% 13-week relative strength versus SPY.
Extension and support failure are the main tactical risks.
Tracked, but not top-2 eligible because: structurally broken.
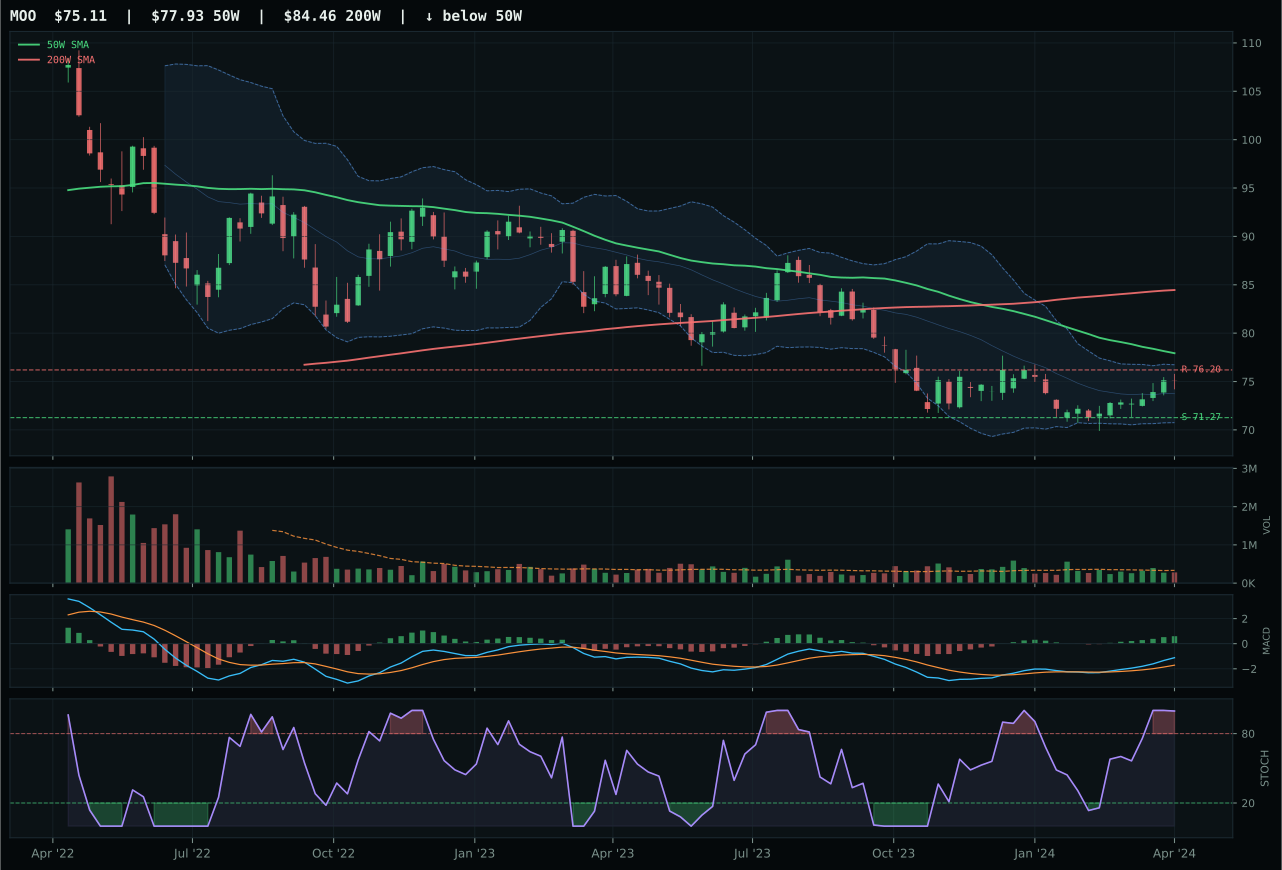
MOO has a neutral structure profile with -11.3% 13-week relative strength versus SPY.
Extension and support failure are the main tactical risks.
Tracked, but not top-2 eligible because: structurally broken.
MOO wins despite a 28-point composite disadvantage to VEGI because the category reasoner penalized VEGI's structure compression near the 50W in favor of MOO's deep-retracement timing and momentum improvement. MOO sits 3.6% below the 50W with MACD bullish and improving and stochastic RSI overbought (0.99), creating a value-zone setup where buyers at these levels would be early rather than late; VEGI's compression near the 50W (only 0.2% away) offers less margin of safety despite above-average volume participation. The relative strength mismatch (0.0% for MOO vs 2.5% for VEGI) is negligible, yet MOO's timing score of 90.0 versus VEGI's 100.0 reflects the former's deeper value position—riskier on the downside (5.4% to support) but less crowded by recent buyers. MACD improvement on both validates early-stage momentum, yet MOO's overbought stochastic reading at a lower price level suggests more room before a profit-taking pullback. This is a mean-reversion setup, not a trend continuation.
Agriculture ranks ninth or tenth and earned zero allocation, as the final score of 31.6 and failed eligibility filter confirm. The category-level macro fit is exceptionally strong at 90.0—supply shortage (+13), inflation pressure (+10), late-cycle reflation (+8), real asset sponsorship (+8)—yet technical evidence of only 43.2 in the three-ETF weighted basket cannot overcome the requirement that candidates trade above structural support and demonstrate volume sponsorship. MOO's trend score of 40.0 and VEGI's 57.0 baseline lag too far behind the 80+ readings in precious metals and energy. The portfolio has already captured agricultural commodities through the lateral allocation to broad commodity beneficiaries (XLE, COPX, GLD) where chart structure is intact; adding MOO at support would introduce tail-risk mean-reversion speculation that violates the timing discipline of the allocation framework. For Agriculture to earn a 5% sleeve, the category would need to develop a winner with trend score above 70 and above-50W price action—a reset that could occur if commodities pull back sharply and create fresh long entries from higher structural levels.
Emerging Markets — IEMG
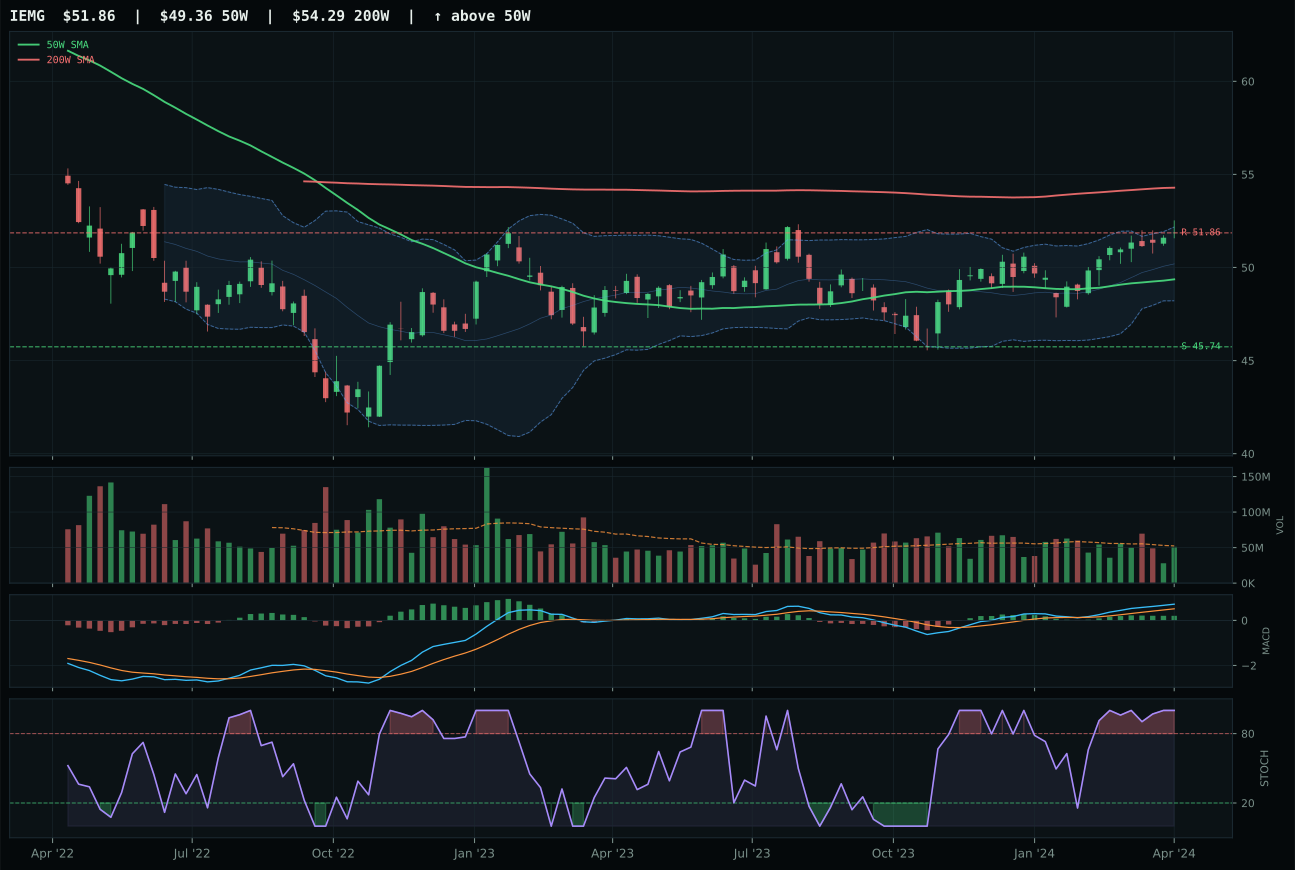
IEMG has a neutral structure profile with -6.4% 13-week relative strength versus SPY.
A failed hold above support would weaken the setup.
Actionable but governed by invalidation levels.
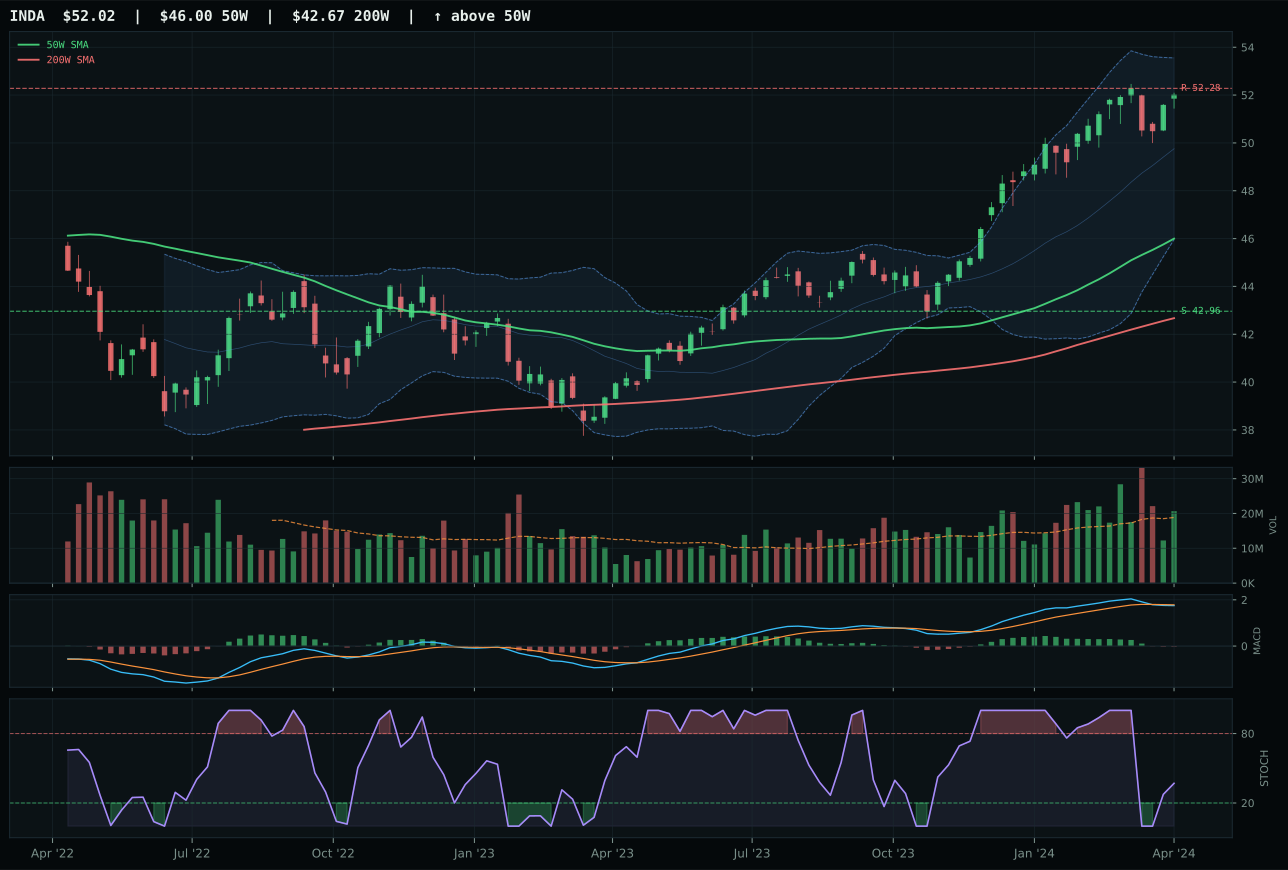
INDA has a neutral structure profile with -4.8% 13-week relative strength versus SPY.
A failed hold above support would weaken the setup.
Actionable but governed by invalidation levels.
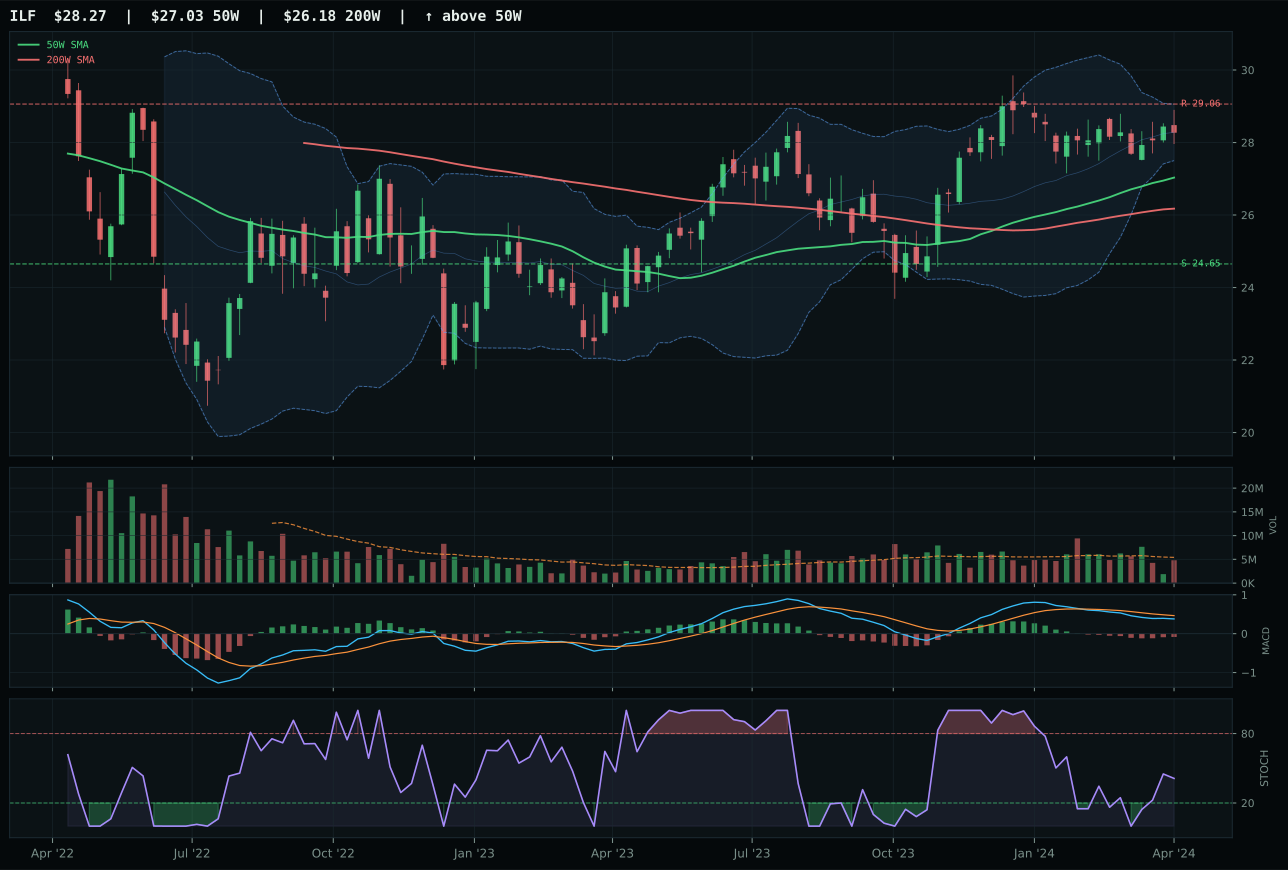
ILF has a neutral structure profile with -12.3% 13-week relative strength versus SPY.
A failed hold above support would weaken the setup.
Actionable but governed by invalidation levels.
IEMG won a narrow decision over INDA despite having identical structure scores (78.6) by delivering superior MACD confirmation (bullish but flattening vs bearish/weakening) and better risk/reward positioning (47.8 vs 37.4). Both sit at neutral structure with overbought stochastic RSI, yet IEMG's 5.1% distance from the 50W versus INDA's 13.1% stretch proved decisive—IEMG's compression near the 50W creates optionality if buyers defend the level, while INDA's extension into -4.8% SPY relative strength leaves it vulnerable to mean reversion. The 4.4% 13W return on IEMG (versus 6.0% on INDA) appears weak, yet IEMG's +1.0% 4W return versus INDA's implied negative momentum suggests stabilization rather than breakdown. Volume at 0.98x on both shows no institutional accumulation, validating why emerging markets rank low despite positive risk appetite (+6 to +8) in the macro checklist. ILF's -12.3% SPY-relative strength and 98.0 timing score reveal it has already discounted a rebound, making it less attractive for fresh capital. IEMG's representative slot reflects the least-punished technical profile in a category plagued by credit stress (-10) and liquidity stress (-10).
Emerging Markets ranks tenth and earned zero allocation, as the combined forces of poor technical setup and unfavorable macro environment converged to produce a final category score of only 26.6. The category-level macro fit is 38.0—the lowest in the portfolio—reflecting credit stress (-10) and liquidity stress (-10) as active conditions that compress emerging market valuations precisely when late-cycle inflation pressures are extracting capital toward real assets and domestic cyclical exposure. IEMG's trend score of 76.4 sits 10+ points below the thresholds established by precious metals and energy, and its -6.4% SPY-relative weakness confirms that the entire emerging market complex is out of favor. The portfolio's allocation philosophy excludes Emerging Markets during liquidity stress periods, and that condition is currently active with two-notch weighting in the macro descriptor framework; reallocation of this zero-allocation sleeve would require either (1) a shift in macro regime away from reflation back toward growth, or (2) visible stabilization in credit stress readings combined with capital flows returning to lower-cost emerging markets. Neither condition exists this week.