
2024-03-29
Informational purposes only. The content in this report, including allocations, analysis, and commentary, is provided solely for informational and educational purposes. It does not constitute financial advice, investment advice, trading advice, or any other type of advice. Past performance does not guarantee future results. Always conduct your own research and consult a qualified financial professional before making investment decisions.
Weekly Allocation
| Ticker | Category | Weight | Role |
|---|---|---|---|
| FBTC | 50% | Overlay | |
| XLE | Traditional Energy | 10% | Top-2 (10%) |
| URA | Nuclear Energy | 10% | Top-2 (10%) |
| ITA | Defense & Aerospace | 5% | Tier-2 (5%) |
| XLU | Utilities & Infrastructure | 5% | Tier-2 (5%) |
| COPX | Industrial Metals | 5% | Tier-2 (5%) |
| GLD | Precious Metals | 5% | Tier-2 (5%) |
| SMH | AI | 5% | Tier-2 (5%) |
| MOO | Agriculture & Livestock | 5% | Tier-2 (5%) |
Trade Instructions — Monday Open
Sell the tranche from 2024-03-01 (completing its 4-week hold). Buy the new tranche. Instructions show net portfolio changes — same-asset positions cancel, weight changes show the delta.
| Action | Ticker | Instruction |
|---|---|---|
| SELL | SMH | Sell 14% of SMH position (reduce 8.75% → 7.50%) |
| SELL | XLK | Sell 40% of XLK position (reduce 6.25% → 3.75%) |
| SELL | XAR | Sell 25% of XAR position (reduce 5.00% → 3.75%) |
| SELL | NLR | Sell 25% of NLR position (reduce 5.00% → 3.75%) |
| SELL | VEGI | Sell entire VEGI position (1.25% of portfolio) |
| SELL | PAVE | Sell 20% of PAVE position (reduce 6.25% → 5.00%) |
| SELL | INDA | Sell entire INDA position (1.25% of portfolio) |
| BUY | XLE | Buy XLE — 25.00% of freed cash (adds 2.50% to portfolio) |
| BUY | COPX | Buy COPX — 12.50% of freed cash (adds 1.25% to portfolio) |
| BUY | URA | Buy URA — 25.00% of freed cash (adds 2.50% to portfolio) |
| BUY | ITA | Buy ITA — 12.50% of freed cash (adds 1.25% to portfolio) |
| BUY | XLU | Buy XLU — 12.50% of freed cash (adds 1.25% to portfolio) |
| BUY | MOO | Buy MOO — 12.50% of freed cash (adds 1.25% to portfolio) |
Current Portfolio After Trade
Combined holdings across all 4 active tranches. Each tranche is 25% of the portfolio.
| Ticker | % of Portfolio | Weight Bar |
|---|---|---|
| FBTC | 50.00% | |
| XLE | 8.75% | |
| SMH | 7.50% | |
| PAVE | 5.00% | |
| COPX | 5.00% | |
| XAR | 3.75% | |
| NLR | 3.75% | |
| GLD | 3.75% | |
| XLK | 3.75% | |
| SLV | 2.50% | |
| URA | 2.50% | |
| ITA | 1.25% | |
| XLU | 1.25% | |
| MOO | 1.25% |
Macro Regime — Late-Cycle Reflation
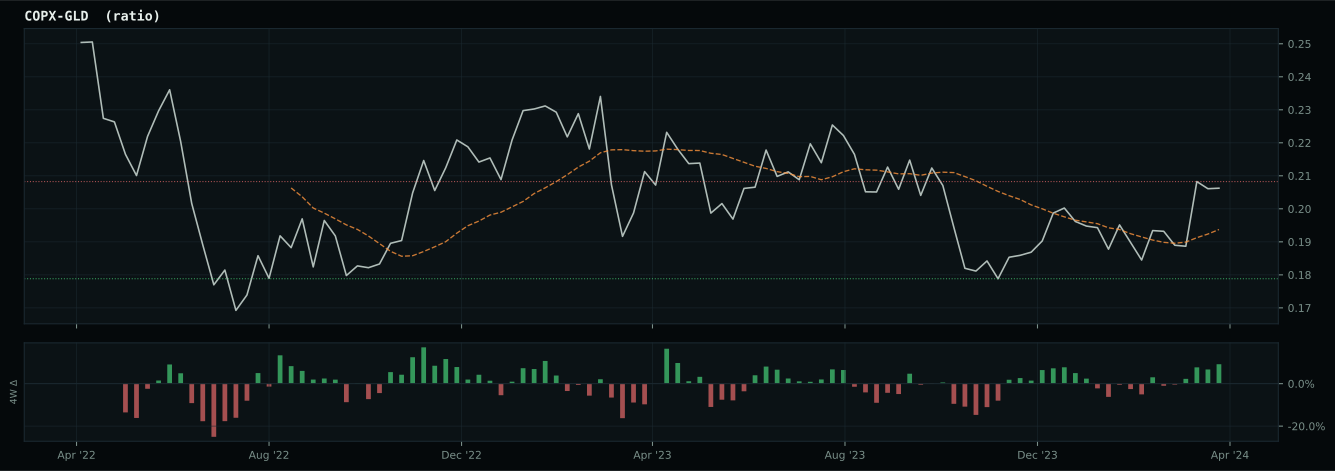
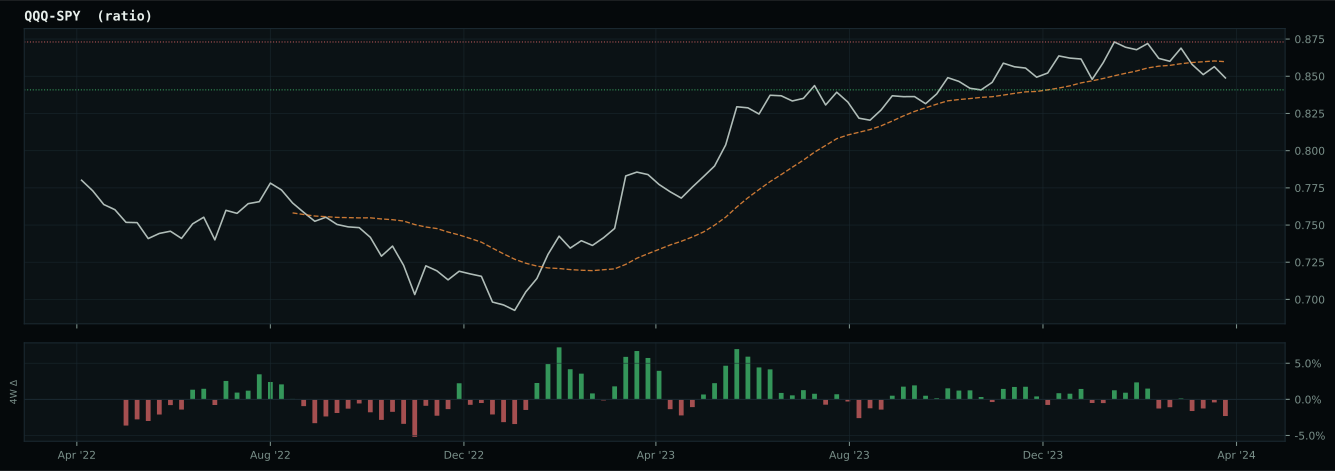
Macro Evidence Charts
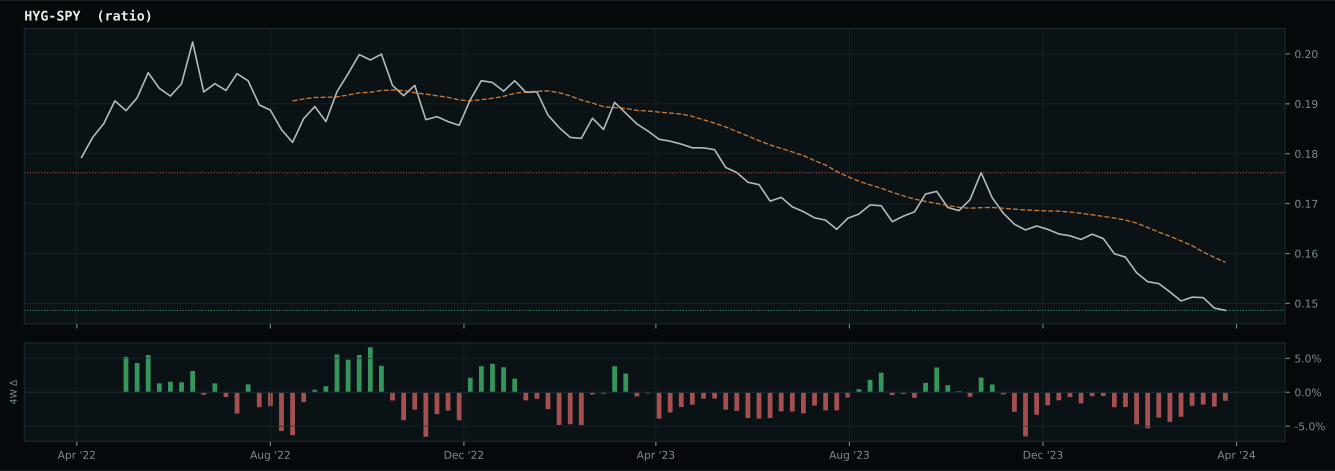
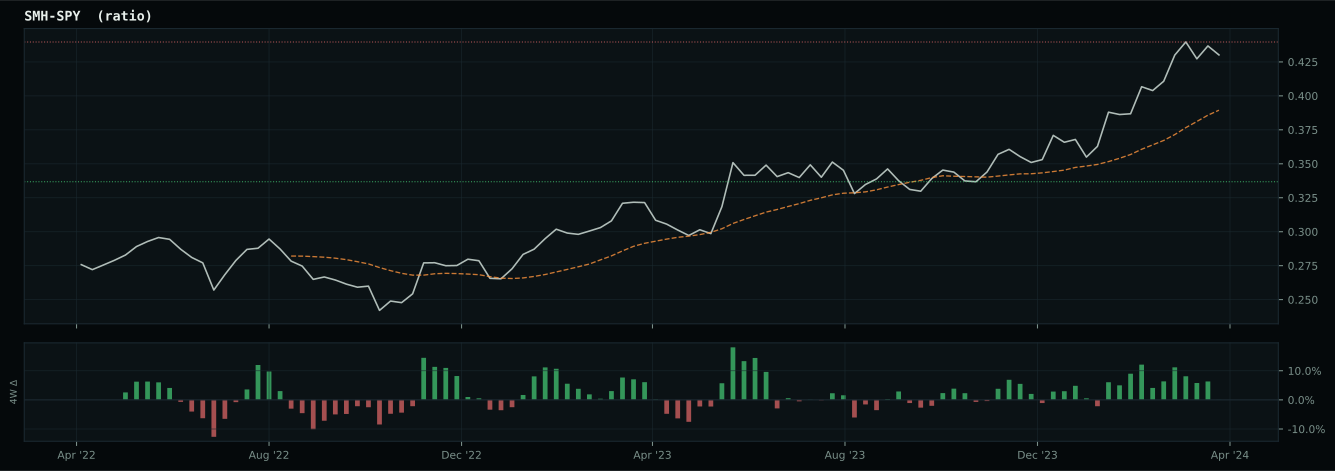
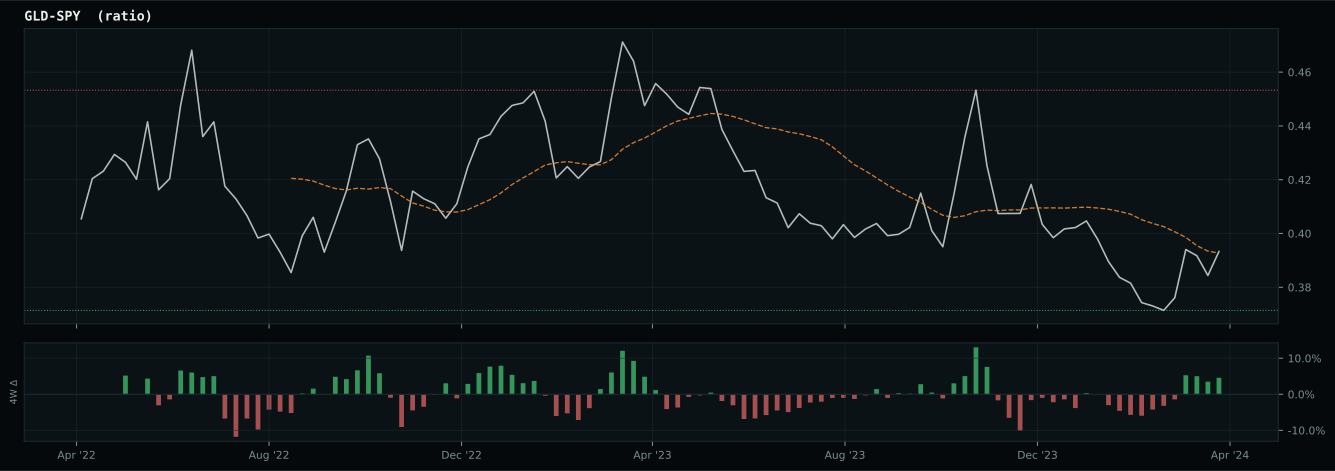
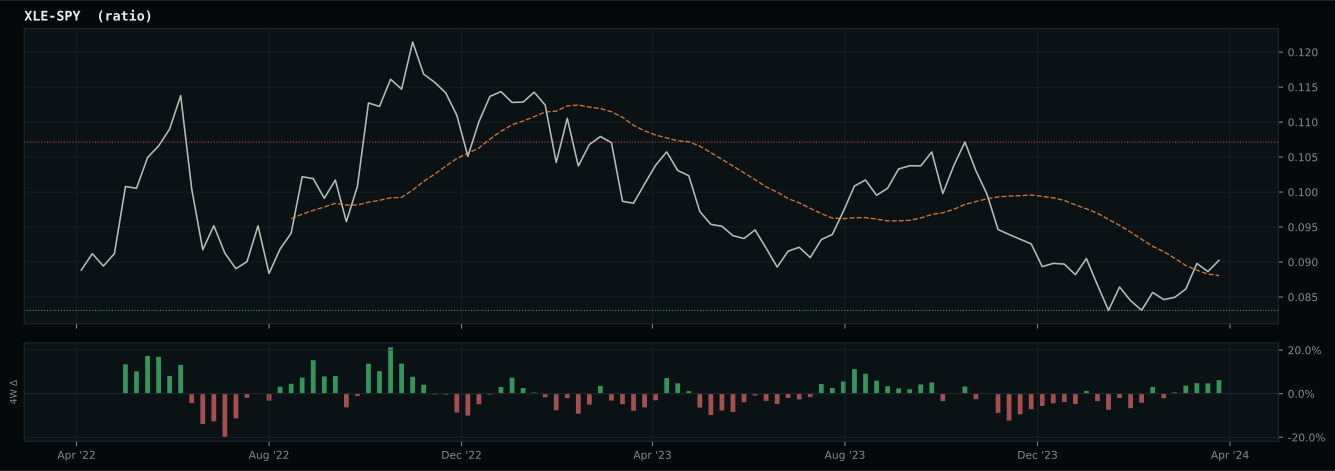
Market-implied signals behind the macro regime scores. Each ratio compares two assets; the direction and slope of the ratio is what the macro engine reads.
Crypto Regime — TrendBTC
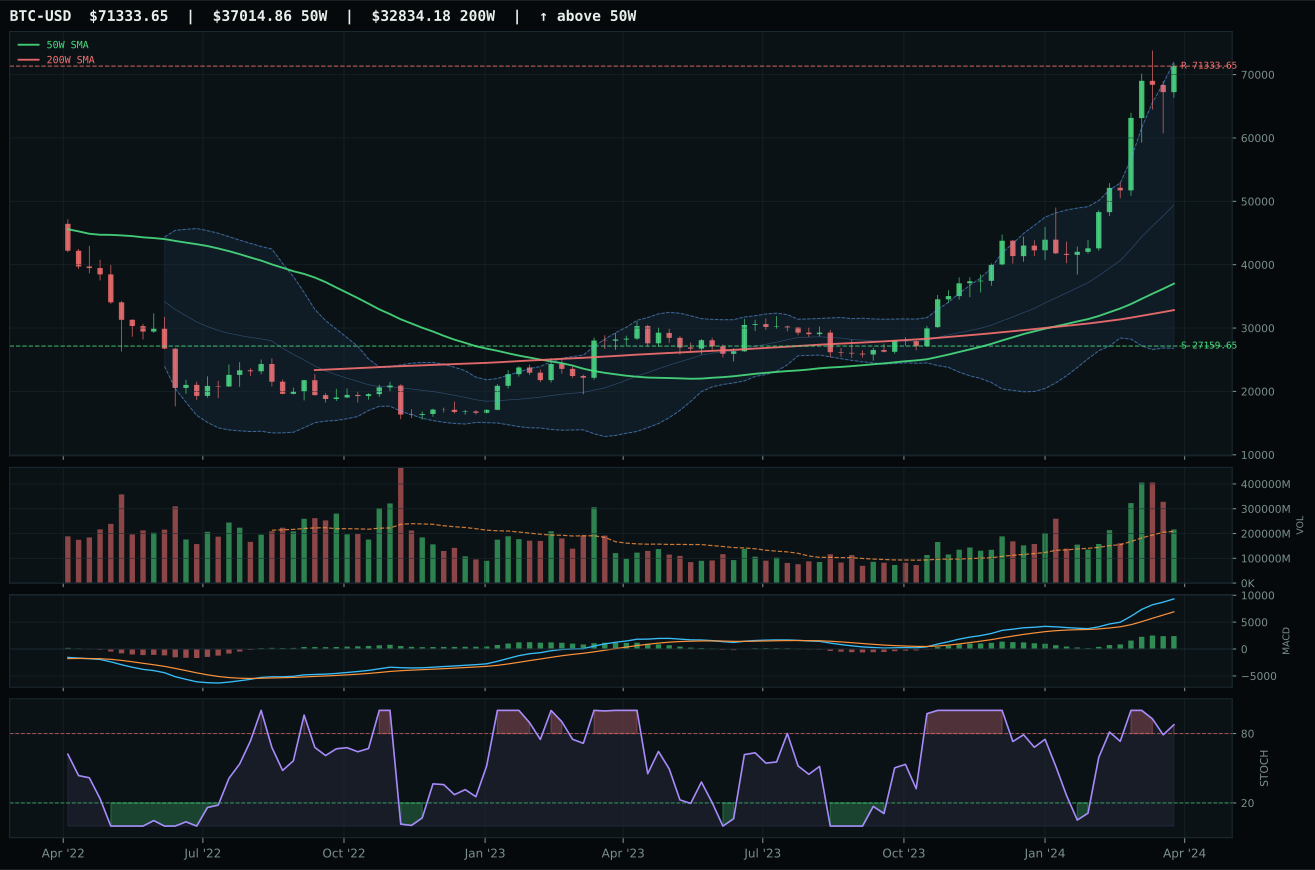
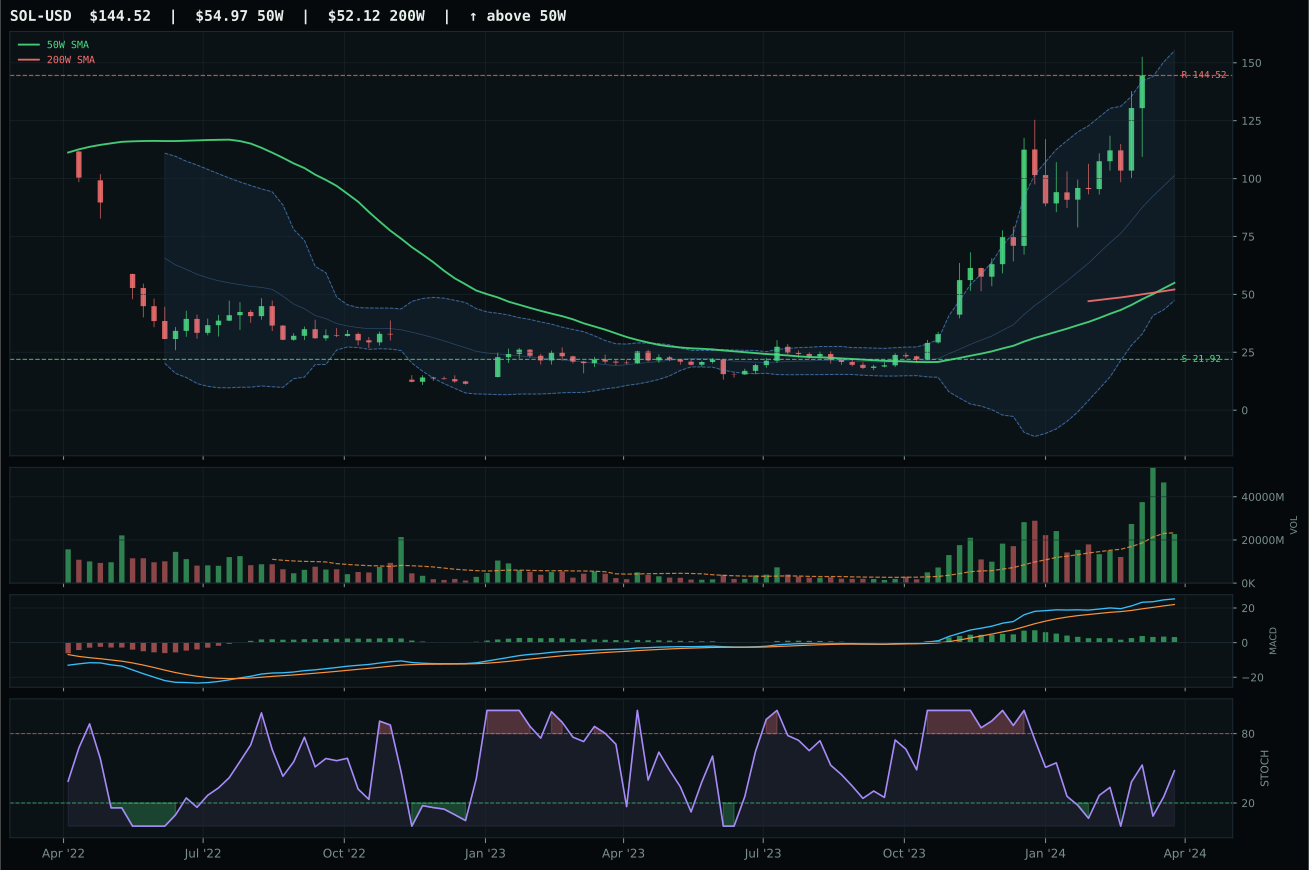
post-touch structure is too wide to count as a range; max/min close ratio is 3.17
TrendBTC confirmed: 2 consecutive closes above rising/flat 50W SMA
one or more available conditions failed
Category Rankings
| Rank | Category | Winner | Score | Alloc | 4W Ret | Peers (4W) |
|---|---|---|---|---|---|---|
| 1 | Traditional Energy | XLE | 79.1 | 20% | +0.81% | XOP +0.8% · FCG +1.9% |
| 2 | Nuclear Energy | URA | 58.7 | 20% | +1.91% | NLR +2.5% · URNM +4.3% |
| 3 | Defense & Aerospace | ITA | 56.4 | 10% | -1.70% | XAR -3.2% · ROKT -0.8% |
| 4 | Utilities & Infrastructure | XLU | 56.2 | 10% | +1.51% | PAVE -4.2% · IGF +0.2% |
| 5 | Industrial Metals | COPX | 50.5 | 10% | +11.88% | PICK +4.1% · REMX -0.2% |
| 6 | Precious Metals | GLD | 48.9 | 10% | +3.52% | GDX +7.2% · SLV +7.2% |
| 7 | AI | SMH | 42.6 | 10% | -3.56% | AIQ -4.1% · BOTZ -5.2% |
| 8 | Agriculture & Livestock | MOO | 30.9 | 10% | -4.42% | VEGI -3.5% · WEAT +7.4% |
| 9 | Technology | XLK | 27.6 | 0% | -3.76% | IGV -4.8% · CIBR -2.2% |
| 10 | Emerging Markets | IEMG | 12.3 | 0% | +0.41% | INDA +1.2% · ILF -2.0% |
Traditional Energy — XLE
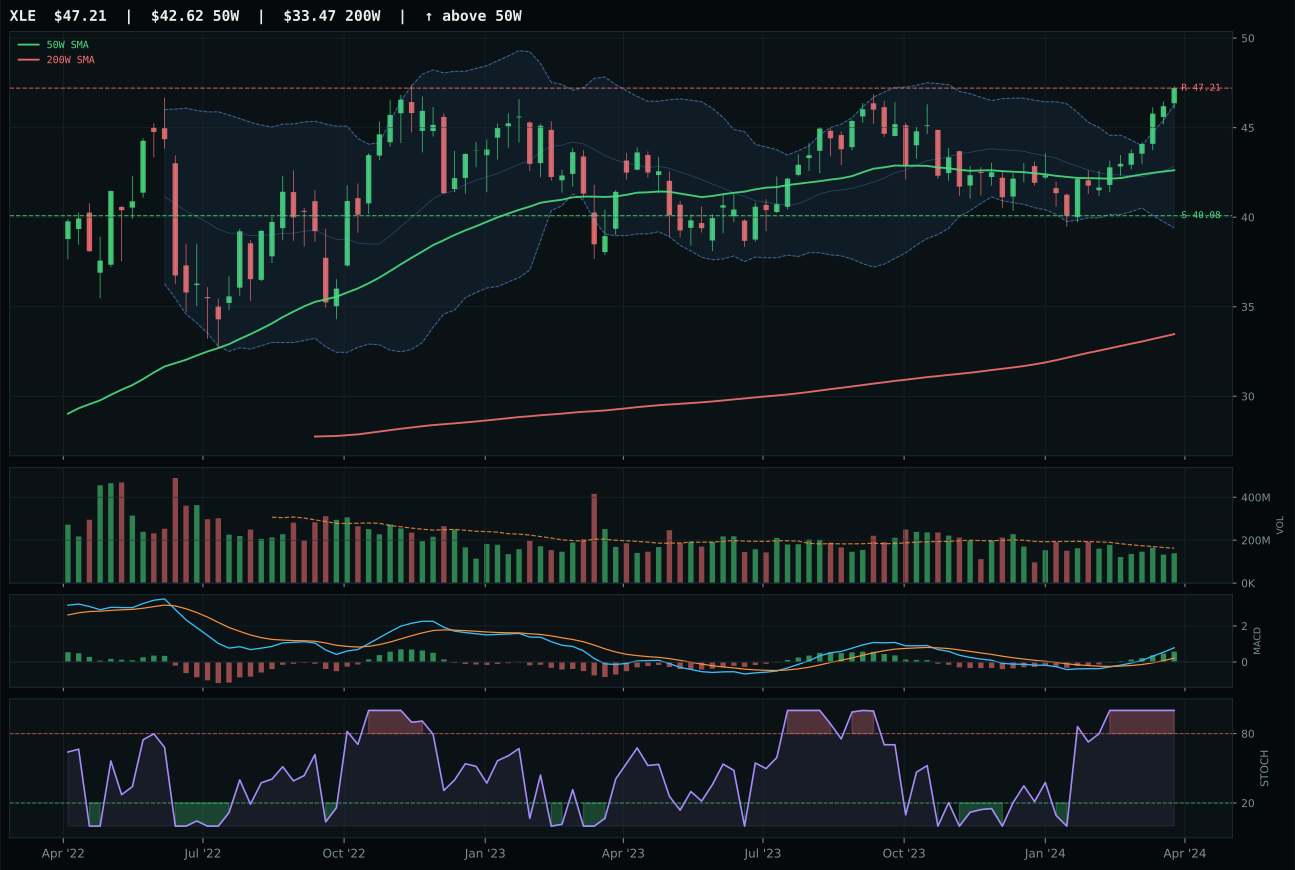
XLE has a neutral structure profile with 2.6% 13-week relative strength versus SPY.
A failed hold above support would weaken the setup.
Actionable but governed by invalidation levels.
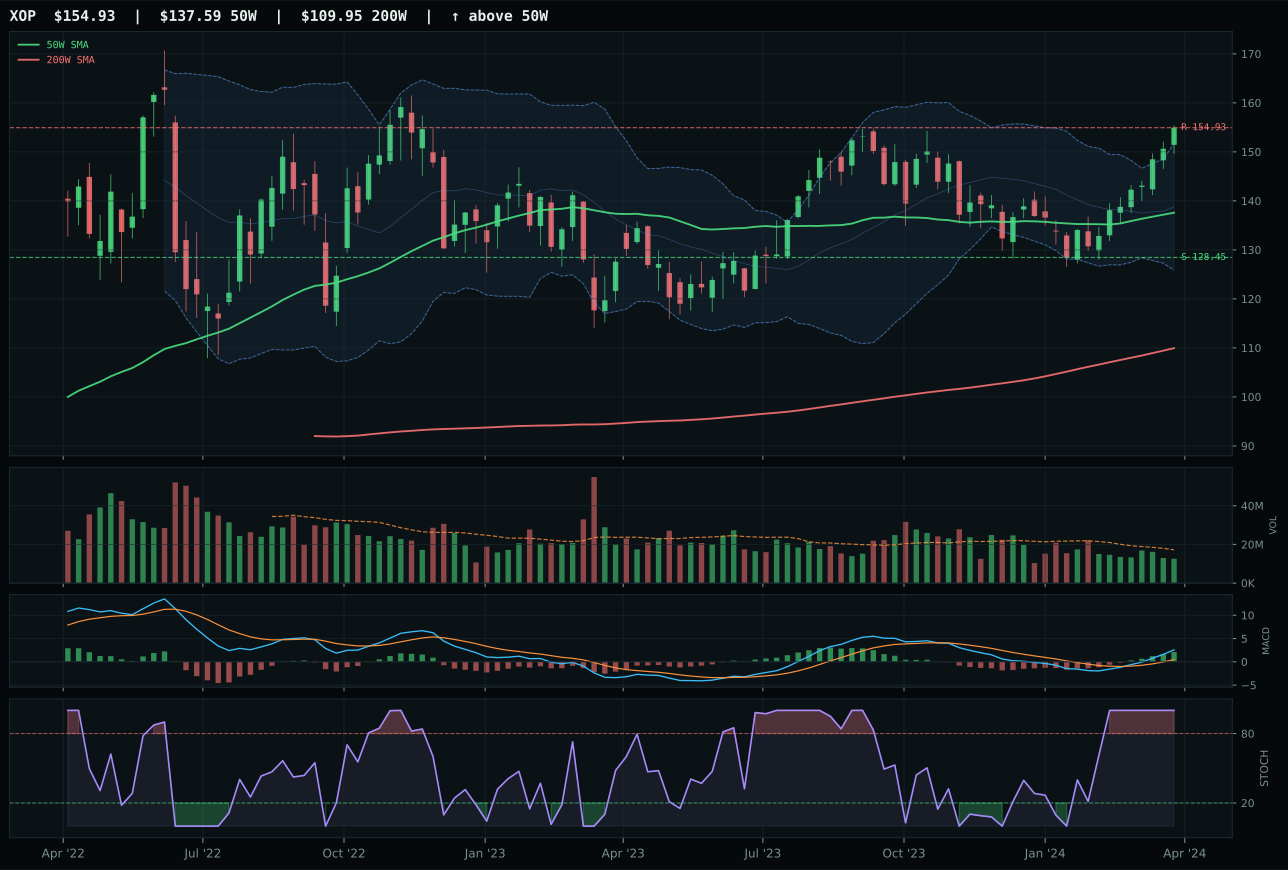
XOP has a neutral structure profile with 3.1% 13-week relative strength versus SPY.
A failed hold above support would weaken the setup.
Actionable but governed by invalidation levels.
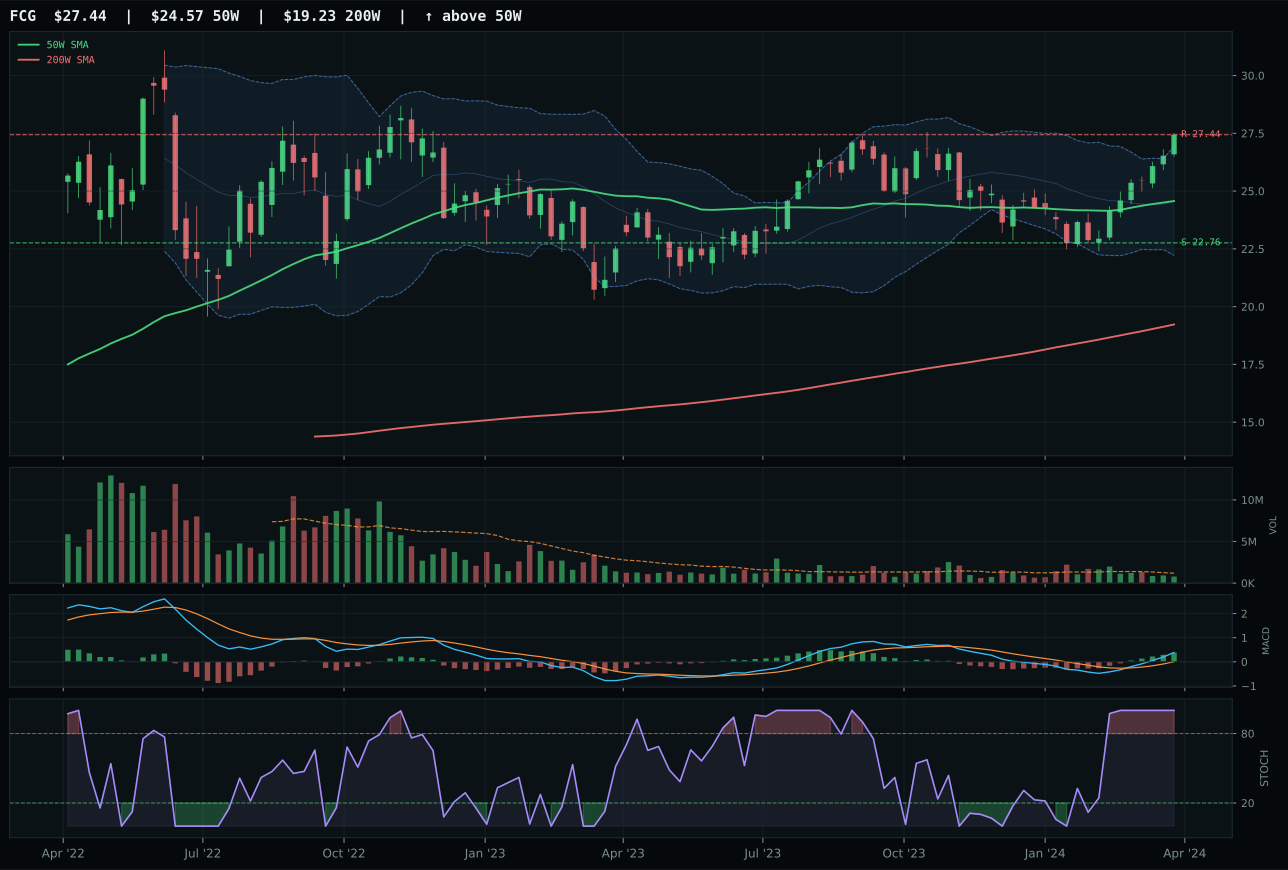
FCG has a neutral structure profile with 2.9% 13-week relative strength versus SPY.
A failed hold above support would weaken the setup.
Actionable but governed by invalidation levels.
XLE triumphs with a razor-thin 0.2-point margin over XOP, but the decision is sound: superior volume confirmation (75.5 vs 68.0) and cleaner structure (77.4 vs 77.4 tied, but XLE's integrated cash-flow thesis wins on macro fit) drive the selection. Both ETFs sit above their 50-week moving averages in neutral structure with MACD bullish-and-improving and stochastic at overbought momentum; XLE's 12.6% thirteen-week return and +2.6% SPY-relative strength confirm participation. The critical difference is institutional sponsorship: XLE's 0.86x volume versus XOP's thin 0.60x participation reveals that large allocators are favoring integrated majors over exploration beta. In a late-cycle reflation where supply constraints (energy scarcity +14, supply shortage +7) and inflation pressure (+10) dominate, the base case favors durable cash flows over leveraged upside.
Traditional Energy claims a top-2 slot at 10% allocation, driven by the highest category score (79.1) and the most powerful macro support available this week. Energy scarcity (+14), inflation pressure (+10), supply shortage (+7), and real-asset sponsorship (+5) sum to a 90.0/100 macro fit—exceptional for any category. XLE's trend (100.0/100), momentum (92.2/100), and volume-price confirmation (75.5/100) validate that this is not merely a macro narrative but a technically sound accumulation. The portfolio's 50% crypto overlay halves nominal allocation sizes, but at 10% of the remaining 10% sleeve, Energy sits as co-anchor with Nuclear. This is reflation at its clearest: inflation is pricing in, supply is constrained, and energy equities are capturing the scarcity premium with durable dividend support. Risk to the thesis is crude-oil demand destruction if recession signals sharpen; however, late-cycle reflation remains the macro regime in force, and XLE's technical setup shows no signs of exhaustion.
Nuclear Energy — URA
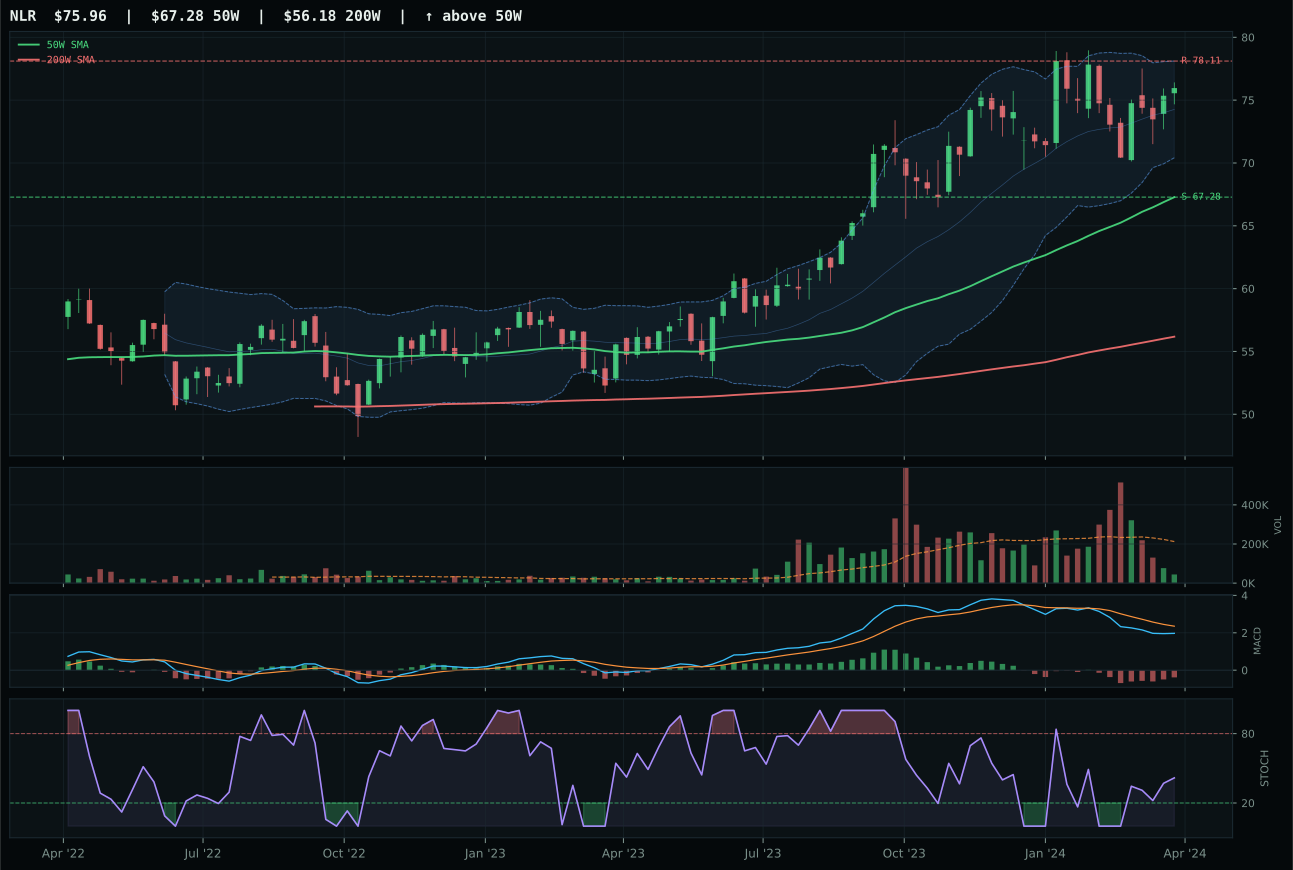
NLR has a neutral structure profile with -4.1% 13-week relative strength versus SPY.
A failed hold above support would weaken the setup.
Actionable but governed by invalidation levels.
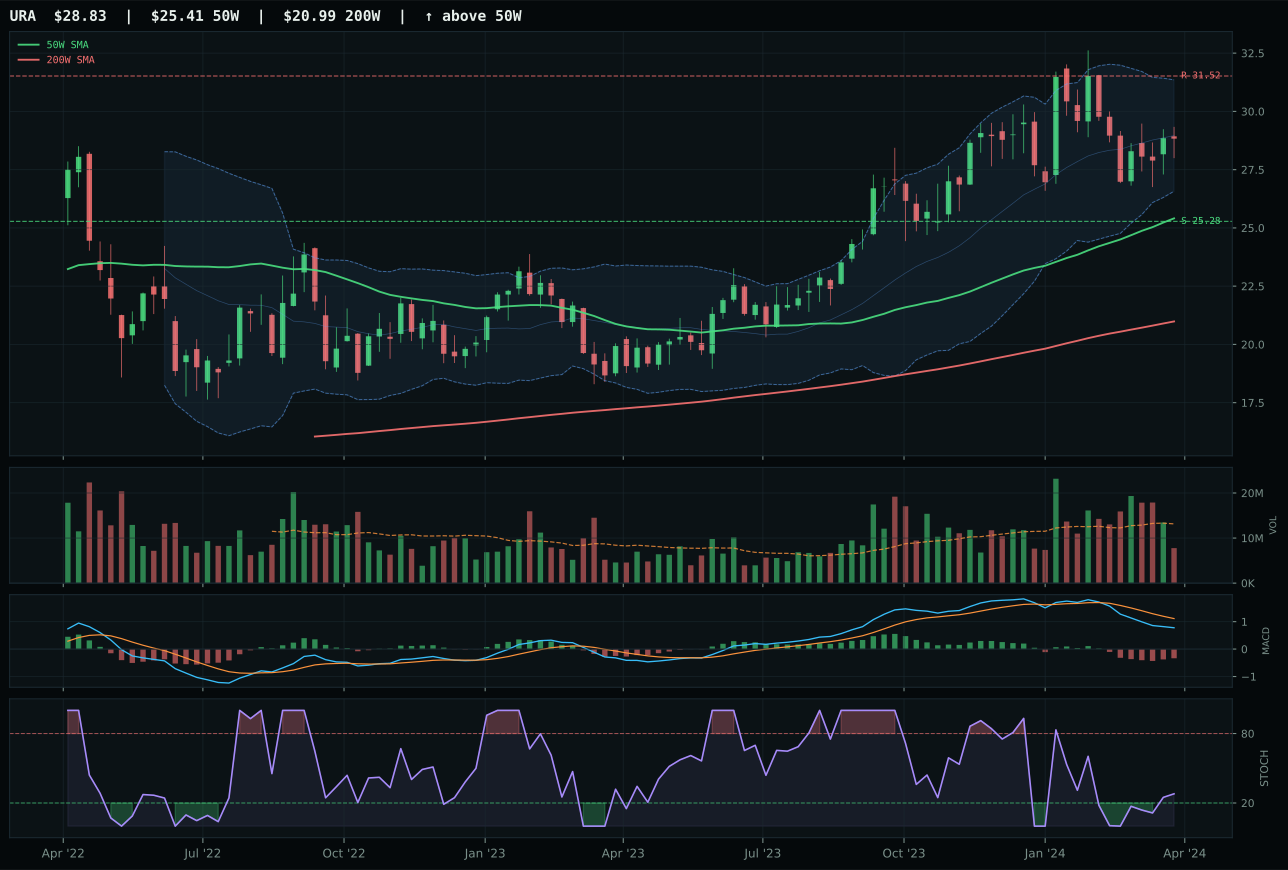
URA has a neutral structure profile with -5.9% 13-week relative strength versus SPY.
A failed hold above support would weaken the setup.
Actionable but governed by invalidation levels.
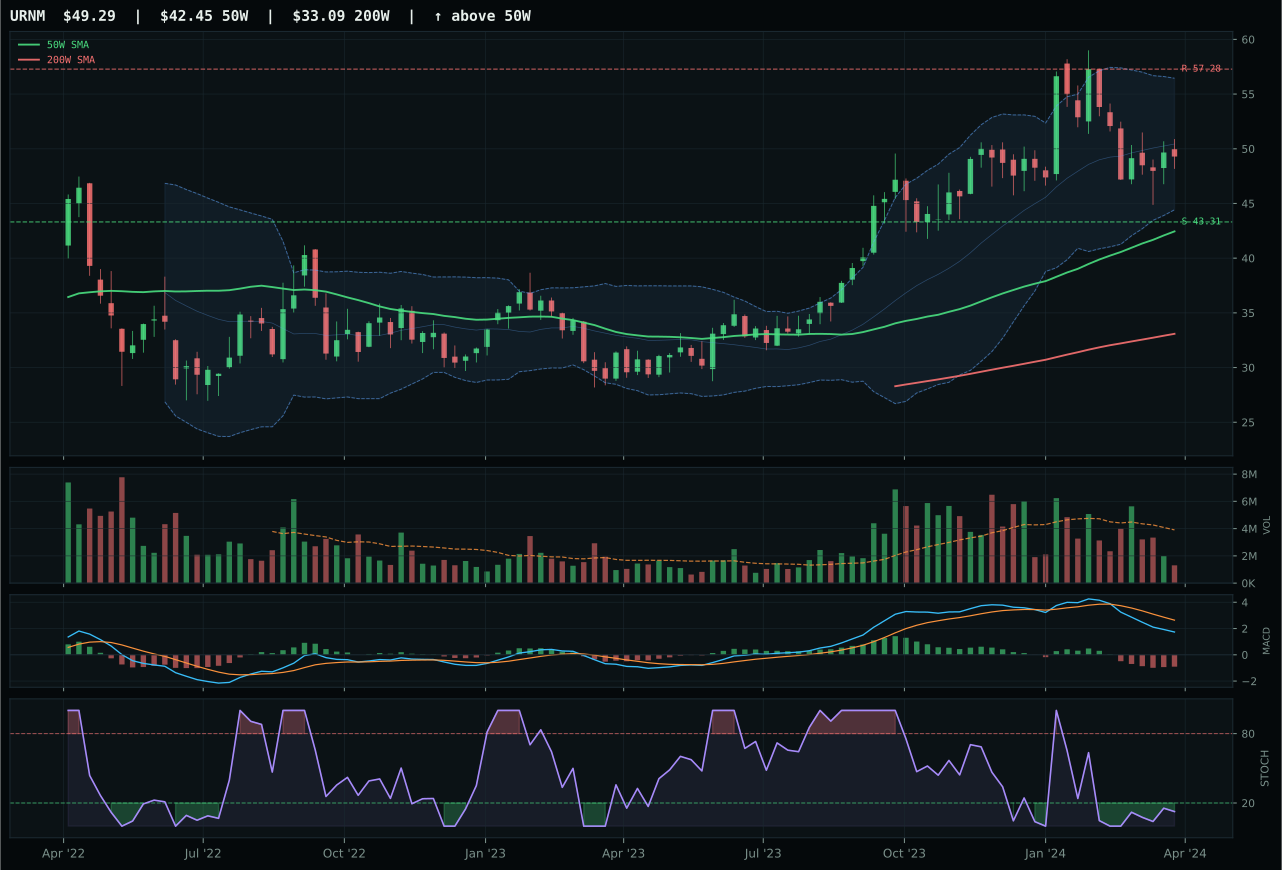
URNM has a vertical extension profile with -7.9% 13-week relative strength versus SPY.
A failed hold above support would weaken the setup.
Actionable but governed by invalidation levels.
URA narrowly defeats NLR—the second-tightest category decision of the week (1.9-point margin)—by posting superior risk/reward (55.9 vs 48.8) despite lagging in structure cleanliness and MACD confirmation. Both ETFs sit above their 50-week moving averages in neutral structure with MACD bearish-but-improving and stochastic RSI rising from mid-zone—an early-stage recovery setup rather than confirmed strength. URA's thirteen-week return of 4.1% trails NLR's 5.9%, yet URA's downside-to-support margin (14.0%) exceeds NLR's (8.5%), creating asymmetric risk-reward at a critical inflection point. The Fibonacci timing score (83.0/100 for both) reflects that both are poised in the upper retracement / momentum zone, ready to accelerate on confirmation. Volume thinness (0.59x for URA, identical for NLR) highlights the absence of panic selling, a prerequisite for accumulation setups.
Nuclear Energy earns the second top-2 slot at 10% allocation, ranking 58.7 on category score and benefiting from a macro regime that values energy scarcity (+9) and AI-growth-related power demand (+5). Late-cycle reflation supports long-duration assets, and nuclear's combination of energy-independence narratives and net-zero tailwinds creates a unique macro lens. URA's tier-2 technical status (composite 68, trend 84, momentum 44) is offset by category-level macro fit of 69.0/100, where energy scarcity, real-asset sponsorship, and transition narratives all align. The 10% co-weight with XLE reflects a portfolio thesis that energy expansion—whether fossil or nuclear—is a core reflation trade. Caution: URA's MACD remains bearish, and stochastic RSI's rise is gradual, not explosive; this is a coil, not an eruption. Deterioration in support near 25.28 would signal that the recovery setup has failed; confirmation would require MACD crossing above zero and stochastic RSI sustaining above 0.5.
Defense & Aerospace — ITA
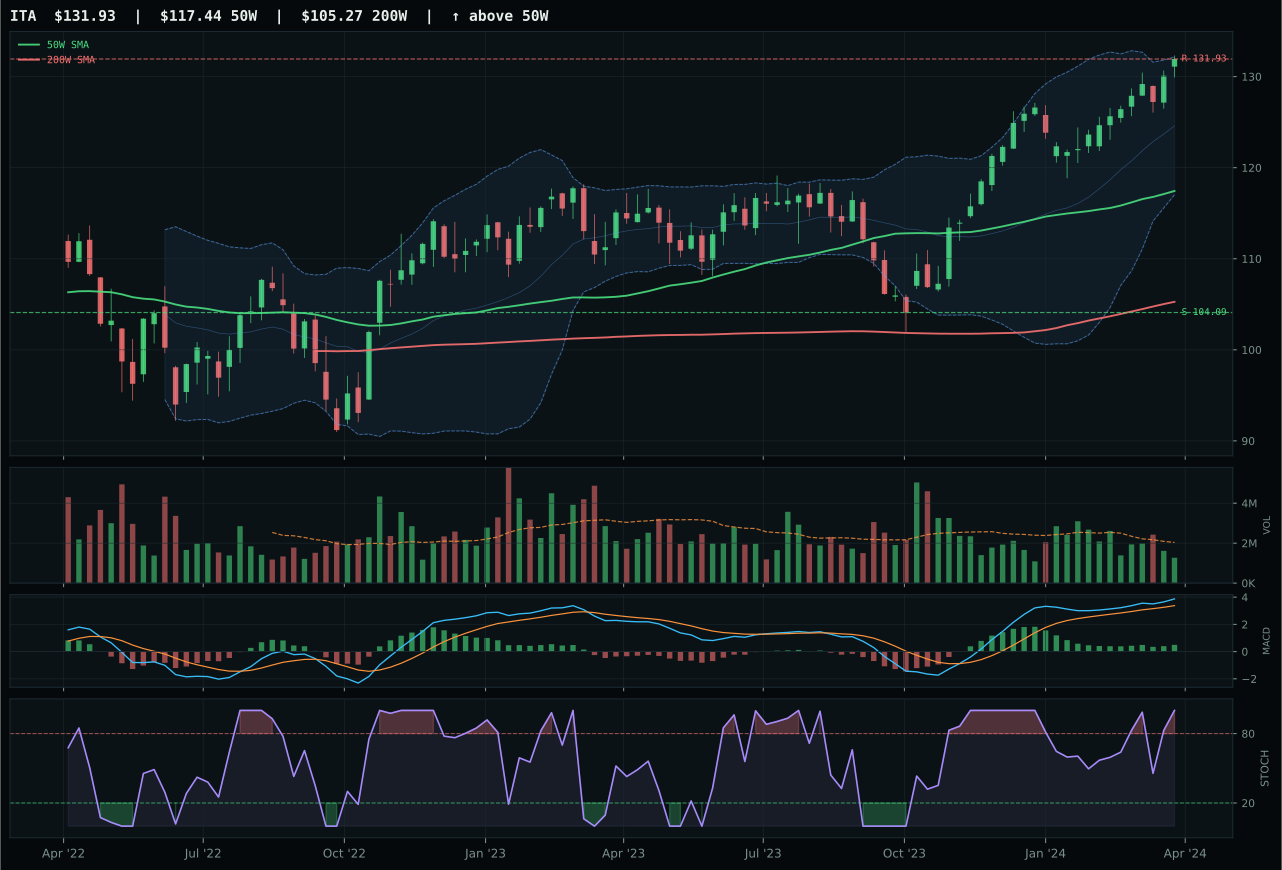
ITA has a neutral structure profile with -5.8% 13-week relative strength versus SPY.
A failed hold above support would weaken the setup.
Actionable but governed by invalidation levels.
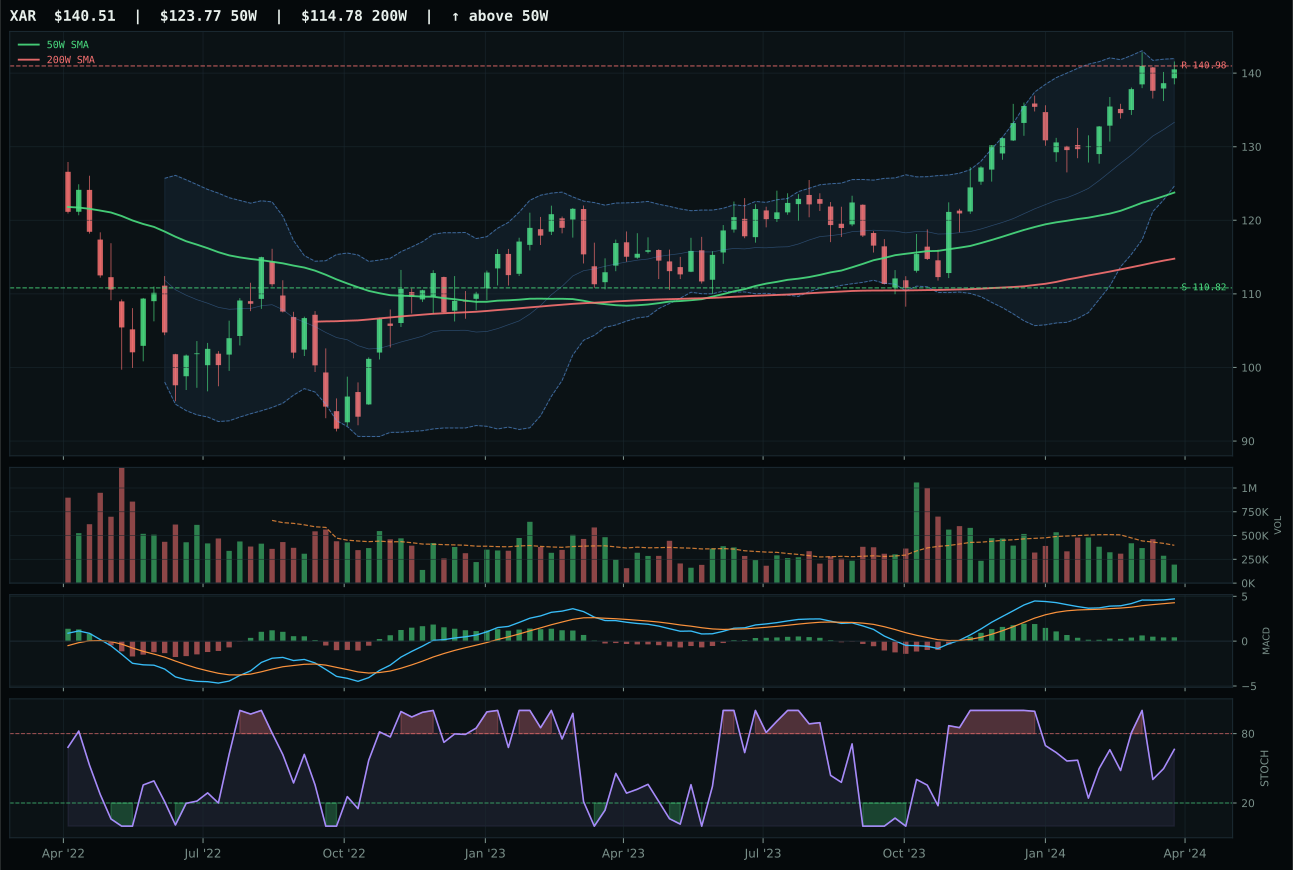
XAR has a neutral structure profile with -6.3% 13-week relative strength versus SPY.
A failed hold above support would weaken the setup.
Actionable but governed by invalidation levels.
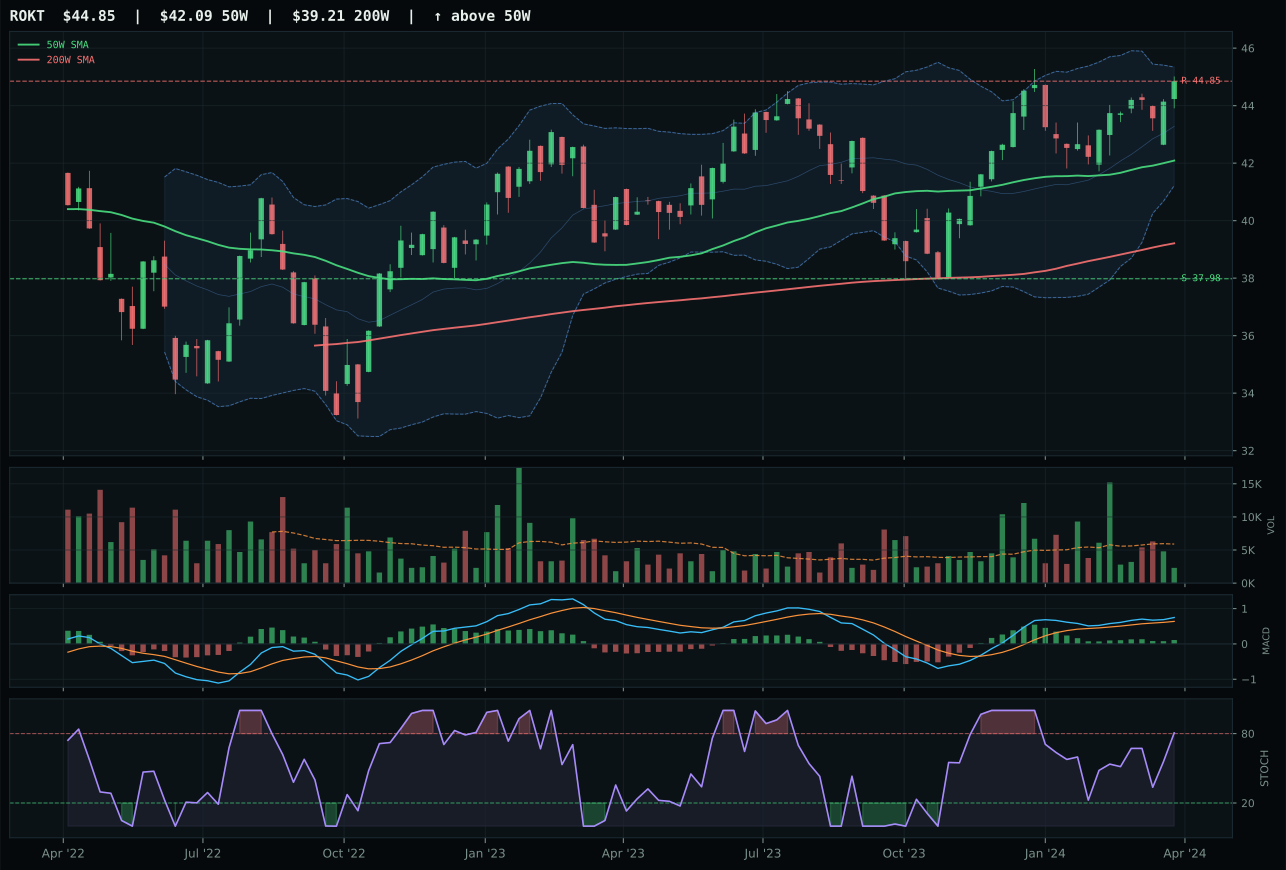
ROKT has a neutral structure profile with -9.8% 13-week relative strength versus SPY.
A failed hold above support would weaken the setup.
Tracked, but not top-2 eligible because: .
ITA edges XAR by 1.0 point in a razor-thin decision that hinges on superior risk/reward (42.4 vs 37.2) and marginally cleaner structure (79.2 vs 76.1). Both ETFs sit in neutral structure above their 50-week moving average with bullish-and-improving MACD and overbought stochastic RSI—a classic late-cycle beat-inflation setup. The critical differentiator is ITA's +0.5% category-relative strength, a small but meaningful signal that this expression of defense durability is being preferred by allocators. MACD improving and stochastic at maximum are textbook confirmation for a quiet re-accumulation; the setup is neither explosive nor extended, which suits a defensive sleeve where durability matters more than momentum surprises.
Defense & Aerospace receives a 5% tier-2 allocation after scoring 56.4 on the back of strong macro fit (66.0/100 category level). Late-cycle reflation, broad-market-bear signals, and dollar pressure all support this exposure; the category gains +6 from broad-market-bear conditions and +3 from dollar support, offsetting modest liquidity headwinds. ITA's neutral structure and tight compression ratios (88.7/100) signal patient accumulation rather than capitulation, a profile that fits defensive positioning. However, tier-2 status reflects ranking discipline: XLE (79.1) and URA (58.7) both scored higher and earned top-2 slots, leaving Defense as the third-best eligible category. The 5% position captures defensive beta without overweighting an exposure that, while technically sound, lacks the macro urgency of energy scarcity or nuclear-growth tailwinds.
Utilities & Infrastructure — XLU
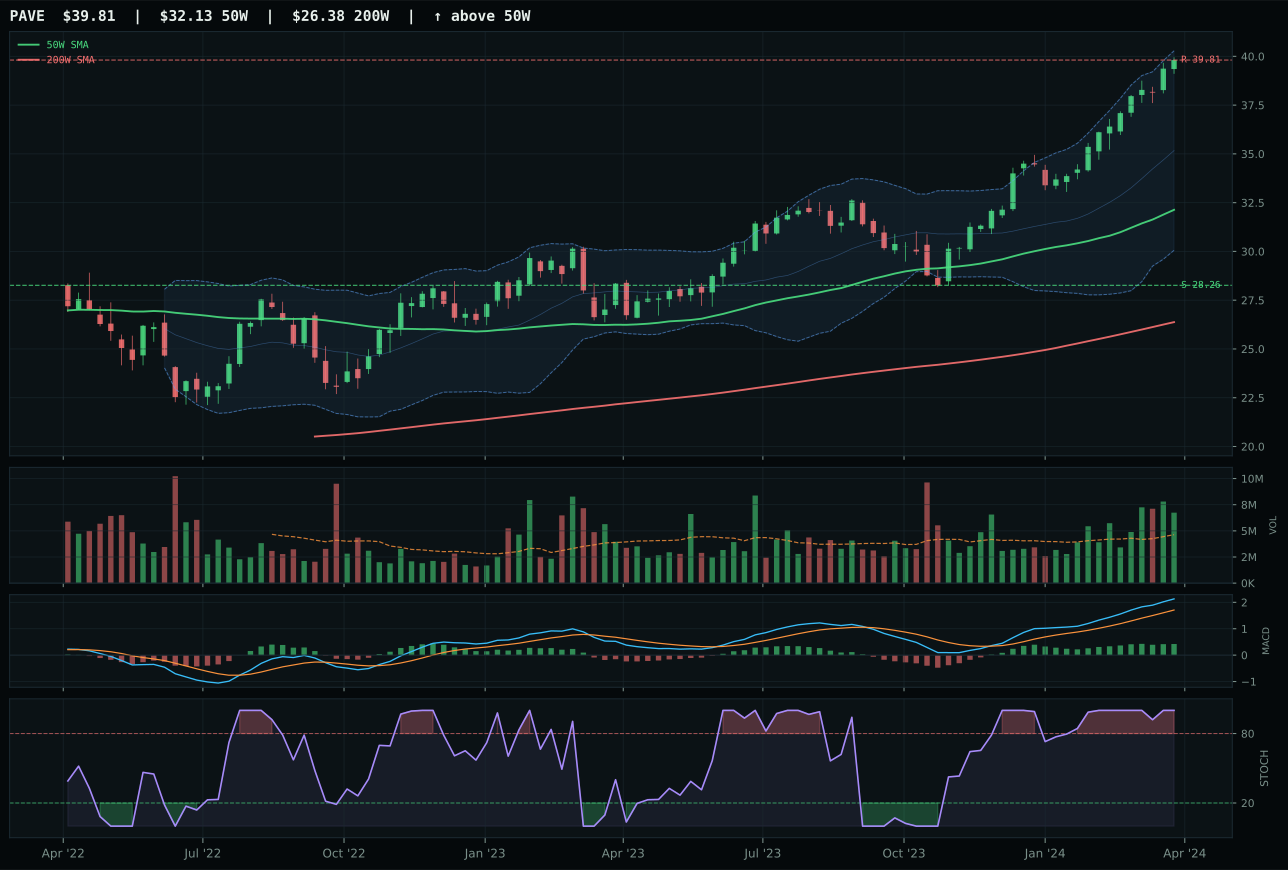
PAVE has a vertical extension profile with 5.5% 13-week relative strength versus SPY.
A failed hold above support would weaken the setup.
Actionable but governed by invalidation levels.
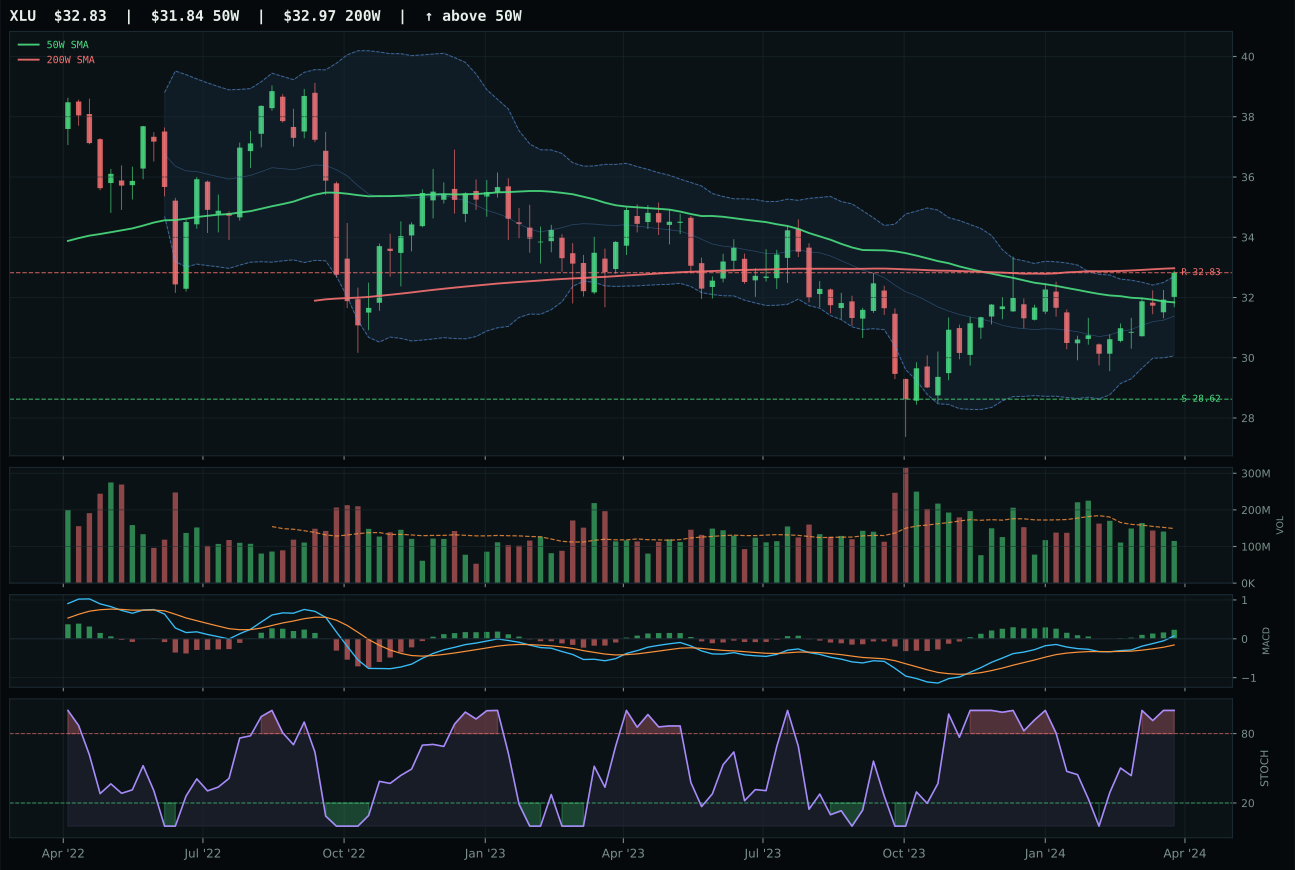
XLU has a neutral structure profile with -6.4% 13-week relative strength versus SPY.
A failed hold above support would weaken the setup.
Actionable but governed by invalidation levels.
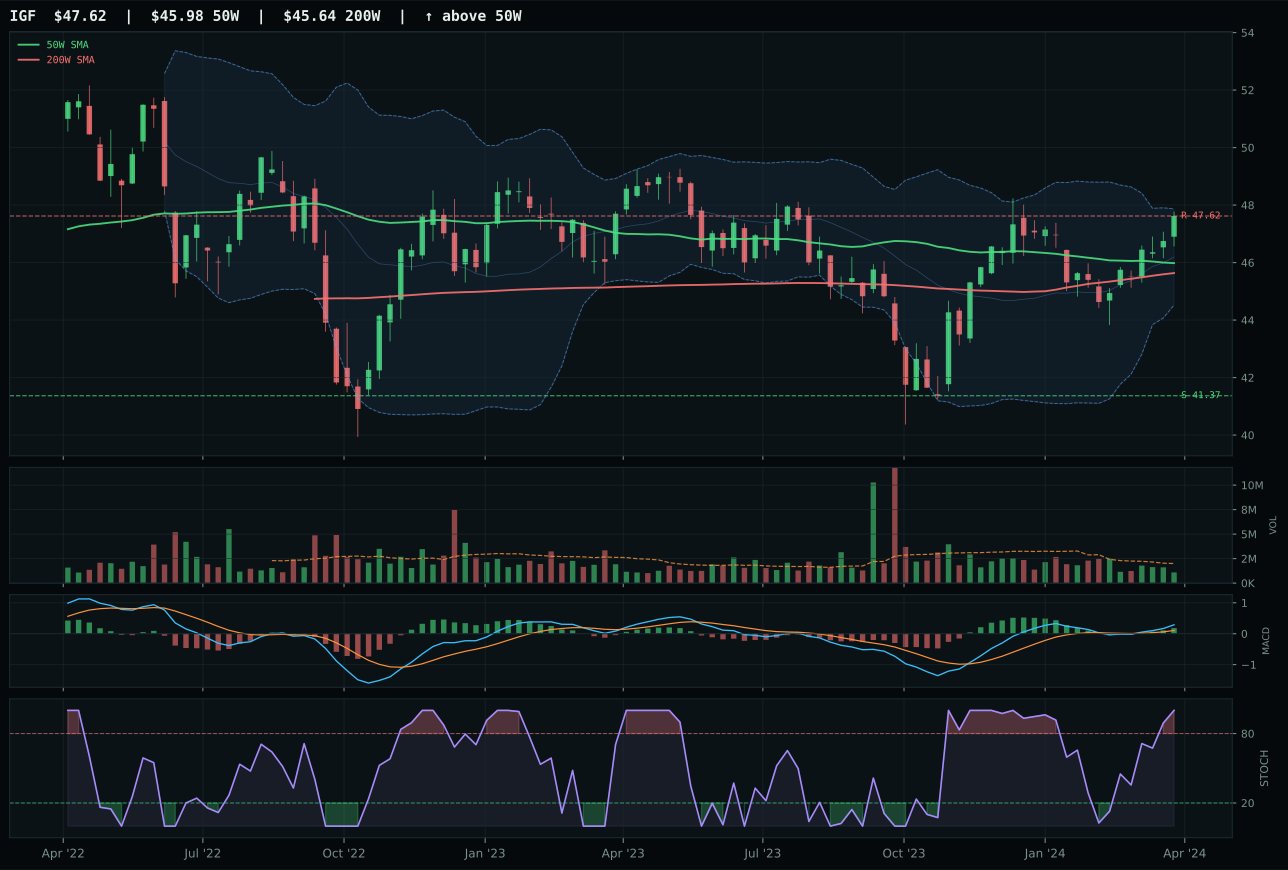
IGF has a neutral structure profile with -8.8% 13-week relative strength versus SPY.
A failed hold above support would weaken the setup.
Actionable but governed by invalidation levels.
XLU defeats PAVE by 5.7 points despite the latter's superior trend (100.0 vs 60.4) and momentum (100.0 vs 65.9), a decision that reveals a critical tension between trend-following and timing discipline. PAVE sits 23.9% above its 50-week moving average in vertical extension near the 52-week high—a setup that rewards only the earliest buyers and penalizes latecomers; its timing score (37.0/100) reflects this entry risk. XLU sits just 3.1% from the 50-week line in the upper retracement / momentum Fibonacci zone with a timing score of 90.0/100—an ideal re-entry point where risk asymmetry has reversed to favor new buyers. Both feature MACD bullish-and-improving and stochastic overbought, yet XLU's neutral volume (0.77x) versus PAVE's above-average participation (1.0x+) signal selective institutional participation in the regulated-utility thesis rather than broad retail rotation. Structure (75.3 vs 73.2) slightly favors XLU's cleaner setup.
Utilities & Infrastructure earns a 5% tier-2 slot on a 56.2 category score, held back by modest macro fit (47.0/100) despite solid technical evidence (XLU composite 67). The category benefits from broad-market-bear signals (+4) and transition narratives (+4), but faces headwinds from inflation pressure (-6) and diminished risk appetite (-2). In late-cycle reflation, utilities face compression margins as input costs (labor, energy) rise faster than regulated pricing can accommodate; the category serves as a hedge against market volatility and a stable-dividend anchor, not a growth engine. XLU's advantage over PAVE—superior timing and risk asymmetry—makes it the correct representative, but its tier-2 allocation reflects this reality: 5% captures defensive beta and income, but not enough to suggest portfolio conviction. For elevation to tier-1, either PAVE's extension would need to exhaust (stochastic rolling and MACD flattening), creating a fresh accumulation point, or macro conditions would need to shift toward credit stress or deflation scenarios where regulated utilities genuinely outperform.
Industrial Metals — COPX
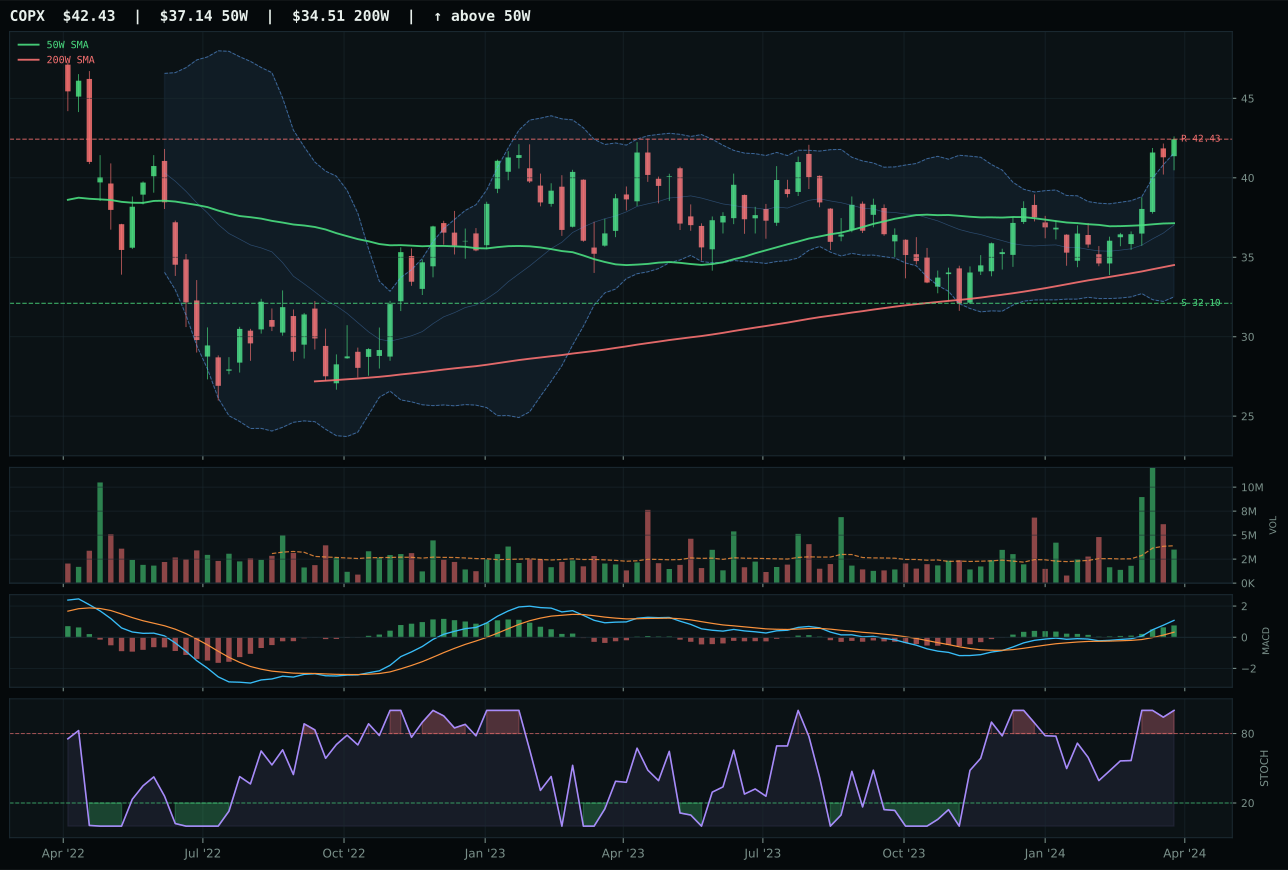
COPX has a neutral structure profile with 3.1% 13-week relative strength versus SPY.
A failed hold above support would weaken the setup.
Actionable but governed by invalidation levels.
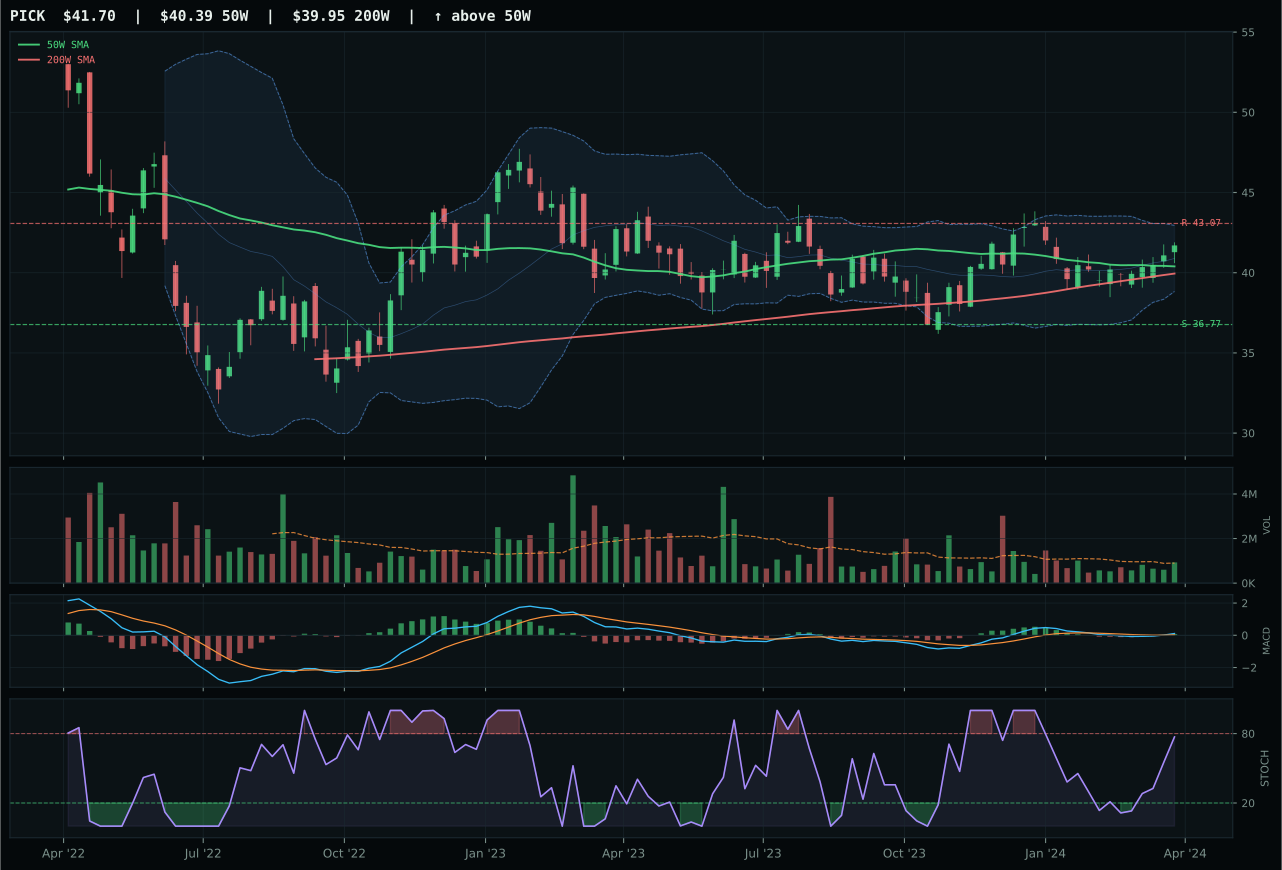
PICK has a neutral structure profile with -13.2% 13-week relative strength versus SPY.
A failed hold above support would weaken the setup.
Actionable but governed by invalidation levels.
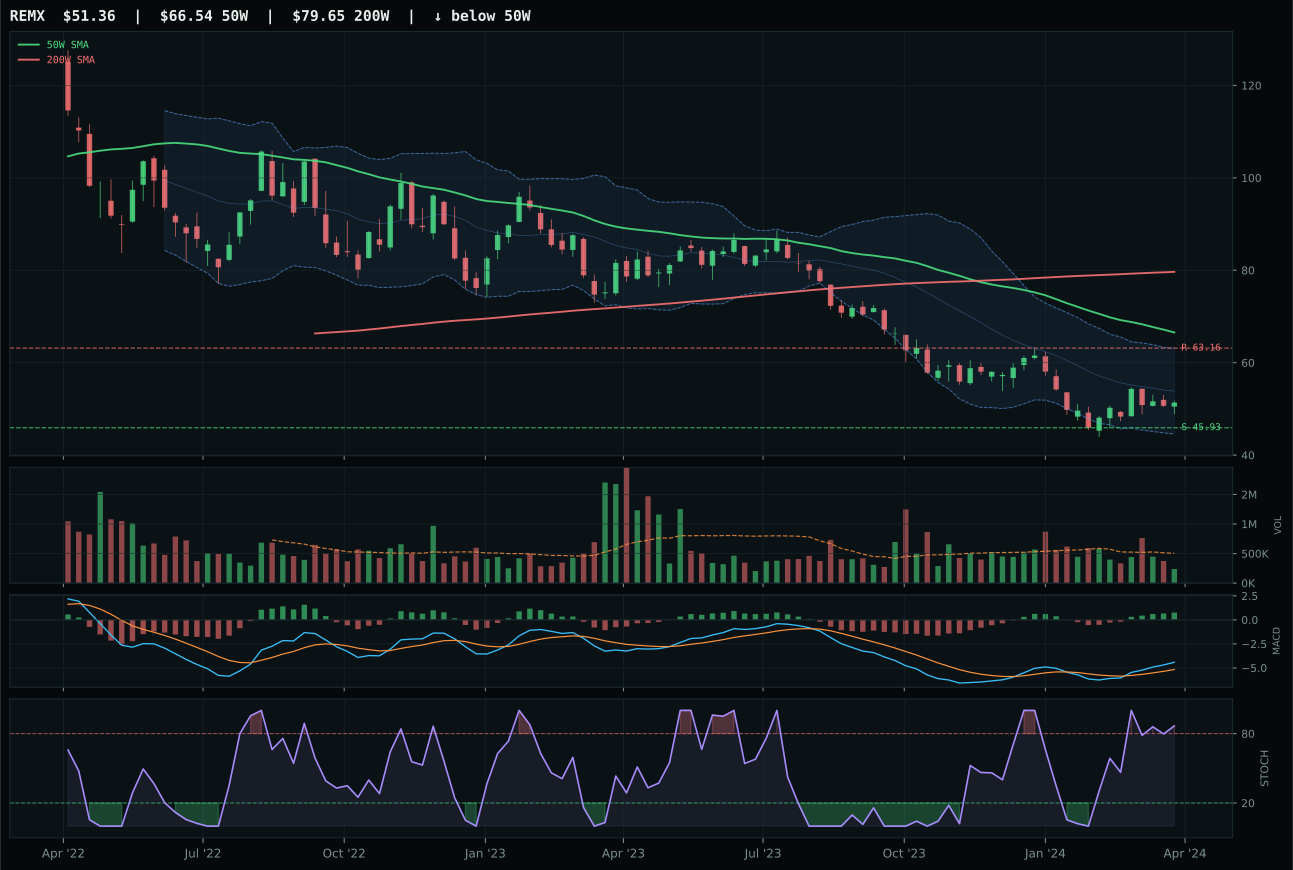
REMX has a neutral structure profile with -26.6% 13-week relative strength versus SPY.
Extension and support failure are the main tactical risks.
Tracked, but not top-2 eligible because: structurally broken.
COPX runs away from the field with a 10.5-point lead over PICK, delivering perfect 100/100 trend and momentum scores alongside exceptional category-relative strength of 16.3%. Copper miners' 13.1% thirteen-week return and +3.1% SPY-relative performance signal that this cohort has captured scarcity premiums; MACD bullish-and-improving, stochastic at overbought, and volume neutral (0.90x) paint a picture of institutional accumulation in anticipation of supply constraints. PICK's weakness is immediate and quantifiable: -13.2% SPY-relative and 0.0% category-relative strength reveal that broad-based mining exposure is being passed over in favor of COPX's copper-specific thesis. The compression ratio (77.1/100) and support/resistance bands frame an orderly structure despite the 37.7% distance to resistance, suggesting patience rather than mania.
Industrial Metals secures a 5% tier-2 allocation, backed by a robust 50.5 category score and exceptional macro support (68.0/100 category fit). Metals scarcity (+14), commodity breadth positive (+10), and real-asset sponsorship (+6) all signal that inflation-driven demand for industrial inputs is a core late-cycle reflation theme. COPX's 80/100 composite technical score and dominant category-relative strength (16.3%) make this a high-conviction pick for a portfolio overweighting commodity inflation. However, tier-2 status reflects allocation discipline: XLE (79.1) and URA (58.7) ranked higher, earning the top-2 10% slots. Industrial Metals' 5% position captures copper and metals scarcity without overcommitting to a narrower macro theme. For elevation to tier-1, COPX would need either a stronger momentum confirmation (stochastic rolling over to set up a higher-lows pattern) or simultaneous deterioration in Energy or Nuclear, which would shift category ranking. Current setup is accumulation, not exhaustion.
Precious Metals — GLD
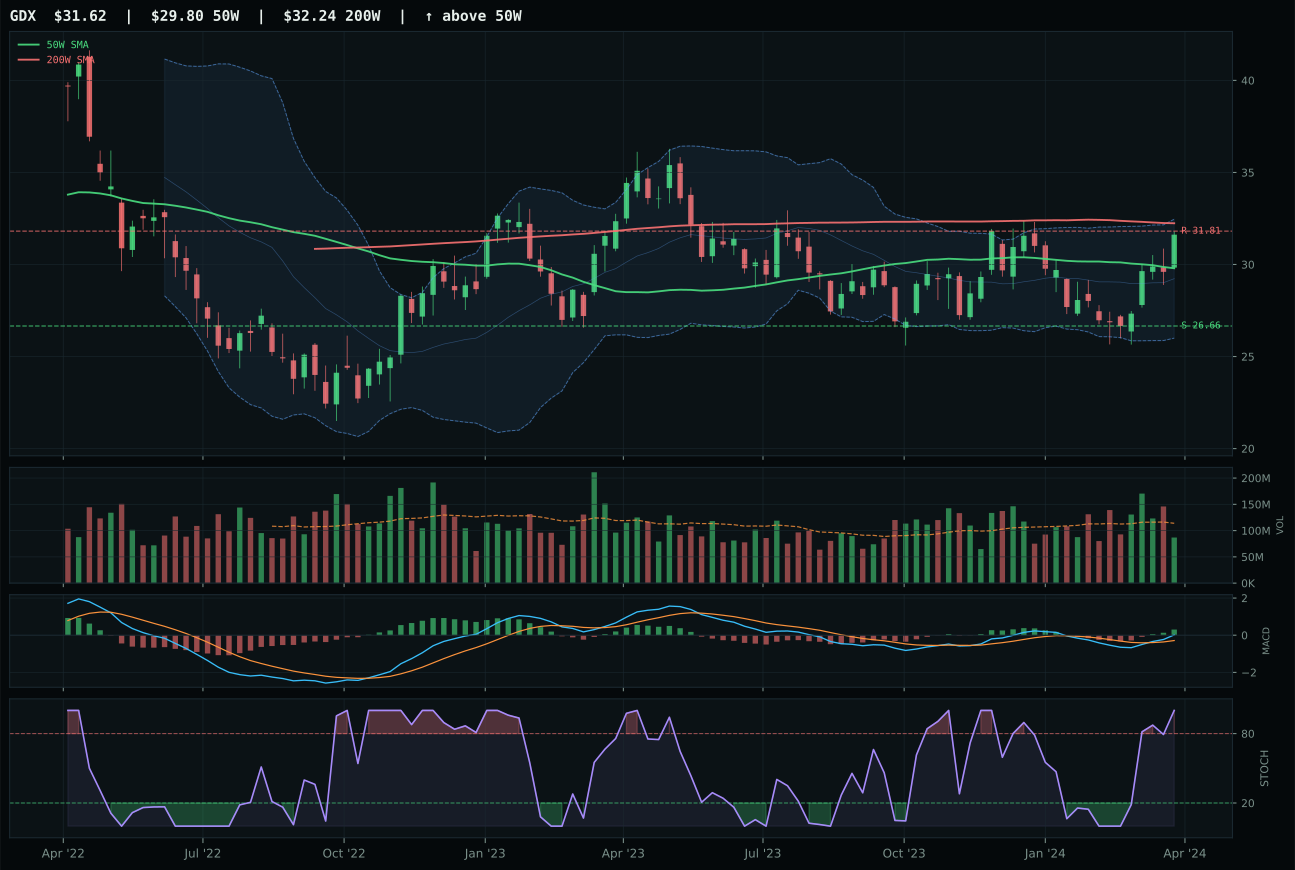
GDX has a neutral structure profile with -8.1% 13-week relative strength versus SPY.
A failed hold above support would weaken the setup.
Actionable but governed by invalidation levels.
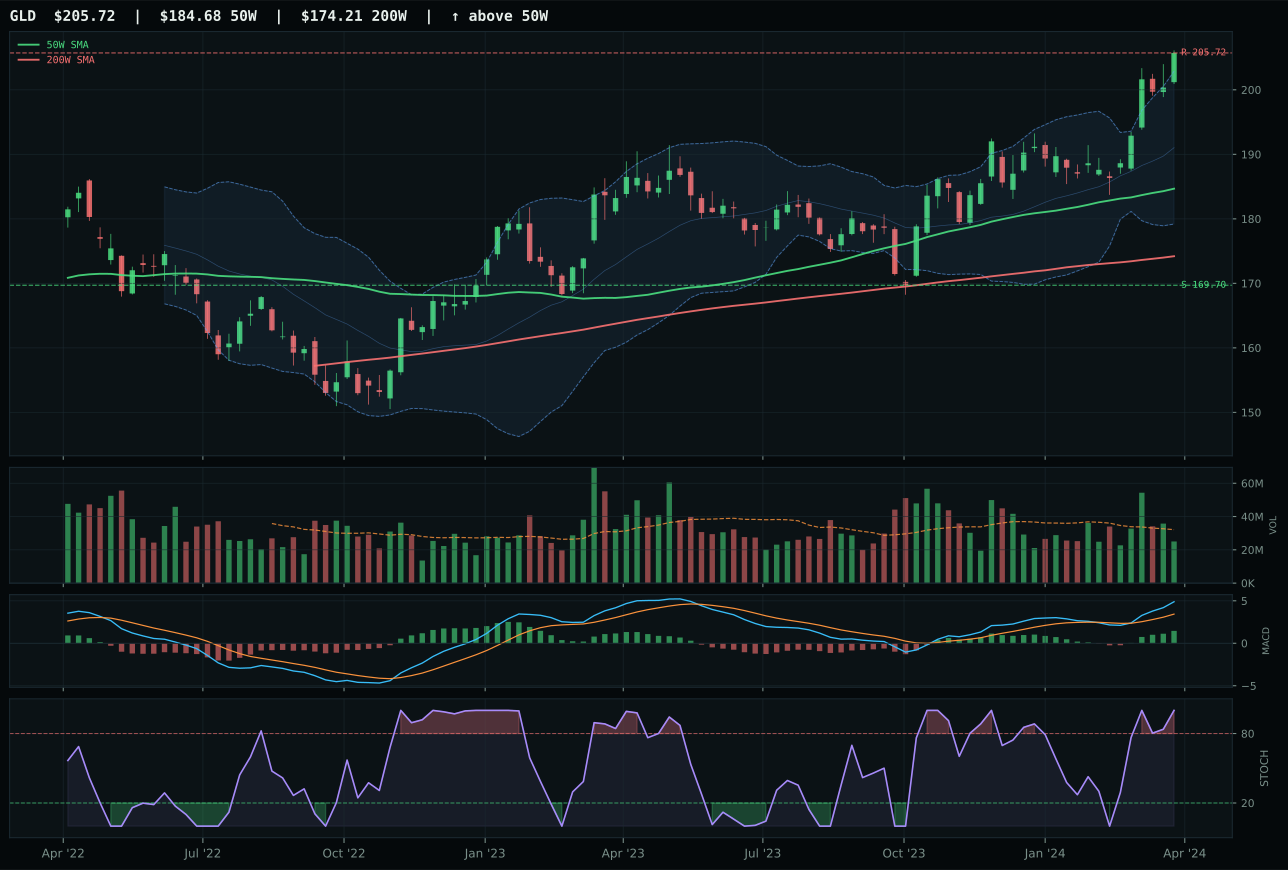
GLD has a neutral structure profile with -2.4% 13-week relative strength versus SPY.
A failed hold above support would weaken the setup.
Actionable but governed by invalidation levels.
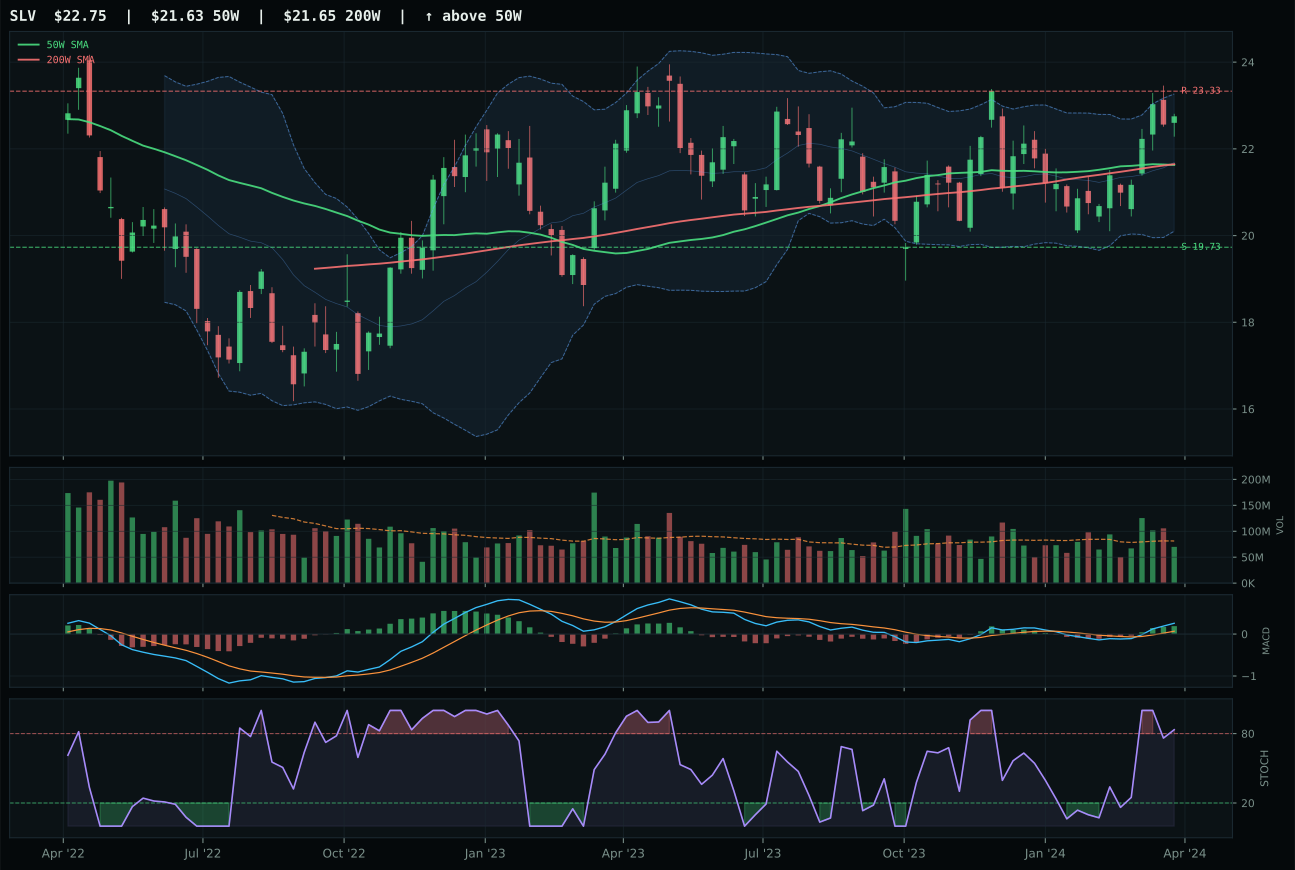
SLV has a neutral structure profile with -5.6% 13-week relative strength versus SPY.
A failed hold above support would weaken the setup.
Actionable but governed by invalidation levels.
GLD captures the category with an 11.1-point lead over GDX, anchored on superior structure (76.2 vs 67.3), stronger category-relative strength (+3.2% vs -2.5%), and cleaner technical confirmation. Gold's trend score of 96.3/100 reflects price above both key moving averages with minimal slope deterioration; the setup sits in neutral structure near the 52-week high where MACD is bullish-and-improving and stochastic RSI peaks at overbought. Relative to GDX, GLD's advantage is unmistakable: gold miners suffer from leverage friction during sideways consolidation, while spot-gold tracking in GLD provides simpler accumulation without leveraged drawdowns. Volume at 0.78x is neutral, not thin, a critical distinction that separates confident buyers from forced sellers. The MACD improvement and compressed support/resistance bands (compression 89.3/100) frame an orderly advance, not a panic escape.
Precious Metals earns a 5% tier-2 allocation on the back of a 48.9 category score, driven by strong technical evidence (GLD composite 75) but limited macro tailwind in a reflation regime. Dollar pressure is active at +2, a modest support; however, risk-appetite-positive (-4) and overall category macro fit of only 49.0/100 constrain allocation size. In late-cycle reflation, gold serves as portfolio insurance against tail risks rather than a core growth driver; it holds value when liquidity stress spikes or credit cracks, but underperforms in risk-on environments. The 5% position reflects this dual nature: enough to provide diversification and volatility dampening, but not so much as to compete with real-asset categories (Energy, Industrial Metals) that benefit from inflation and growth simultaneously. For Precious Metals to move to tier-1, either stochastic RSI would need to roll over (signaling a consolidation and re-entry point) or macro descriptors would need to show emerging credit stress or liquidity tightening.
AI — SMH
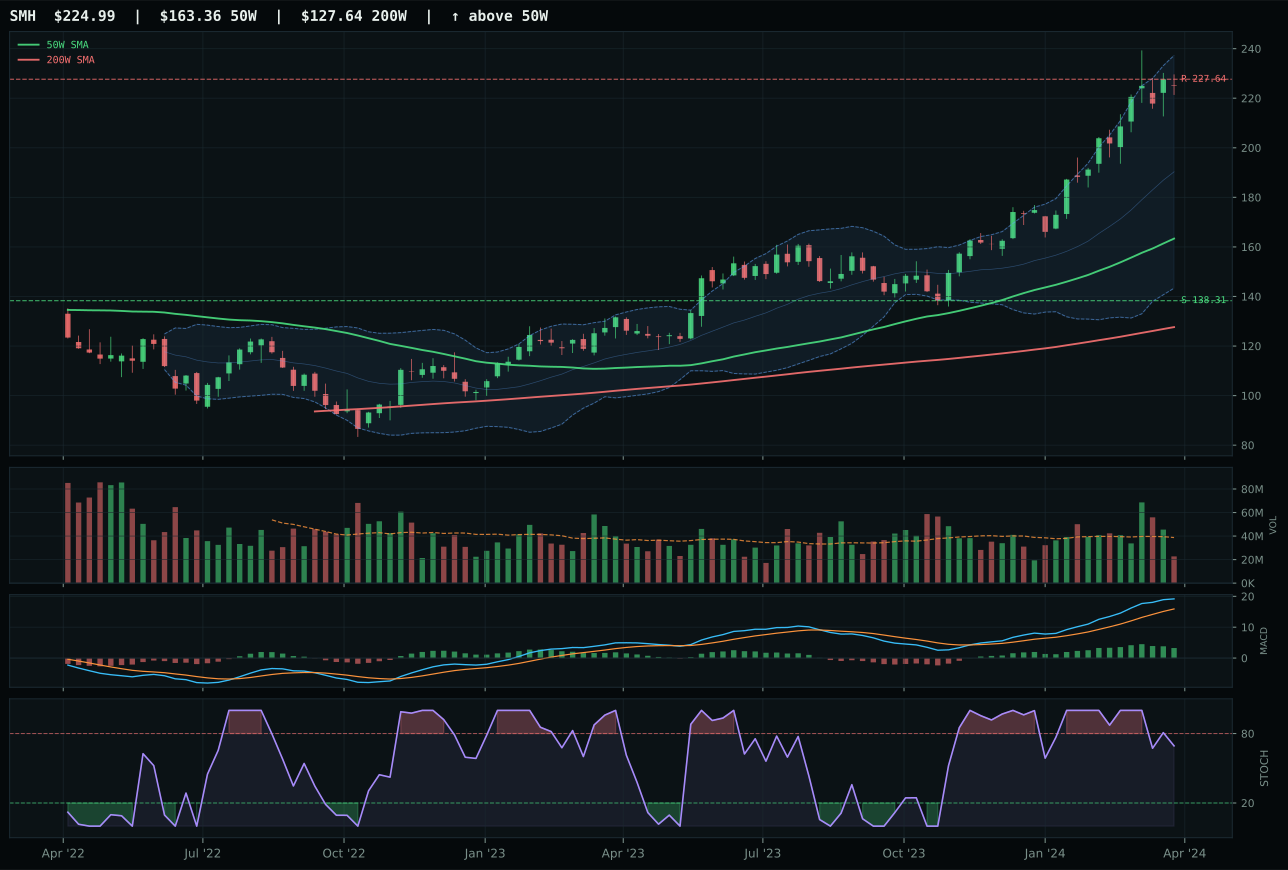
SMH has a vertical extension profile with 18.6% 13-week relative strength versus SPY.
A failed hold above support would weaken the setup.
Actionable but governed by invalidation levels.
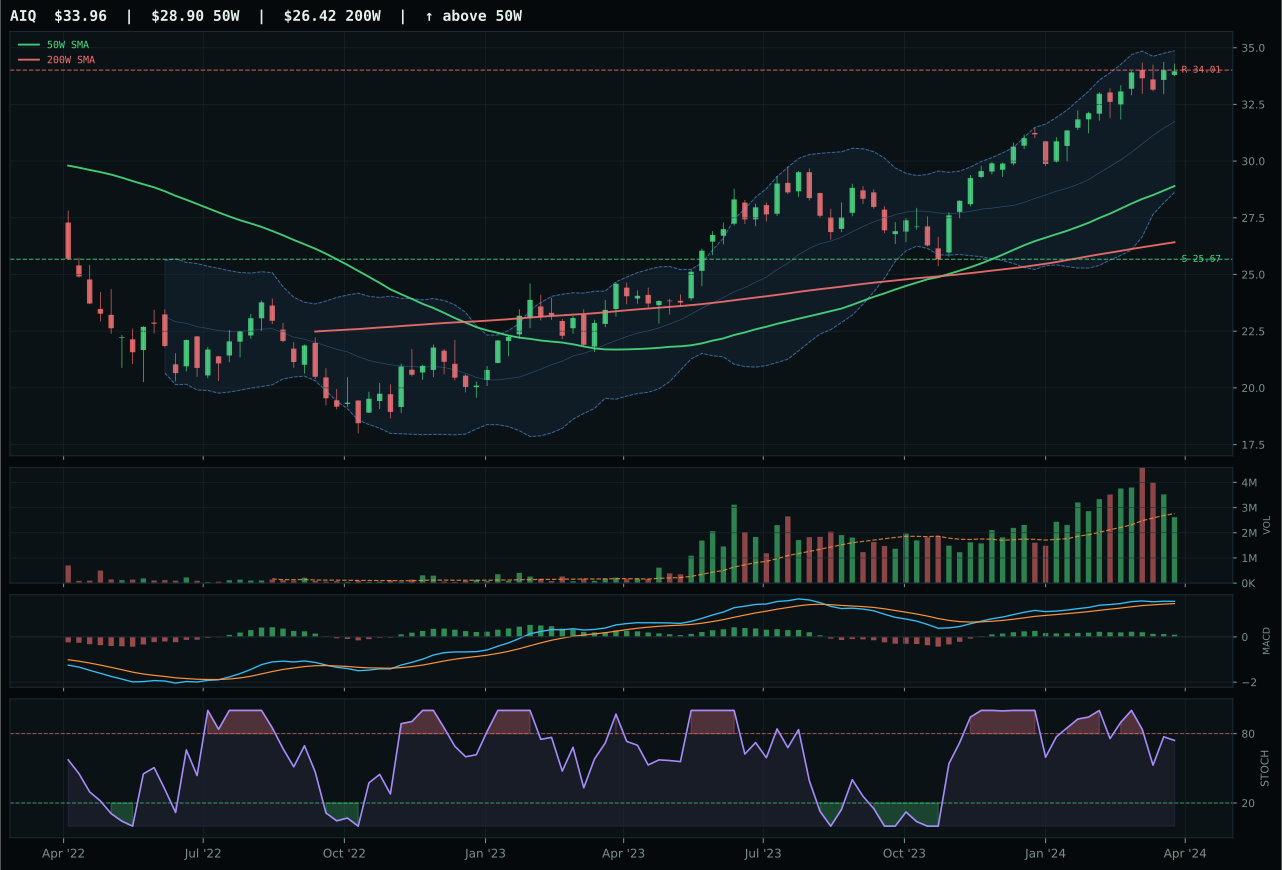
AIQ has a vertical extension profile with -1.1% 13-week relative strength versus SPY.
A failed hold above support would weaken the setup.
Actionable but governed by invalidation levels.
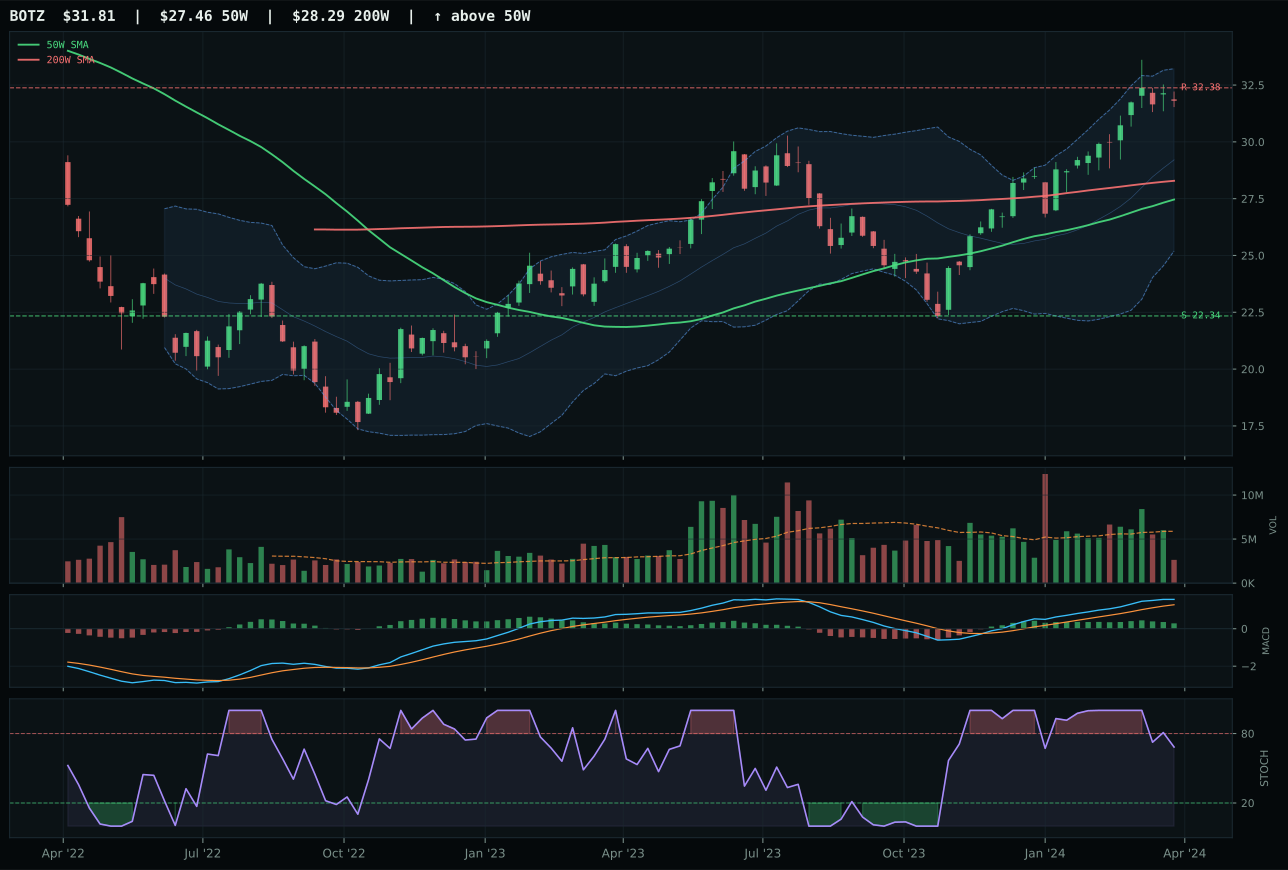
BOTZ has a vertical extension profile with 1.6% 13-week relative strength versus SPY.
A failed hold above support would weaken the setup.
Actionable but governed by invalidation levels.
SMH dominates its category with a 5.0-point technical advantage over AIQ, anchored on perfect 100/100 momentum confirmation and maximum trend strength. The semiconductor ETF's 28.7% thirteen-week return and 18.6% outperformance versus SPY are legitimate—not stretched—because volume-price confirmation (78.8/100) and persistence (93.0/100) validate that buyers are accumulating rather than exhausting. At 37.7% above the 50-week line, SMH risks late entry; however, category-relative strength of 17.0% signals that this is the path of least resistance for capital seeking AI exposure. AIQ's weakness stems not from broken MACD but from lagging SPY-relative and category-relative performance (-1.1% and -2.7%, respectively), a subtle but critical erosion in comparative sponsorship that the timing and risk/reward scores correctly penalize.
AI earns a tier-2 slot at 5% allocation, a position that reflects strong technical evidence (SMH composite 65) but insufficient macro tailwind to compete with top-2 categories. The category's 42.6 final score benefits from AI growth sponsorship (+14) and positive risk appetite (+10), yet those gains are partially offset by active liquidity stress (-12) and broad-market-bear signals (-8). In a late-cycle reflation regime, AI is a growth asset fighting a defensive tide; it will accumulate on dips and spike on risk-on reversals, but lacks the structural macro support to justify top-2 weight. For elevation, the category would need either MACD deterioration in top-tier competitors (XLE, URA) or a macro shift that dampens liquidity stress and credit stress concerns. Until then, 5% captures AI momentum without overcommitting to a regime that favors real assets and energy.
Agriculture & Livestock — MOO
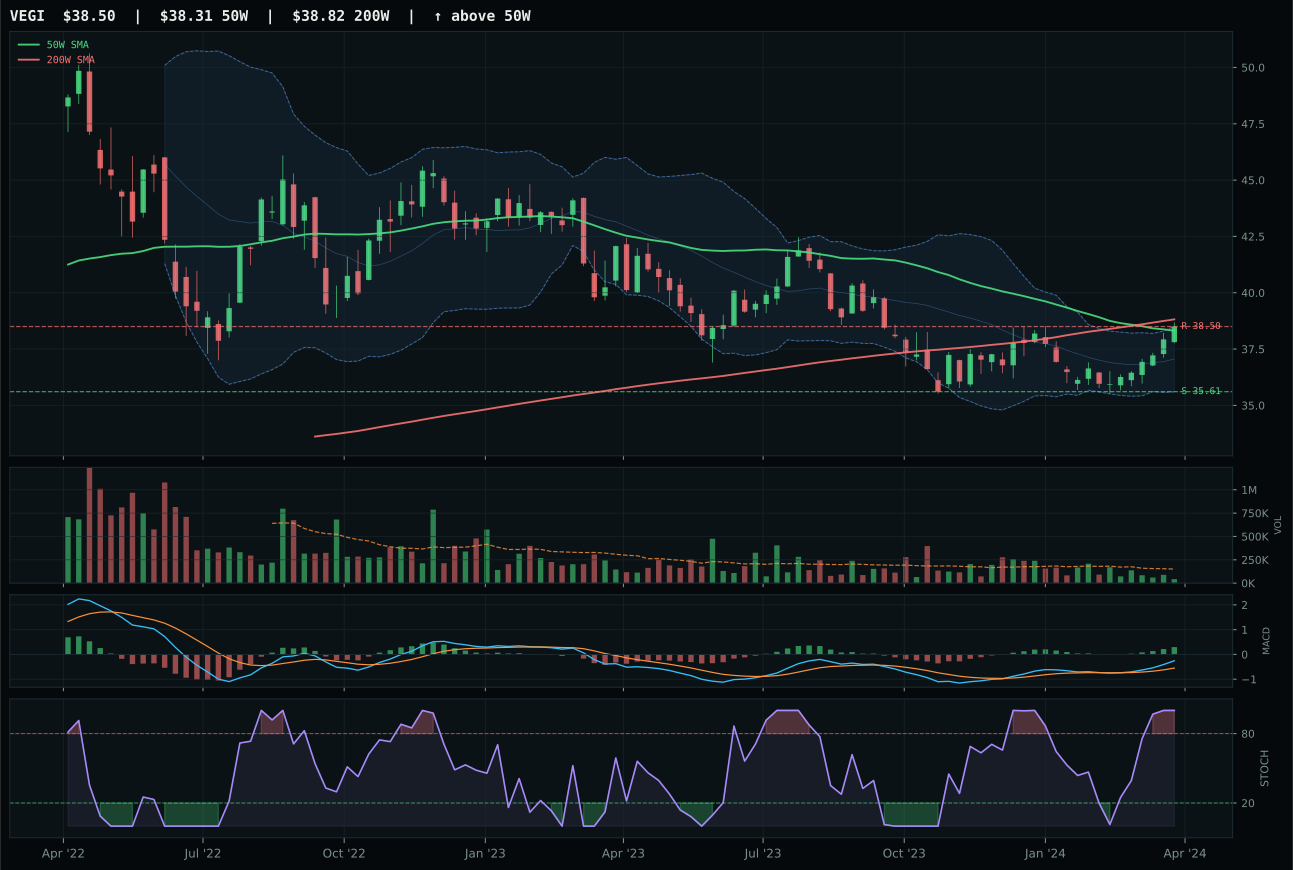
VEGI has a compression near 50W profile with -9.2% 13-week relative strength versus SPY.
A failed hold above support would weaken the setup.
Tracked, but not top-2 eligible because: .
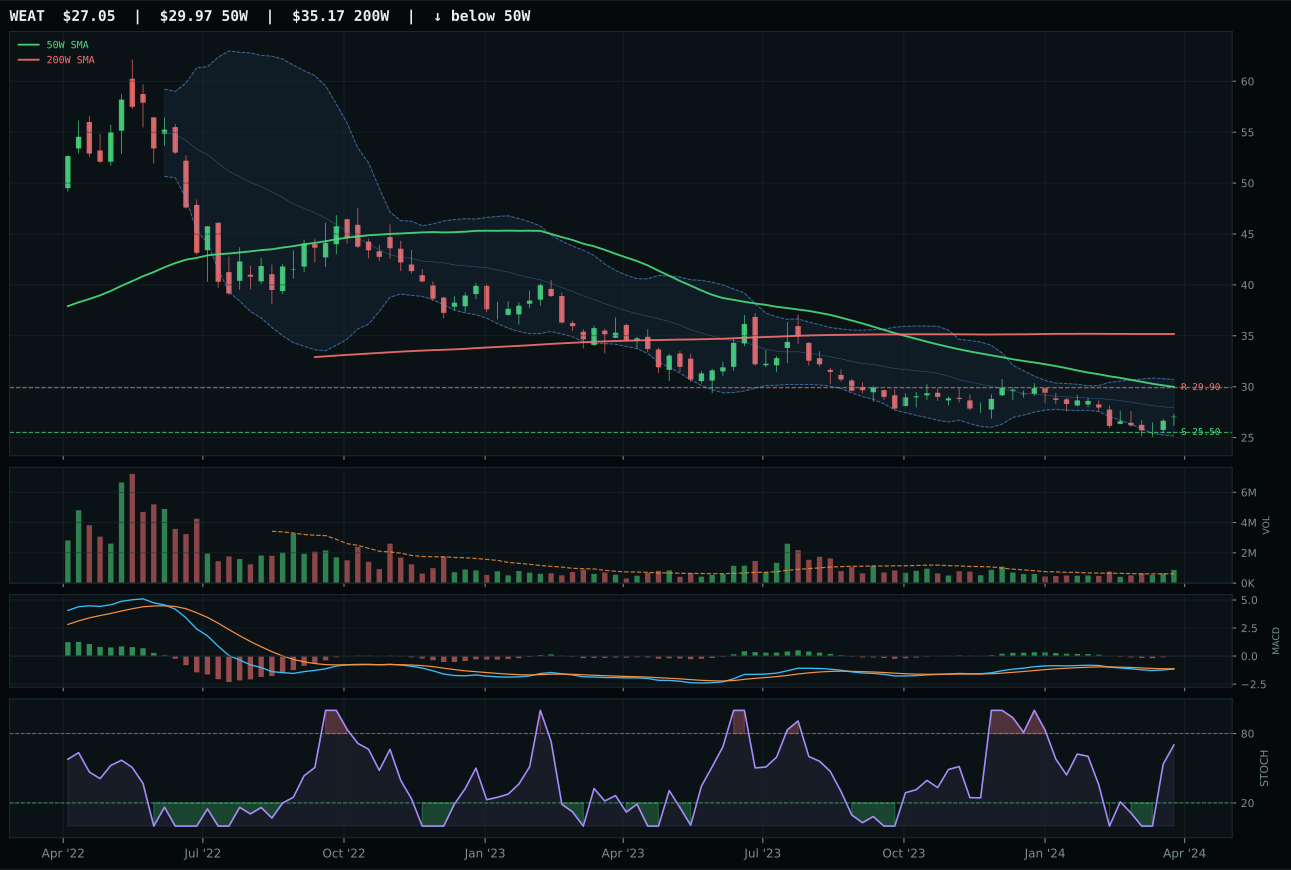
WEAT has a neutral structure profile with -19.4% 13-week relative strength versus SPY.
Extension and support failure are the main tactical risks.
Tracked, but not top-2 eligible because: structurally broken.
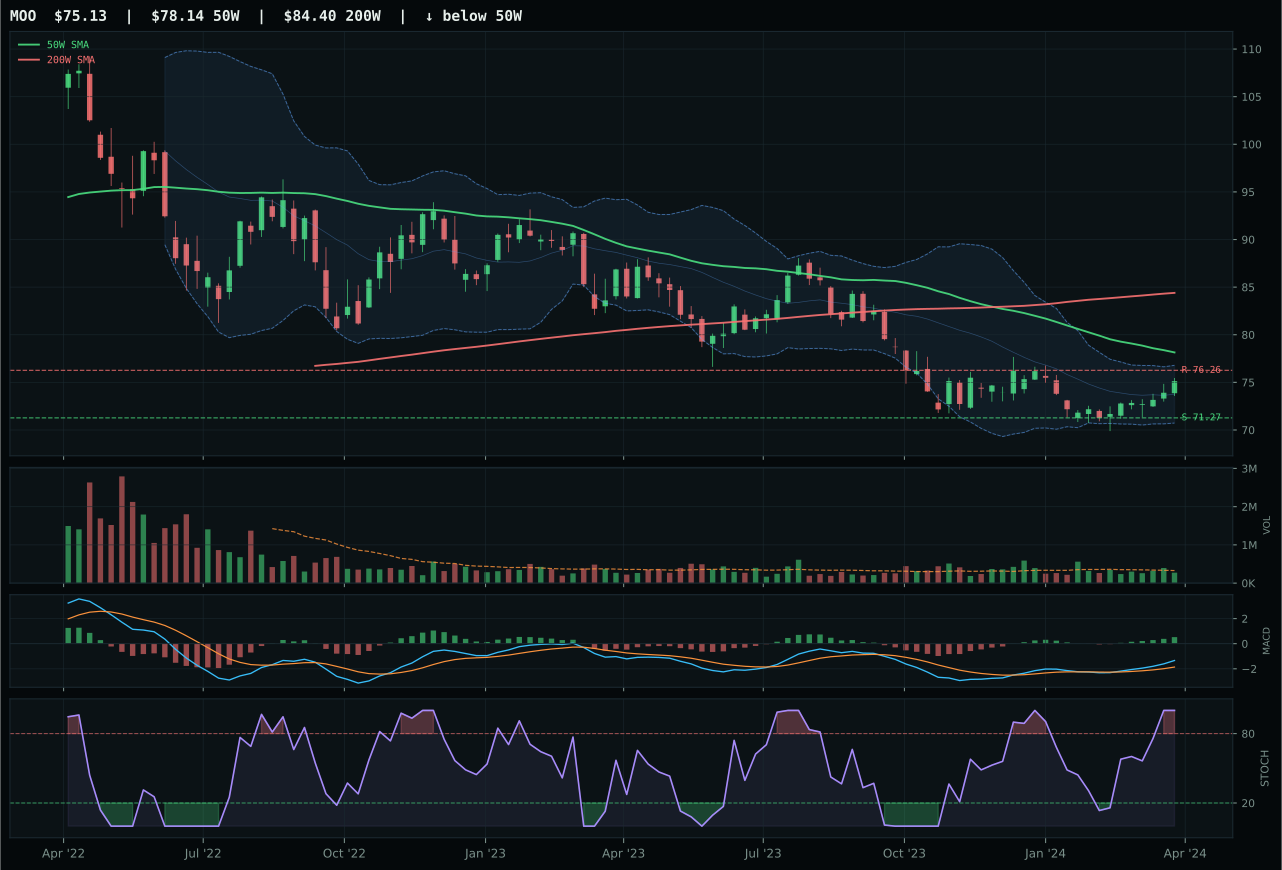
MOO has a neutral structure profile with -11.4% 13-week relative strength versus SPY.
Extension and support failure are the main tactical risks.
Tracked, but not top-2 eligible because: structurally broken.
MOO wins its category despite an ineligible ranking status (the category scored 30.9 and failed eligibility), beating VEGI principally on volume confirmation—neutral 0.83x participation versus VEGI's thin 0.60x. Both ETFs rest below their 50-week moving average in a deep retracement (Fibonacci 0.786 zone), so the setup is pure support-hold rather than trend-confirmation. MOO's MACD is bullish-and-improving and stochastic RSI sits overbought, a mean-reversion coil waiting for catalysts. The 23.9-point gap versus VEGI reflects MOO's cleaner participation: at neutral volume, buyers are present without panic; at thin volume, VEGI's advance lacks sponsorship. This is a category breakdown in technical terms—price below both moving averages with negative thirteen-week returns (-1.4% for MOO, +0.8% for VEGI)—but MACD improving and Fibonacci timing (90.0/100) keep the door open for a snapback.
Agriculture earns 5% allocation despite scoring only 30.9 and marked as ineligible in the category reasoning layer, a decision driven by exceptional macro fit (90.0/100). The category benefits from active supply-shortage signals (+13), inflation pressure (+10), and real-asset sponsorship (+8), making it one of the highest macro-supported categories despite technical weakness. MOO's failure to qualify reflects broken technical structure (trend 40.0, momentum 47.0) and negative SPY-relative performance (-11.4%), but the macro regime—late-cycle reflation with commodity breadth positive—strongly suggests accumulation on support holds. The 5% allocation is a macro conviction trade, not a technical endorsement; it signals that supply-driven commodity inflation and real-asset rotation are powerful enough to justify holding an asset whose price is still below trend. Price breaking back above the 50-week MA, MACD holding above zero, and volume improving would convert this from a macro gamble to a confident add.
Technology — XLK
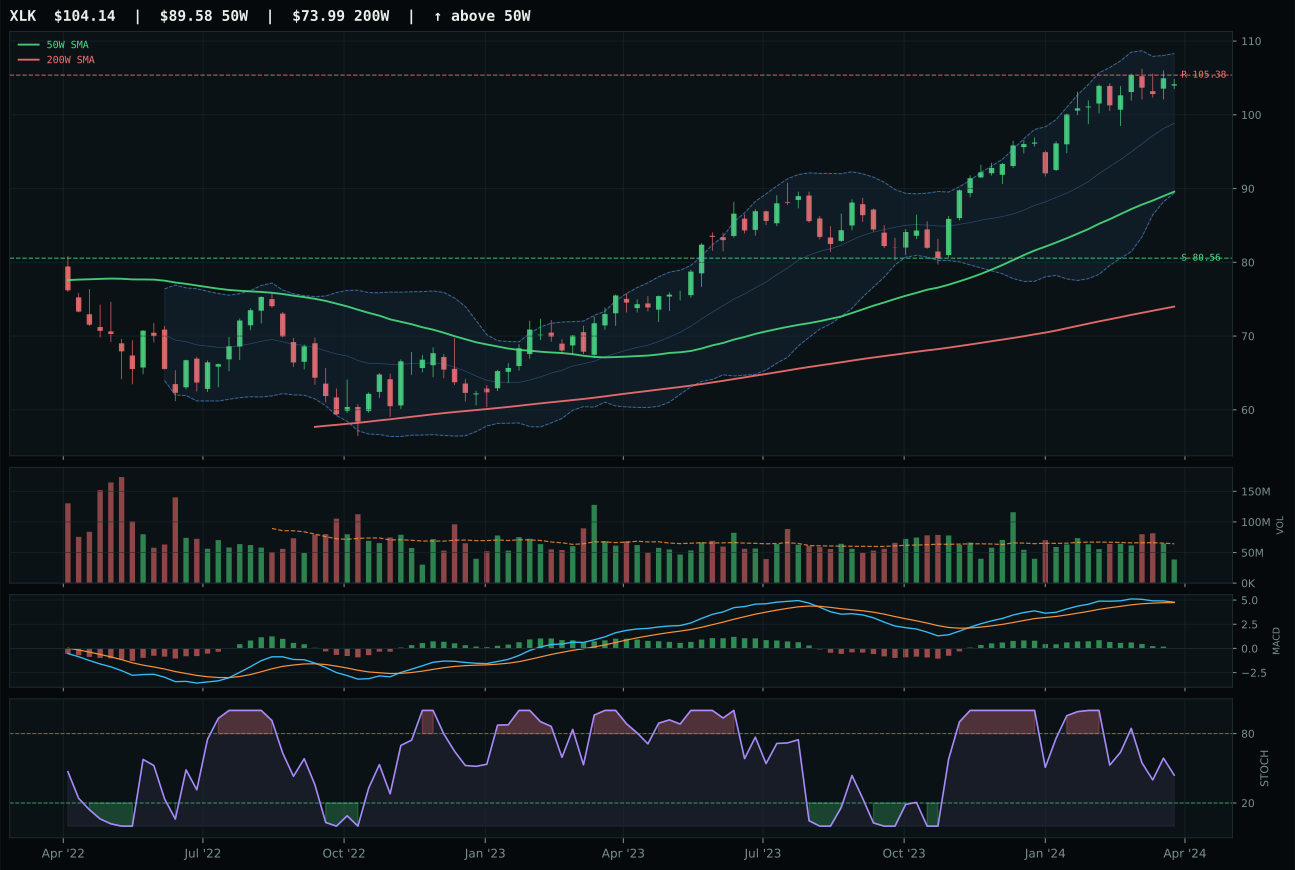
XLK has a vertical extension profile with -1.8% 13-week relative strength versus SPY.
A failed hold above support would weaken the setup.
Actionable but governed by invalidation levels.
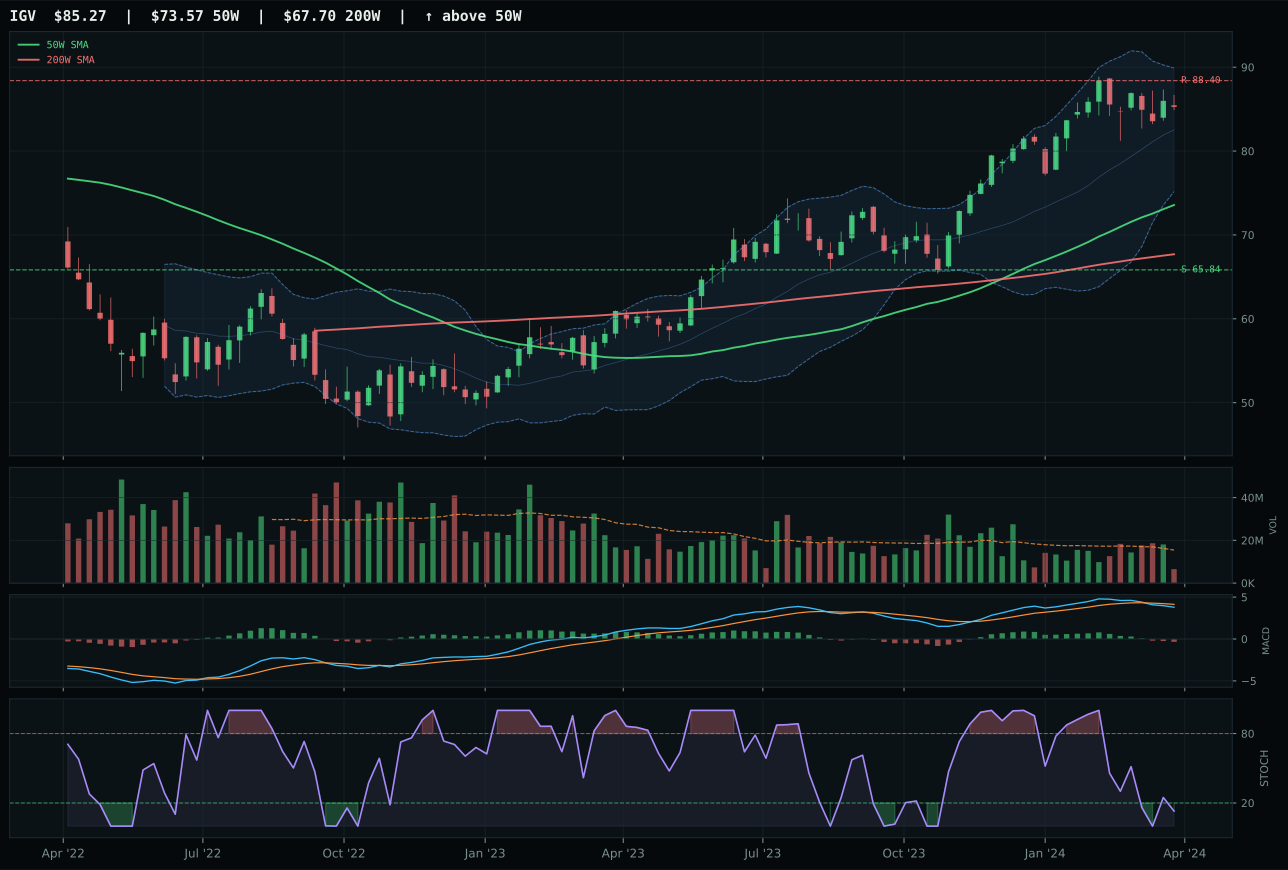
IGV has a vertical extension profile with -4.9% 13-week relative strength versus SPY.
A failed hold above support would weaken the setup.
Actionable but governed by invalidation levels.
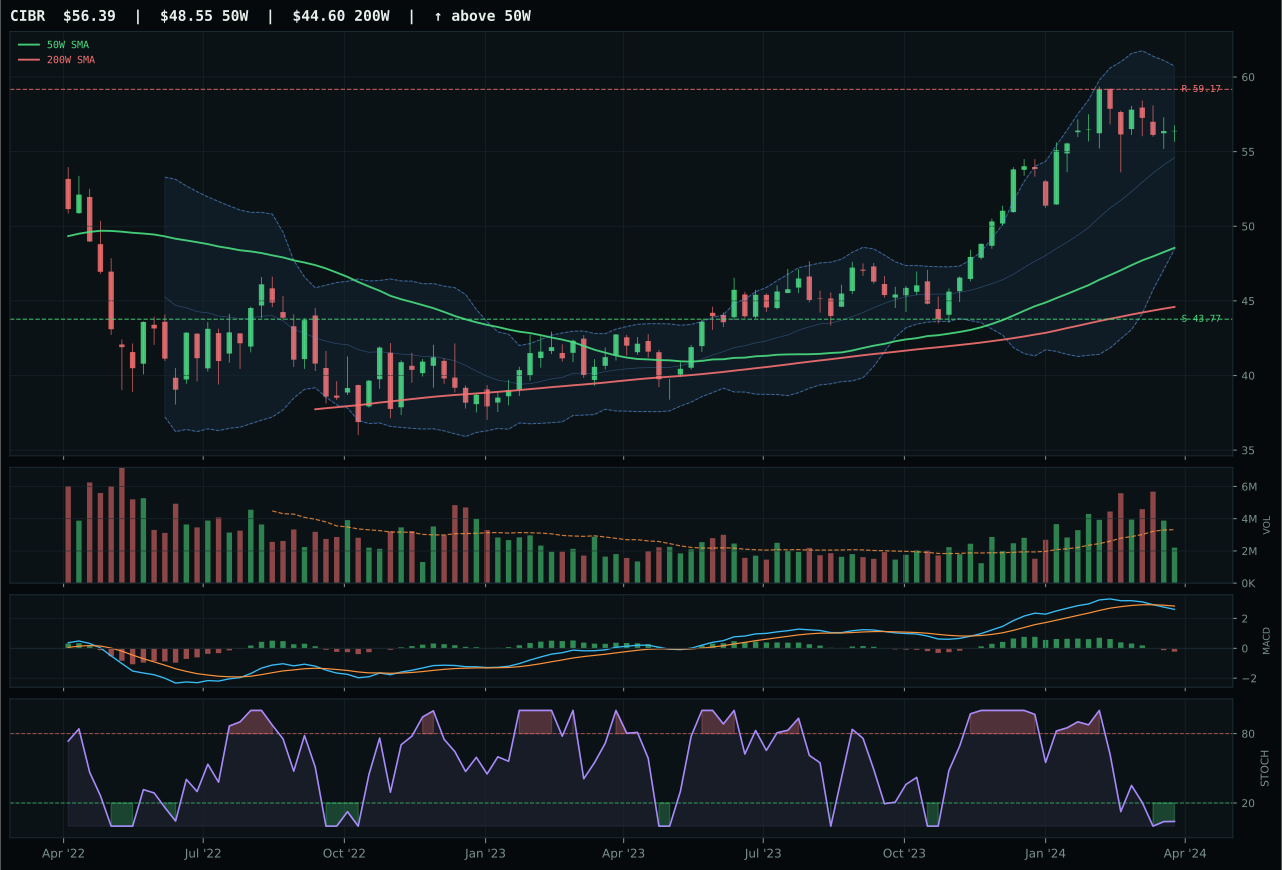
CIBR has a vertical extension profile with -5.3% 13-week relative strength versus SPY.
A failed hold above support would weaken the setup.
Actionable but governed by invalidation levels.
XLK wins the category with a 9.1-point margin over IGV, driven by superior relative strength within the sector and cleaner technical confirmation. While both ETFs sit in vertical extension 16%+ above their 50-week moving average, XLK's 3.1% category-relative strength and bullish-but-flattening MACD present a more credible accumulation pattern than IGV's bearish/weakening momentum and oversold stochastic RSI. The setup rewards trend followers, not contrarians—price sits near the 52-week high where every new buyer has absorbed a loss on entry, so breadth and volume sponsorship become gatekeepers. XLK's thin 0.60x participation suggests selective institutional buying rather than panic rotation, a distinction that separates legitimate leadership from mean-reversion noise.
Technology ranks outside the portfolio this week at 0% allocation, excluded as the 9th or 10th category on a forward-looking basis. The category's 27.6 composite score reflects a late-cycle reflation regime that penalizes duration-sensitive growth: liquidity stress and credit stress are active macro headwinds, both subtracting 9-10 basis points from category-level macro fit. XLK's strong trend alone cannot overcome the structural headwind that reflation typically rotates capital away from technology toward real assets and cash-flow defensives. For Technology to re-enter the allocation, either MACD confirmation must sharpen into genuine accumulation (not just flattening), or macro descriptors must shift—specifically, liquidity stress would need to turn off. The current setup is a trend-following rally in a macro regime that does not favor it.
Emerging Markets — IEMG
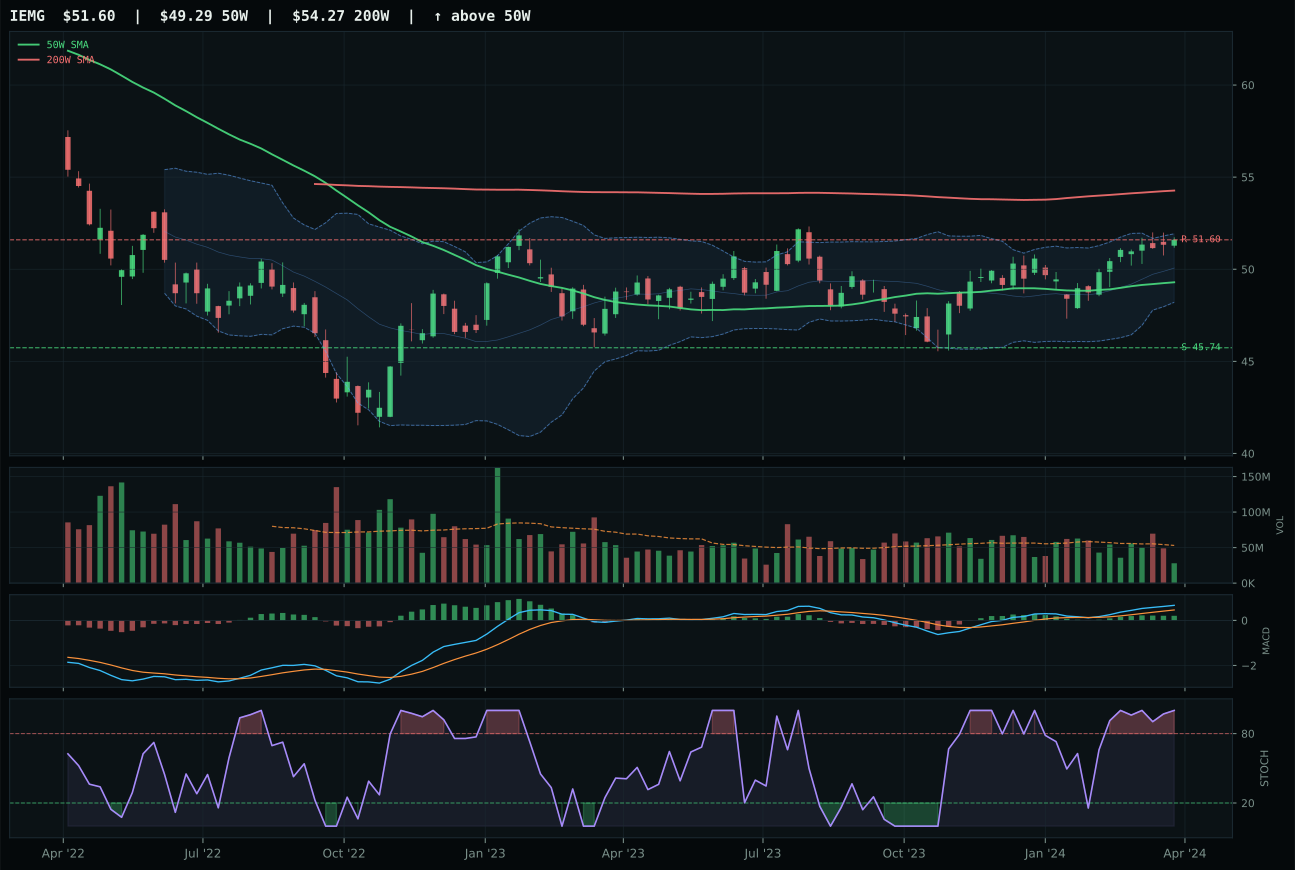
IEMG has a neutral structure profile with -8.0% 13-week relative strength versus SPY.
A failed hold above support would weaken the setup.
Actionable but governed by invalidation levels.
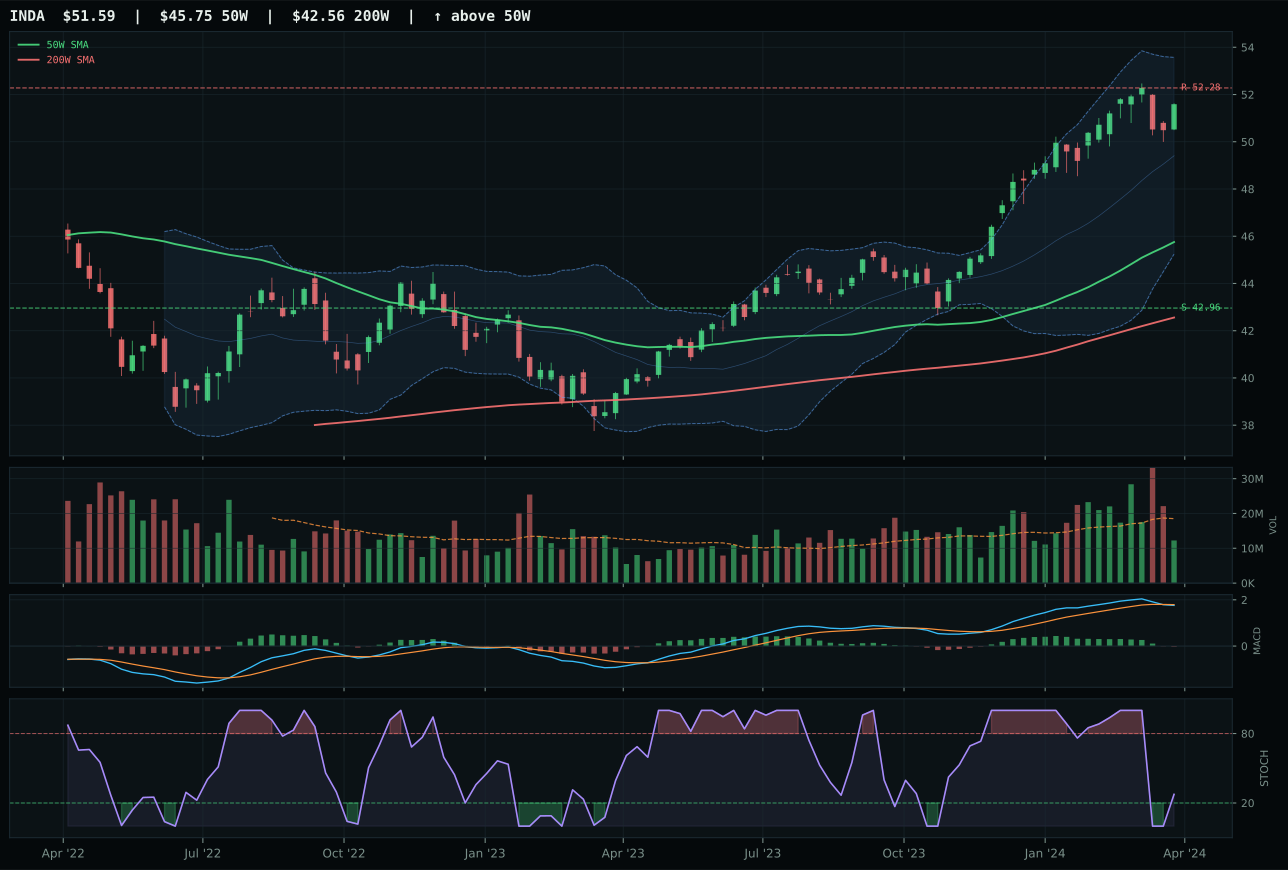
INDA has a neutral structure profile with -4.4% 13-week relative strength versus SPY.
A failed hold above support would weaken the setup.
Actionable but governed by invalidation levels.
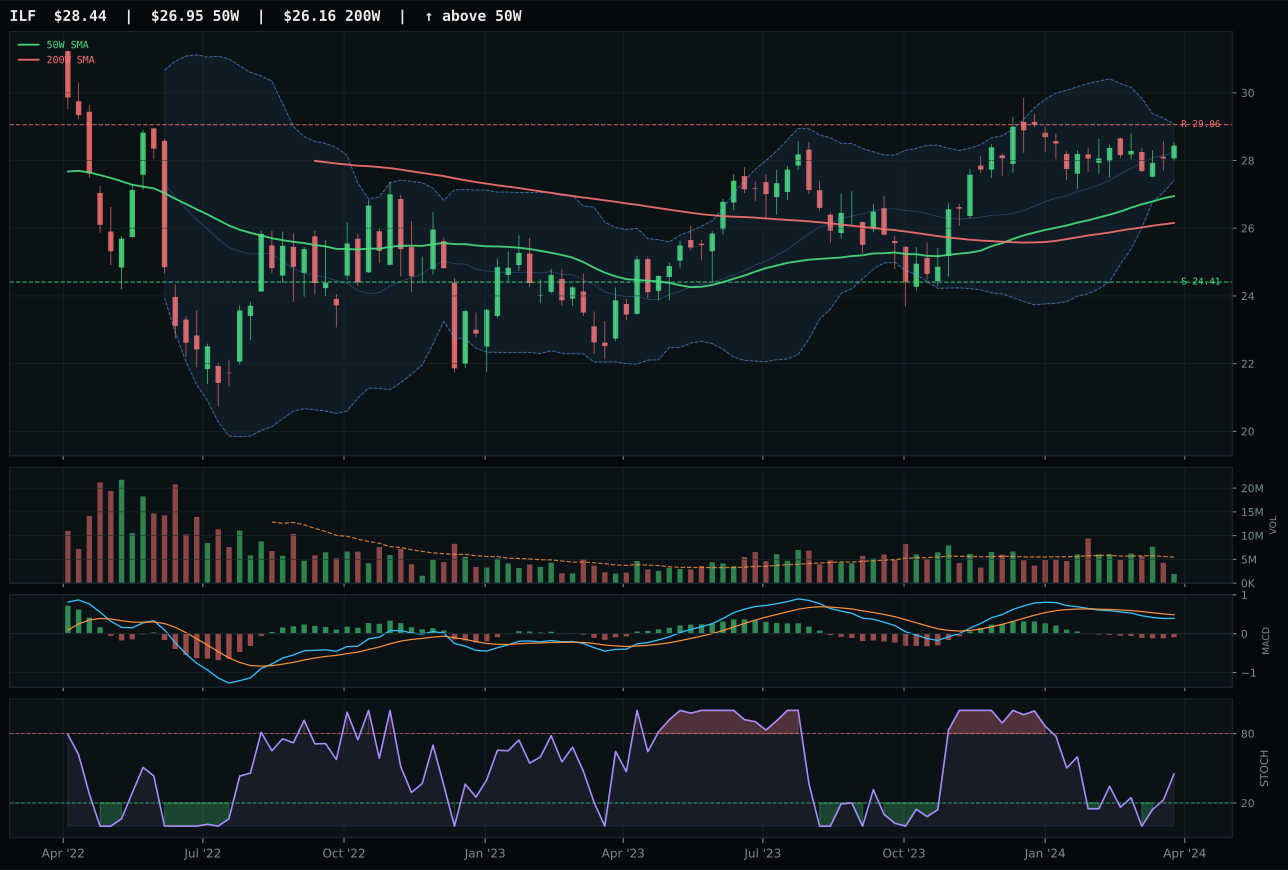
ILF has a neutral structure profile with -12.2% 13-week relative strength versus SPY.
A failed hold above support would weaken the setup.
Actionable but governed by invalidation levels.
IEMG wins a weak field with a 9.4-point margin over INDA, capturing category leadership despite both ETFs residing below their 200-week moving averages in a price structure that signals recovery risk rather than confirmed strength. IEMG's advantage derives from superior timing (90.0 vs 62.0), better risk/reward (56.2 vs 38.2), bullish-and-improving MACD (versus INDA's bearish/weakening), and cleaner entry setup—price sits just 4.7% from the 50-week moving average in the Fibonacci upper retracement zone, a textbook mean-reversion coil. INDA's extension to 12.8% from the 50-week MA and bearish momentum divergence make it a contrarian short-setup, not a long vehicle. Both suffer from severe macro headwinds (dollar pressure -10 to -14, credit stress -5 to -10), making this a category where technical setup must be pristine to overcome regime resistance.
Emerging Markets is excluded from the portfolio this week at 0% allocation, ranked 9th or 10th among all categories due to an anemic 12.2 composite score. The category's macro fit plummets to 15.0/100, ravaged by dollar-pressure headwinds (-14), credit stress (-10), liquidity stress (-10), and broad-market-bear signals (-9)—a four-point concurrent bearish setup that is nearly unprecedented this week. In late-cycle reflation, emerging markets face a uniqueness challenge: they benefit from commodity upside and real-asset rotation, yet suffer from dollar strength and capital outflows as U.S. rates remain elevated. IEMG's technical setup (timing 90.0, momentum 47.0) shows a mean-reversion structure, but mean reversions rarely work when macro headwinds are this severe. For Emerging Markets to re-enter allocation, either dollar-pressure descriptors must turn off (signaling Fed pivot or global rate equilibrium) or credit stress must subside (signaling improved financial conditions). Until then, the category is a contrarian long waiting for capitulation—technically interesting but macro-hostile.