
2024-03-22
Informational purposes only. The content in this report, including allocations, analysis, and commentary, is provided solely for informational and educational purposes. It does not constitute financial advice, investment advice, trading advice, or any other type of advice. Past performance does not guarantee future results. Always conduct your own research and consult a qualified financial professional before making investment decisions.
Weekly Allocation
| Ticker | Category | Weight | Role |
|---|---|---|---|
| FBTC | 50% | Overlay | |
| XLE | Traditional Energy | 10% | Top-2 (10%) |
| PAVE | Utilities & Infrastructure | 10% | Top-2 (10%) |
| SMH | AI | 5% | Tier-2 (5%) |
| SLV | Precious Metals | 5% | Tier-2 (5%) |
| XAR | Defense & Aerospace | 5% | Tier-2 (5%) |
| XLK | Technology | 5% | Tier-2 (5%) |
| NLR | Nuclear Energy | 5% | Tier-2 (5%) |
| COPX | Industrial Metals | 5% | Tier-2 (5%) |
Trade Instructions — Monday Open
Sell the tranche from 2024-02-23 (completing its 4-week hold). Buy the new tranche. Instructions show net portfolio changes — same-asset positions cancel, weight changes show the delta.
| Action | Ticker | Instruction |
|---|---|---|
| SELL | SMH | Sell 12% of SMH position (reduce 10.00% → 8.75%) |
| SELL | XLK | Sell 17% of XLK position (reduce 7.50% → 6.25%) |
| SELL | GLD | Sell 25% of GLD position (reduce 5.00% → 3.75%) |
| SELL | VEGI | Sell 50% of VEGI position (reduce 2.50% → 1.25%) |
| SELL | INDA | Sell 50% of INDA position (reduce 2.50% → 1.25%) |
| BUY | PAVE | Buy PAVE — 20.00% of freed cash (adds 1.25% to portfolio) |
| BUY | XLE | Buy XLE — 40.00% of freed cash (adds 2.50% to portfolio) |
| BUY | COPX | Buy COPX — 20.00% of freed cash (adds 1.25% to portfolio) |
| BUY | SLV | Buy SLV — 20.00% of freed cash (adds 1.25% to portfolio) |
Current Portfolio After Trade
Combined holdings across all 4 active tranches. Each tranche is 25% of the portfolio.
| Ticker | % of Portfolio | Weight Bar |
|---|---|---|
| FBTC | 50.00% | |
| SMH | 8.75% | |
| XLK | 6.25% | |
| PAVE | 6.25% | |
| XLE | 6.25% | |
| XAR | 5.00% | |
| NLR | 5.00% | |
| GLD | 3.75% | |
| COPX | 3.75% | |
| SLV | 2.50% | |
| VEGI | 1.25% | |
| INDA | 1.25% |
Macro Regime — Transition / Mixed
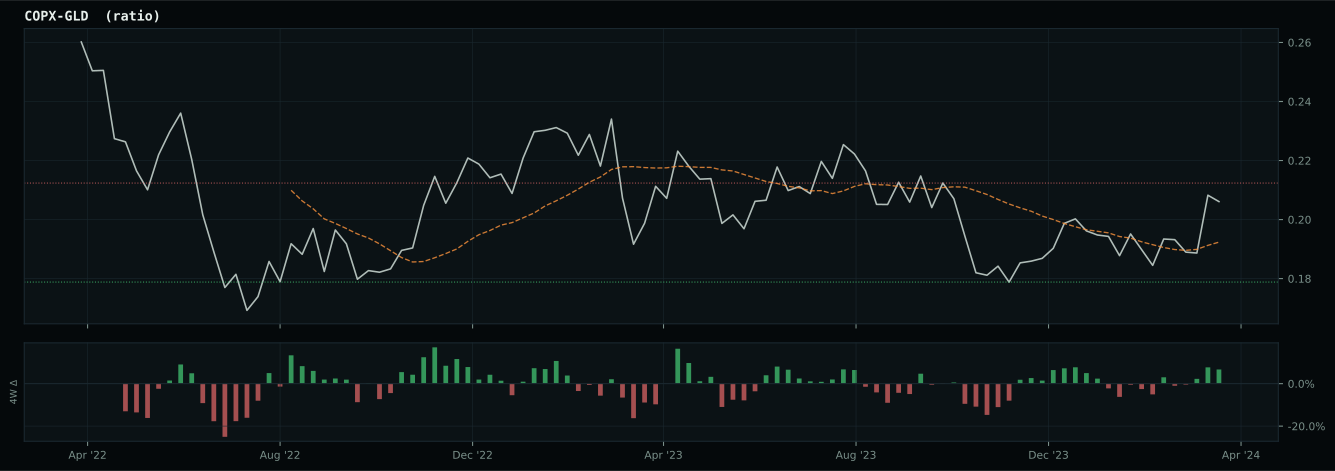
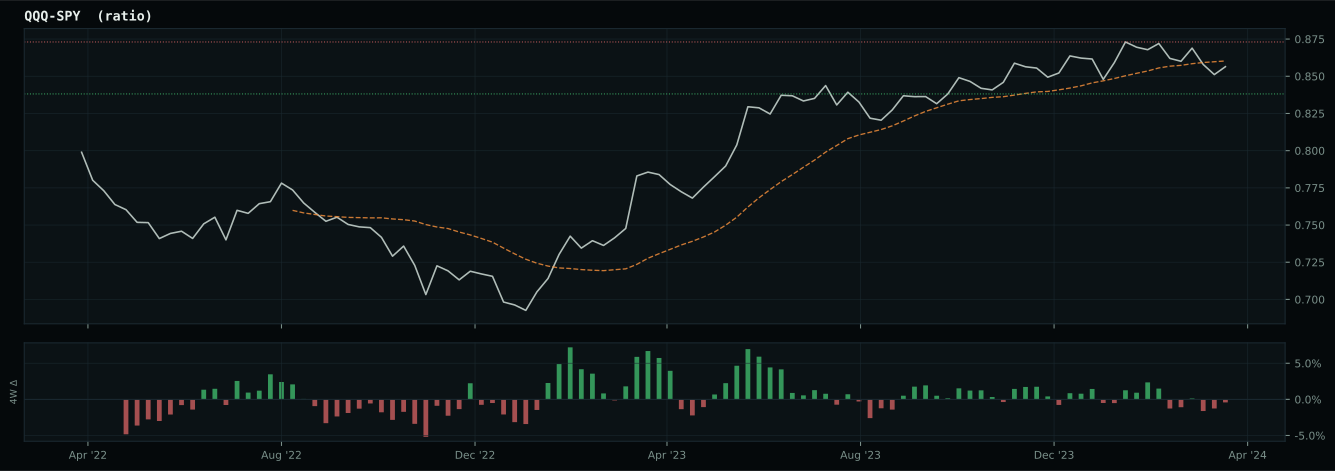
Macro Evidence Charts
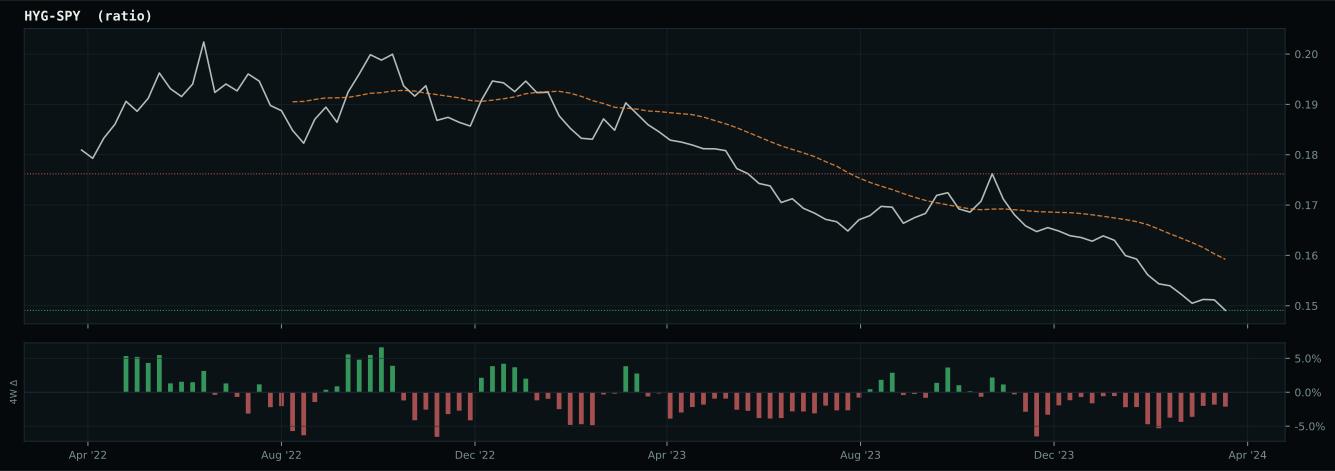
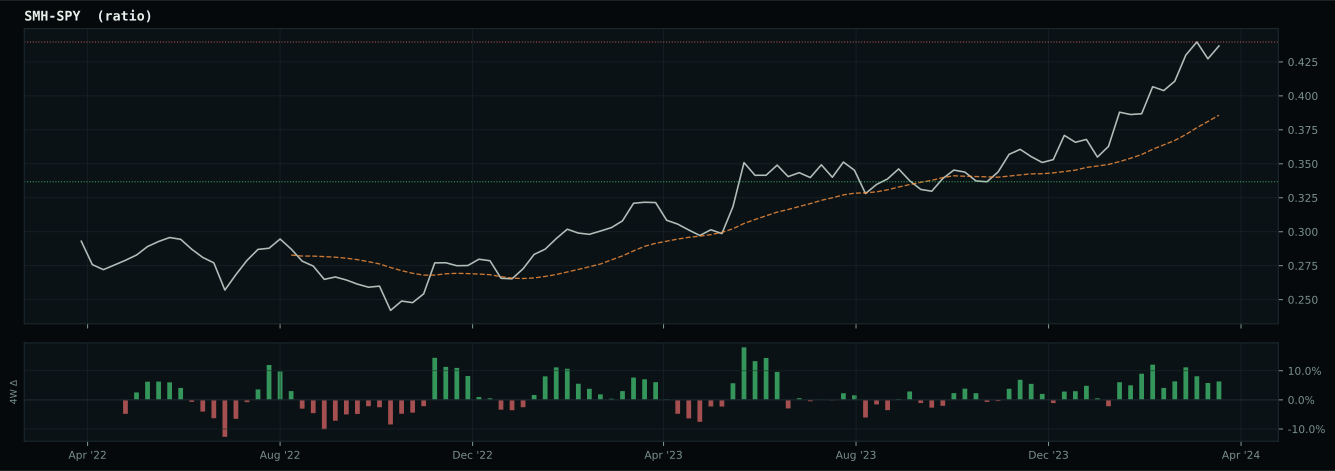
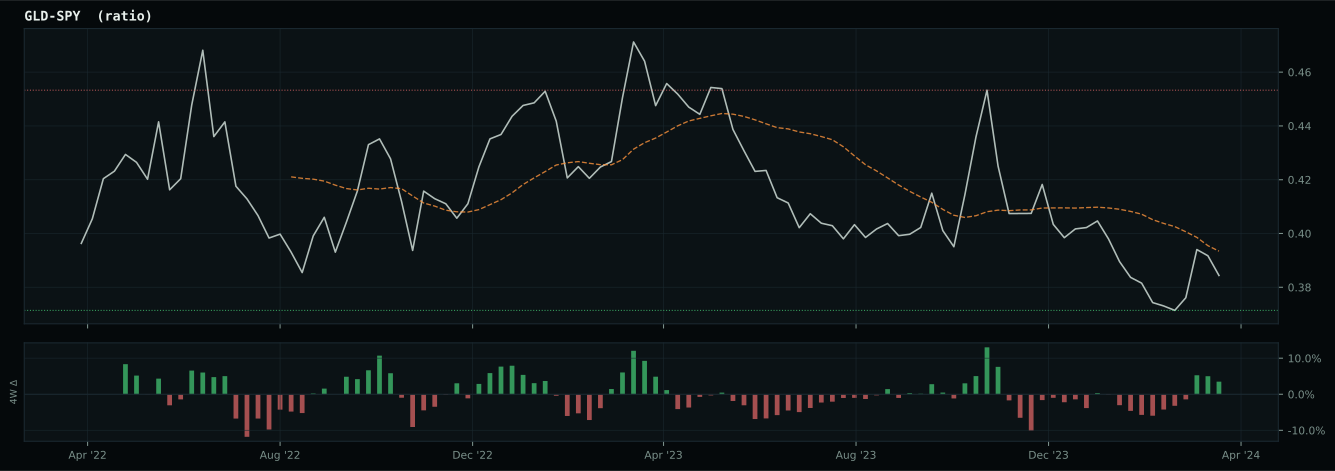
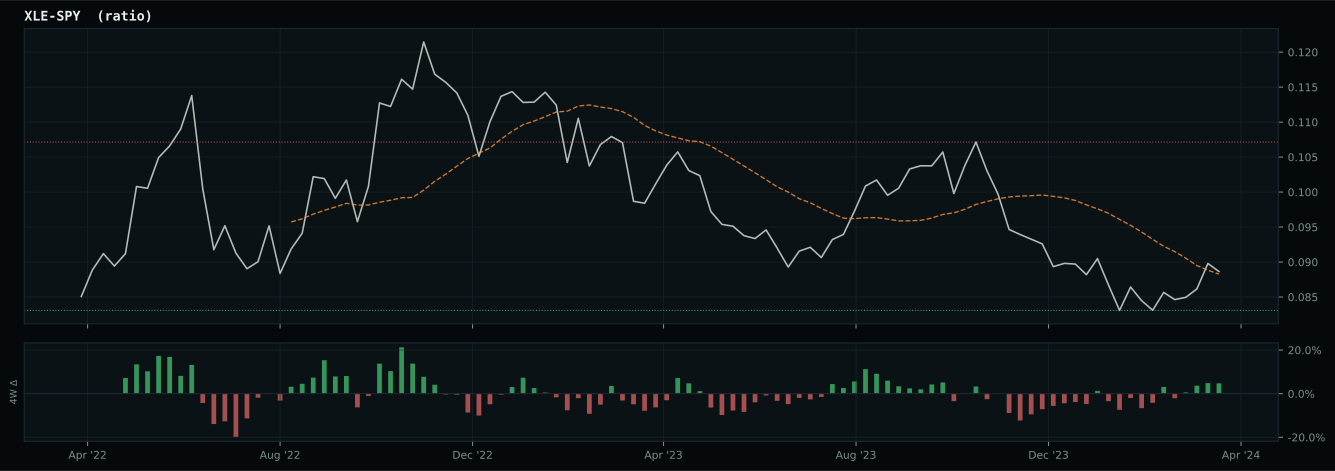
Market-implied signals behind the macro regime scores. Each ratio compares two assets; the direction and slope of the ratio is what the macro engine reads.
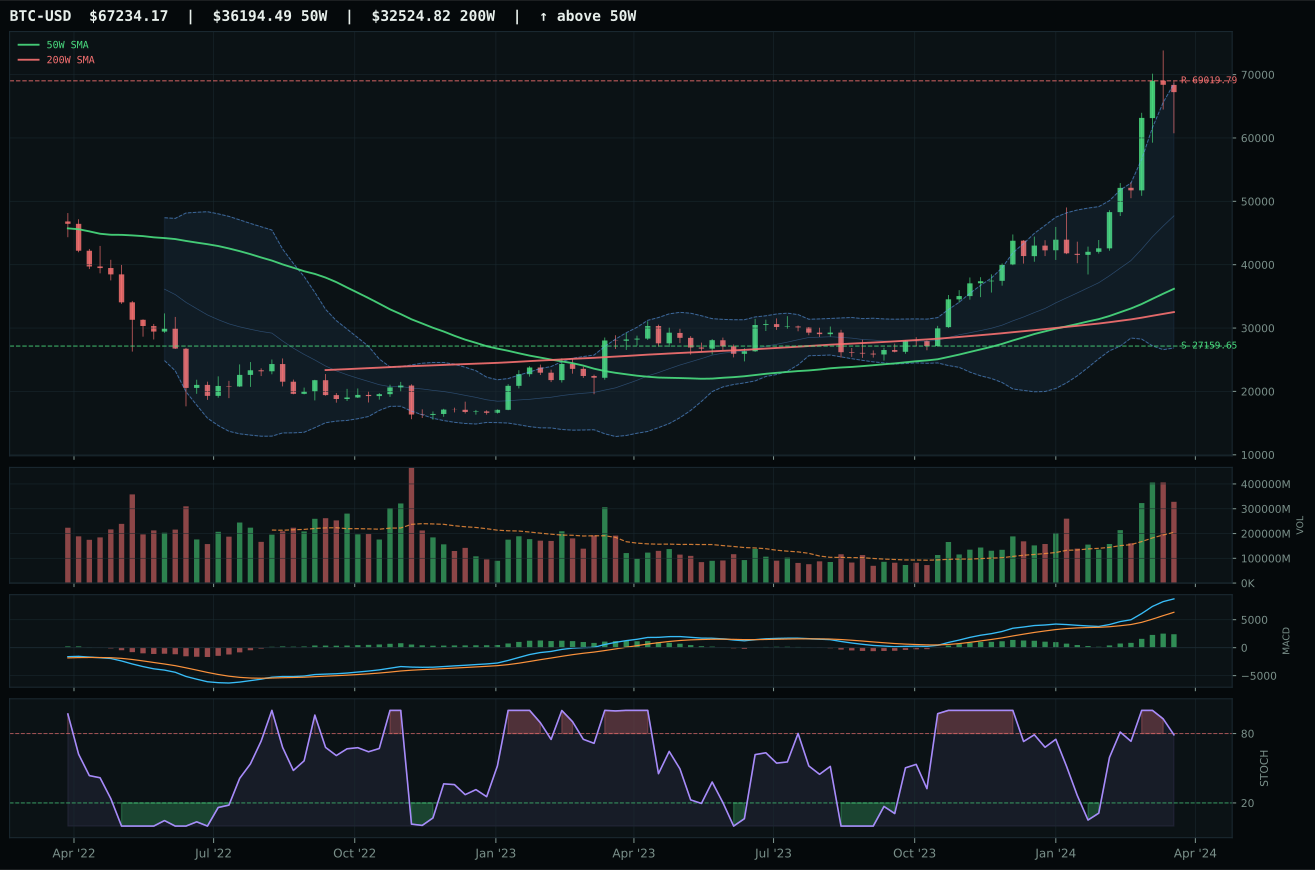
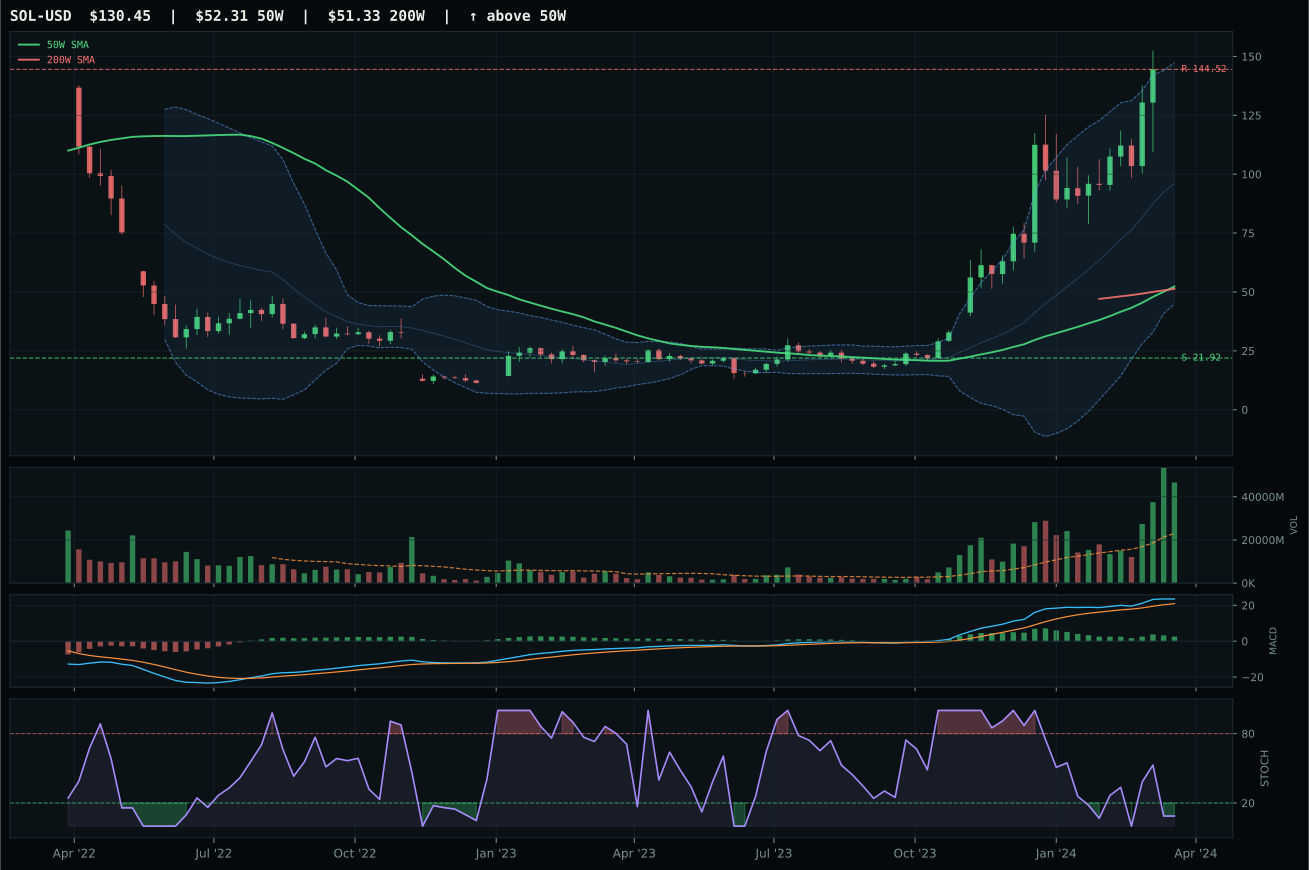
Crypto Regime — TrendBTC
post-touch structure is too wide to count as a range; max/min close ratio is 3.17
TrendBTC confirmed: 2 consecutive closes above rising/flat 50W SMA
one or more available conditions failed
Category Rankings
| Rank | Category | Winner | Score | Alloc | 4W Ret | Peers (4W) |
|---|---|---|---|---|---|---|
| 1 | Traditional Energy | XLE | 62.7 | 20% | +1.89% | XOP +0.9% · FCG +2.1% |
| 2 | Utilities & Infrastructure | PAVE | 57.5 | 20% | -4.70% | XLU +2.2% · IGF -0.9% |
| 3 | AI | SMH | 56.0 | 10% | -10.77% | AIQ -6.3% · BOTZ -9.1% |
| 4 | Precious Metals | SLV | 49.9 | 10% | +10.40% | GLD +7.5% · GDX +9.3% |
| 5 | Defense & Aerospace | XAR | 46.5 | 10% | -4.54% | ITA -1.8% · ROKT -4.7% |
| 6 | Technology | XLK | 44.2 | 10% | -6.69% | IGV -7.2% · CIBR -5.3% |
| 7 | Nuclear Energy | NLR | 42.8 | 10% | +0.71% | URA -0.2% · URNM -0.3% |
| 8 | Industrial Metals | COPX | 40.9 | 10% | +10.06% | PICK +3.2% · REMX -2.0% |
| 9 | Agriculture & Livestock | MOO | 15.7 | 0% | -3.02% | VEGI -1.3% · WEAT +0.0% |
| 10 | Emerging Markets | IEMG | 11.4 | 0% | -2.28% | INDA +2.5% · ILF -3.8% |
Traditional Energy — XLE
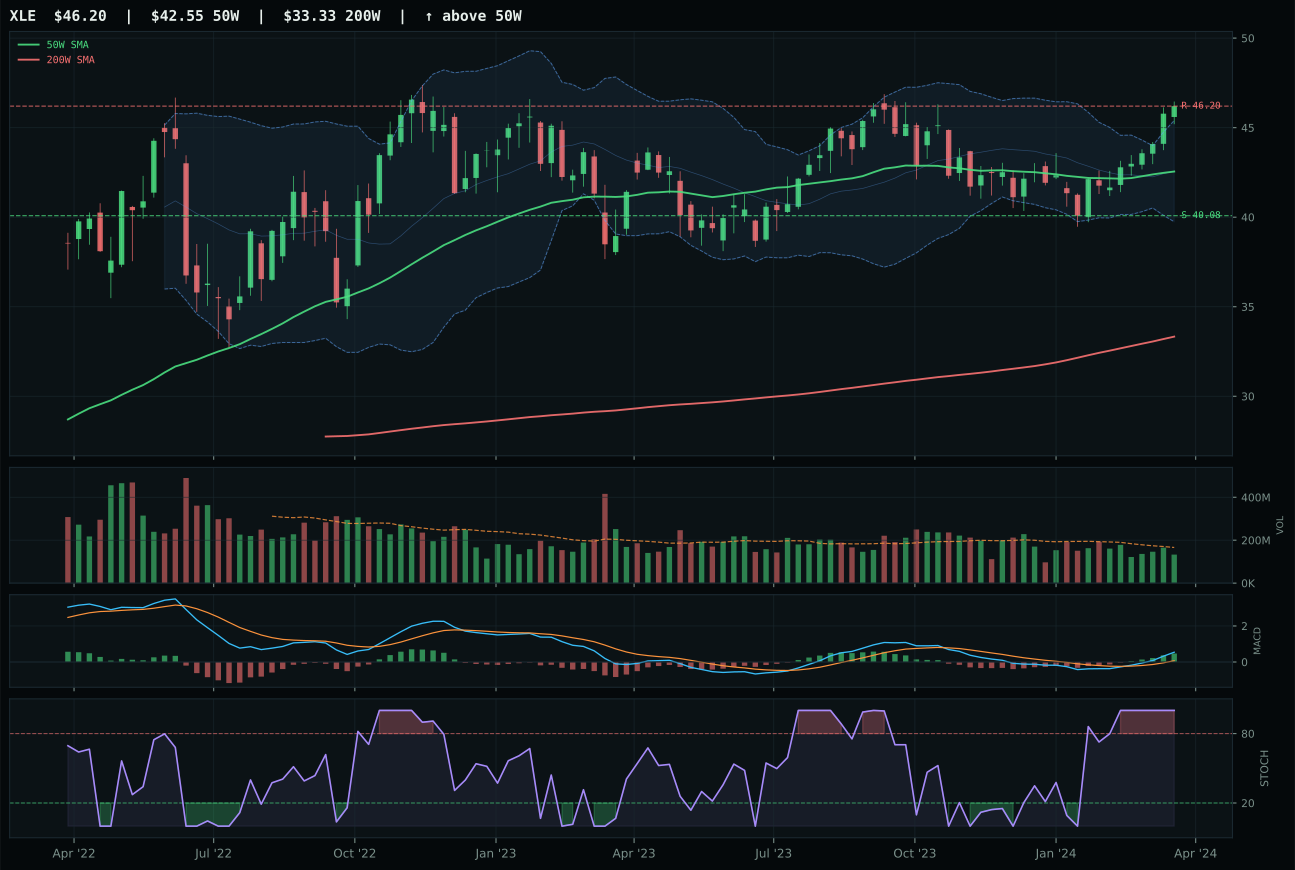
XLE has a neutral structure profile with -1.3% 13-week relative strength versus SPY.
A failed hold above support would weaken the setup.
Actionable but governed by invalidation levels.
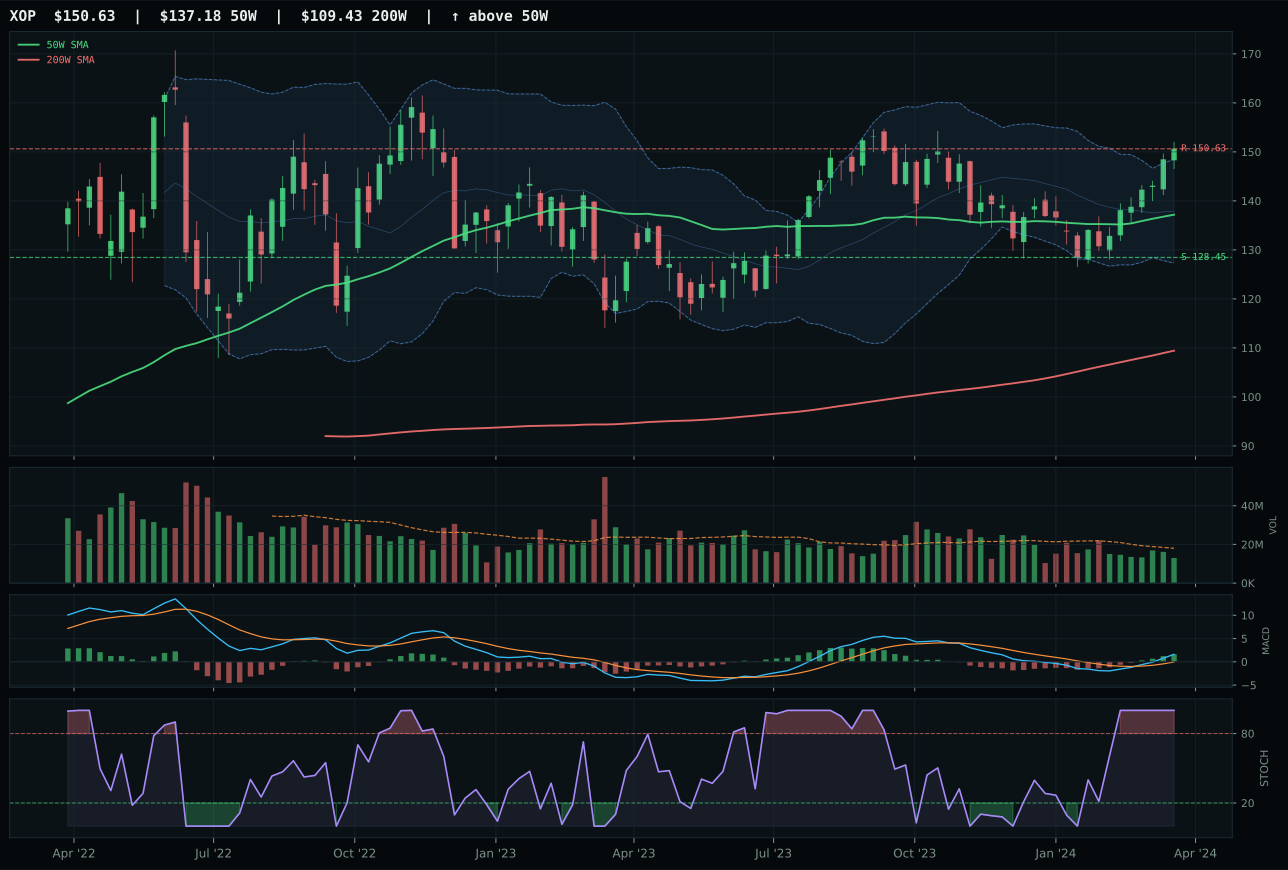
XOP has a neutral structure profile with -1.6% 13-week relative strength versus SPY.
A failed hold above support would weaken the setup.
Actionable but governed by invalidation levels.
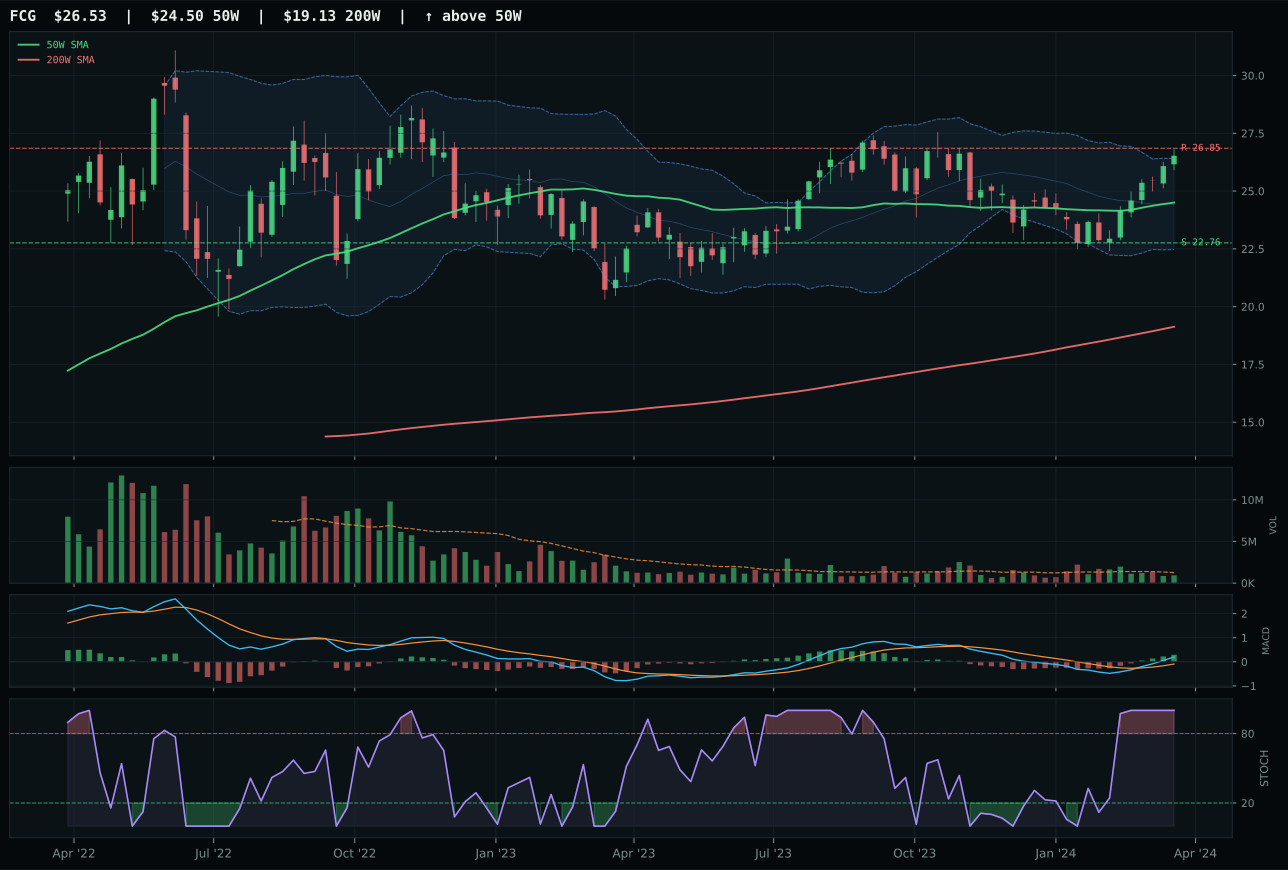
FCG has a neutral structure profile with -2.0% 13-week relative strength versus SPY.
A failed hold above support would weaken the setup.
Actionable but governed by invalidation levels.
XLE wins with a near-perfect 98.0/100 trend score and 81.5/100 momentum confirmation—the strongest absolute trend scores in the entire 10-category portfolio. Price sits above both the 50W and 200W with a robust 0.2% slope, and the 13W return of 8.7% with +0.3% category-relative strength means every competitor is being outpaced from within the category itself. Against XOP, the gap is razor-thin (0.2 points), but the decisive factor is structure: XLE's 77.4/100 structure (clean, well-compressed) beats XOP's 74.8/100, and critically, XLE's neutral volume (0.80x) versus XOP's thin participation (0.67x) tells you that institutional buyers are choosing XLE over exploration beta. Energy scarcity is active (+14–16 points), and this macro signal is finding its clearest expression through the integrated energy cash-flow story rather than the exploratory upside.
Traditional Energy is one of only two top-2 overweights at 10% allocation, with a 62.7 composite score. Energy scarcity (+16) and real asset sponsorship (+7) provide +23 points of macro support, overwhelming the -7 to -7 hits from liquidity and credit stress. The technical evidence (78.4/100) is the second-strongest in the portfolio after Utilities & Infrastructure, confirming that XLE's trend is not a function of macro narrative alone but a genuine price-momentum expression. In a Transition/Mixed regime, energy is one of the few categories that benefits from both regime uncertainty (prices rise as real assets become scarce) and the specific macro descriptor activation (energy scarcity). The 10% allocation reflects that this is one of the two cleanest setups available: trend is intact, structure is neutral (not extended), and volume-price confirmation is present. Energy's risk is that it is overbought stochastically (1.00), meaning the next 5–10% move could be a consolidation. However, as a top-2 slot in a 50% overlay regime, the 10% is appropriate sizing for a core hedge against continued scarcity premiums.
Utilities & Infrastructure — PAVE
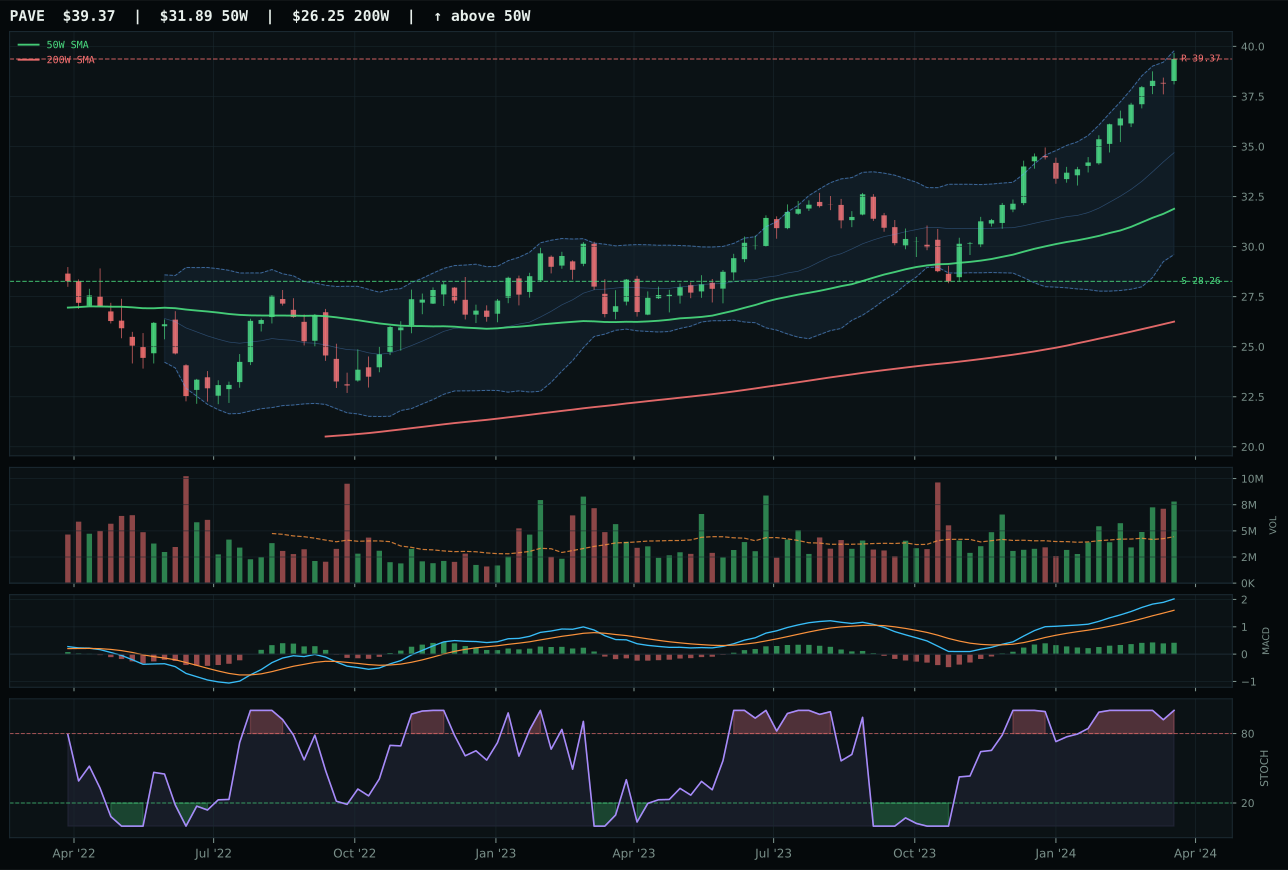
PAVE has a vertical extension profile with 4.1% 13-week relative strength versus SPY.
A failed hold above support would weaken the setup.
Actionable but governed by invalidation levels.
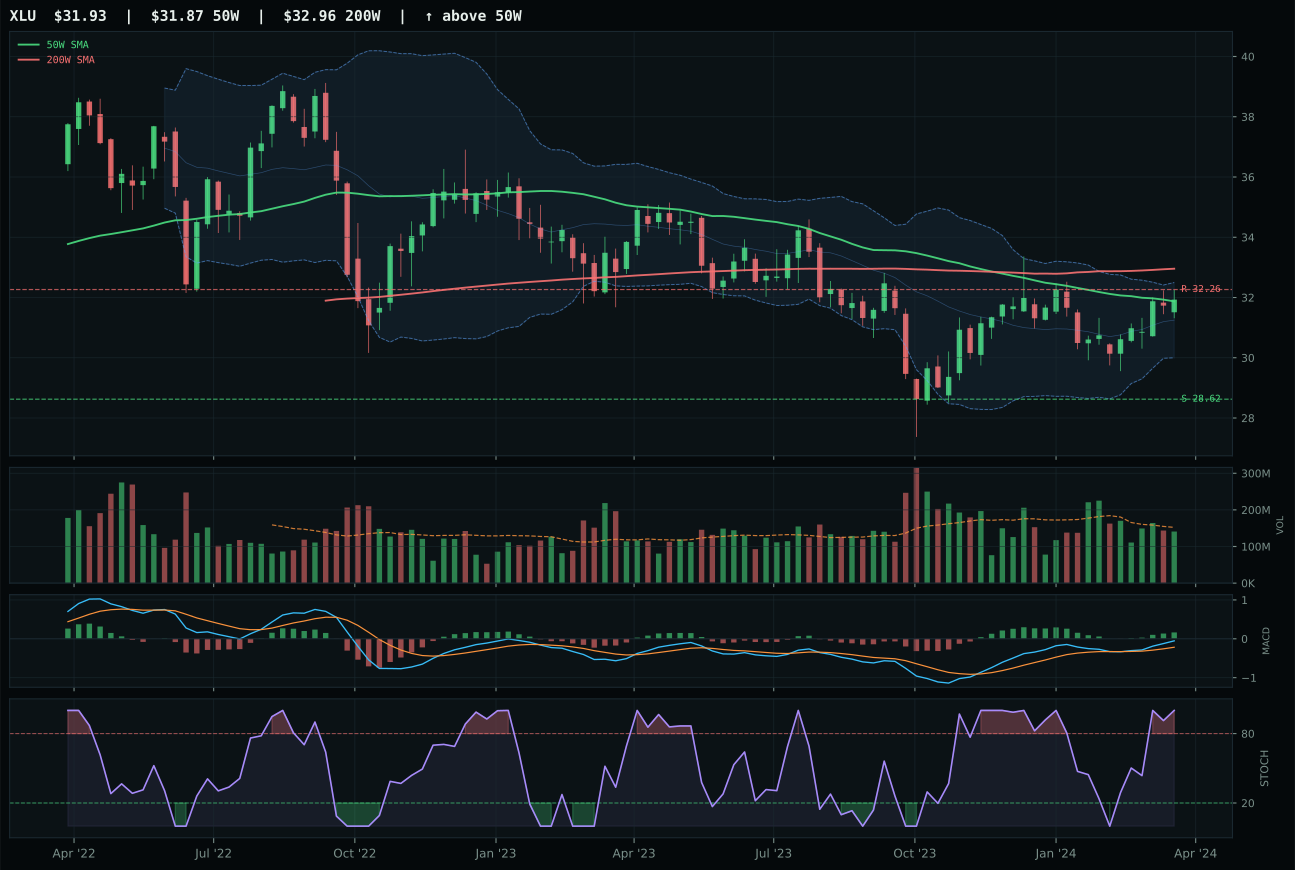
XLU has a compression near 50W profile with -8.1% 13-week relative strength versus SPY.
A failed hold above support would weaken the setup.
Actionable but governed by invalidation levels.
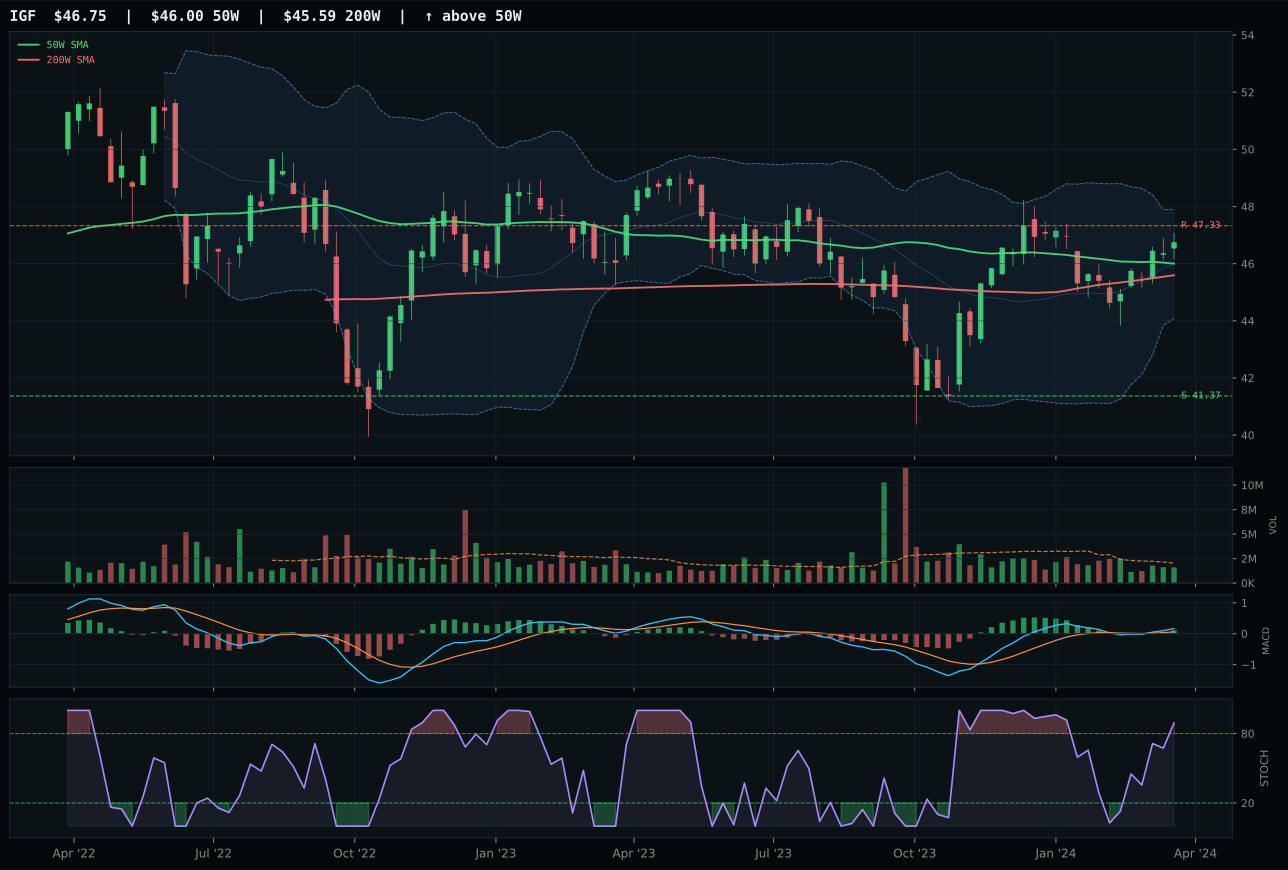
IGF has a compression near 50W profile with -10.4% 13-week relative strength versus SPY.
A failed hold above support would weaken the setup.
Actionable but governed by invalidation levels.
PAVE wins decisively with a rare 100.0/100 trend score and 100.0/100 momentum confirmation—the highest combined scores in the entire portfolio. The setup is exceptional: price sits 23.5% above the 50W, yet this extension is not a red flag; instead, it is being met with 1.76x volume participation classed as accumulation/confirmation, indicating that institutional buyers are willing to chase the breakout. The structure score of 89.3/100 (the highest in the portfolio) shows this vertical extension is clean and well-compressed, not a shaky climactic breakout. Against XLU, which shows compression near the 50W with neutral volume and only +2.0% 13W return versus PAVE's +14.1%, PAVE is simply in a different momentum league. The 2.8-point gap masks an enormous relative-strength advantage: +12.1% category-relative strength versus XLU's 0.0% means PAVE is being accumulated while utilities-as-defensive are being rotated away from.
Utilities & Infrastructure is one of only two top-2 overweights at 10% allocation, with a 57.5 composite score—the highest in the portfolio alongside energy. The technical evidence is extraordinary (100.0/100 for the representative ETF), while macro fit is modest (47.0/100) but still positive. Commodity breadth (+4) and risk appetite (+4) provide support, while liquidity and credit stress subtract -6 and -5. The reason this category earned top-2 despite modest macro support is pure technical dominance: PAVE's perfect trend and momentum scores, combined with its exceptional volume-price confirmation (91.2/100), create an asymmetric setup that overrides macro concerns. The 10% allocation reflects this: in a mixed regime, the cleanest technical stories earn the largest slots, and PAVE is objectively the cleanest setup in the portfolio. The risk is entry: at 23.5% extended above the 50W with overbought stochastic, the next 10–15% move could be consolidation rather than continuation. However, at top-2 weighting in a 50% overlay regime, the 10% slot is sized appropriately for a category with genuine institutional accumulation behind it.
AI — SMH
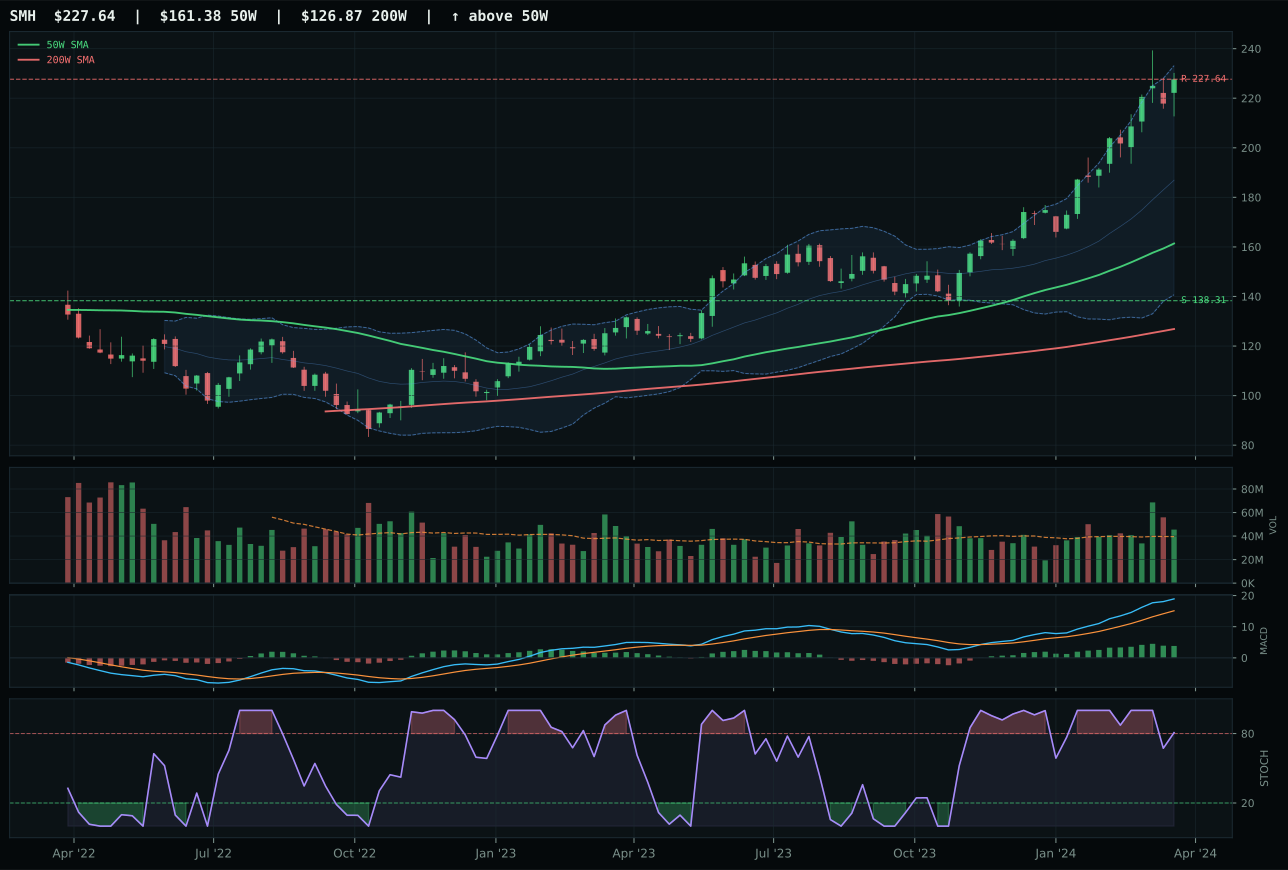
SMH has a vertical extension profile with 21.3% 13-week relative strength versus SPY.
A failed hold above support would weaken the setup.
Actionable but governed by invalidation levels.
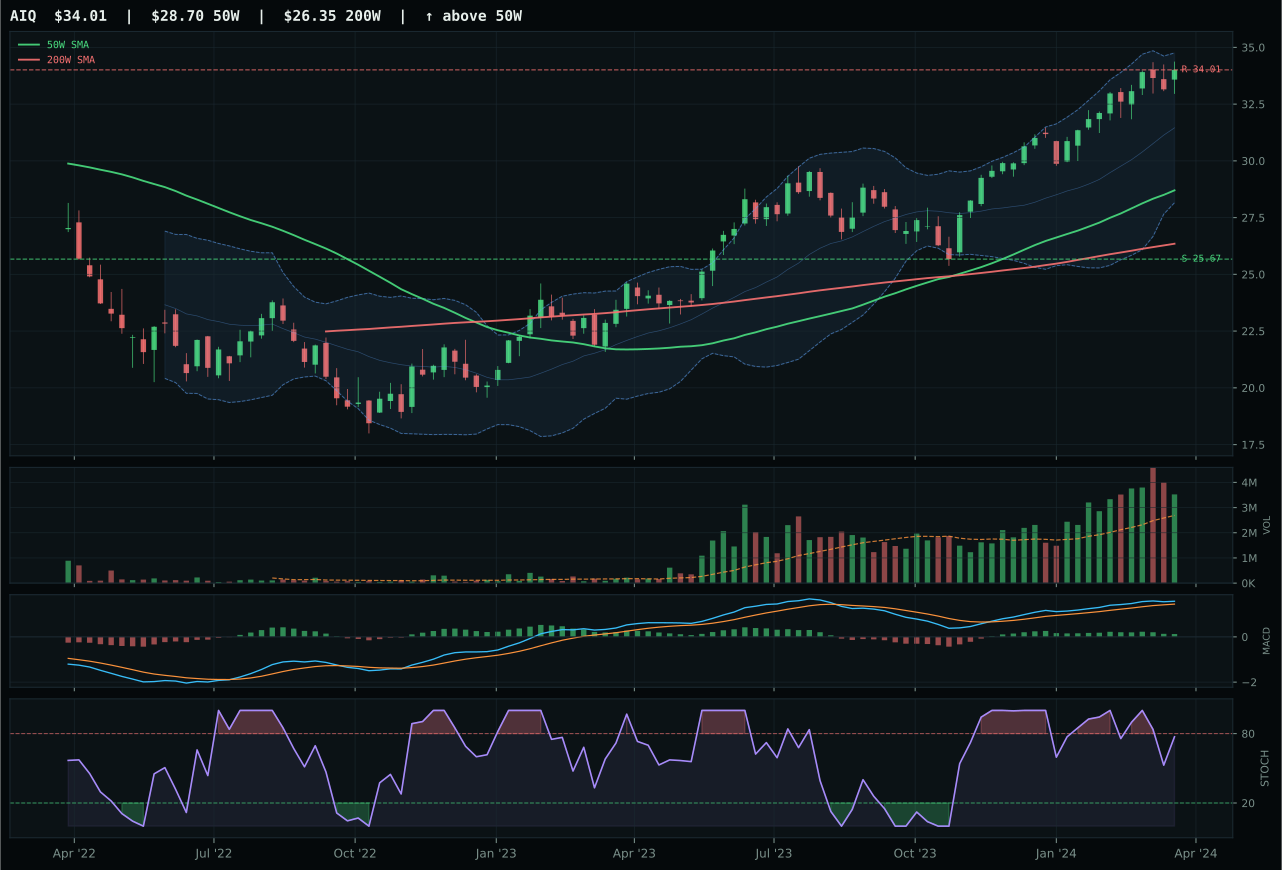
AIQ has a vertical extension profile with -0.4% 13-week relative strength versus SPY.
A failed hold above support would weaken the setup.
Actionable but governed by invalidation levels.
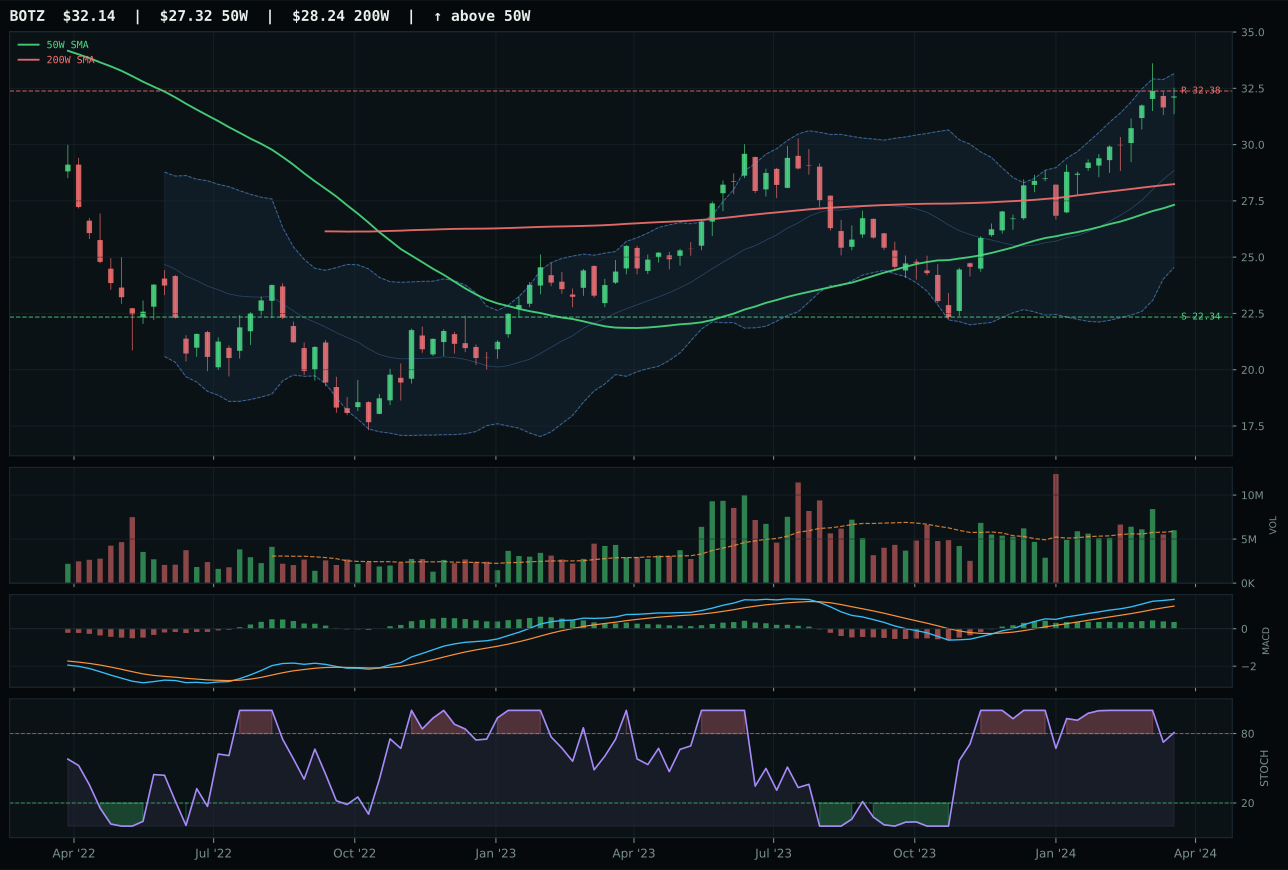
BOTZ has a vertical extension profile with 3.2% 13-week relative strength versus SPY.
A failed hold above support would weaken the setup.
Actionable but governed by invalidation levels.
SMH wins with a perfect 100.0/100 trend score and equally impressive 100.0/100 momentum confirmation—a rare combination that reflects both structural leadership and immediate buying pressure. The semiconductor thesis is underwritten by a 31.4% 13-week return and +21.3% SPY-relative strength, metrics that dwarf AIQ's trailing +9.7% and -0.4% SPY-relative performance. Against AIQ, SMH's MACD is not only bullish but improving, while AIQ's flattens; SMH's stochastic RSI is overbought and rolling over (a sign of fresh distribution hitting a climactic high), while AIQ remains in neutral territory. The 0.1-point score gap masks a critical technical edge: SMH's above-average 1.15x volume participation at the extension confirms that the 41.1% move above the 50W is being accumulated, not distributed. This is the setup of a category leader that has earned the trust of institutions.
AI ranks third overall at 56.0 and receives 5% allocation as a tier-2 category despite exceptional technical scores. The tension is clear: SMH's momentum is undeniable, but the macro regime actively penalizes it. Liquidity stress and broad market bear are each -8 to -12 points, more than offsetting the +14 AI growth sponsorship. The category's 62% weighting toward technical evidence versus 38% macro means the setup quality alone cannot overcome the regime headwind. At 41.1% extended above the 50W with stochastic RSI already rolling over, the risk asymmetry has shifted—every new buyer is buying the extension, not the trend. AI would reclaim top-2 status only if the macro backdrop shifts toward risk-on conditions that persist beyond the current mixed state, or if liquidity stress reverses. For now, the 5% sleeve honors the momentum while respecting the timing risk.
Precious Metals — SLV
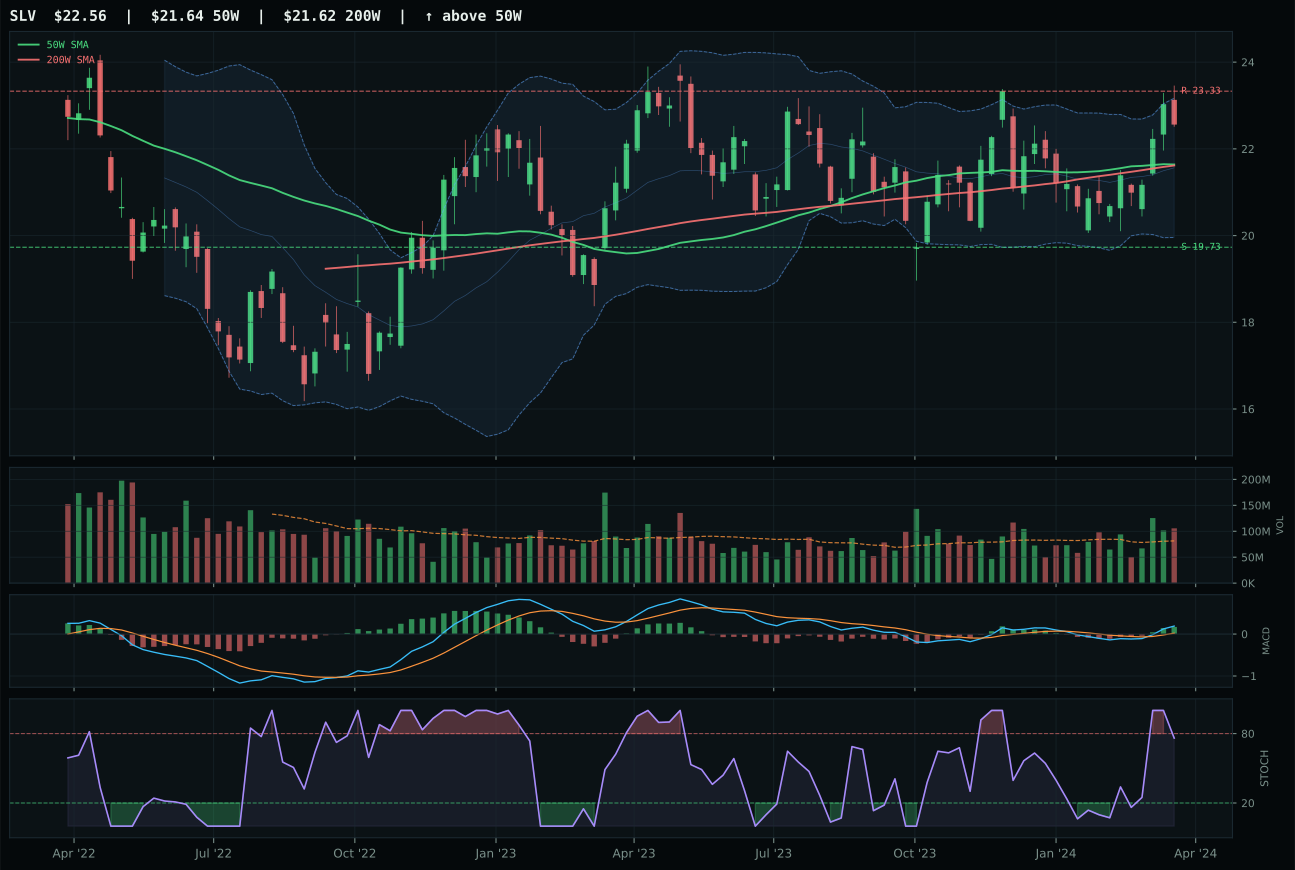
SLV has a neutral structure profile with -8.1% 13-week relative strength versus SPY.
A failed hold above support would weaken the setup.
Actionable but governed by invalidation levels.
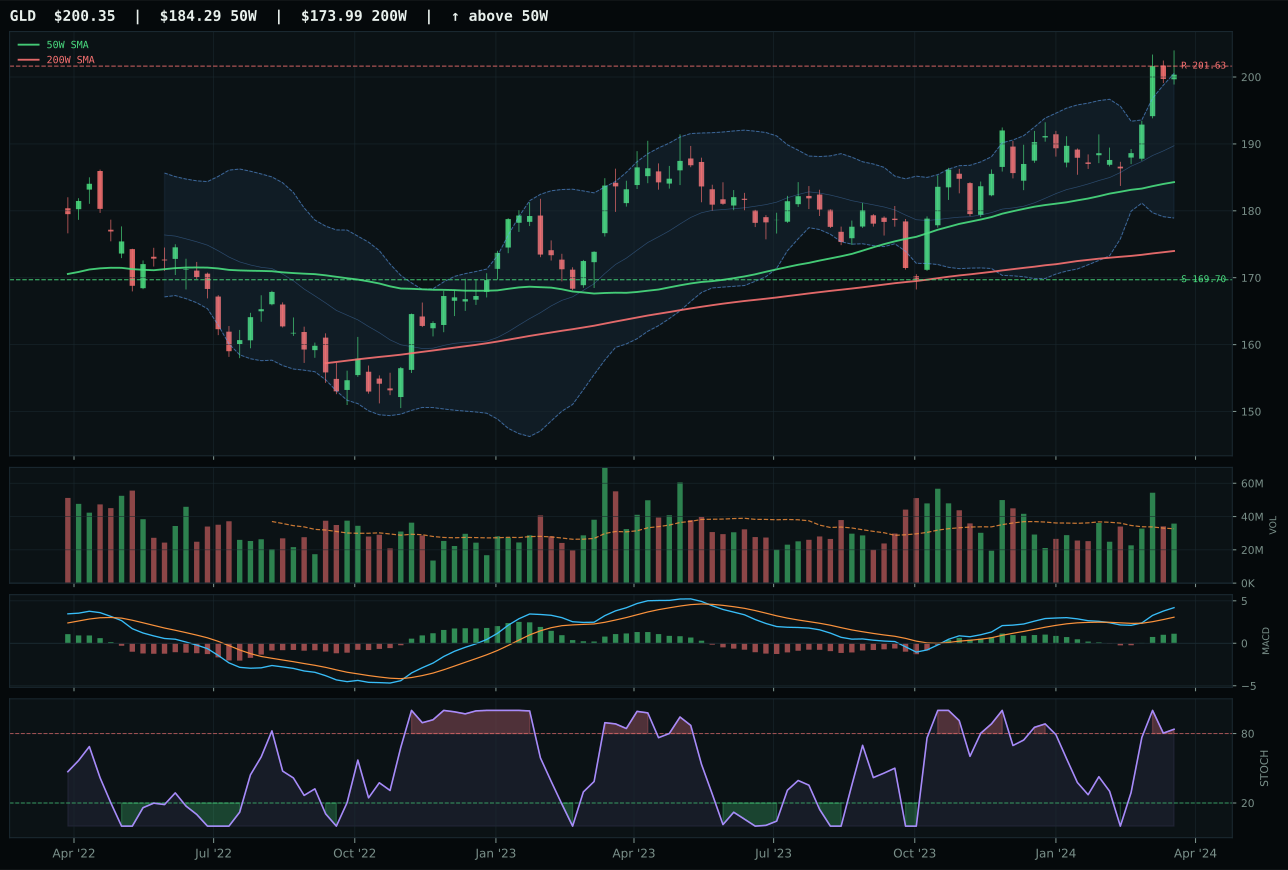
GLD has a neutral structure profile with -4.7% 13-week relative strength versus SPY.
A failed hold above support would weaken the setup.
Actionable but governed by invalidation levels.
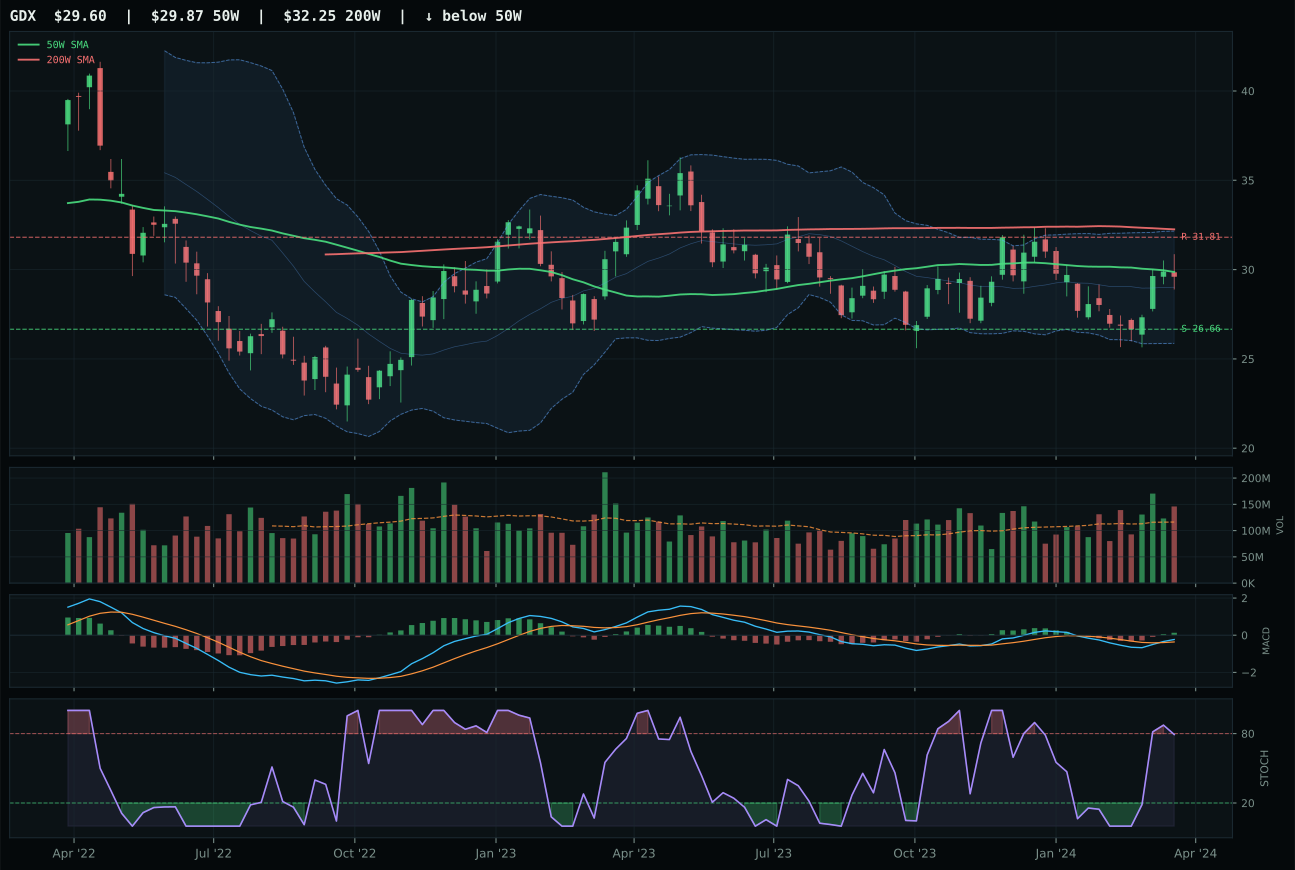
GDX has a compression near 50W profile with -16.3% 13-week relative strength versus SPY.
Extension and support failure are the main tactical risks.
Tracked, but not top-2 eligible because: structurally broken.
SLV wins the category with a 98.0/100 timing score—the highest in this group—driven by sitting just 4.3% from the 50W moving average in a rising-mid-zone stochastic pattern. This proximity to the moving average while above it is the ideal entry window before extension: MACD is bullish and improving, volume at 1.30x is above-average, and the setup has not yet climbed into overbought extremes. Against GLD, which shows overbought momentum stochastic rolling over, SLV is earlier in its cycle and therefore less vulnerable to distribution. The -2.3-point score difference is deceiving; it masks a critical timing asymmetry: GLD is already rolling over while SLV is still accelerating into its momentum phase. SLV's 4W return of +7.5% versus GLD's +5.3% confirms the metal is attracting fresh accumulation rather than experiencing a late squeeze.
Precious Metals earns 5% allocation as a tier-2 category with a 49.9 composite score, holding its position despite macro headwinds. Dollar pressure and risk-appetite-negative conditions each subtract points, but metals scarcity (+7) and modest commodity breadth support provide ballast. The macro fit at 49.0/100 is neutral-to-slightly-positive, reflecting that in a Transition/Mixed regime, precious metals act as neither pure hedges nor momentum bets. SLV's edge—its superior timing into the 50W—is exactly the kind of asymmetry that justifies a tier-2 slot: the setup is early enough in its cycle to offer reasonable risk-reward, yet constrained by flat momentum breadth. Precious metals would advance to top-2 only if either risk-off conditions accelerate (triggering hard defensive filters) or if the dollar pressure reverses dramatically. For now, 5% represents a measured hedge position without overcommitment to a category constrained by mixed macro conditions.
Defense & Aerospace — XAR
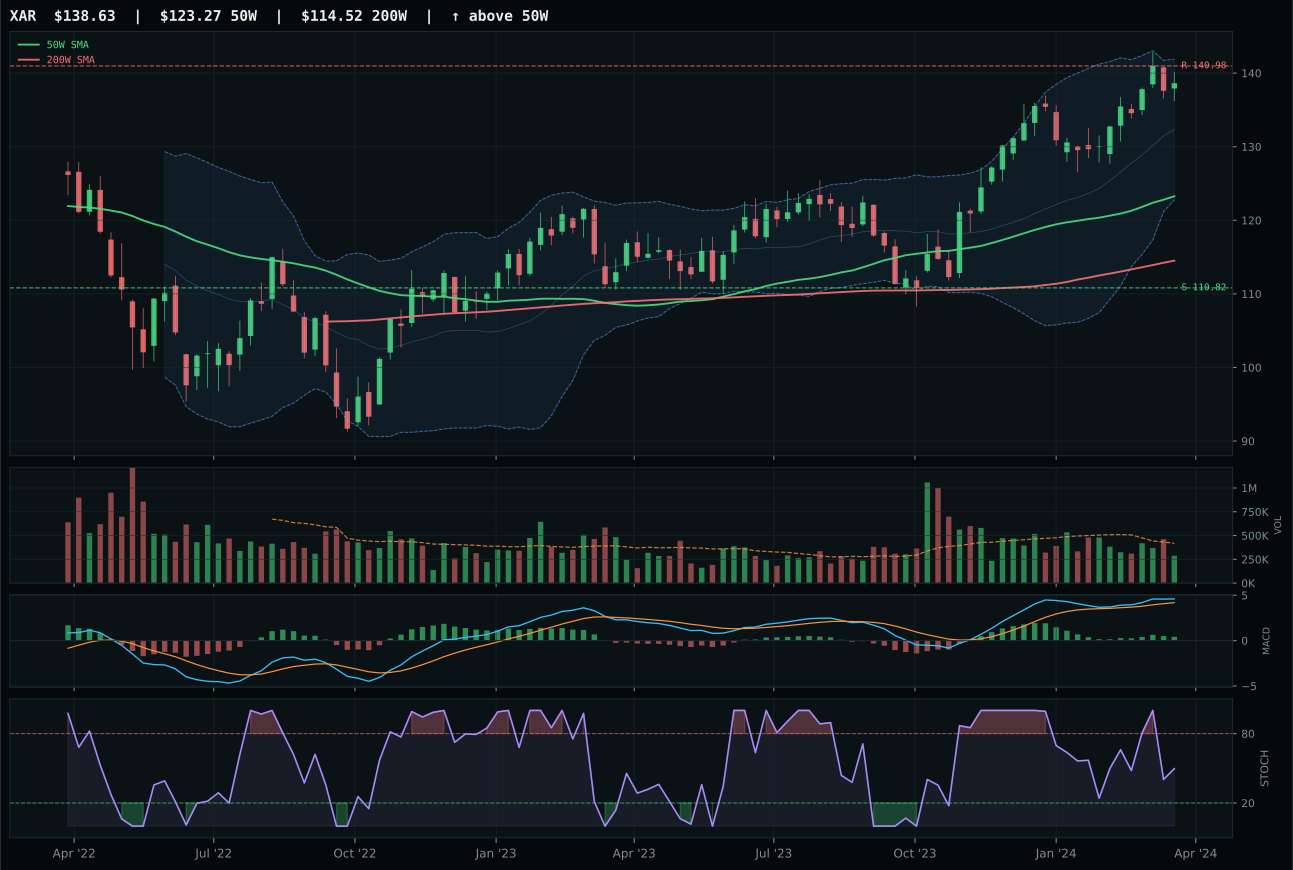
XAR has a neutral structure profile with -7.8% 13-week relative strength versus SPY.
A failed hold above support would weaken the setup.
Actionable but governed by invalidation levels.
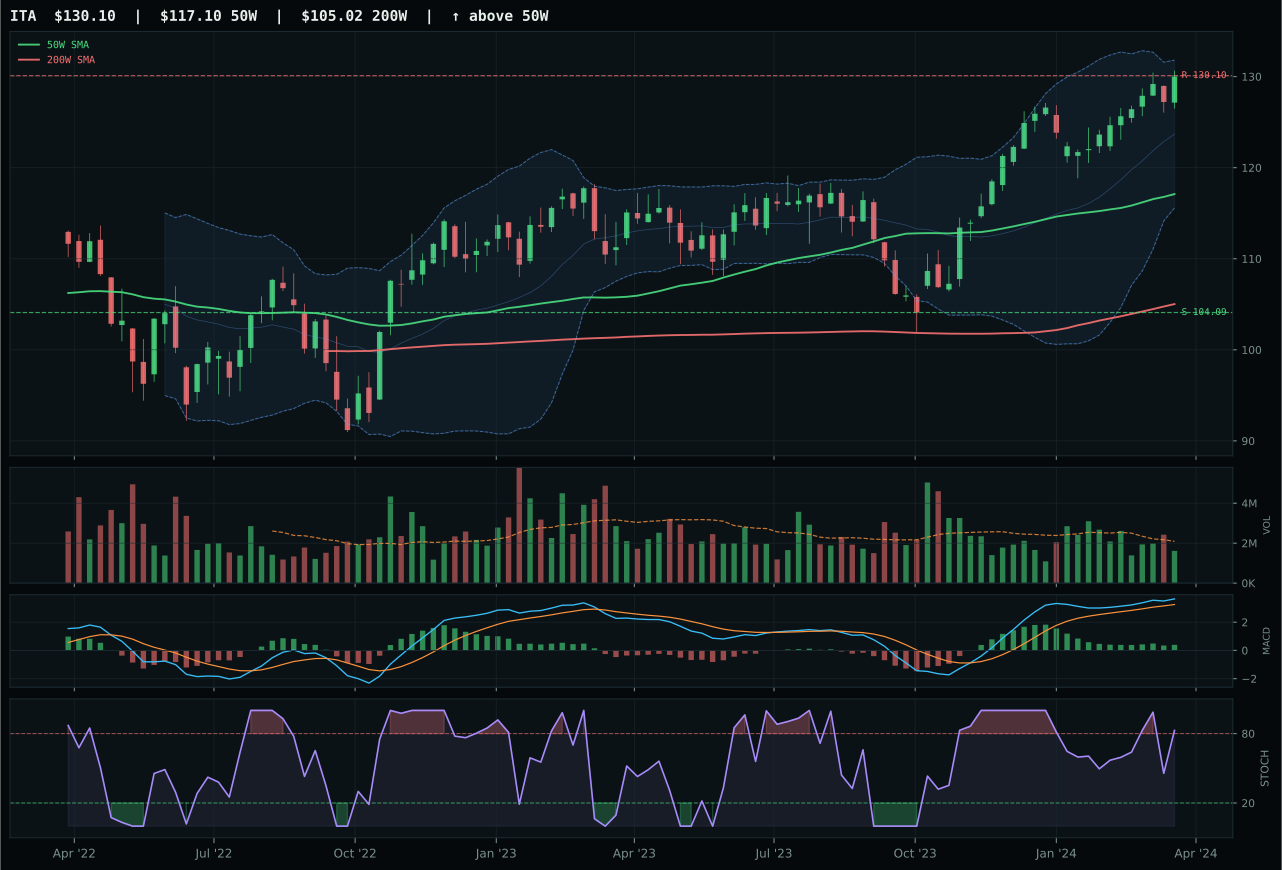
ITA has a neutral structure profile with -6.7% 13-week relative strength versus SPY.
A failed hold above support would weaken the setup.
Actionable but governed by invalidation levels.
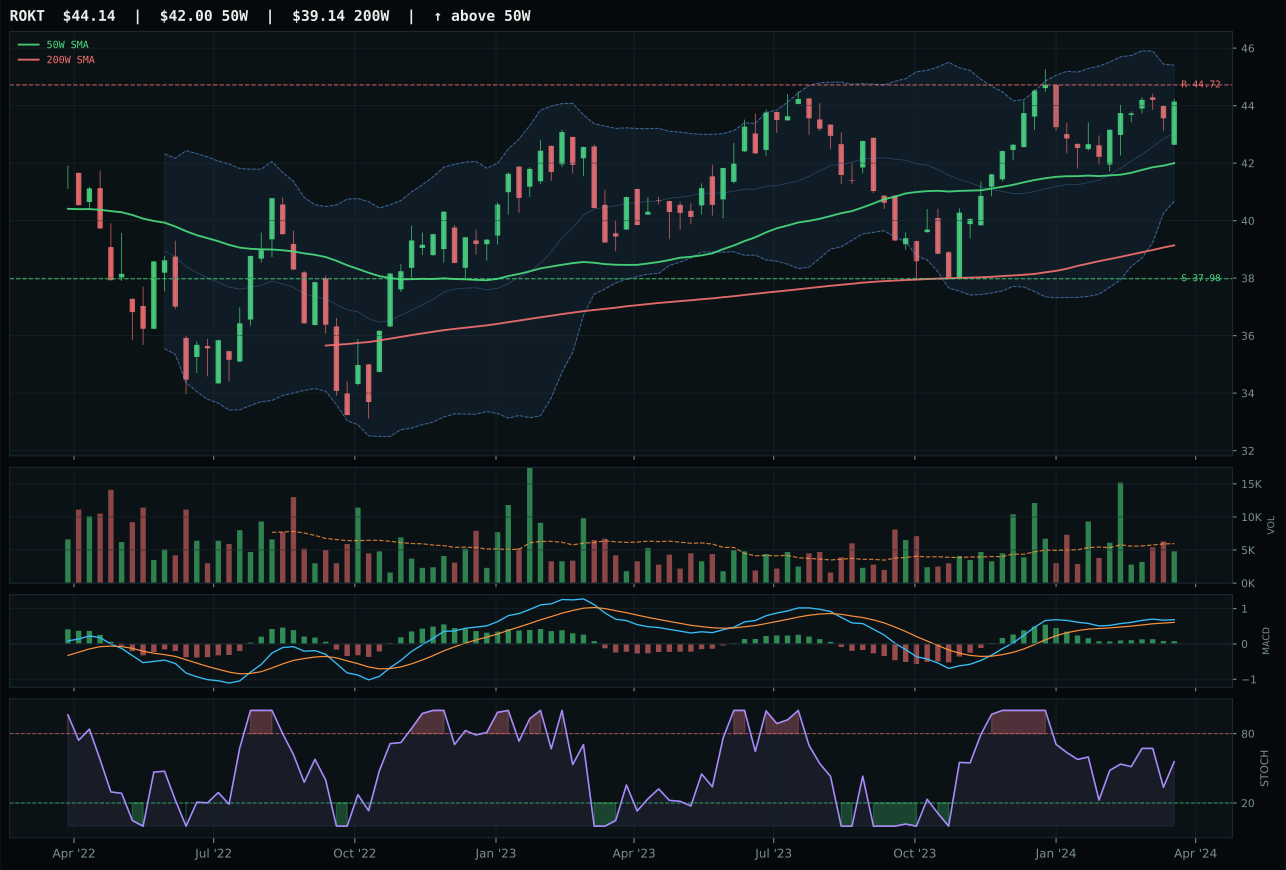
ROKT has a neutral structure profile with -10.9% 13-week relative strength versus SPY.
A failed hold above support would weaken the setup.
Tracked, but not top-2 eligible because: .
XAR wins by timing alone: a 75.0/100 timing score versus ITA's 49.0, combined with superior risk-reward (46.2 vs 42.8), gives XAR the edge despite operating from a structurally neutral setup. Price sits just 12.5% from the 50W with MACD bullish and improving and stochastic RSI in a benign falling/neutral zone at 0.50—textbook intermediate-term positioning before the next leg up. ITA, by contrast, is stretched further from trend reversal signals; its overbought/rolling-over stochastic RSI at the extension suggests the setup is aging. The 2.9-point margin is narrow because both setups rest on the same neutral structure (neither is a clean pullback or a vertical breakout), meaning neither commands exceptional structural confidence. XAR's thin 0.69x volume participation is a liability, but it also means there is less crowding and more room for new accumulation if the timing indicators activate.
Defense & Aerospace earns 5% as a tier-2 category, ranking well below the energy and infrastructure overweights despite a respectable 46.5 score. Macro provides modest tailwinds: broad market bear and dollar pressure each add +3 to +6 points, and the Transition/Mixed regime itself adds +3. However, the category's technical evidence (68.9/100) is solid but not exceptional, and the macro fit (50.0/100, largely neutral due to lack of category-specific descriptors) does not compensate. The key structural issue is that XAR itself carries thin volume participation, meaning the category lacks institutional momentum. Defense would move to top-2 if geopolitical risk escalates (activating hard risk-off filters) or if broader market volatility crushes multiple compression—either scenario would make the defensive thesis more attractive relative to the current regime. For now, the 5% allocation is defensive positioning without overcommitment.
Technology — XLK
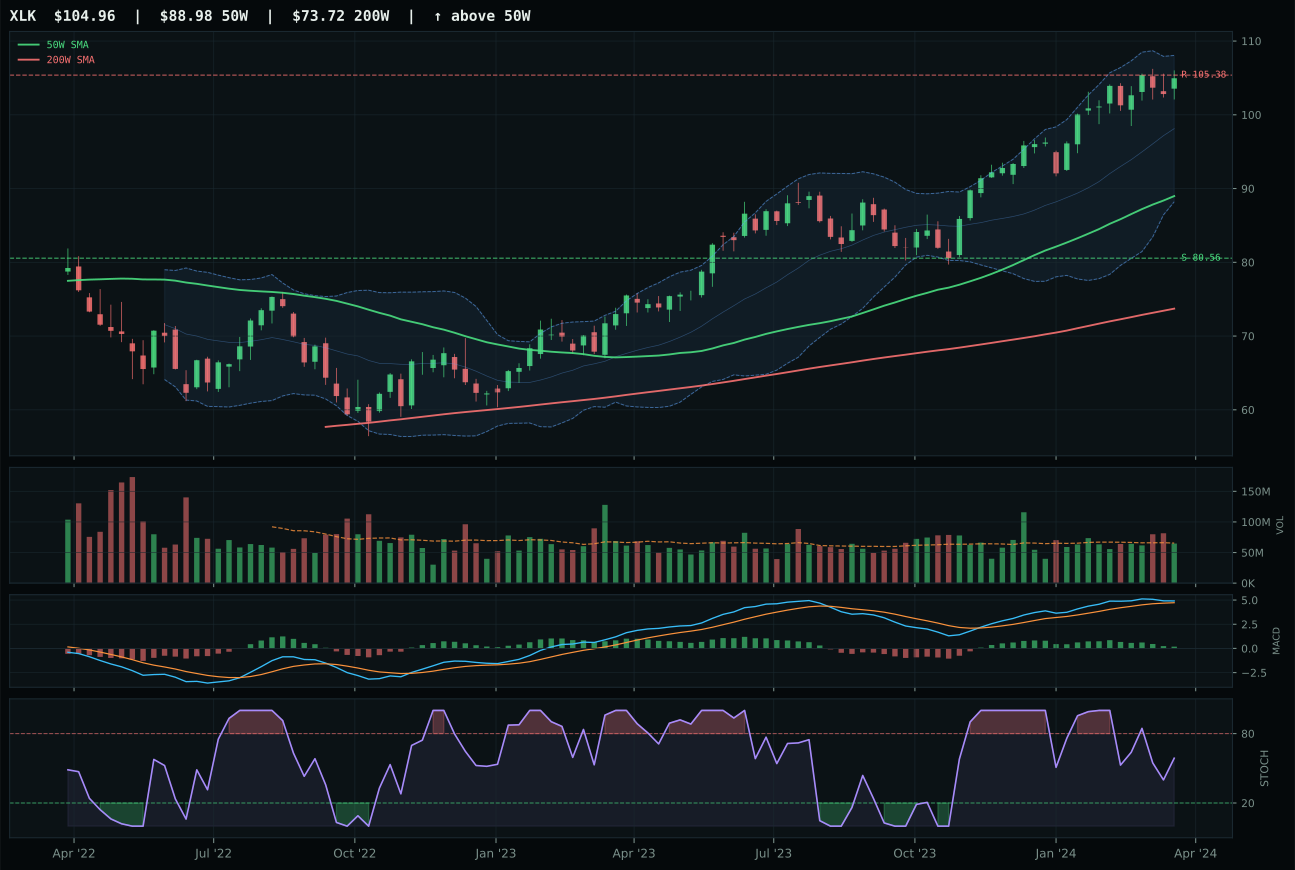
XLK has a vertical extension profile with -0.7% 13-week relative strength versus SPY.
A failed hold above support would weaken the setup.
Actionable but governed by invalidation levels.
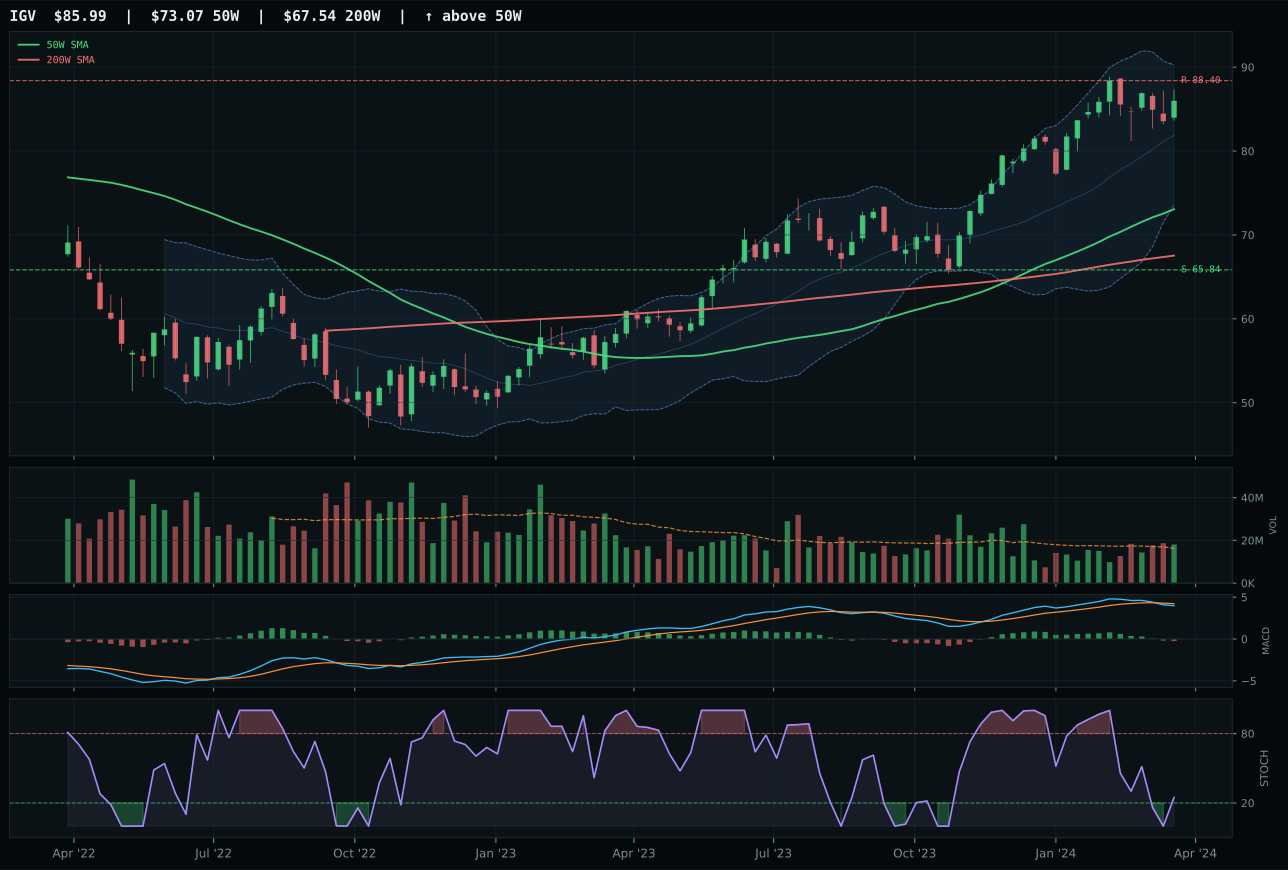
IGV has a vertical extension profile with -4.5% 13-week relative strength versus SPY.
A failed hold above support would weaken the setup.
Actionable but governed by invalidation levels.
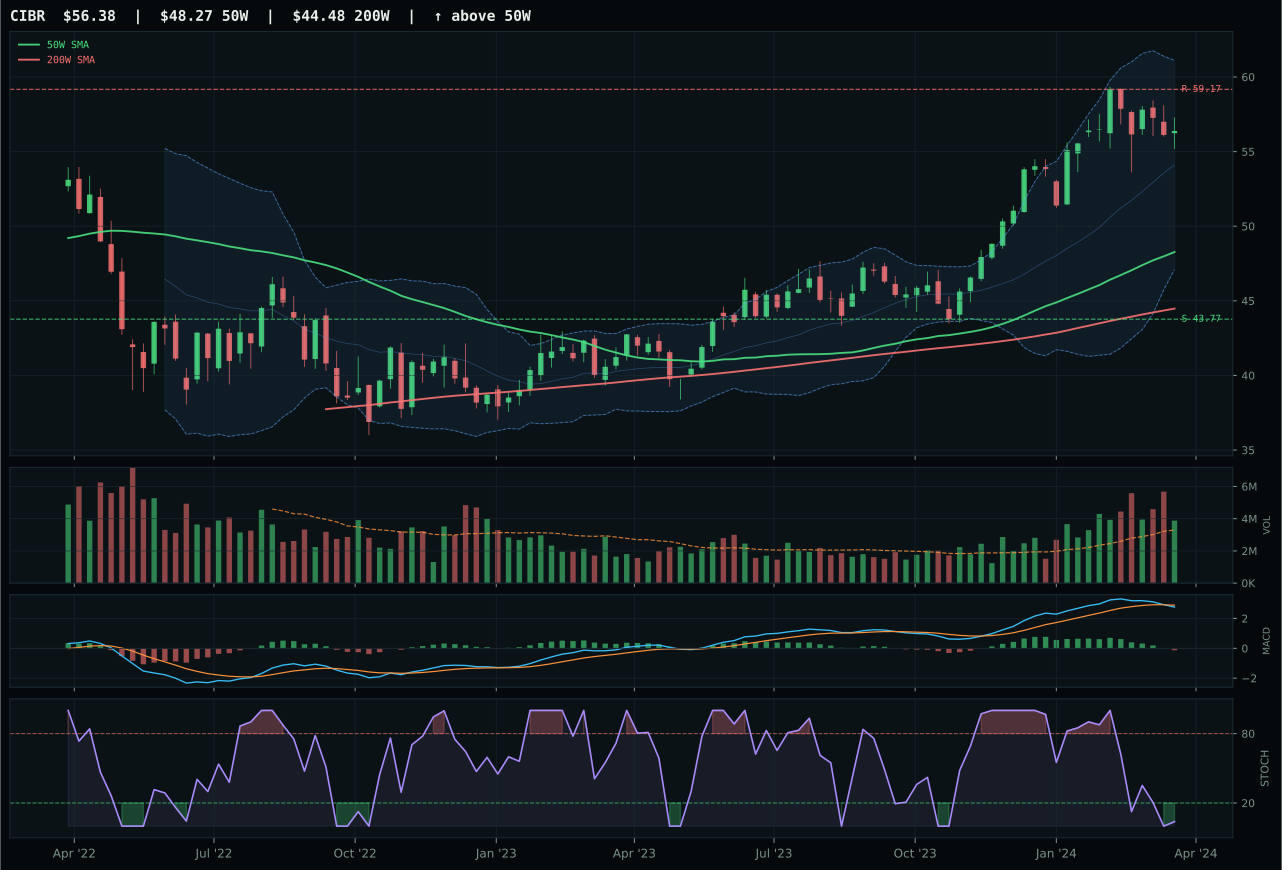
CIBR has a vertical extension profile with -5.7% 13-week relative strength versus SPY.
A failed hold above support would weaken the setup.
Actionable but governed by invalidation levels.
XLK wins the category with a trend score of 94.9/100 driven by price sitting comfortably above both the 50W and 200W moving averages with a steady 0.7% slope—a foundation that most challengers cannot match. Against IGV, which suffers from bearish/weakening MACD and a -4.5% SPY-relative return over 13 weeks, XLK's bullish-but-flattening MACD and +3.8% category-relative strength tell a clearer story of managed leadership rather than deterioration. The 11.2-point score gap reflects that XLK's vertical extension at 17.9% above the 50W, while risky on entry, is being met with neutral volume participation—suggesting discipline in accumulation rather than panic buying into resistance. The real difference is timing: XLK's stochastic RSI is falling but neutral at 0.59, whereas IGV's is already neutral-falling, indicating IGV has already cycled through overbought conditions and left early money in the setup.
Technology earned 5% allocation as a tier-2 category—ranking below the two top-tier overweights but holding enough technical merit to justify positioning. The 44.2 composite score reflects a macro headwind: liquidity stress and credit stress each subtract 8–10 points, offsetting the +9 boost from positive risk appetite and +6 from AI growth sponsorship. In a Transition/Mixed regime, growth categories face structural pressure as multiple compression scenarios become asymmetric. What would push Technology to top-2 is either a sustained acceleration in the 13W return momentum (currently +9.3% is solid but not explosive) or a macro pivot away from credit stress; currently, the category is paying the entry-risk tax for its extension without the relative-strength sponsorship needed to justify higher weightings. The 5% sleeve allows participation in XLK's trend while preserving capital for categories with better risk-adjusted setups.
Nuclear Energy — NLR
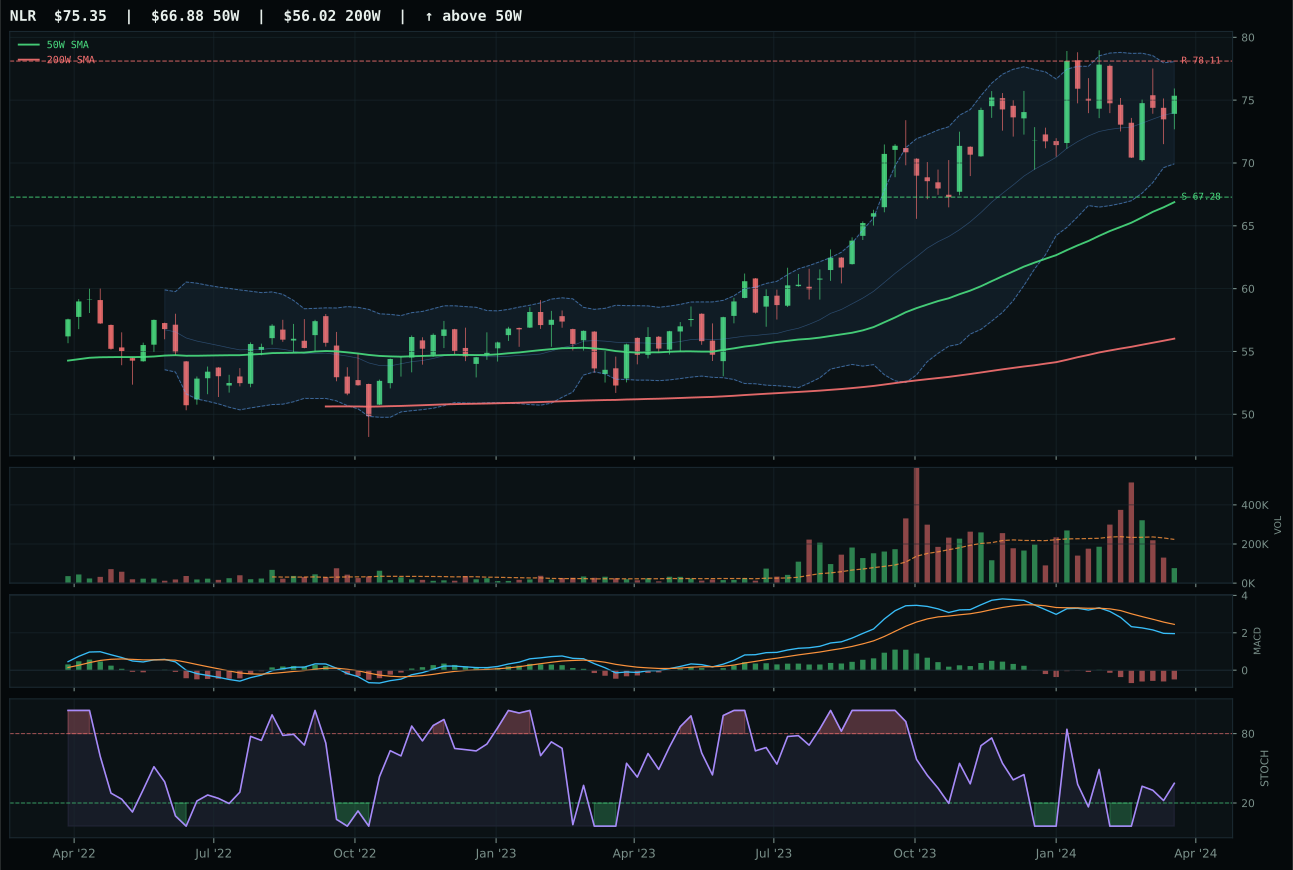
NLR has a neutral structure profile with -5.1% 13-week relative strength versus SPY.
A failed hold above support would weaken the setup.
Actionable but governed by invalidation levels.
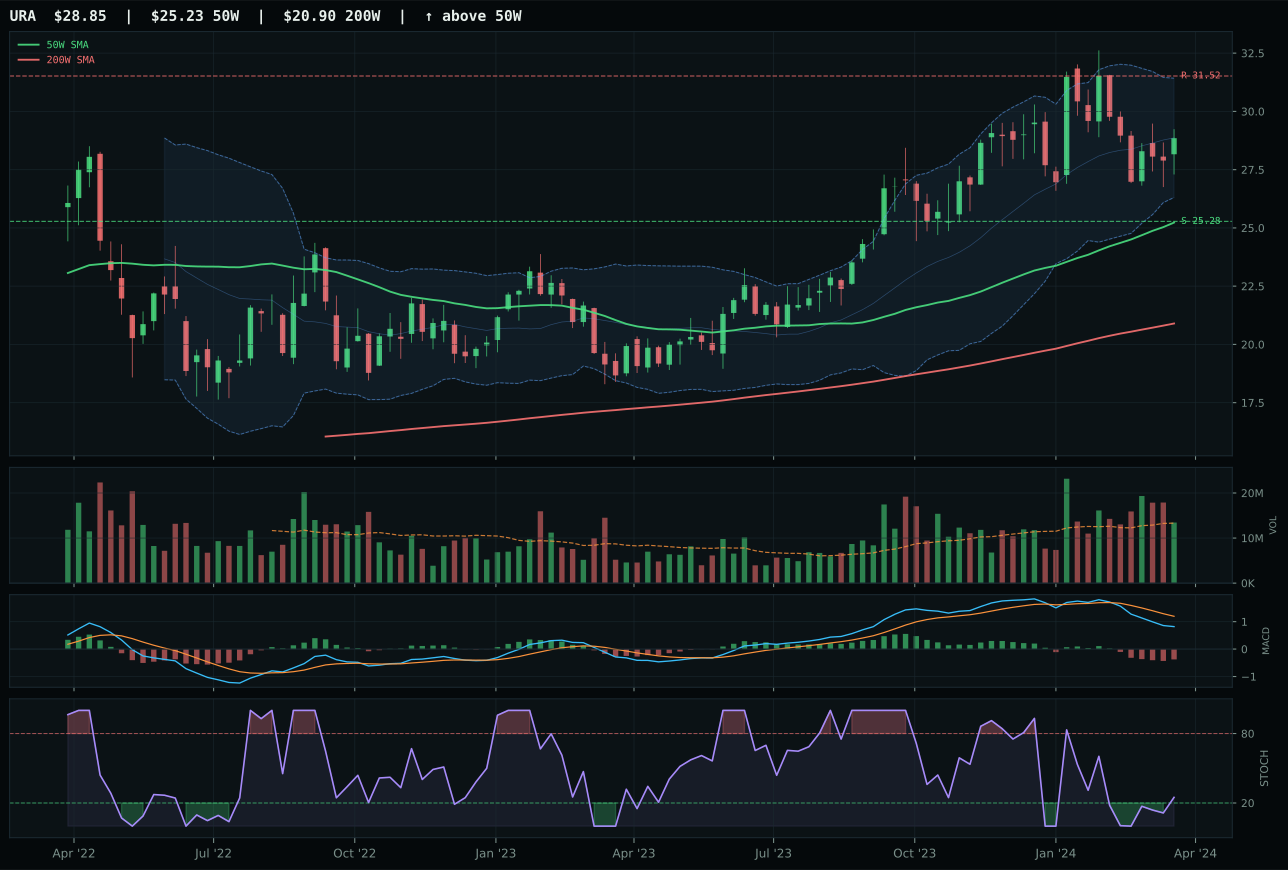
URA has a neutral structure profile with -12.3% 13-week relative strength versus SPY.
A failed hold above support would weaken the setup.
Actionable but governed by invalidation levels.
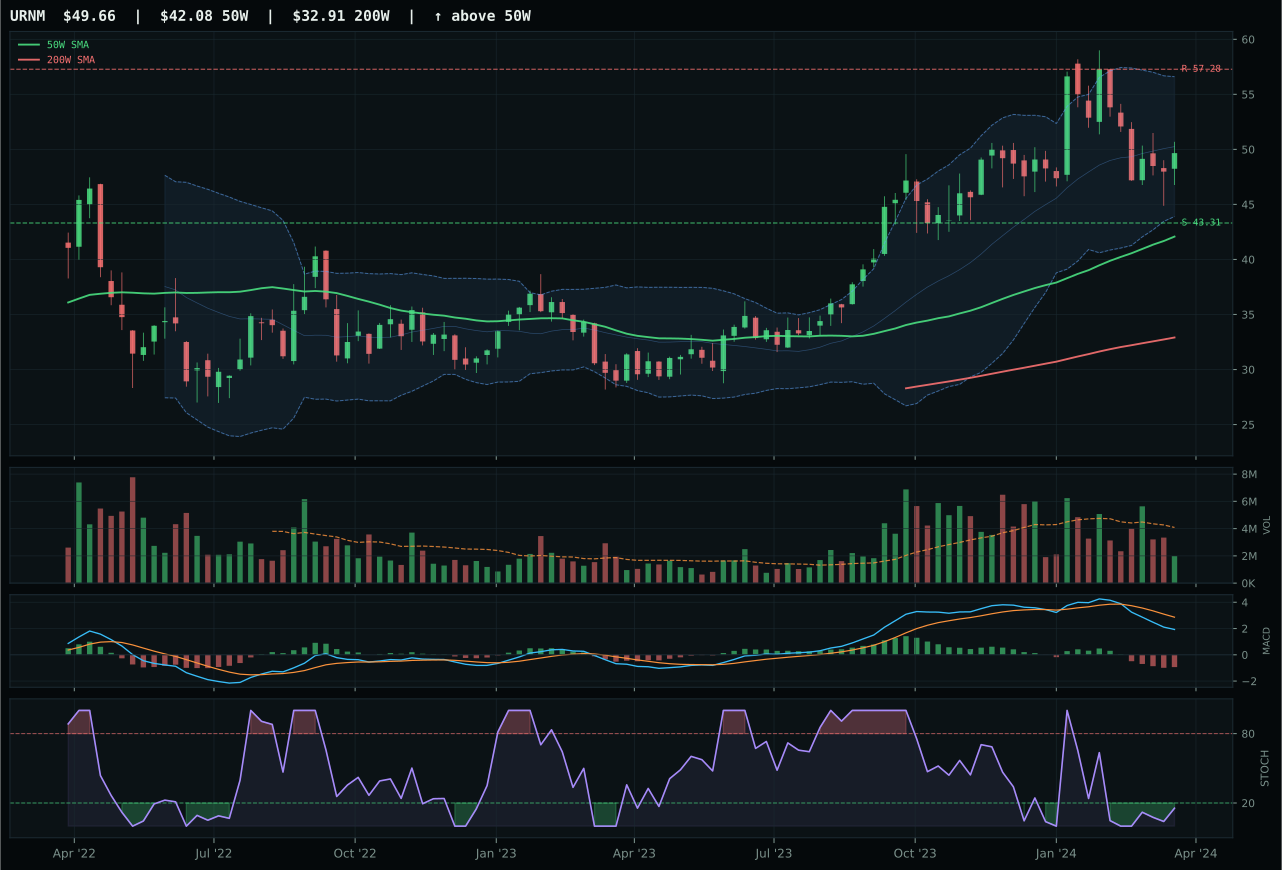
URNM has a vertical extension profile with -8.9% 13-week relative strength versus SPY.
A failed hold above support would weaken the setup.
Actionable but governed by invalidation levels.
NLR wins the category with an 85.3/100 trend score despite MACD only being bearish-but-improving rather than bullish, a limitation that normally disqualifies candidates. Price holds above the 50W and 200W, and the 4.9% 13W return with +3.8% category-relative strength means NLR is outperforming its peers URA and URNM in a category where momentum is muted across the board. Against URA, which shows a deteriorating -12.3% SPY-relative return and a failing -2.3% 13W return, NLR is simply the least-bad option: it has trend preservation while URA is in decline. The 12.1-point score gap is substantial because URA's MACD is bearish/weakening (not just improving), confirming that nuclear utilities lack institutional sponsorship at this moment. NLR's thin 0.34x volume is a structural weakness, but it also means the setup is not crowded and could accumulate quietly if energy scarcity remains active.
Nuclear Energy earns 5% allocation as a tier-2 category with a 42.8 composite score, holding a position despite thin volume and weak momentum across the entire three-ETF basket. Energy scarcity (+9) and real asset sponsorship (+7) provide macro support, while credit stress and liquidity stress subtract -5 to -7 points. The technical evidence is weak (59.3/100), and the setup is structurally defensive: both trend and volume-price confirmation are present but not enthusiastic. Nuclear would move to top-2 if institutional demand for nuclear utilities as an energy-security play accelerated—either through AI data-center demand or geopolitical de-risking of power supplies. Currently, the category is a tier-2 hold rather than a core position because it lacks the trend velocity (NLR's +4.9% 13W is respectable but not catalytic) and volume confirmation needed to justify larger allocation. The 5% slot represents a speculative bet on rising energy scarcity hitting nuclear demand, not a high-conviction technical setup.
Industrial Metals — COPX
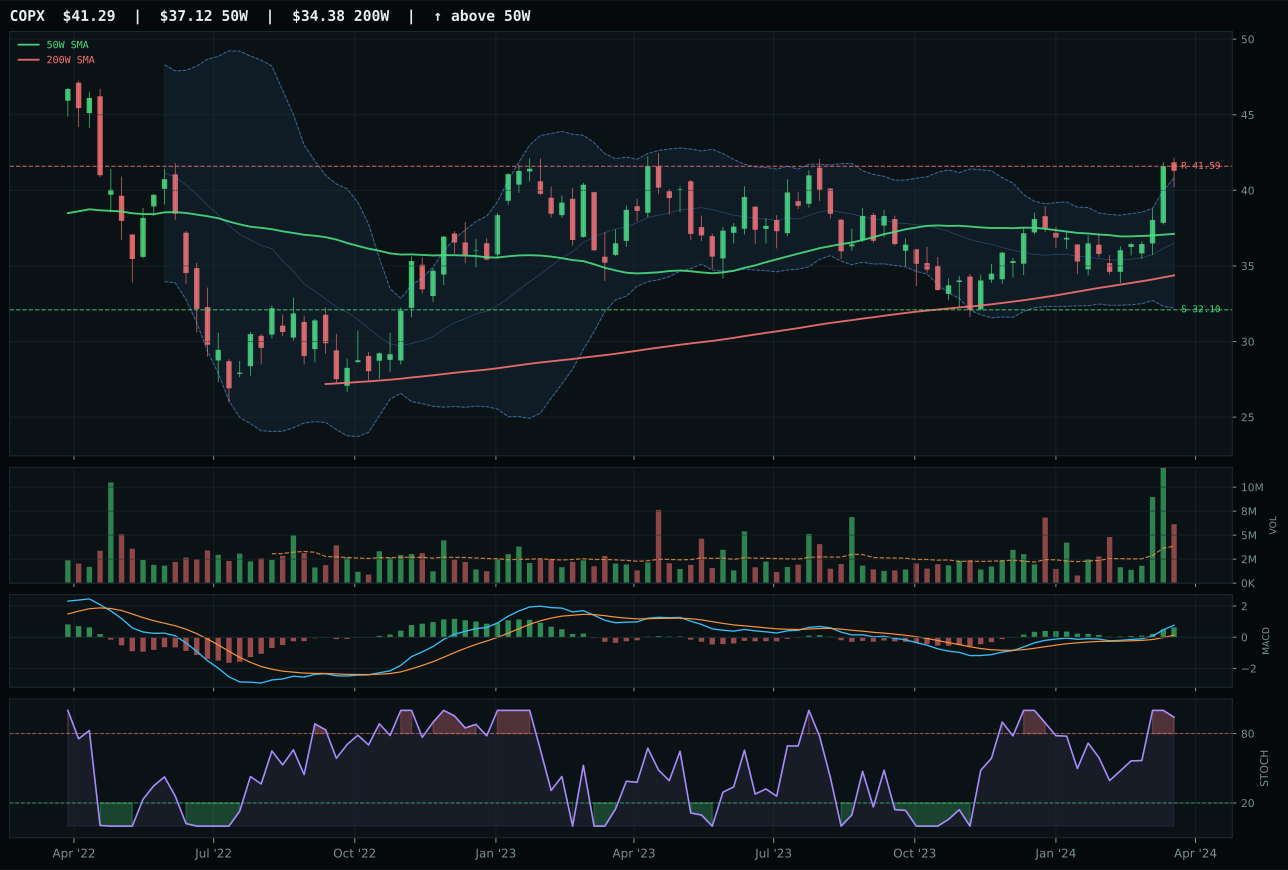
COPX has a neutral structure profile with -1.7% 13-week relative strength versus SPY.
A failed hold above support would weaken the setup.
Actionable but governed by invalidation levels.
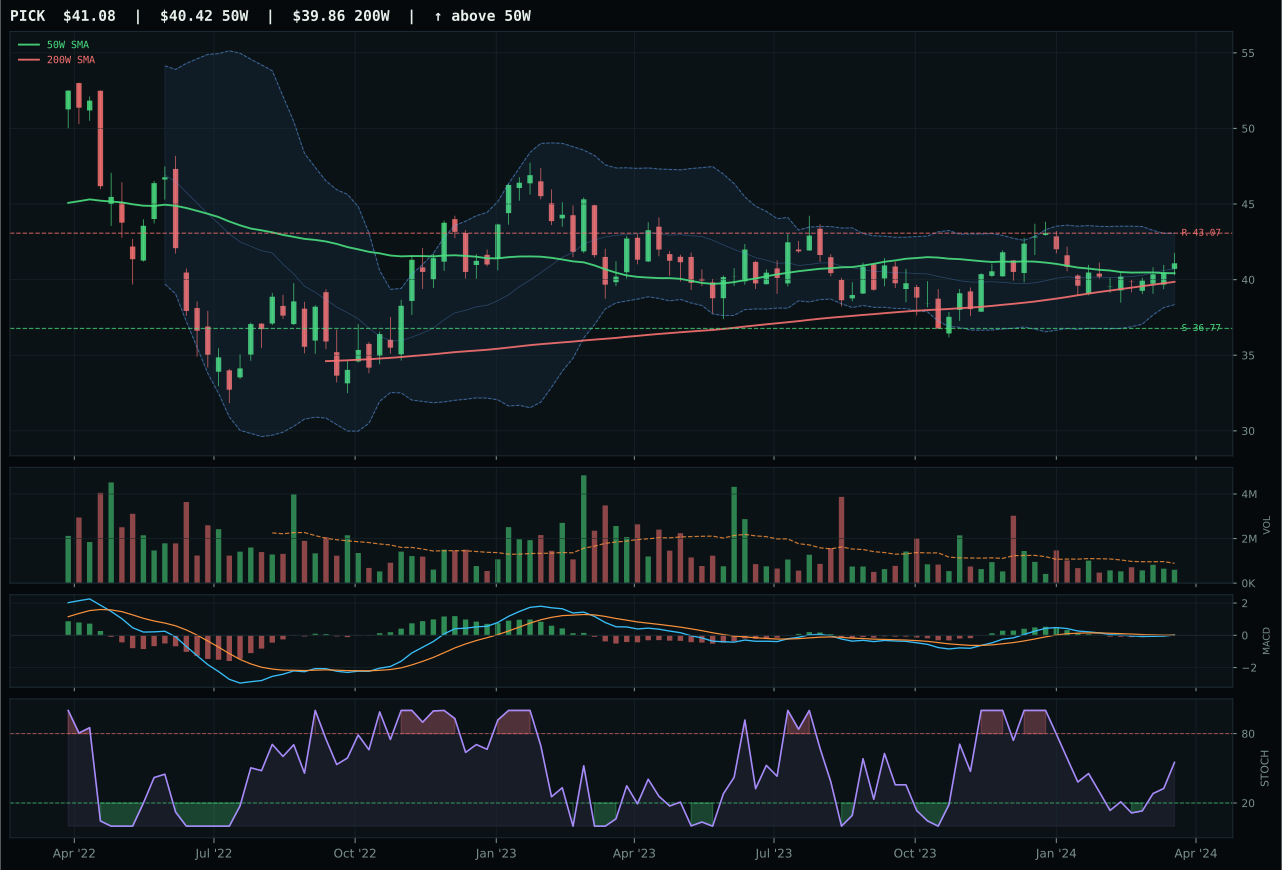
PICK has a compression near 50W profile with -14.2% 13-week relative strength versus SPY.
A failed hold above support would weaken the setup.
Actionable but governed by invalidation levels.
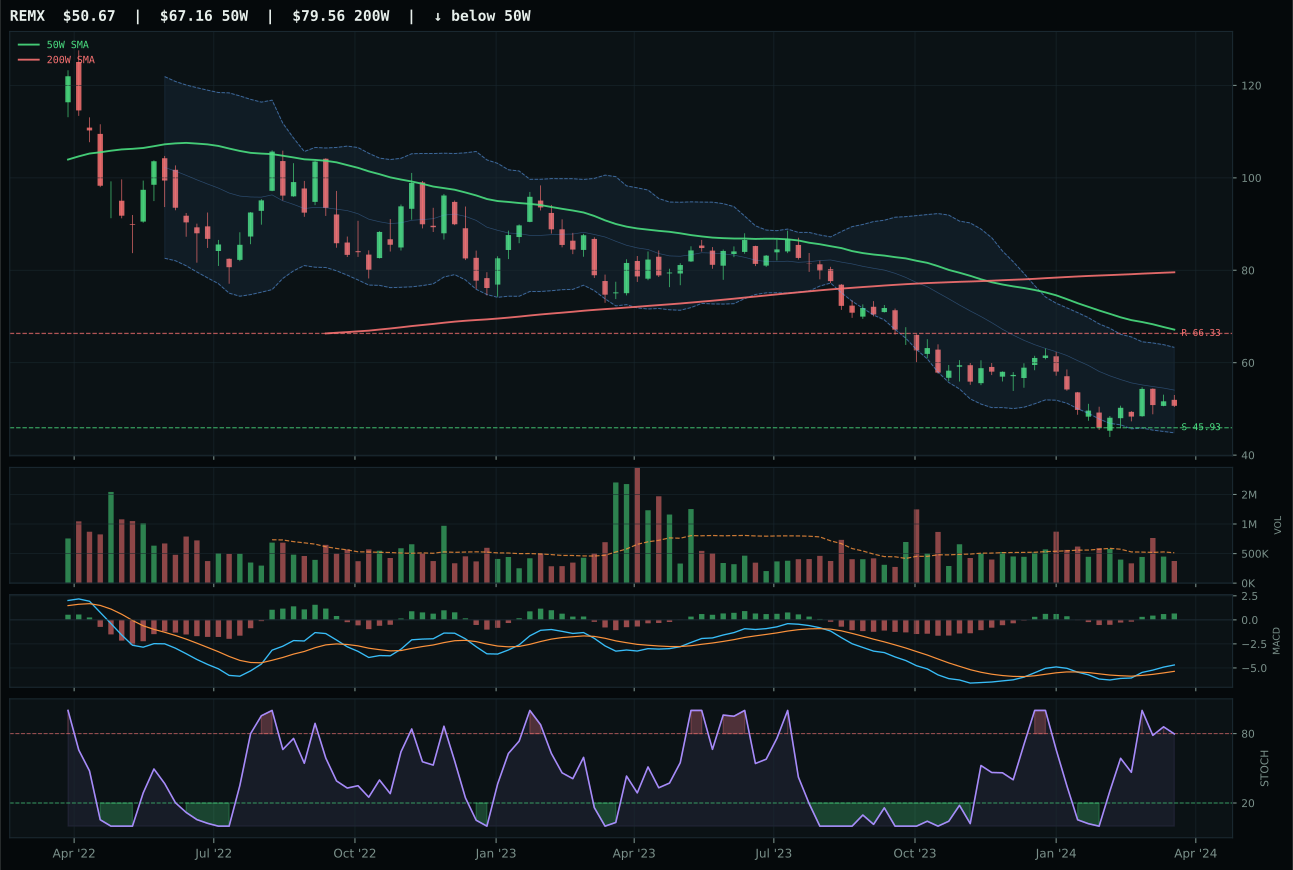
REMX has a neutral structure profile with -27.0% 13-week relative strength versus SPY.
Extension and support failure are the main tactical risks.
Tracked, but not top-2 eligible because: structurally broken.
COPX wins because its momentum confirmation score is 97.4/100—nearly perfect—driven by a 13W return of 8.4%, a 4W return of 13.3%, and category-relative strength of +12.5%. This is the clearest relative-strength story in the portfolio this week: COPX is the only metal commodity outperforming its own peer set by a meaningful margin. Against PICK, which shows 0.0% category-relative strength and a deteriorating -4.1% 13W return, COPX's trend is not only intact but accelerating. The 1.7-point score gap is narrow because PICK shows excellent timing (100.0/100) thanks to its compression-near-50W setup, but timing without momentum is a setup waiting for catalysts, not one commanding capital. COPX's distribution-pressure volume (1.60x) and overbought stochastic are red flags for entry, but they are offset by the fact that metal scarcity and commodity breadth are active sponsors pushing institutional allocations into copper plays.
Industrial Metals earns 5% allocation as a tier-2 category with a 40.9 composite score, ranking below infrastructure and energy but above the broken agriculture category. The macro support is genuine: metals scarcity (+14), commodity breadth (+10), and real asset sponsorship (+6) total +30 points of support, while liquidity stress and dollar pressure subtract only -8 and -6. This is one of the few categories where macro tailwinds outweigh headwinds, yet the technical evidence (57.4/100) is merely solid, not exceptional. COPX's extended 11.2% move above the 50W at overbought stochastic levels creates entry-risk tension; the category is attractive on macro grounds but late on entry timing. Industrial Metals would solidify top-2 status if COPX could pull back 5–8% and confirm on rising-mid-zone stochastic, turning the setup into a confirmed breakout rather than an extended high. For now, 5% respects the macro sponsorship while acknowledging the late-cycle entry window.
Agriculture & Livestock — MOO
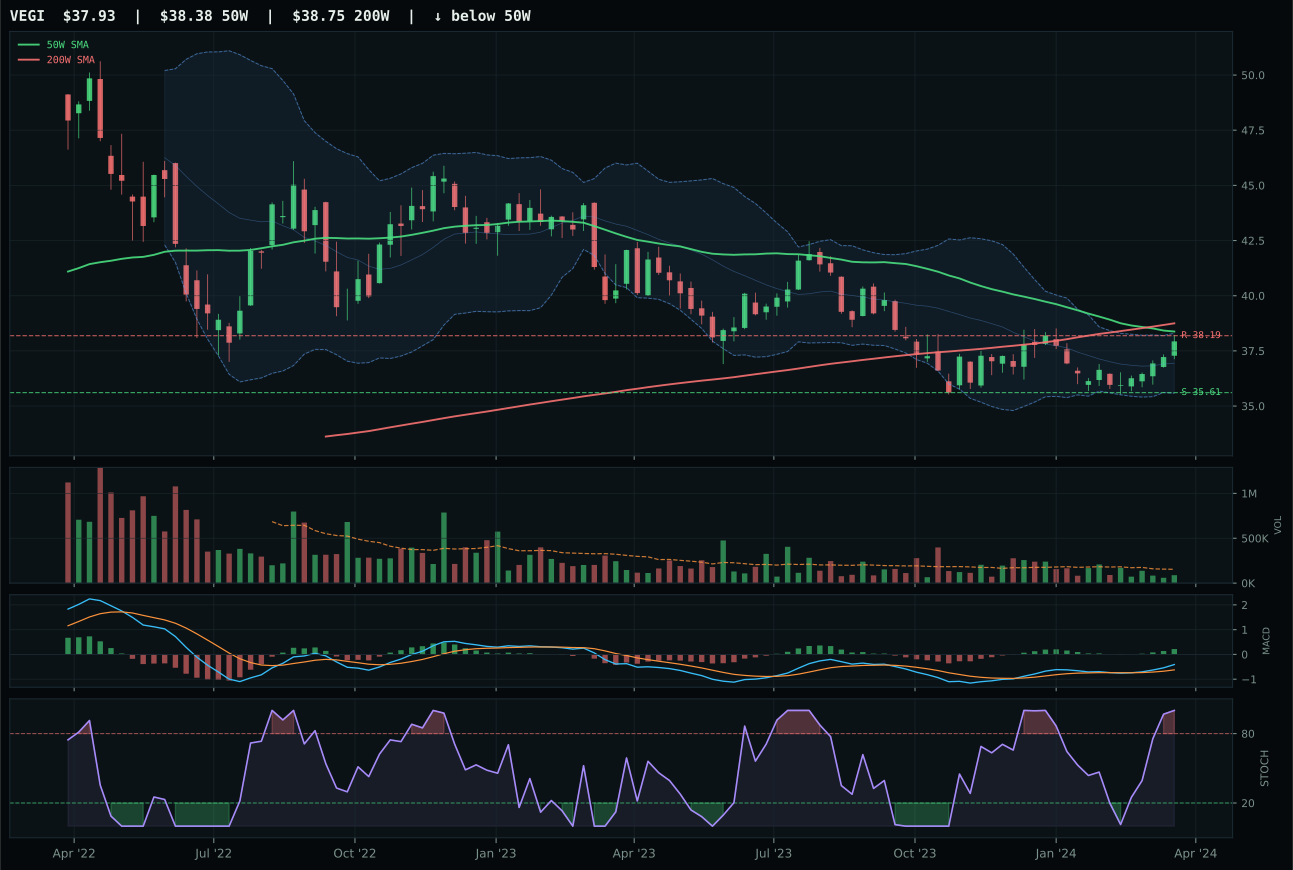
VEGI has a compression near 50W profile with -9.6% 13-week relative strength versus SPY.
Extension and support failure are the main tactical risks.
Tracked, but not top-2 eligible because: structurally broken.
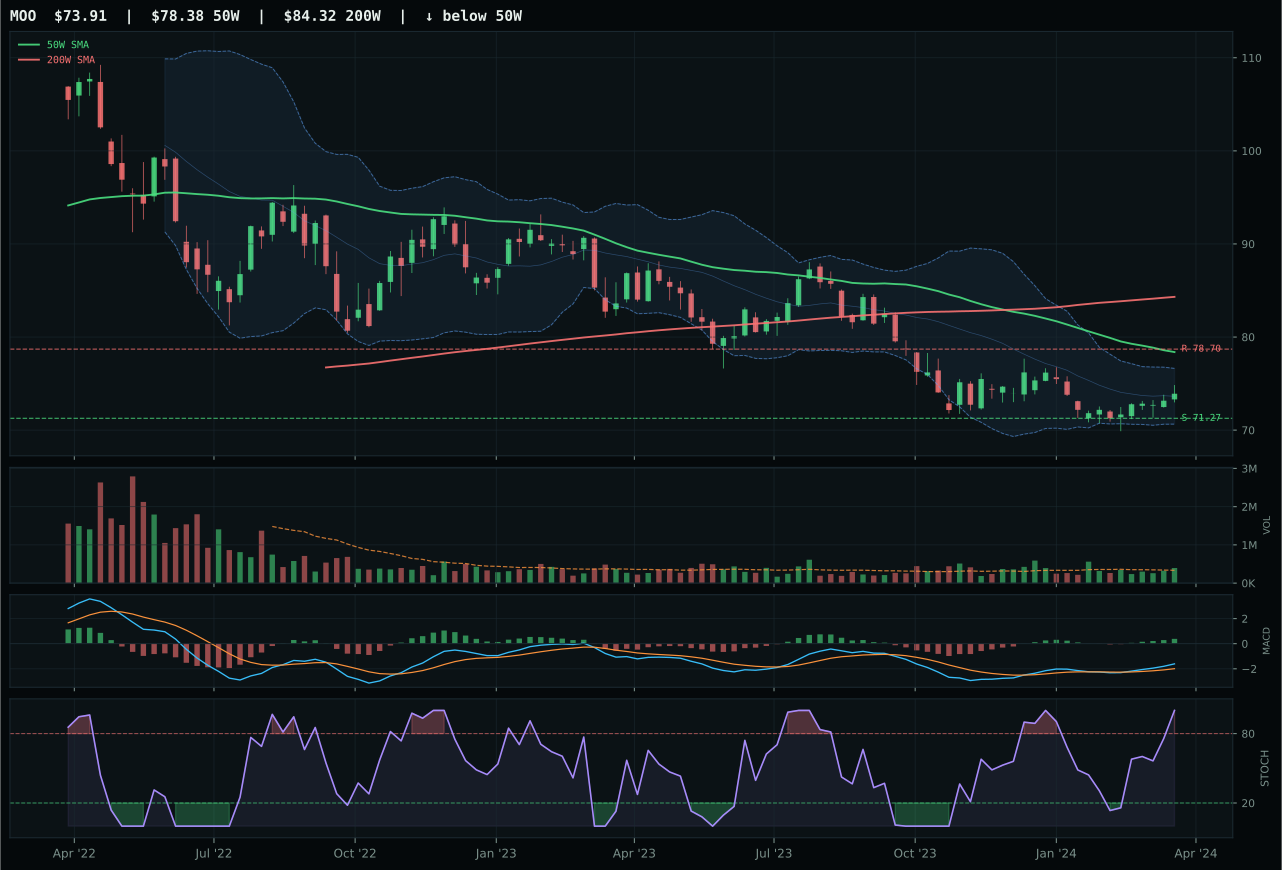
MOO has a pullback into support profile with -11.9% 13-week relative strength versus SPY.
Extension and support failure are the main tactical risks.
Tracked, but not top-2 eligible because: structurally broken.
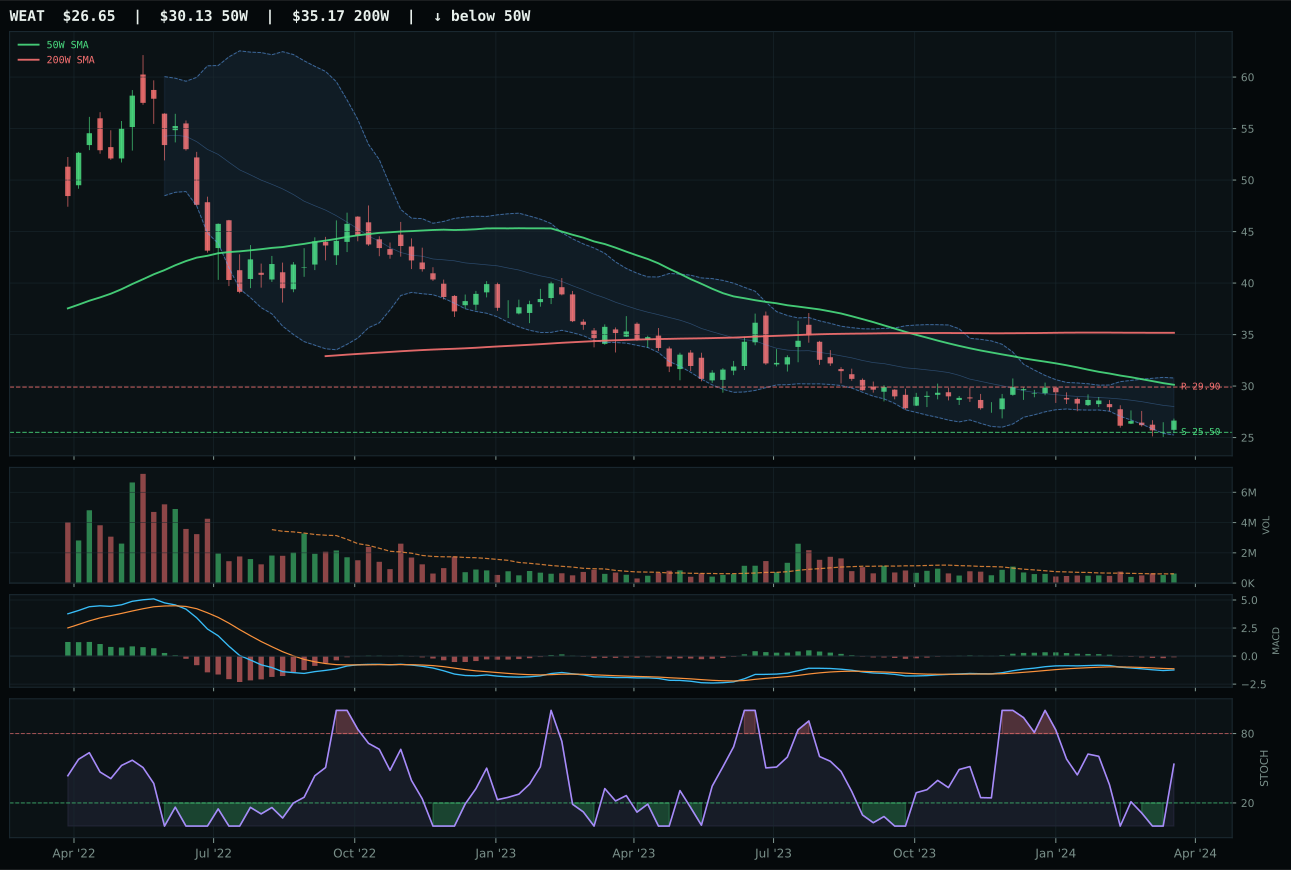
WEAT has a pullback into support profile with -19.1% 13-week relative strength versus SPY.
Extension and support failure are the main tactical risks.
Tracked, but not top-2 eligible because: structurally broken.
MOO wins the category despite its structure being materially broken: price is 5.7% below the 50W and below the 200W, triggering a hard technical flaw that normally excludes a candidate from top-tier consideration. The win reflects that MOO's only peer, VEGI, is structurally broken in a worse way (compression at a lower price zone with weaker 54.9/100 risk-reward versus MOO's 74.6/100). MOO's saving grace is its timing setup: the pullback-into-support structure sits at 71.27 with MACD bullish and improving and stochastic RSI at overbought momentum (1.00), creating a defined reversal point. Volume at 1.18x confirms the move is being accumulated through the support test. Against VEGI's thin participation and bearish-like compression, MOO's pullback-into-support with above-average volume reads as an actual rebound candidate rather than a deteriorating hold.
Agriculture & Livestock earned 0% allocation this week, ranking 9th among the 10 categories with a composite score of 15.7. The category is structurally broken: both MOO and VEGI are below their 50W and 200W, and the macro fit (59.0/100 macro support from real assets and commodity breadth) is not enough to overcome the technical ineligibility. Liquidity stress (-4 points) and the -11.9% SPY-relative return on the category leader MGO worsen the case. The only technical merit is timing: both MOO and VEGI show bullish MACD and overbought momentum stochastic, suggesting a mean-reversion trade is brewing. However, in a Transition/Mixed regime, mean-reversion setups in broken structures do not warrant capital when tier-2 categories offer better risk profiles. Agriculture would re-enter the portfolio only if either (a) price recovers above the 50W with volume confirmation, triggering a new uptrend, or (b) macro risk escalates to a true risk-off state where commodity hedging becomes a portfolio necessity.
Emerging Markets — IEMG
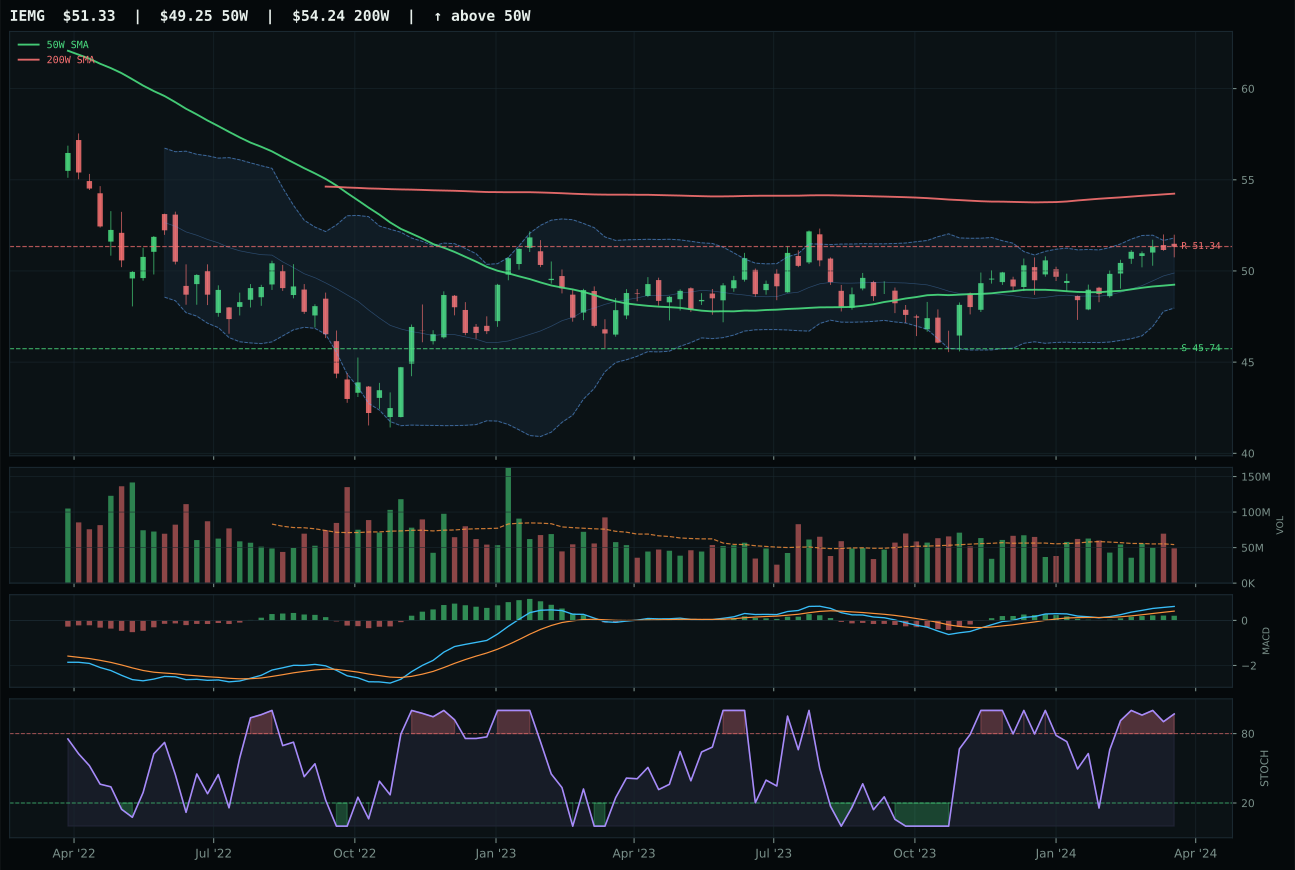
IEMG has a neutral structure profile with -6.3% 13-week relative strength versus SPY.
A failed hold above support would weaken the setup.
Actionable but governed by invalidation levels.
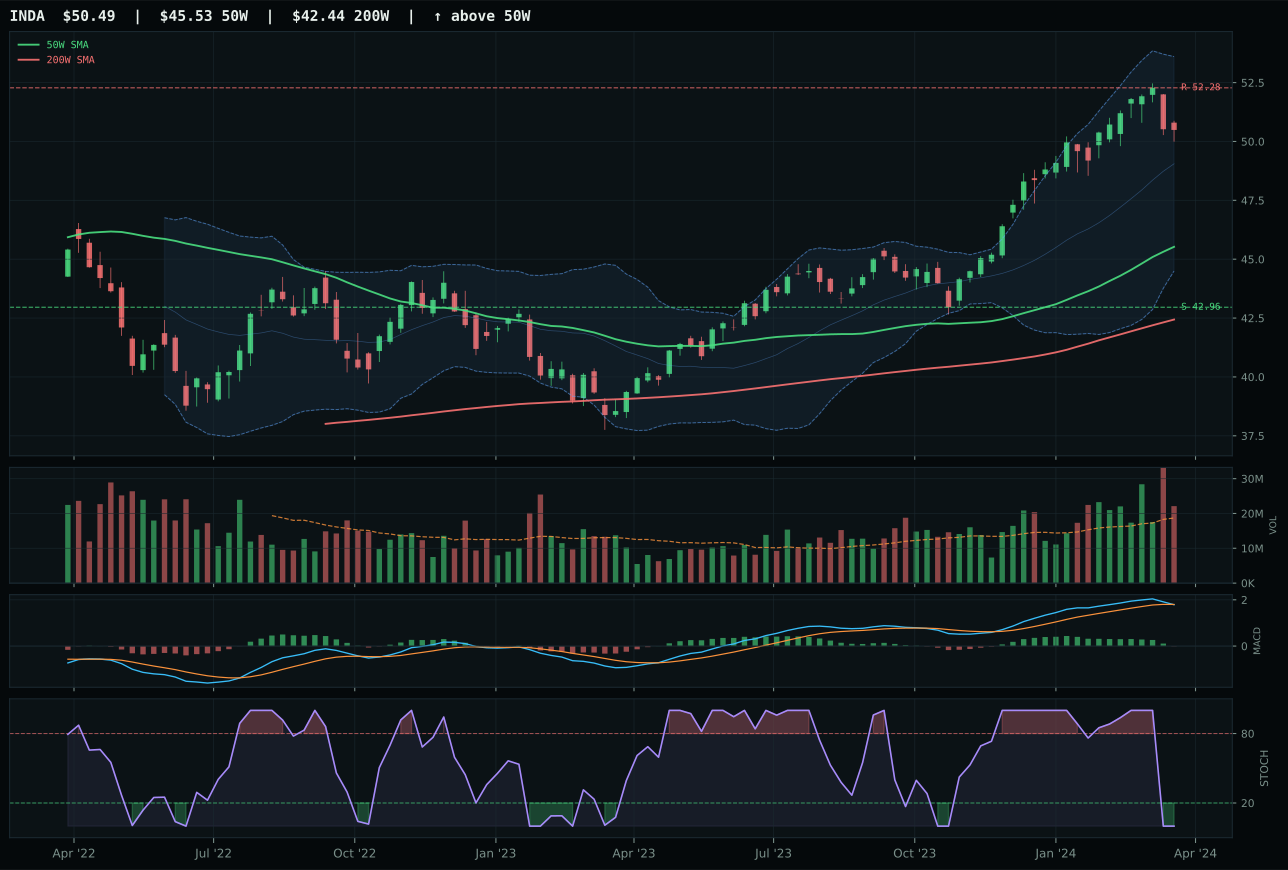
INDA has a neutral structure profile with -5.6% 13-week relative strength versus SPY.
A failed hold above support would weaken the setup.
Actionable but governed by invalidation levels.
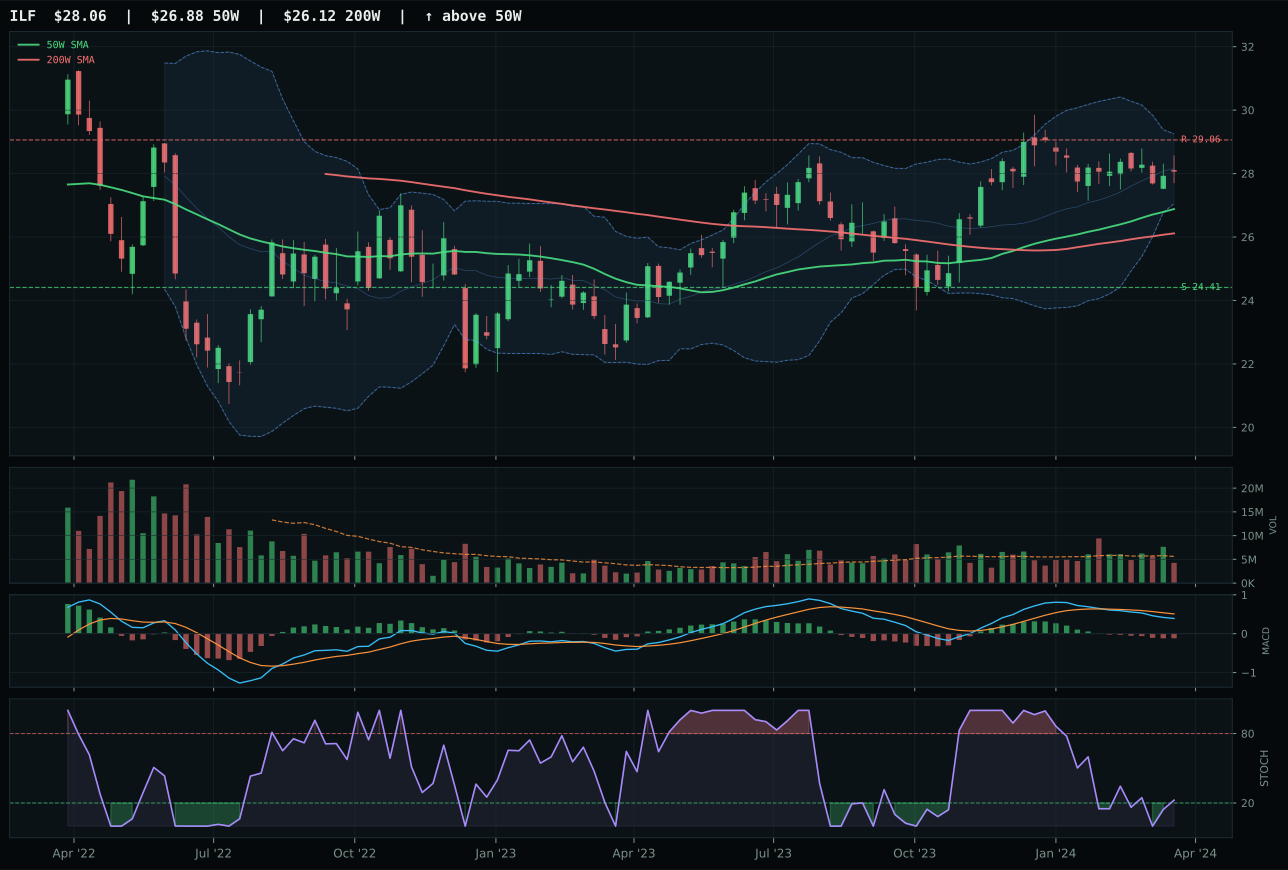
ILF has a neutral structure profile with -12.9% 13-week relative strength versus SPY.
A failed hold above support would weaken the setup.
Actionable but governed by invalidation levels.
IEMG wins the category with a 90.0/100 timing score—among the highest in the portfolio—driven by sitting just 4.2% from the 50W with MACD bullish and improving and overbought momentum stochastic. This proximity to moving-average support while still above it is classic mean-reversion positioning. Against INDA, which is stretched 10.9% from the 50W with bearish/weakening MACD, IEMG is structurally earlier in its potential rebound cycle. The 7.0-point score gap reflects that INDA is more vulnerable to rollover, while IEMG still has setup integrity. However, the 11.4 composite score for the entire category—the lowest in the portfolio—means neither IEMG nor INDA qualifies for allocation, as the macro headwinds (dollar pressure -14, credit stress -10, liquidity stress -10, broad market bear -9) total -43 points and overwhelm the +8 risk-appetite support.
Emerging Markets earned 0% allocation this week, ranking 10th out of 10 categories with a composite score of 11.4. While IEMG's technical setup (69.4/100 evidence) is respectable and its timing score is one of the highest, the macro fit of 30.0/100 is disqualifying. Dollar pressure, credit stress, liquidity stress, and broad market bear are all active simultaneously, creating a perfect storm for emerging-market exposure: EM currencies suffer as the dollar strengthens, credit conditions tighten margins, and risk-off environments favor developed-market safe havens. IEMG would only return to the portfolio if either (a) the dollar pressure reverses and risk appetite re-ignites, or (b) the composite score of tier-2 categories falls below emerging markets' 11.4 due to deterioration elsewhere. This is the category most dependent on macro regime shift; technicals alone cannot overcome a 43-point macro headwind.