
2024-03-15
Informational purposes only. The content in this report, including allocations, analysis, and commentary, is provided solely for informational and educational purposes. It does not constitute financial advice, investment advice, trading advice, or any other type of advice. Past performance does not guarantee future results. Always conduct your own research and consult a qualified financial professional before making investment decisions.
Weekly Allocation
| Ticker | Category | Weight | Role |
|---|---|---|---|
| FBTC | 50% | Overlay | |
| XLE | Traditional Energy | 10% | Top-2 (10%) |
| SMH | AI | 10% | Top-2 (10%) |
| SLV | Precious Metals | 5% | Tier-2 (5%) |
| COPX | Industrial Metals | 5% | Tier-2 (5%) |
| XAR | Defense & Aerospace | 5% | Tier-2 (5%) |
| NLR | Nuclear Energy | 5% | Tier-2 (5%) |
| XLK | Technology | 5% | Tier-2 (5%) |
| PAVE | Utilities & Infrastructure | 5% | Tier-2 (5%) |
Trade Instructions — Monday Open
Sell the tranche from 2024-02-16 (completing its 4-week hold). Buy the new tranche. Instructions show net portfolio changes — same-asset positions cancel, weight changes show the delta.
| Action | Ticker | Instruction |
|---|---|---|
| SELL | CIBR | Sell entire CIBR position (2.50% of portfolio) |
| SELL | GLD | Sell 20% of GLD position (reduce 6.25% → 5.00%) |
| SELL | INDA | Sell 33% of INDA position (reduce 3.75% → 2.50%) |
| SELL | VEGI | Sell 33% of VEGI position (reduce 3.75% → 2.50%) |
| BUY | XLK | Buy XLK — 20.00% of freed cash (adds 1.25% to portfolio) |
| BUY | XLE | Buy XLE — 40.00% of freed cash (adds 2.50% to portfolio) |
| BUY | COPX | Buy COPX — 20.00% of freed cash (adds 1.25% to portfolio) |
| BUY | SLV | Buy SLV — 20.00% of freed cash (adds 1.25% to portfolio) |
Current Portfolio After Trade
Combined holdings across all 4 active tranches. Each tranche is 25% of the portfolio.
| Ticker | % of Portfolio | Weight Bar |
|---|---|---|
| FBTC | 50.00% | |
| SMH | 10.00% | |
| XLK | 7.50% | |
| XAR | 5.00% | |
| GLD | 5.00% | |
| NLR | 5.00% | |
| PAVE | 5.00% | |
| XLE | 3.75% | |
| INDA | 2.50% | |
| VEGI | 2.50% | |
| COPX | 2.50% | |
| SLV | 1.25% |
Macro Regime — Late-Cycle Reflation
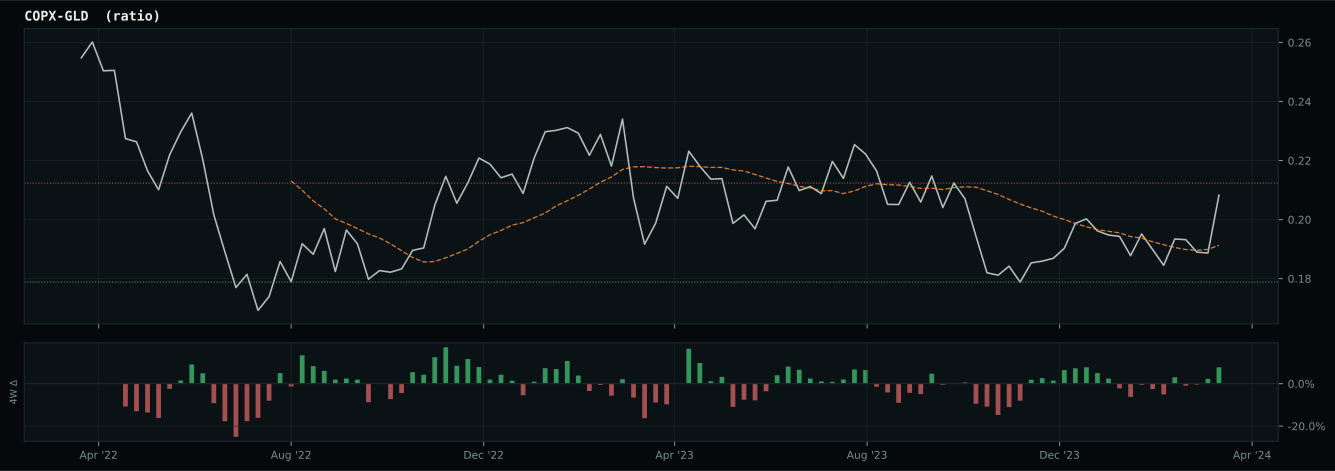
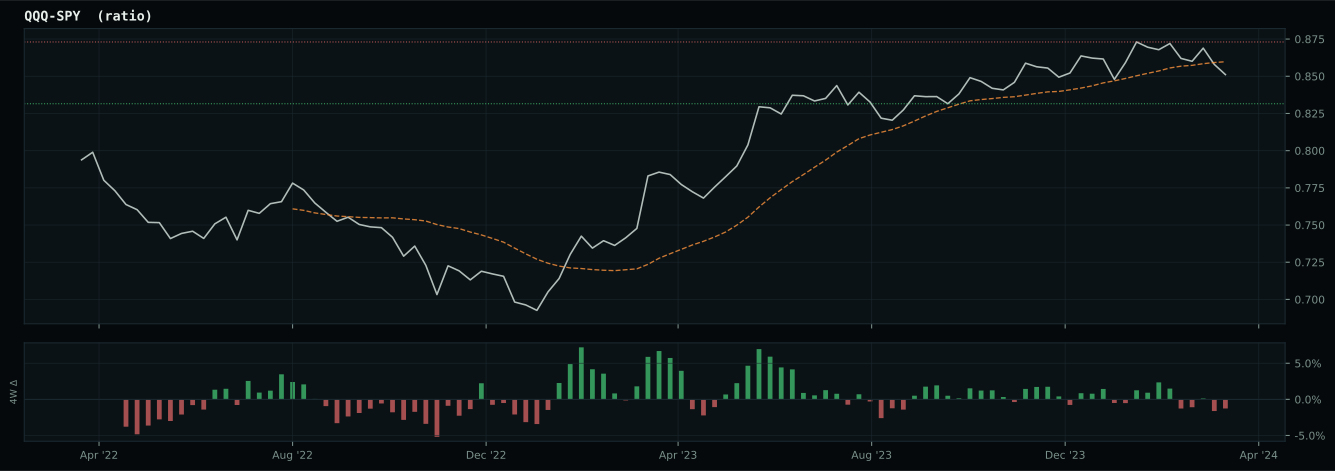
Macro Evidence Charts
Market-implied signals behind the macro regime scores. Each ratio compares two assets; the direction and slope of the ratio is what the macro engine reads.
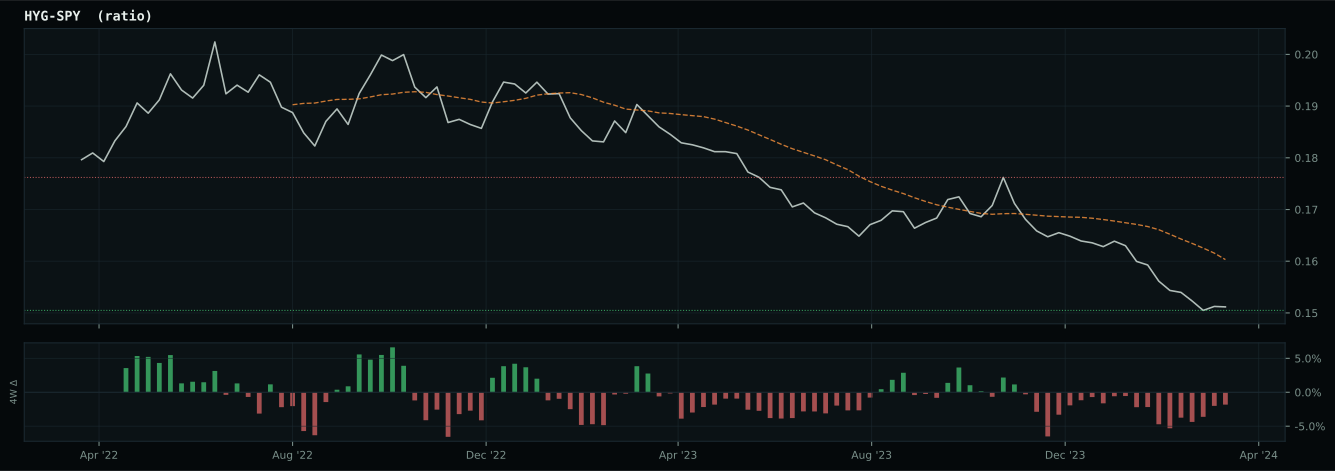
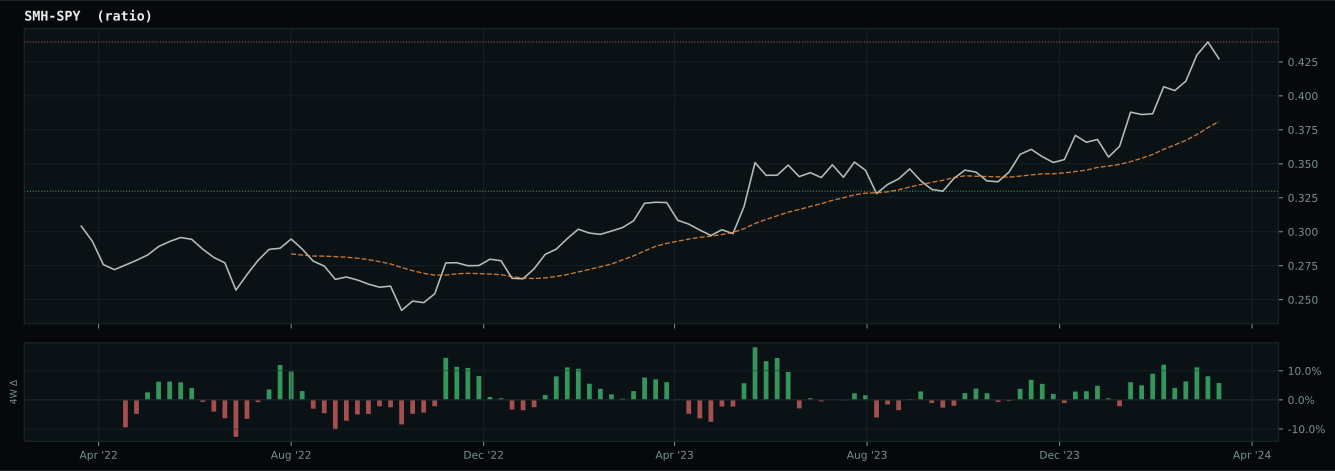
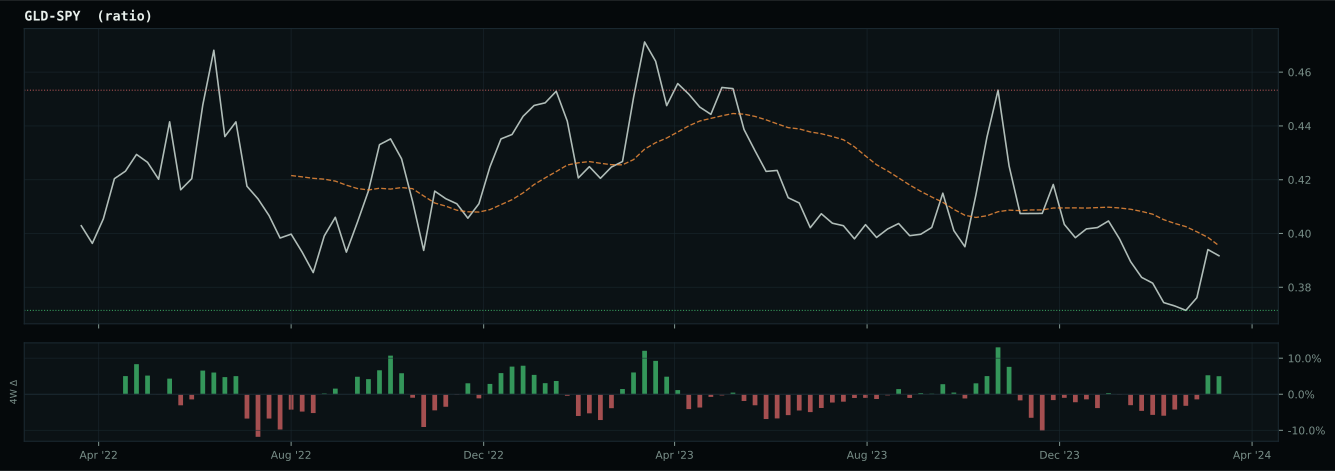
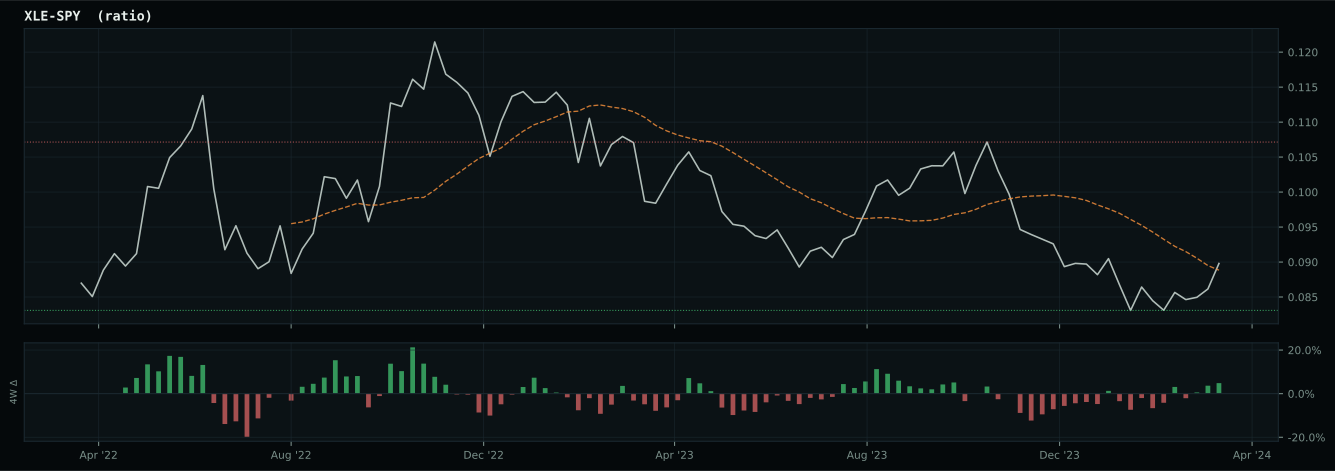
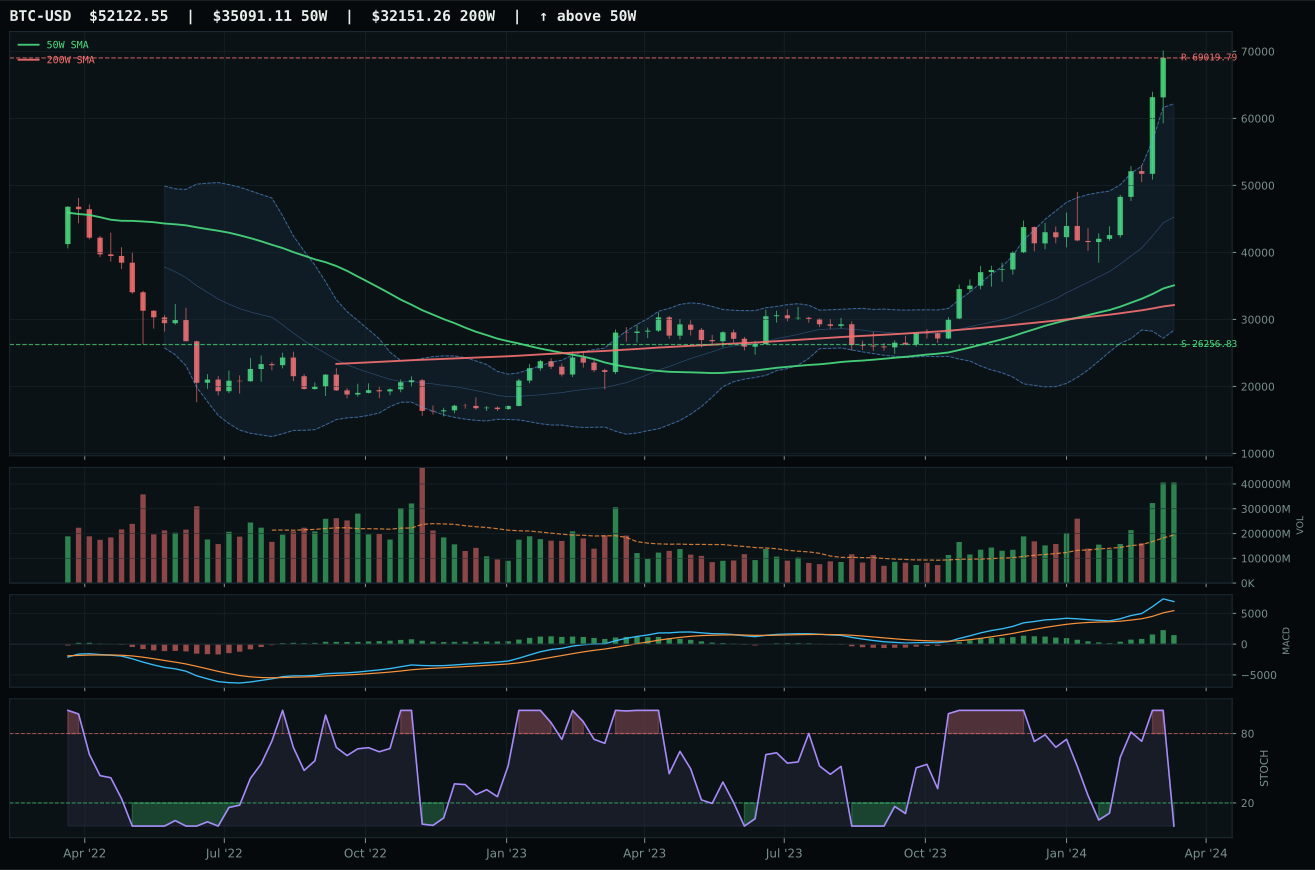
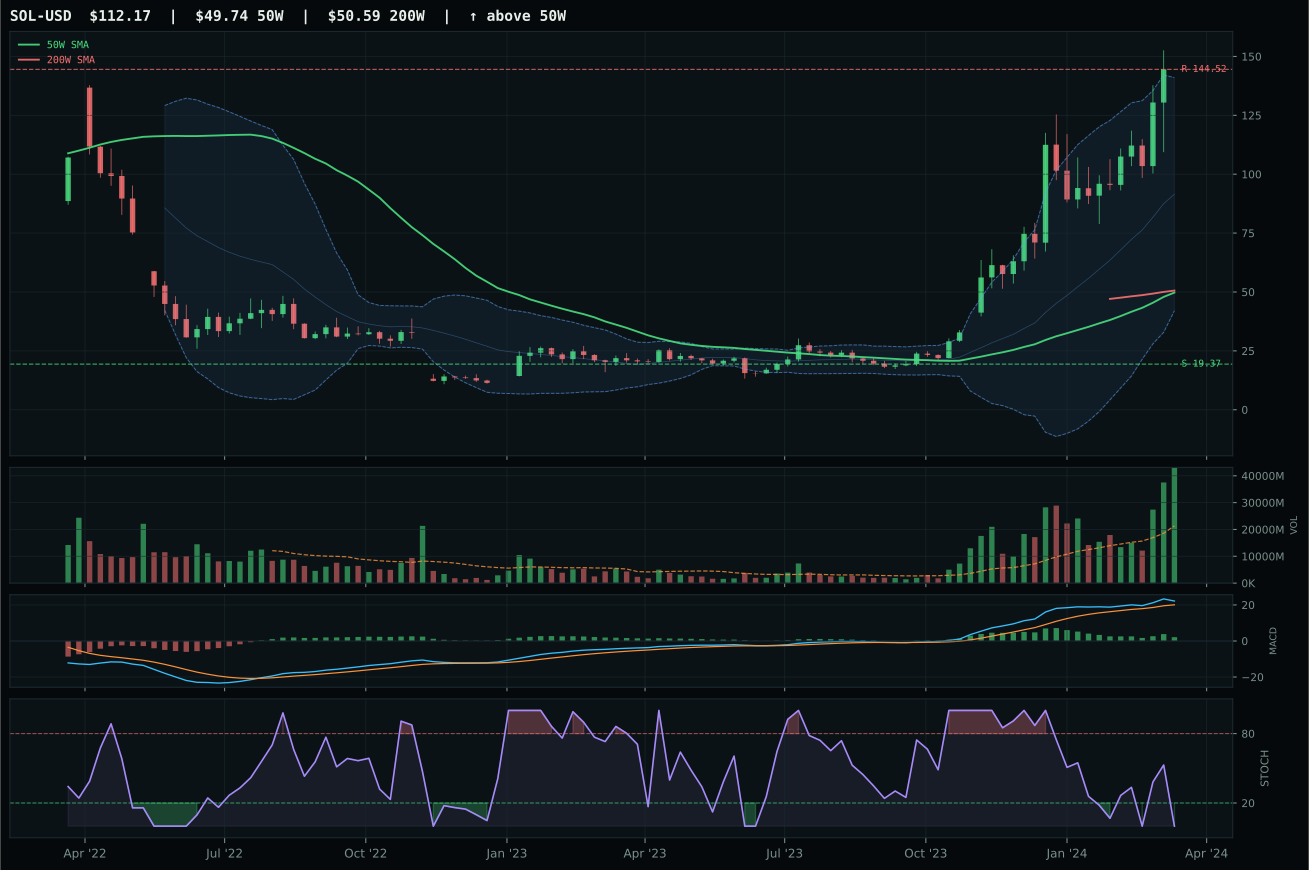
Crypto Regime — TrendBTC
post-touch structure is too wide to count as a range; max/min close ratio is 3.17
TrendBTC confirmed: 2 consecutive closes above rising/flat 50W SMA
one or more available conditions failed
Category Rankings
| Rank | Category | Winner | Score | Alloc | 4W Ret | Peers (4W) |
|---|---|---|---|---|---|---|
| 1 | Traditional Energy | XLE | 70.0 | 20% | +5.92% | XOP +6.6% · FCG +6.7% |
| 2 | AI | SMH | 58.9 | 20% | +0.71% | BOTZ -5.5% · AIQ +0.5% |
| 3 | Precious Metals | SLV | 49.3 | 10% | +13.32% | GLD +9.2% · GDX +14.1% |
| 4 | Industrial Metals | COPX | 49.1 | 10% | +11.47% | PICK +7.3% · REMX +2.2% |
| 5 | Defense & Aerospace | XAR | 46.3 | 10% | -1.80% | ITA +1.8% · ROKT +0.2% |
| 6 | Nuclear Energy | NLR | 42.6 | 10% | +7.52% | URNM +10.5% · URA +8.1% |
| 7 | Technology | XLK | 39.2 | 10% | -0.20% | CIBR -1.7% · IGV -1.1% |
| 8 | Utilities & Infrastructure | PAVE | 36.6 | 10% | +1.54% | IGF -0.1% · XLU +2.6% |
| 9 | Emerging Markets | IEMG | 21.0 | 0% | -0.37% | INDA +1.8% · ILF -1.8% |
| 10 | Agriculture & Livestock | MOO | 18.2 | 0% | -1.34% | VEGI +0.5% · WEAT +2.9% |
Traditional Energy — XLE
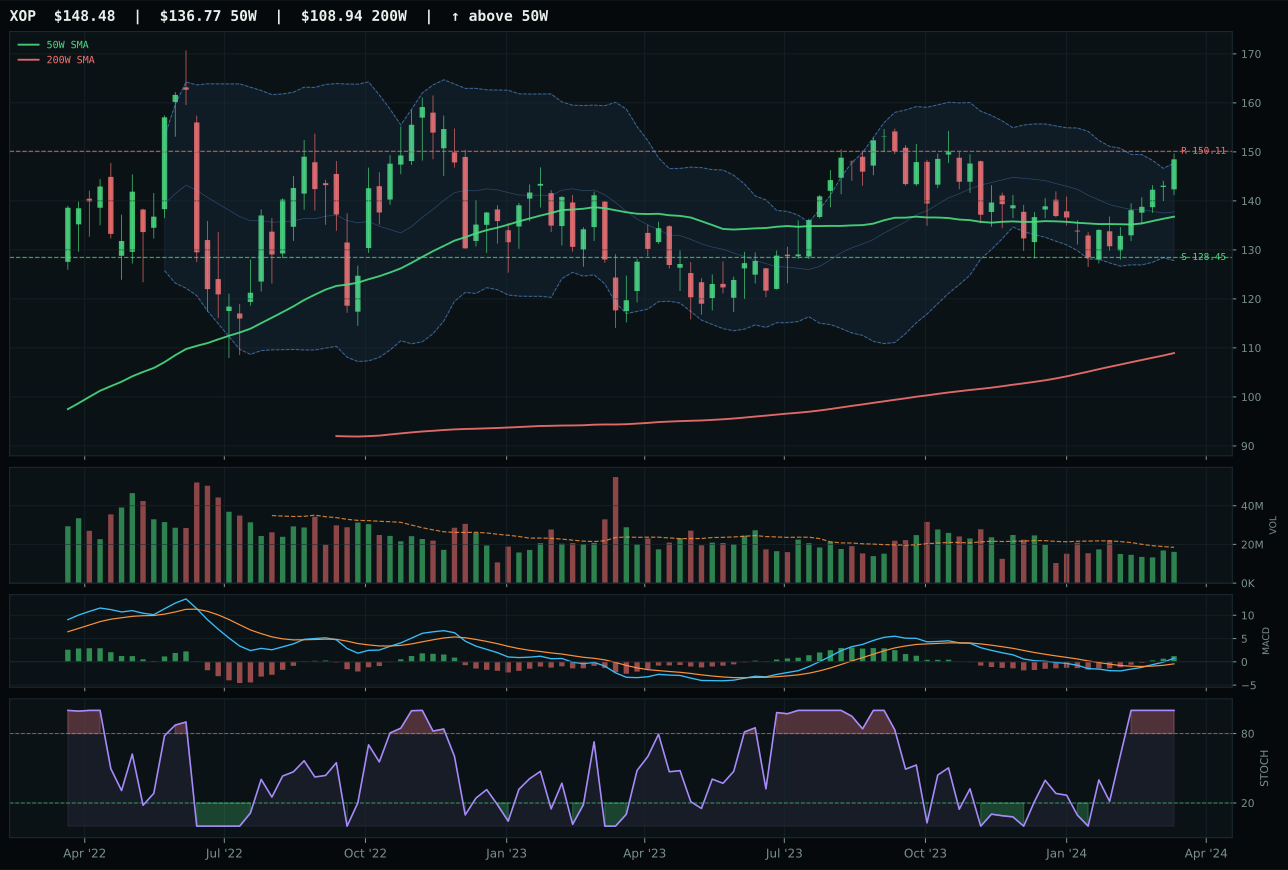
XOP has a neutral structure profile with -0.0% 13-week relative strength versus SPY.
A failed hold above support would weaken the setup.
Actionable but governed by invalidation levels.
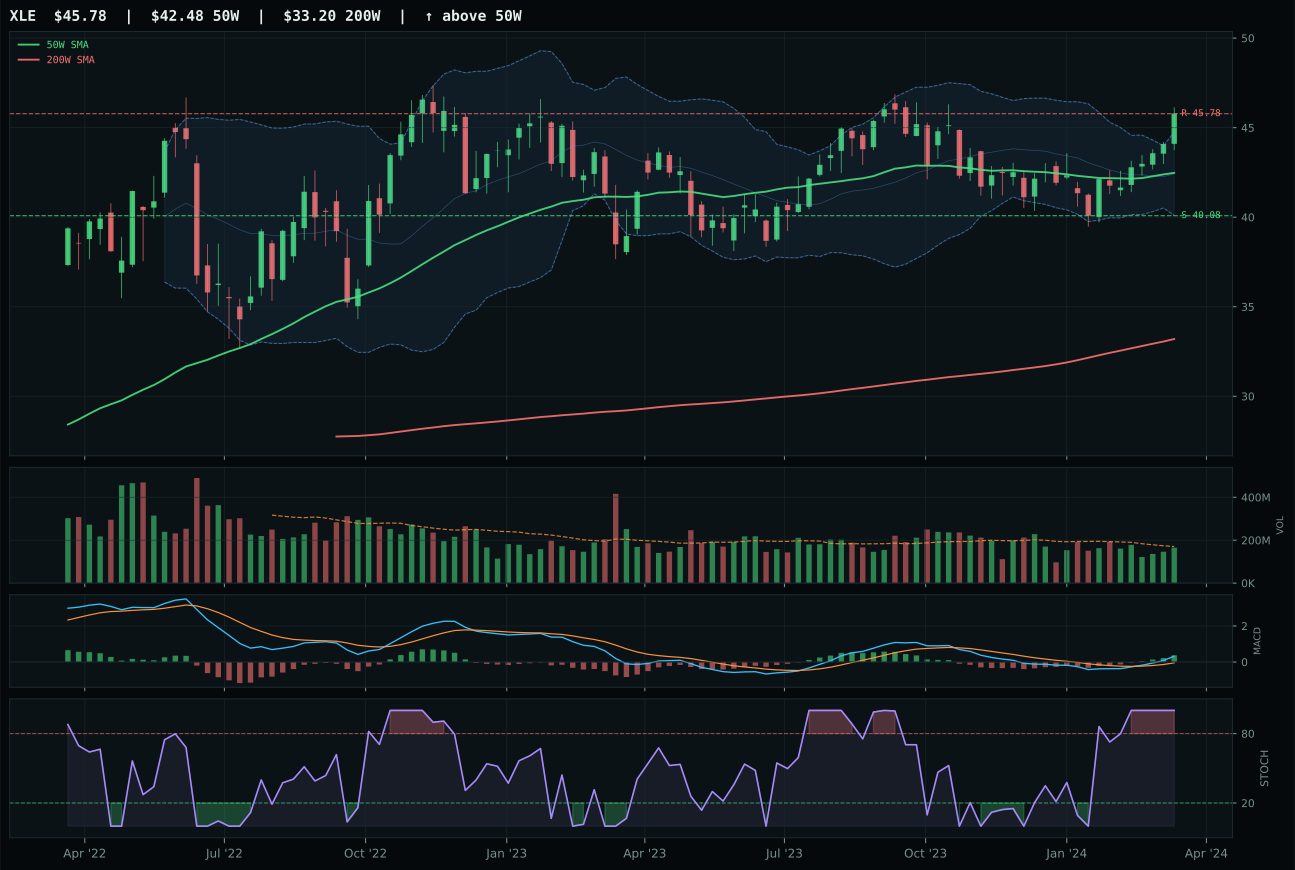
XLE has a neutral structure profile with -0.0% 13-week relative strength versus SPY.
A failed hold above support would weaken the setup.
Actionable but governed by invalidation levels.
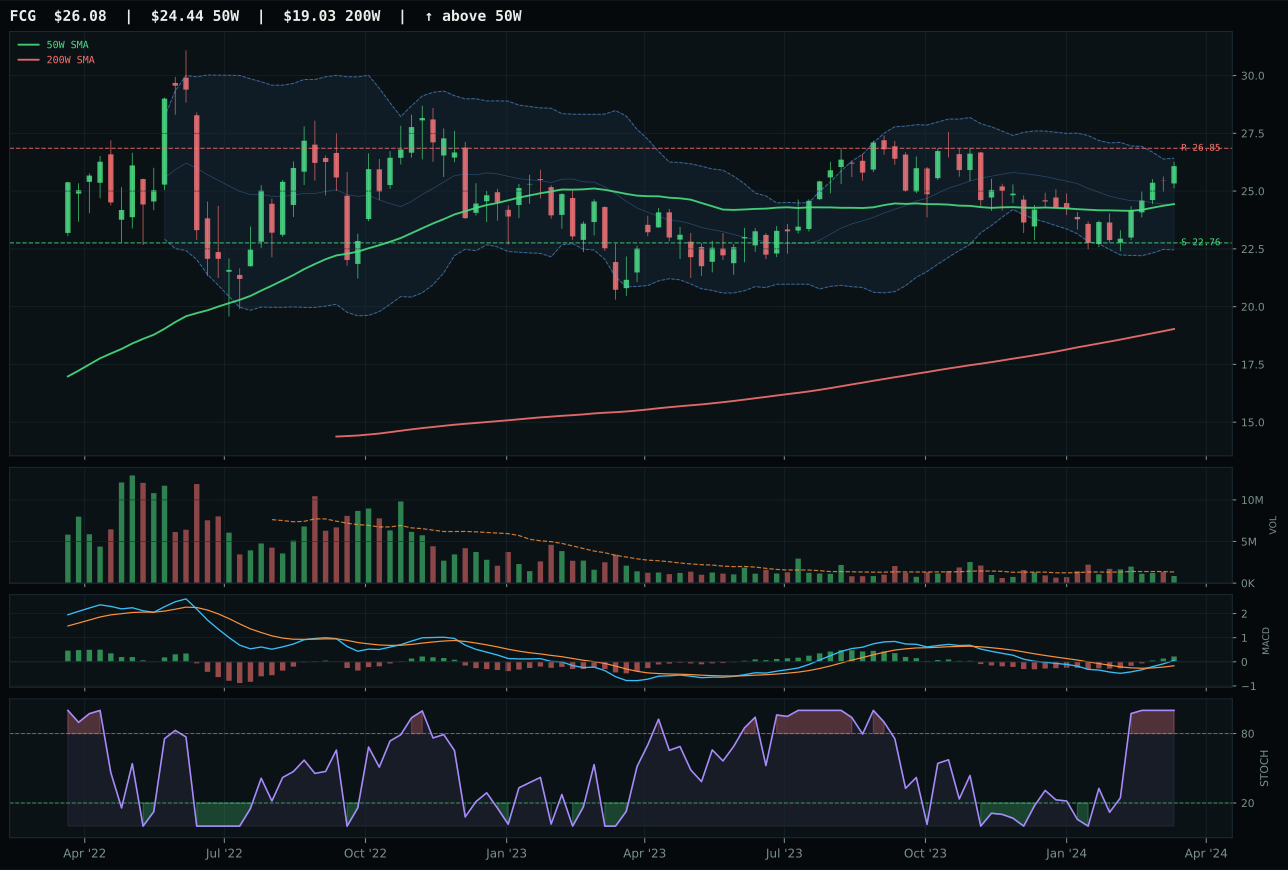
FCG has a neutral structure profile with -0.9% 13-week relative strength versus SPY.
A failed hold above support would weaken the setup.
Actionable but governed by invalidation levels.
XLE earns top-2 allocation through a straightforward technical narrative: price above both major moving averages, 50W slope of 0.2%, MACD bullish and improving, and RS vs SPY at -0.0%—trend confirmation with zero peer competition. The 8.6% 13-week return and overbought stochastic RSI (1.00) are textbook late-move mechanics that would normally trigger caution, yet the category macro fit is strong enough to justify the allocation despite extended technicals. Structure scores 74.7/100 (neutral, 58.3 cleanliness), and risk/reward of 55.1/100 is the highest in the category, meaning the downside-to-support cushion (14.2%) exceeds the upside-to-resistance overshoot (0.0%). Volume sits neutral (0.97x 20W), which is the only technical weakness—the move lacks aggressive participation, suggesting slower supply absorption. XOP lost on risk/reward (46.2 vs 55.1) and marginal structure cleanliness, making XLE the safer integrated-equity representative despite being equally extended on momentum.
Traditional Energy captures top-2 overweight allocation at 10%, one of only two categories (alongside AI) earning this tier in a portfolio designed for late-cycle reflation. The category score of 70.0 reflects 79.5/100 technical evidence paired with 69.0/100 macro fit, the second-highest category macro score after Precious Metals and Industrial Metals (not top-2). Energy scarcity is the active sponsor (+14 macro points), supplemented by real asset sponsorship (+5) and late-cycle reflation (+12), while liquidity and credit stress (-7 each) represent modest headwinds. XLE's 100.0 trend score and 82.3 momentum confirmation deliver the technical case, even though the neutral volume participation leaves the move vulnerable to quick distribution. The 10% allocation positions the portfolio for sustained oil-market tightness and capital discipline in upstream investment; this persists as long as the energy scarcity descriptor remains active. A break below the 50-week moving average on distribution volume would warrant immediate tier-2 demotion, given the overbought stochastic RSI leaves no room for failed breakouts.
AI — SMH
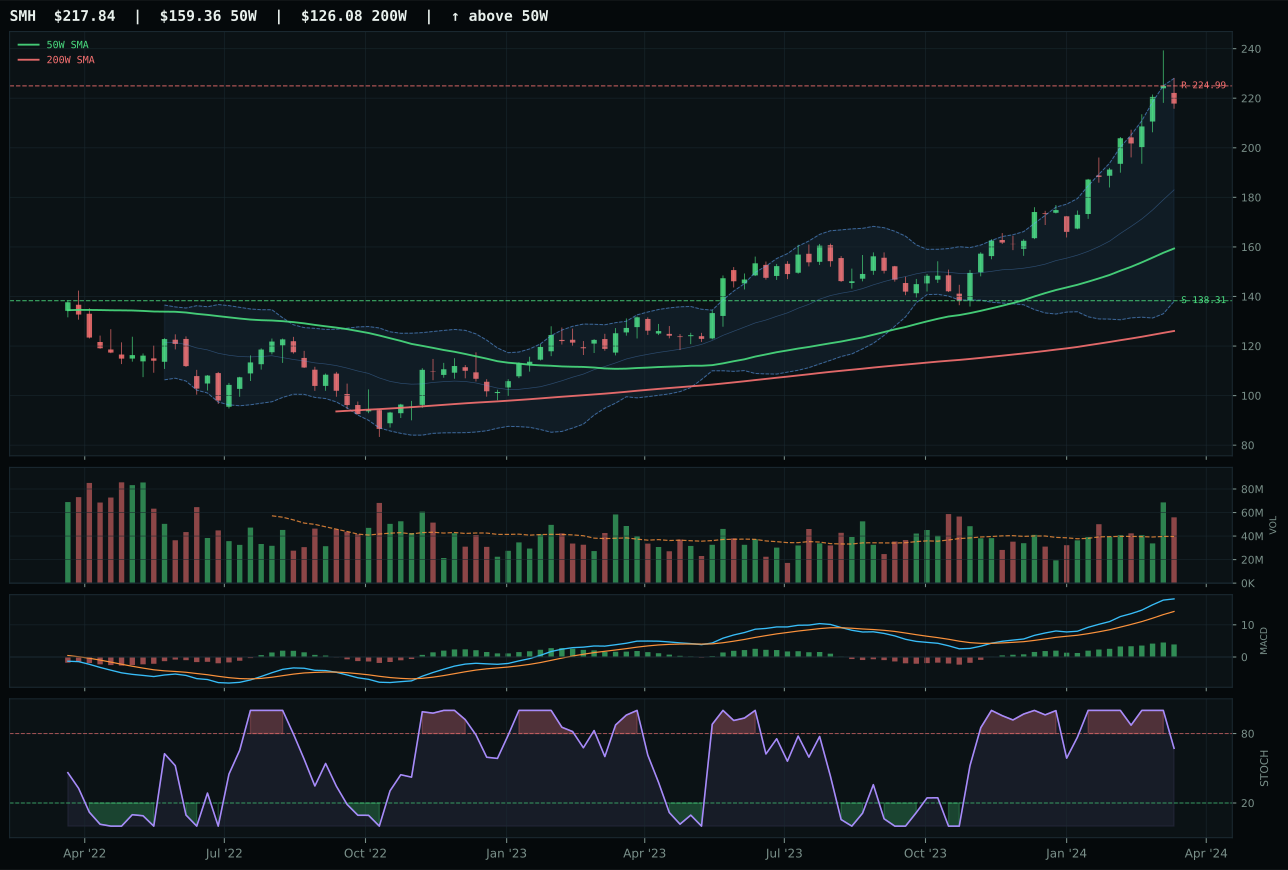
SMH has a vertical extension profile with 16.5% 13-week relative strength versus SPY.
A failed hold above support would weaken the setup.
Actionable but governed by invalidation levels.
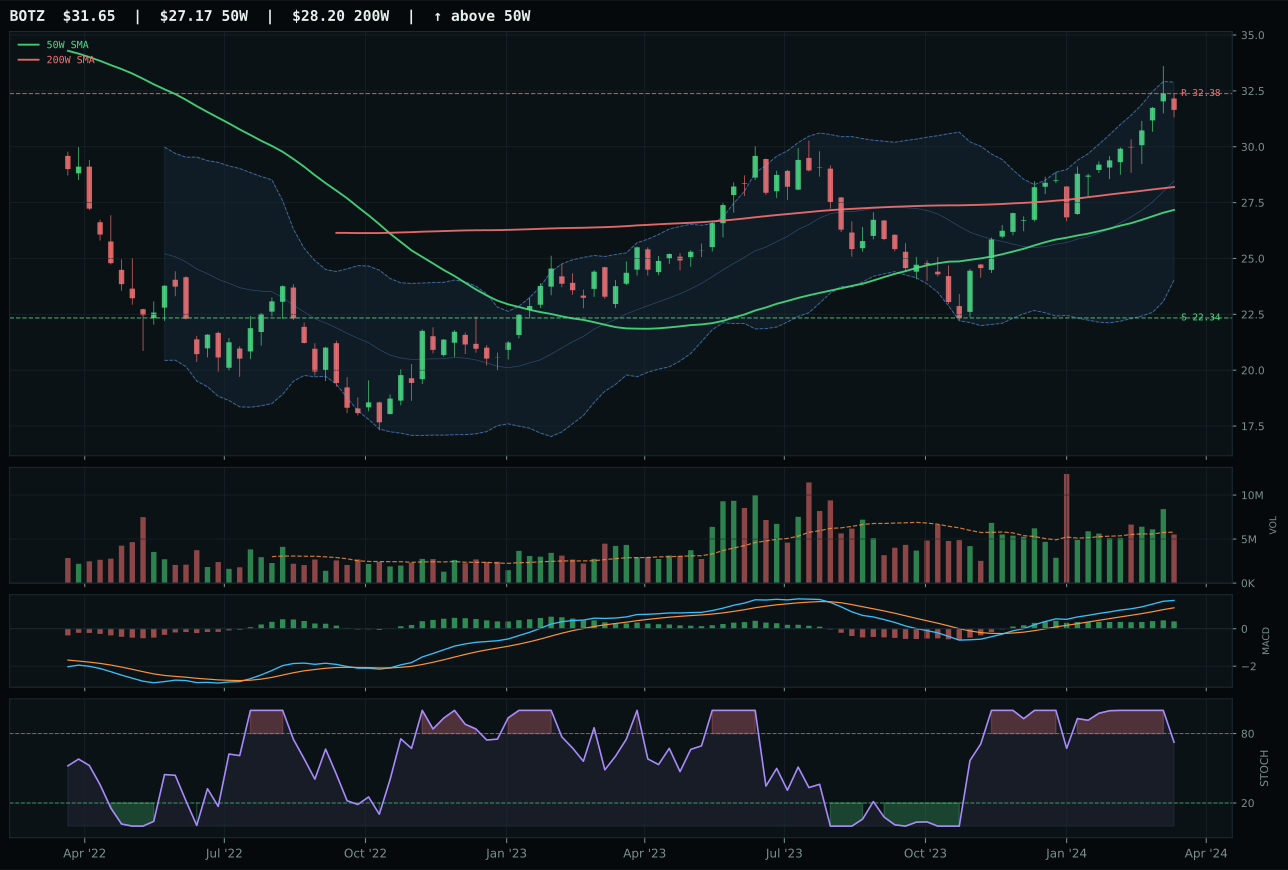
BOTZ has a vertical extension profile with 3.6% 13-week relative strength versus SPY.
A failed hold above support would weaken the setup.
Actionable but governed by invalidation levels.
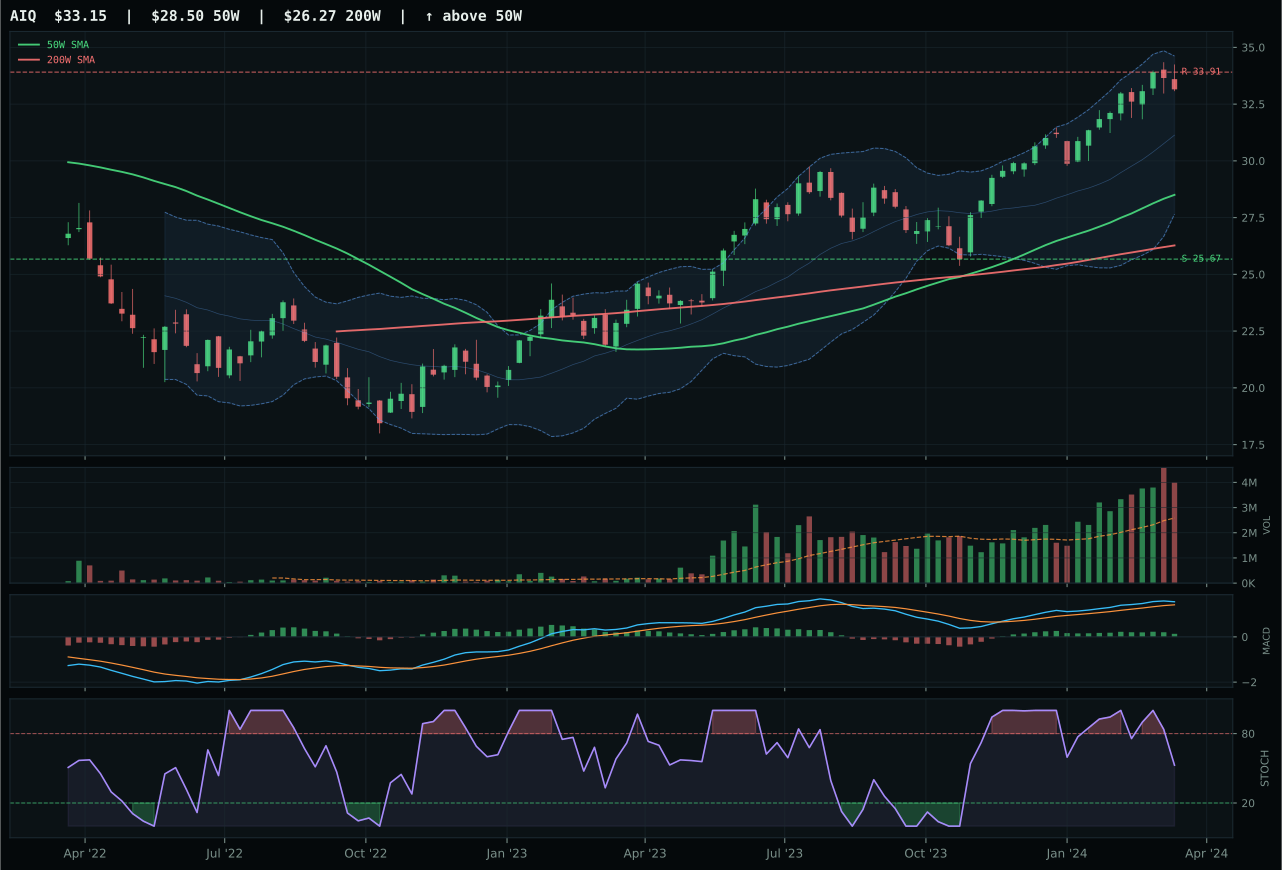
AIQ has a vertical extension profile with -0.4% 13-week relative strength versus SPY.
A failed hold above support would weaken the setup.
Actionable but governed by invalidation levels.
SMH dominates the AI category through dominant trend confirmation and category-relative acceleration that leaves BOTZ behind decisively. The semiconductor ETF sits 36.7% above its 50-week moving average—an extreme extension that would normally be penalized—yet trend and momentum scores of 100 each reflect the quality of the underlying move: price above both the 50- and 200-week averages, a 1.1% 50-week slope, MACD bullish and improving, and 25.1% 13-week return with 16.5% RS versus SPY. Volume participation at 1.41x the 20-week average adds credibility to the persistence (89.7/100). BOTZ matches SMH on some metrics (trend 100, timing 53) but collapses on volume confirmation (neutral vs above-average participation) and category-relative strength (0.0% vs 12.9%), revealing that the robotics thesis is lagging the compute cycle. That 12.9-point category-relative edge tells the story: SMH is capturing the actual capital flows in AI, not just riding macro sponsorship.
AI earns top-2 overweight allocation at 10%, justified by a 58.9 category score that reflects sustained macro tailwinds and technical leadership in the highest-conviction positioning. The Late-Cycle Reflation regime actively sponsors AI growth (+14 macro points), while risk appetite (+10) and commodity breadth (+7 applied from broader reflation) create a benign backdrop. Credit stress (-8) and liquidity stress (-12) represent headwinds, yet they are outweighed by the deterministic technical evidence—SMH's composite technical score is 85.5/100, the highest among all category representatives. The 10% allocation sits alongside XLE's 10% in the top tier, making AI the growth anchor to energy's commodity play. This positioning persists as long as SMH maintains its volume sponsorship and relative strength edge; if momentum divergences appear or volume participation drops below 1.2x the 20-week average, the category's tier-2 demotion would follow quickly.
Precious Metals — SLV
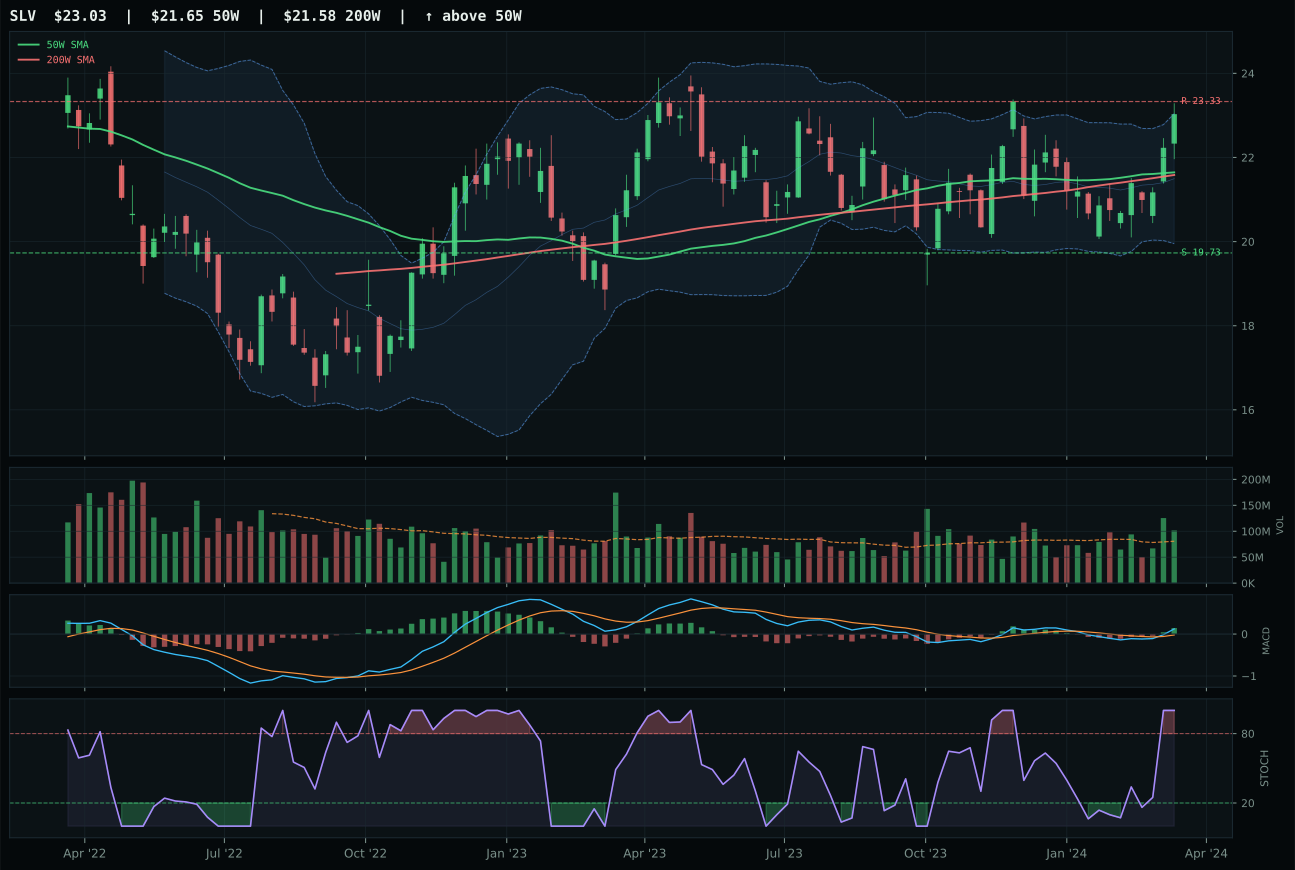
SLV has a neutral structure profile with -3.1% 13-week relative strength versus SPY.
A failed hold above support would weaken the setup.
Actionable but governed by invalidation levels.
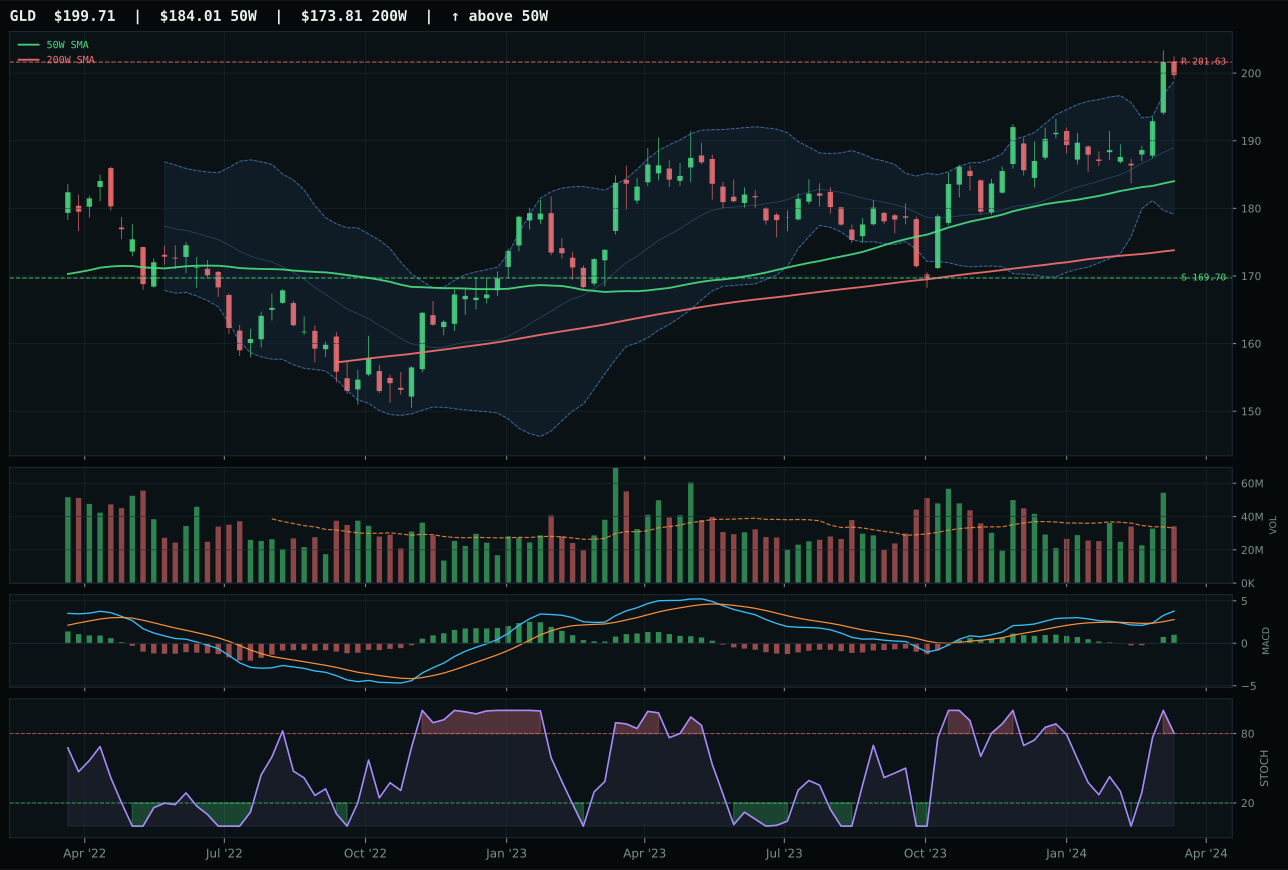
GLD has a neutral structure profile with -1.8% 13-week relative strength versus SPY.
A failed hold above support would weaken the setup.
Actionable but governed by invalidation levels.
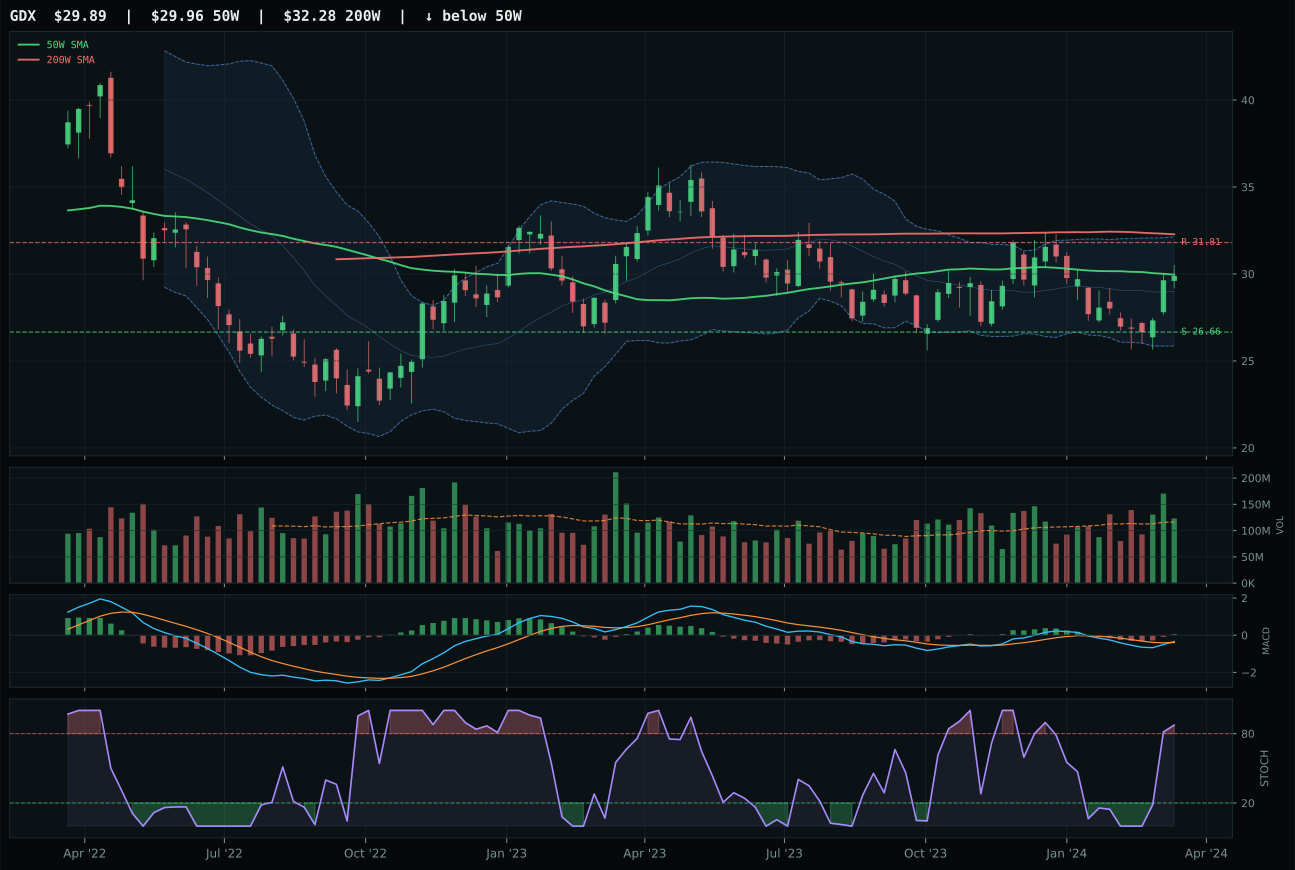
GDX has a compression near 50W profile with -12.1% 13-week relative strength versus SPY.
Extension and support failure are the main tactical risks.
Tracked, but not top-2 eligible because: structurally broken.
SLV takes Precious Metals on a thread: trend and timing are strong (95.3 and 75.0 respectively), but the winner owns just 0.0% category-relative strength in a basket where that metric matters for conviction. Price sits 6.4% above the 50-week moving average with MACD bullish and improving and volume confirmation at 1.26x the 20-week average, yet stochastic RSI is at overbought extreme (1.00), signaling momentum exhaustion. Structure is neutral (71.5/100) with tight 3.6% range between support and resistance relative to price, which constrains r/r to 46.4—manageable but uninspiring. GLD lost marginally: its trend is even stronger (97 vs 95.3), MACD identical, yet volume sits at neutral (vs SLV's above-average participation), and its risk/reward is marginally weaker (46.0 vs 46.4). The 1.0-point category score gap is the narrowest among all category decisions; this is a coin flip masked by technical metrics. SLV's edge lies solely in volume participation—the deciding factor in a category where both leaders show momentum topping.
Precious Metals receives 5% tier-2 allocation despite its 49.3 category score, which ranks it comfortably above Utilities (36.6) and Agriculture (18.2) but below the top-2 threshold. The macro fit is modest at 46.0/100 because risk appetite is actively negative (-4 points), offsetting the metals scarcity tailwind (+7). Metals scarcity is a genuine structural sponsor, yet the Late-Cycle Reflation regime is designed to favor growth and productive assets (energy, industrial metals, semiconductors) over monetary hedges. The 5% slot preserves exposure to any surprise inflation acceleration or credit stress that could drive a fast rotation into gold; however, the category's extension (SLV 6.4% above 50W, GLD well-extended relative to peers) and overbought momentum readings argue against loading here. If gold breaks below its 50-week moving average and stochastic RSI falls below 0.50 with volume participation declining, the category's allocation would be reconsidered downward. For now, it functions as a modest tail-hedge in a growth-biased regime.
Industrial Metals — COPX
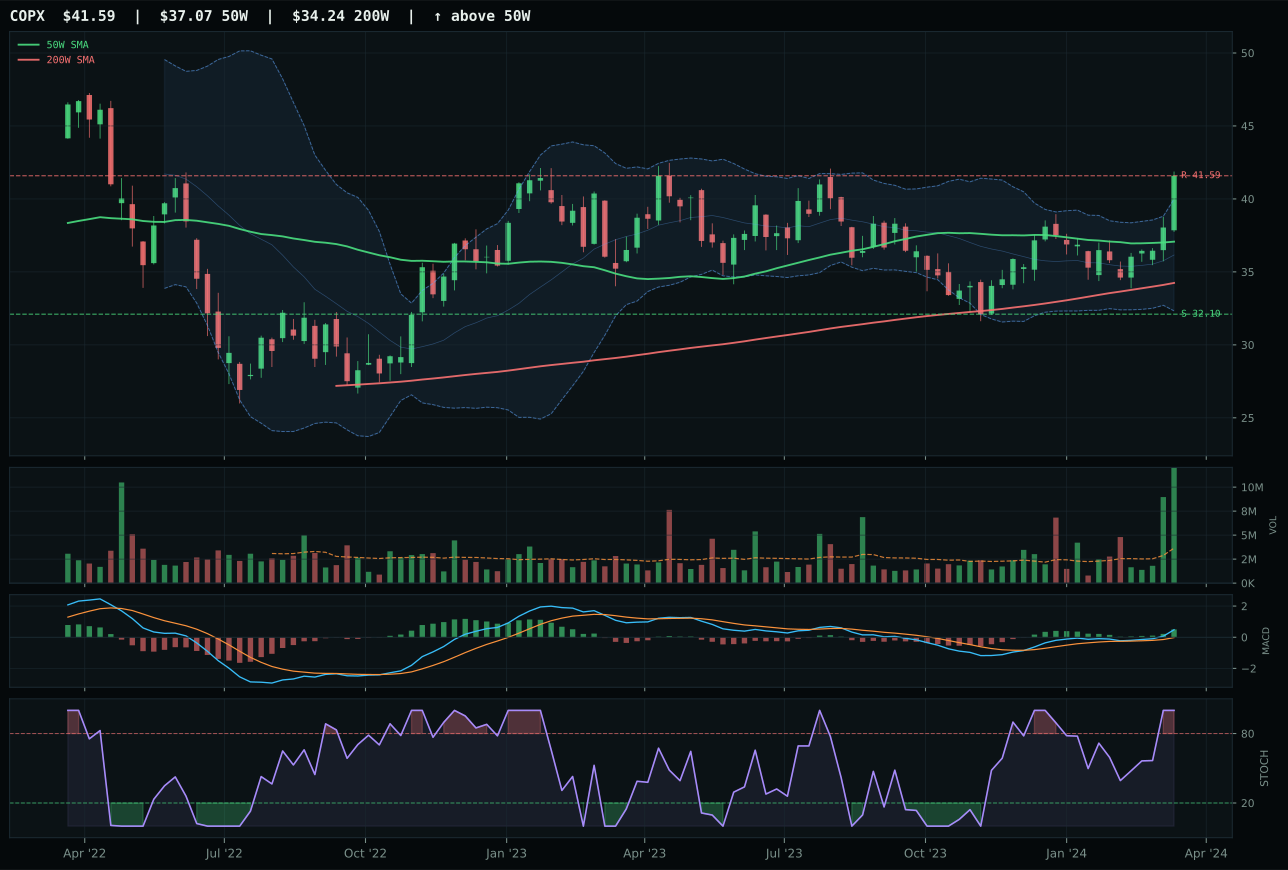
COPX has a neutral structure profile with 3.3% 13-week relative strength versus SPY.
A failed hold above support would weaken the setup.
Actionable but governed by invalidation levels.
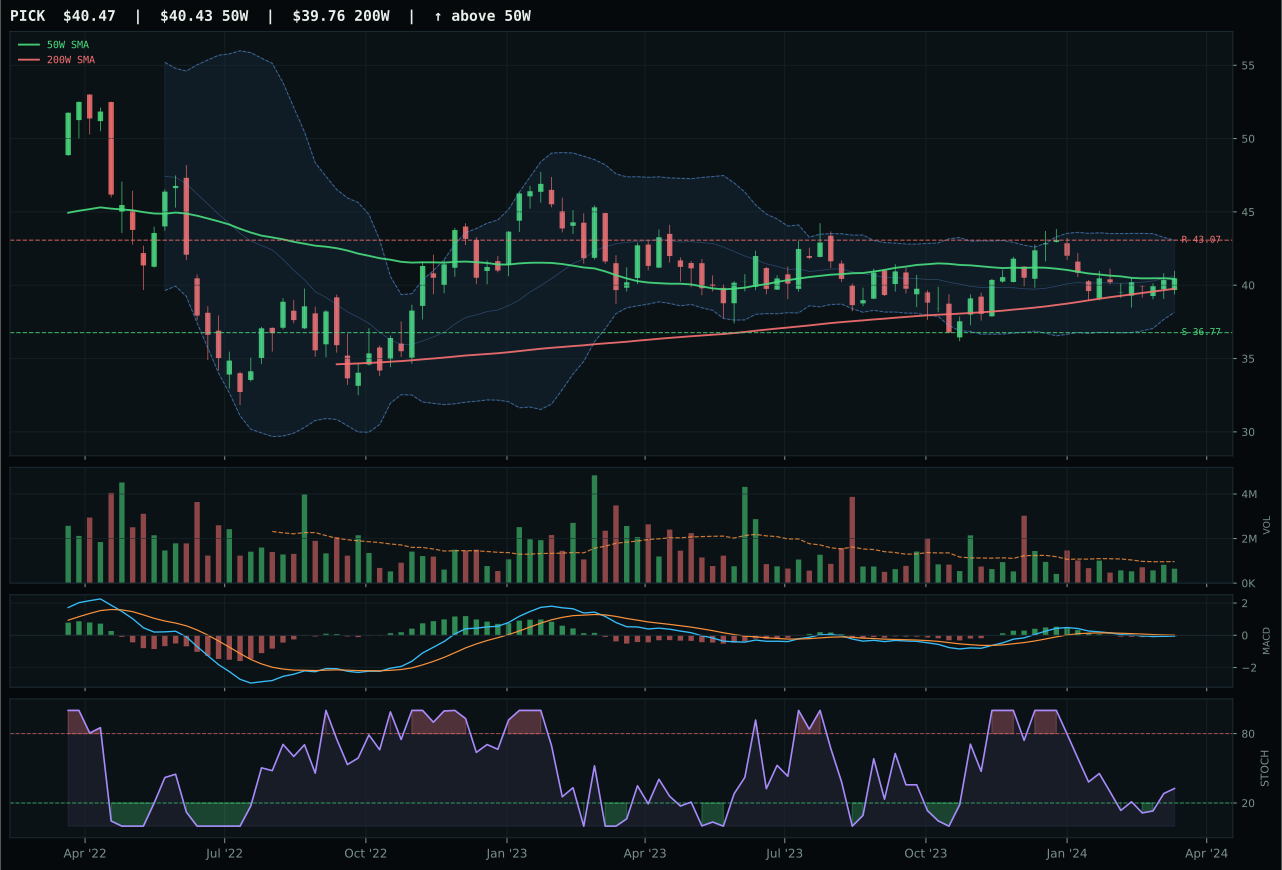
PICK has a compression near 50W profile with -13.1% 13-week relative strength versus SPY.
A failed hold above support would weaken the setup.
Actionable but governed by invalidation levels.
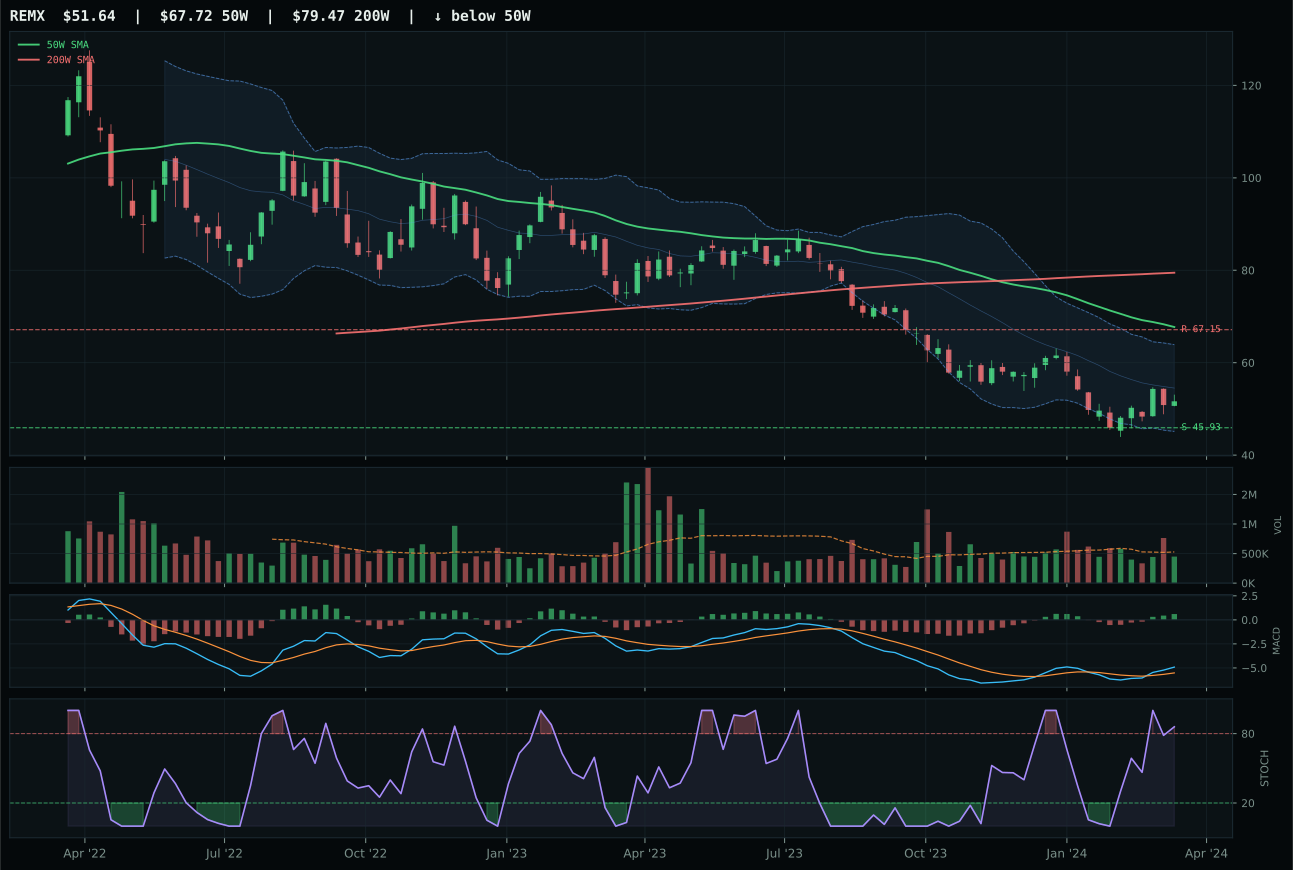
REMX has a neutral structure profile with -21.0% 13-week relative strength versus SPY.
Extension and support failure are the main tactical risks.
Tracked, but not top-2 eligible because: structurally broken.
COPX dominates Industrial Metals through a rare combination of clean trend, explosive momentum, and volume conviction that is unambiguous across all metrics. Price sits 12.2% above the 50-week moving average with a 0.2% 50W slope, MACD bullish and improving, stochastic RSI at overbought (1.00), and volume at 4.68x the 20-week average—accumulation/confirmation grade participation. The 13-week return of 11.9% and category-relative strength of 16.4% are the highest in the metals complex; RS vs SPY at 3.3% shows COPX is outperforming the broad market, not just its peers. Momentum and volume-price confirmation both score 100.0, reflecting the quality of sponsorship. PICK trails decisively: structure 69.9 vs 77.1, MACD bearish but improving (vs bullish and improving), volume thin participation (vs accumulation), and category-relative strength 0.0% (vs 16.4%). The 9.9-point final score gap reflects a clean decision—copper is being accumulated, mining breadth is lagging.
Industrial Metals receives 5% tier-2 allocation, supported by the strongest macro fit of any tier-2 category at 75.0/100. Metals scarcity (+14), commodity breadth positive (+10), real asset sponsorship (+6), and late-cycle reflation (+10) combine to create a structural tailwind that makes the category a legitimate allocation despite its outside-top-2 ranking. COPX's technical evidence of 100.0/100 is the portfolio's highest among tier-2 holdings, bridging the gap between a sector with genuine macro sponsorship and overbought near-term technicals. The risk to maintaining this position is sharp: COPX sits at extended fibonacci levels with zero upside to resistance (0.0%) and limited margin of safety. If volume participation drops below 2.0x the 20-week average or MACD begins to flatten, the setup converts from accumulation into distribution, and tier-2 allocation would face downward pressure. The category is pinned at 5% rather than elevated to 10% because the technical extension and stochastic exhaustion argue against loading aggressively, despite the compelling macro backdrop.
Defense & Aerospace — XAR
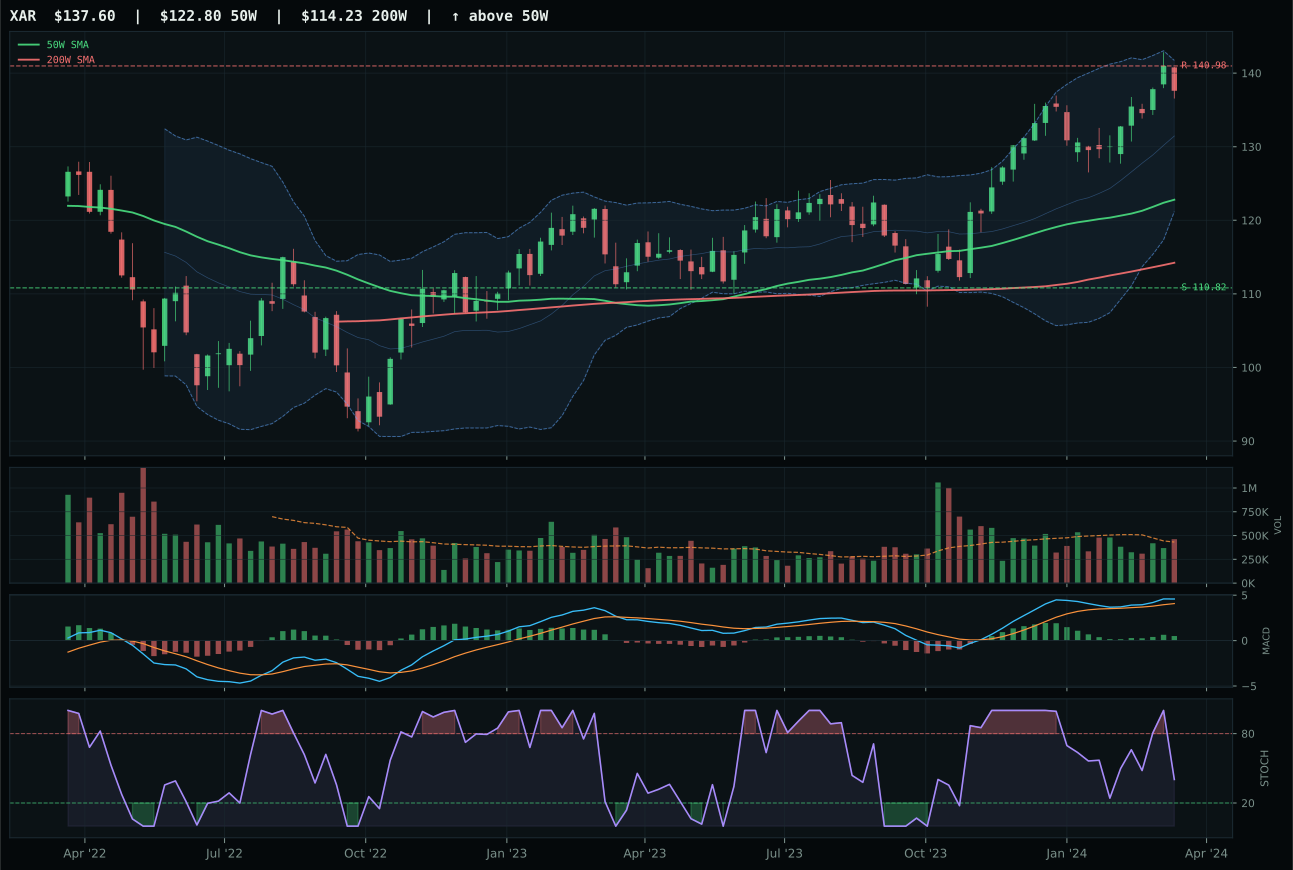
XAR has a neutral structure profile with -5.3% 13-week relative strength versus SPY.
A failed hold above support would weaken the setup.
Actionable but governed by invalidation levels.
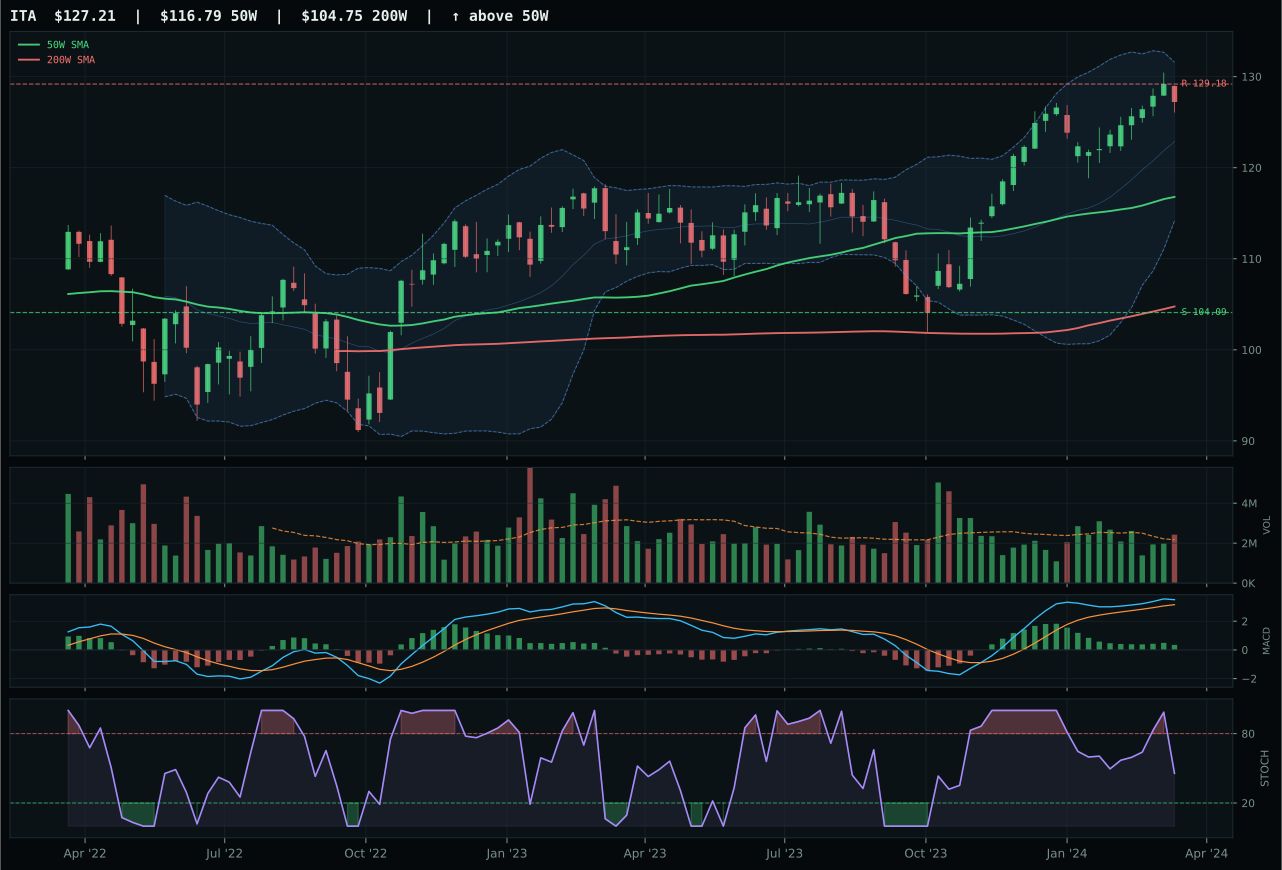
ITA has a neutral structure profile with -6.8% 13-week relative strength versus SPY.
A failed hold above support would weaken the setup.
Actionable but governed by invalidation levels.
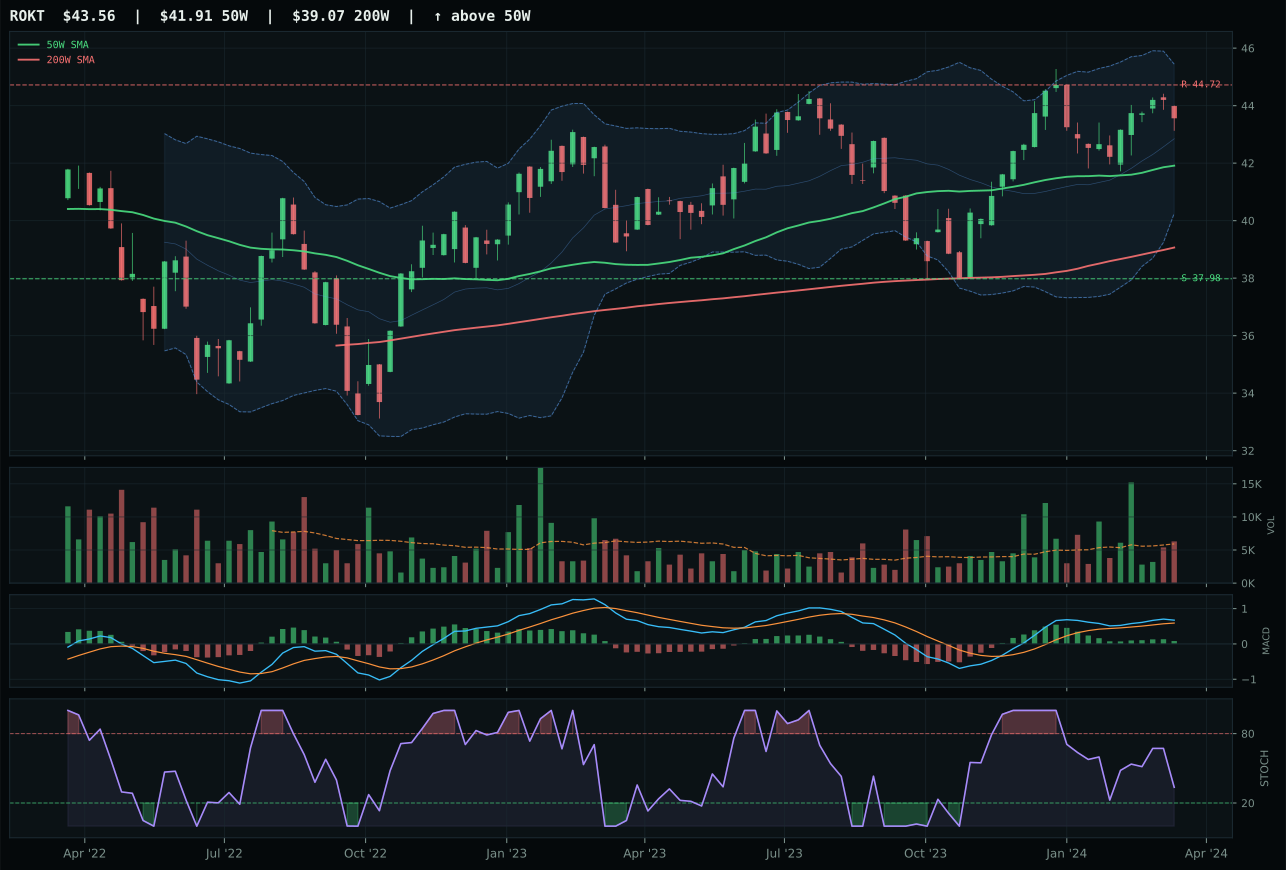
ROKT has a neutral structure profile with -9.0% 13-week relative strength versus SPY.
A failed hold above support would weaken the setup.
Tracked, but not top-2 eligible because: .
XAR wins Defense & Aerospace despite trailing SPY by 5.3% over 13 weeks, a deficit that forces reliance on internal category leadership and steady chart mechanics rather than absolute momentum. Price sits 12.1% above the 50-week moving average with MACD bullish and improving—a crisp timing advantage that matters in a relatively sideways category. Structure scores 72.7/100 (neutral setup, 50% cleanliness, strong 85.1 compression), and the 1.5% category-relative strength edge over the median provides just enough peer differentiation to claim the representative slot. ITA lost on timing (75.0 vs 70.0), marginal risk/reward (46.8 vs 46.2), and a flattening MACD despite above-average volume participation—the classic late-move rejection pattern. XAR's neutral relative positioning and steady timing cadence make it the resilient choice in a category that lacks absolute strength but has merit in a late-cycle environment where defense and durability align with fiscal support.
Defense & Aerospace receives 5% allocation in tier-2, a position justified by a 46.3 category score anchored in reasonable macro fit (57.0/100) despite weak absolute technical readings. The category benefits from late-cycle reflation tailwinds (+6 macro points), transition/mixed structural positioning (+3), and modest credit stress relief (+2), yet liquidity stress (-4) remains a constraint. XAR's technical evidence score of 72.9 is solid enough to sustain tier-2 status, even though the category's 13-week return of 3.3% sits well below the portfolio baseline. The 5% allocation serves a portfolio role as a defensive income and durability hedge against equity multiple compression, complementing the growth (AI) and commodity (XLE, COPX) positions. For promotion to top-2, the category would require either stronger absolute momentum convergence (MACD and stochastic RSI rising together with price) or a meaningful shift in the macro regime toward risk-off positioning that favors noneconomic sensitivity.
Nuclear Energy — NLR
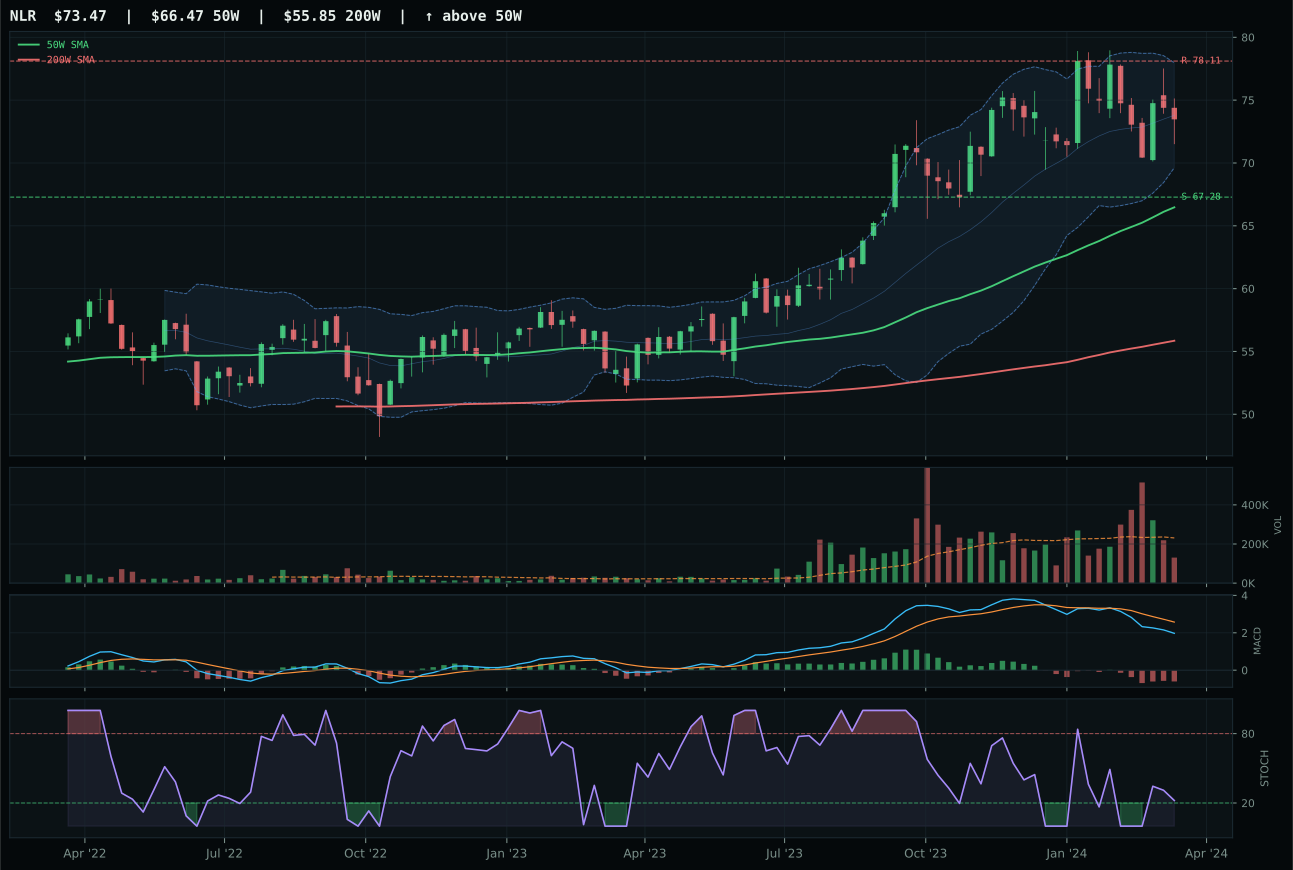
NLR has a neutral structure profile with -9.4% 13-week relative strength versus SPY.
A failed hold above support would weaken the setup.
Actionable but governed by invalidation levels.
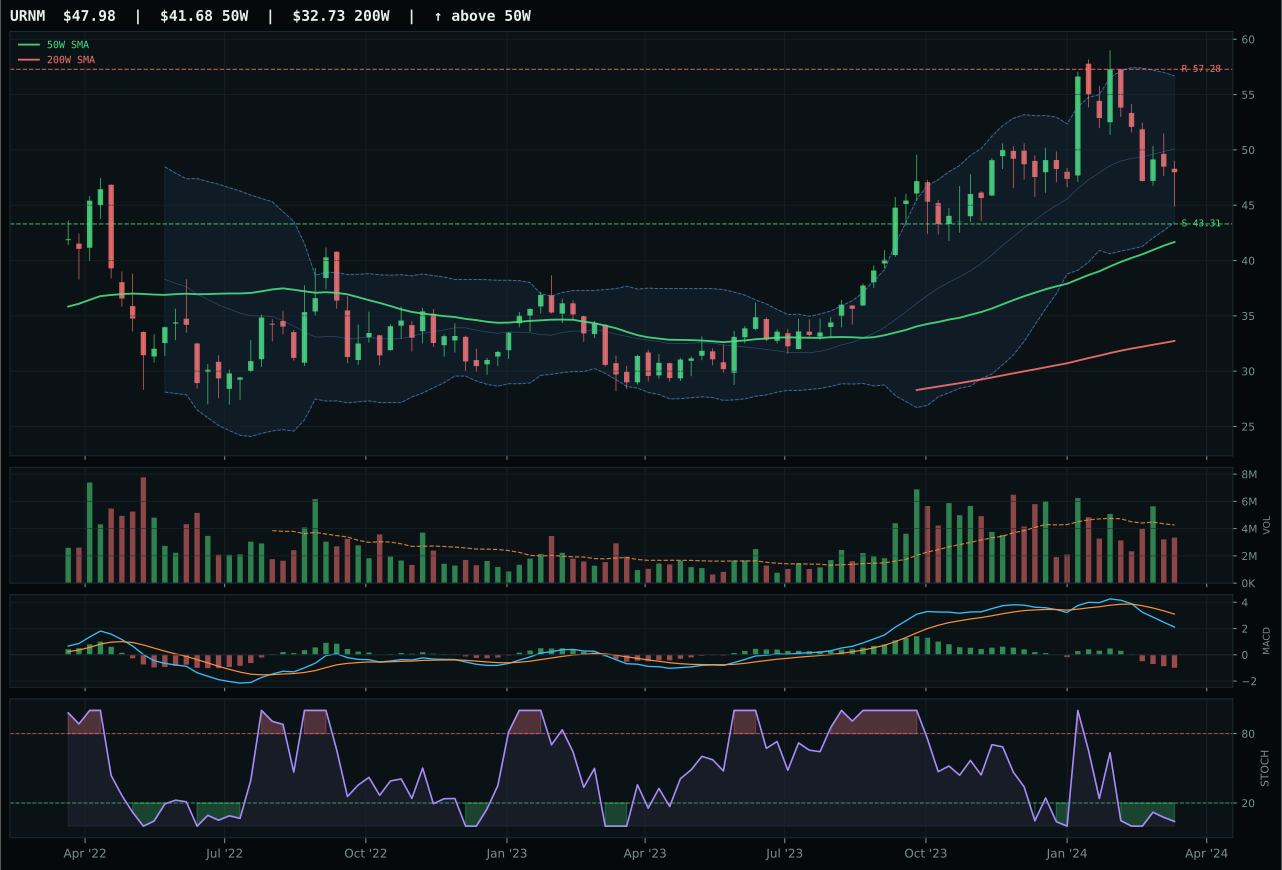
URNM has a vertical extension profile with -7.7% 13-week relative strength versus SPY.
A failed hold above support would weaken the setup.
Actionable but governed by invalidation levels.
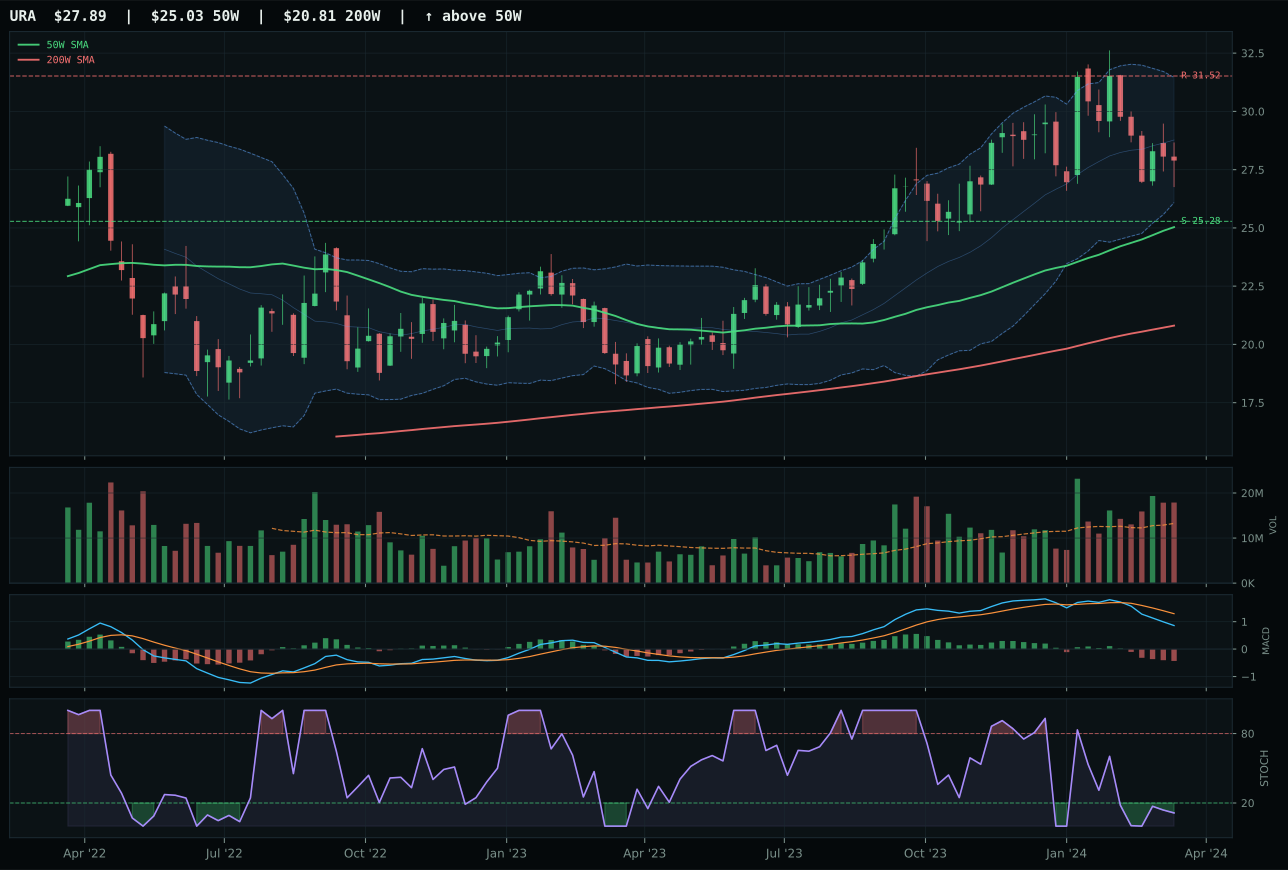
URA has a neutral structure profile with -12.5% 13-week relative strength versus SPY.
A failed hold above support would weaken the setup.
Actionable but governed by invalidation levels.
NLR wins Nuclear Energy despite weak absolute momentum by default in a category where all three representatives show structural decay—price above the 50W (67.9 trend score) but MACD bearish/weakening and 13-week return negative at -0.8%. The differentiation comes from timing and risk/reward geometry: NLR sits 10.5% above the 50W with stochastic RSI rising into mid-zone (0.22), suggesting early repair mechanics if the bearish MACD can stabilize. Risk/reward is 56.6, centered on a 9.2% downside-to-support buffer and 5.9% upside-to-resistance constraint—an unfavorable asymmetry that limits conviction. Volume is thin participation (0.56x 20W average), the weakest in the category and a critical red flag. URNM loses on timing (62.0 vs 78.0) and structure (58.5 vs 61.1) despite a less-extended stochastic position (oversold turn up vs rising mid-zone); the uranium-miner beta is pinned in a worse setup. Both are poor choices, but NLR's neutral structure and rising stochastic offer a thread of hope that URNM's oversold reversal lacks.
Nuclear Energy receives 5% tier-2 allocation despite a weak 42.6 category score, sustained by 66.0/100 macro fit and energy scarcity sponsorship (+9). The allocation is defensible only through macro composition: late-cycle reflation (+7), real asset sponsorship (+7), and energy scarcity make nuclear exposure a structural hedge against sustained commodity inflation and power-demand volatility. NLR's technical evidence score of 38.2 is among the portfolio's weakest tier-2 holdings, reflecting negative 13-week momentum, thin volume, and a bearish MACD. The 5% allocation functions as a speculative position on energy-supply constraints and AI-driven power demand, not a near-term trading setup—if the technicals improve (MACD stabilizing above zero, volume expanding above 1.0x the 20-week average, stochastic RSI rising above 0.50), the category could justify elevation. Conversely, a breakdown of support near 67.28 with continued thin participation would trigger removal to 0%. This is the portfolio's most macro-dependent and technically fragile tier-2 holding.
Technology — XLK
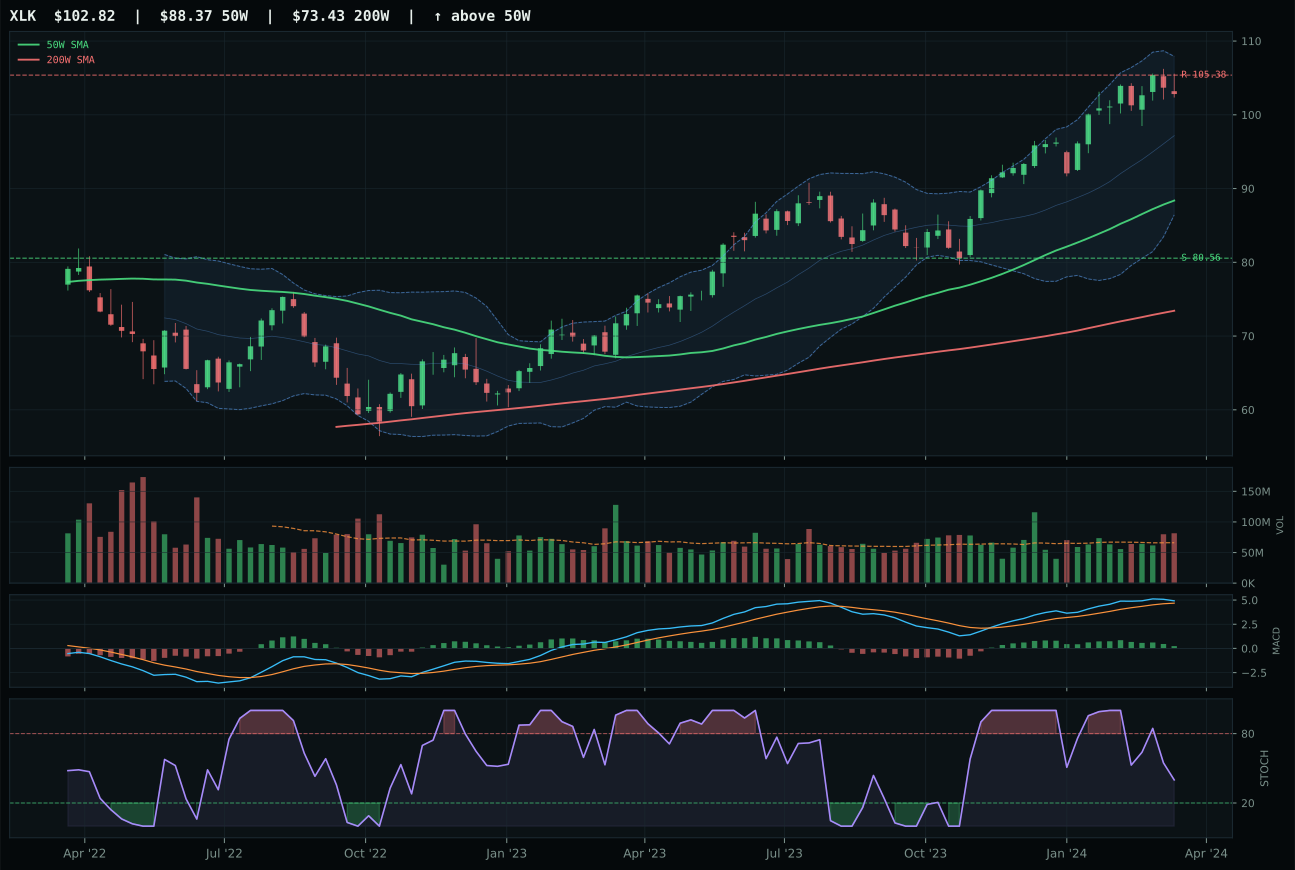
XLK has a vertical extension profile with -1.4% 13-week relative strength versus SPY.
A failed hold above support would weaken the setup.
Actionable but governed by invalidation levels.
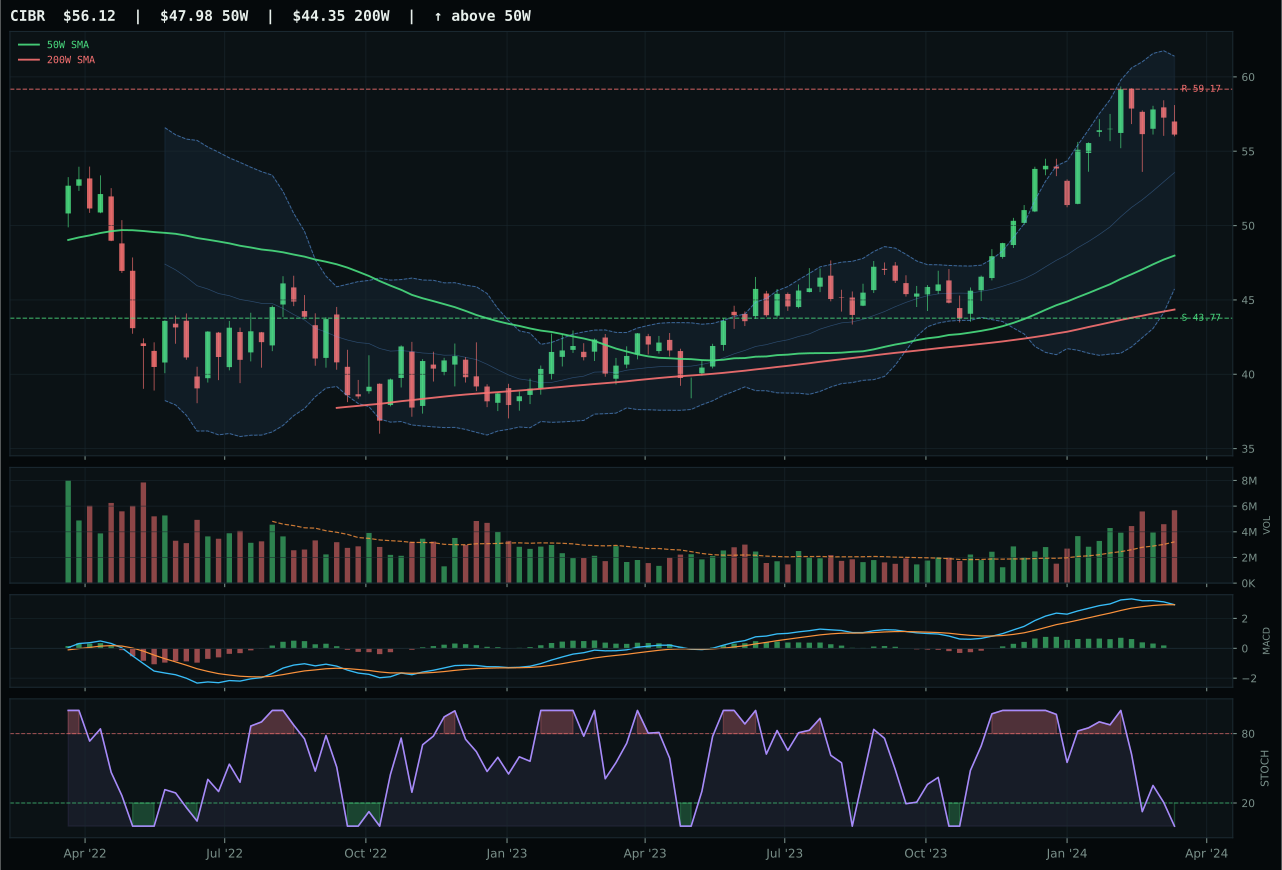
CIBR has a vertical extension profile with -4.3% 13-week relative strength versus SPY.
A failed hold above support would weaken the setup.
Actionable but governed by invalidation levels.
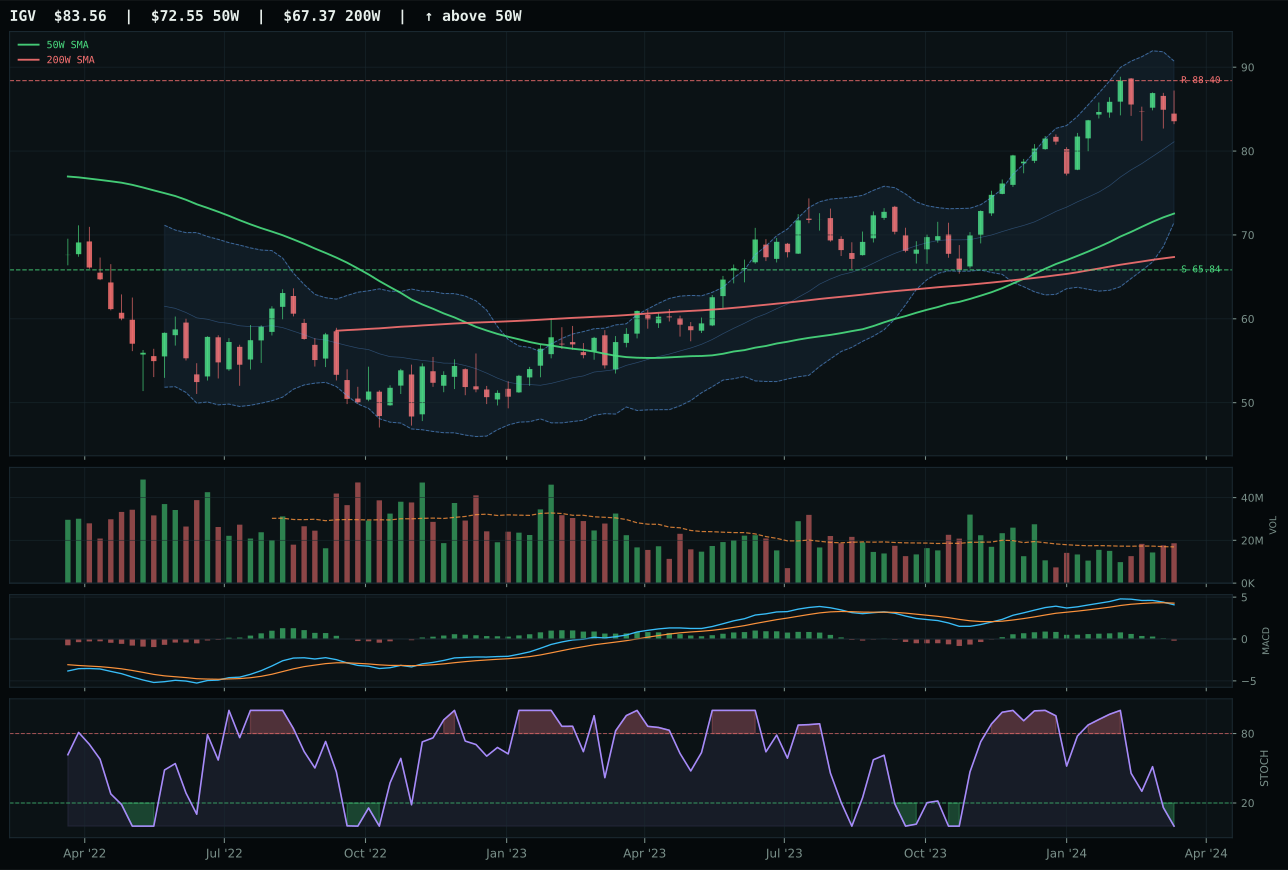
IGV has a vertical extension profile with -4.6% 13-week relative strength versus SPY.
A failed hold above support would weaken the setup.
Actionable but governed by invalidation levels.
XLK captured the technology leadership by combining clean uptrend mechanics with modest relative strength inside its peer set. Price sits 16.3% above the 50-week moving average with a slope of 0.6%, MACD bullish but beginning to flatten, and volume confirmation at 1.23x the 20-week average—enough participation to validate accumulation without the aggressive buying that would signal climax. The 13-week return of 7.3% trails the broader market (RS vs SPY of -1.4%), yet within the three-ETF technology basket, XLK carries a 3.0% relative strength edge over CIBR, which stumbled on weaker structure (68.5 vs 79.9), thinner volume confirmation, and a deteriorating -4.3% SPY-relative reading. The setup is vertical extension into Fibonacci 0.236 resistance near 97.85, where risk asymmetry has begun to shift against new entrants—a meaningful constraint that tempers the score despite XLK's clear peer dominance.
Technology lands at 5% allocation, a tier-2 position that reflects its ranking below the two category winners but above the excluded names. The category score of 39.2 was pulled down by late-cycle reflation dynamics that favor real assets and energy over software and semiconductors; AI growth sponsorship (+6 macro points) and risk appetite (+9) provide some offset, yet active liquidity stress (-10) and credit stress (-7) weigh against cyclical duration exposure. XLK's trend score of 94 and momentum confirmation of 72.4 are strong, but the 40-point timing score—penalizing extension and stalled MACD momentum—limits the category's ability to command top-tier capital. For this allocation to expand, either the macro regime must shift toward growth-rate sponsorship or XLK must pull back into the 50-week moving average and rebuild volume sponsorship, resetting entry risk and creating a fresher setup.
Utilities & Infrastructure — PAVE
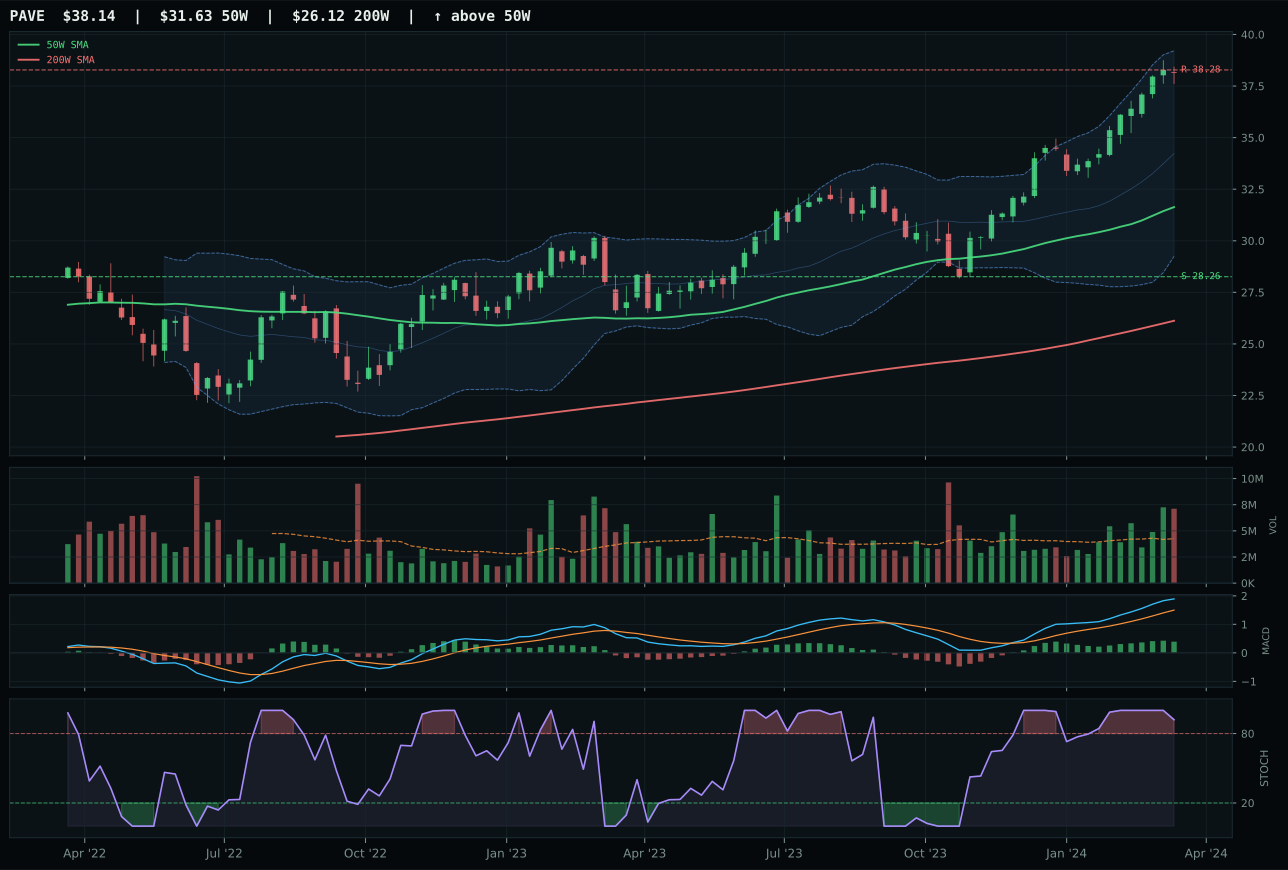
PAVE has a vertical extension profile with 3.5% 13-week relative strength versus SPY.
A failed hold above support would weaken the setup.
Actionable but governed by invalidation levels.
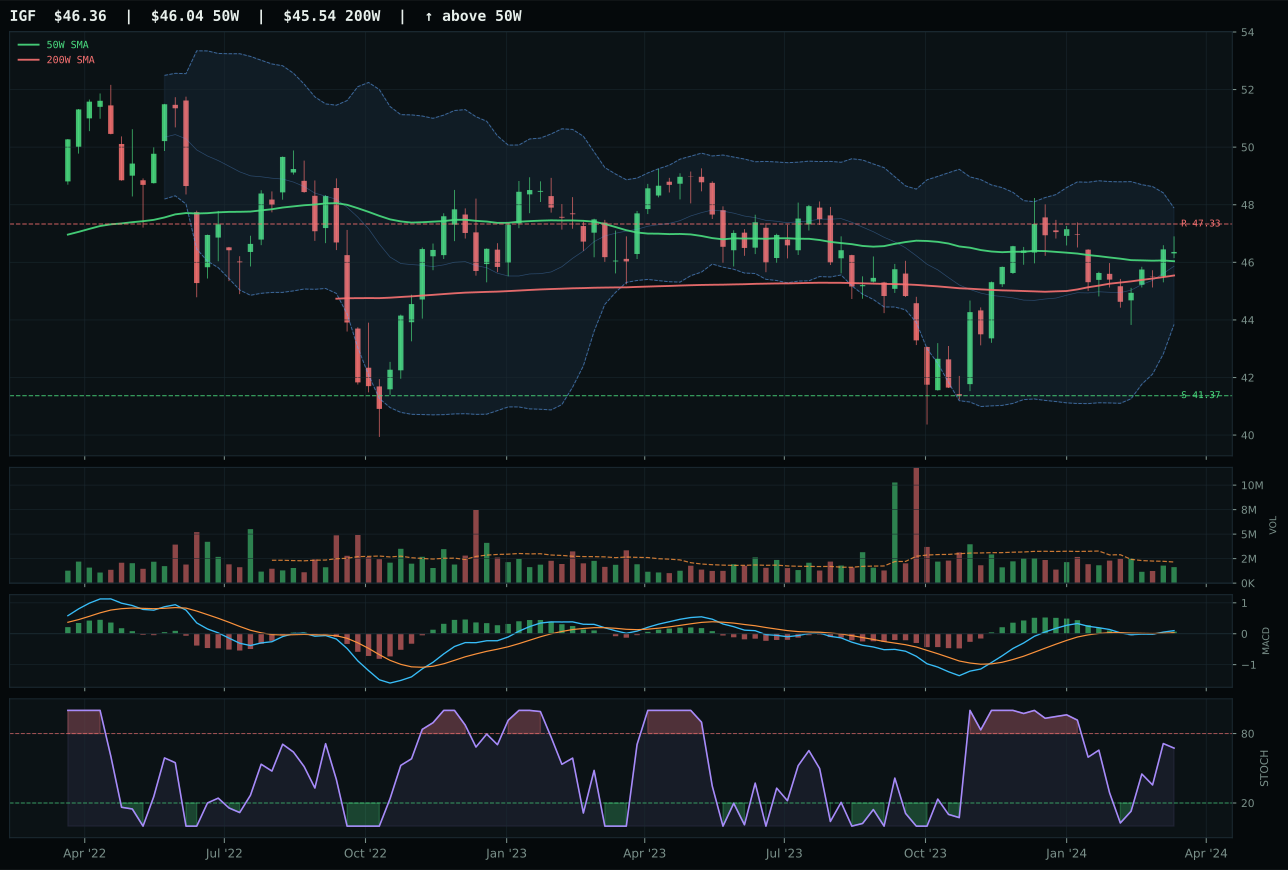
IGF has a compression near 50W profile with -10.7% 13-week relative strength versus SPY.
A failed hold above support would weaken the setup.
Actionable but governed by invalidation levels.
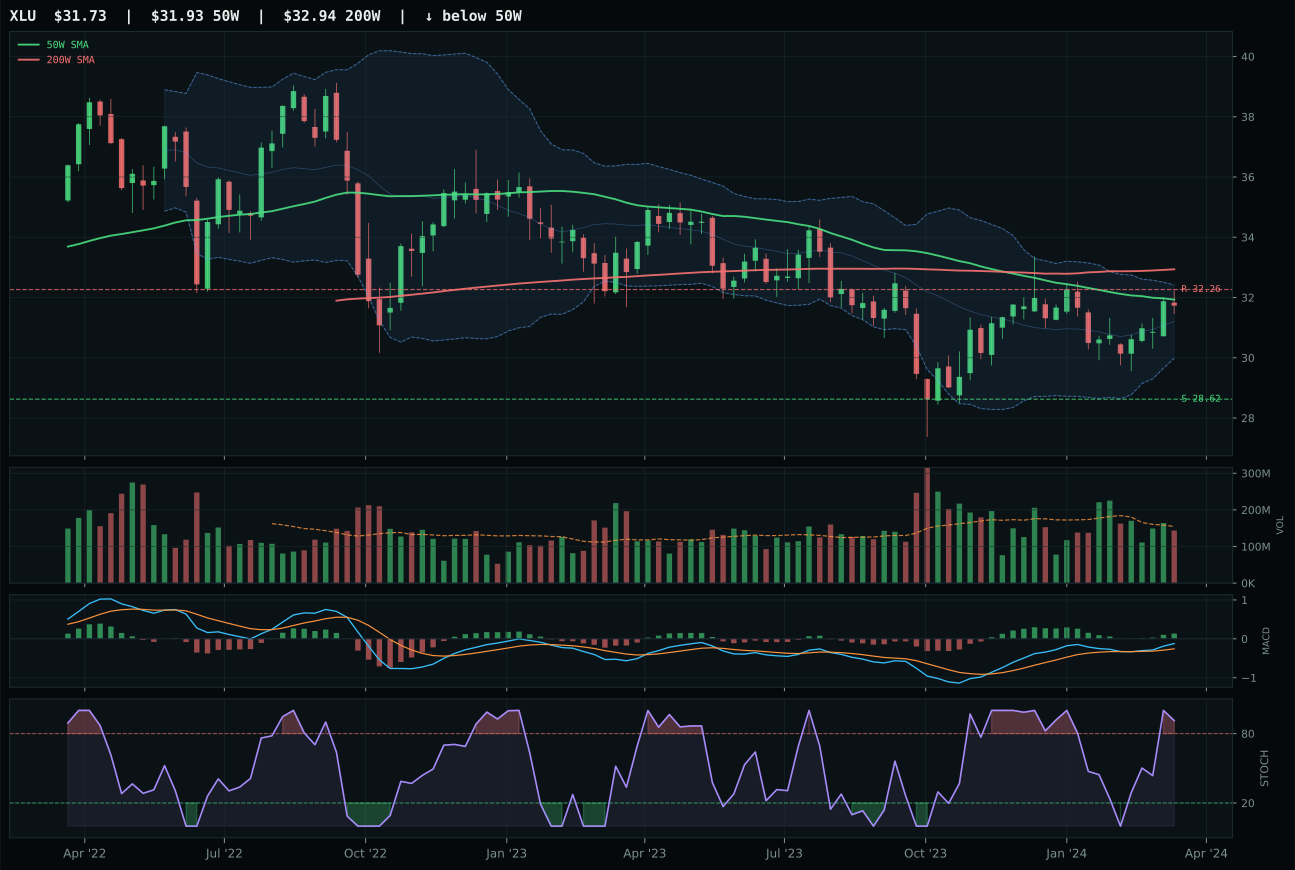
XLU has a compression near 50W profile with -9.4% 13-week relative strength versus SPY.
Extension and support failure are the main tactical risks.
Tracked, but not top-2 eligible because: structurally broken.
PAVE wins Utilities & Infrastructure despite its broken risk/reward profile and extended 20.6% above-50W positioning—a contrarian victory that highlights the category's weakness. Price shows perfect trend confirmation (100.0 score) with RS vs SPY at 3.5% and category-relative strength of 13.0%, strong category leadership credentials. MACD bullish and improving, volume distribution pressure (1.67x 20W average), and stochastic RSI overbought rolling over (0.92) signal late-stage accumulation followed by rotation. Structure scores 77.6 (strong vertical extension cleanliness at 75.0), yet timing collapses to 27.0 because price is too far extended for reliable entry. Risk/reward at 29.2 is the portfolio's worst among all representatives—only 0.4% upside to resistance and 35.0% downside to support reveal aggressive overextension. IGF loses on category-relative strength (-1.3% vs 13.0%) and cleanliness (73.4 vs 77.6), making PAVE the better carrier despite its structural defect.
Utilities & Infrastructure receives 5% tier-2 allocation despite a bottom-quartile 36.6 category score, justified solely by the need to maintain exposure to a macro cohort (Transition/Mixed) that could stage faster-than-expected rate relief. The category macro fit of 49.0/100 is weakly positive: Transition/Mixed positioning (+4) barely offsets liquidity stress (-3) and risk appetite penalty (-2). PAVE's 33.2 technical evidence and 87.0 momentum confirmation are misleading—the high momentum score reflects distribution pressure (late-stage accumulation by institutions liquidating into strength), not fresh buying interest. The 12.2% 13-week return is exceptional, yet it comes with the worst risk/reward on the board (only 0.4% upside cushion), making PAVE's extension unsustainable. The 5% allocation serves as a barbell: if infrastructure plays matter in a rate-relief scenario, PAVE captures the beta; if rates remain sticky, the position will be quickly demoted. This is one of the weakest conviction tier-2 holds in the portfolio—any MACD deterioration or volume decline would trigger immediate 0% reallocation.
Emerging Markets — IEMG
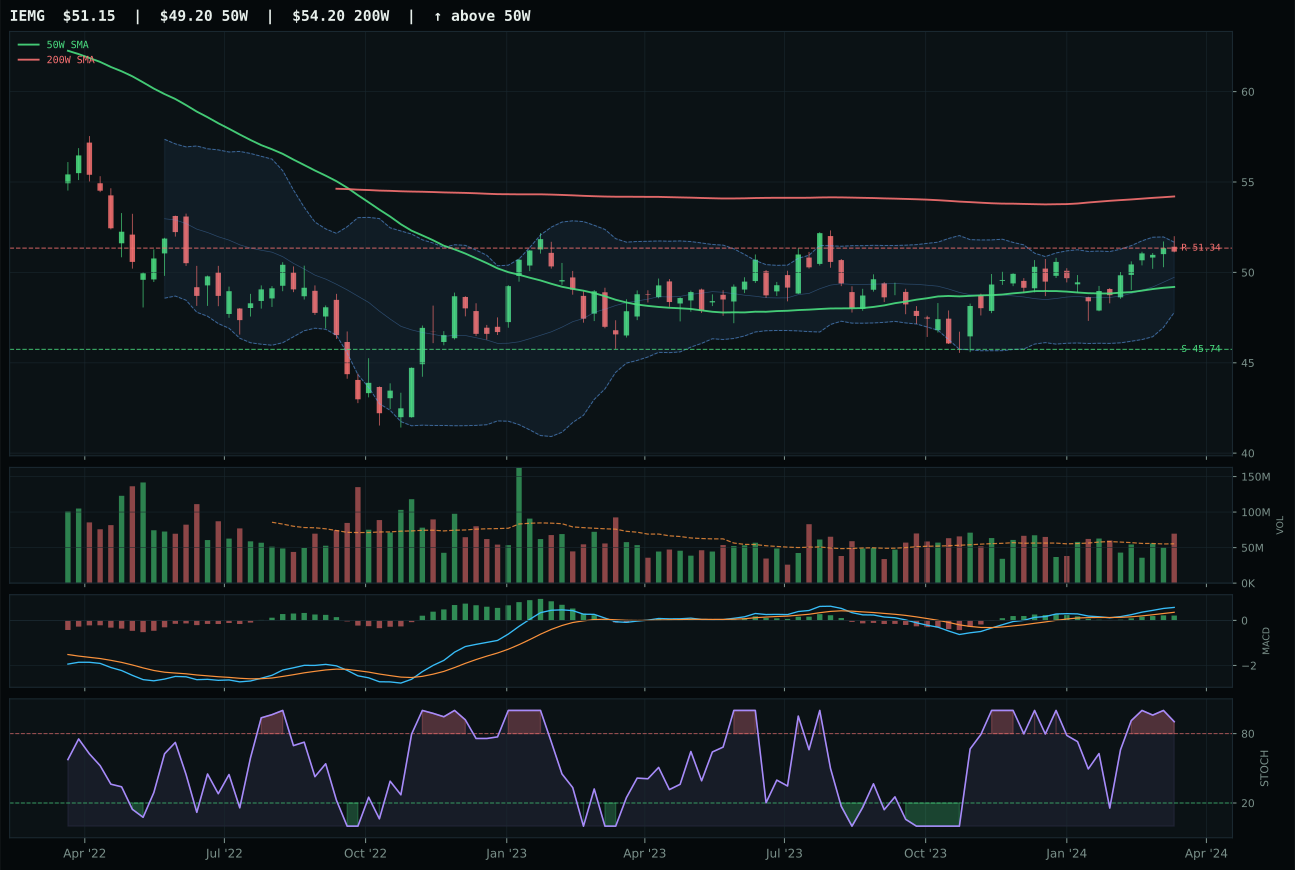
IEMG has a neutral structure profile with -7.0% 13-week relative strength versus SPY.
A failed hold above support would weaken the setup.
Actionable but governed by invalidation levels.
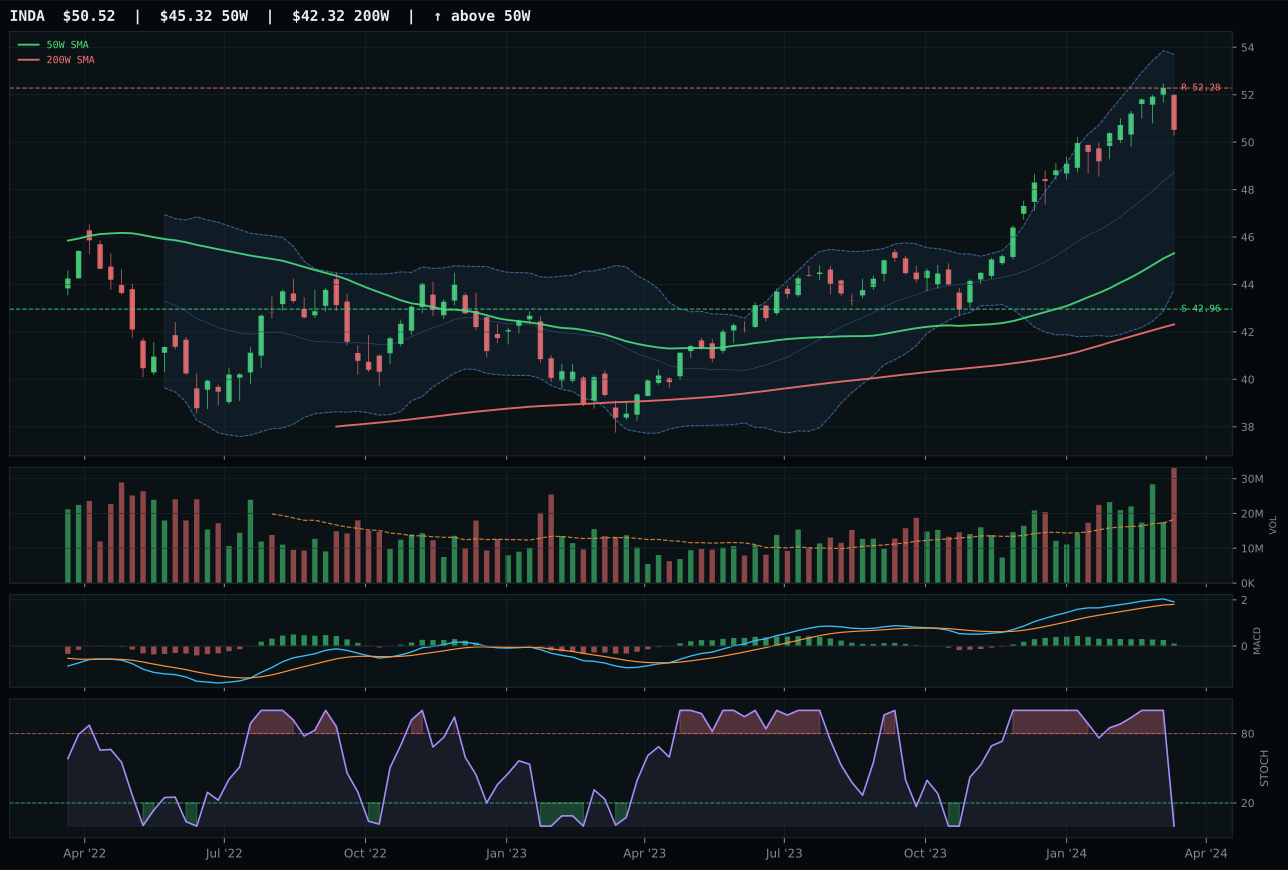
INDA has a neutral structure profile with -4.0% 13-week relative strength versus SPY.
A failed hold above support would weaken the setup.
Actionable but governed by invalidation levels.
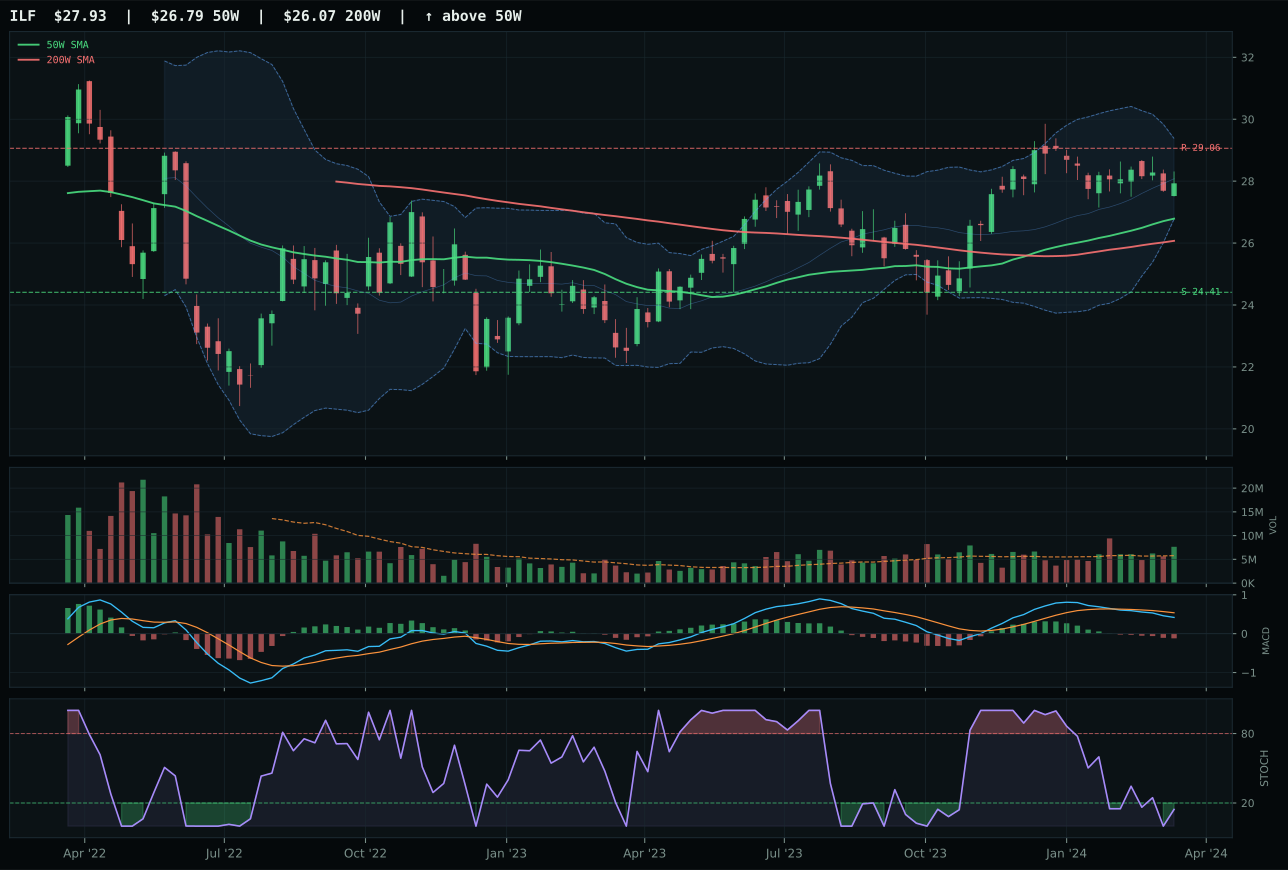
ILF has a neutral structure profile with -12.3% 13-week relative strength versus SPY.
A failed hold above support would weaken the setup.
Actionable but governed by invalidation levels.
IEMG claims Emerging Markets leadership in a category that failed the eligibility filter—a 21.0 final score represents hard rejection despite IEMG's 50.9 reasoned ETF score in the raw ranking. Price sits just 4.0% above the 50W moving average (modest extension), MACD bullish and improving, stochastic RSI overbought rolling over (0.90), and volume above-average participation at 1.26x the 20-week average. The structure is neutral with tight support/resistance bands, constraining r/r to 45.6, which would normally be acceptable but combines with negative macro fit (-20 combined macro points for credit and liquidity stress) to create category-level ineligibility. INDA loses on timing (70.0 vs 72.0), risk/reward (40.4 vs 45.6), and MACD deterioration (bullish but flattening), adding to IEMG's marginal edge. The gap is only 1.8 points in the reasoned ranking, yet the category-level macro backdrop is hostile enough to exclude both.
Emerging Markets receives 0% allocation, ranked 9th among the portfolio's 10 categories with a 21.0 final score that triggers complete exclusion this week. The category macro fit is actively negative at 38.0/100: credit stress (-10) and liquidity stress (-10) combine to overwhelm risk appetite (+8), creating a regime where capital flows away from cyclical, credit-sensitive emerging markets. IEMG's technical evidence of 56.0/100 is below-average and cannot sustain allocation against a hostile macro backdrop. The 1.7% 13-week return and -7.0% RS vs SPY confirm that emerging markets are not receiving new capital inflows; this is a regime where dollar strength and US rate support dominate. For re-entry into allocation, Emerging Markets would require either (1) a shift in the macro regime toward risk-off dynamics that favor diversification, (2) a dramatic improvement in emerging-market relative momentum (currently -7.0% vs SPY is unacceptable), or (3) stabilization of credit conditions that removes the active credit-stress penalty. Until one of these conditions is met, the category remains off the board.
Agriculture & Livestock — MOO
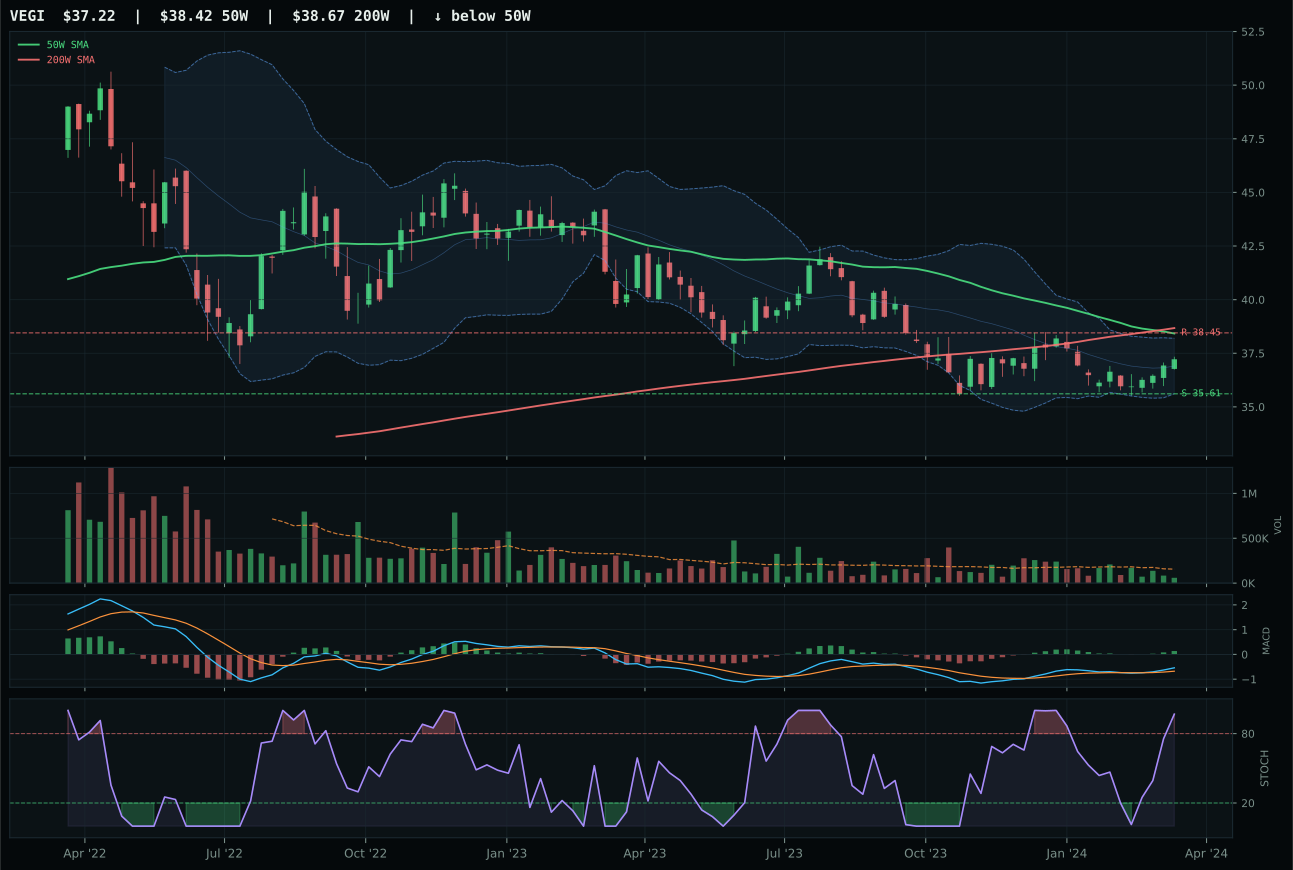
VEGI has a pullback into support profile with -10.1% 13-week relative strength versus SPY.
Extension and support failure are the main tactical risks.
Tracked, but not top-2 eligible because: structurally broken.
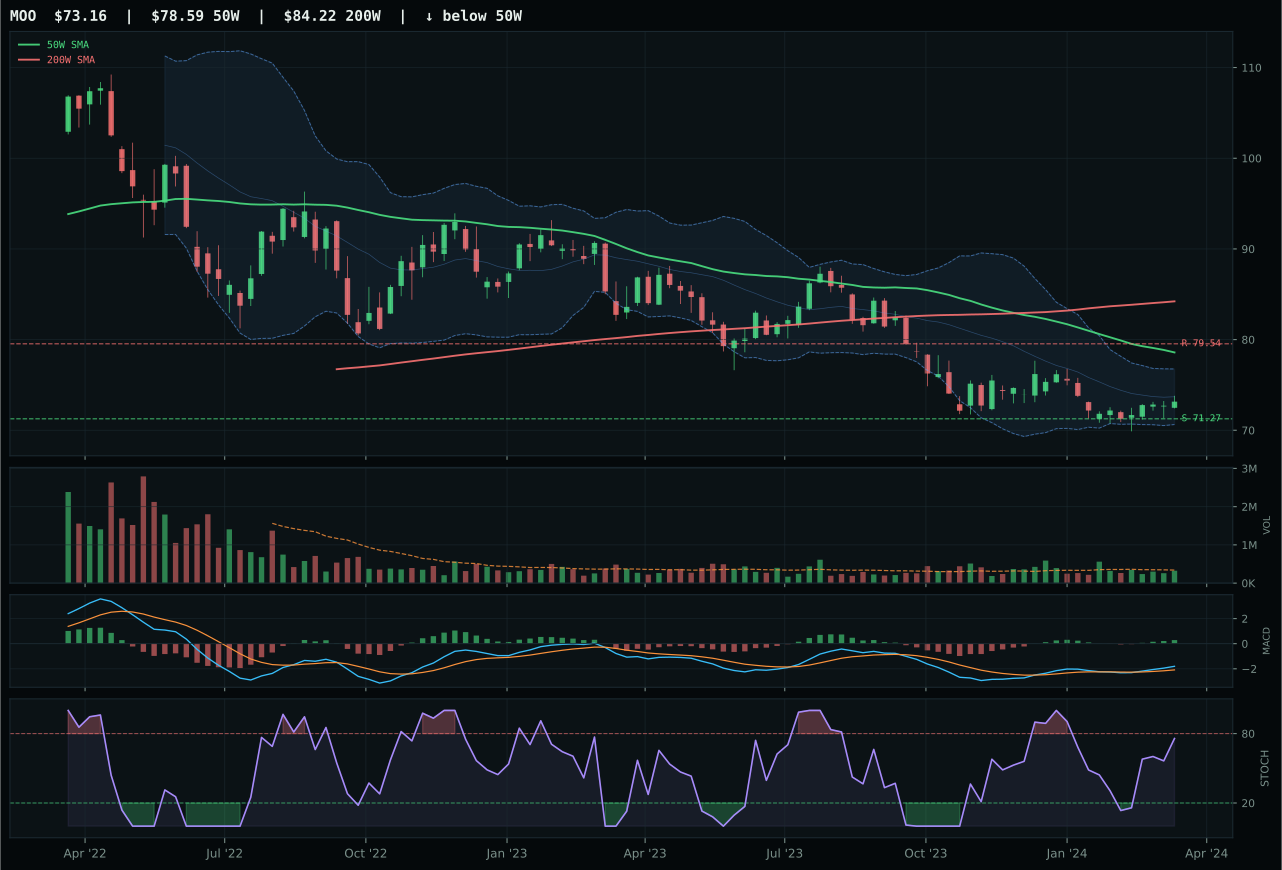
MOO has a pullback into support profile with -12.6% 13-week relative strength versus SPY.
Extension and support failure are the main tactical risks.
Tracked, but not top-2 eligible because: structurally broken.
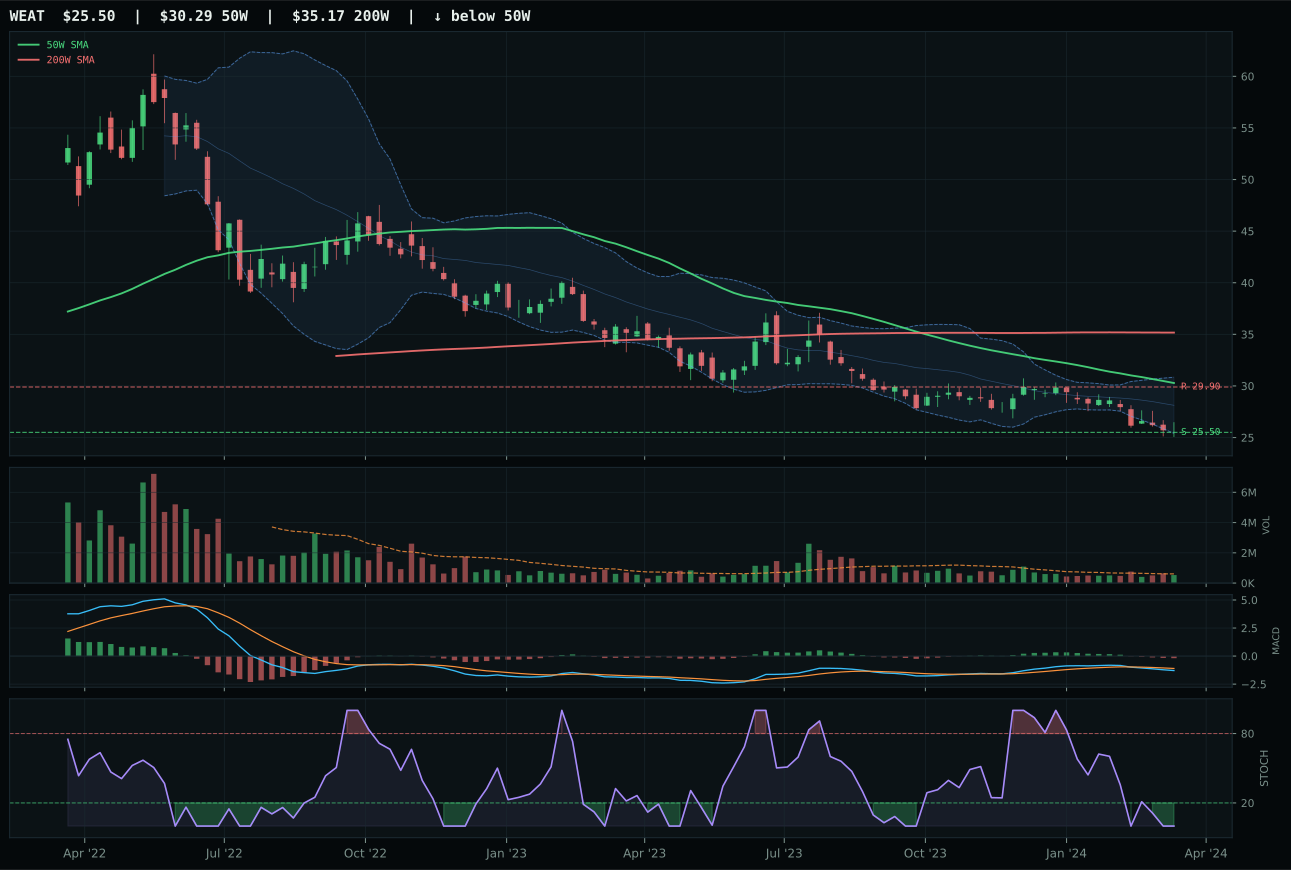
WEAT has a pullback into support profile with -22.8% 13-week relative strength versus SPY.
Extension and support failure are the main tactical risks.
Tracked, but not top-2 eligible because: structurally broken.
MOO wins Agriculture & Livestock in a category that failed its eligibility gate—the representative setup is structurally broken, pulling into support rather than confirming an uptrend, and the score of 18.2 reflects categorical rejection. Nevertheless, MOO claims the title through risk/reward geometry and Fibonacci support positioning: price trades 6.9% below the 50-week moving average and sits in the deep repair zone near Fib 0.786 at 73.81, with support 2.7% below current levels and resistance 8.0% above, creating asymmetric downside containment. MACD is bullish and improving with stochastic RSI rising into mid-zone (0.76), offering early repair mechanics. VEGI failed on that same structure but added poor risk/reward (65.7 vs 90.0), overbought stochastic momentum, and distribution-pressure volume—harder to justify on a pullback when the setup lacks conviction. The gap of 21.7 points between MOO and VEGI is wide because MOO at least preserves the repair narrative; VEGI contradicts it with stretched positioning.
Agriculture & Livestock receives 0% allocation this week, ranked among the excluded 9th and 10th positions despite a 67.0/100 macro fit score that favors real assets in a reflation regime. The category-level technical evidence proved insufficient: the 3/2/1 weighted basket (MOO, VEGI, WEAT) started at 38.0, and post-eligibility testing slashed the final score to 18.2 because all three representatives are below-trend structures (pullback into support) with negative momentum breadth. Late-Cycle Reflation (+8 macro), real asset sponsorship (+8), and commodity breadth positive (+5) cannot overcome the hard filter: the category's 13-week return of -4.0% for the winner and -11.3% for the 26-week window signal structural supply/demand weakness, not cyclical pullback. Emerging Markets' dysfunction (21.0 score) and Utilities' extended weakness (36.6) both ranked higher because they retained uptrend structures even while stretched. For Agriculture to re-enter allocation, the winner must recapture the 50-week moving average with above-average volume and show MACD recovery—a repair that would restore credibility to the real-asset narrative.