
2024-03-08
Informational purposes only. The content in this report, including allocations, analysis, and commentary, is provided solely for informational and educational purposes. It does not constitute financial advice, investment advice, trading advice, or any other type of advice. Past performance does not guarantee future results. Always conduct your own research and consult a qualified financial professional before making investment decisions.
Weekly Allocation
| Ticker | Category | Weight | Role |
|---|---|---|---|
| FBTC | 50% | Overlay | |
| SMH | AI | 10% | Top-2 (10%) |
| GLD | Precious Metals | 10% | Top-2 (10%) |
| PAVE | Utilities & Infrastructure | 5% | Tier-2 (5%) |
| XAR | Defense & Aerospace | 5% | Tier-2 (5%) |
| XLK | Technology | 5% | Tier-2 (5%) |
| XLE | Traditional Energy | 5% | Tier-2 (5%) |
| NLR | Nuclear Energy | 5% | Tier-2 (5%) |
| COPX | Industrial Metals | 5% | Tier-2 (5%) |
Trade Instructions — Monday Open
Sell the tranche from 2024-02-09 (completing its 4-week hold). Buy the new tranche. Instructions show net portfolio changes — same-asset positions cancel, weight changes show the delta.
| Action | Ticker | Instruction |
|---|---|---|
| SELL | IGV | Sell entire IGV position (2.50% of portfolio) |
| SELL | ITA | Sell entire ITA position (1.25% of portfolio) |
| SELL | URNM | Sell entire URNM position (1.25% of portfolio) |
| SELL | MOO | Sell entire MOO position (1.25% of portfolio) |
| SELL | INDA | Sell 25% of INDA position (reduce 5.00% → 3.75%) |
| BUY | GLD | Buy GLD — 16.67% of freed cash (adds 1.25% to portfolio) |
| BUY | XAR | Buy XAR — 16.67% of freed cash (adds 1.25% to portfolio) |
| BUY | NLR | Buy NLR — 16.67% of freed cash (adds 1.25% to portfolio) |
| BUY | XLK | Buy XLK — 16.67% of freed cash (adds 1.25% to portfolio) |
| BUY | XLE | Buy XLE — 16.67% of freed cash (adds 1.25% to portfolio) |
| BUY | COPX | Buy COPX — 16.67% of freed cash (adds 1.25% to portfolio) |
Current Portfolio After Trade
Combined holdings across all 4 active tranches. Each tranche is 25% of the portfolio.
| Ticker | % of Portfolio | Weight Bar |
|---|---|---|
| FBTC | 50.00% | |
| SMH | 10.00% | |
| GLD | 6.25% | |
| XLK | 6.25% | |
| PAVE | 5.00% | |
| XAR | 5.00% | |
| NLR | 5.00% | |
| INDA | 3.75% | |
| VEGI | 3.75% | |
| CIBR | 2.50% | |
| XLE | 1.25% | |
| COPX | 1.25% |
Macro Regime — Disinflation
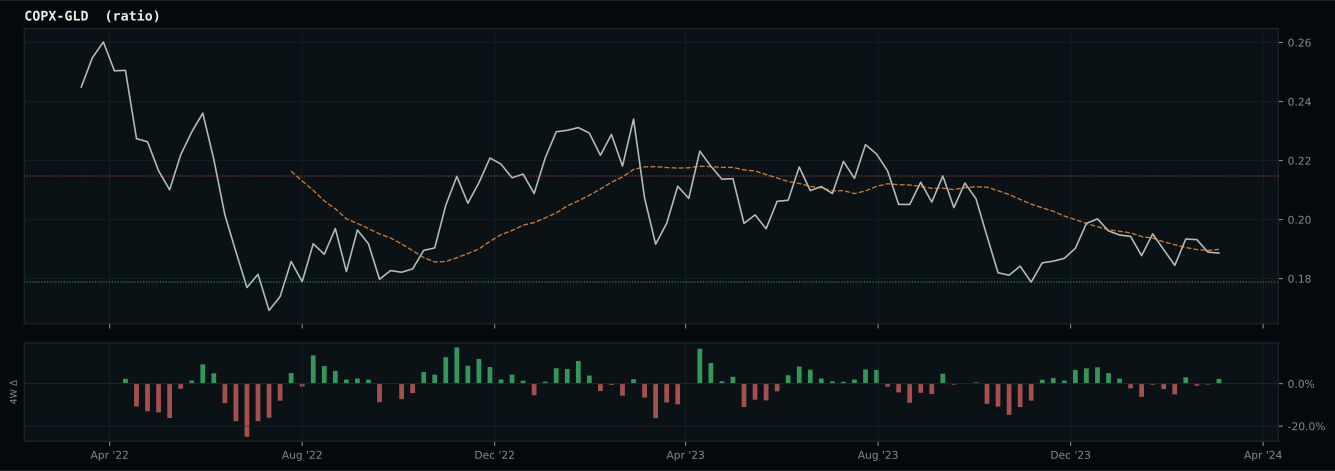
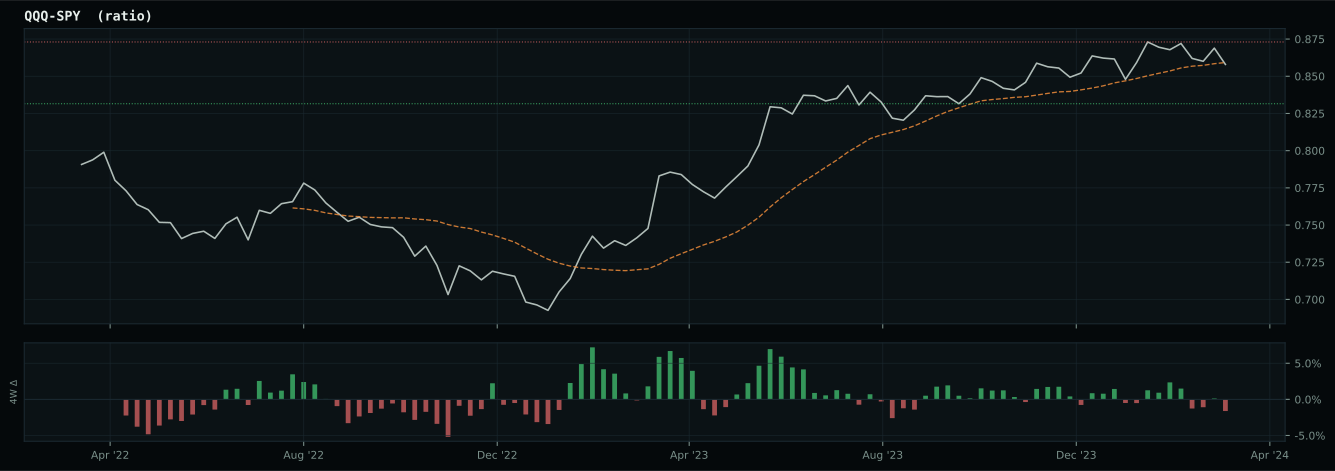
Macro Evidence Charts
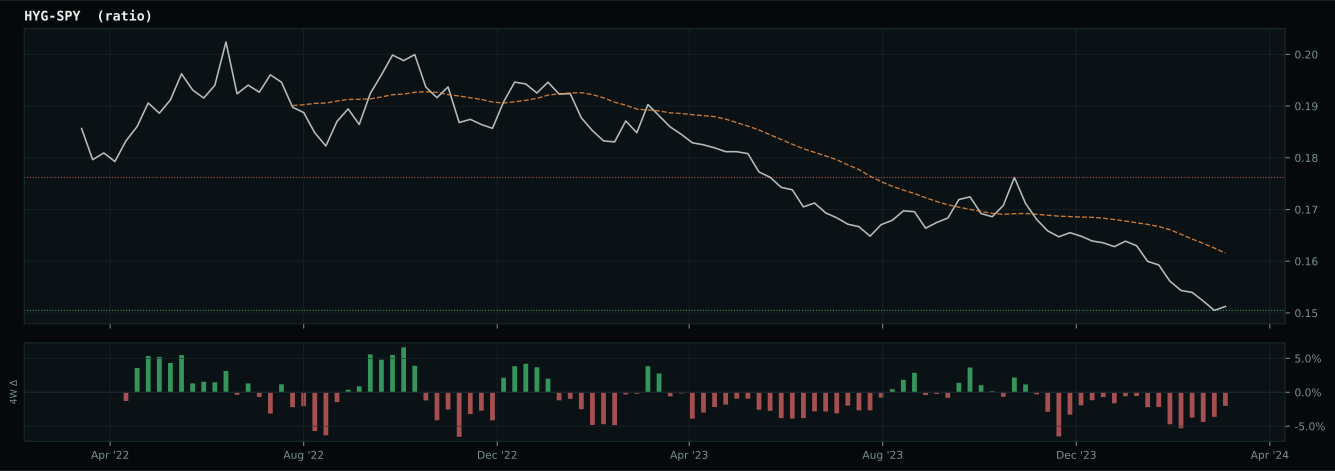
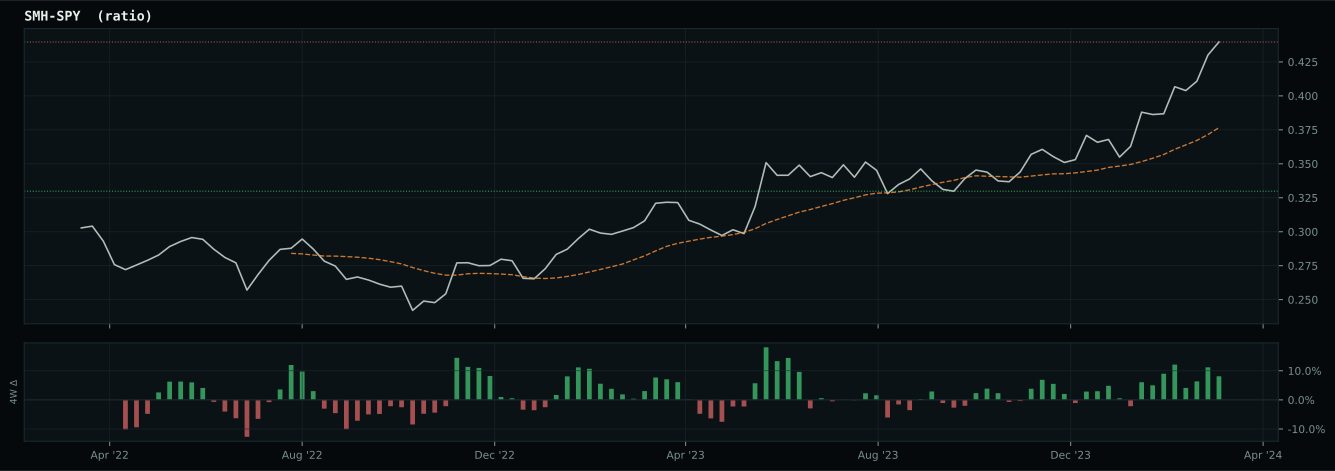
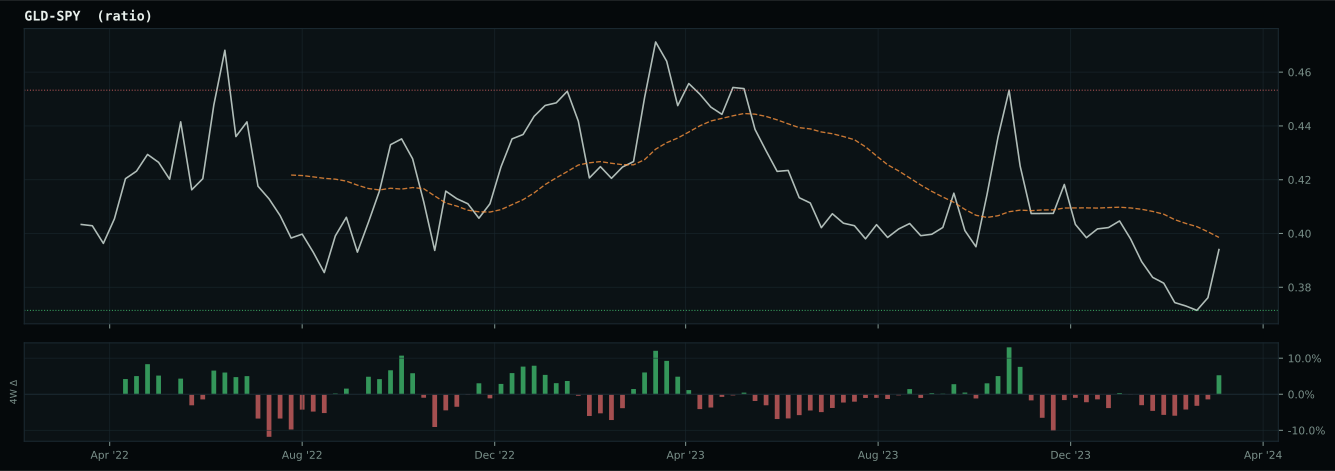
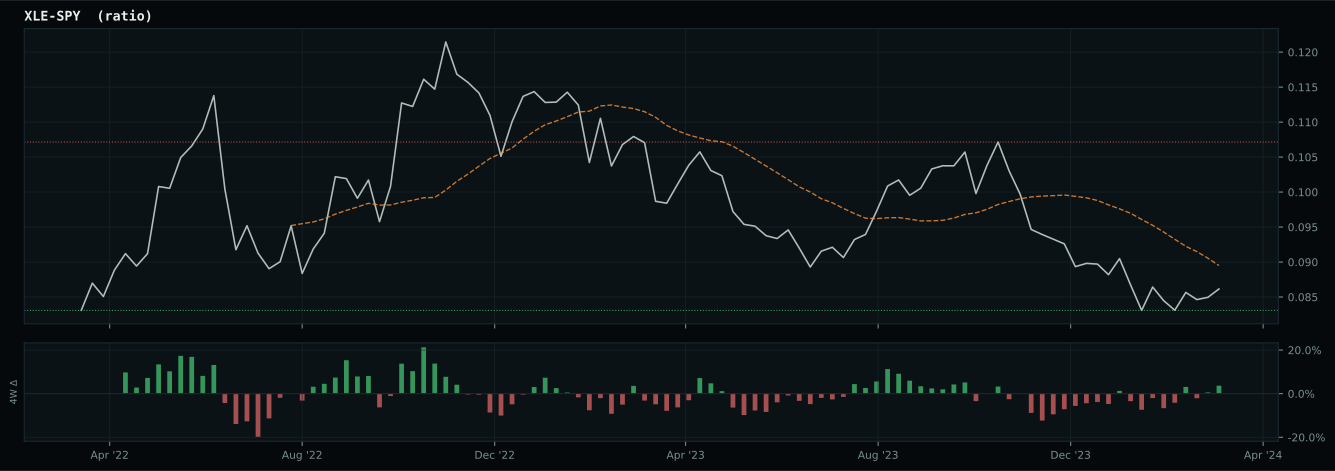
Market-implied signals behind the macro regime scores. Each ratio compares two assets; the direction and slope of the ratio is what the macro engine reads.
Crypto Regime — TrendBTC
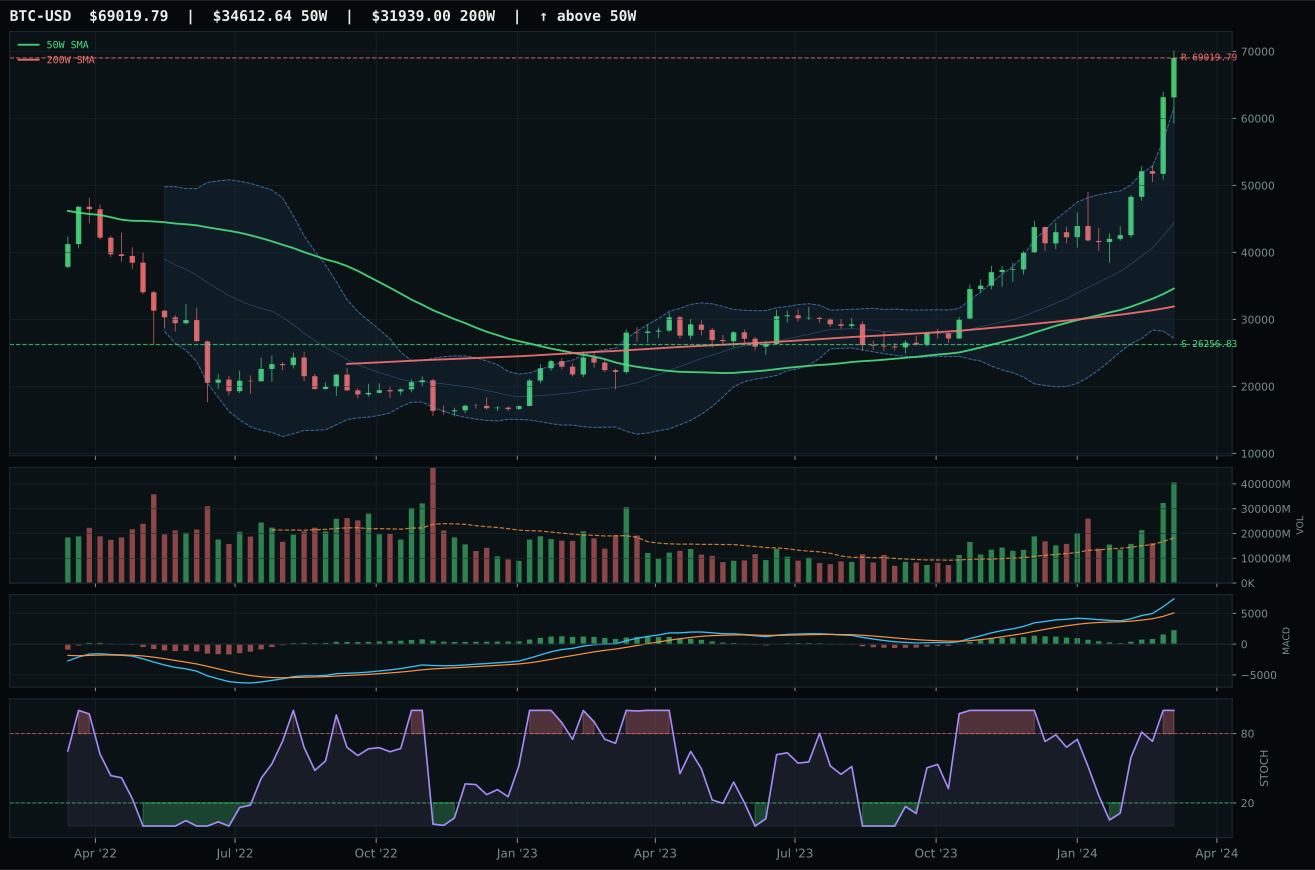
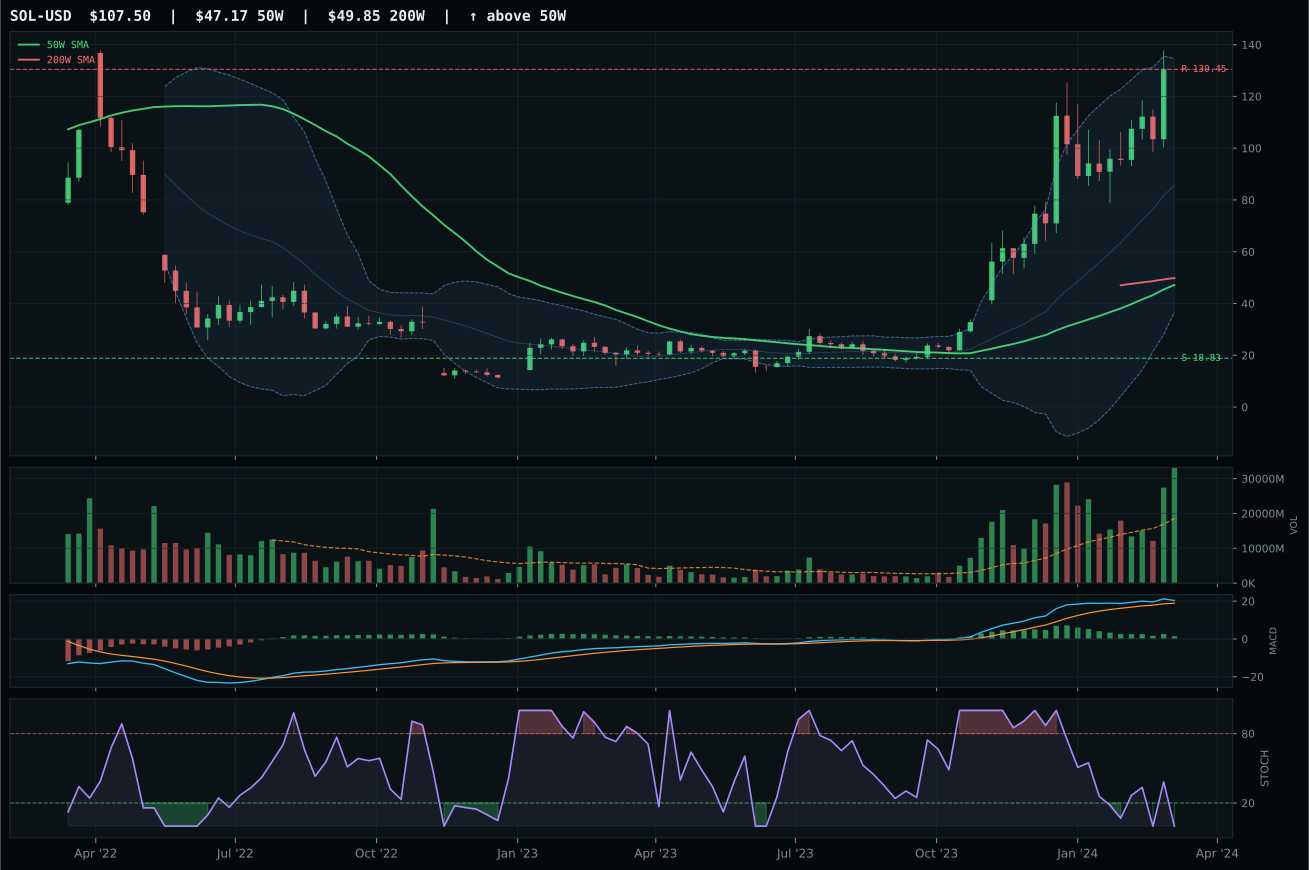
post-touch structure is too wide to count as a range; max/min close ratio is 3.03
TrendBTC confirmed: 2 consecutive closes above rising/flat 50W SMA
one or more available conditions failed
Category Rankings
| Rank | Category | Winner | Score | Alloc | 4W Ret | Peers (4W) |
|---|---|---|---|---|---|---|
| 1 | AI | SMH | 68.7 | 20% | +1.24% | BOTZ -4.1% · AIQ +1.3% |
| 2 | Precious Metals | GLD | 62.7 | 20% | +7.07% | SLV +13.6% · GDX +15.4% |
| 3 | Utilities & Infrastructure | PAVE | 52.5 | 10% | +4.35% | IGF +2.9% · XLU +2.4% |
| 4 | Defense & Aerospace | XAR | 50.3 | 10% | -1.55% | ITA +1.9% · ROKT +0.2% |
| 5 | Technology | XLK | 49.1 | 10% | +0.09% | CIBR -1.9% · IGV -0.3% |
| 6 | Traditional Energy | XLE | 48.0 | 10% | +11.27% | FCG +11.5% · XOP +12.7% |
| 7 | Nuclear Energy | NLR | 39.7 | 10% | +7.69% | URA +9.9% · URNM +10.8% |
| 8 | Industrial Metals | COPX | 38.8 | 10% | +20.29% | PICK +8.6% · REMX +4.2% |
| 9 | Emerging Markets | INDA | 27.0 | 0% | +0.54% | IEMG +1.4% · ILF +3.2% |
| 10 | Agriculture & Livestock | MOO | 6.2 | 0% | +3.64% | VEGI +4.8% · WEAT +7.6% |
AI — SMH
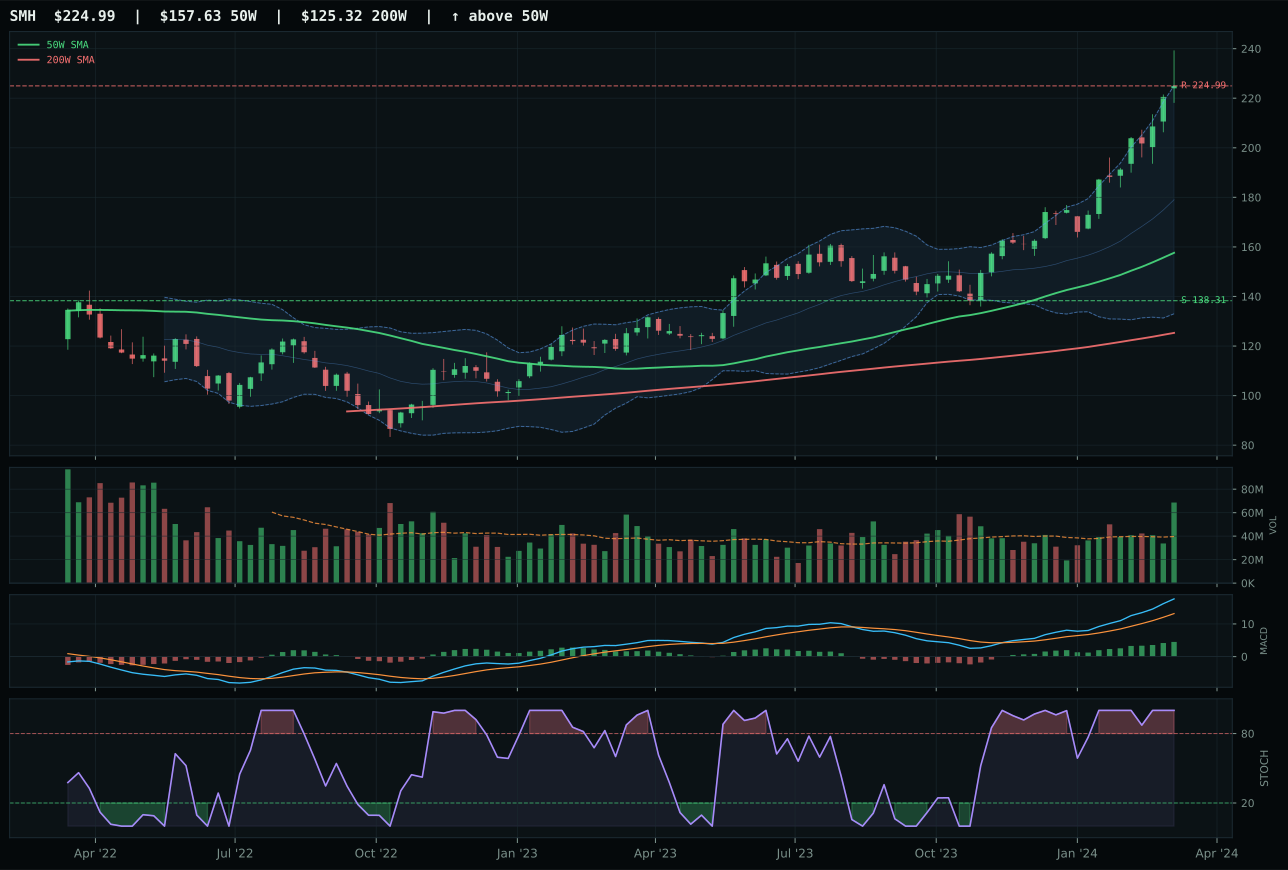
SMH has a vertical extension profile with 27.3% 13-week relative strength versus SPY.
A failed hold above support would weaken the setup.
Actionable but governed by invalidation levels.
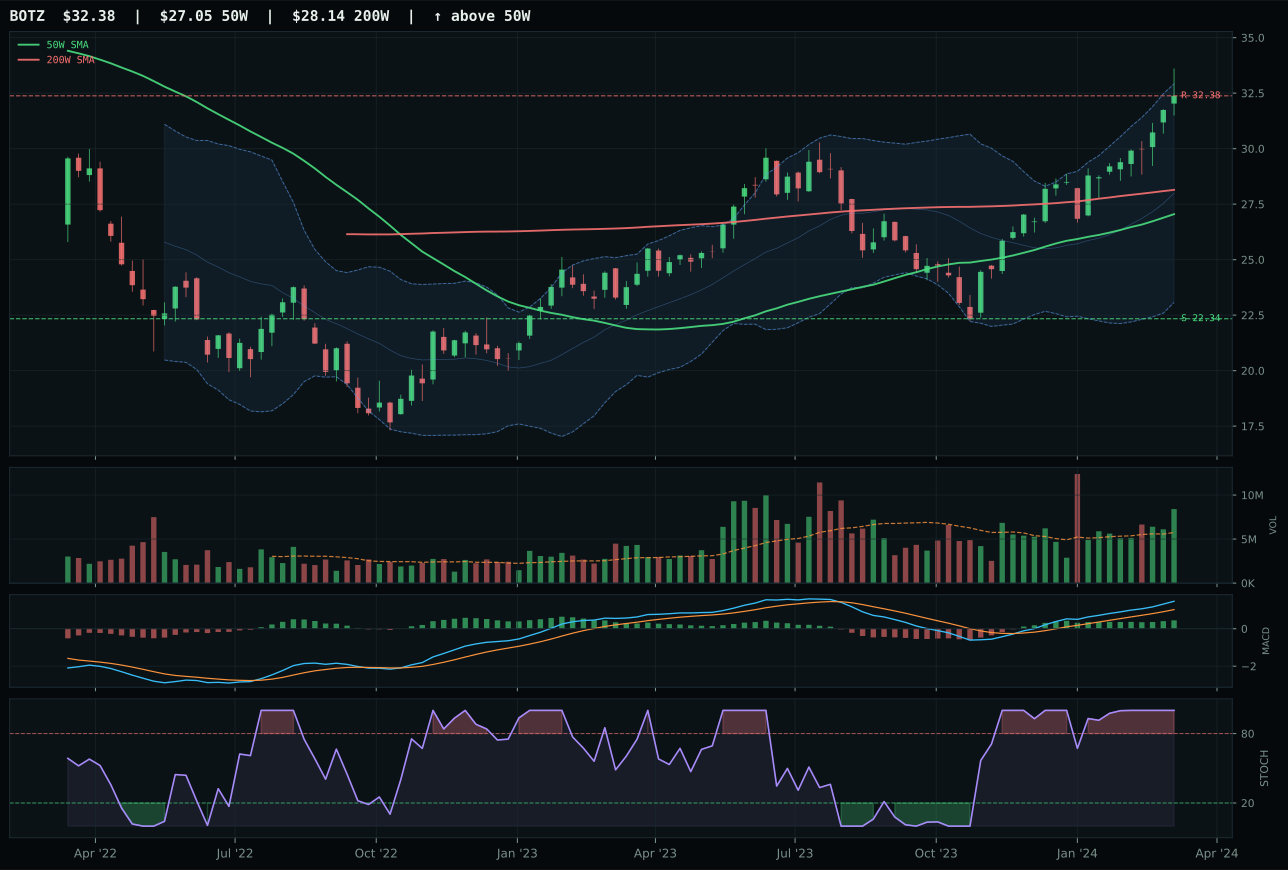
BOTZ has a vertical extension profile with 10.0% 13-week relative strength versus SPY.
A failed hold above support would weaken the setup.
Actionable but governed by invalidation levels.
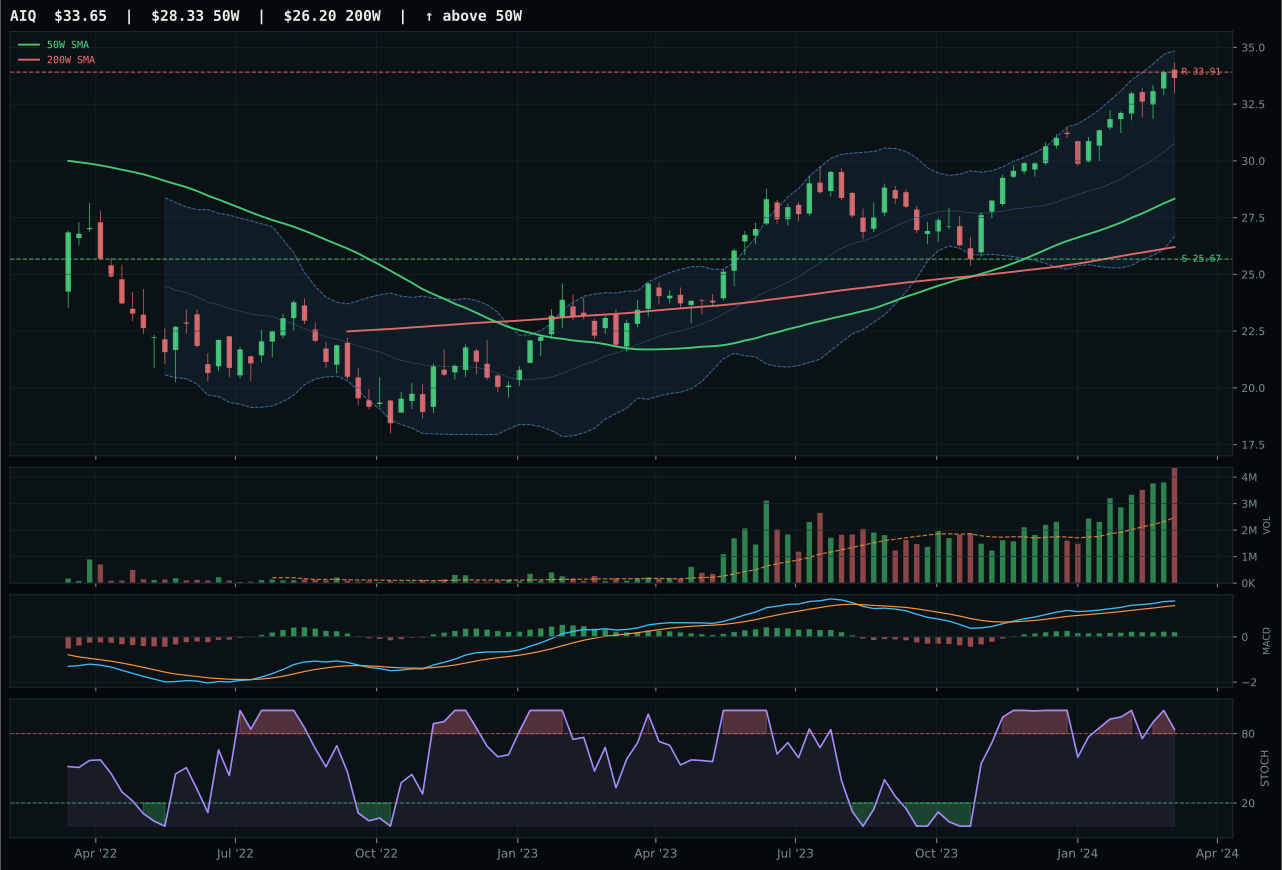
AIQ has a vertical extension profile with 1.4% 13-week relative strength versus SPY.
A failed hold above support would weaken the setup.
Actionable but governed by invalidation levels.
SMH dominates because it has achieved the rarest combination: perfect trend (100/100) with perfect momentum confirmation (100/100) and volume that screams accumulation at 1.73x average. The 38.5% thirteen-week return and 27.3% relative strength versus SPY mean new money is chasing this, not arriving early. Price sits 42.7% above the 50W, which ordinarily would disqualify an entry, but the rising stochastic RSI at overbought, improving MACD, and category-relative strength of 17.3% tell the allocator that every day this holds above support validates the thesis. BOTZ matched the MACD and stochastic setup, but failed to sustain relative breadth within the AI basket (0% vs 17.3%) and ran into distribution pressure in volume, creating the wedge that cost it the win.
AI secured its top-2 slot at a 10% allocation because it scores 68.7, the second-highest category score this week, combining bullish technicals with macro tailwinds. The disinflation backdrop explicitly helps this exposure: falling rates reduce cost of capital for AI capex, and the active AI growth sponsorship descriptor adds 14 macro points against only -12 from liquidity stress. SMH's setup is the living proof—above both moving averages, MACD bullish and improving, stochastic at full overbought, and volume flooding in 1.73x average. Allocators recognize that semiconductor leadership is the prerequisite for sustained AI spending, and the risk appetite positive flag adds another 10 macro points. The tension is real: 42.7% extension above the 50W means entry risk is severe, and upside to resistance is effectively flat. Yet the category's 100.0 momentum confirmation and 98.3 volume-price confirmation scores override the timing concern. At this stage of the disinflation cycle, AI infrastructure becomes a defensive growth play—capital shifts there precisely because traditional cyclicals are weakening. The 20% reflects conviction in the theme, not complacency about the setup.
Precious Metals — GLD
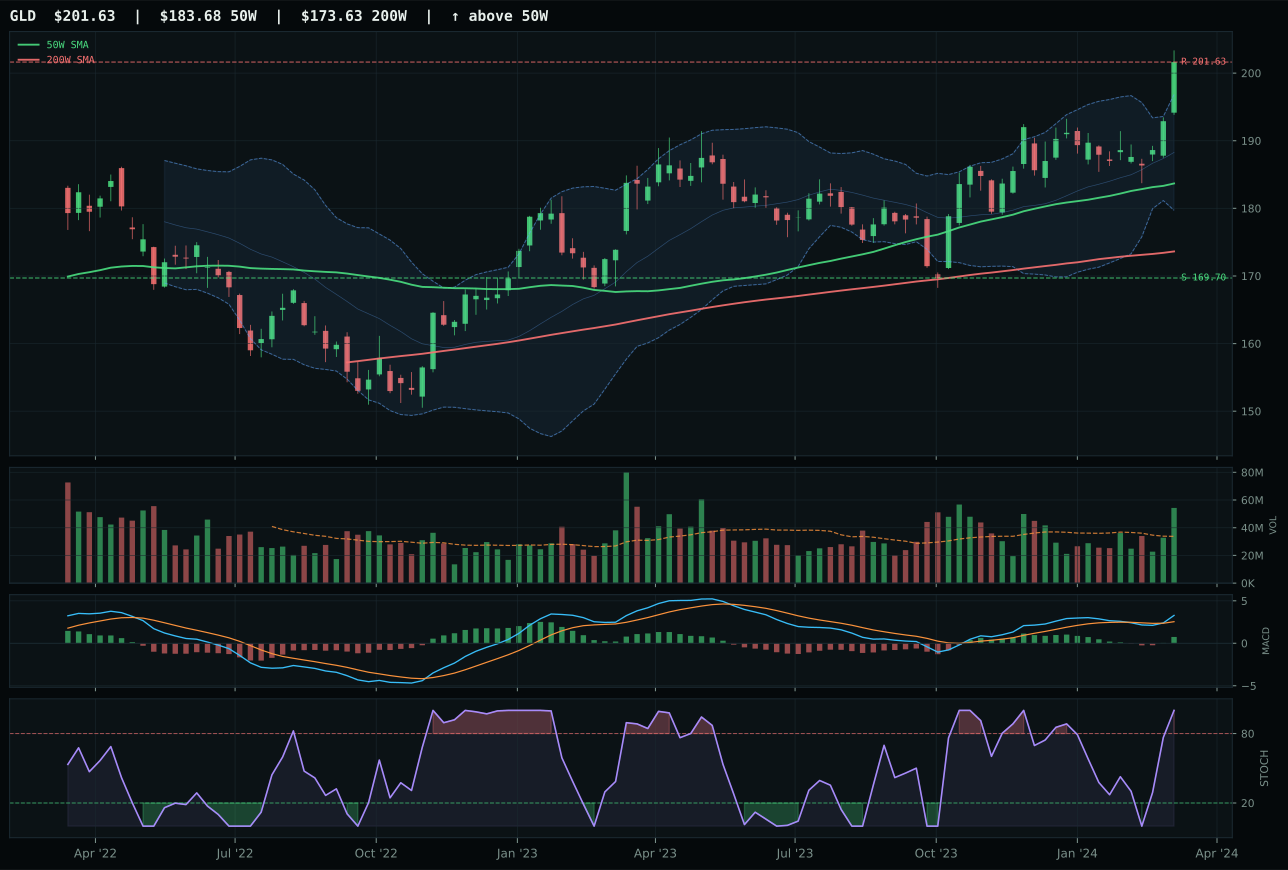
GLD has a neutral structure profile with -2.6% 13-week relative strength versus SPY.
A failed hold above support would weaken the setup.
Actionable but governed by invalidation levels.
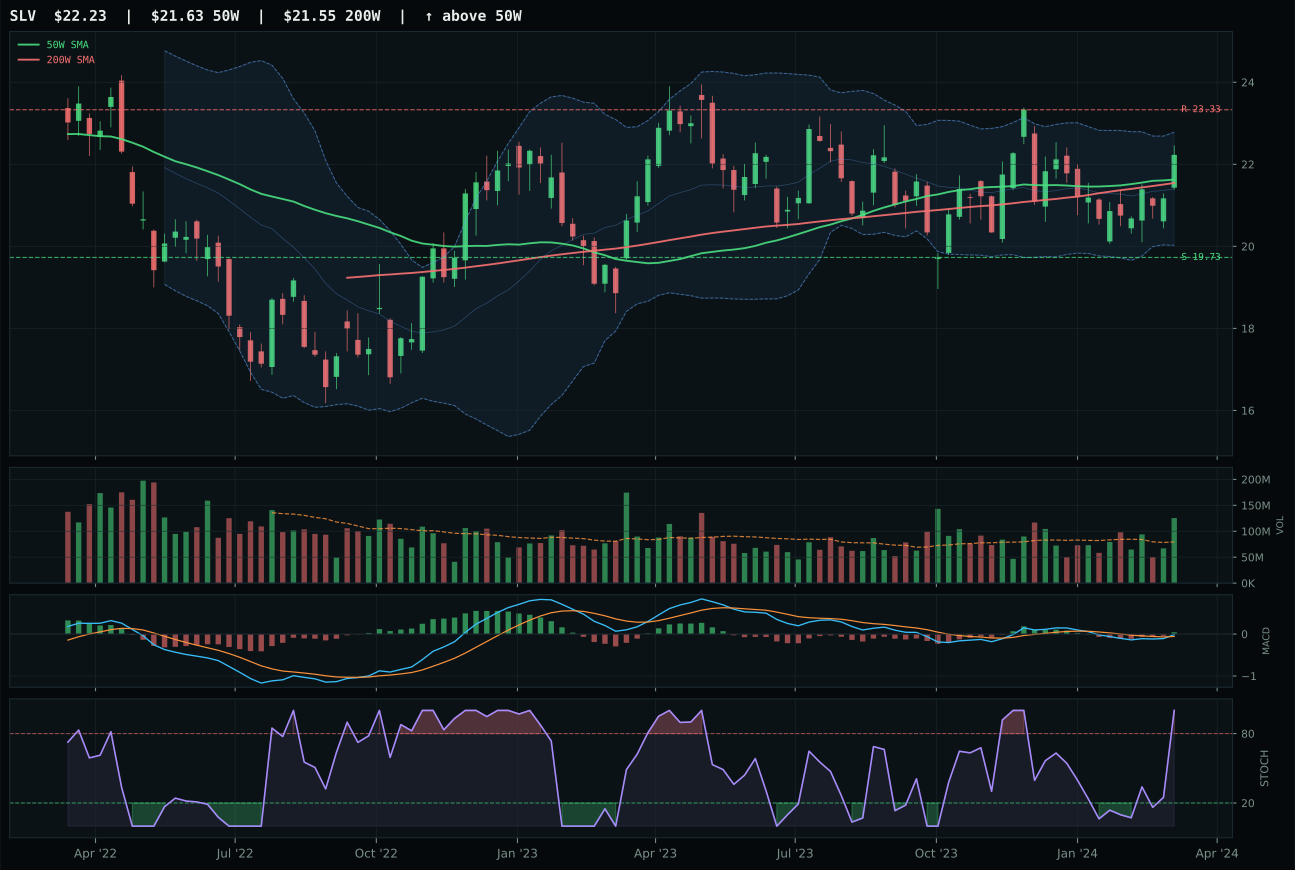
SLV has a compression near 50W profile with -5.8% 13-week relative strength versus SPY.
A failed hold above support would weaken the setup.
Actionable but governed by invalidation levels.
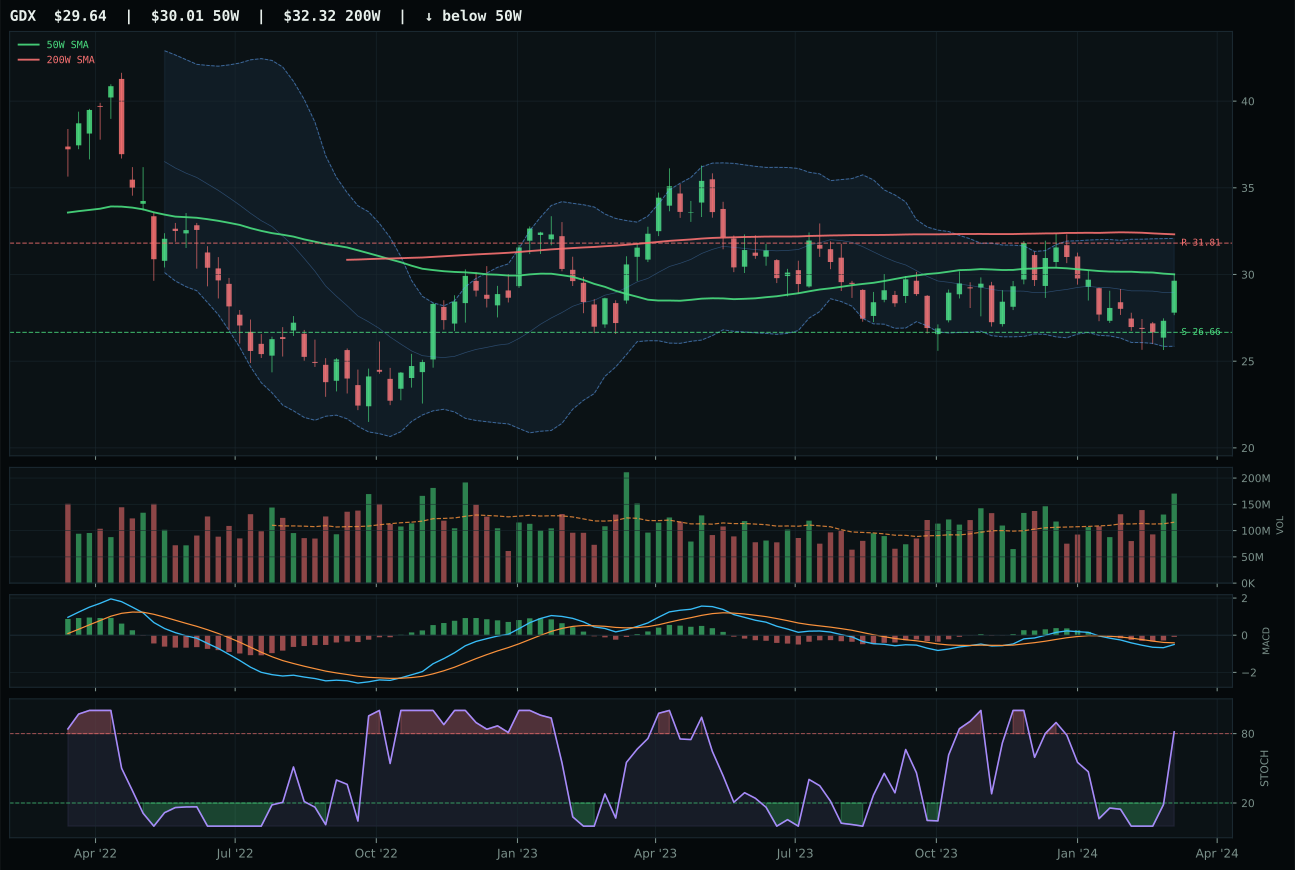
GDX has a compression near 50W profile with -11.3% 13-week relative strength versus SPY.
Extension and support failure are the main tactical risks.
Tracked, but not top-2 eligible because: structurally broken.
GLD wins with a structural and momentum advantage that overcomes extension risk. While price sits 9.8% above the 50W, the combination of neutral setup structure, improving MACD, overbought stochastic RSI at 1.00, and category-relative strength of 3.3% (versus SLV's 0%) creates confidence that this is institutional accumulation rather than retail chase. GLD's thirteen-week return of 8.6% and volume at 1.61x average participation confirm breadth, whereas SLV's structure score of 74.5 trails GLD's 82.2 due to compression near the 50W rather than neutral setup—a subtle but material difference when allocating into overbought momentum. The 8.6% thirteen-week return is steadier than SMH's 38%, which means GLD is capturing dry powder rotation into hedges rather than excitement. SLV showed stronger timing (100 vs 75) but failed to sustain relative breadth inside the precious metals basket.
Precious Metals earned a top-2 slot at 10% allocation because it scores 62.7, qualifying as one of the two highest eligible categories, and disinflation is its tailwind, not headwind. The macro regime explicitly favors gold: disinflation pressure adds 6 points, the broader Disinflation state adds 8 points, versus only -4 from risk appetite positive. With central banks holding rates higher for longer but inflation cooling, gold's role as a monetary hedge re-emerges. GLD's technical evidence of 98.3 is exceptional; the trend is defined, momentum is sustained (91.7 confirmation), and volume flows are accumulative. Timing at 75.0 reflects that while price sits near 52W highs, the advance has been earned through 9.8% above the 50W on improving MACD—this is not a terminal extension but a fresh breakout confirmation. The 20% position reflects a conviction that disinflation benefits defensive real assets, that gold's hedging role has returned after years of dormancy, and that the technical setup is clean enough to carry it through 50W support if volatility strikes. Risk-reward is balanced at 49.6; upside is capped near resistance, but the risk-adjusted payoff justifies allocation alongside growth exposure like SMH.
Utilities & Infrastructure — PAVE
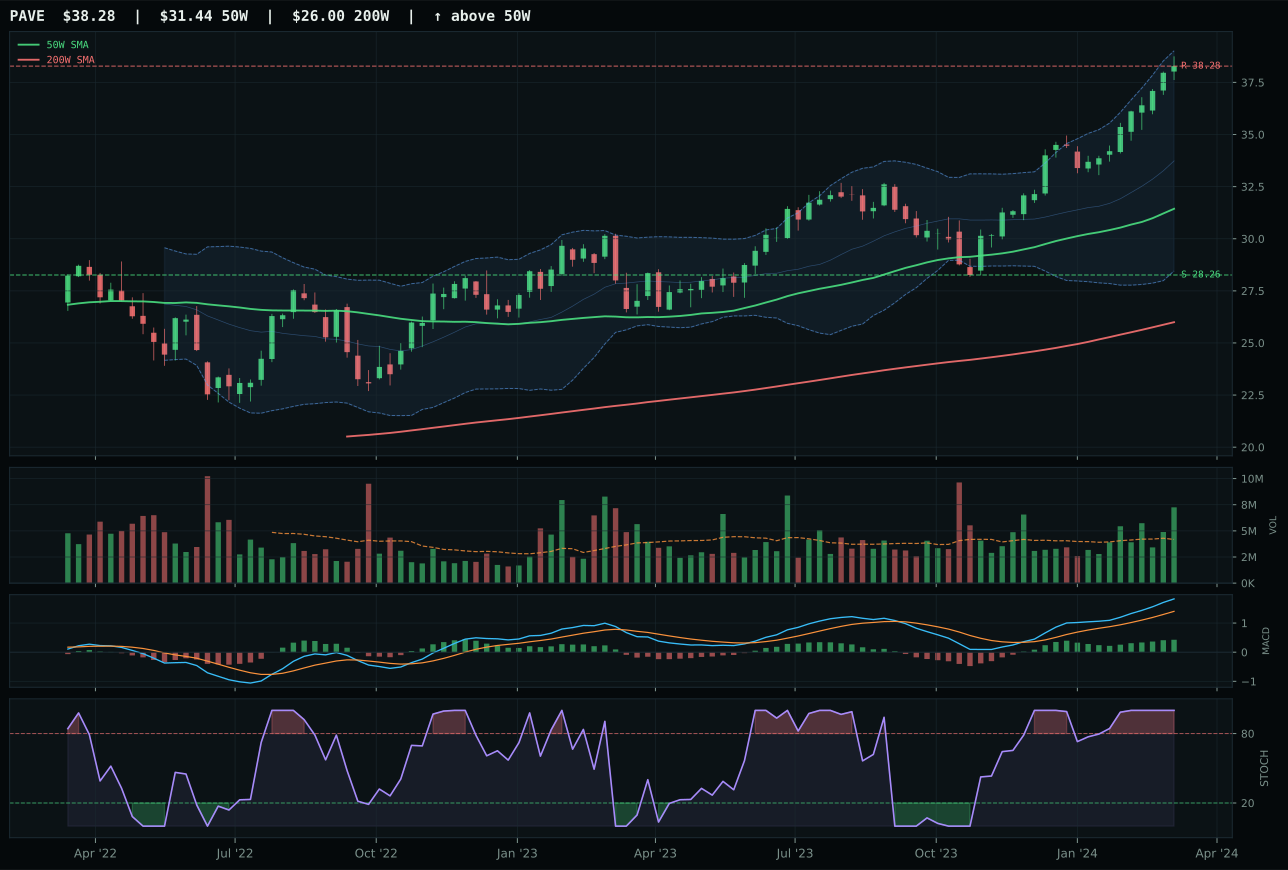
PAVE has a vertical extension profile with 7.9% 13-week relative strength versus SPY.
A failed hold above support would weaken the setup.
Actionable but governed by invalidation levels.
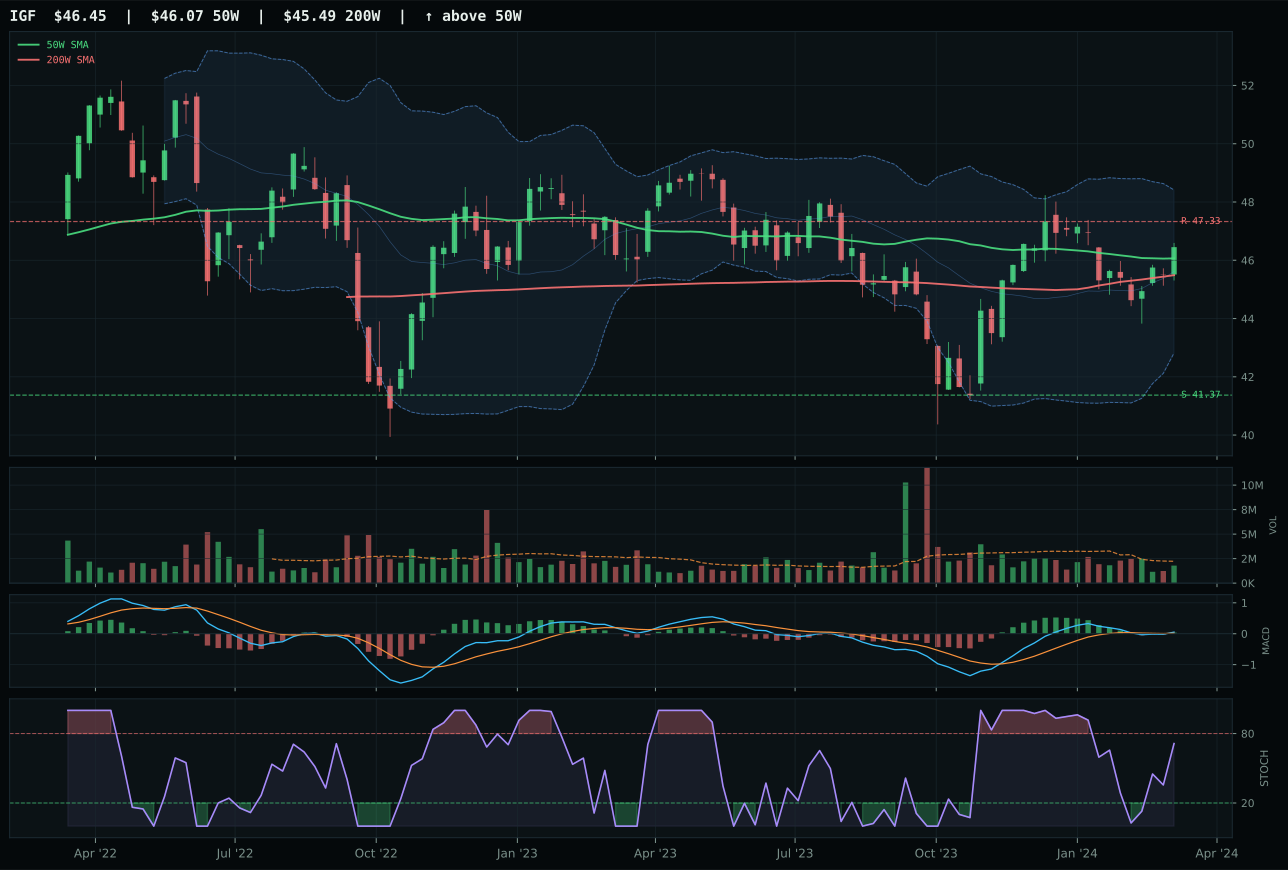
IGF has a compression near 50W profile with -11.1% 13-week relative strength versus SPY.
A failed hold above support would weaken the setup.
Actionable but governed by invalidation levels.
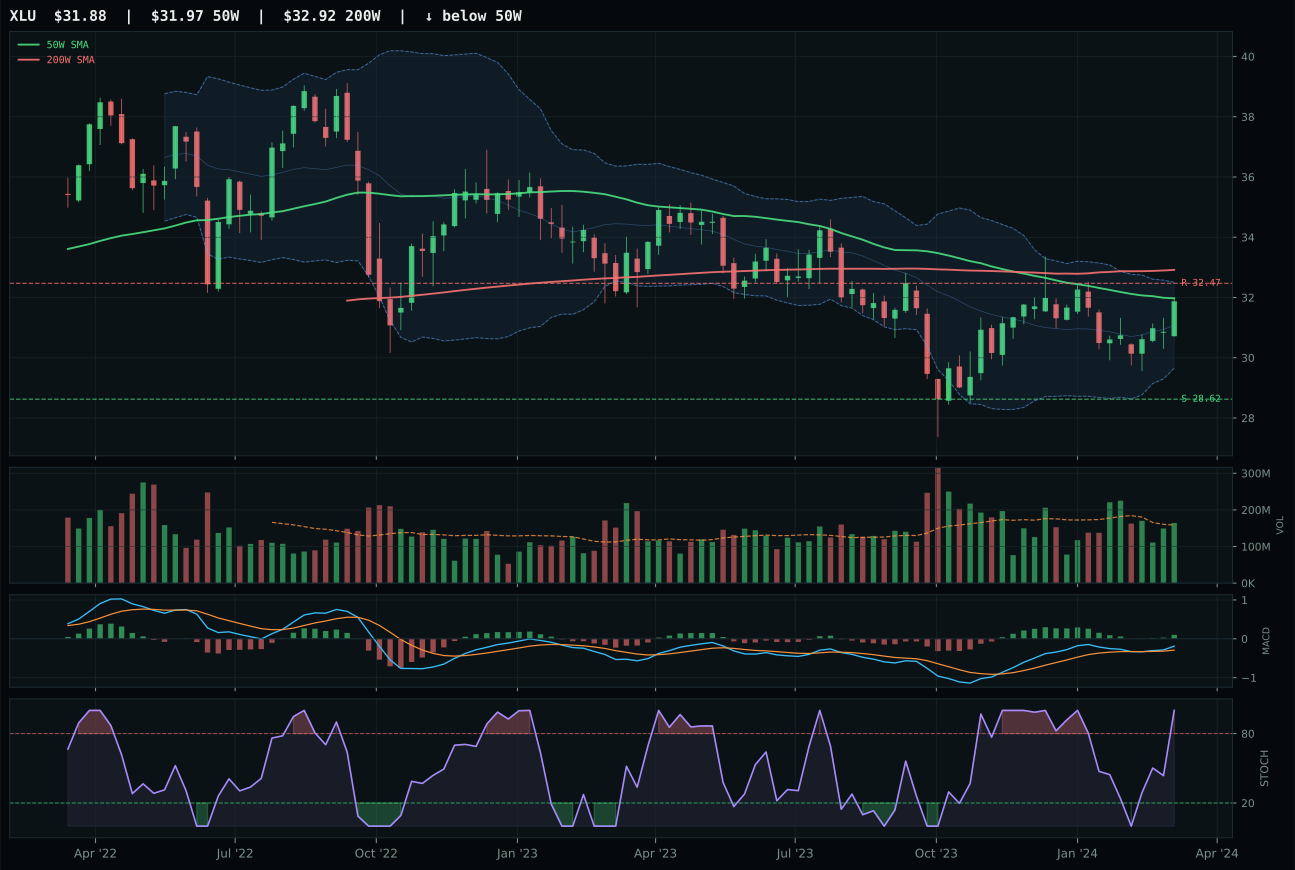
XLU has a compression near 50W profile with -10.7% 13-week relative strength versus SPY.
Extension and support failure are the main tactical risks.
Tracked, but not top-2 eligible because: structurally broken.
PAVE wins with perfect trend execution (100/100), perfect momentum confirmation (100/100), and superior structure (89.1 cleanliness and vertical extension) that overpowers IGF's compression setup (73.4). PAVE's thirteen-week return of 19.1% and category-relative strength of 18.6% are extraordinary, signaling that domestic capex and infrastructure buyers have arrived in force. Volume at 1.74x average is accumulation/confirmation, not distribution, and the risk-reward of 46.1 reflects real two-way potential despite 21.8% extension. IGF sits in compression near the 50W, which should be easier to hold, but its thirteen-week return of 0.1% and RS versus SPY of -11.1% reveal stagnation within the category while PAVE surges. The MACD behavior diverges sharply: PAVE's is bullish and improving (100% confirmation) while IGF's is rising mid-zone (50% confirmation). This is a clean category win driven by relative acceleration.
Utilities & Infrastructure earned 5% allocation despite a 52.5 category score (fourth rank) because its allocation to PAVE reflects opportunity cost versus higher-scoring categories. The disinflation regime helps this category: the state adds 7 macro points, disinflation pressure adds 6, and the Transition/Mixed descriptor adds 4, netting 62.0 macro/narrative fit—strong support. PAVE's 100.0 technical evidence score and 86.6 reasoned ETF proof order are exceptional; the domestic infrastructure beta resonates with capex cycles driven by AI buildout and grid modernization. Yet the 21.8% extension above the 50W, despite clean structure, demands respect for entry risk. Upside to resistance is flat at 0.0% while downside to support offers 35.5%—the worst risk-reward among allocated categories, justified only by the momentum evidence and the macro tailwind. The 5% position reflects that infrastructure is a legitimate emerging theme (EV charging, data center power, fiber), but entry risk is severe. PAVE needs to hold above the 21-period at approximately 32.50 to validate the setup; a pullback into the 50W at 29.37 would be a cleaner reentry point for larger allocation. This is a tactical position pending better risk geometry.
Defense & Aerospace — XAR
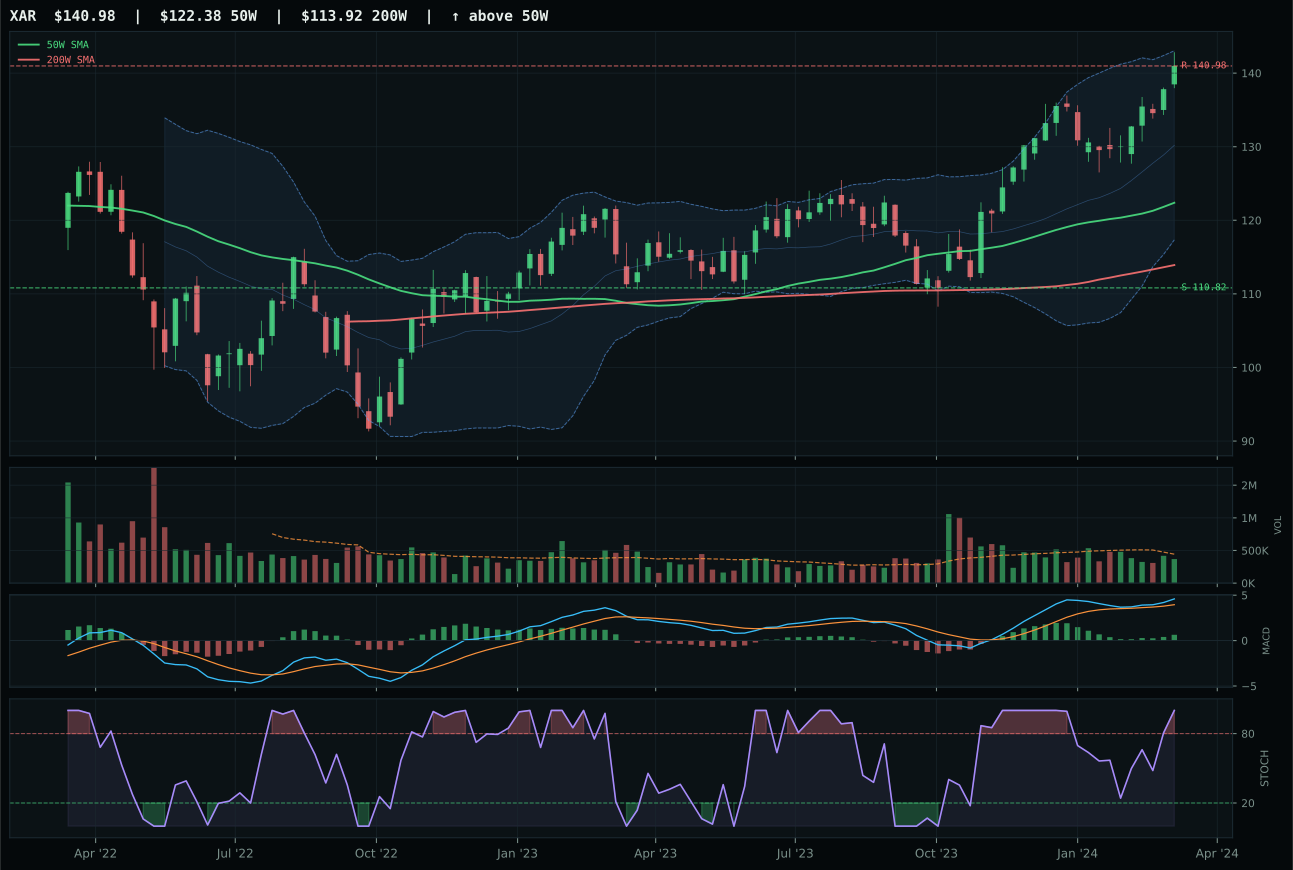
XAR has a vertical extension profile with -3.7% 13-week relative strength versus SPY.
A failed hold above support would weaken the setup.
Actionable but governed by invalidation levels.
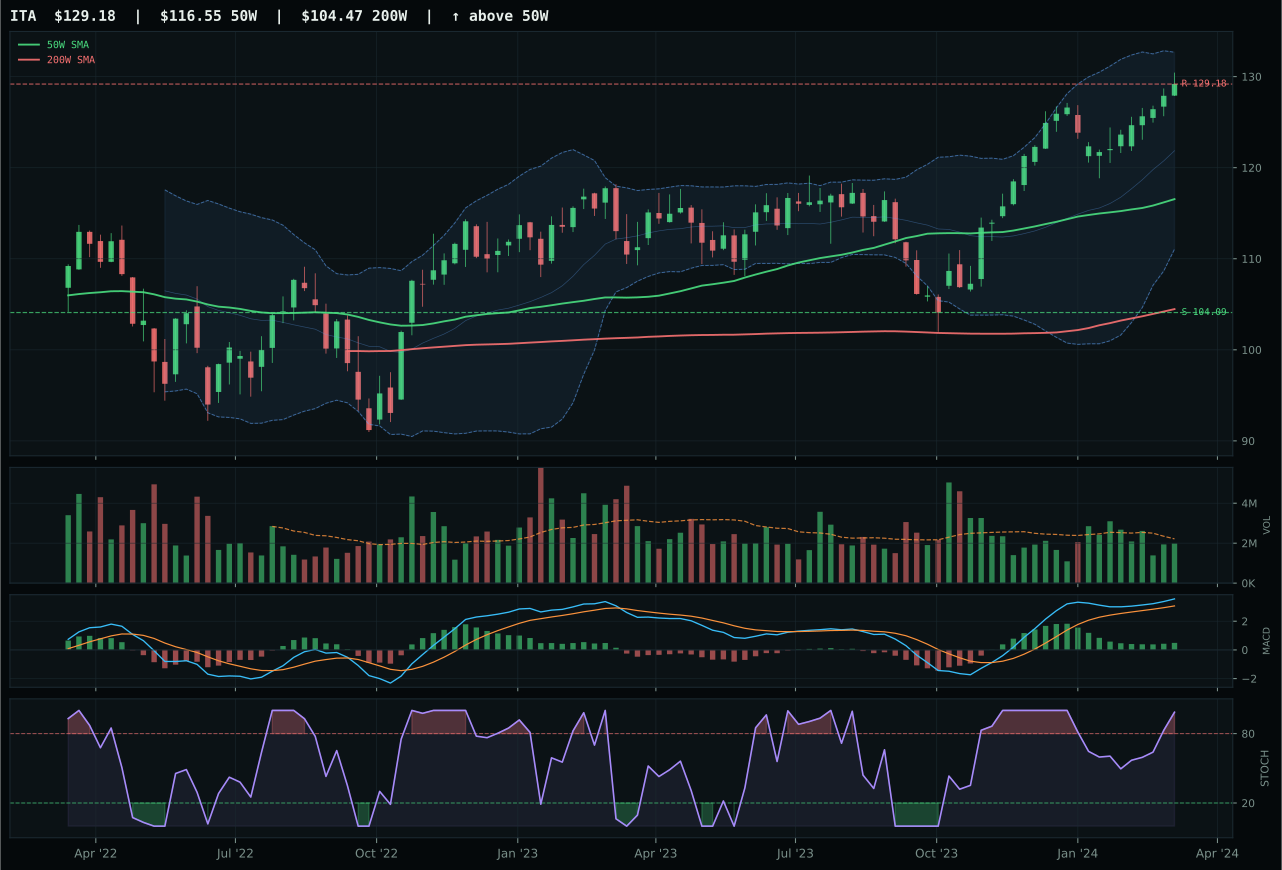
ITA has a neutral structure profile with -5.6% 13-week relative strength versus SPY.
A failed hold above support would weaken the setup.
Actionable but governed by invalidation levels.
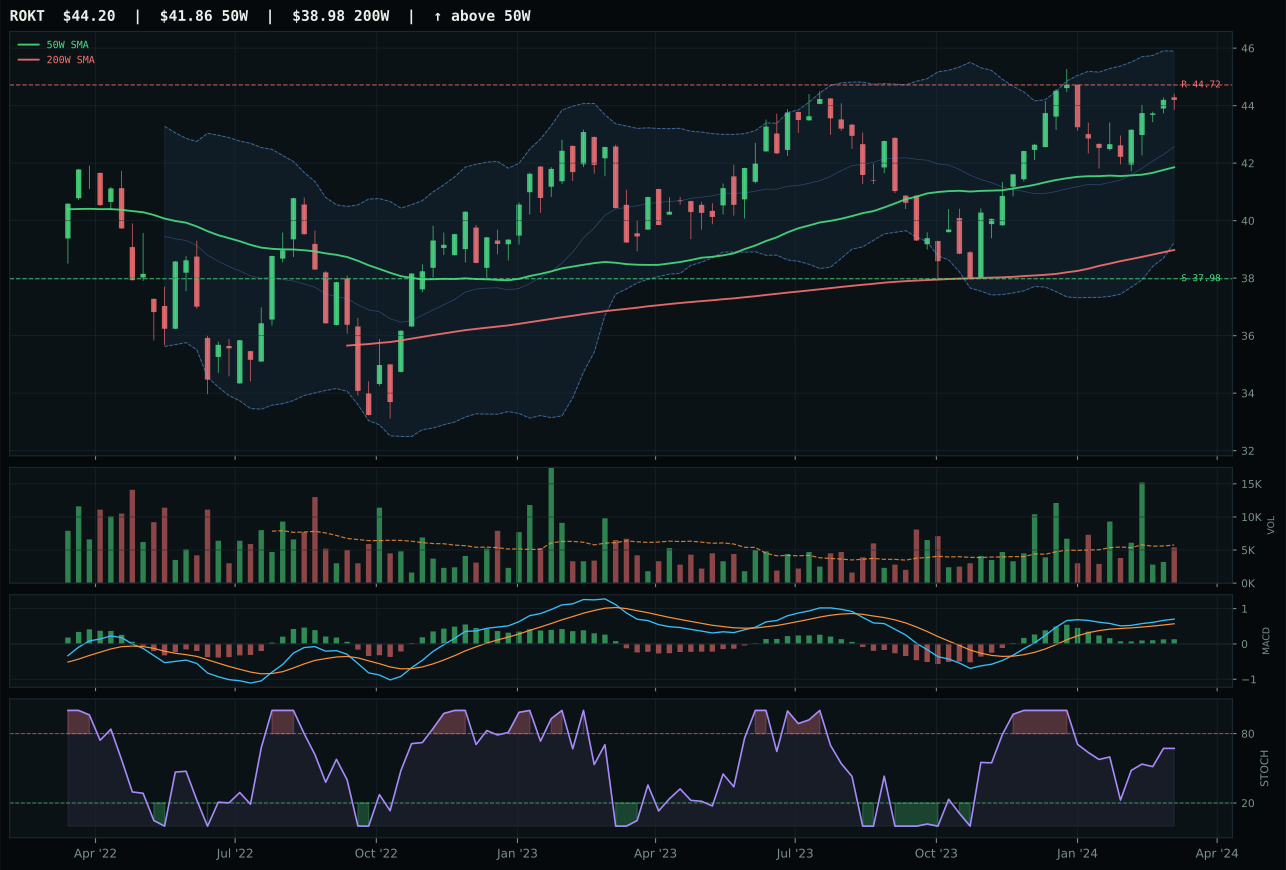
ROKT has a neutral structure profile with -7.5% 13-week relative strength versus SPY.
A failed hold above support would weaken the setup.
Tracked, but not top-2 eligible because: .
XAR wins a weak category decision where the margin over ITA is only 0.5 points on the reasoned score. XAR's victory turns on category-relative strength of 1.8% versus ITA's 0% and a slightly sharper structure score (75.4 vs placeholder comparison). Both face identical momentum setups—overbought stochastic RSI, bullish and improving MACD—but XAR maintains neutral volume participation at 0.83x while ITA also sits neutral. The real separator is that XAR's chart extended 15.2% from the 50W while ITA remained in a neutral structure, meaning XAR captured the most recent impulse and holds it. Neither name generates conviction; both sit extended and both have collapsed relative strength versus SPY (-3.7% and -5.6% respectively), which is the fundamental problem the category faces.
Defense & Aerospace landed at 5% allocation because its 50.3 category score ranks seventh, below the tier-1 categories but within the sustainable allocation band. Macro support is neutral to slightly positive: credit stress adds 2 points while liquidity stress removes 4, netting to 51.0 macro/narrative fit. The real constraint is technical: XAR's timing score of 37.0 reflects that 15.2% extension has exhausted most near-term upside. Risk-reward heavily favors the downside at 27.2% down to support against 0.0% to resistance, a 27:1 asymmetry that demands patience rather than aggression. Defense typically thrives during risk-off periods, yet the current regime is risk-on (risk appetite positive active), which removes one traditional tailwind. The disinflation environment offers neutral macro support since defense spending is inelastic to rate cycles. XAR's 5% position is a structural holding—the trend remains intact, MACD still improving, and the defense narrative endures—but new capital deployment would require either a pullback below the 50W for reentry or a break above resistance at 140.98, neither of which is imminent.
Technology — XLK
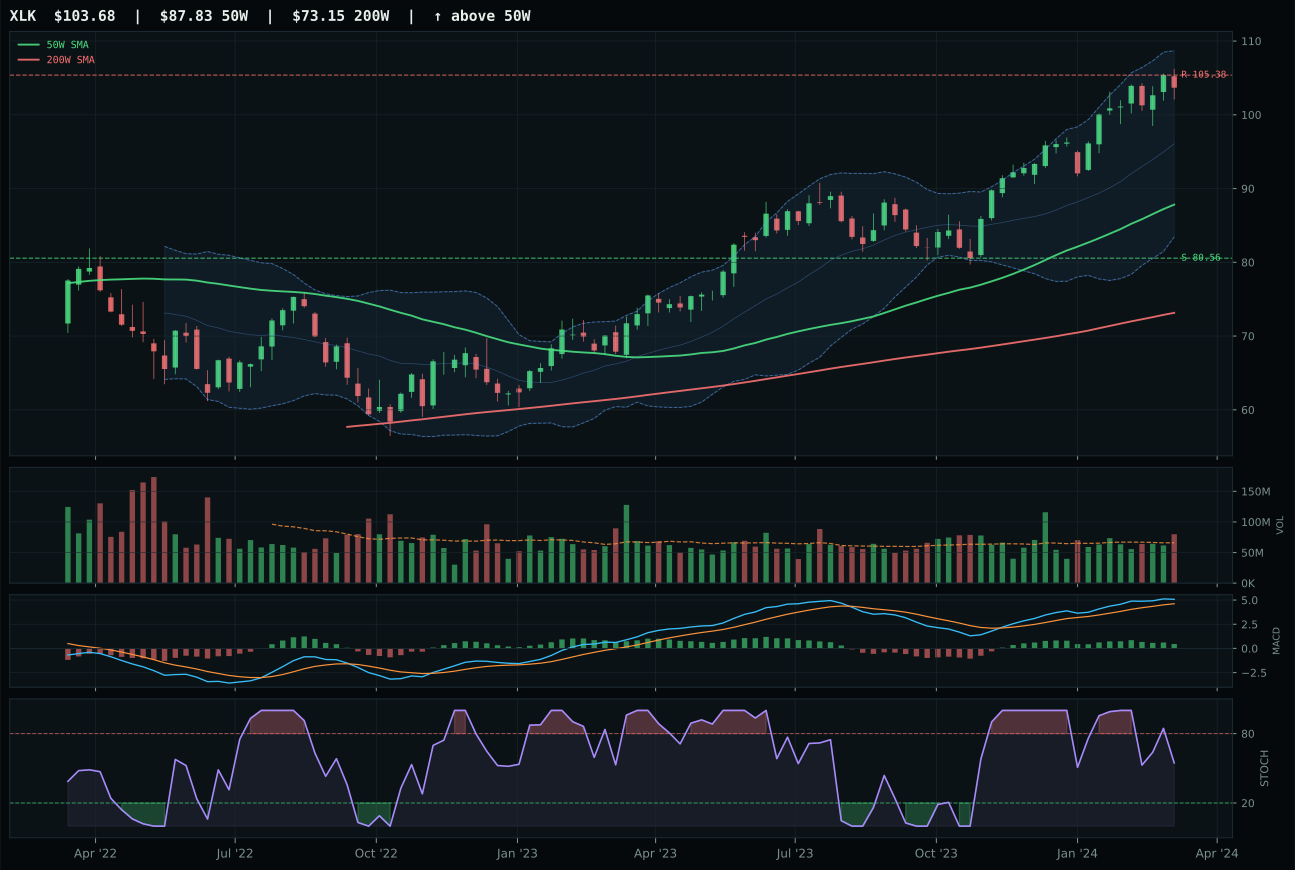
XLK has a vertical extension profile with -0.1% 13-week relative strength versus SPY.
A failed hold above support would weaken the setup.
Actionable but governed by invalidation levels.
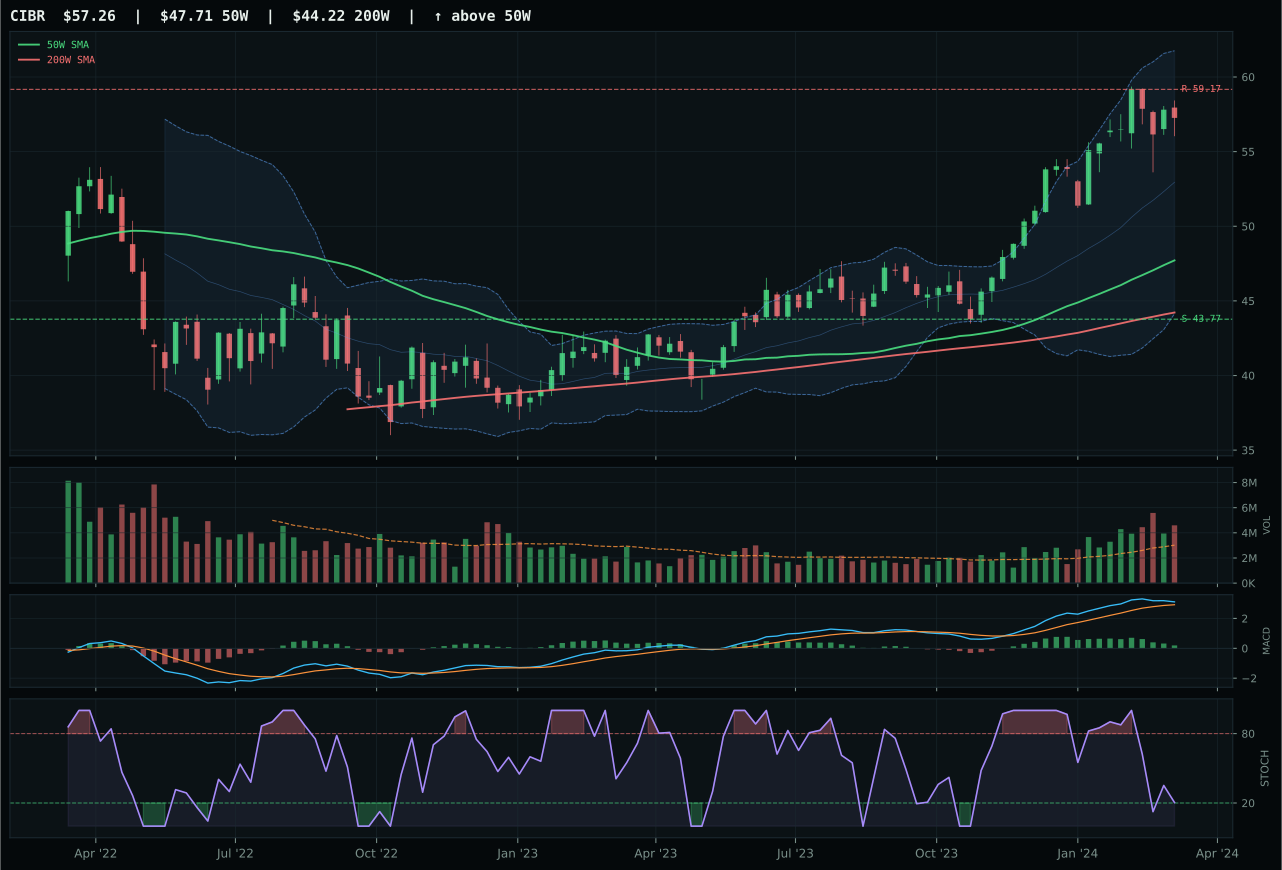
CIBR has a vertical extension profile with 1.0% 13-week relative strength versus SPY.
A failed hold above support would weaken the setup.
Actionable but governed by invalidation levels.
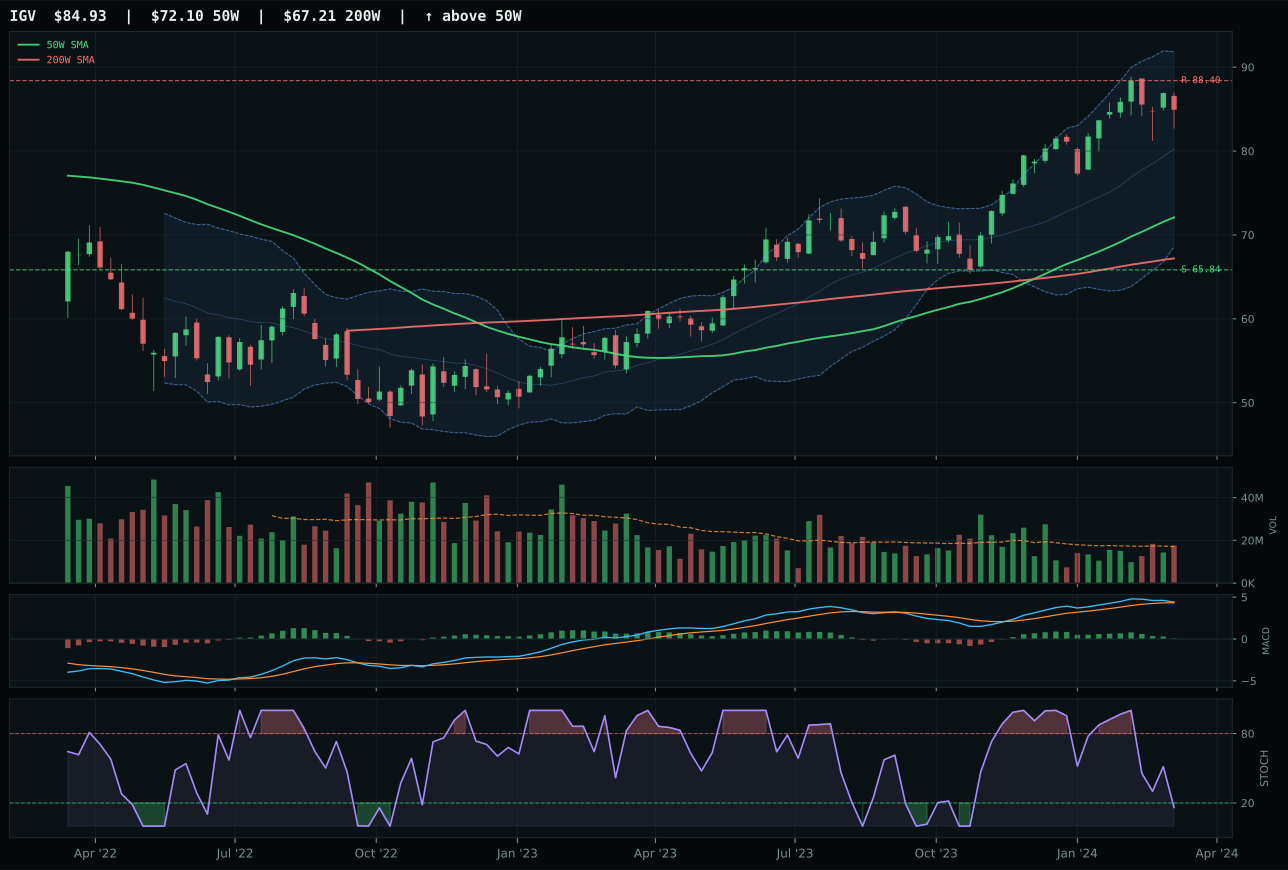
IGV has a vertical extension profile with -3.3% 13-week relative strength versus SPY.
A failed hold above support would weaken the setup.
Actionable but governed by invalidation levels.
XLK wins the category with clean trend confirmation above both the 50W and 200W, supported by a 50W slope of 0.7% that shows sustained buying rather than a stall. The 18% extension above the 50W penalizes entry timing, but the 11.1% thirteen-week return and neutral relative strength versus SPY (-0.1%) indicate this is a broad, undisputed move rather than a narrow leadership bet. CIBR lost ground because its stochastic RSI fell into neutral territory while XLK's remained mid-zone and rising, signaling divergent momentum even though both face extension risk. The MACD flattening across both names suggests the impulse phase is aging, making this a fading window for fresh accumulation.
Technology earned a 5% allocation slot rather than a top-2 position because its 49.1 category score ranks outside the two highest eligible categories this week. The macro environment offers mixed support: AI growth sponsorship adds 4 points, but liquidity stress drags down 9 points while credit stress removes another 6, netting to a 48.0 macro/narrative fit that cannot overcome the technical timing penalty. At 18% above the 50W, XLK is extended enough that the risk-reward has shifted unfavorably—upside to resistance is a mere -1.6% while downside to support offers 28.7%, exactly the asymmetry that sidelines a category despite bullish fundamentals. The disinflation regime actually supports technology through multiple channels (lower financing costs, AI efficiency gains), yet the timing score of 48.0 reflects that most of the move has already been captured. XLK remains worthy of 5% as a quality leadership anchor, but allocation capital flows to categories with better risk-adjusted setups this week.
Traditional Energy — XLE
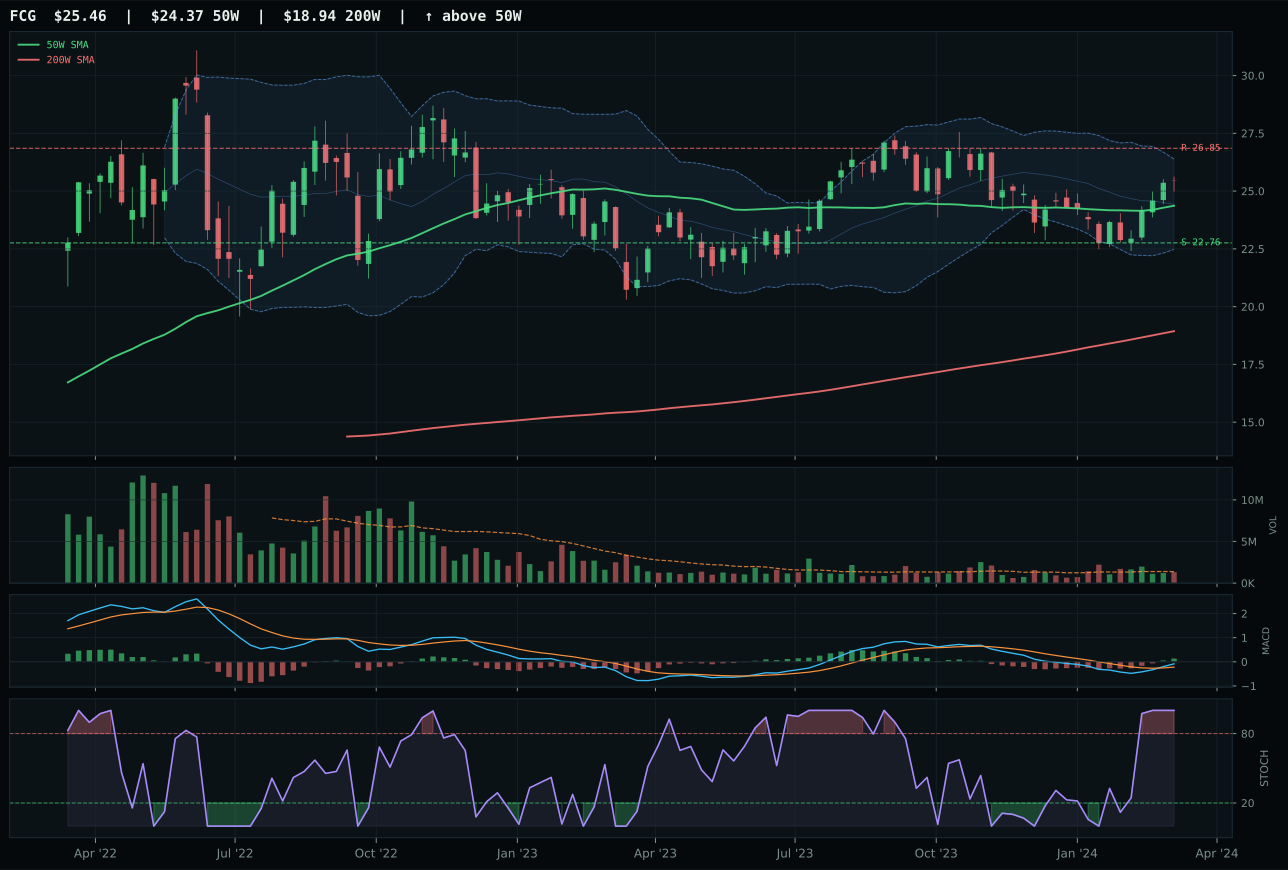
FCG has a neutral structure profile with -3.5% 13-week relative strength versus SPY.
A failed hold above support would weaken the setup.
Actionable but governed by invalidation levels.
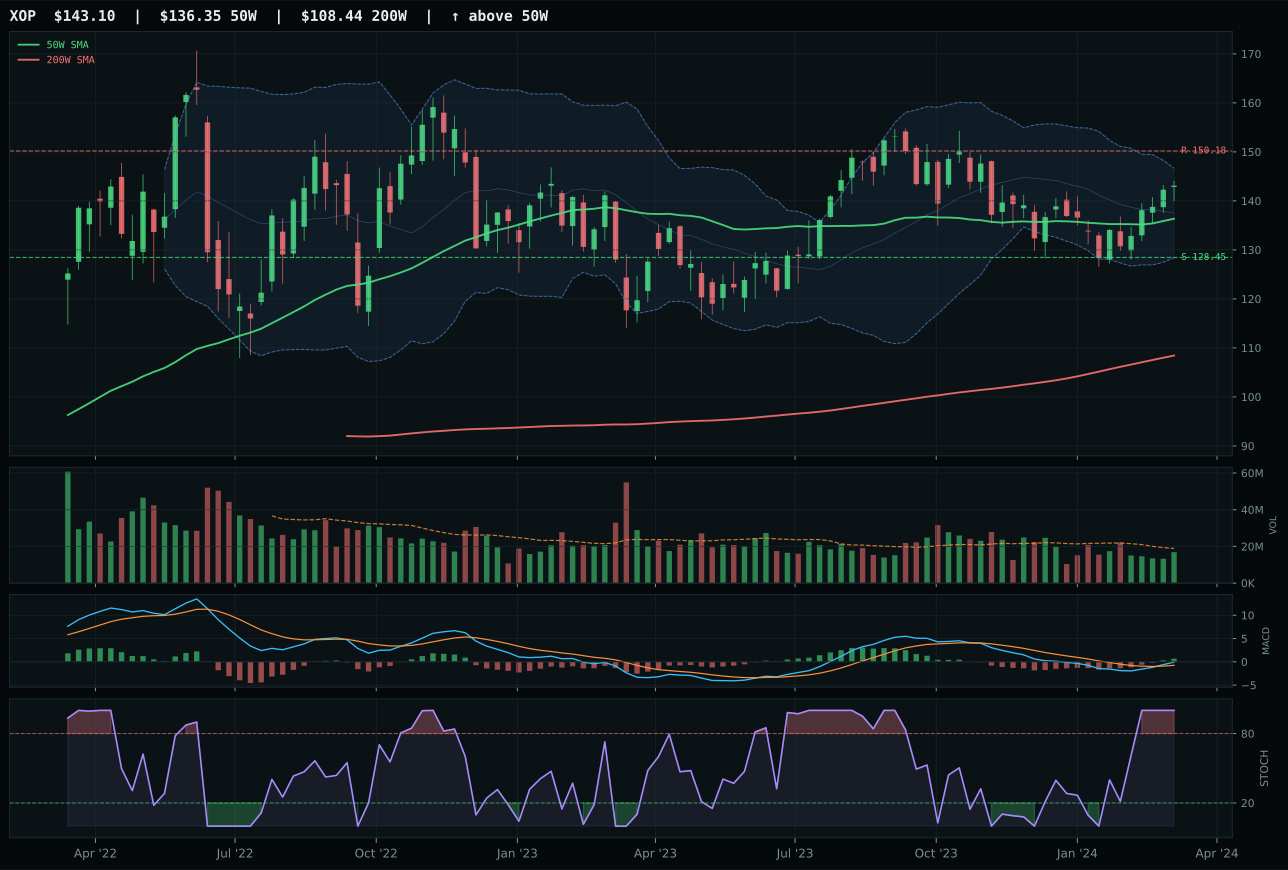
XOP has a neutral structure profile with -3.1% 13-week relative strength versus SPY.
A failed hold above support would weaken the setup.
Actionable but governed by invalidation levels.
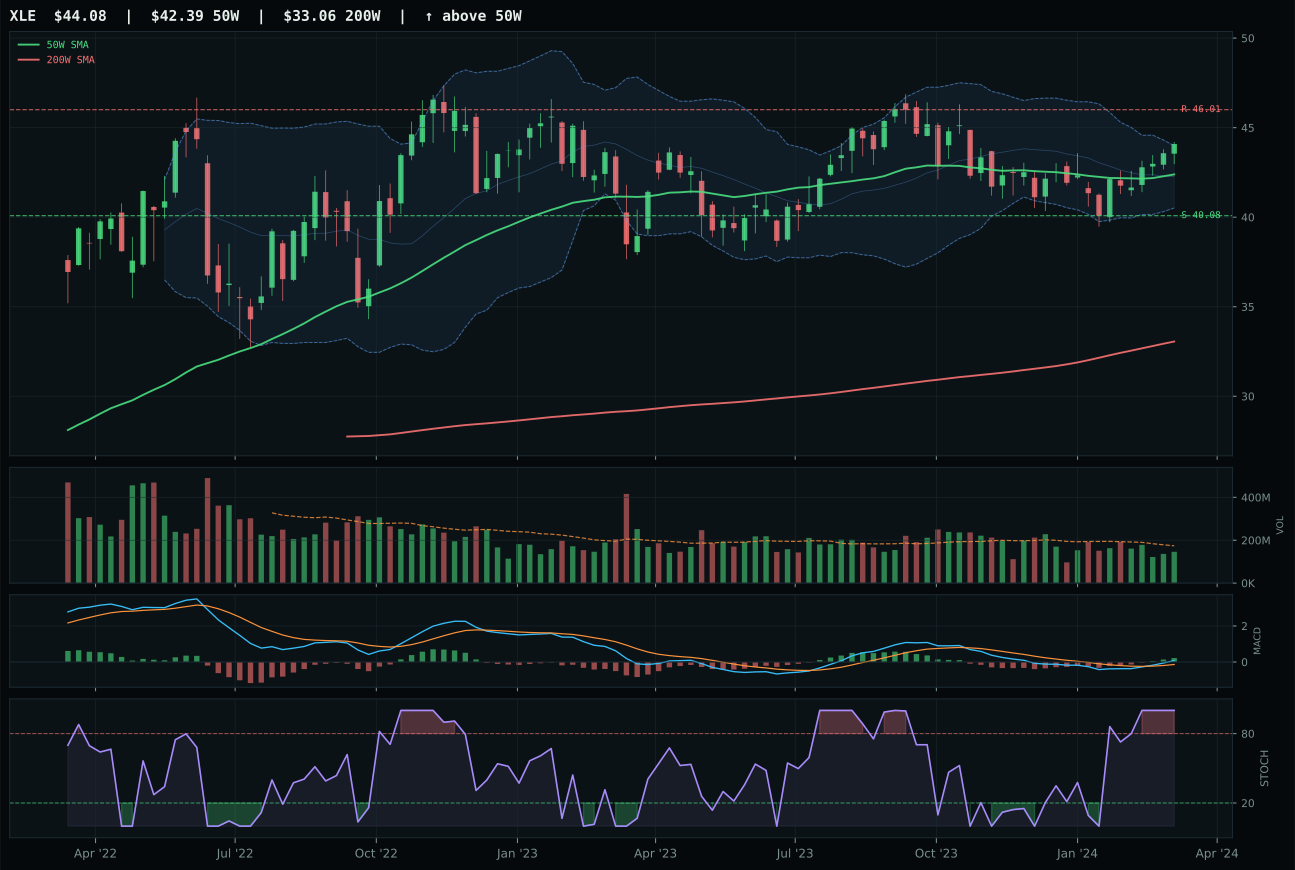
XLE has a neutral structure profile with -4.0% 13-week relative strength versus SPY.
A failed hold above support would weaken the setup.
Actionable but governed by invalidation levels.
XLE narrowly defeats FCG and XOP despite being the weakest of three closely bunched names. All three show identical MACD behavior (bullish and improving), identical stochastic RSI (overbought momentum), and neutral structure with 4% distance to the 50W. XLE's category-relative strength of -0.5% is marginally better than FCG's 0% and XOP's comparison baseline, giving it the edge in a photo finish. Structure cleanliness scores are all 58.3, and risk-reward is tightly packed between 52–53, meaning this win comes down to volume confirmation rather than setup quality: XLE's neutral participation at 0.84x is slightly cleaner than FCG's read, avoiding any suggestion of late-stage distribution. The category is genuinely weak; no name shows conviction, and the decision among three near-identical competitors suggests the allocator should treat this as a placeholder trade rather than a conviction position.
Traditional Energy received 5% allocation despite a 48.0 category score (sixth rank) because it occupies a structural position in real asset breadth, but the macro regime is actively hostile. Disinflation pressure removes 10 points, the Disinflation state removes 10 points, and liquidity stress removes 7, for a net 23.0 macro/narrative fit—the worst among all ten categories except Agriculture. The category is underwater on macro: falling rates and cooling inflation are structural headwinds to energy spending. Real asset sponsorship adds 7 points, a nod to the inflation-hedge narrative, but that's insufficient to overcome the disinflationary tide. XLE's 94.0 trend score and 90.0 timing reflect a chart that is technically intact—price remains above both moving averages, MACD is improving, entry risk is manageable—yet the macro drag is inescapable. The 5% allocation serves as a portfolio hedge: if disinflation reverses and inflation resurges, energy and real assets become core positions again. For now, XLE's neutral structure and 4.0% distance from the 50W suggest the uptrend is mature but not broken. This is a holding, not a new commitment. The category would need either a break above 46.01 resistance with volume confirmation or a Fed pivot signal to earn promotion to 10%.
Nuclear Energy — NLR
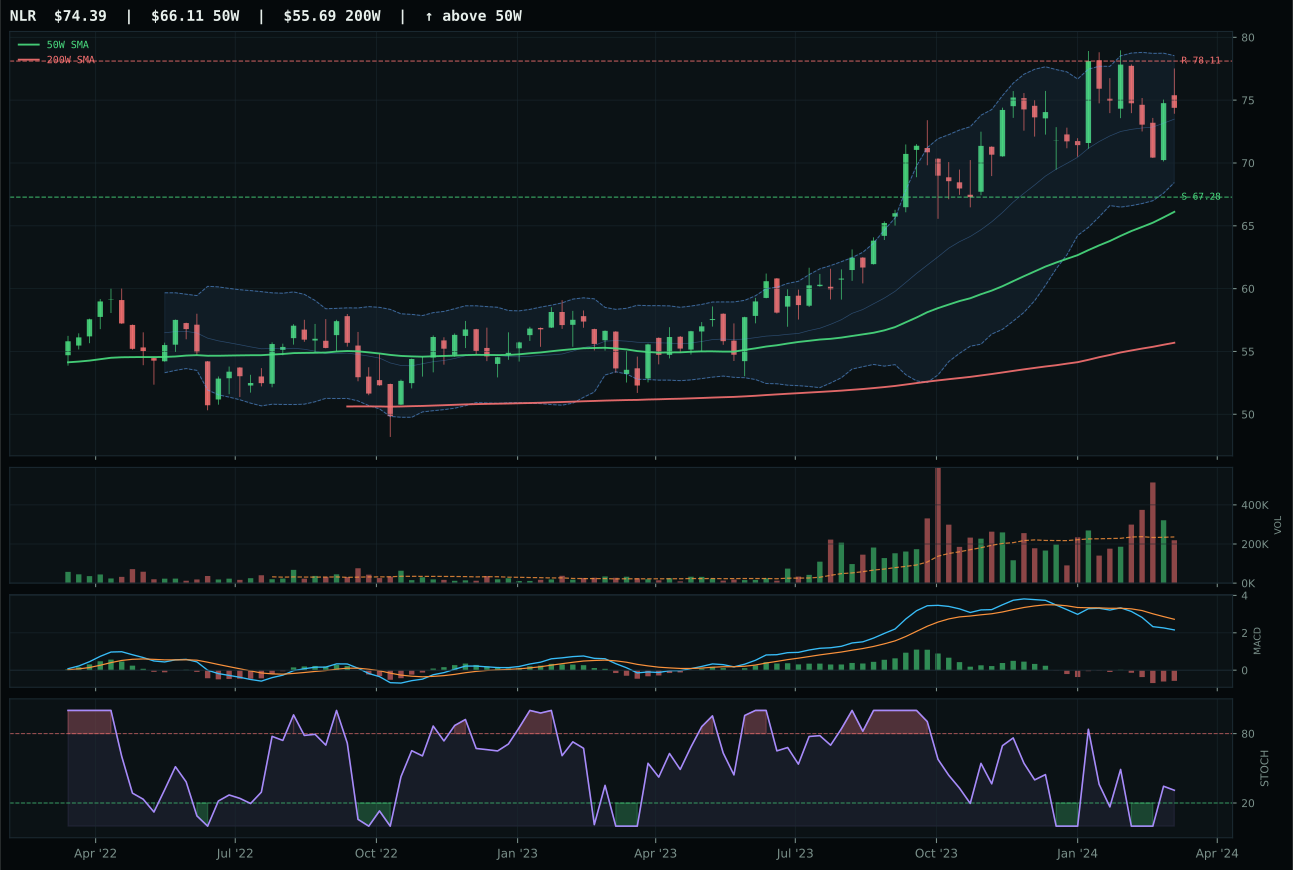
NLR has a neutral structure profile with -10.2% 13-week relative strength versus SPY.
A failed hold above support would weaken the setup.
Actionable but governed by invalidation levels.
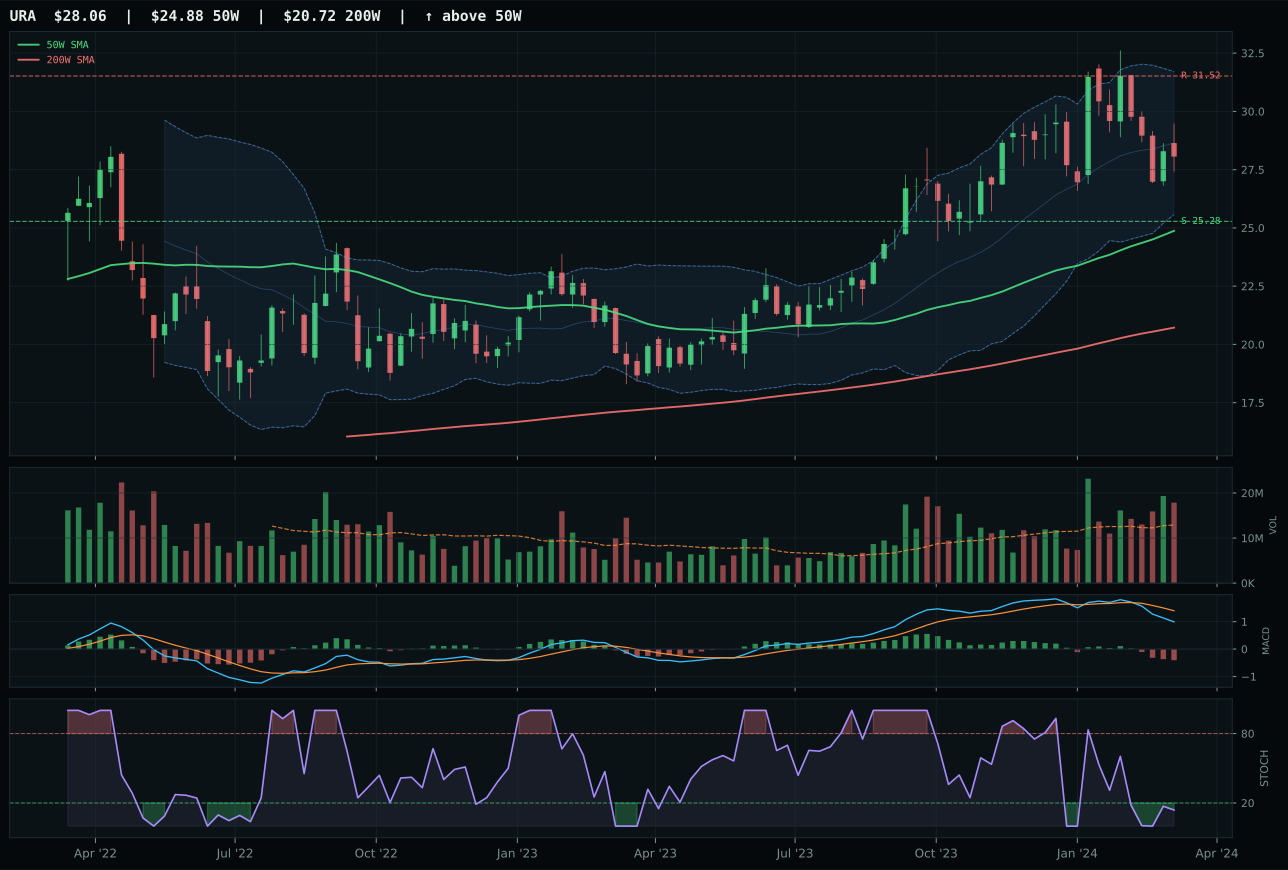
URA has a neutral structure profile with -13.7% 13-week relative strength versus SPY.
A failed hold above support would weaken the setup.
Actionable but governed by invalidation levels.
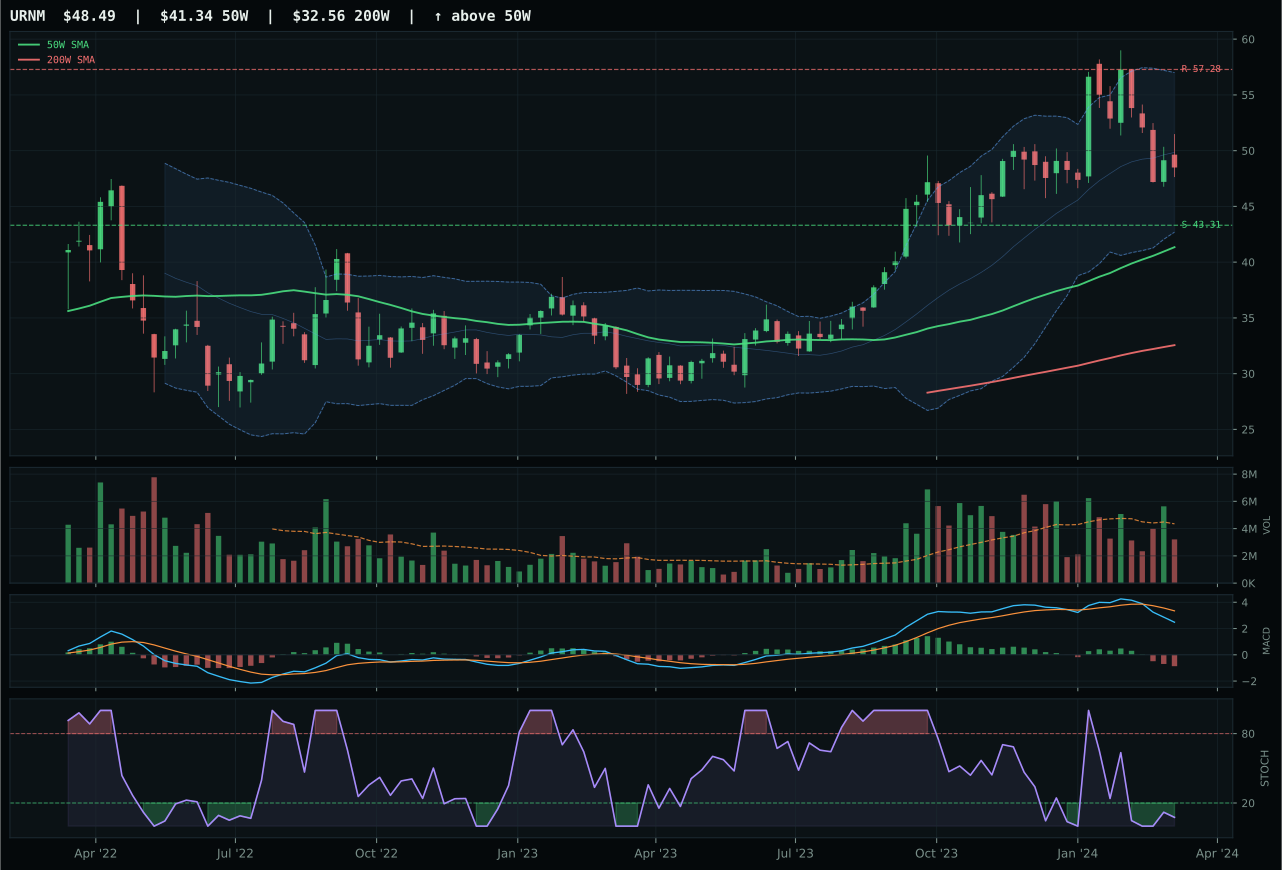
URNM has a vertical extension profile with -11.6% 13-week relative strength versus SPY.
A failed hold above support would weaken the setup.
Actionable but governed by invalidation levels.
NLR wins an equally weak matchup over URA by a margin of 0.5 points on technical evidence. Both sit above the 50W and 200W, but NLR's stochastic RSI is rising mid-zone (0.31) while URA's is oversold turn-up, giving NLR's setup a fractionally cleaner timing profile. NLR's category-relative strength of 1.5% exceeds URA's -2.1%, providing the decisive edge. Neither shows genuine momentum: NLR's thirteen-week return is 1% and MACD is bearish/weakening, which is disqualifying in a category where nuclear should be performing. Volume is thin across both names (0.93x and above-average for URA), and the risk-reward setups favor downside protection (NLR at 10.6% to support, URA at 10.6% as well). This is a weak category win where the victor is simply less wrong than the runner-up.
Nuclear Energy earned 5% allocation as a structural holding despite a 39.7 category score (eighth rank) because the macro narrative has shifted in its favor. AI growth sponsorship adds 5 points, real asset sponsorship adds 7, supporting the thesis that power grid upgrades and data center buildouts will require new baseload capacity. Credit stress removes 5 and liquidity stress removes 7, but the 50.0 macro/narrative fit reflects a category in early narrative transition. NLR's technical deterioration is real—MACD weakening, momentum at 21.0, 13W return only 1.0%—yet the structural case for nuclear energy support (AI capex, climate policy, grid stability) has strengthened relative to traditional utilities. The 5% position is a conviction allocation to a potential turning point rather than an immediate trade. Support sits at 67.28, only 10.6% below current prices, offering defined downside risk. Upside resistance at 78.11 represents 4.8% available, slightly negative on entry, but the asymmetry is acceptable for a positioning bet. This category needs either a break above 78.11 or a sustained move back above 75 (21-period level) to signal that the MACD deterioration was a false bear flag. If neither occurs, nuclear would be a downgrade candidate in next week's rebalance.
Industrial Metals — COPX
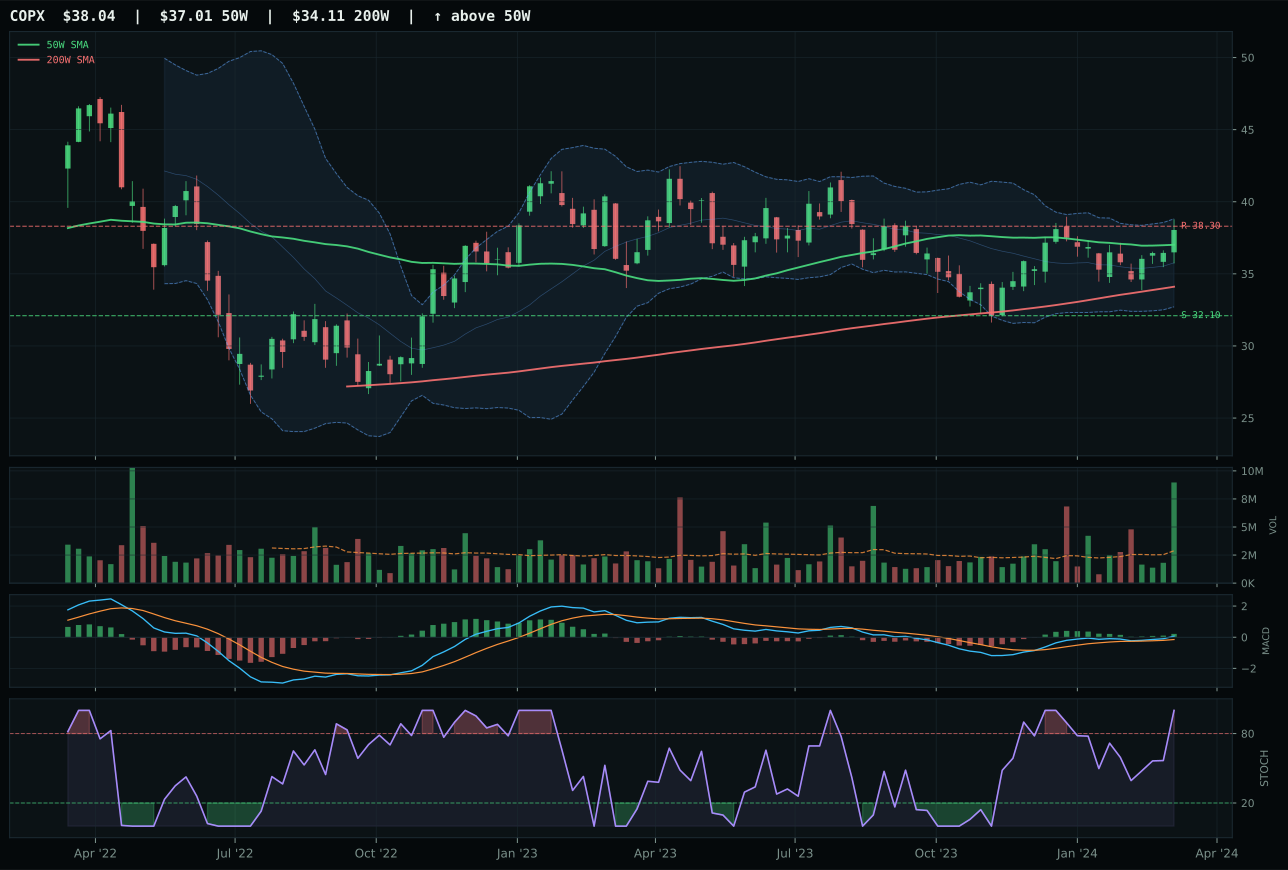
COPX has a compression near 50W profile with -3.5% 13-week relative strength versus SPY.
A failed hold above support would weaken the setup.
Actionable but governed by invalidation levels.
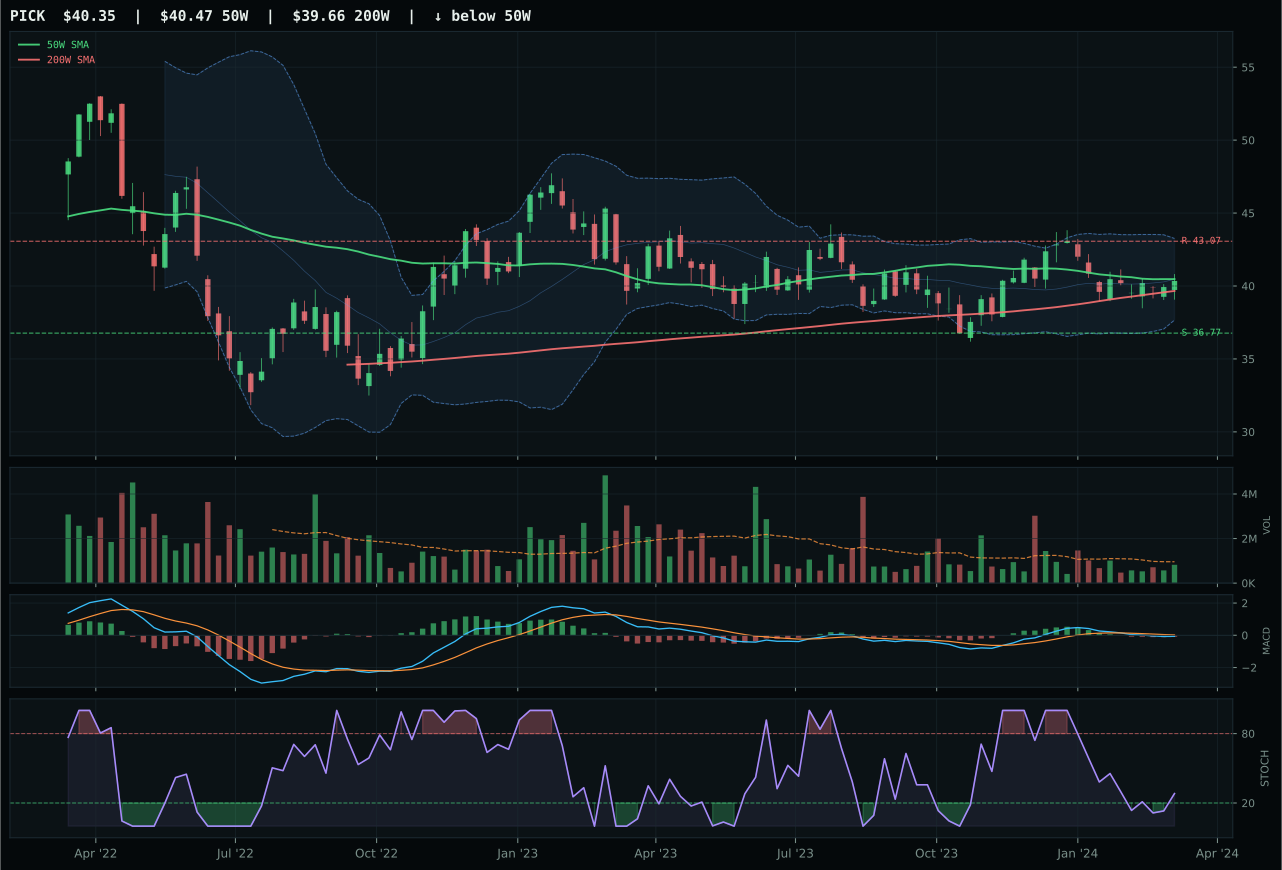
PICK has a compression near 50W profile with -11.6% 13-week relative strength versus SPY.
A failed hold above support would weaken the setup.
Actionable but governed by invalidation levels.
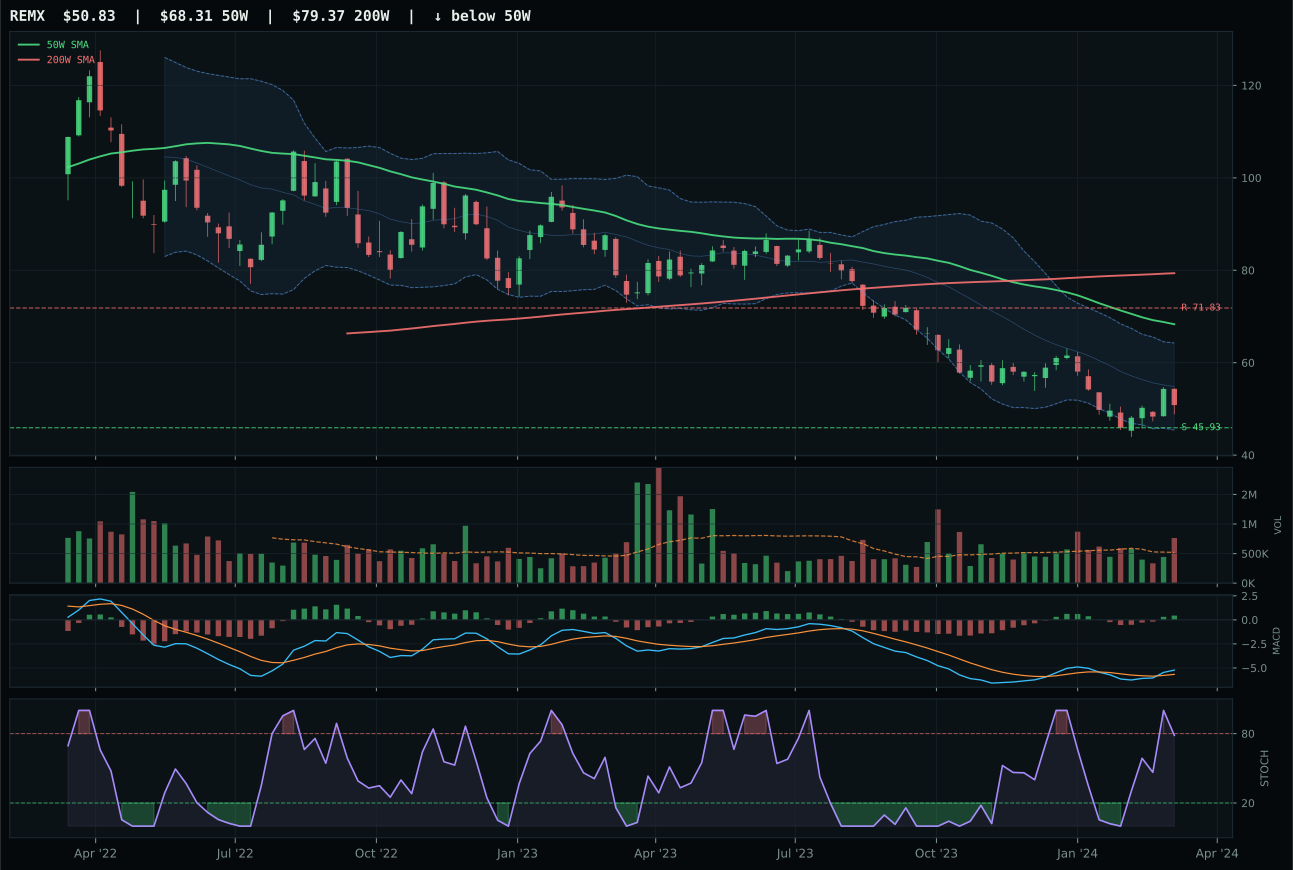
REMX has a neutral structure profile with -22.6% 13-week relative strength versus SPY.
Extension and support failure are the main tactical risks.
Tracked, but not top-2 eligible because: structurally broken.
COPX delivers a rare perfect-score setup: compression near the 50W with only 2.8% distance, overbought stochastic RSI at 1.00, bullish and improving MACD, and category-relative strength of 8.1% that dwarfs PICK's 0%. Volume at 3.11x average participation is the highest in the dataset, signaling that industrial buyers have returned to copper futures and equity holders are defending support. The thirteen-week return of 7.7% matches healthy momentum without extension, and the risk-reward score of 58.7 reflects genuine two-way potential—18.5% downside to support provides a defined exit while 0.7% upside leaves room to work. PICK's MACD turned bearish/weakening, which is disqualifying in a category where commodity breadth positive is active at +10; the divergence in momentum confirmation between COPX's 100 and PICK's 20 is stark.
Industrial Metals earned a 5% allocation despite a 38.8 category score (seventh rank) because the macro regime actively supports metals scarcity, offering a specific allocation thesis. Metals scarcity adds 14 macro points, commodity breadth positive adds 10, and real asset sponsorship adds 6, for a 65.0 macro/narrative fit—the second-best after Precious Metals. This category is the inflation-hedge play within the disinflation framework: while prices are cooling, industrial metals benefit from structural demand (EV batteries, renewable energy infrastructure) that outpaces sentiment. COPX's 100.0 technical evidence score and compression near the 50W create a risk-defined setup where downside support is 18.5% away while upside is capped at -0.7%—acceptable risk geometry for a 5% satellite position. Liquidity stress removes 8 points and credit stress removes 7, headwinds that keep the category out of top-2, yet the structural metals scarcity thesis has strengthened in recent weeks. COPX's 3.11x volume suggests smart money is positioning ahead of a potential breakout; the 5% position captures that upside if compression resolves higher while limiting exposure if it fails. This is a tactical hedge against reflation risk if disinflation falters.
Emerging Markets — INDA
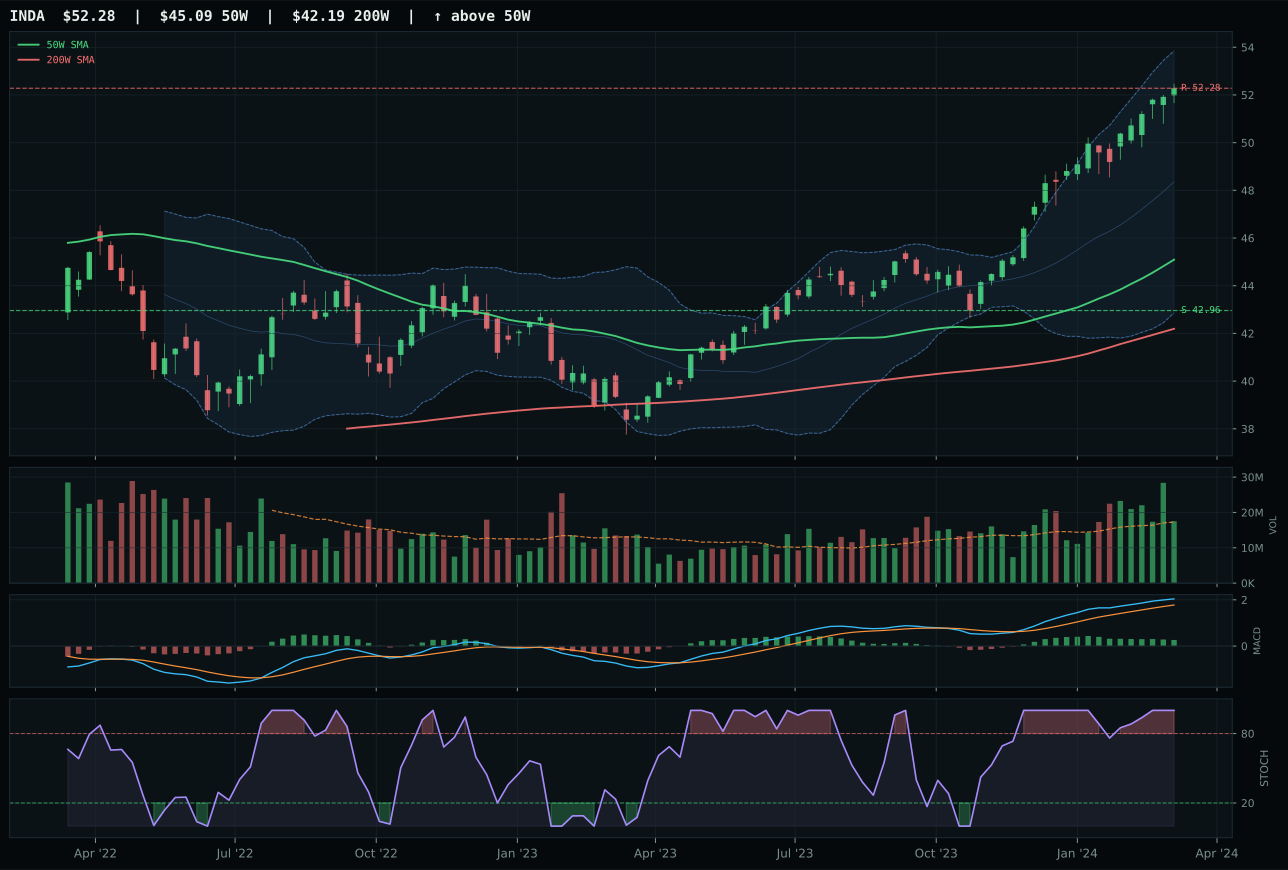
INDA has a vertical extension profile with -0.7% 13-week relative strength versus SPY.
A failed hold above support would weaken the setup.
Actionable but governed by invalidation levels.
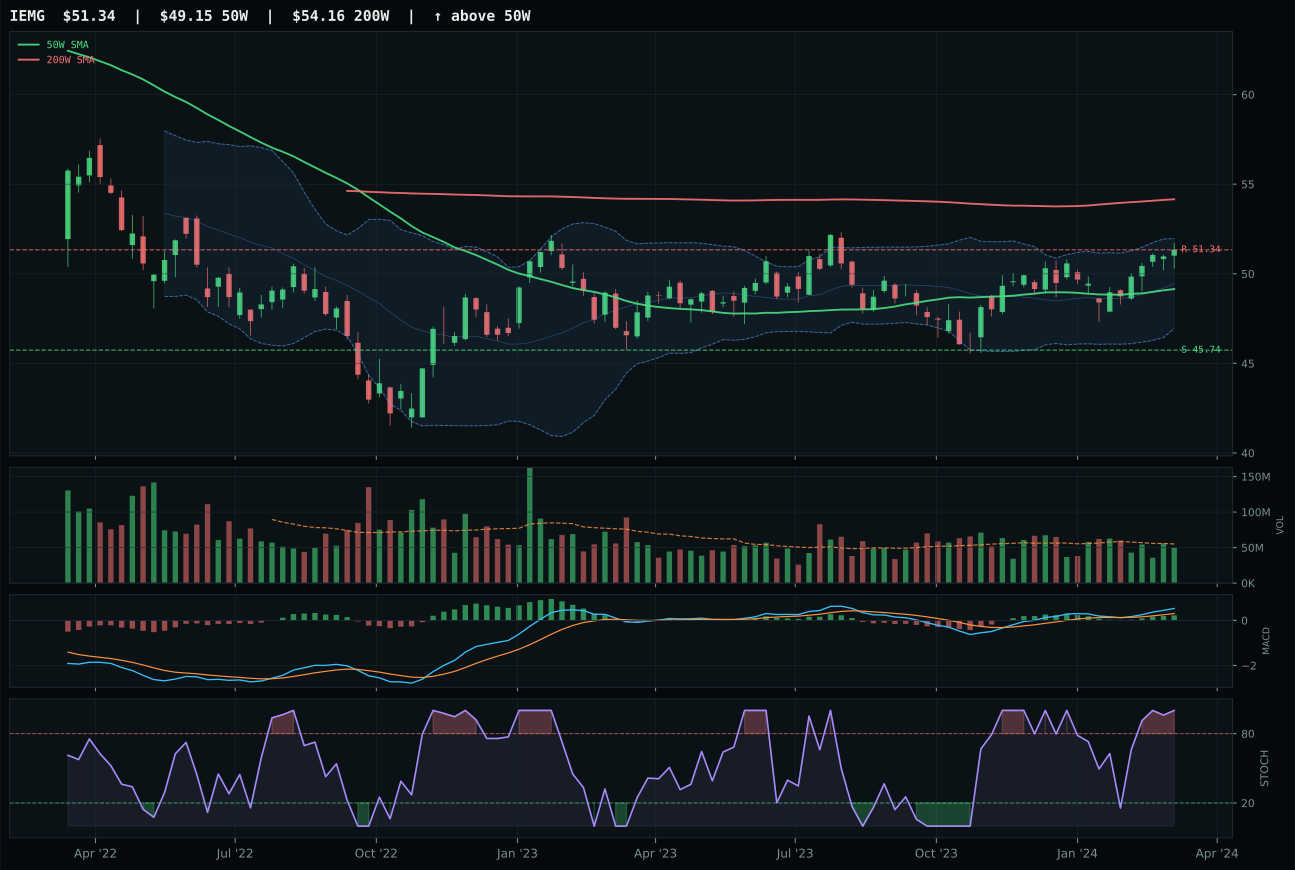
IEMG has a neutral structure profile with -6.7% 13-week relative strength versus SPY.
A failed hold above support would weaken the setup.
Actionable but governed by invalidation levels.
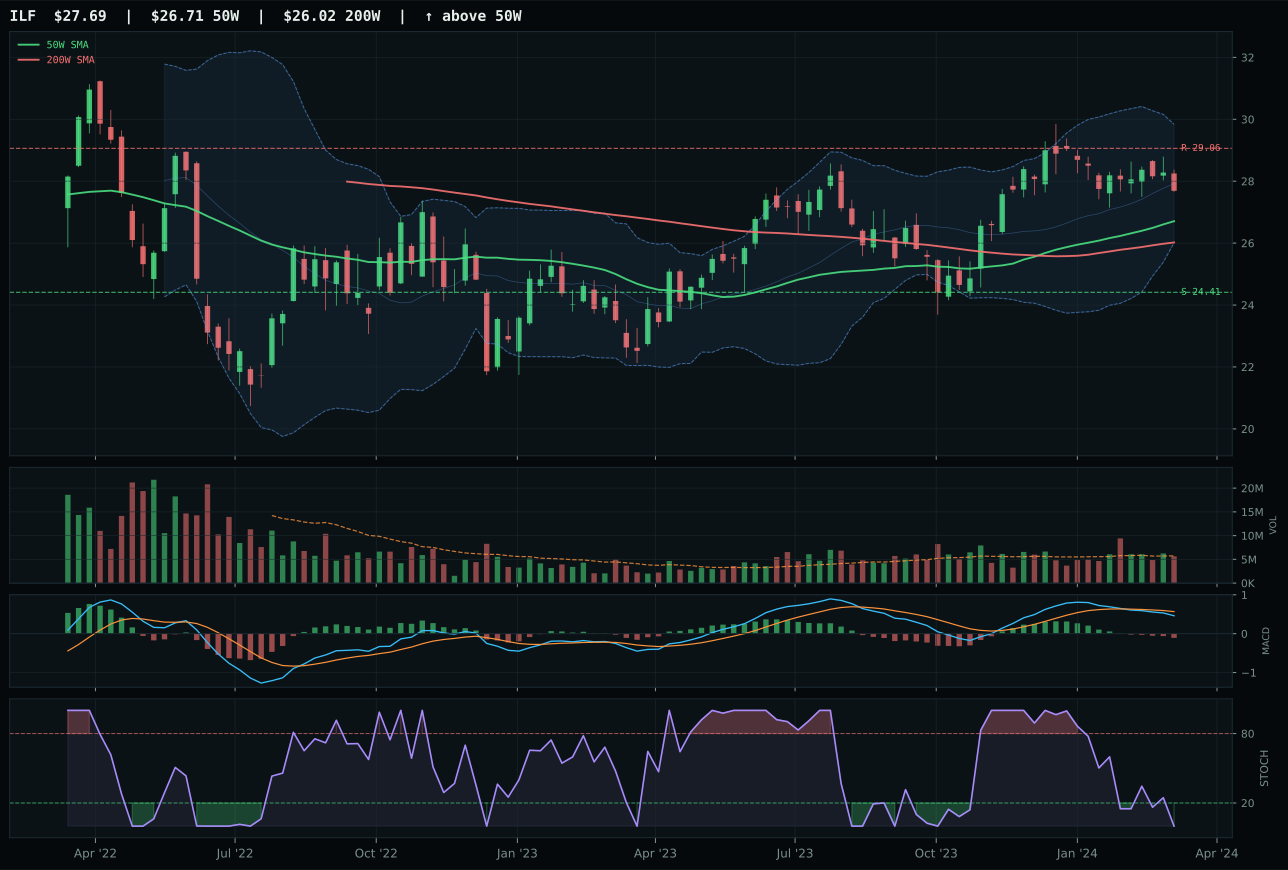
ILF has a neutral structure profile with -12.5% 13-week relative strength versus SPY.
A failed hold above support would weaken the setup.
Actionable but governed by invalidation levels.
INDA defeats IEMG despite scoring lower on the reasoned ETF list because the category representative logic selects for trend and relative strength within the basket, not macro or macro-adjusted benchmarking. INDA's thirteen-week return of 10.5% and category-relative strength of 6% dwarf IEMG's 4.5% and 0%, respectively. The structure comparison is stark: INDA scores 83.5 for cleanliness and vertical extension (near 52W high), while IEMG's neutral structure scores only 73.2. INDA's stochastic RSI is overbought momentum like IEMG's, but INDA's MACD is bullish but flattening versus IEMG's bullish and improving, which seems like a reversal until you consider the relative strength—INDA is pulling ahead in a category that faces macro headwinds, suggesting its outperformance is structural, not momentum. IEMG's broader emerging-market exposure should have provided resilience, but it was outbid.
Emerging Markets received 0% allocation because its 27.0 final score ranks 10th, the lowest category this week, with an ineligible flag on the representative. The macro regime is explicitly hostile: credit stress removes 10 points, liquidity stress removes 10 points, and the Disinflation state offers no supportive descriptor. With only risk appetite positive at 8 points, the category averages 38.0 macro/narrative fit, the worst combined with a technical setup that is too extended to justify risk. INDA's 32.0 timing score reflects that 15.9% above the 50W is late in the move; upside to resistance is flat at 0.0% while downside to support offers 21.7%—an asymmetry that screams caution. The 79.9 momentum confirmation suggests accumulated buying, yet the bullish but flattening MACD indicates momentum is rolling over. Emerging markets depend on capital flows and risk appetite, both of which are frail in the current regime. This category would require either a 10% pullback to the 50W to reset technicals or a meaningful positive macro catalyst (Fed pivot, China stimulus, trade deal) to warrant reentry. For now, emerging market exposure is speculative noise rather than strategic allocation.
Agriculture & Livestock — MOO
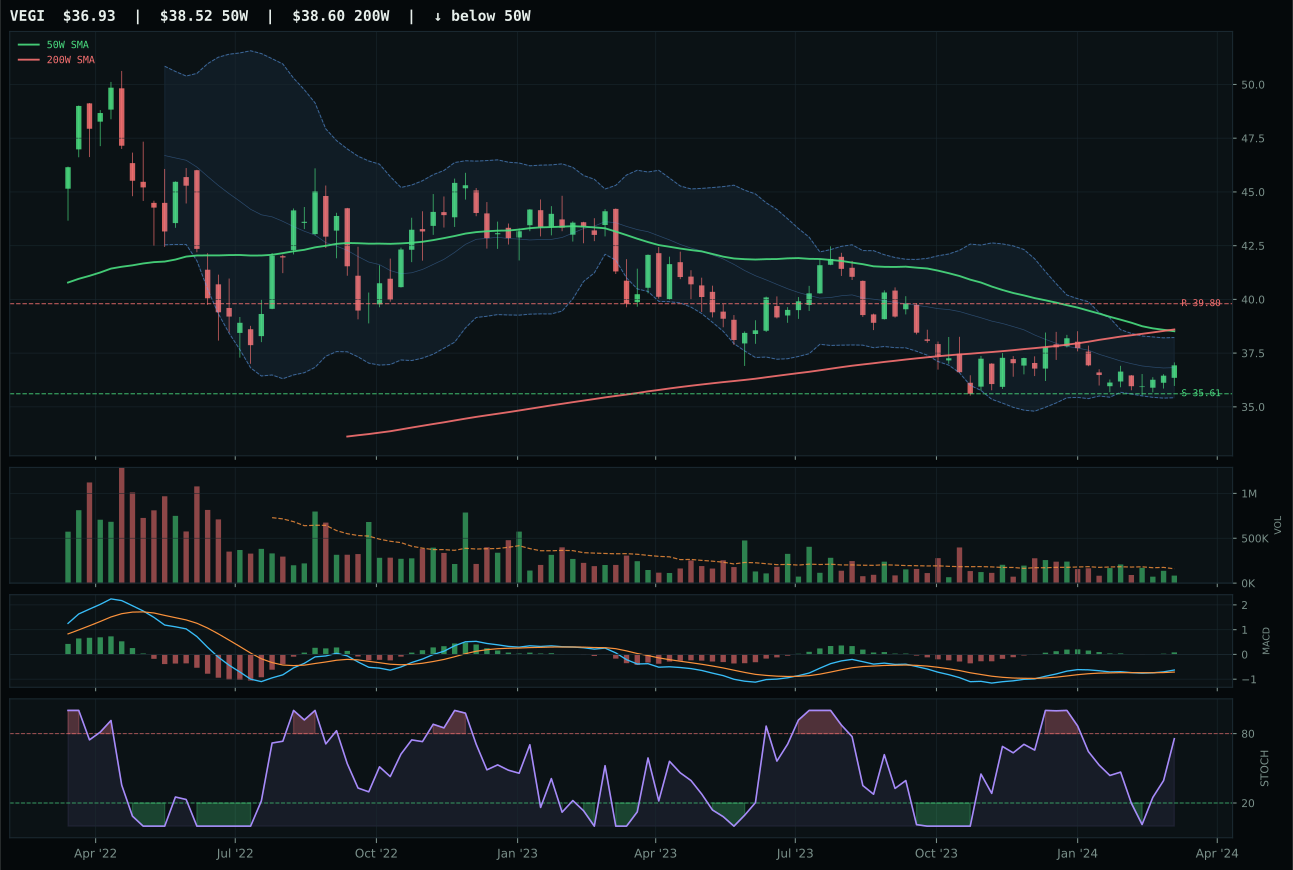
VEGI has a pullback into support profile with -10.8% 13-week relative strength versus SPY.
Extension and support failure are the main tactical risks.
Tracked, but not top-2 eligible because: structurally broken.
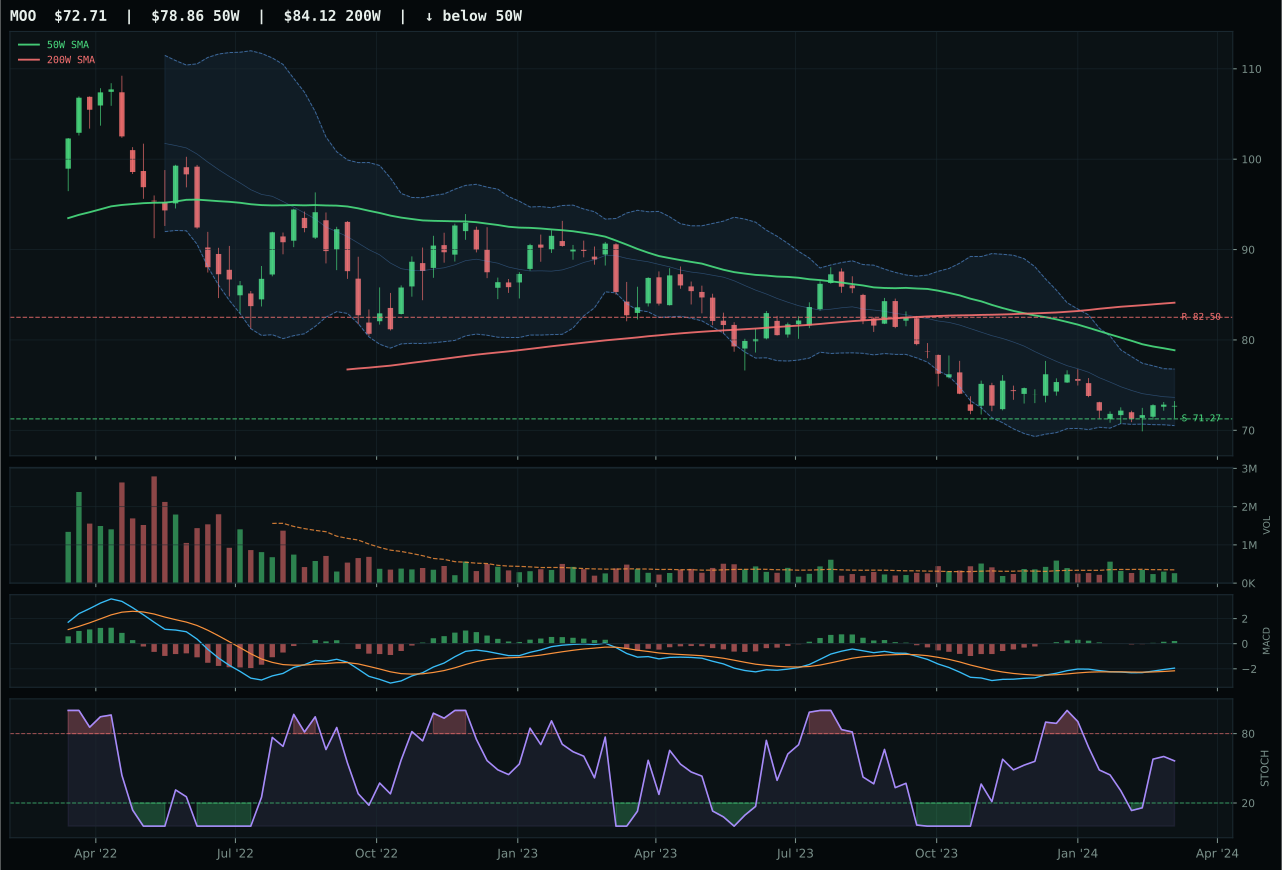
MOO has a pullback into support profile with -12.9% 13-week relative strength versus SPY.
Extension and support failure are the main tactical risks.
Tracked, but not top-2 eligible because: structurally broken.
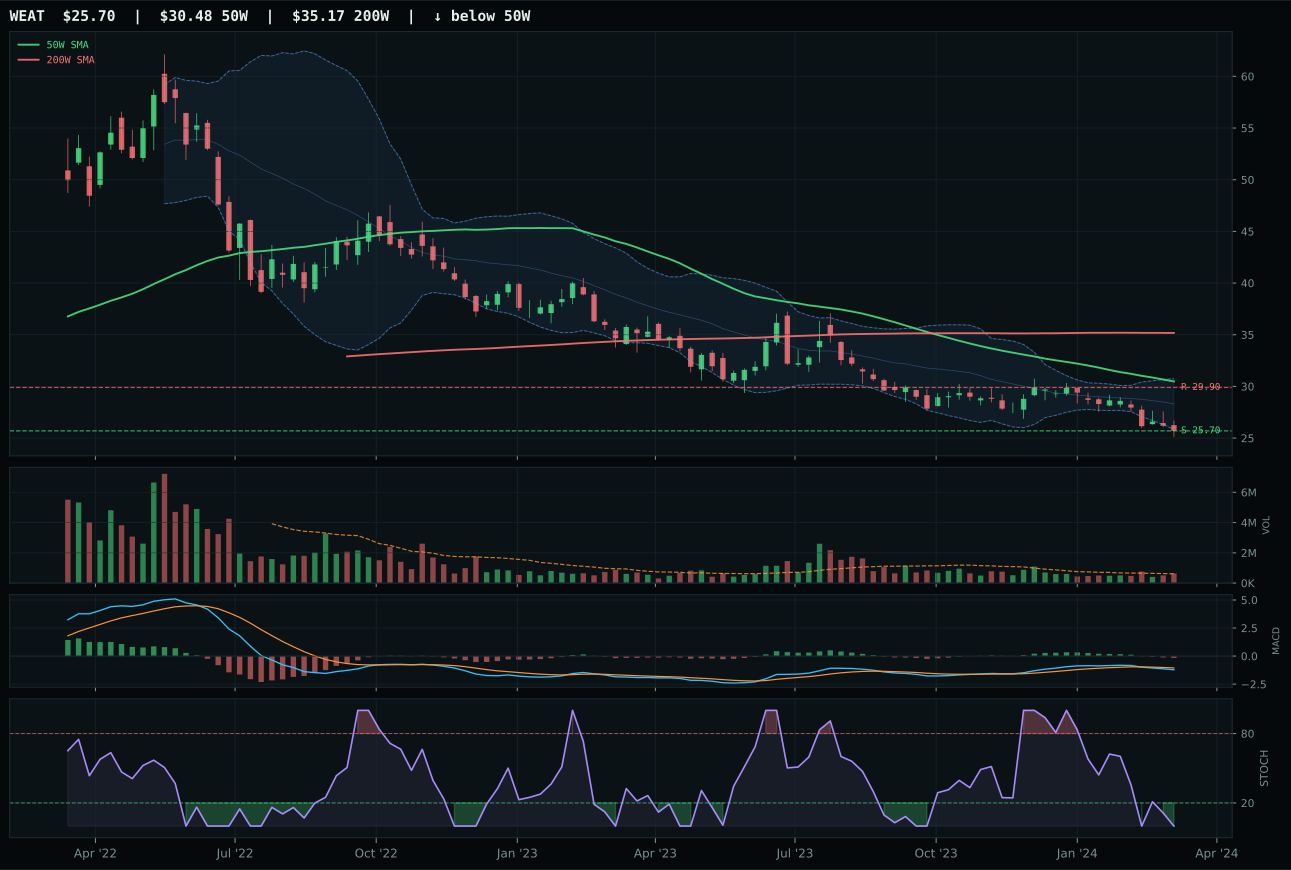
WEAT has a pullback into support profile with -25.2% 13-week relative strength versus SPY.
Extension and support failure are the main tactical risks.
Tracked, but not top-2 eligible because: structurally broken.
MOO wins a category that failed the hard eligibility filters, narrowly beating VEGI on risk-reward (90 versus 80) despite identical technical evidence scores of 42. Both sit below their 50W and 200W, with 13W returns in negative territory (MOO at -1.7%, VEGI at +0.4%) and RS versus SPY around -11 to -13%. The decision hinges on timing: MOO's setup is pullback into support at 71.27 with only 2% downside, while VEGI faces -11.9% upside to resistance, creating the risk asymmetry that pushes MOO ahead. Neither shows evidence of institutional re-entry; volume is thin at 0.75x for both, and MACD/stochastic suggest early-stage bottoming rather than confirmed reversal. This is a defensive low-conviction win.
Agriculture & Livestock receives 0% allocation because its 6.2 final score is disqualifying, ranking ninth among ten categories, with an ineligible flag on the representative. The disinflation regime actively hurts this category: falling commodity prices reduce input costs but also suppress farmer revenues, netting to -6 macro points for the regime. Real asset sponsorship adds 8 points, and commodity breadth positive adds 5, but disinflation pressure removes 8 and liquidity stress removes 4, leaving 45.0 macro/narrative fit—the lowest among all ten categories. MOO's technical evidence of 42.0 is simply inadequate; below-trend price, a broken moving average structure, thin volume at 0.75x the 20W average, and a 37.1 momentum confirmation score reflect an asset class in structural decline, not early repair. The setup does offer defined risk (support at 71.27 with only 2.0% downside), but that's a coward's argument for a zero-allocation category. Agriculture needs either a macro pivot toward inflation pressure or a technical rebound through the 50W at 77.27 to earn consideration. Until one of those conditions materializes, capital allocation to this category is speculative rather than systematic.