
2024-03-01
Informational purposes only. The content in this report, including allocations, analysis, and commentary, is provided solely for informational and educational purposes. It does not constitute financial advice, investment advice, trading advice, or any other type of advice. Past performance does not guarantee future results. Always conduct your own research and consult a qualified financial professional before making investment decisions.
Weekly Allocation
| Ticker | Category | Weight | Role |
|---|---|---|---|
| FBTC | 50% | Overlay | |
| SMH | AI | 10% | Top-2 (10%) |
| XLK | Technology | 10% | Top-2 (10%) |
| XAR | Defense & Aerospace | 5% | Tier-2 (5%) |
| NLR | Nuclear Energy | 5% | Tier-2 (5%) |
| GLD | Precious Metals | 5% | Tier-2 (5%) |
| VEGI | Agriculture & Livestock | 5% | Tier-2 (5%) |
| PAVE | Utilities & Infrastructure | 5% | Tier-2 (5%) |
| INDA | Emerging Markets | 5% | Tier-2 (5%) |
Trade Instructions — Monday Open
Sell the tranche from 2024-02-02 (completing its 4-week hold). Buy the new tranche. Instructions show net portfolio changes — same-asset positions cancel, weight changes show the delta.
| Action | Ticker | Instruction |
|---|---|---|
| SELL | IGV | Sell 50% of IGV position (reduce 5.00% → 2.50%) |
| SELL | URNM | Sell 50% of URNM position (reduce 2.50% → 1.25%) |
| SELL | ITA | Sell 50% of ITA position (reduce 2.50% → 1.25%) |
| SELL | MOO | Sell 50% of MOO position (reduce 2.50% → 1.25%) |
| SELL | XLE | Sell entire XLE position (1.25% of portfolio) |
| BUY | INDA | Buy INDA — 16.67% of freed cash (adds 1.25% to portfolio) |
| BUY | XAR | Buy XAR — 16.67% of freed cash (adds 1.25% to portfolio) |
| BUY | NLR | Buy NLR — 16.67% of freed cash (adds 1.25% to portfolio) |
| BUY | VEGI | Buy VEGI — 16.67% of freed cash (adds 1.25% to portfolio) |
| BUY | XLK | Buy XLK — 33.33% of freed cash (adds 2.50% to portfolio) |
Current Portfolio After Trade
Combined holdings across all 4 active tranches. Each tranche is 25% of the portfolio.
| Ticker | % of Portfolio | Weight Bar |
|---|---|---|
| FBTC | 50.00% | |
| SMH | 10.00% | |
| PAVE | 5.00% | |
| GLD | 5.00% | |
| INDA | 5.00% | |
| XLK | 5.00% | |
| XAR | 3.75% | |
| NLR | 3.75% | |
| VEGI | 3.75% | |
| IGV | 2.50% | |
| CIBR | 2.50% | |
| URNM | 1.25% | |
| ITA | 1.25% | |
| MOO | 1.25% |
Macro Regime — Disinflation
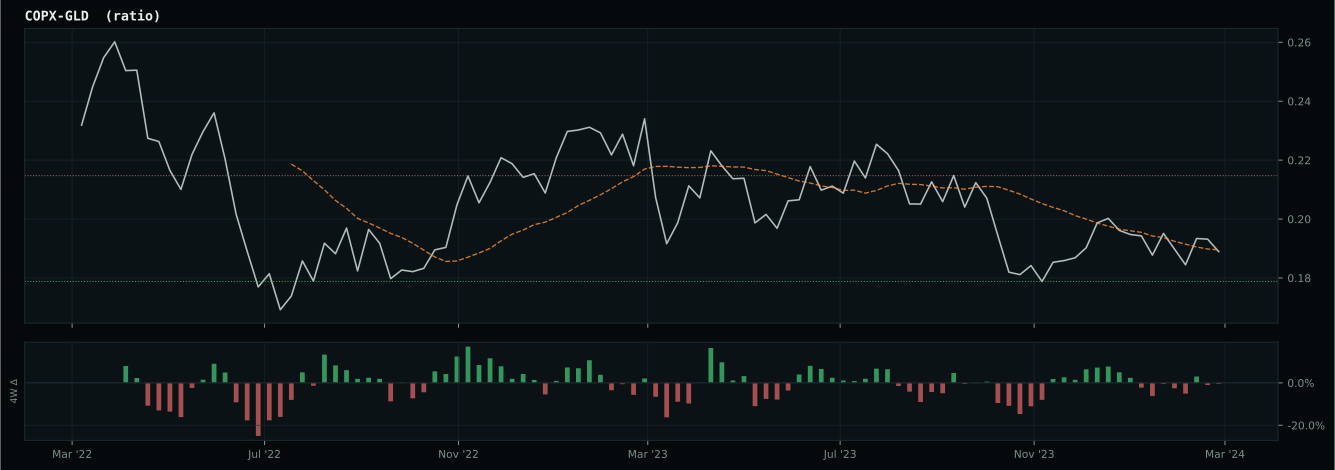
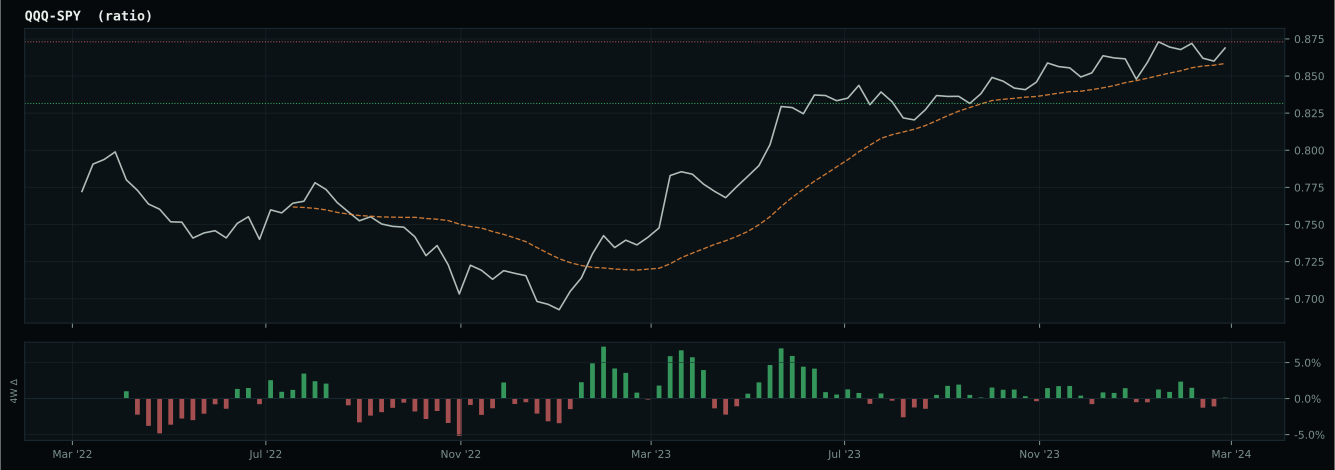
Macro Evidence Charts
Market-implied signals behind the macro regime scores. Each ratio compares two assets; the direction and slope of the ratio is what the macro engine reads.
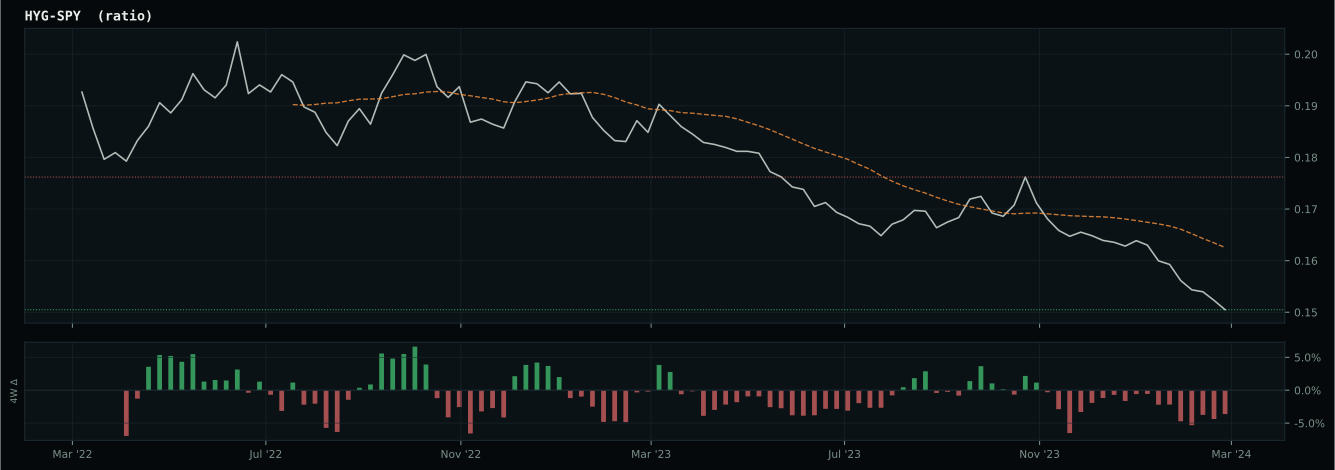
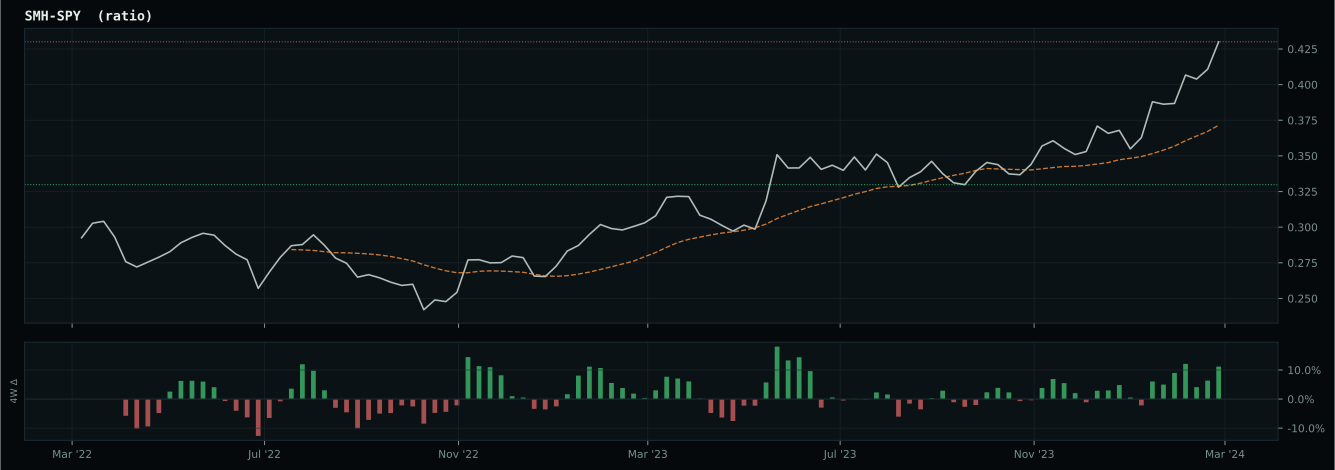
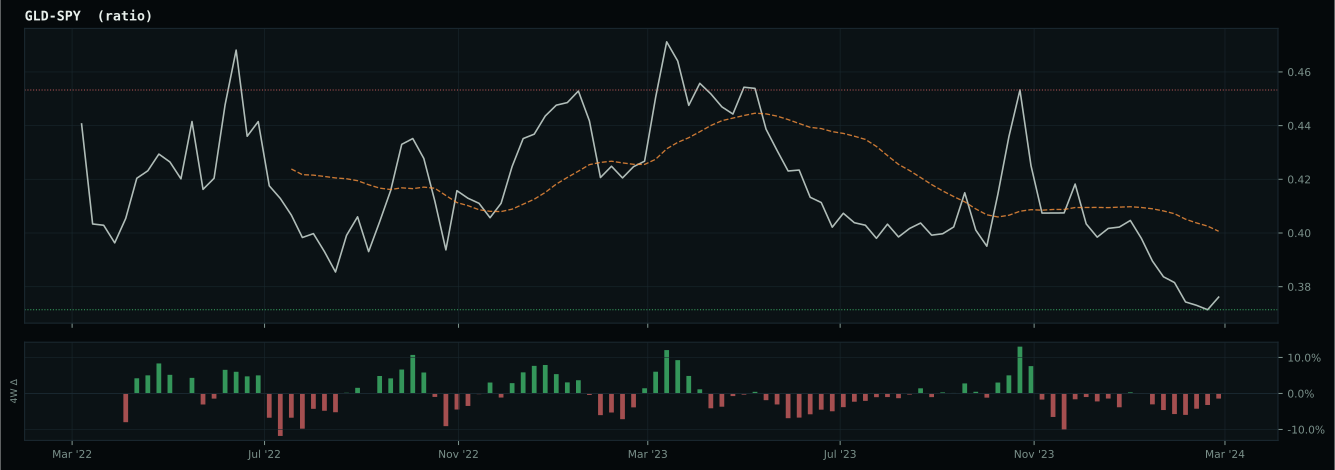
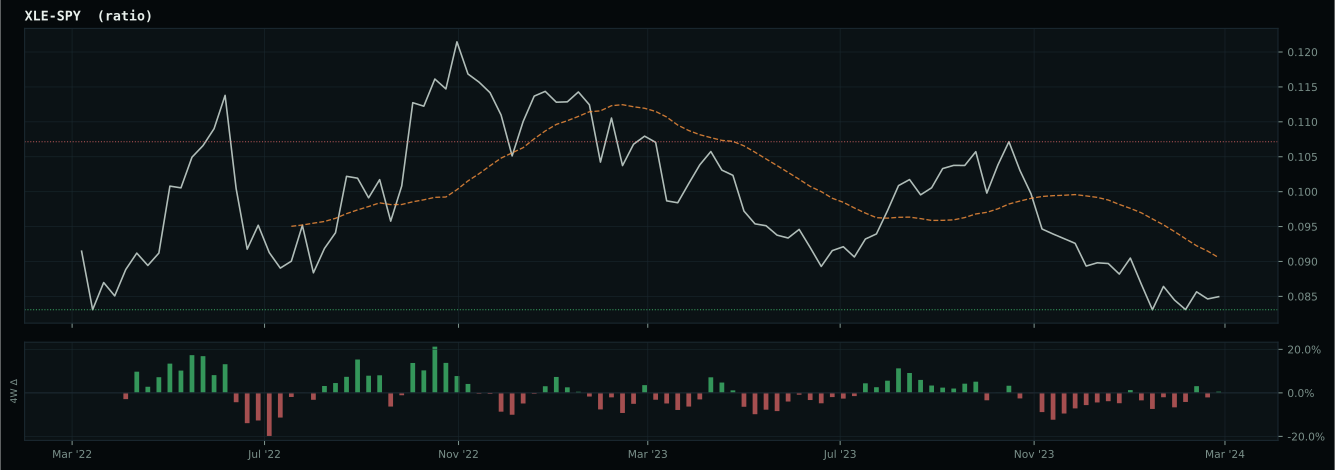
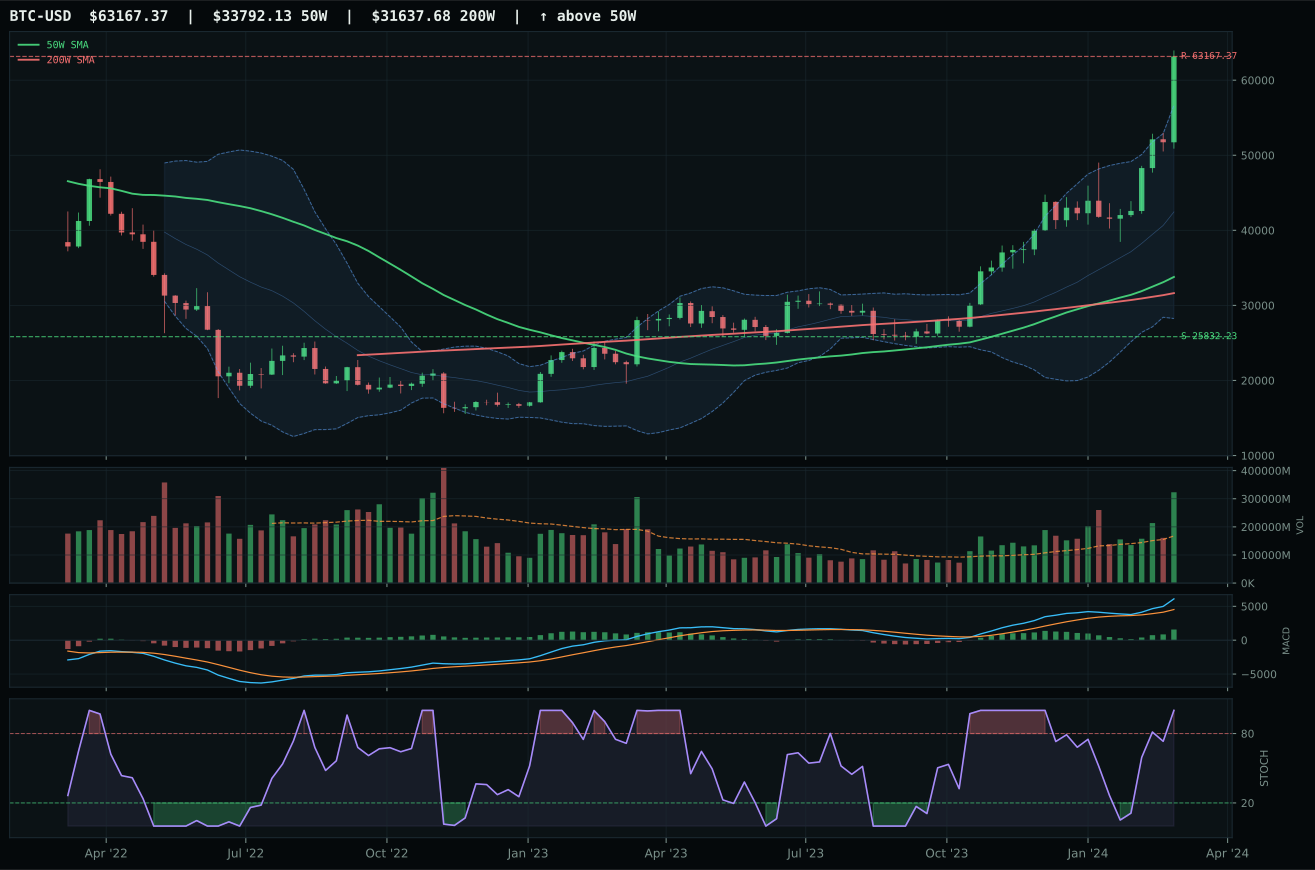
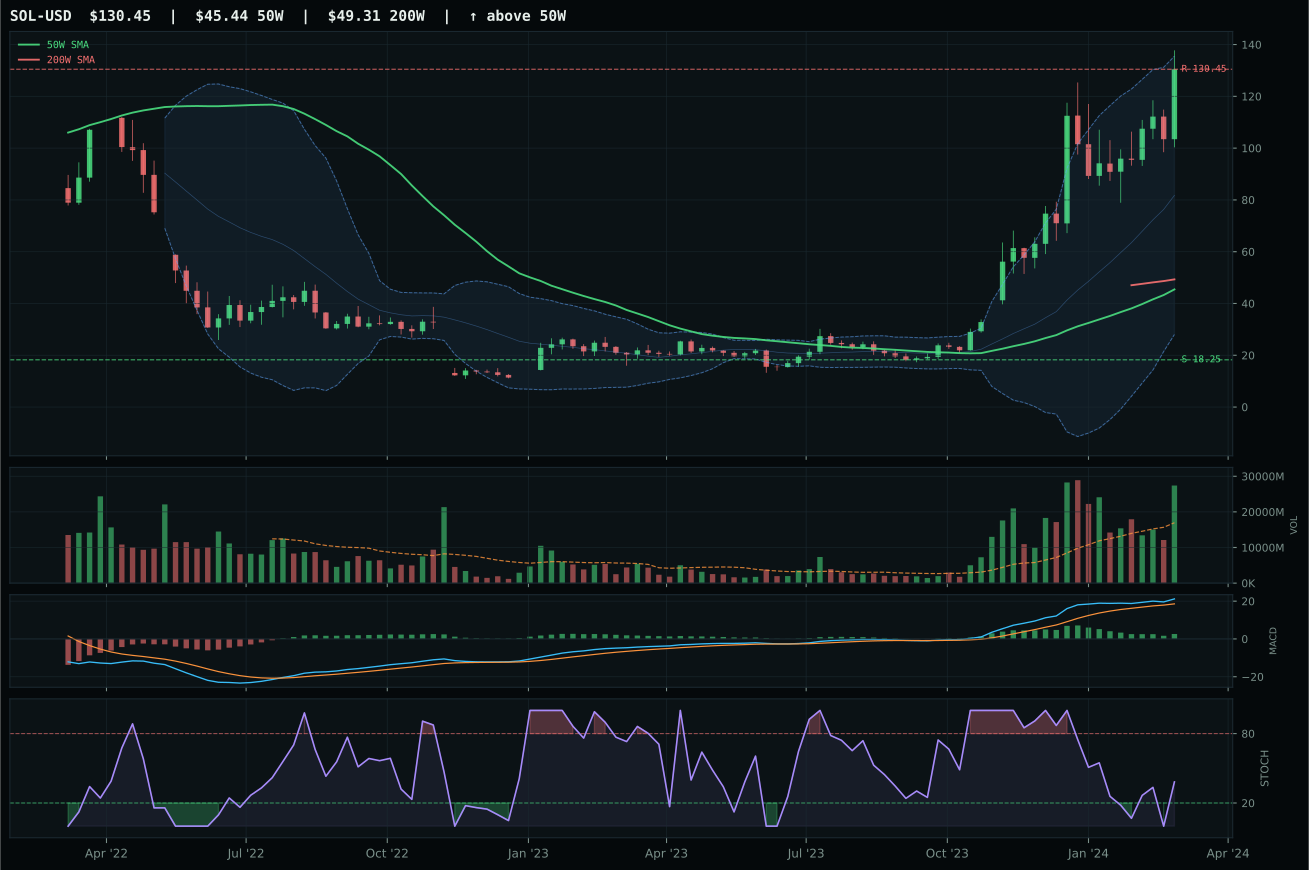
Crypto Regime — TrendBTC
post-touch structure is too wide to count as a range; max/min close ratio is 3.05
TrendBTC confirmed: 2 consecutive closes above rising/flat 50W SMA
one or more available conditions failed
Category Rankings
| Rank | Category | Winner | Score | Alloc | 4W Ret | Peers (4W) |
|---|---|---|---|---|---|---|
| 1 | AI | SMH | 72.0 | 20% | +0.67% | BOTZ -0.6% · AIQ +0.5% |
| 2 | Technology | XLK | 52.6 | 20% | -0.83% | CIBR -2.6% · IGV -1.2% |
| 3 | Defense & Aerospace | XAR | 49.7 | 10% | +2.00% | ITA +3.2% · ROKT +0.0% |
| 4 | Nuclear Energy | NLR | 41.6 | 10% | +1.57% | URNM +0.1% · URA +2.5% |
| 5 | Precious Metals | GLD | 38.3 | 10% | +7.48% | SLV +8.2% · GDX +16.2% |
| 6 | Utilities & Infrastructure | PAVE | 36.4 | 10% | +4.97% | IGF +4.6% · XLU +6.9% |
| 7 | Emerging Markets | INDA | 30.3 | 10% | -0.25% | IEMG +1.6% · ILF +0.8% |
| 8 | Traditional Energy | FCG | 28.7 | 10% | +8.09% | XOP +8.8% · XLE +8.7% |
| 9 | Industrial Metals | COPX | 11.2 | 0% | +17.37% | PICK +5.1% · REMX -5.2% |
| 10 | Agriculture & Livestock | VEGI | — | 0% | +6.02% | MOO +3.4% · WEAT +2.9% |
AI — SMH
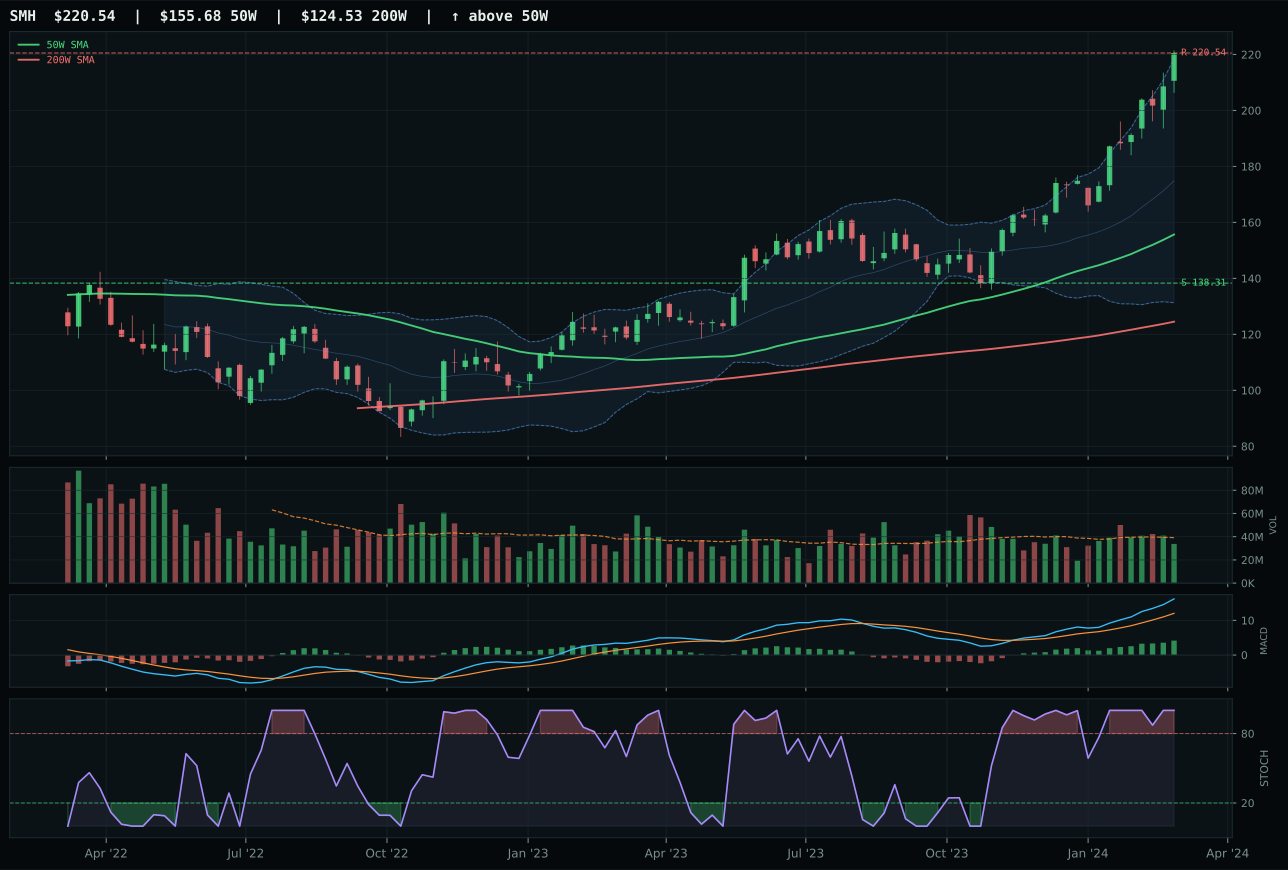
SMH has a vertical extension profile with 25.2% 13-week relative strength versus SPY.
A failed hold above support would weaken the setup.
Actionable but governed by invalidation levels.
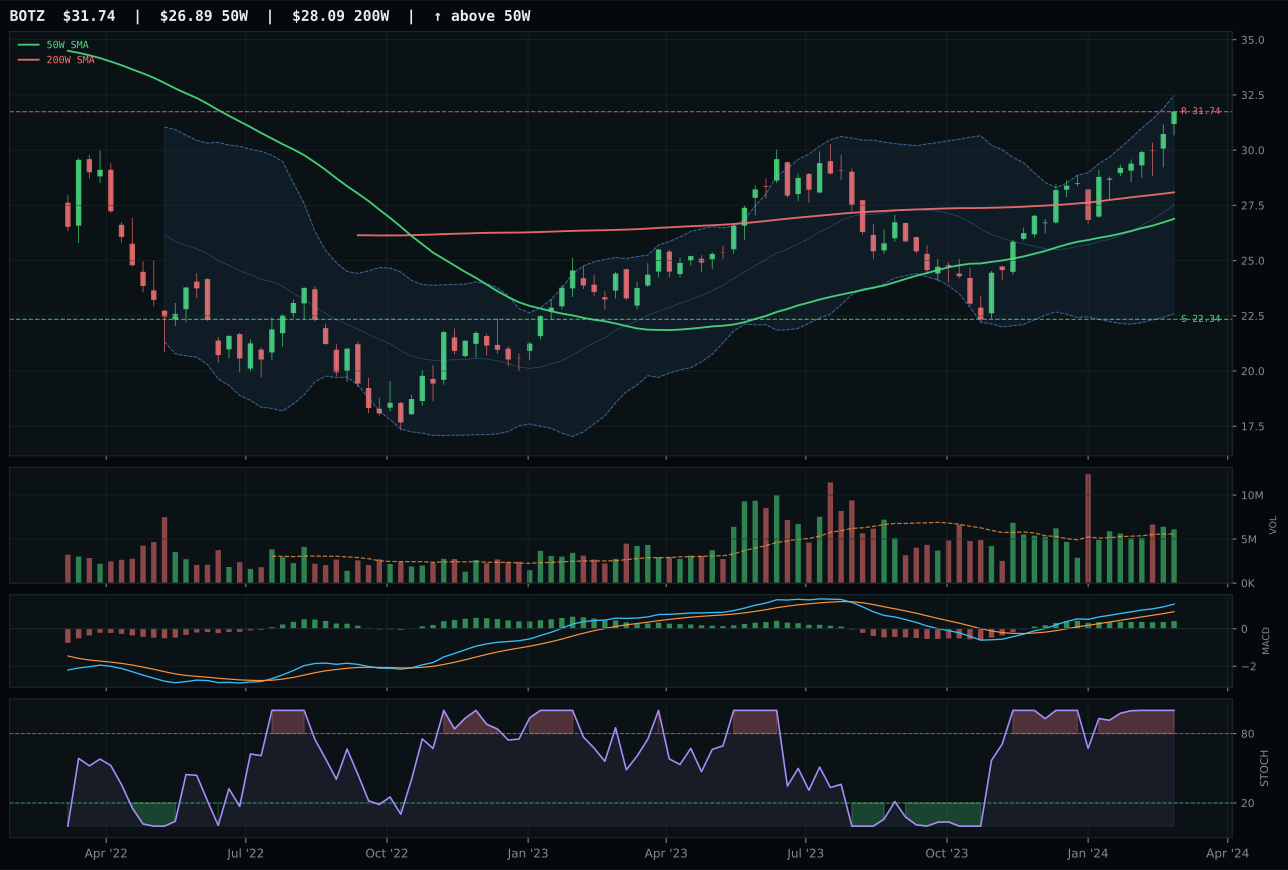
BOTZ has a vertical extension profile with 5.7% 13-week relative strength versus SPY.
A failed hold above support would weaken the setup.
Actionable but governed by invalidation levels.
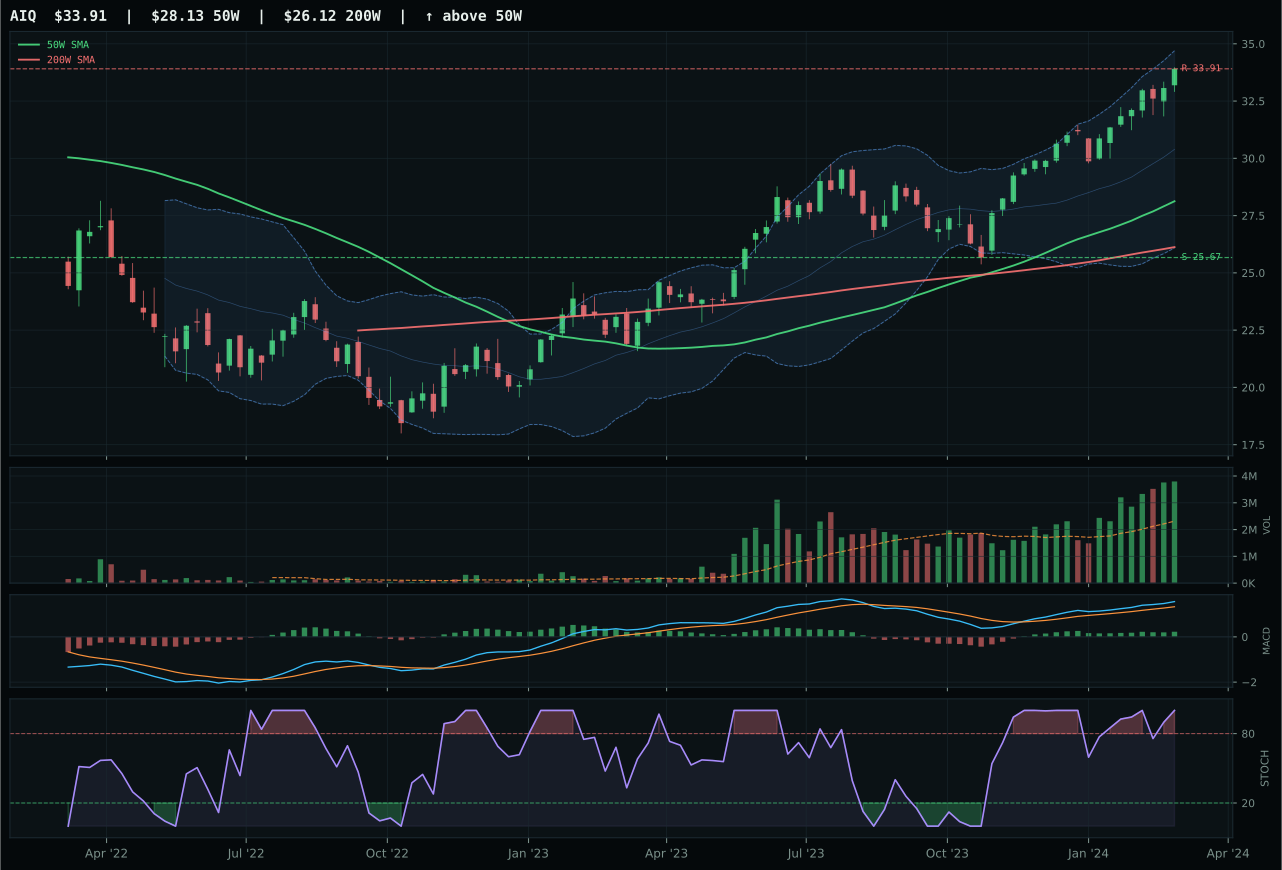
AIQ has a vertical extension profile with 1.7% 13-week relative strength versus SPY.
A failed hold above support would weaken the setup.
Actionable but governed by invalidation levels.
SMH dominates the AI category with a 7.3-point victory over BOTZ by running a 25.2% RS lead versus SPY and posting perfect momentum confirmation (100/100) on the back of 36.9% 13-week returns. The semiconductor leader sits 41.7% above its 50-week average in a vertical extension setup with MACD bullish and improving plus stochastic RSI at the 1.00 momentum extreme—a chart that announces late-stage enthusiasm in every candlestick. Volume is neutral at 0.86x the 20-week average, which means this extended move lacks the accumulation signature that would justify chasing price here, yet the category-relative strength of 19.4% versus the basket median shows SMH is the only horse in this race that institutional buyers are selecting. BOTZ stumbled by failing to generate category-relative strength (0.0% vs 19.4%) despite matching SMH on trend and MACD quality; the robotics angle simply lacks the current narrative fuel.
AI ranks first at 72.0 points and commands a top-2 allocation with 20% capital. The macro alignment is exceptional: AI growth sponsorship contributes 14 points, risk appetite positive adds 10, and these dwarf the liquidity and credit stress headwinds. SMH's 100/100 momentum confirmation, 98.9/100 persistence, and 84/100 volume-price confirmation create a rare convergence where technical evidence (80.5/100) and macro sponsorship (58/100) reinforce each other. The category's 41.7% extension above the 50-week is steep, but relative strength breadth—particularly SMH's 19.4% category dominance—proves this is a genuine rotation into AI compute, not a bubble confined to one ticker. This is the strongest setup in the portfolio and merits maximum conviction.
Technology — XLK
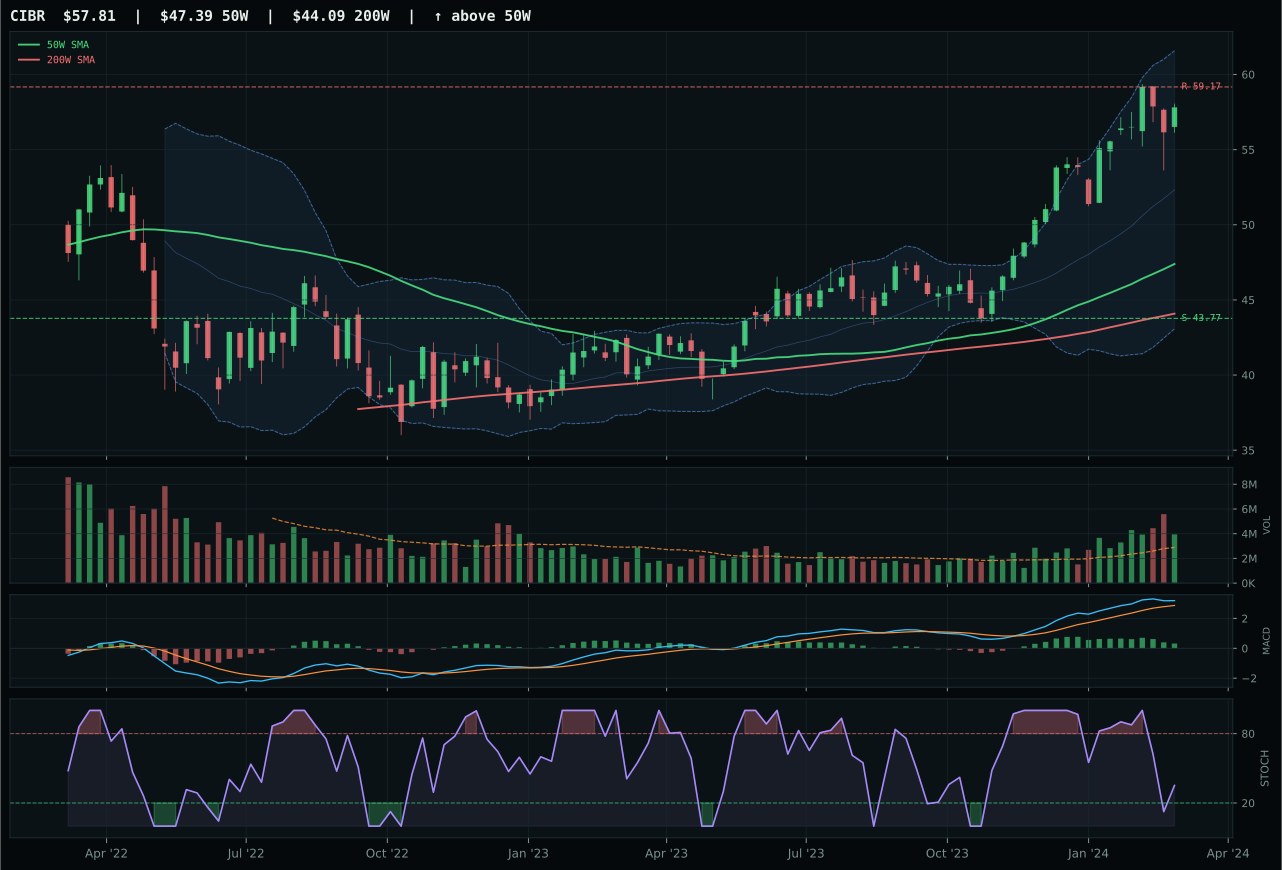
CIBR has a vertical extension profile with 3.2% 13-week relative strength versus SPY.
A failed hold above support would weaken the setup.
Actionable but governed by invalidation levels.
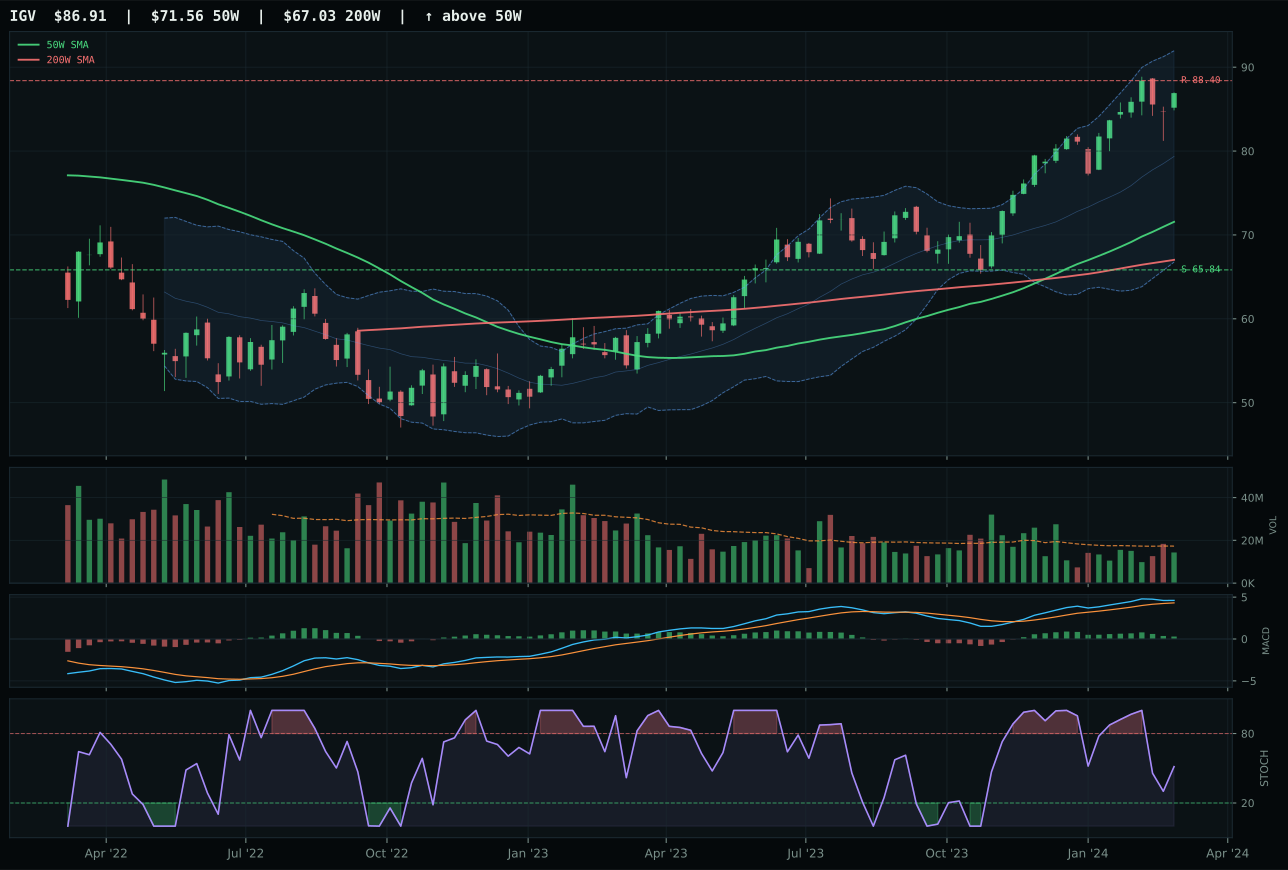
IGV has a vertical extension profile with -2.4% 13-week relative strength versus SPY.
A failed hold above support would weaken the setup.
Actionable but governed by invalidation levels.
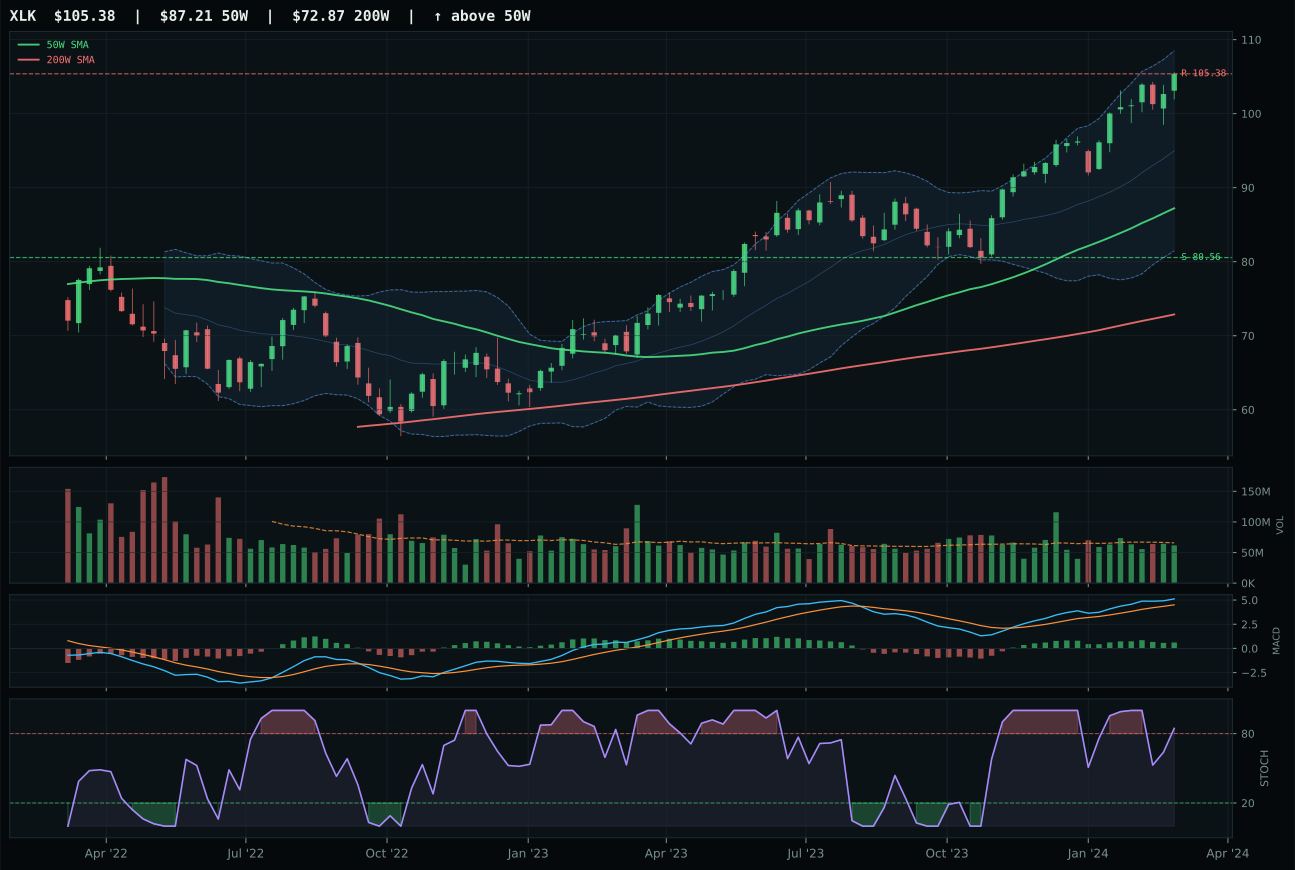
XLK has a vertical extension profile with 1.9% 13-week relative strength versus SPY.
A failed hold above support would weaken the setup.
Actionable but governed by invalidation levels.
XLK wins the category with a clean 4.3-point margin over CIBR by delivering better risk-reward geometry and structural integrity. Price sits 20.8% above the 50-week moving average with a 0.8% upslope, supported by 1.9% relative strength versus SPY and neutral volume participation at 0.94x the 20-week average. The setup is a vertical extension with MACD bullish but flattening and stochastic RSI rolling over from overbought—a textbook late-stage momentum setup where every new buyer faces deteriorating entry conditions. CIBR lost primarily on risk-reward (38.3 vs 41.7) and structural cleanliness (79.2 vs 82.5), despite stronger category-relative strength of 1.3%, because its cybersecurity narrow-band profile lacked the breadth sponsorship that keeps XLK relevant even when extended.
Technology ranked second among all categories at 52.6 points, earning a 10% slot despite not being top-2. The disinflation macro backdrop actively supports this exposure with AI growth sponsorship adding 6 points and risk appetite positive contributing 9 points, more than offsetting the liquidity stress penalty. XLK's trend score of 98.8/100 and SPY-relative strength of 1.9% prove the category has real participation, not just sentiment. However, the timing score of only 22.0—driven by the 20.8% extension and overbought stochastic rolling over—prevents it from ranking higher. For Technology to move to top-2 allocation, the category would need either a pullback to reset entry risk or fresh momentum confirmation from volume and MACD; as it stands, the risk-reward asymmetry is unfavorable enough to cap this at a supporting allocation.
Defense & Aerospace — XAR
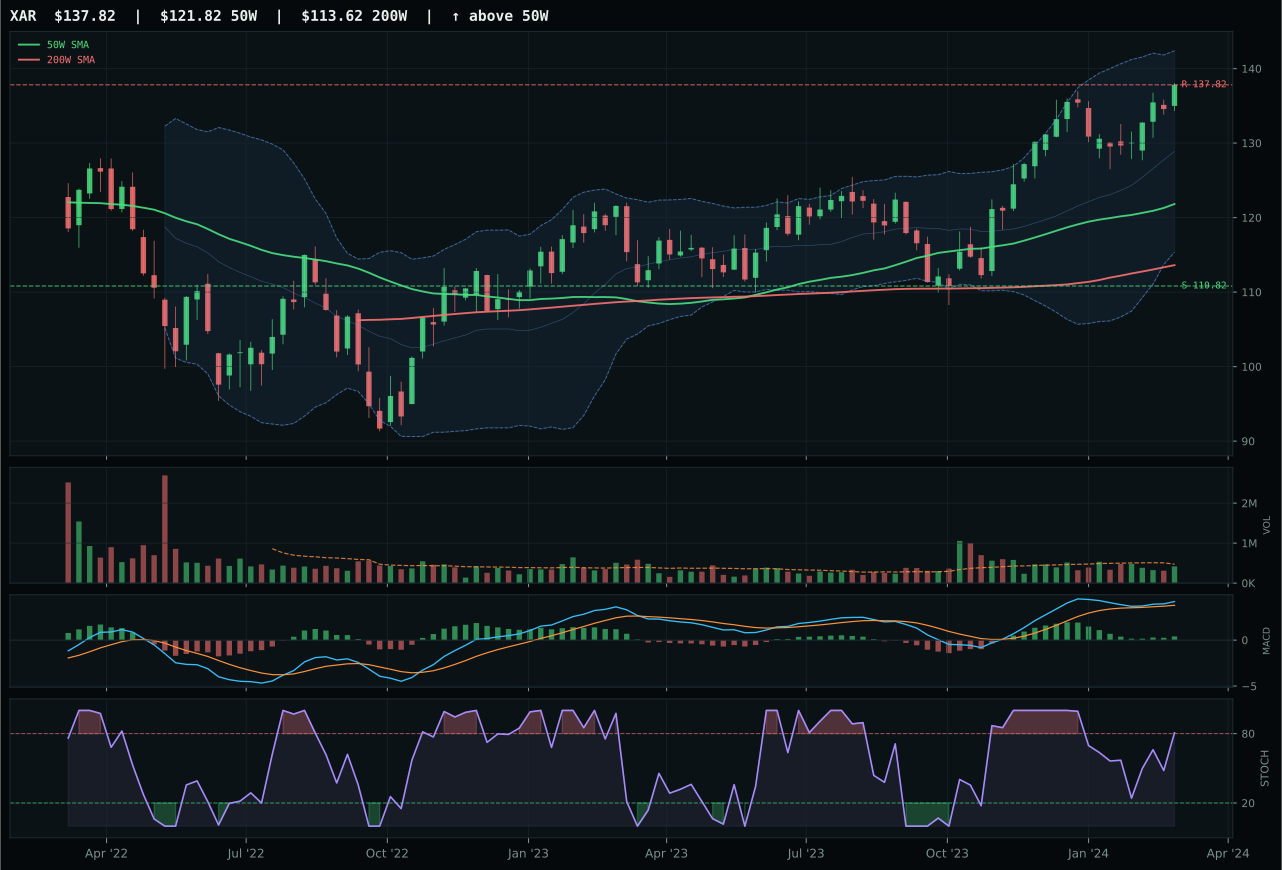
XAR has a neutral structure profile with -5.8% 13-week relative strength versus SPY.
A failed hold above support would weaken the setup.
Actionable but governed by invalidation levels.
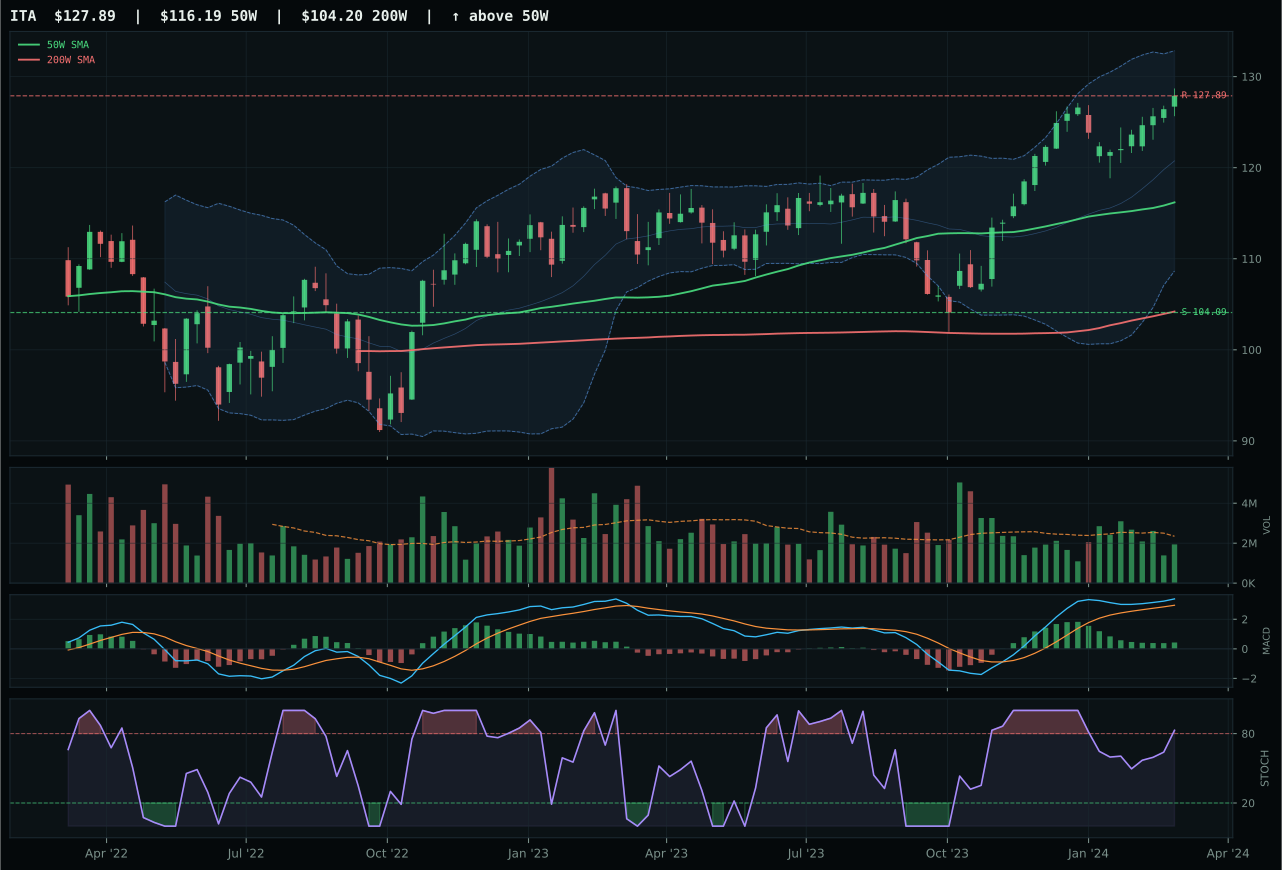
ITA has a neutral structure profile with -6.3% 13-week relative strength versus SPY.
A failed hold above support would weaken the setup.
Actionable but governed by invalidation levels.
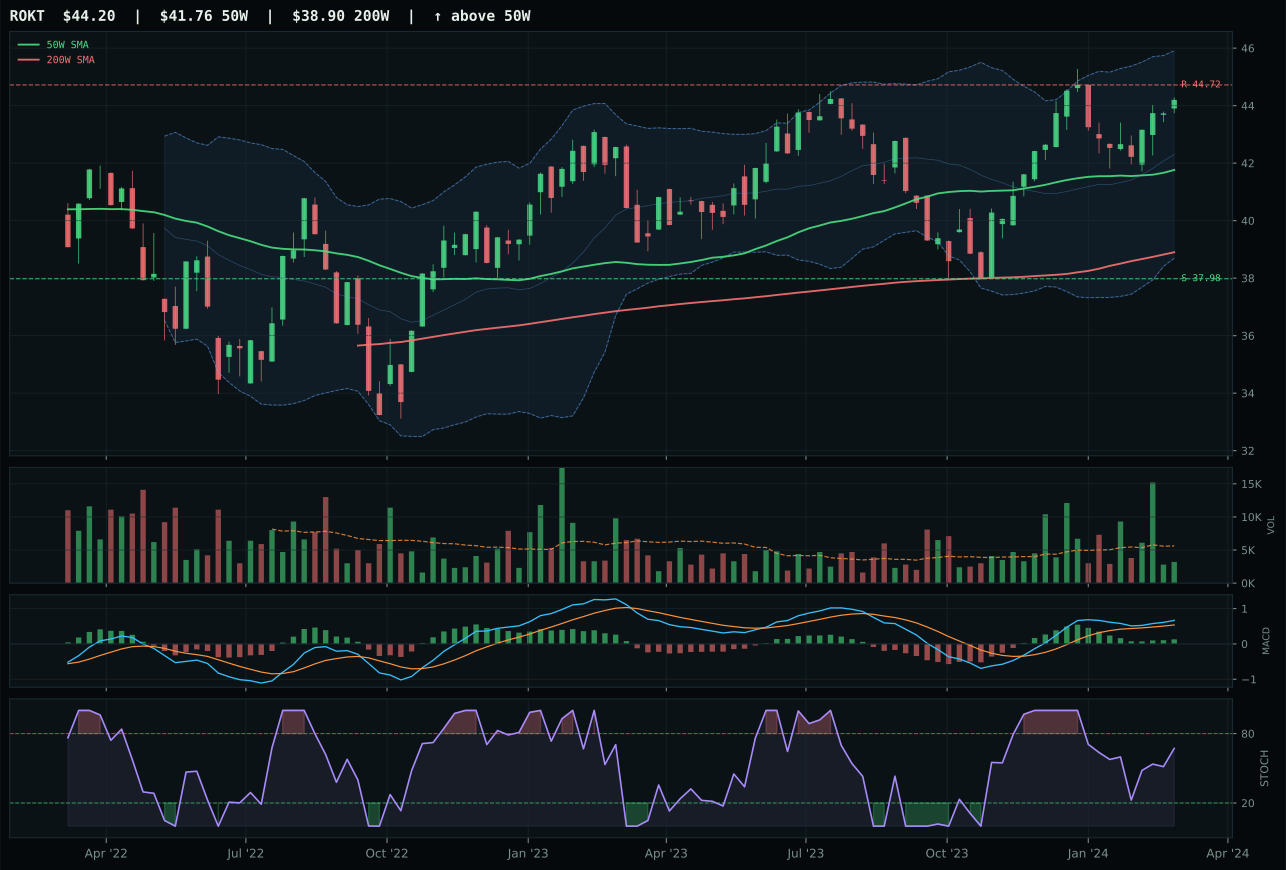
ROKT has a neutral structure profile with -7.5% 13-week relative strength versus SPY.
A failed hold above support would weaken the setup.
Tracked, but not top-2 eligible because: .
XAR edges ITA by 2.9 points in a category where both nominees are constrained by SPY headwinds and macro indifference, making this less a victory lap and more a battle for structural precision. XAR's 13-week return of 5.9% lags most portfolios' expectations, yet its bullish-and-improving MACD and cleaner timing (59 vs 54) hand it the nod over ITA's bullish-but-flattening confirmation. Both trade 13% and 14% above their 50-week moving averages with neutral volume, neutral structure, and zero category-relative strength; neither ETF is running away inside its three-fund basket, which means this category is a consensus pick with nobody leading. The 0.4% category-relative advantage for XAR is marginal—the structural and momentum confirmation differences are what separated them when the fundamentals essentially tied.
Defense & Aerospace scored 49.7 and received 5% allocation as a mid-tier holding, ranking outside the top-2 because two higher-scoring categories claimed those slots. The macro fit is neutral—no category-specific descriptors fired to support or penalize aerospace exposure—leaving the system to rely on deterministic technical evidence (72.2/100). XAR's trend score of 91.2 and structure score of 75.3 are respectable but not exceptional; the real limiting factor is that risk appetite positive adds just 0 points (it applies broadly, not specifically to defense), and liquidity stress drags down the macro fit to 50/100. The 5% allocation serves as exposure to any surprise geopolitical risk-off, but the category lacks the technical momentum or macro sponsorship to justify larger size.
Nuclear Energy — NLR
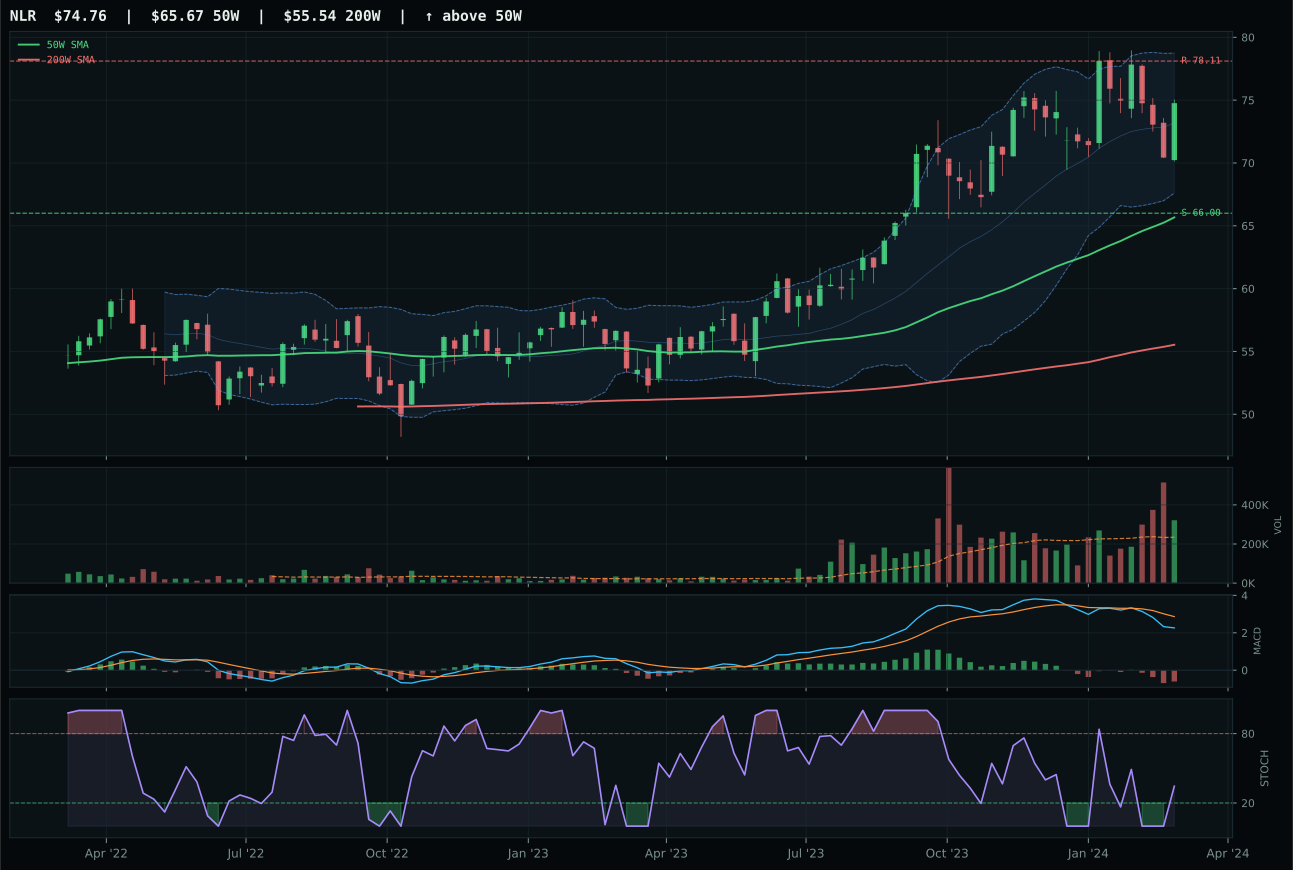
NLR has a neutral structure profile with -11.0% 13-week relative strength versus SPY.
A failed hold above support would weaken the setup.
Actionable but governed by invalidation levels.
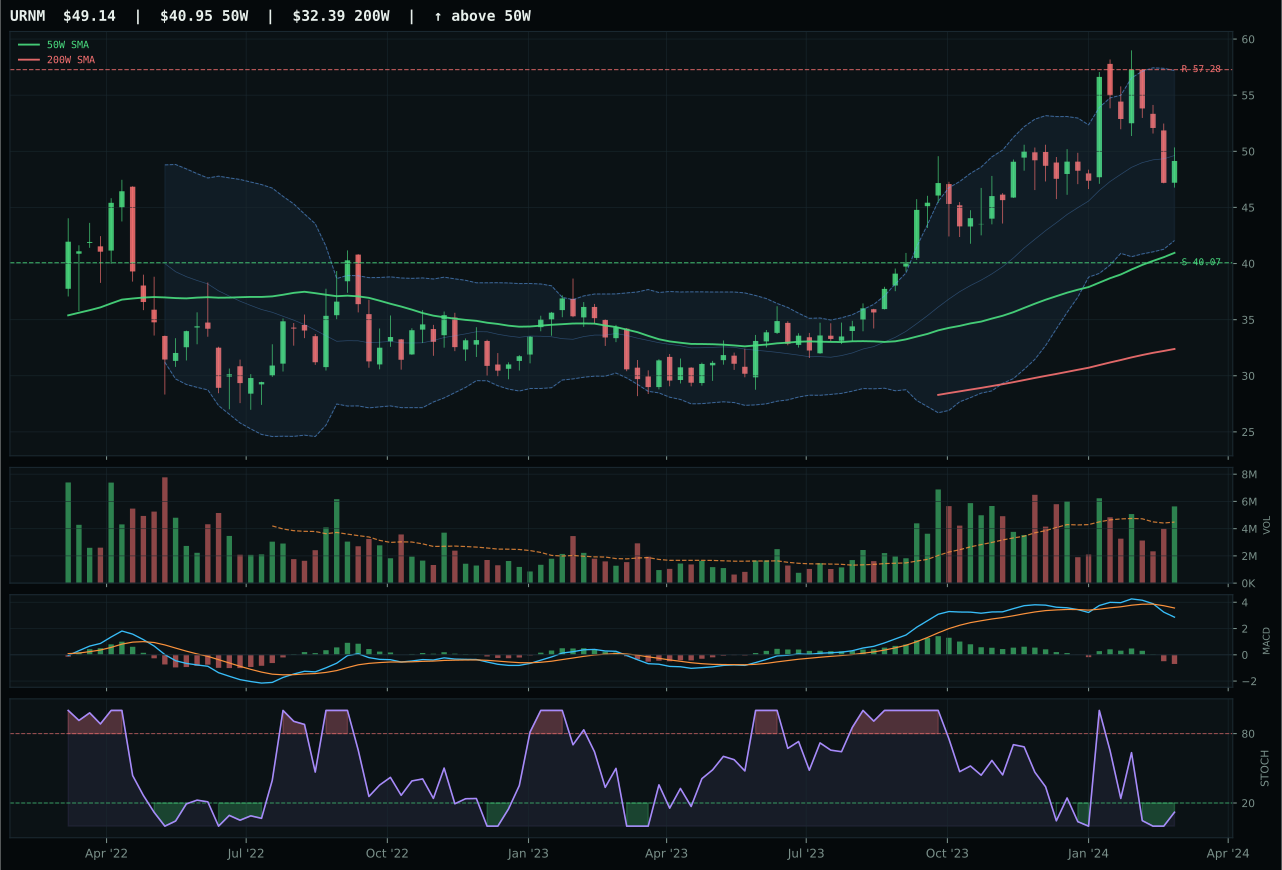
URNM has a vertical extension profile with -11.8% 13-week relative strength versus SPY.
A failed hold above support would weaken the setup.
Actionable but governed by invalidation levels.
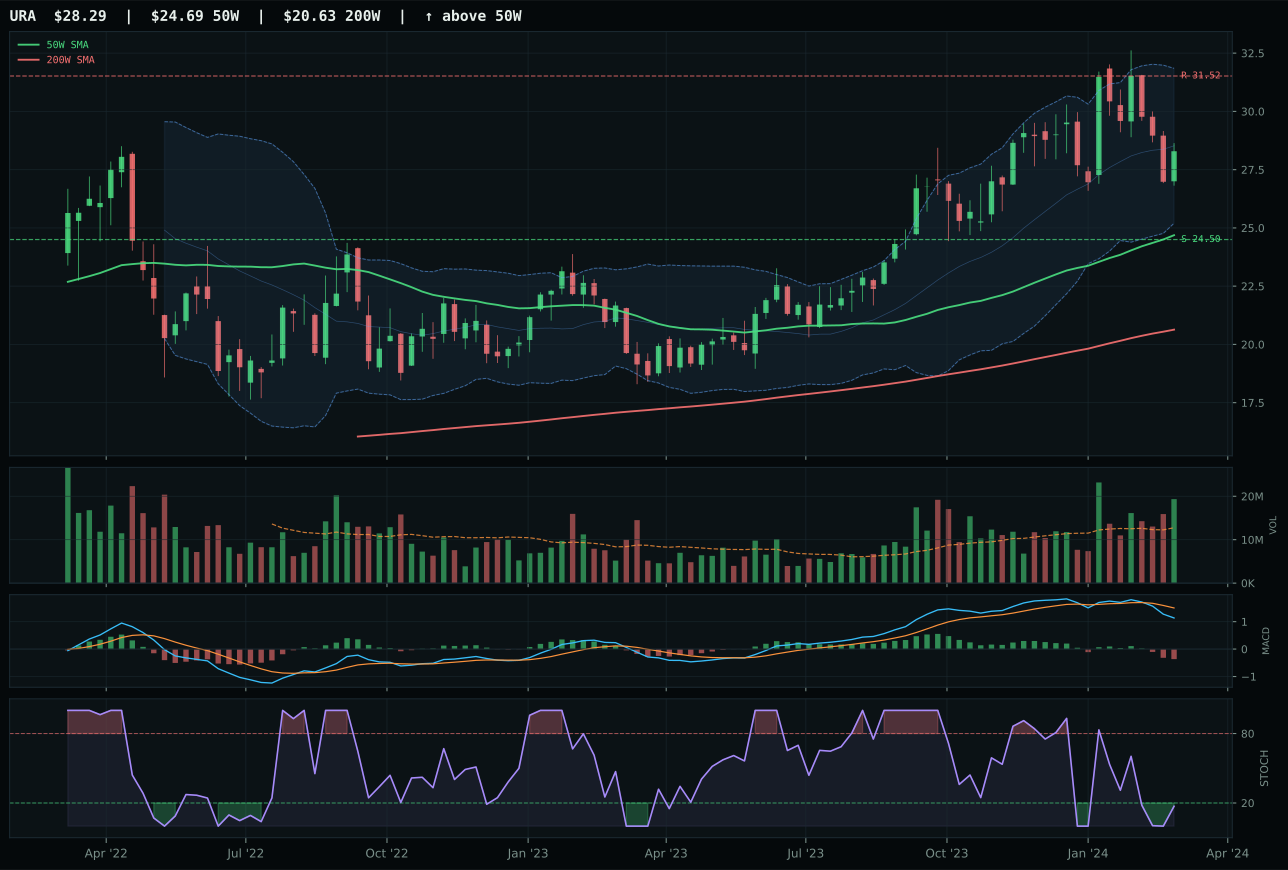
URA has a neutral structure profile with -14.0% 13-week relative strength versus SPY.
A failed hold above support would weaken the setup.
Actionable but governed by invalidation levels.
NLR wins a modest 14-point margin over URNM despite both trading in the same extended zone, because NLR's neutral structure and bullish-and-improving MACD confirmation beat URNM's vertical extension and bearish-weakening setup. NLR sits 13.8% above the 50-week moving average with above-average participation (1.37x), yet momentum confirmation is only 15.9/100—the lowest score in the entire portfolio—because the 13-week return of 0.7% and minus-3.9% 4-week return expose the stall in nuclear momentum. MACD is bearish/weakening, stochastic RSI is rising mid-zone, and the story here is energy scarcity sponsorship (plus 6) keeping the setup alive despite technical deterioration. URNM loses on timing (62 vs 78), risk-reward (41.3 vs 50.8), and structural cleanliness (64.1 vs 68.3), compounded by the oversold-turn-up stochastic, which signals capitulation buyers rather than fresh accumulation.
Nuclear Energy scored 41.6 and earned 5% allocation despite ranking outside top-2 categories. Energy scarcity active status (+9 points) and AI growth sponsorship (+5 points) provide genuine macro sponsorship; liquidity and credit stress penalties are only -7 and -5 points respectively. The real problem is technical weakness: NLR's momentum confirmation of 15.9/100 and persistence of 37.9/100 are among the lowest in the entire portfolio, reflecting a chart that is price-positive but momentum-negative. This allocation is a long-duration macro bet on energy scarcity resolution and nuclear's role in AI data center power supply, not a technical trade. It merits 5% as a structural hedge to inflation and energy crisis scenarios, but will not perform in near-term rallies.
Precious Metals — GLD
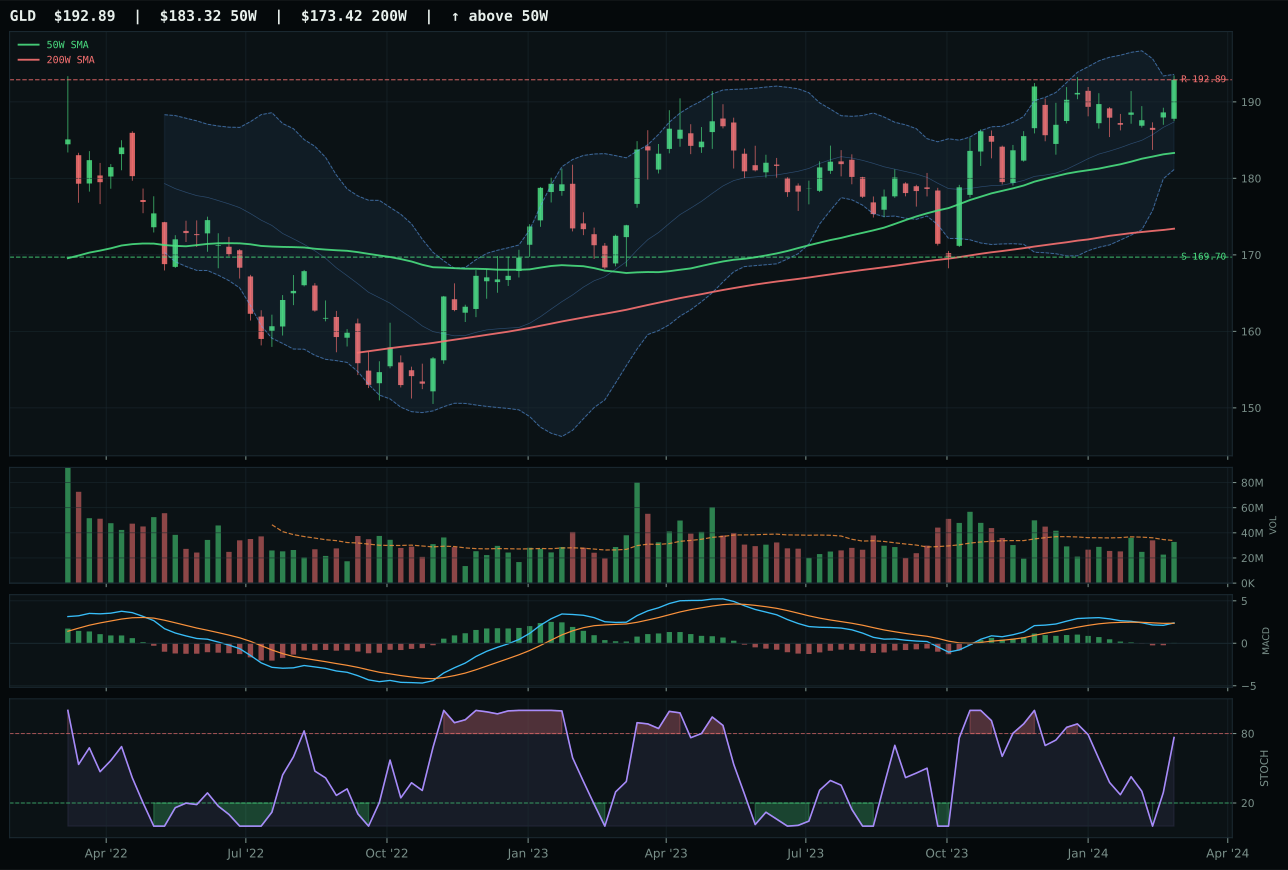
GLD has a neutral structure profile with -11.2% 13-week relative strength versus SPY.
A failed hold above support would weaken the setup.
Actionable but governed by invalidation levels.
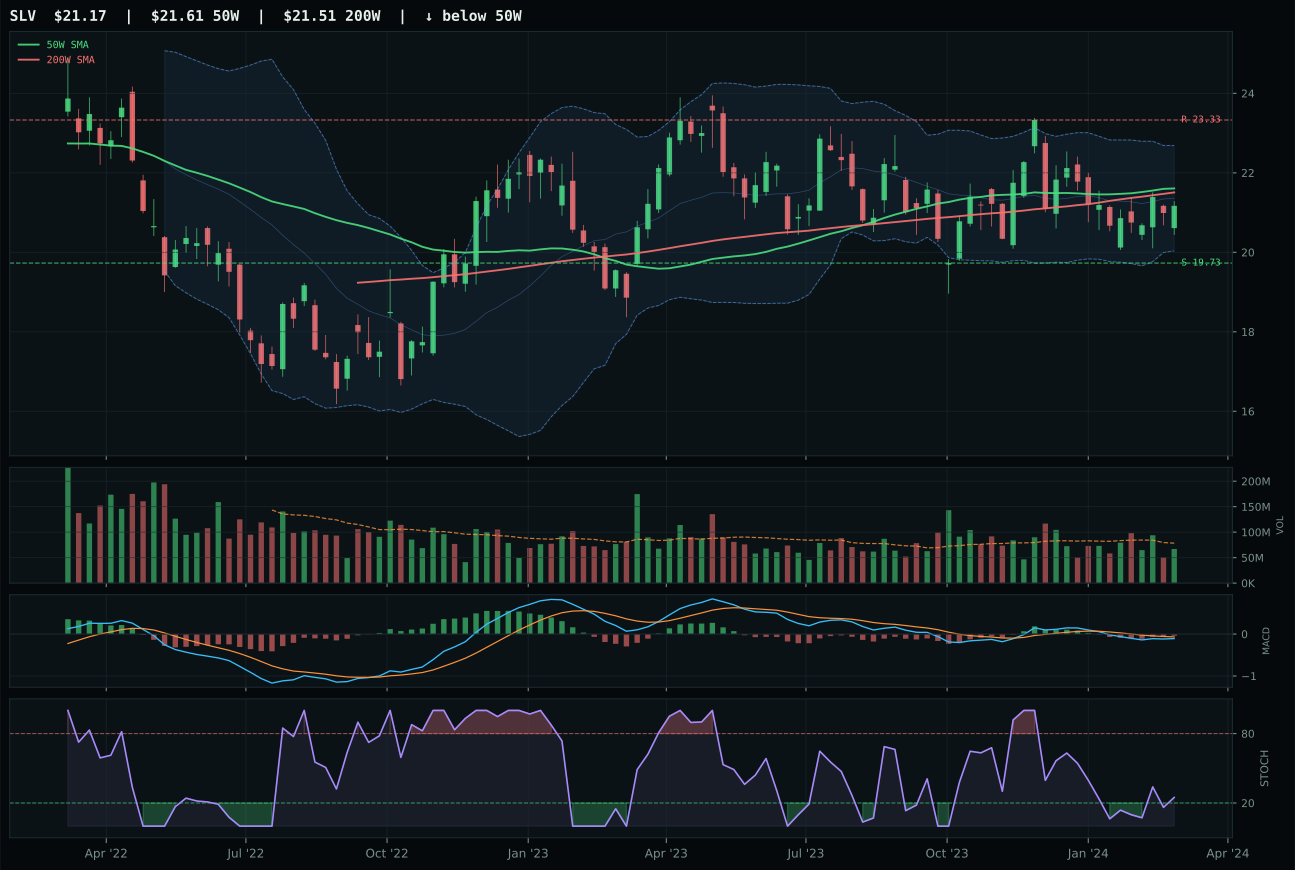
SLV has a compression near 50W profile with -21.0% 13-week relative strength versus SPY.
A failed hold above support would weaken the setup.
Actionable but governed by invalidation levels.
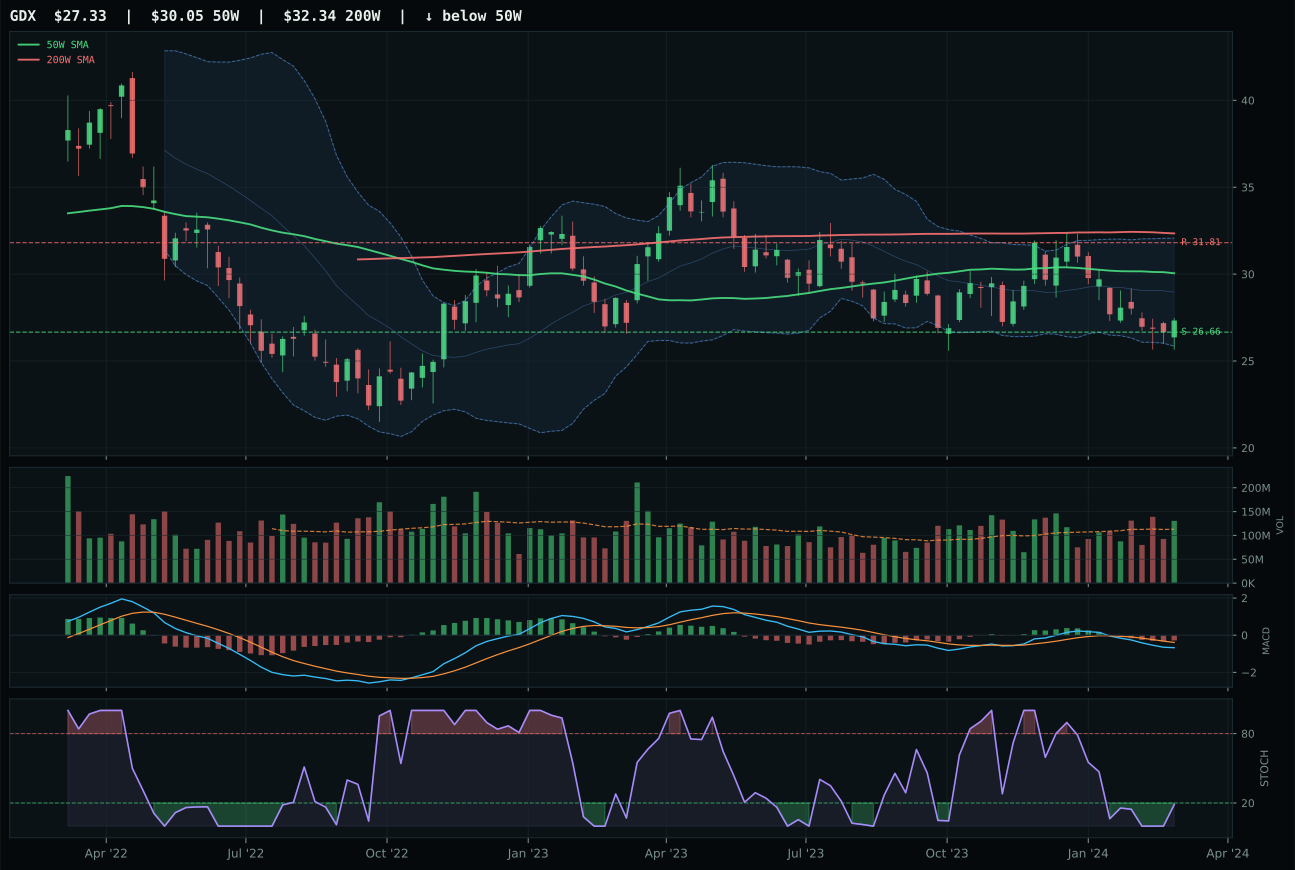
GDX has a pullback into support profile with -25.8% 13-week relative strength versus SPY.
Extension and support failure are the main tactical risks.
Tracked, but not top-2 eligible because: structurally broken.
GLD outpaces SLV by 4.4 points in a category where the gold-silver divergence reveals the market's view that monetary safety is worth more than industrial participation. GLD trades 5.2% above its 50-week moving average with neutral structure, a bullish-but-flattening MACD, and a 9.7% category-relative strength advantage that translates to clear institutional preference for the gold over the hybrid story. The setup sits in a near-52W high zone with 81/100 trend and 78/100 timing, acceptable for a monetary hedge but not electrifying as a growth vehicle. SLV collapsed to 50.3/100 technical evidence because its bearish-but-improving MACD and minus-21.0% relative strength versus SPY broadcast that silver is losing its appeal even to risk-on buyers who normally chase industrial beta. The 0.5% 13-week return for GLD confirms this is not an aggressive bet—it is a portfolio volatility dampener that benefits modestly from disinflation's plus-8 macro push.
Precious Metals scored 38.3 and earned 5% as a diversifier, though it ranks well outside top-2 due to weak momentum scores and low persistence. Disinflation backdrop provides a +8 point macro boost—gold benefits as real rates fall—but this is partially offset by risk appetite positive being active (-4 points), indicating equity sponsorship isn't following. GLD's 57/100 momentum confirmation and 63.3/100 persistence reveal this is a slow, grinding accumulation rather than a conviction play. The category fills a hedge role: it provides uncorrelated downside protection if risk sentiment deteriorates, and the disinflation macro sponsorship justifies the allocation. However, it lacks the technical breadth and momentum to move higher in the allocation scheme.
Utilities & Infrastructure — PAVE
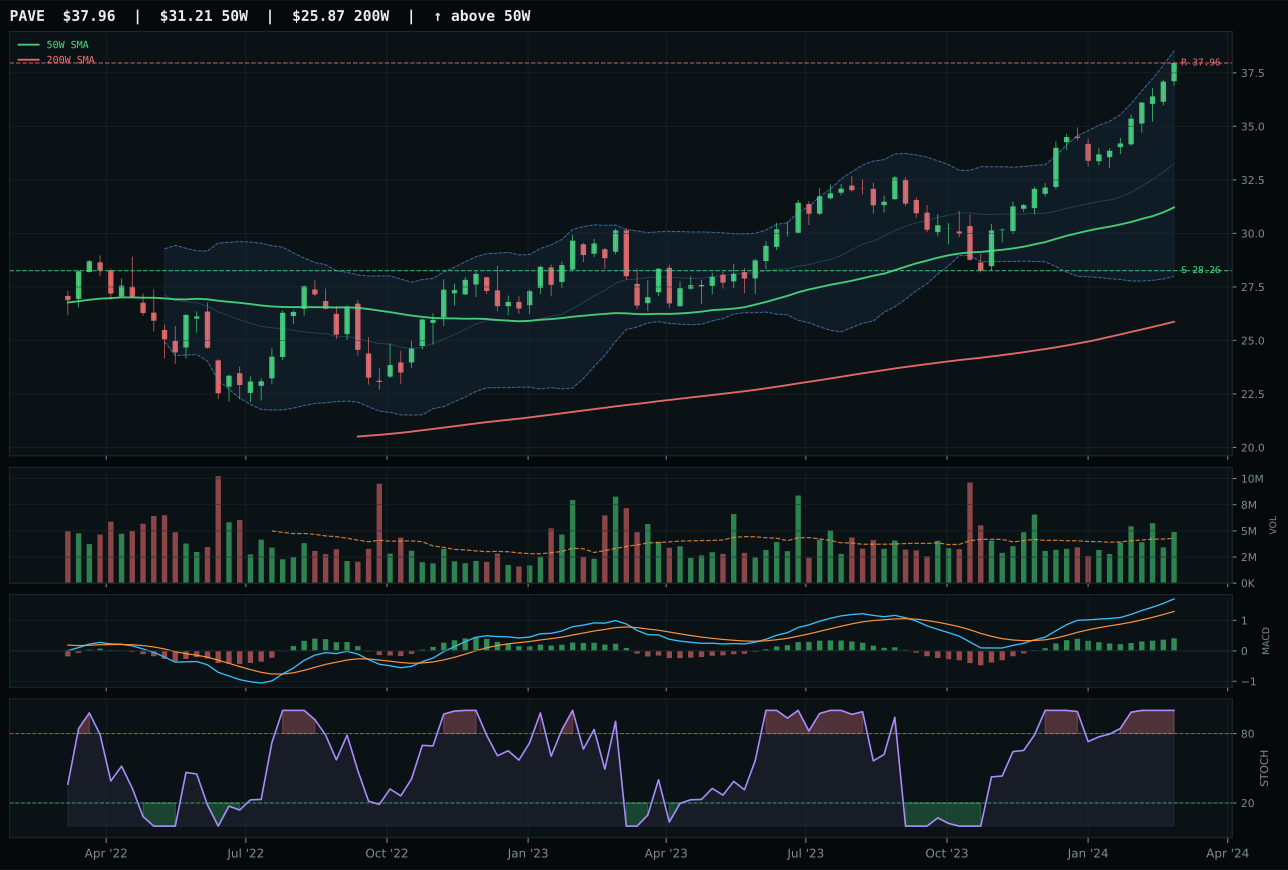
PAVE has a vertical extension profile with 6.6% 13-week relative strength versus SPY.
A failed hold above support would weaken the setup.
Actionable but governed by invalidation levels.
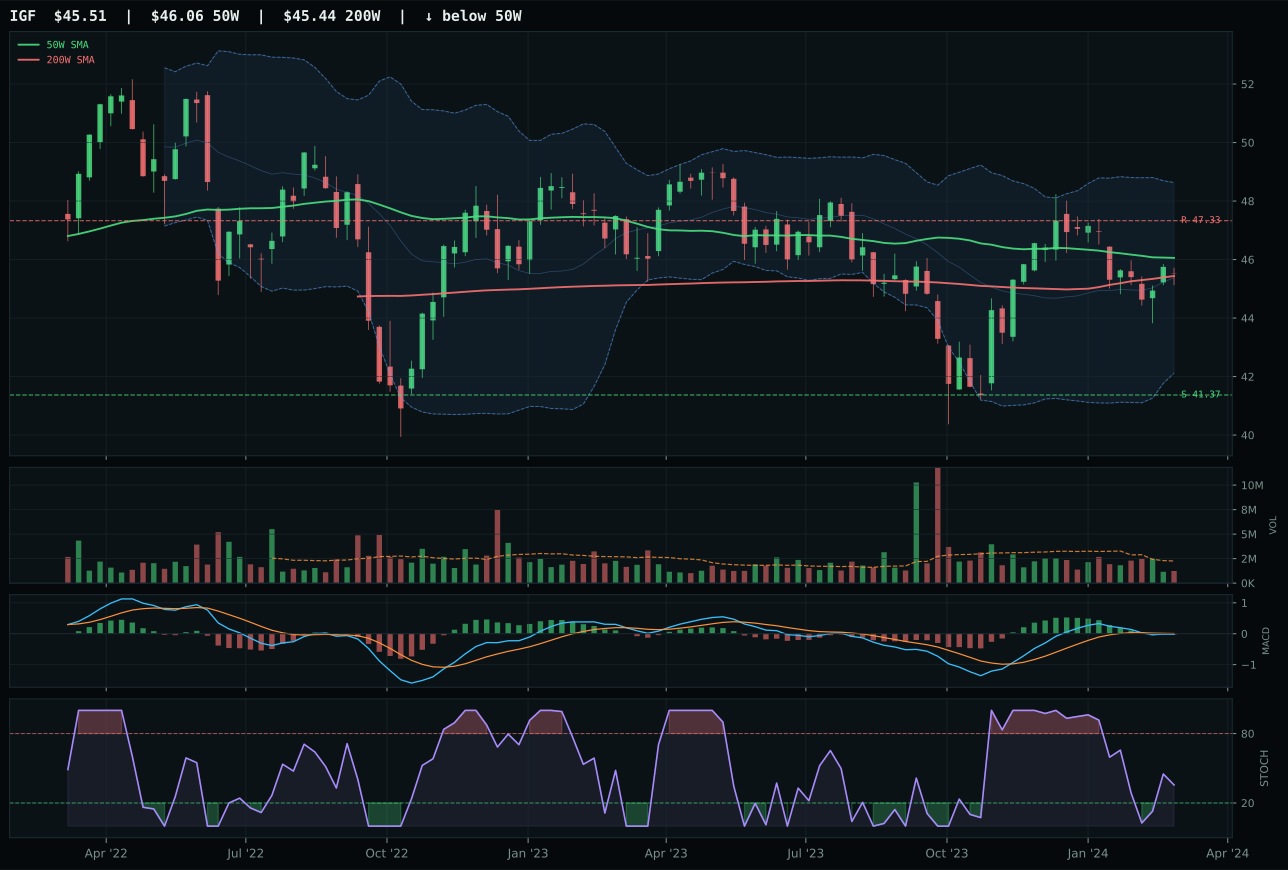
IGF has a compression near 50W profile with -14.0% 13-week relative strength versus SPY.
A failed hold above support would weaken the setup.
Actionable but governed by invalidation levels.
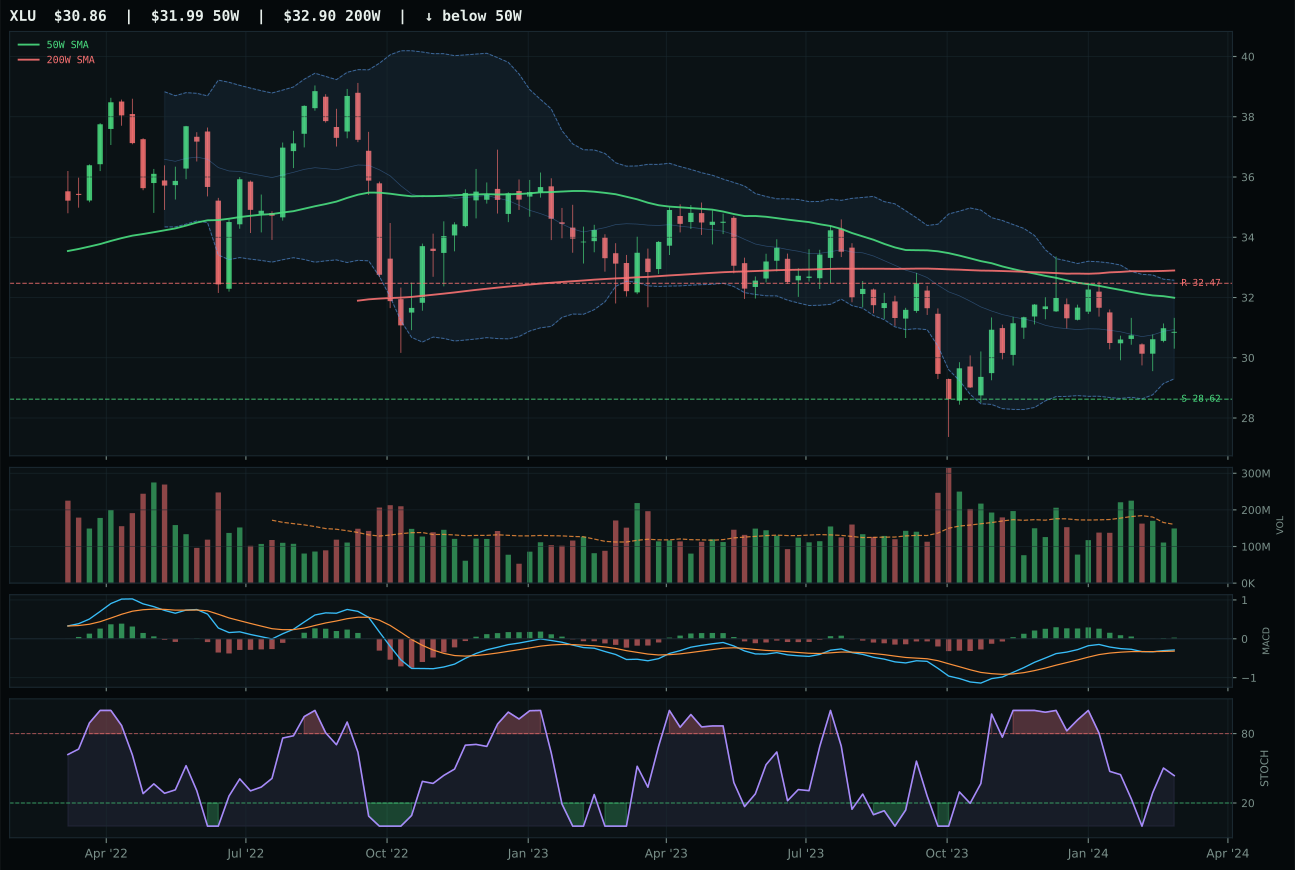
XLU has a neutral structure profile with -14.6% 13-week relative strength versus SPY.
Extension and support failure are the main tactical risks.
Tracked, but not top-2 eligible because: structurally broken.
PAVE crushes the Utilities & Infrastructure category by a dominant 26.8 points over IGF, delivering a 100/100 trend score, 100/100 momentum confirmation, and perfect 85.5/100 structure from a vertical extension setup with bullish-and-improving MACD. The infrastructure leader sits 21.6% above the 50-week moving average with above-average participation (1.14x) and a 18.3% 13-week return that converts into a 20.6% category-relative strength advantage—the highest category-relative lead in the entire portfolio. MACD is bullish and improving, stochastic RSI is at 1.00 momentum, and every technical indicator screams accumulation into infrastructure capex positioning. IGF collapsed to 30.4/100 technical evidence with bearish-weakening MACD and thin participation, confirming that global infrastructure income (dividend play) is not the market's choice; domestic capex-driven infrastructure (PAVE) is winning decisively.
Utilities & Infrastructure scored 36.4 and earned 5% allocation outside the top-2, justified entirely by macro fit. Disinflation actively helps this sector (+7 points) and disinflation pressure adds another +6 points, creating a +13 point macro tailwind that elevates what is otherwise a mid-tier technical setup. PAVE's momentum and trend scores are exceptional (100 and 100 respectively), but timing of 37.0 and risk-reward of 41.2 reflect the same extension problem seen in other momentum winners. The portfolio needs rate-sensitive, defensive income exposure in a disinflationary regime, and PAVE's clean technicals with macro sponsorship justify the 5% slot. However, the category's 43/100 macro fit (hampered by liquidity and credit stress drags) and only 94.2/100 technical evidence for the winner prevent larger allocation; this is a regime play, not a conviction trade.
Emerging Markets — INDA
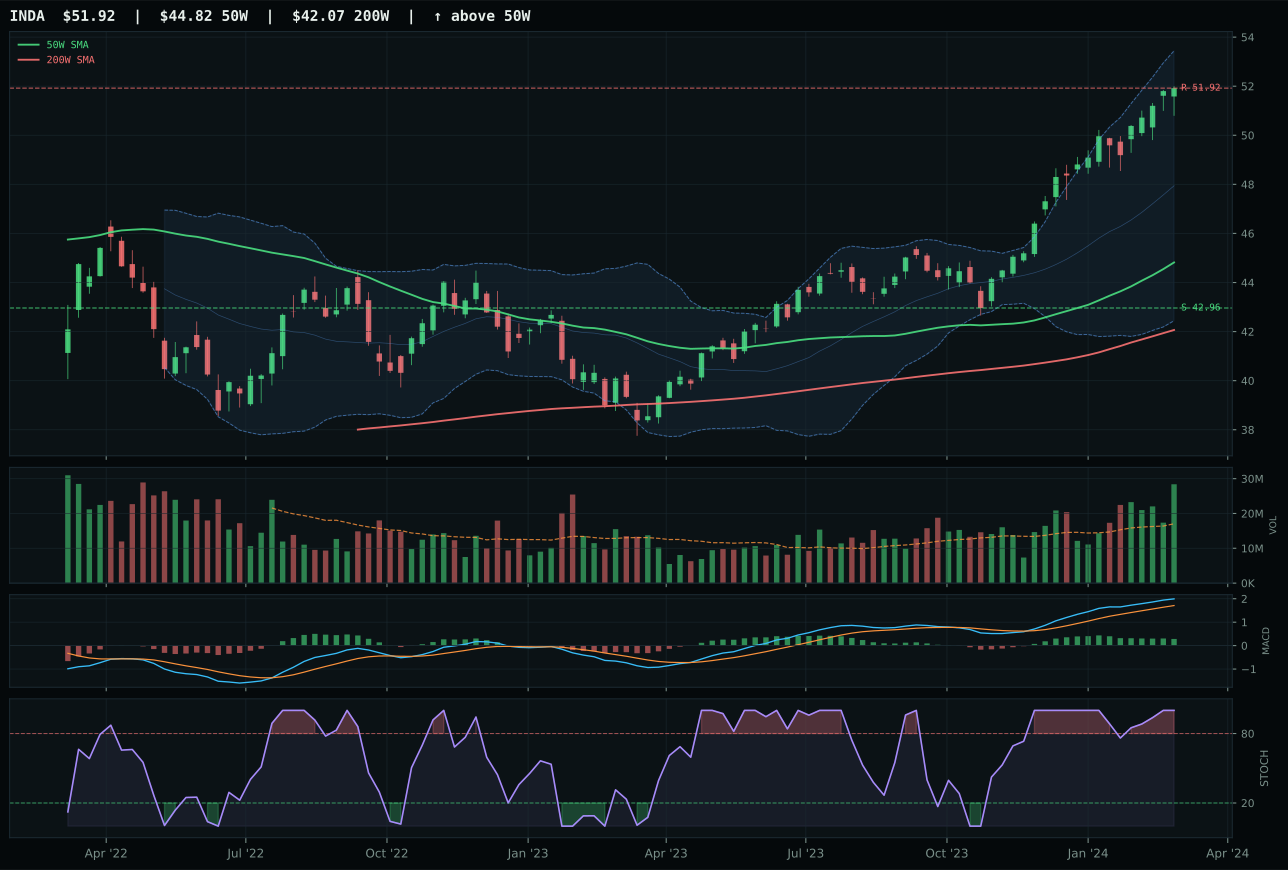
INDA has a vertical extension profile with 0.2% 13-week relative strength versus SPY.
A failed hold above support would weaken the setup.
Actionable but governed by invalidation levels.
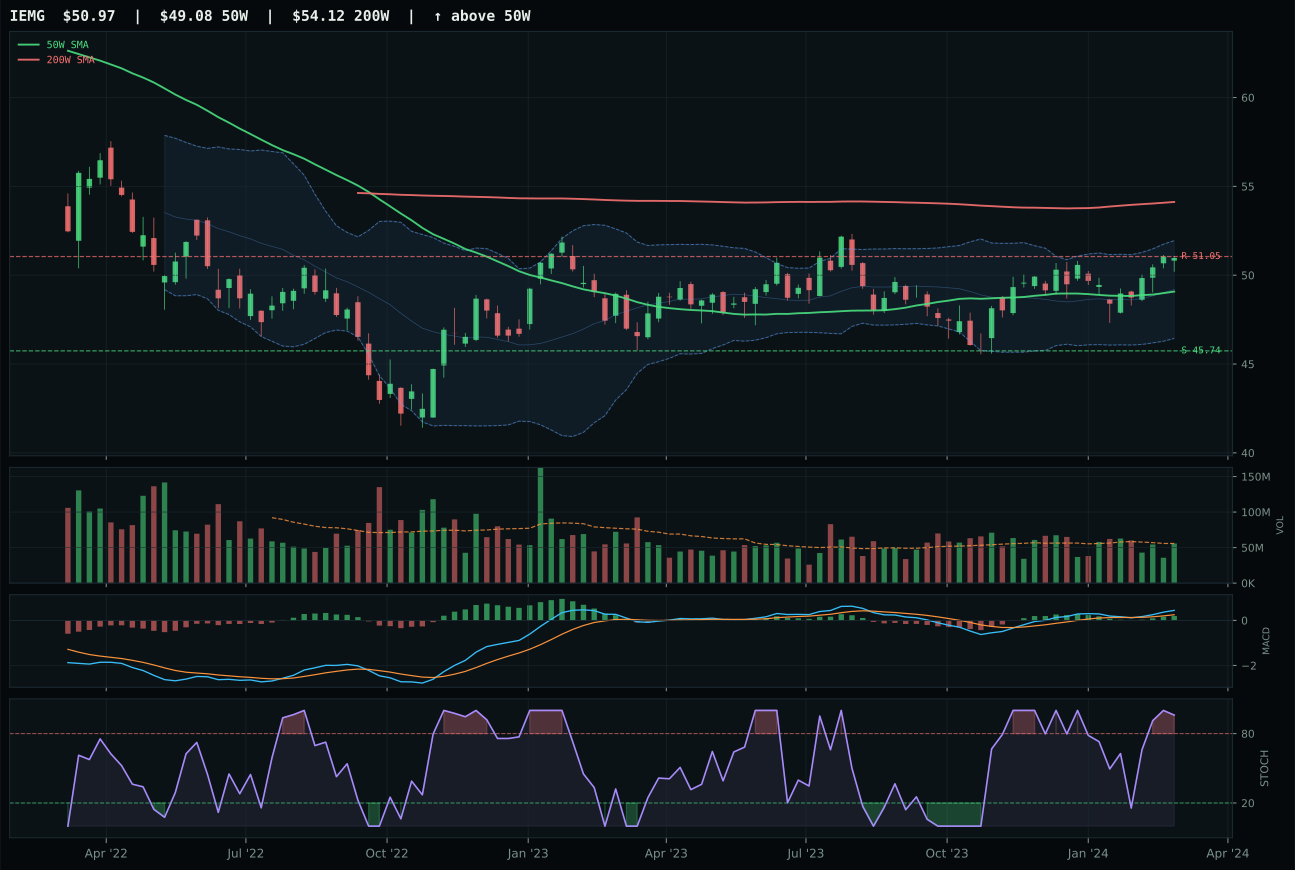
IEMG has a neutral structure profile with -9.6% 13-week relative strength versus SPY.
A failed hold above support would weaken the setup.
Actionable but governed by invalidation levels.
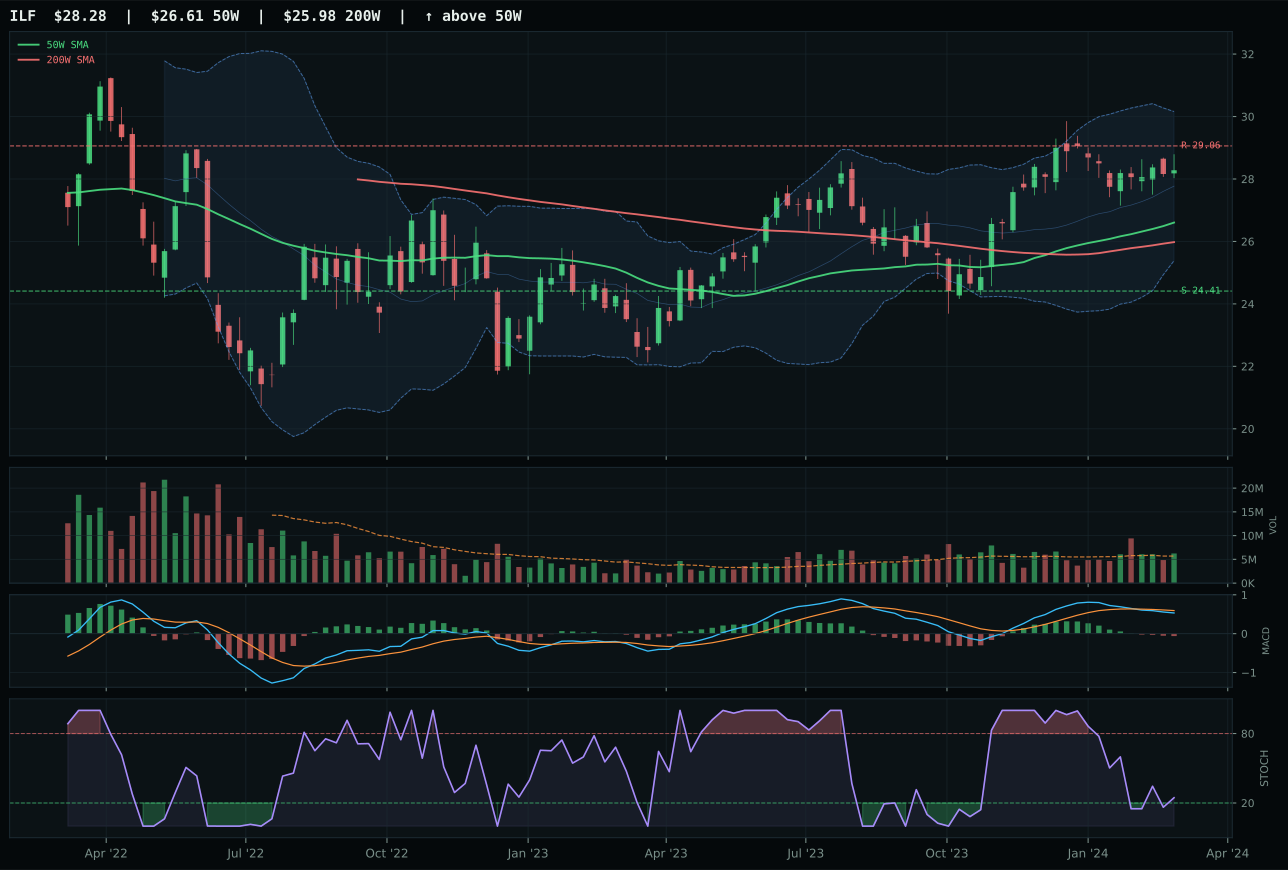
ILF has a neutral structure profile with -12.1% 13-week relative strength versus SPY.
A failed hold above support would weaken the setup.
Actionable but governed by invalidation levels.
INDA crushes IEMG by a mere 0.5 points on a technician's knife's edge, winning because of superior structure (89.7 vs 73.3), better risk-reward (48.9 vs 45.2), and overwhelming volume confirmation (accumulation at 1.67x the 20-week average vs neutral). Both ETFs sit extended above their 50-week moving averages—INDA at 15.8% with 96.3/100 trend and IEMG at neutral structure—but INDA's 11.9% 13-week return and 9.8% category-relative strength create a narrative of quality flight that IEMG's 2.1% return cannot match. INDA's MACD is bullish but flattening while IEMG's is bullish and improving, yet INDA's above-average volume participation and 96.2/100 momentum confirmation override the MACD advantage; when volume is accumulating into a leading ETF, the flattening MACD is a sign of consolidation, not rollover. The 0.2% RS versus SPY is near-neutral for INDA but negative-9.6% for IEMG, signaling that India-specific growth is winning against broad emerging-market bets.
Emerging Markets scored 30.2 and received 5% allocation despite ranking outside top-2. Risk appetite positive adds 8 points to the category-level macro score, but credit stress and liquidity stress each drag by 10 points, netting a -12 point macro headwind that prevents this from ranking higher. INDA's technical evidence is exceptional at 91.8/100—its trend (96.3), momentum (96.2), and persistence (87.2) are elite—yet the timing score of only 32.0 reflects a 15.8% extension above the 50-week that pressures entry risk asymmetry. The 5% allocation captures the India growth narrative and INDA's clean technical setup, but the category macro fit of 48/100 and weak category-level support prevent larger sizing. This is a conviction trade on emerging-market rotations within disinflation, not a high-conviction category.
Agriculture & Livestock — VEGI
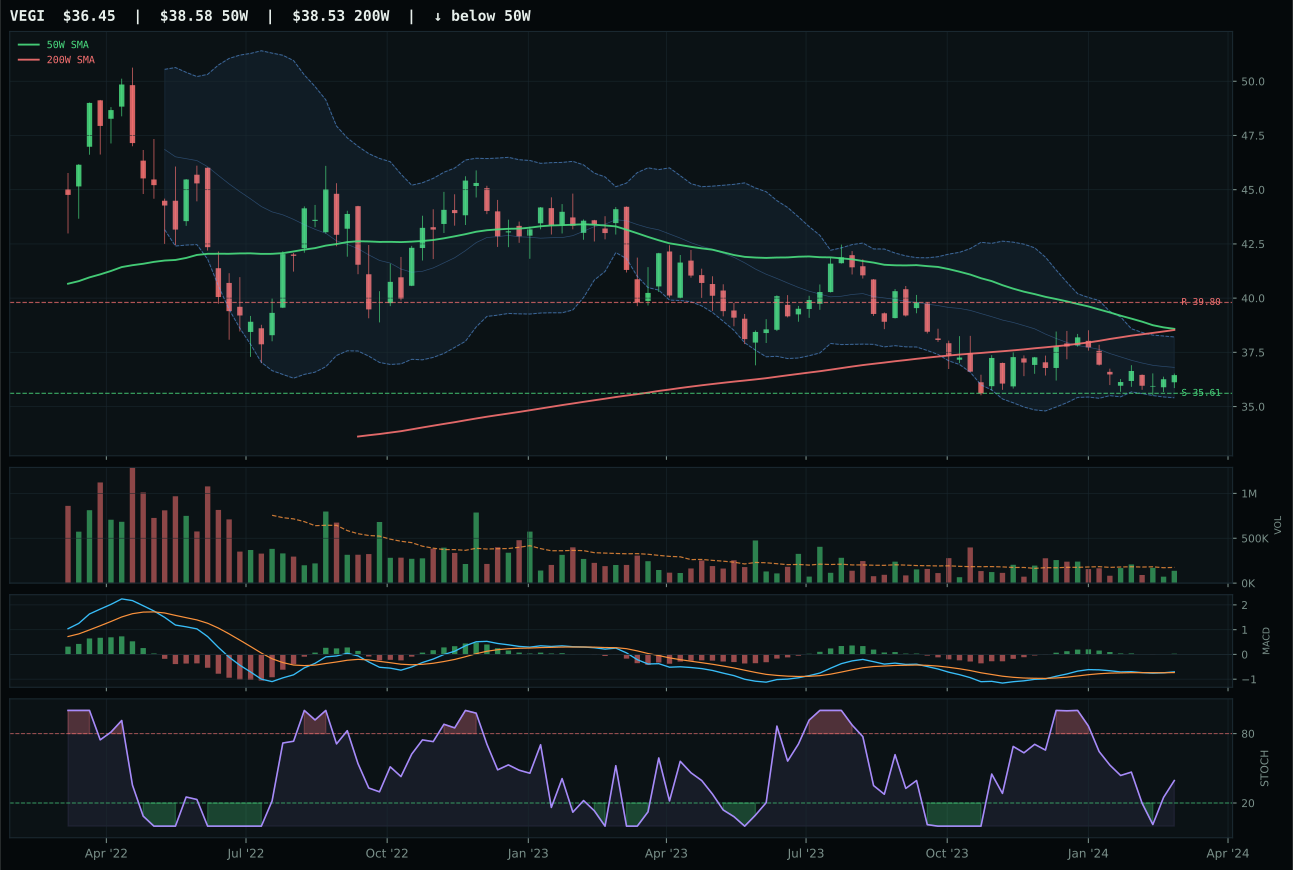
VEGI has a pullback into support profile with -13.9% 13-week relative strength versus SPY.
A failed hold above support would weaken the setup.
Tracked, but not top-2 eligible because: .
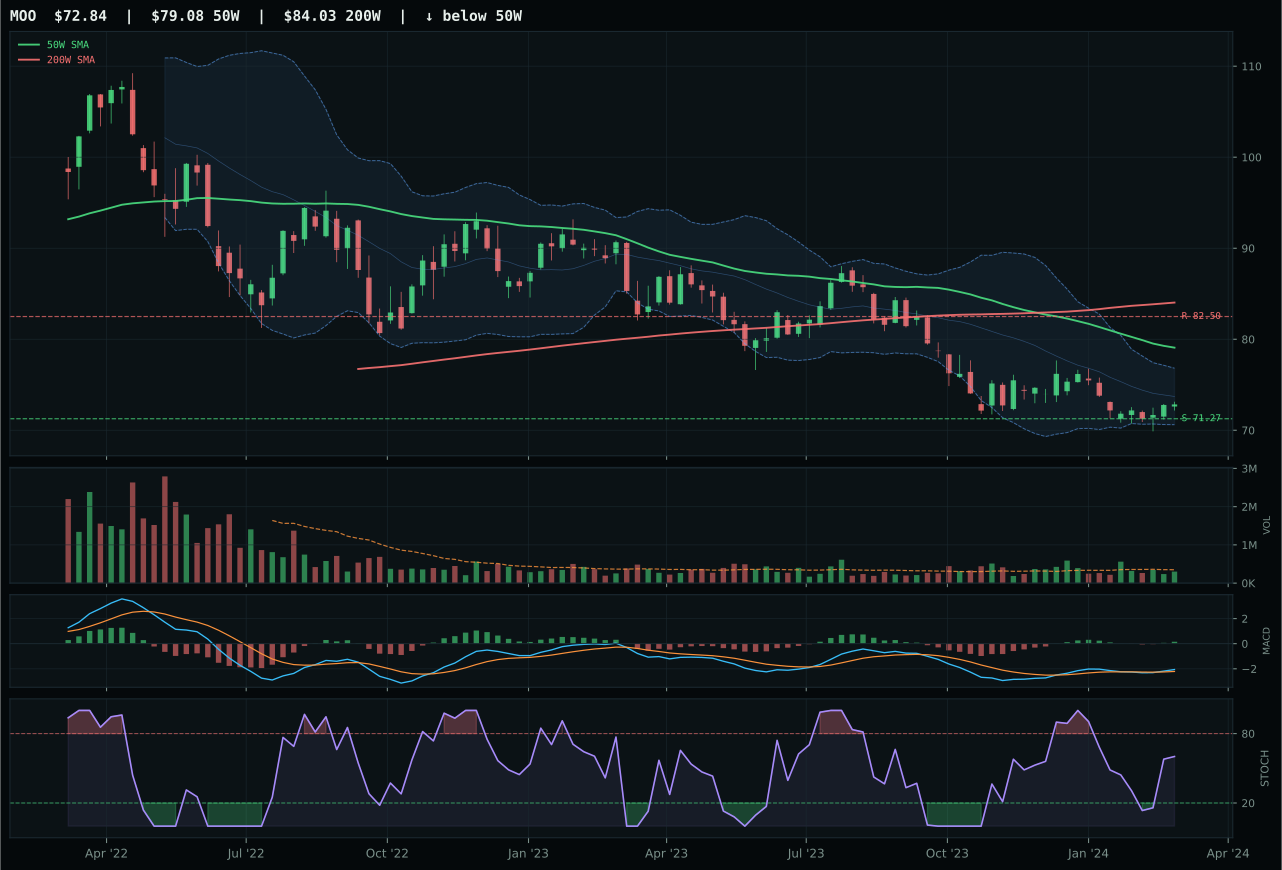
MOO has a pullback into support profile with -14.2% 13-week relative strength versus SPY.
Extension and support failure are the main tactical risks.
Tracked, but not top-2 eligible because: structurally broken.
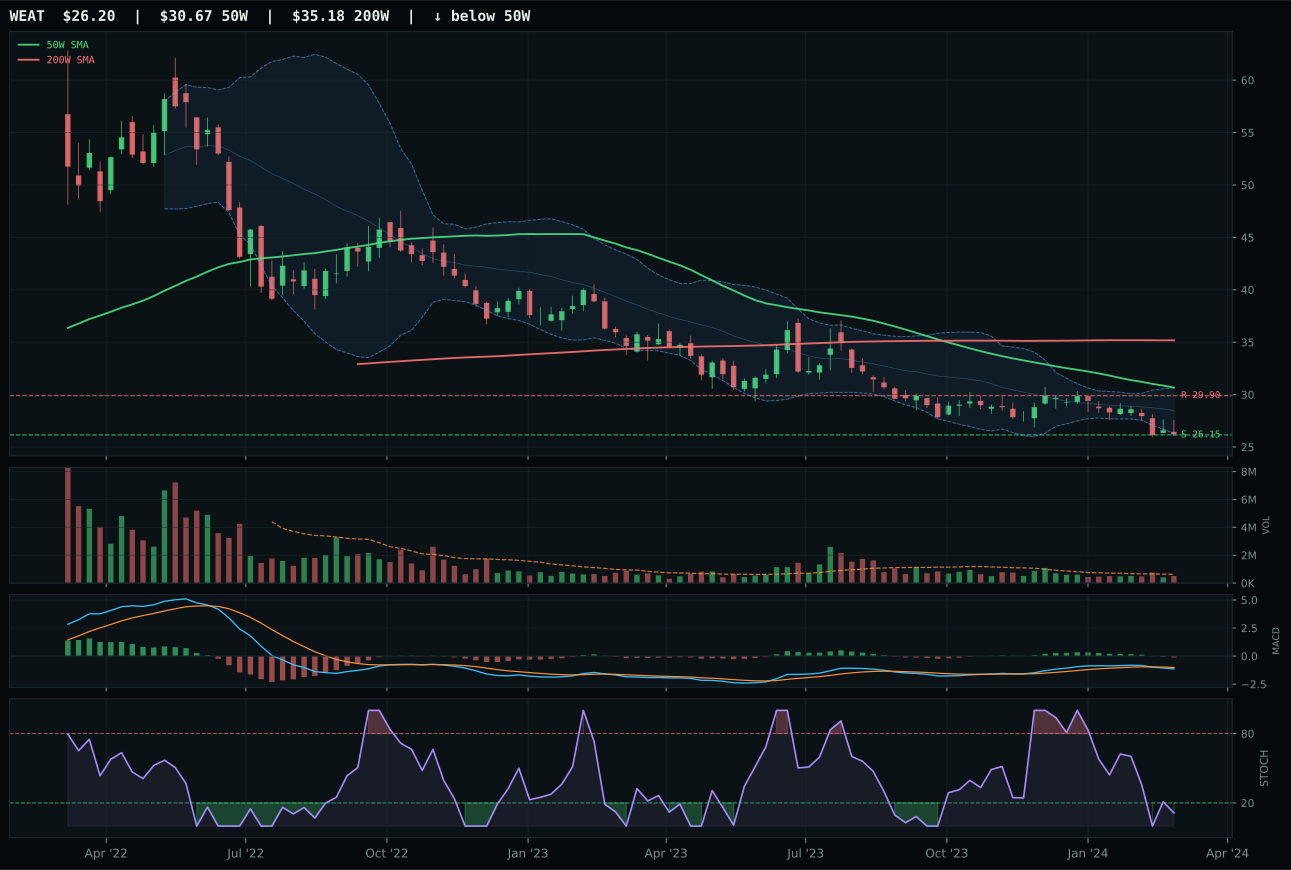
WEAT has a pullback into support profile with -20.7% 13-week relative strength versus SPY.
Extension and support failure are the main tactical risks.
Tracked, but not top-2 eligible because: structurally broken.
VEGI wins a category that failed its eligibility filter by delivering the least-bad setup among deeply troubled fundamentals—a pullback into support at 35.61 with 88/100 timing precision and exceptional risk-reward geometry (90/100) offset by a broken trend score of 36/100 and momentum confirmation of 30.8/100. The 13-week return is negative at minus 2.2%, relative strength versus SPY is minus 13.9%, and MACD is bullish but flattening, which reads as a whipsaw setup where recovery attempts keep failing. Price sits 5.5% below the 50-week moving average in a near-52W low repair zone, and volume is neutral at 0.78x the 20-week average, meaning there is no fresh institutional bid to catch this falling knife. VEGI's 0.3% category-relative strength over MOO is technical margin noise; both ETFs are expressions of macro pressure, not momentum leadership.
Agriculture & Livestock scored 0.0 and received zero allocation—it is entirely excluded from the portfolio. Disinflation actively hurts this category by 6 points, and disinflation pressure is marked as active with a -8 point penalty, making this the only regime where farm products structurally underperform. Both VEGI and MOO trade below their 50-week moving averages with slowing momentum, and the broad macro headwinds ensure that any tactical bounce in this category gets immediately sold. To earn any allocation, Agriculture would need either a macro regime shift away from disinflation or a hard technical reset where support holds and MACD restarts a new uptrend; neither condition is present.
Traditional Energy — FCG
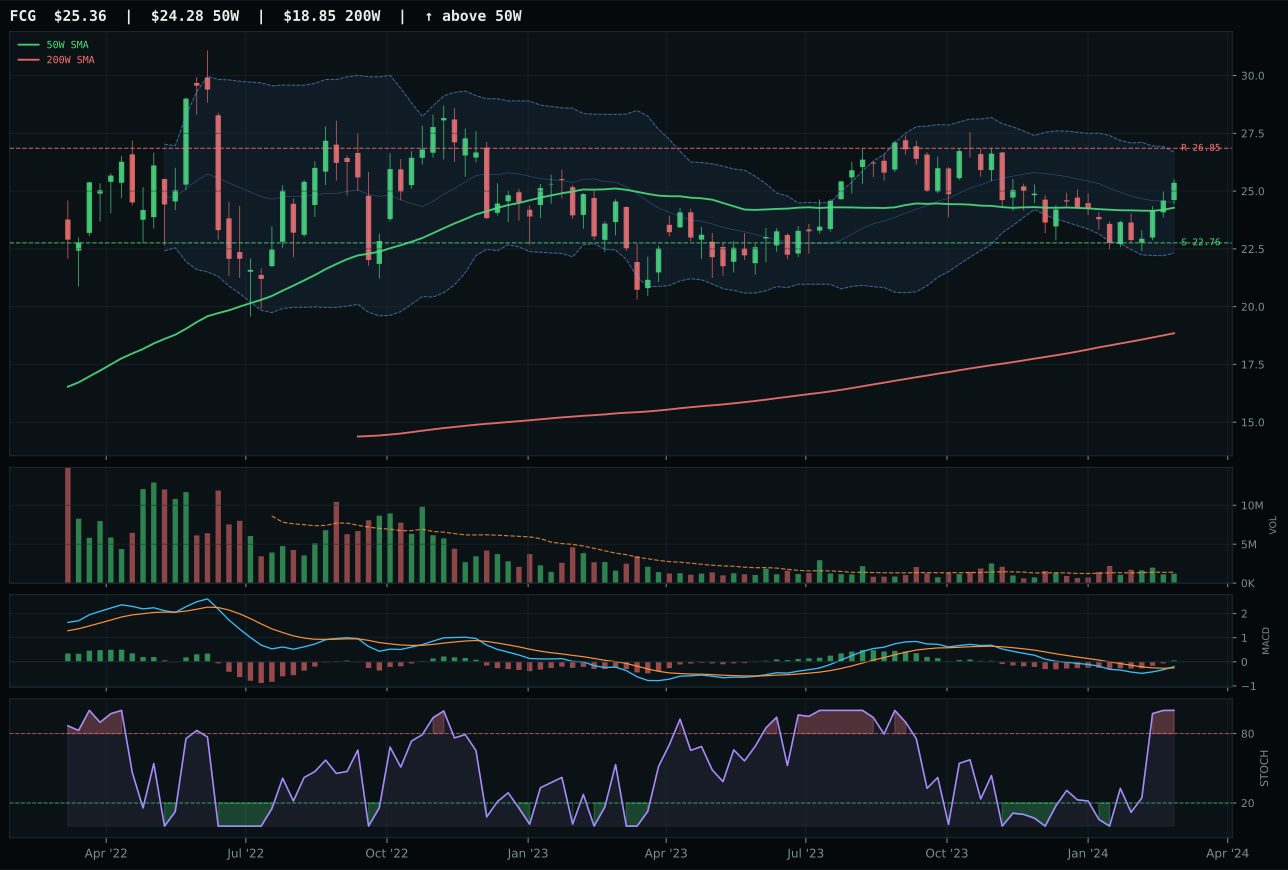
FCG has a neutral structure profile with -9.8% 13-week relative strength versus SPY.
A failed hold above support would weaken the setup.
Actionable but governed by invalidation levels.
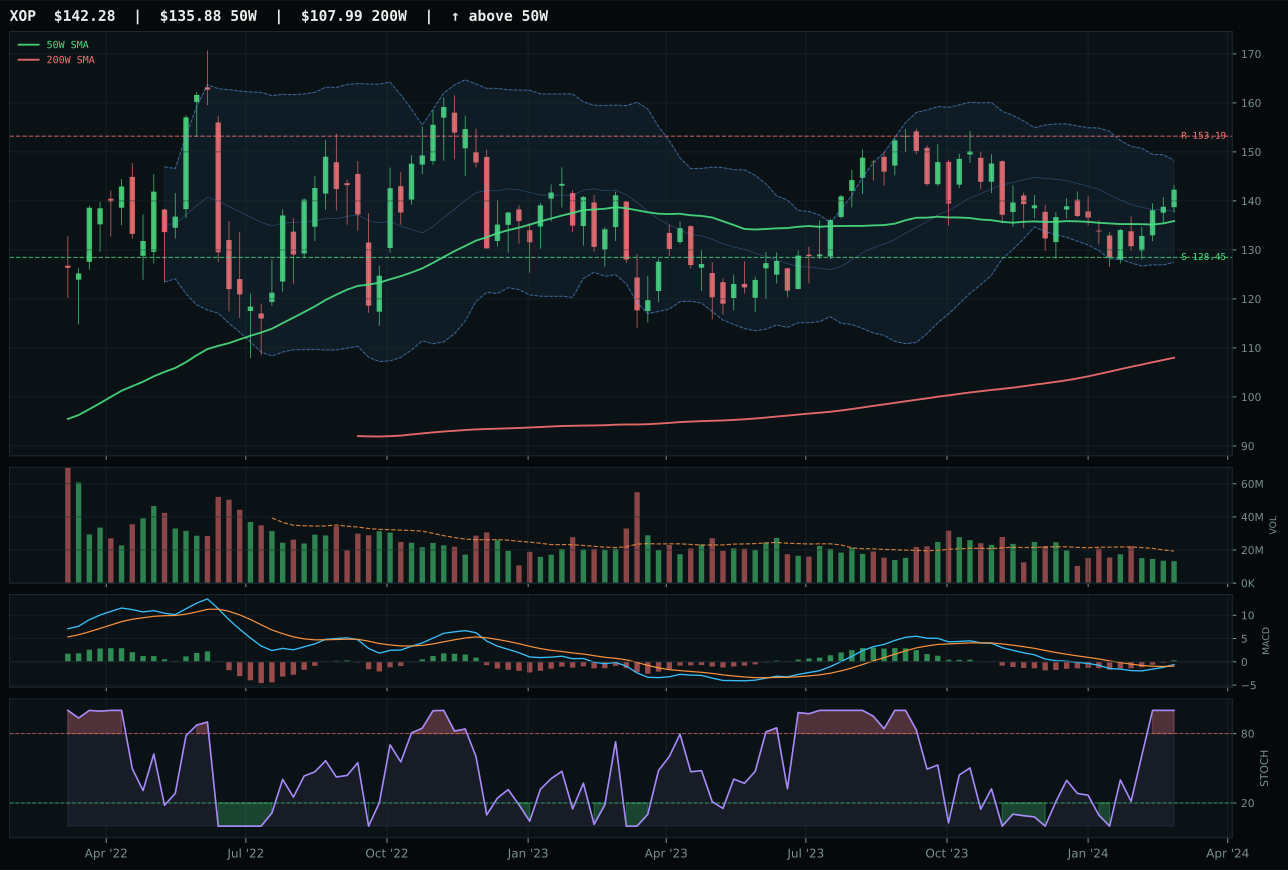
XOP has a neutral structure profile with -9.4% 13-week relative strength versus SPY.
A failed hold above support would weaken the setup.
Actionable but governed by invalidation levels.
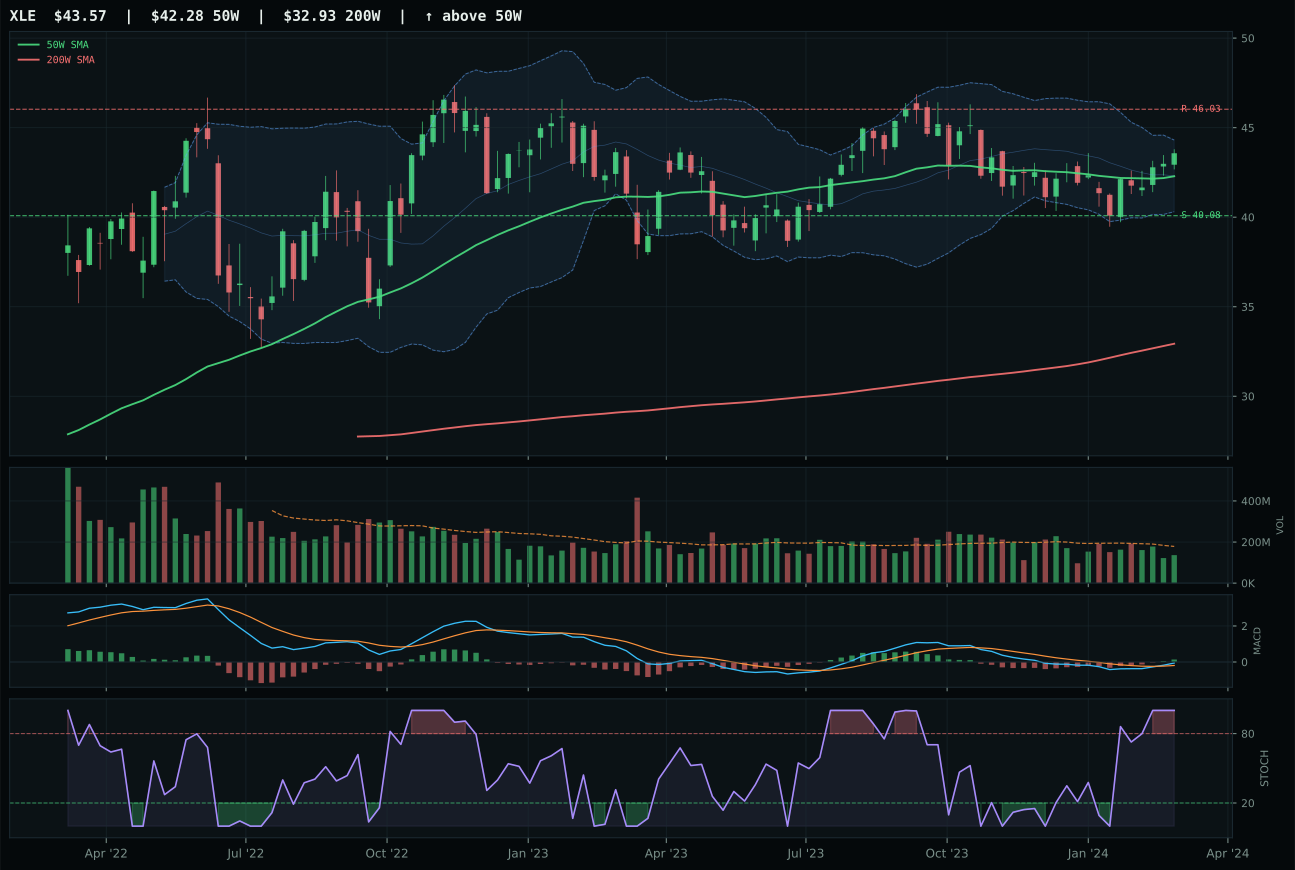
XLE has a neutral structure profile with -9.2% 13-week relative strength versus SPY.
A failed hold above support would weaken the setup.
Actionable but governed by invalidation levels.
FCG edges XOP by just 0.7 points in a category where all three nominees are technical leaders but macro orphans—both FCG and XOP score 85-86/100 on trend with bullish-and-improving MACD and overbought stochastic RSI. FCG's 73.8/100 structure score narrowly beats XOP's 71.8 due to cleaner lines and neutral versus thin participation, and that marginal difference is all that separates them when both sit 4% to 5% above 50-week moving averages with minus-9% to minus-10% relative strength versus SPY. The 13-week returns are nearly identical (1.9% vs 2.3%), and category-relative strength is neutral for both. FCG's accumulation is neutral versus XOP's thin participation, a minor technical edge that would be invisible if volumes mattered more, but in a macro-hostile category, structural cleanliness becomes the tiebreaker.
Traditional Energy scored 28.7 and receives zero allocation—it is excluded entirely. Energy scarcity is marked active with +16 points, a powerful macro signal, yet disinflation hurts the category by 10 points and creates a -10 point disinflation pressure penalty, for a net macro headwind of -4 points. The portfolio is anchored in a TrendBTC crypto regime favoring inflation hedges, not deflation hedges, and traditional energy sits at the wrong end of that trade. FCG and XOP both show acceptable trend scores (85-86/100) but weak momentum confirmation (66 and 59/100 respectively) and thin participation, indicating this is a dead-money sector until either crude prices break higher on supply shock or the macro regime shifts inflation-ward. Zero allocation is appropriate.
Industrial Metals — COPX
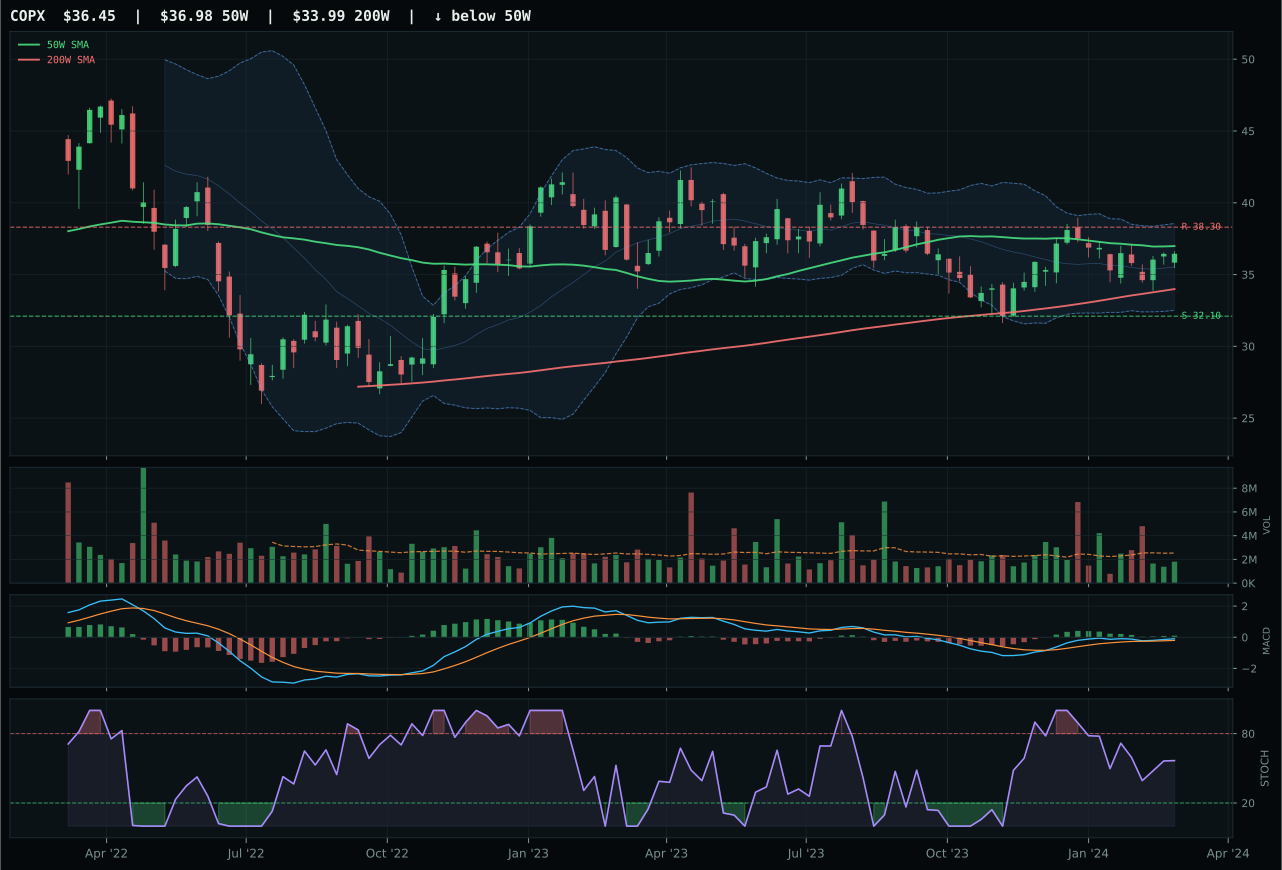
COPX has a compression near 50W profile with -10.1% 13-week relative strength versus SPY.
A failed hold above support would weaken the setup.
Actionable but governed by invalidation levels.
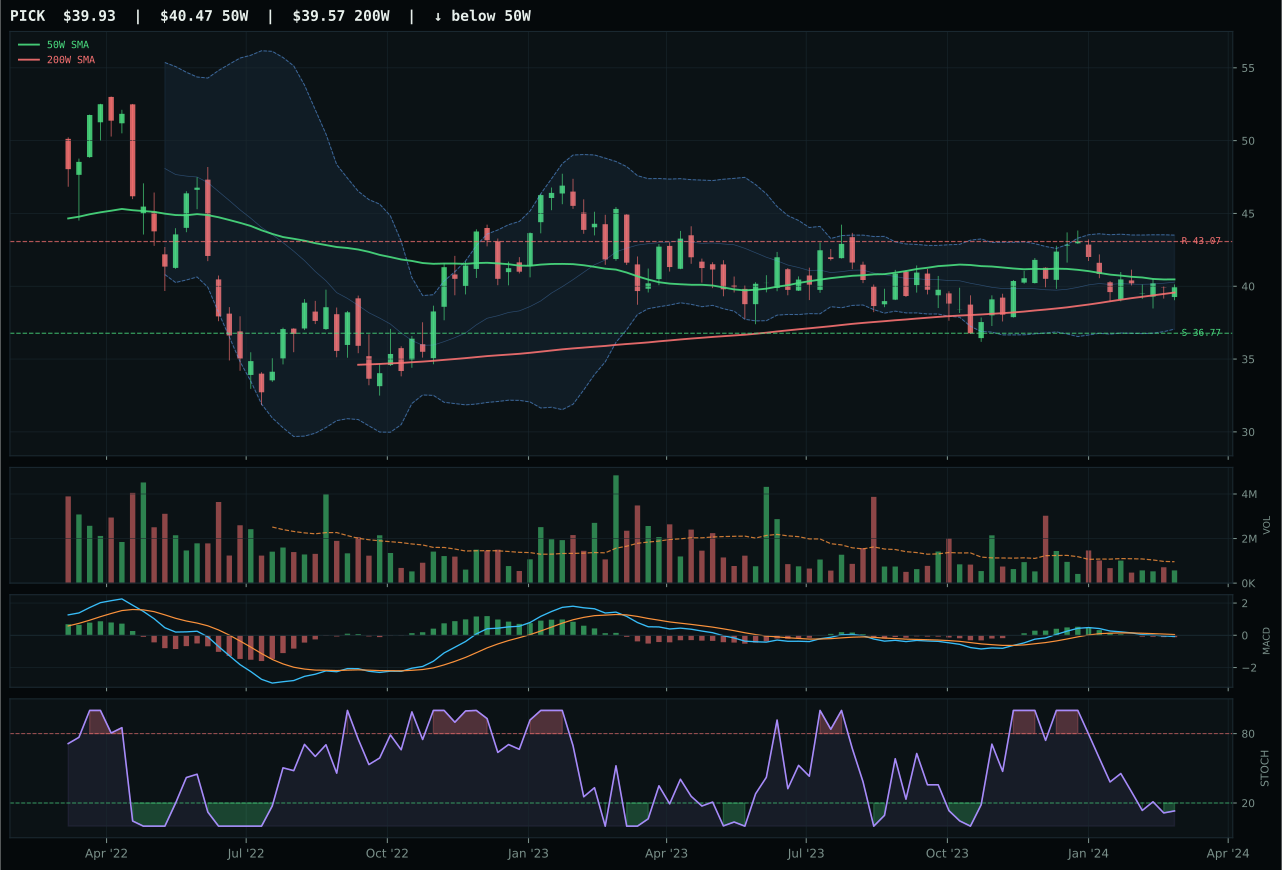
PICK has a compression near 50W profile with -16.2% 13-week relative strength versus SPY.
A failed hold above support would weaken the setup.
Actionable but governed by invalidation levels.
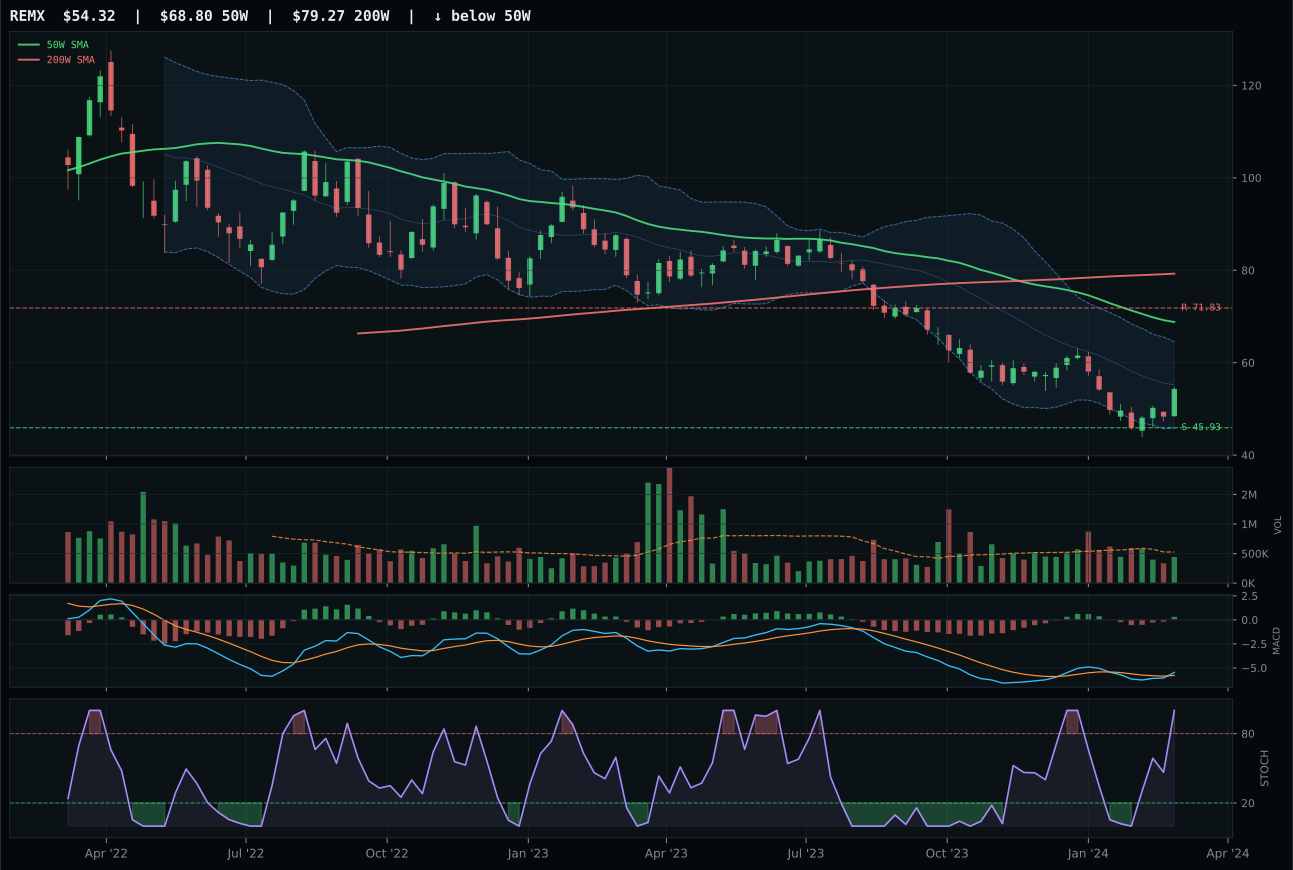
REMX has a neutral structure profile with -18.1% 13-week relative strength versus SPY.
Extension and support failure are the main tactical risks.
Tracked, but not top-2 eligible because: structurally broken.
COPX wins by a large 24.7-point margin over PICK, though victory here is like claiming the best seat on a sinking ship—the category itself failed eligibility, and COPX's score of 11.2 reflects deep structural distress. COPX sits just minus-1.4% below its 50-week moving average in compression, which would be a coil setup if volumes and momentum were confirming; instead, volume is thin at 0.71x the 20-week average and momentum confirmation is only 48.6/100, signaling no institutional accumulation. MACD is bullish but flattening, stochastic RSI is rising mid-zone at 0.57, and the Fibonacci location is middle retracement, the kiss of death for conviction entries. COPX's category-relative strength of 6.1% offers a thin margin of relative leadership versus PICK's bearish/weakening MACD and oversold stochastic RSI, but relative leadership in a failed category is not a recommendation.
Industrial Metals scored 11.2 and receives zero allocation—it is ranked 9th or 10th and entirely excluded from the portfolio. Liquidity stress drags the macro fit down with -8 points and credit stress contributes another -7 points, creating a -15 point macro headwind that overwhelms COPX's improved technical setup. Volume is thin participation at 0.71x average, signaling that even the category winner lacks accumulation sponsorship. The category scores 69.5/100 on technical evidence but only 43/100 on macro fit, and the 62%-38% weighting toward technicals cannot overcome the regime headwind. Industrial metals would need either a return to risk appetite broadly or a breakdown in credit conditions that forces flight-to-yield trades; neither is happening in the current disinflation regime.