
2024-02-23
Informational purposes only. The content in this report, including allocations, analysis, and commentary, is provided solely for informational and educational purposes. It does not constitute financial advice, investment advice, trading advice, or any other type of advice. Past performance does not guarantee future results. Always conduct your own research and consult a qualified financial professional before making investment decisions.
Weekly Allocation
| Ticker | Category | Weight | Role |
|---|---|---|---|
| FBTC | 50% | Overlay | |
| SMH | AI | 10% | Top-2 (10%) |
| XLK | Technology | 10% | Top-2 (10%) |
| XAR | Defense & Aerospace | 5% | Tier-2 (5%) |
| PAVE | Utilities & Infrastructure | 5% | Tier-2 (5%) |
| GLD | Precious Metals | 5% | Tier-2 (5%) |
| VEGI | Agriculture & Livestock | 5% | Tier-2 (5%) |
| NLR | Nuclear Energy | 5% | Tier-2 (5%) |
| INDA | Emerging Markets | 5% | Tier-2 (5%) |
Trade Instructions — Monday Open
Sell the tranche from 2024-01-26 (completing its 4-week hold). Buy the new tranche. Instructions show net portfolio changes — same-asset positions cancel, weight changes show the delta.
| Action | Ticker | Instruction |
|---|---|---|
| SELL | URNM | Sell 33% of URNM position (reduce 3.75% → 2.50%) |
| SELL | ITA | Sell 33% of ITA position (reduce 3.75% → 2.50%) |
| SELL | XLE | Sell 50% of XLE position (reduce 2.50% → 1.25%) |
| SELL | MOO | Sell 33% of MOO position (reduce 3.75% → 2.50%) |
| BUY | INDA | Buy INDA — 25.00% of freed cash (adds 1.25% to portfolio) |
| BUY | XAR | Buy XAR — 25.00% of freed cash (adds 1.25% to portfolio) |
| BUY | NLR | Buy NLR — 25.00% of freed cash (adds 1.25% to portfolio) |
| BUY | VEGI | Buy VEGI — 25.00% of freed cash (adds 1.25% to portfolio) |
Current Portfolio After Trade
Combined holdings across all 4 active tranches. Each tranche is 25% of the portfolio.
| Ticker | % of Portfolio | Weight Bar |
|---|---|---|
| FBTC | 50.00% | |
| SMH | 10.00% | |
| PAVE | 5.00% | |
| GLD | 5.00% | |
| IGV | 5.00% | |
| INDA | 3.75% | |
| URNM | 2.50% | |
| ITA | 2.50% | |
| MOO | 2.50% | |
| CIBR | 2.50% | |
| XAR | 2.50% | |
| NLR | 2.50% | |
| VEGI | 2.50% | |
| XLK | 2.50% | |
| XLE | 1.25% |
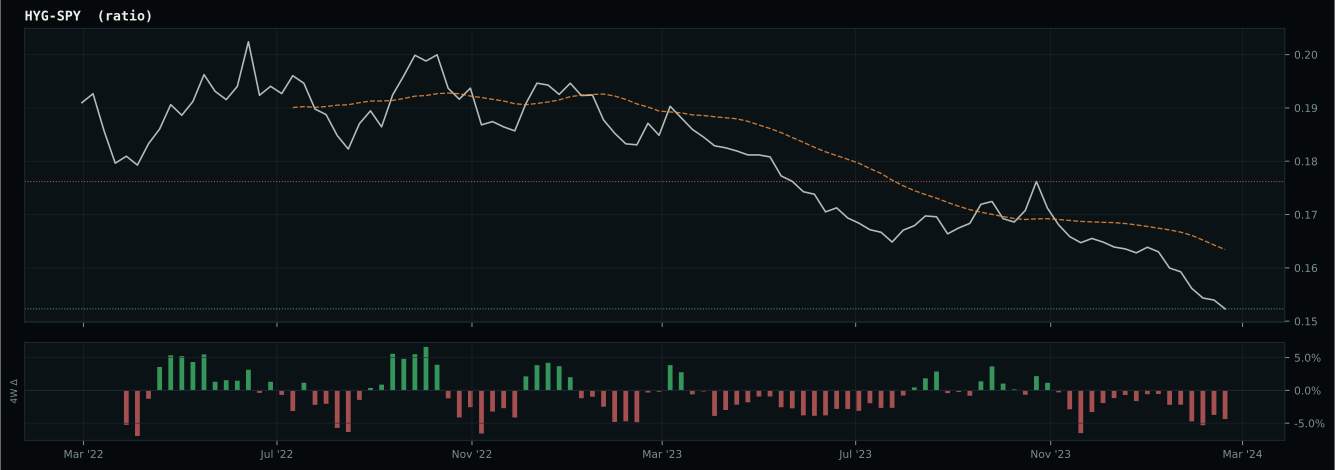
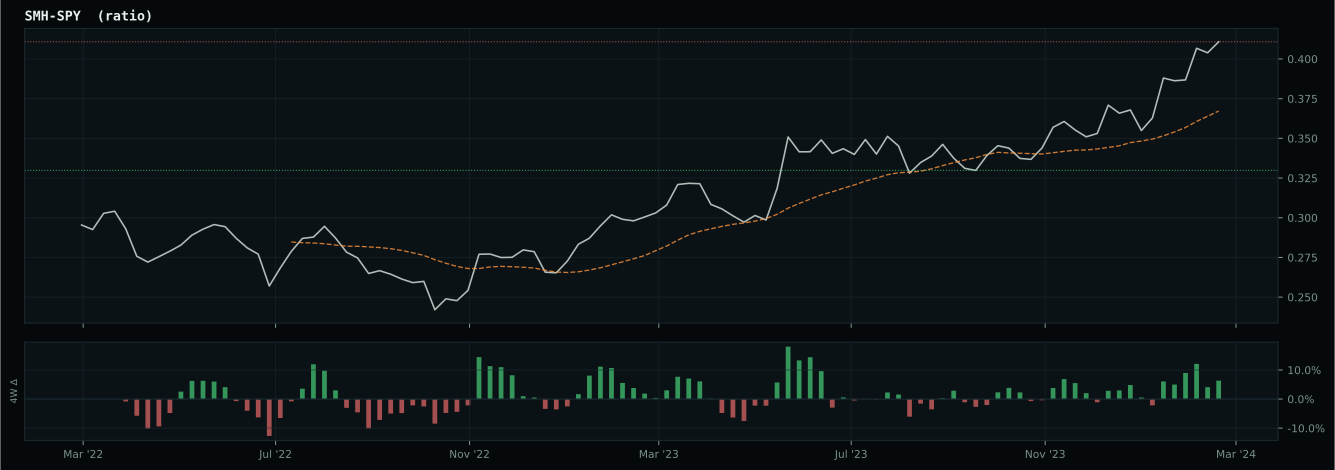
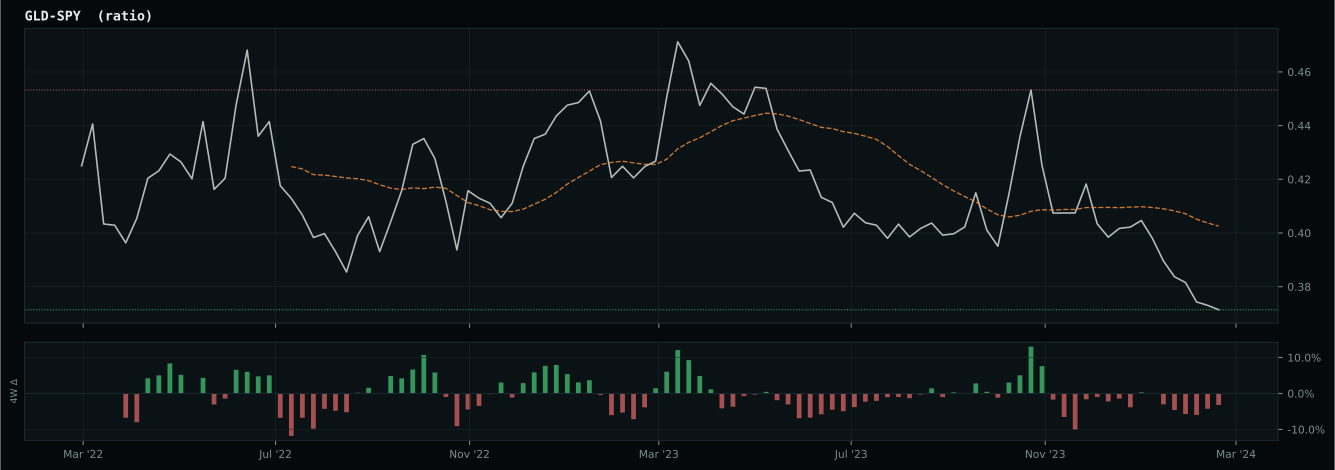
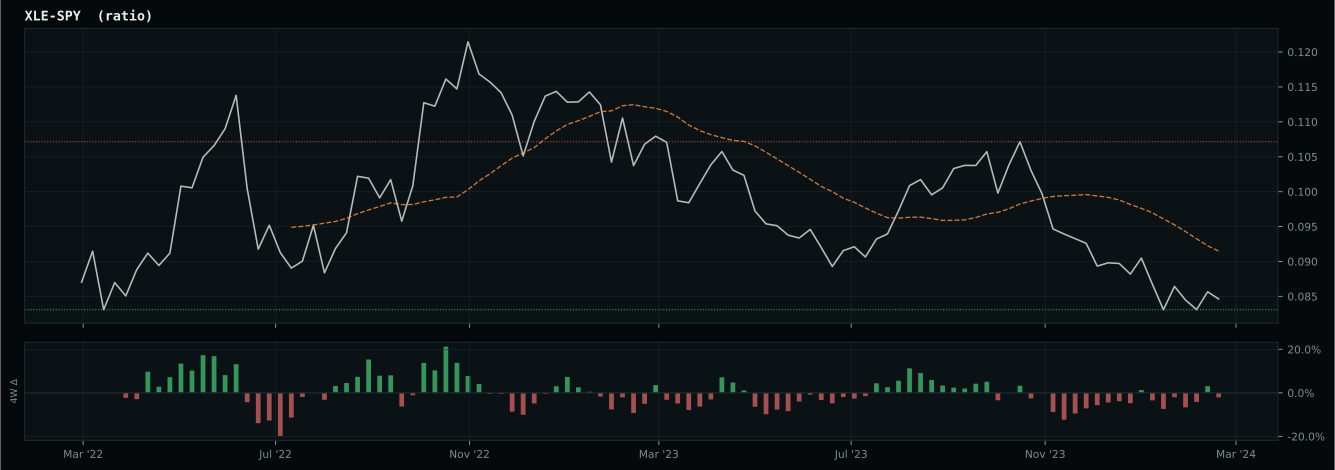
Macro Regime — Disinflation
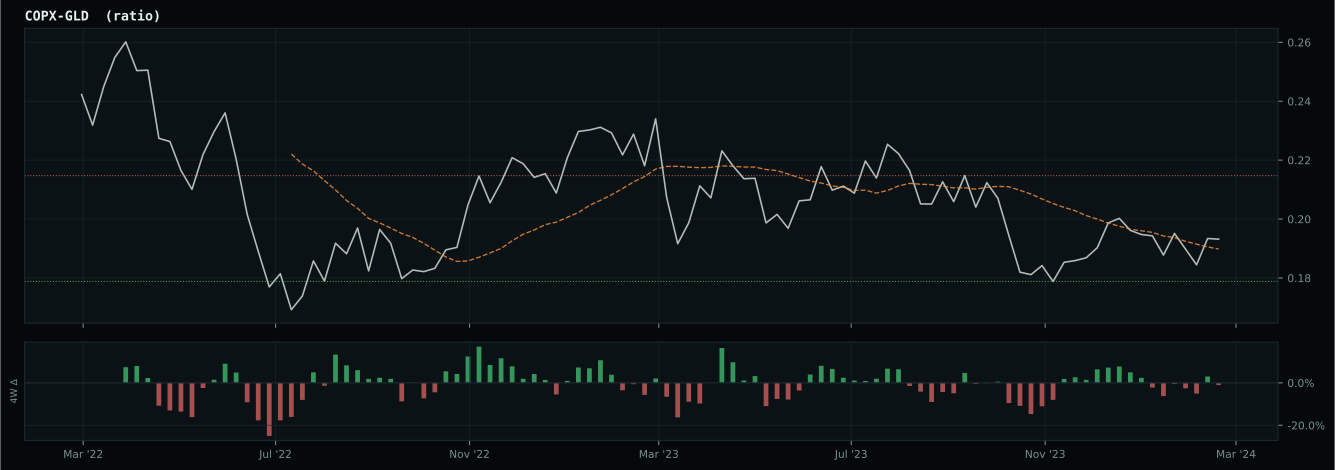
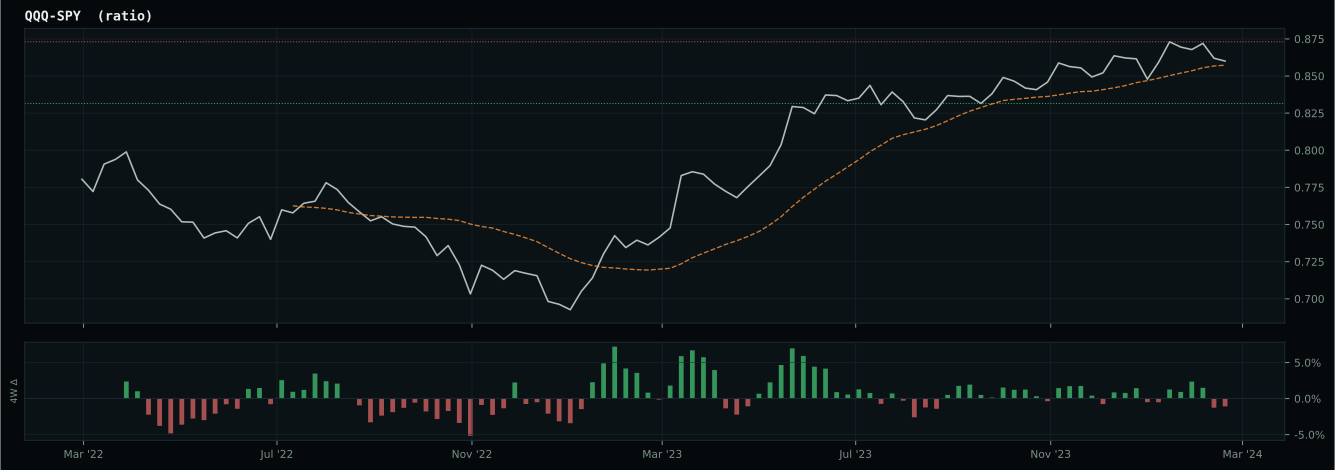
Macro Evidence Charts
Market-implied signals behind the macro regime scores. Each ratio compares two assets; the direction and slope of the ratio is what the macro engine reads.
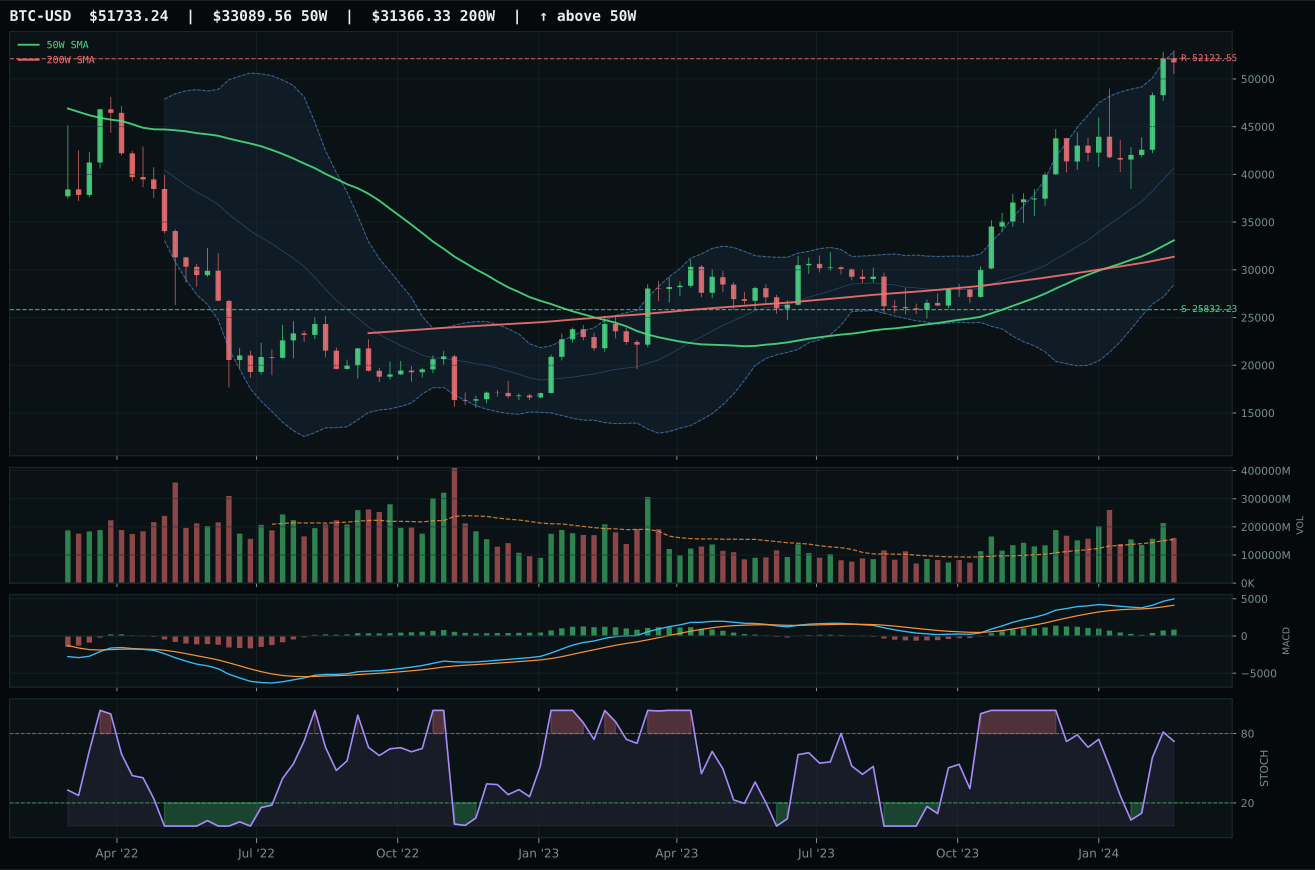
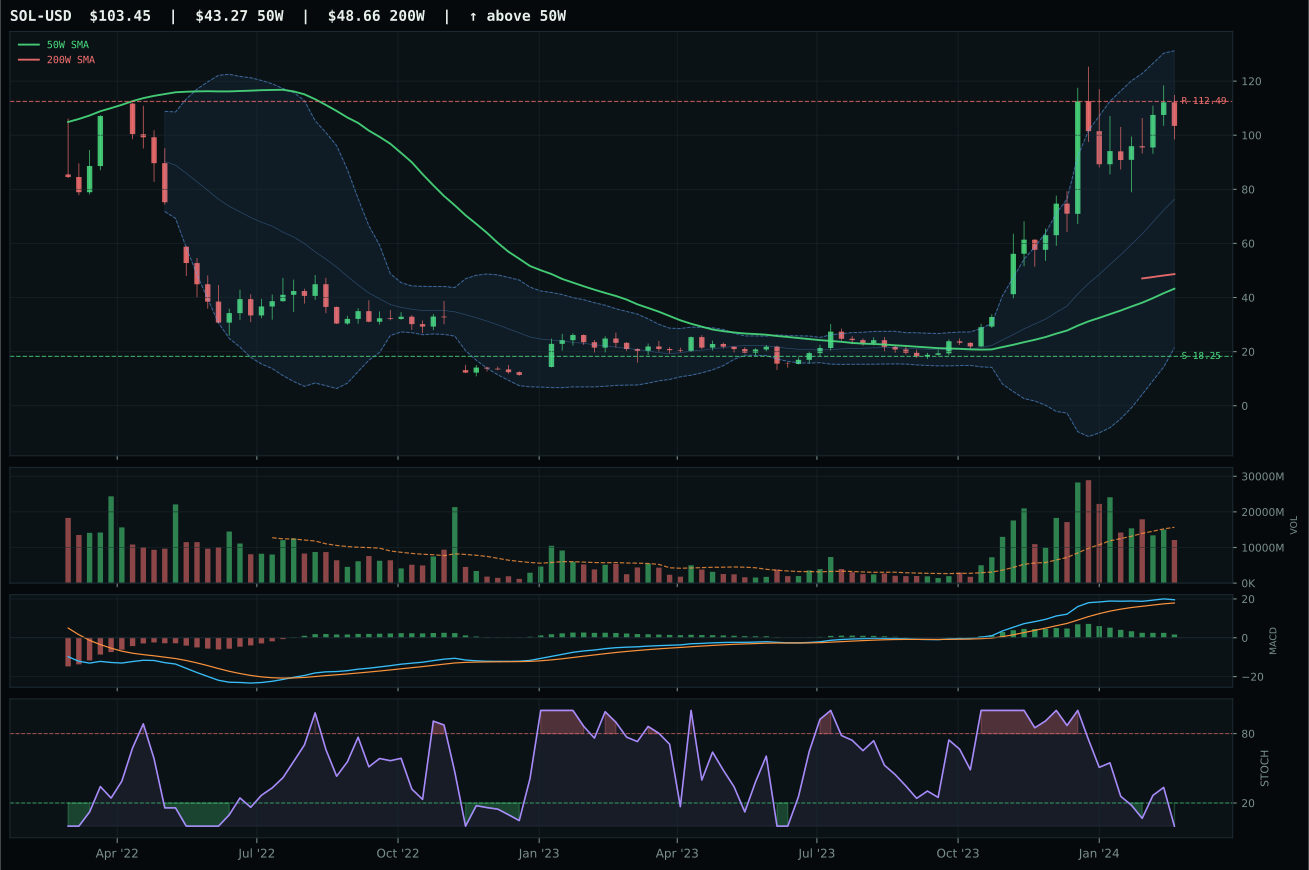
Crypto Regime — TrendBTC
post-touch structure is too wide to count as a range; max/min close ratio is 3.14
TrendBTC confirmed: 2 consecutive closes above rising/flat 50W SMA
one or more available conditions failed
Category Rankings
| Rank | Category | Winner | Score | Alloc | 4W Ret | Peers (4W) |
|---|---|---|---|---|---|---|
| 1 | AI | SMH | 70.4 | 20% | +6.94% | BOTZ +2.2% · AIQ +1.8% |
| 2 | Technology | XLK | 50.6 | 20% | +0.84% | IGV +0.3% · CIBR -0.3% |
| 3 | Defense & Aerospace | XAR | 49.8 | 10% | +3.19% | ITA +3.5% · ROKT +0.8% |
| 4 | Utilities & Infrastructure | PAVE | 38.4 | 10% | +6.04% | IGF +3.0% · XLU +3.9% |
| 5 | Precious Metals | GLD | 36.1 | 10% | +7.14% | SLV +9.7% · GDX +13.2% |
| 6 | Nuclear Energy | NLR | 30.9 | 10% | +7.58% | URA +7.1% · URNM +5.9% |
| 7 | Emerging Markets | INDA | 27.7 | 10% | -2.06% | IEMG +0.9% · ILF -0.4% |
| 8 | Industrial Metals | COPX | 24.3 | 10% | +15.43% | PICK +5.1% · REMX +4.3% |
| 9 | Traditional Energy | XLE | 10.7 | 0% | +7.99% | XOP +9.2% · FCG +8.0% |
| 10 | Agriculture & Livestock | VEGI | — | 0% | +4.68% | MOO +1.7% · WEAT +2.1% |
AI — SMH
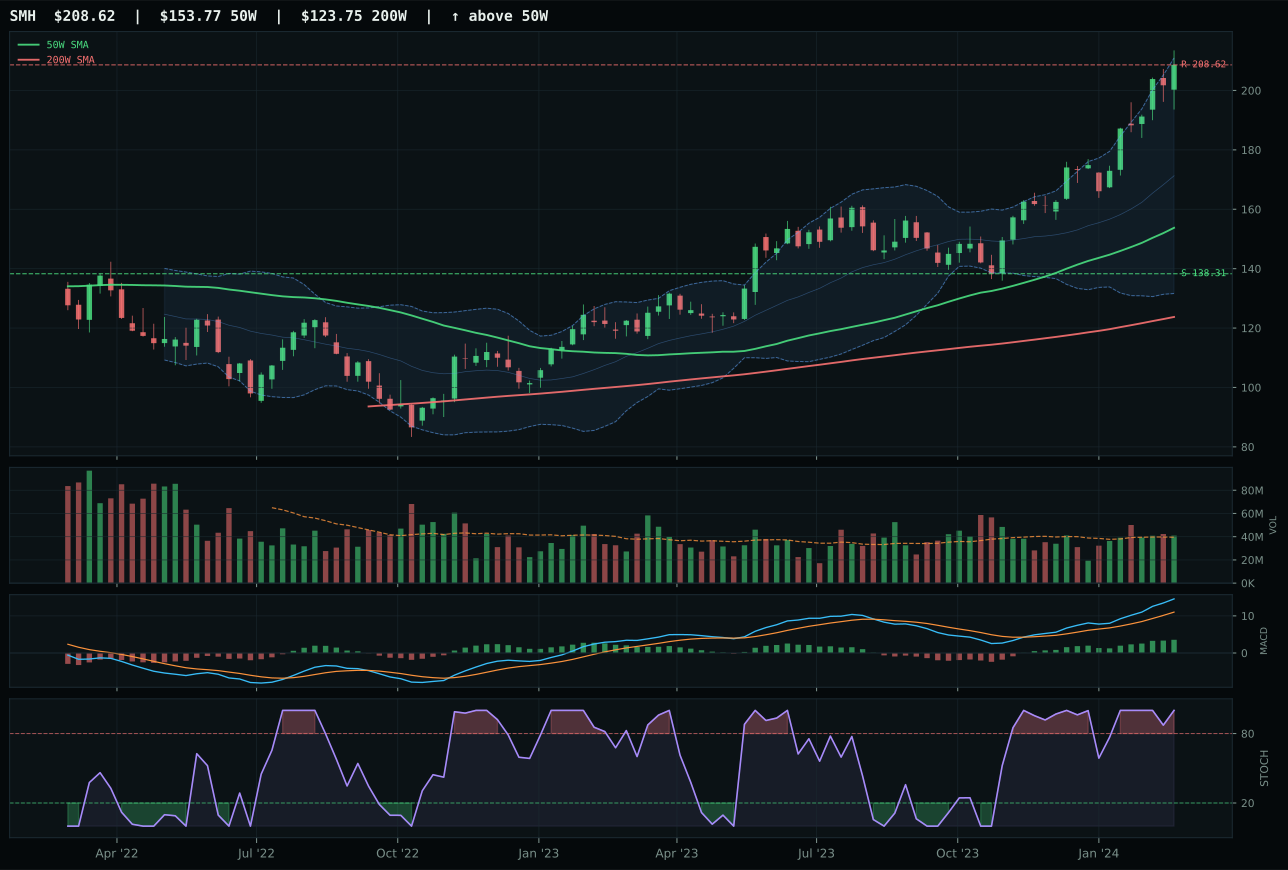
SMH has a vertical extension profile with 17.4% 13-week relative strength versus SPY.
A failed hold above support would weaken the setup.
Actionable but governed by invalidation levels.
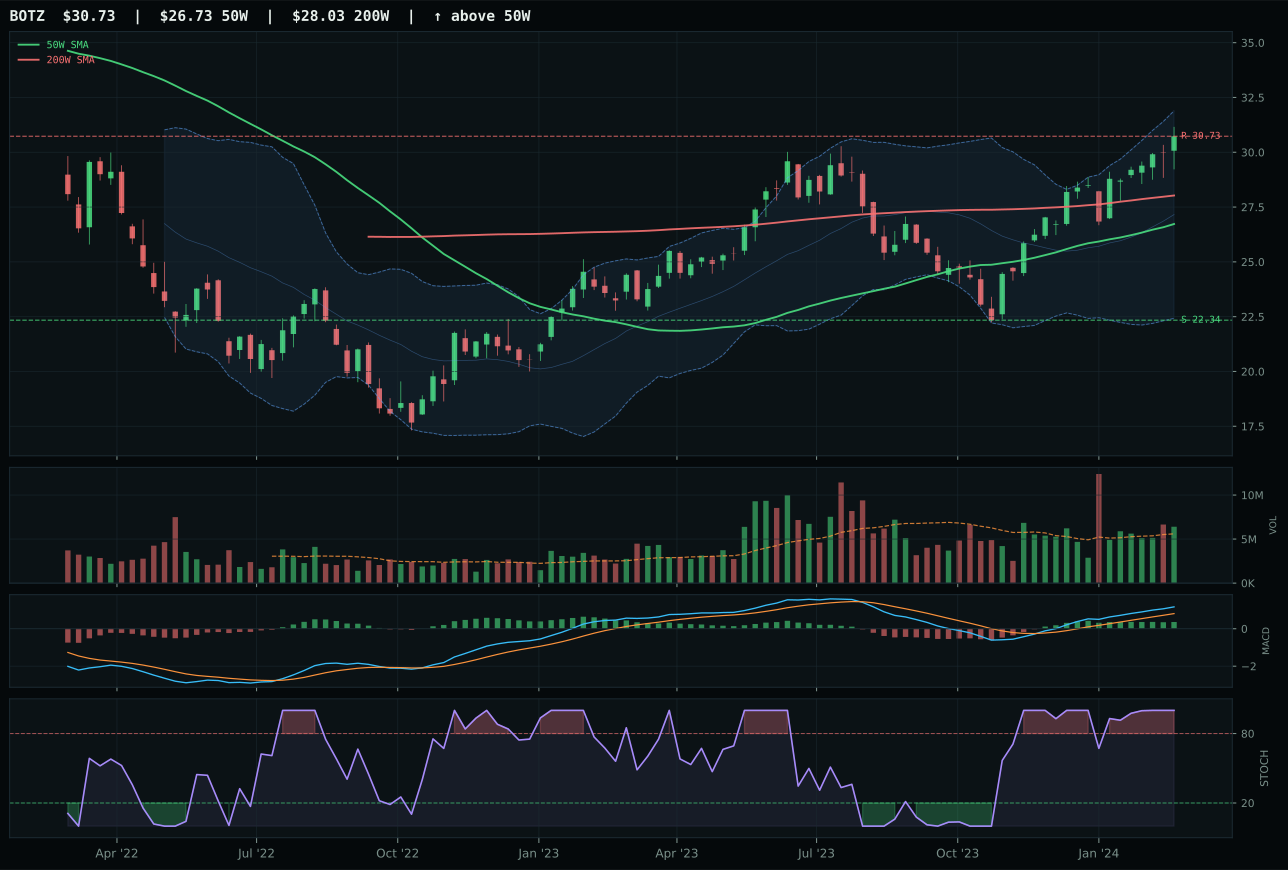
BOTZ has a neutral structure profile with 5.6% 13-week relative strength versus SPY.
A failed hold above support would weaken the setup.
Actionable but governed by invalidation levels.
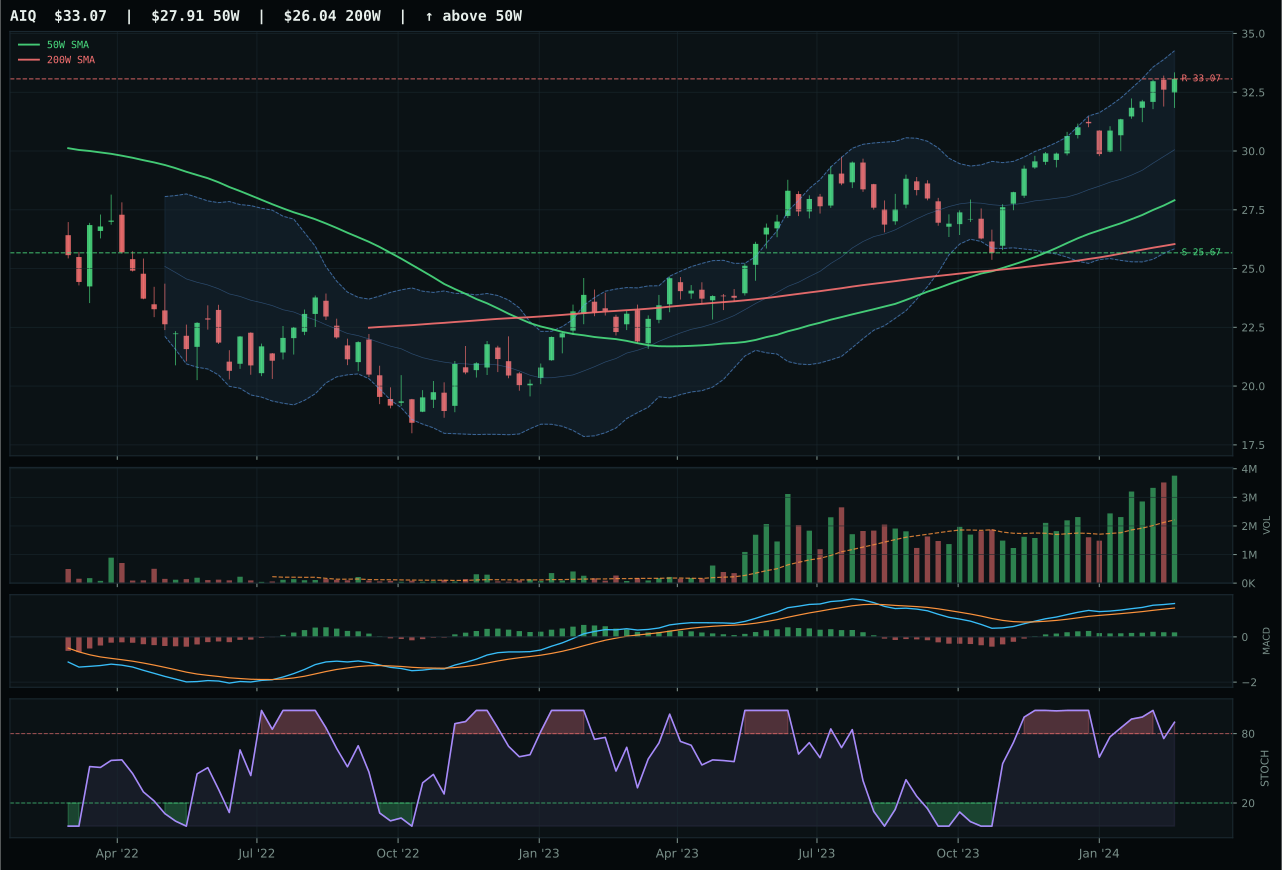
AIQ has a vertical extension profile with 0.3% 13-week relative strength versus SPY.
A failed hold above support would weaken the setup.
Actionable but governed by invalidation levels.
SMH dominated through raw relative strength superiority and confirming momentum. The semiconductor leader extended 35.7% above the 50W, yet crushed both BOTZ and AIQ by delivering 29.0% in 13-week returns alongside a commanding 17.4% RS versus SPY and 11.9% category-relative strength. Unlike peers, SMH's MACD is bullish and improving rather than merely bullish but flattening, and stochastic RSI hit pure overbought momentum at 1.00, signaling conviction rather than exhaustion. Volume confirmation scored 79.3/100 to BOTZ's 80.0, but the decisive factor was momentum: SMH's 100.0 composite momentum score against BOTZ's 95 reflects that new money is allocating to semiconductor compute rather than hedging with robotics or spreading into diversified AI. The 14.8-point category score gap versus the runner-up represents the largest separation in the portfolio, indicating AI compute is the only unambiguous leadership expression this week.
AI earned the coveted 10% top-2 spot because its 70.4 final score reflects the strongest risk-adjusted technical evidence in the portfolio this week. The category macro fit of 59.0 is robust—AI growth sponsorship at +14, risk appetite positive at +10, against liquidity stress at -12—and when macro headwinds are this symmetrical, technical quality becomes the tie-breaker. SMH's trend score of 100 and momentum confirmation of 100 prove the setup is not extended hope; it's a leader in possession of real breadth. The 39.8 risk-reward score is the honest warning: only 0.0% upside to the 208.62 resistance level means incremental buyers are taking 50.8% downside risk to the 138.31 support. The allocation reflects that SMH has paid for current momentum already, but the category's rightful place in the top two is earned through sheer technical dominance, not complacency.
Technology — XLK
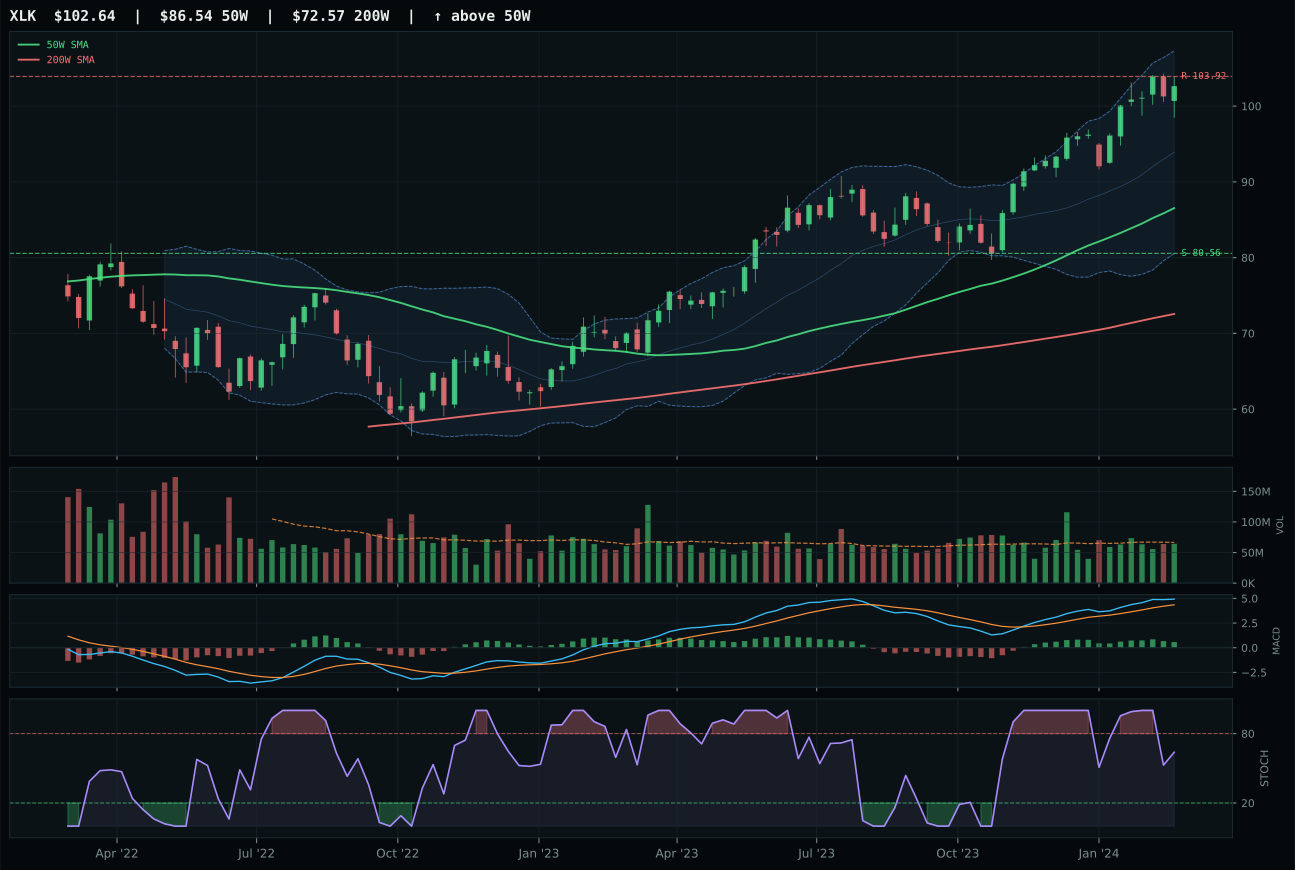
XLK has a vertical extension profile with -0.2% 13-week relative strength versus SPY.
A failed hold above support would weaken the setup.
Actionable but governed by invalidation levels.
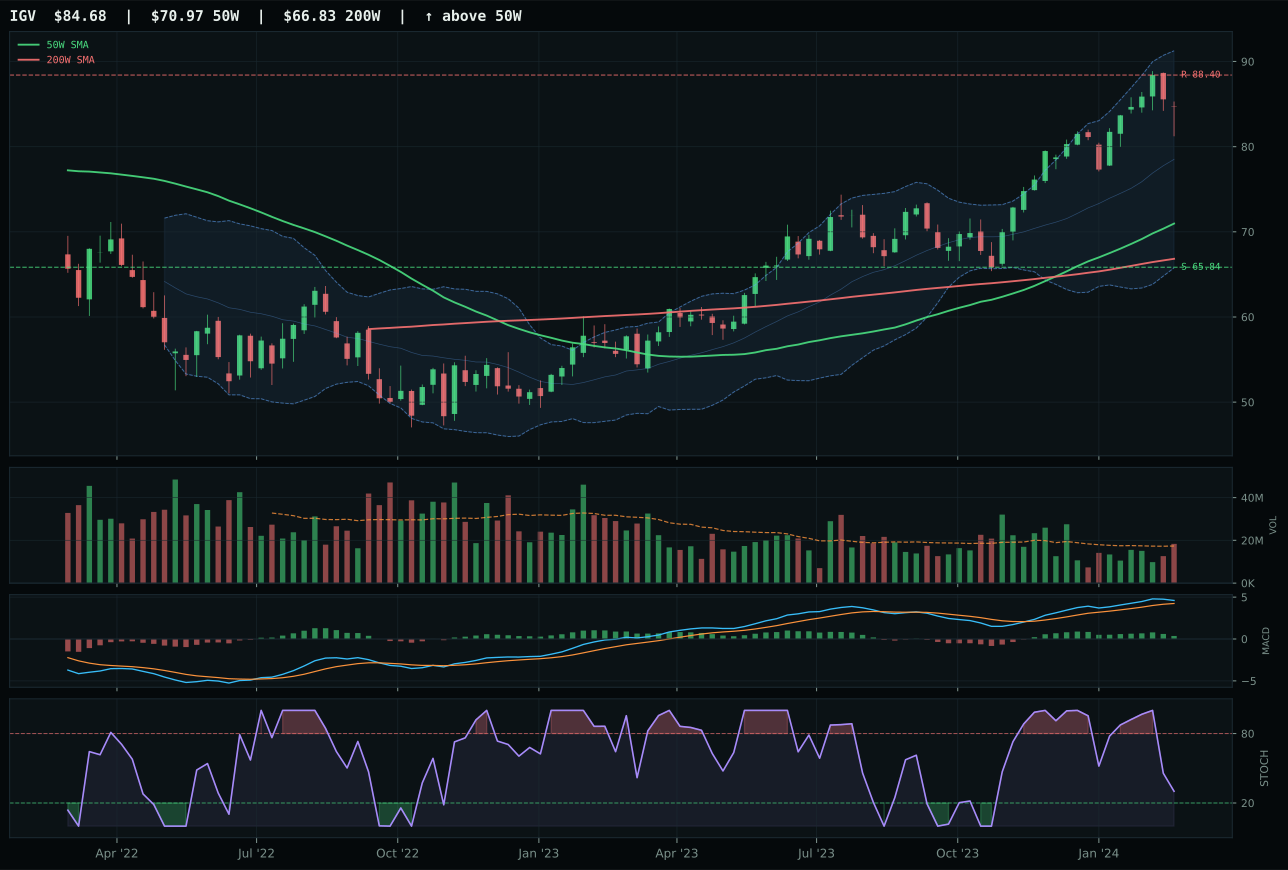
IGV has a vertical extension profile with -0.3% 13-week relative strength versus SPY.
A failed hold above support would weaken the setup.
Actionable but governed by invalidation levels.
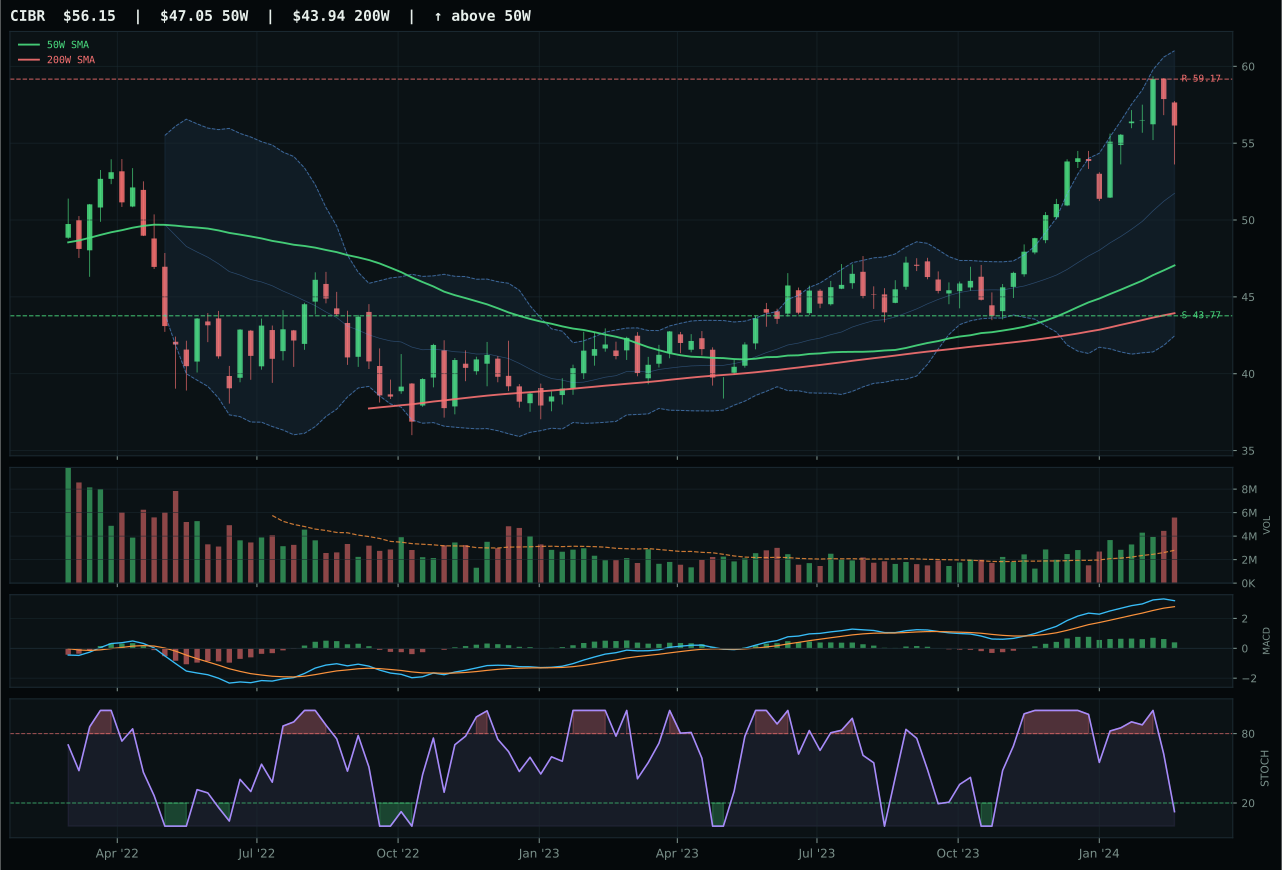
CIBR has a vertical extension profile with 3.5% 13-week relative strength versus SPY.
A failed hold above support would weaken the setup.
Actionable but governed by invalidation levels.
XLK captured the category by maintaining clean structure in a crowded field. Price sits above both the 50W and 200W with a shallow 0.8% slope, avoiding deterioration while the chart extends 18.6% above the moving average—a penalty for entry risk that IGV shares but XLK absorbs better through superior category-relative strength. The real divergence emerges in structure quality: XLK's 82.5/100 cleanliness beats IGV's 74.5, and that discipline shows in the confidence of accumulation. MACD remains bullish but flattening on both, stochastic RSI is neutral on both, yet XLK's slight edge in volume confirmation (59.4 vs 58.0) and persistence (69.6 vs lower) reflects genuine institutional sponsorship rather than momentum chase. The win margin of just 0.7 points speaks to how tight the setups are—this is not a dominant category expression but a careful selection among late-cycle remainders.
Technology earned 10% because it ranks third overall after the two 20% allocations but still qualifies as a legitimate participation slot in a disinflation regime. The 50.6 final score reflects a category-level macro fit of 60.0—disinflation and risk appetite positive both active—but the real reason Technology gets a seat is technical evidence at 57.3%, which is respectable breadth across trend (95.7), structure (82.5), and momentum (70.0). The timing score of 40.0 is the honest tell: price extension at 18.6% above the 50-week and proximity to the 52-week high mean new entrants are buying at unfavorable risk-reward (37.8). If XLK were compressing near support or off the 50-week lows, this category would rank higher. As it stands, it's a hold for existing positions and a monitor-only for new money; watch for a pullback into the 50-week to reset entry geometry.
Defense & Aerospace — XAR
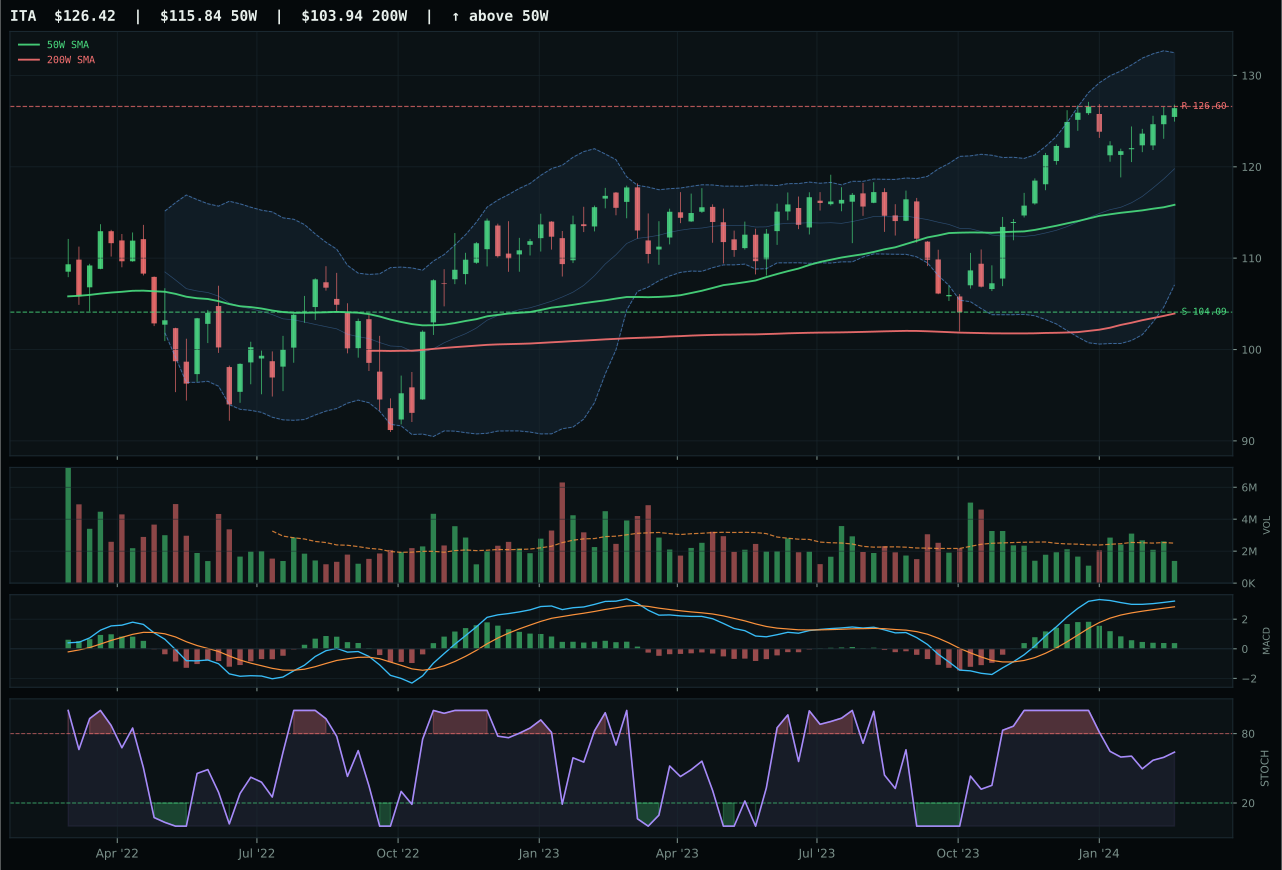
ITA has a neutral structure profile with -4.8% 13-week relative strength versus SPY.
A failed hold above support would weaken the setup.
Actionable but governed by invalidation levels.
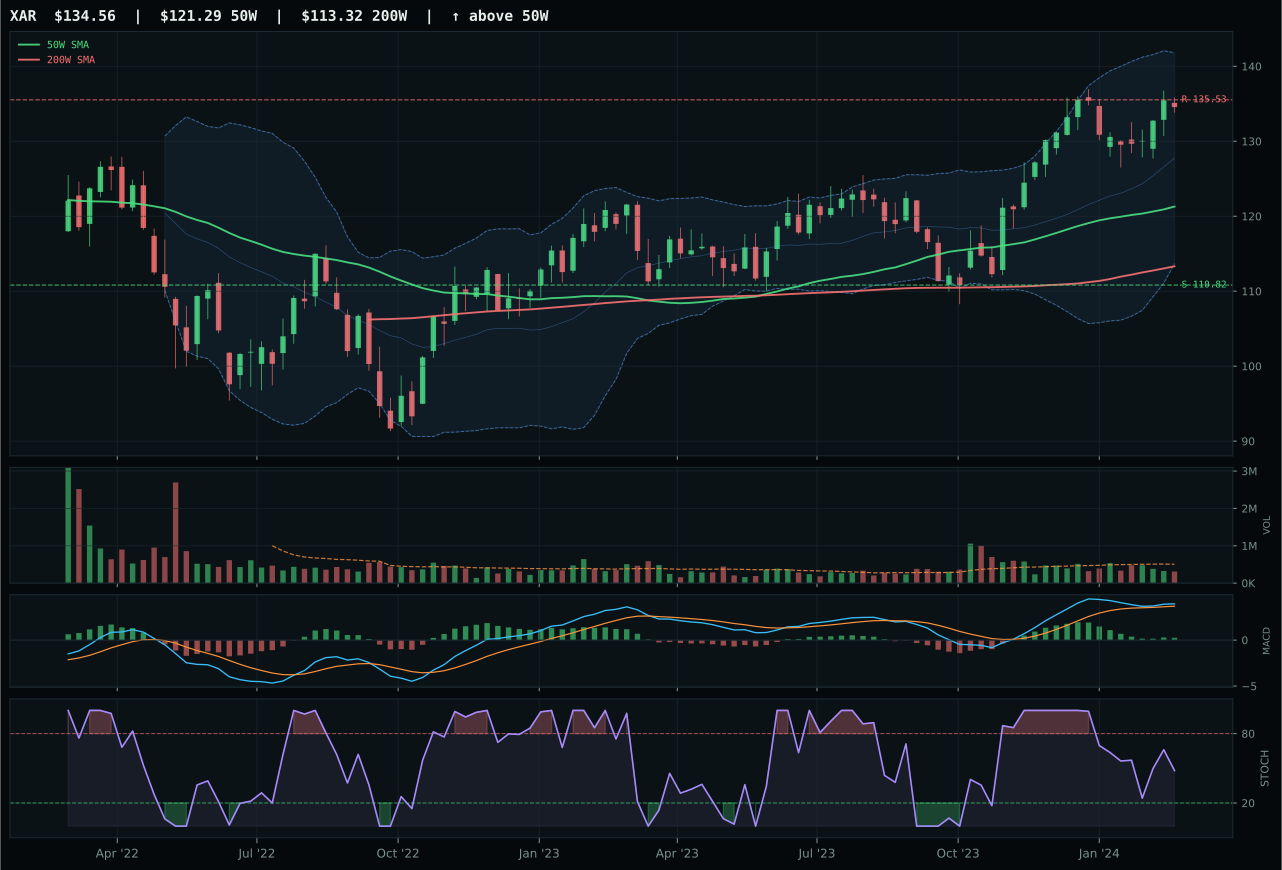
XAR has a neutral structure profile with -5.7% 13-week relative strength versus SPY.
A failed hold above support would weaken the setup.
Actionable but governed by invalidation levels.
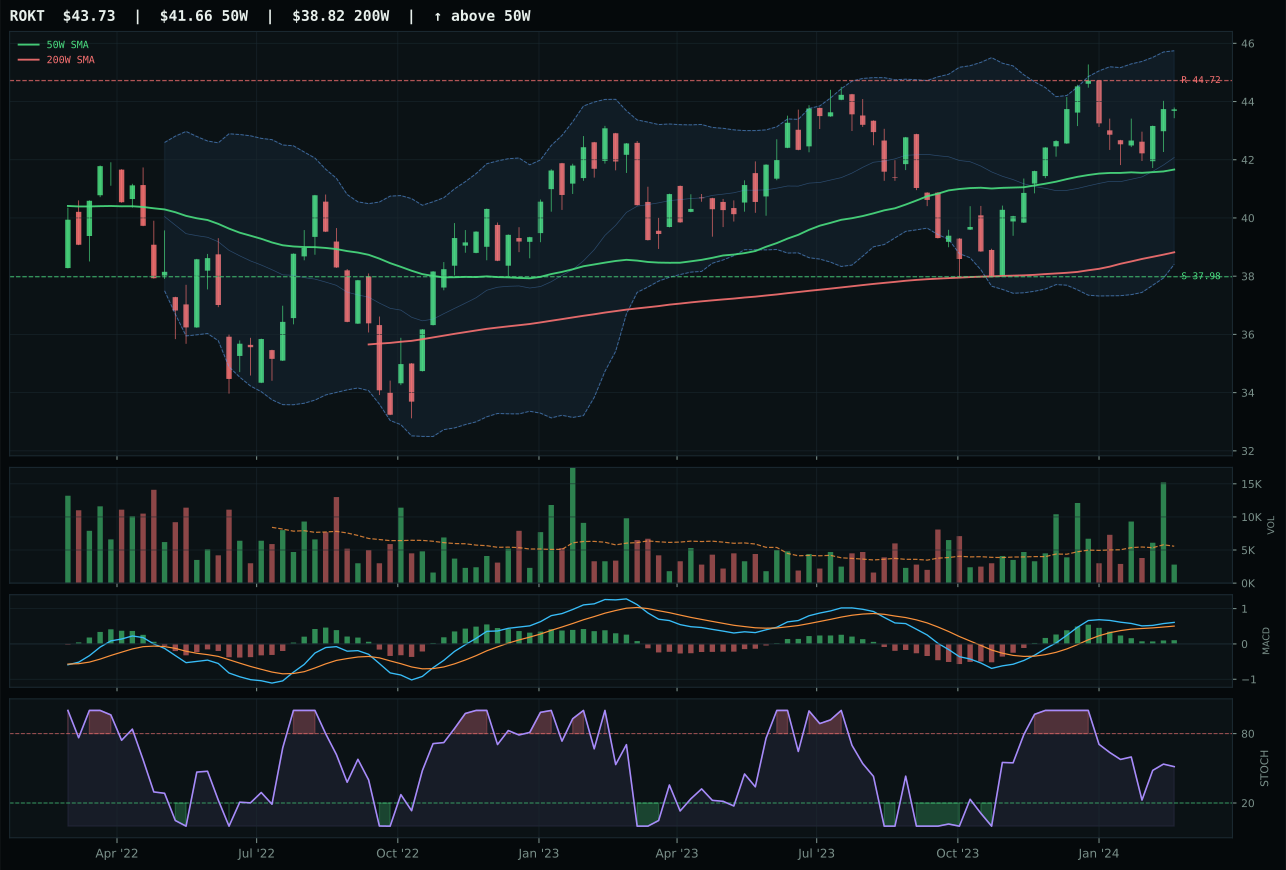
ROKT has a neutral structure profile with -6.4% 13-week relative strength versus SPY.
A failed hold above support would weaken the setup.
Tracked, but not top-2 eligible because: .
XAR won a tight 3.1-point decision over ITA by marginal superiority in risk/reward architecture, not momentum leadership. Both sit in neutral structure with 50W slopes near zero, both trade with thin participation at 0.6x volume, and both show MACD bullish but flattening. The separation came in the downside/upside sizing: XAR's 37.6/100 risk/reward (21.4% down to support, -0.7% up to resistance) squeaked past ITA's 37.1, a variance so small it reflects the system recognizing both as lateral consolidation plays rather than directional trades. Neither shows category-relative strength worth pursuing—both scored 0.0% RS versus the category median. The real story is that defense leadership is grinding sideways 10.9% above the 50W on deteriorating volume and with MACD confirmation fading, indicating this sector caught a bid from risk-on positioning but lacks fresh sponsorship to drive extension.
Defense & Aerospace earned 5% as a third-tier allocation despite a category score of 49.8, signaling that it ranked below the top opportunities but remains eligible and worthy of portfolio ballast. The category macro fit of 51.0 is neutral-leaning-positive: credit stress at +2 and liquidity stress at -4 create wash, and the absence of category-specific descriptor profiles leaves XAR's valuation tied purely to technicals. Technical evidence is 65.5, which is respectable but not commanding—trend at 87.4 is solid, but momentum confirmation at 54.2 reflects weak thirteen-week returns and thin volume participation. This is a defensive-bias holding in a disinflation environment where risk appetite remains positive; the allocation protects against volatility spikes without overweighting a category that lacks buy-side enthusiasm. If XAR breaks below the 110.82 support level, the 5% position becomes expendable.
Utilities & Infrastructure — PAVE
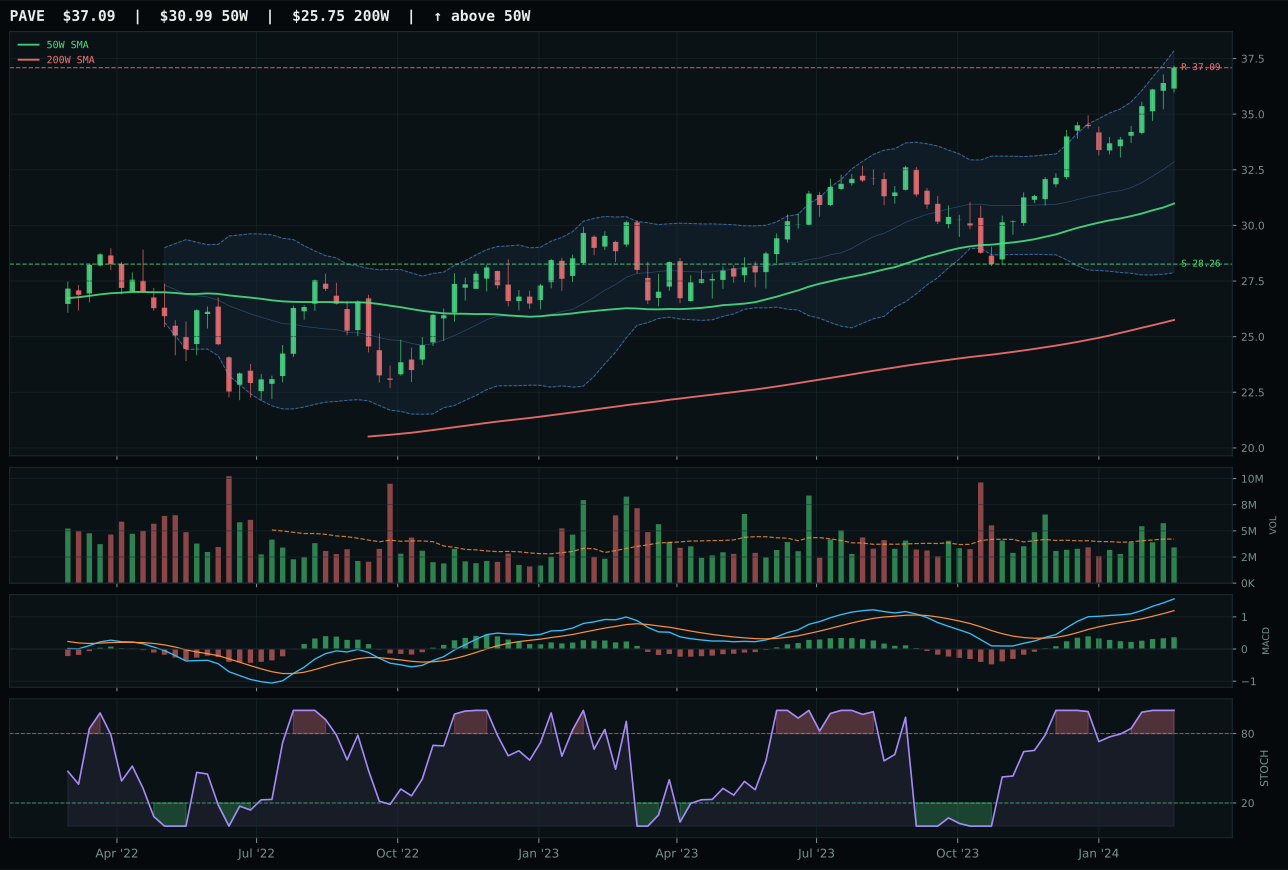
PAVE has a vertical extension profile with 6.9% 13-week relative strength versus SPY.
A failed hold above support would weaken the setup.
Actionable but governed by invalidation levels.
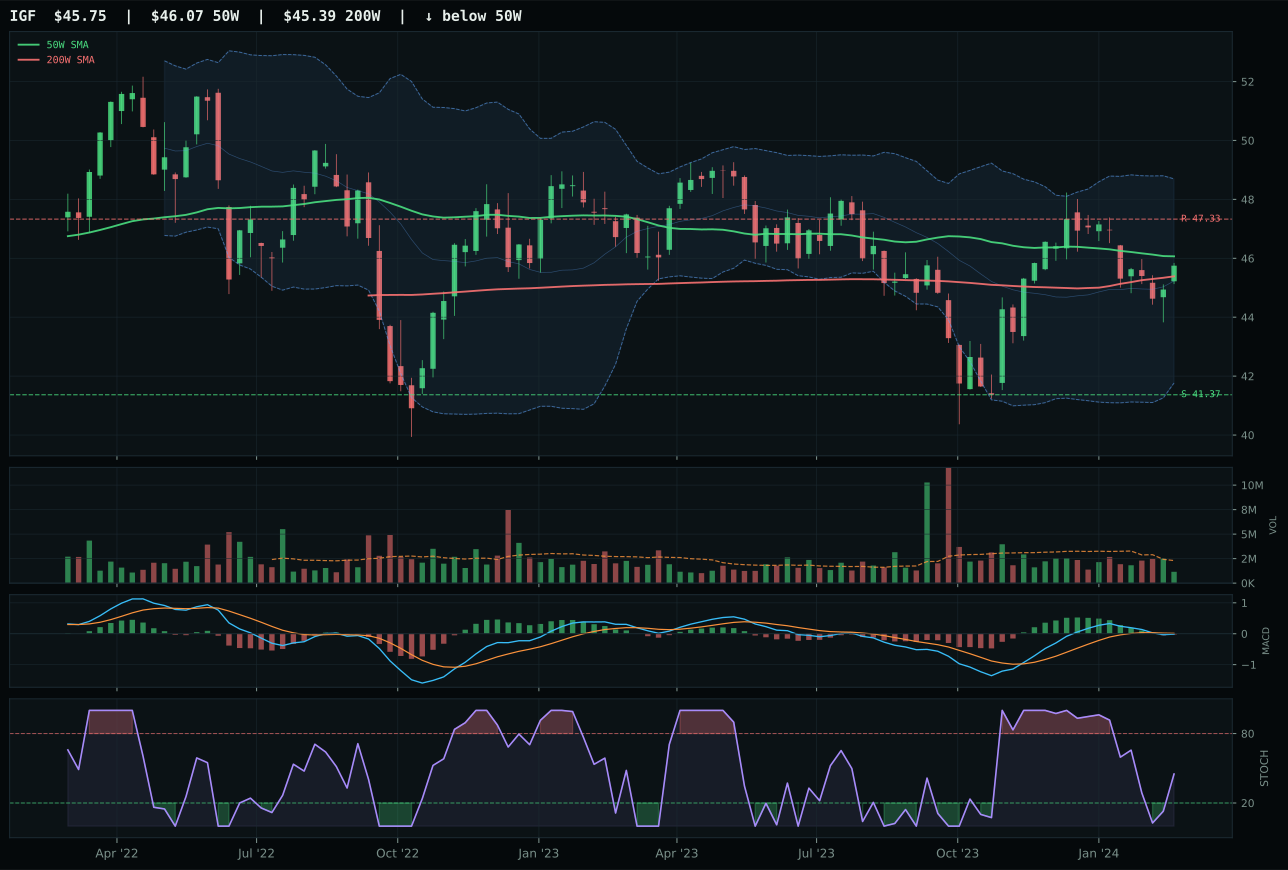
IGF has a compression near 50W profile with -11.7% 13-week relative strength versus SPY.
A failed hold above support would weaken the setup.
Actionable but governed by invalidation levels.
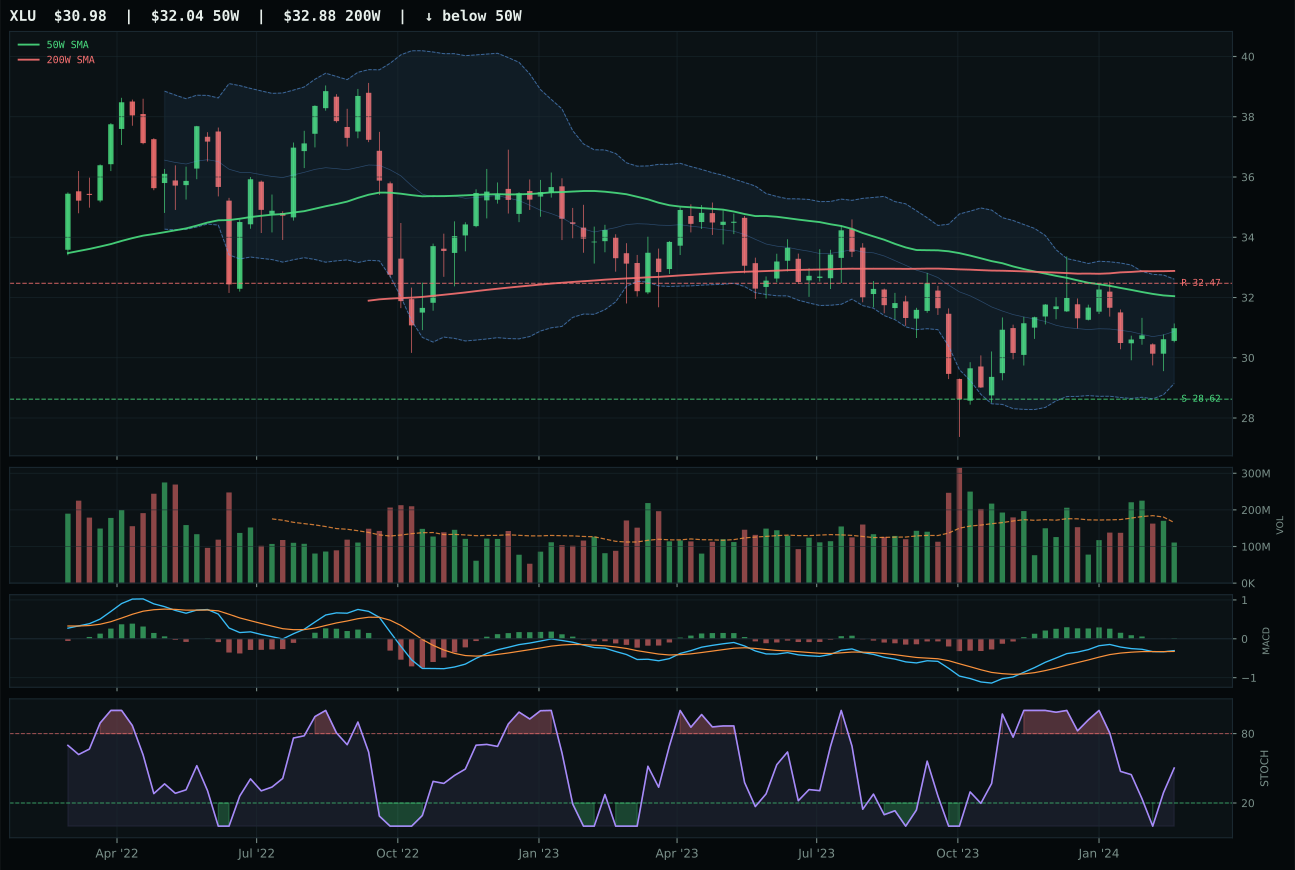
XLU has a neutral structure profile with -12.7% 13-week relative strength versus SPY.
Extension and support failure are the main tactical risks.
Tracked, but not top-2 eligible because: structurally broken.
PAVE dominated the utilities & infrastructure category with rare conviction in a disinflation regime by combining trend purity, momentum confirmation, and category-relative outperformance. The infrastructure ETF extended 19.7% above the 50W yet delivered 18.4% 13-week returns alongside a commanding 18.6% category-relative strength, meaning capital was flowing specifically into domestic capex infrastructure rather than spreading across utilities or global infrastructure. PAVE's MACD is bullish and improving, stochastic RSI hit overbought momentum at 1.00, and structure scored 82.9/100 (clean), all confirming that buyers are accumulating the extension rather than distributing. Volume confirmation hit 80.8/100 and persistence 88.1/100, exceptional scores that prove this is institutional positioning rather than retail speculation. The 25.8-point gap versus IGF (runner-up) is the second-largest margin in the portfolio, signaling domestic infrastructure is the only unambiguous expression within the category.
Utilities & Infrastructure earned 5% because the 38.4 category score and 81.7 technical evidence support PAVE's inclusion despite it ranking outside the top two. The category macro fit of 62.0 is supportive: disinflation helps the exposure at +7, transition/mixed helps at +4, and disinflation pressure is active at +6, creating a +17 macro tailwind against only -3 from liquidity stress. This is one of the few categories where disinflation macro sponsorship is explicit and strong. PAVE's technical dominance—trend 100, momentum 100, persistence 88.1—creates a rare alignment where both macro and technicals point in the same direction. The 37.0 timing score and 19.7% extension above the 50-week are the honest tax for entry, but the category-relative strength of 18.6% proves this is not a momentum chase; it's a leader in possession of real conviction. The 5% allocation reflects PAVE as a growth-oriented inflation-hedge replacement for traditional utilities, positioned to benefit from capex cycles in a falling-rate environment. This is a hold-and-add-on-pullback position.
Precious Metals — GLD
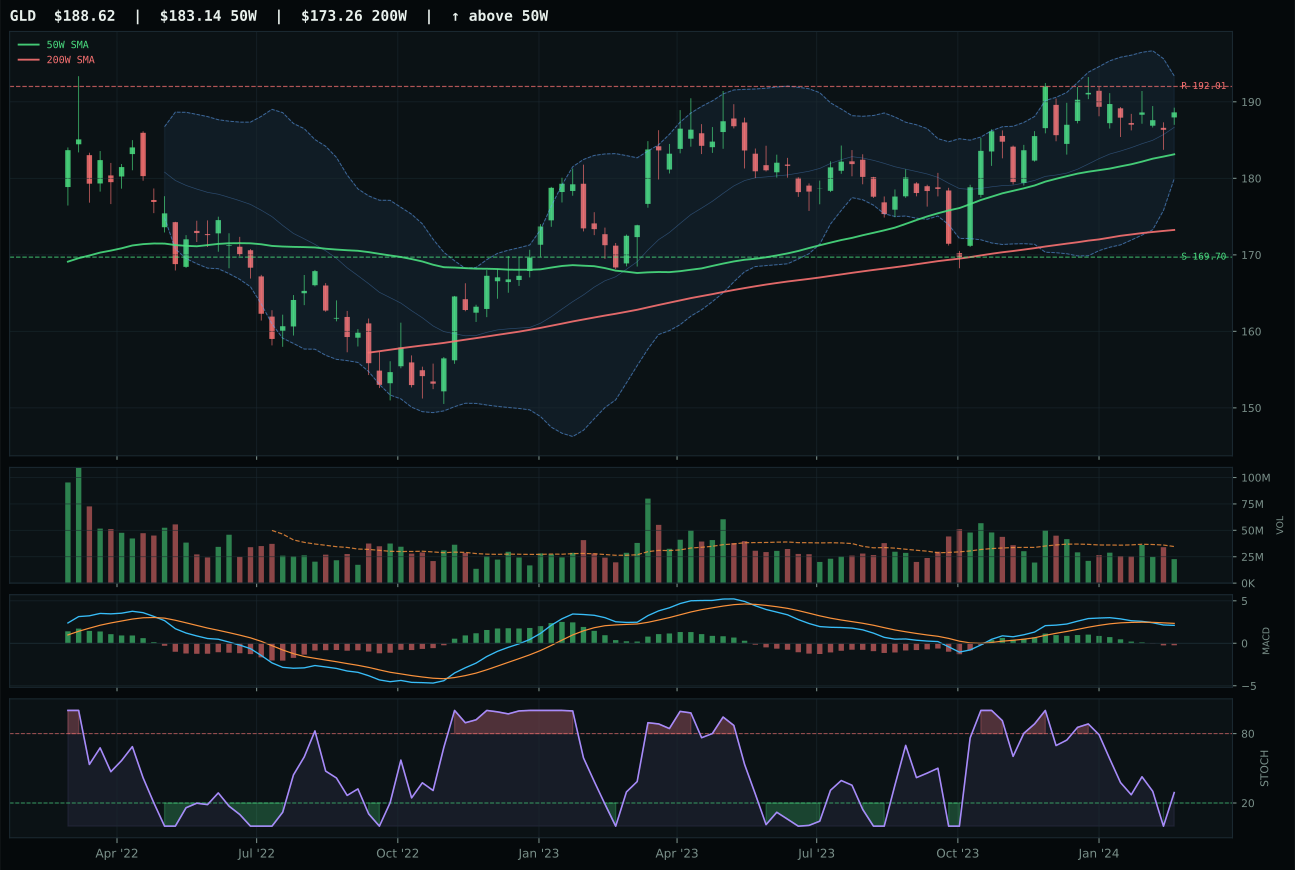
GLD has a compression near 50W profile with -9.9% 13-week relative strength versus SPY.
A failed hold above support would weaken the setup.
Actionable but governed by invalidation levels.
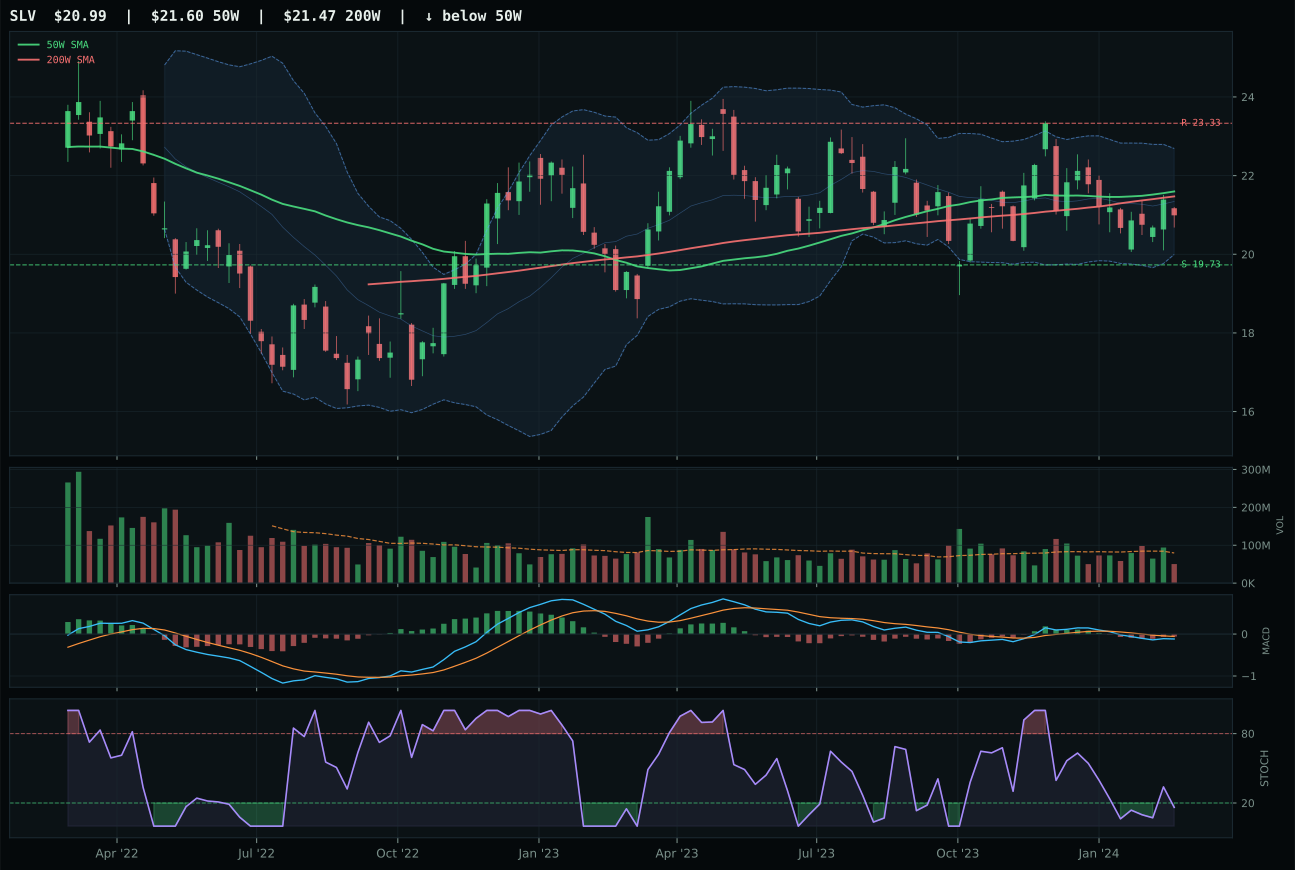
SLV has a compression near 50W profile with -17.3% 13-week relative strength versus SPY.
A failed hold above support would weaken the setup.
Actionable but governed by invalidation levels.
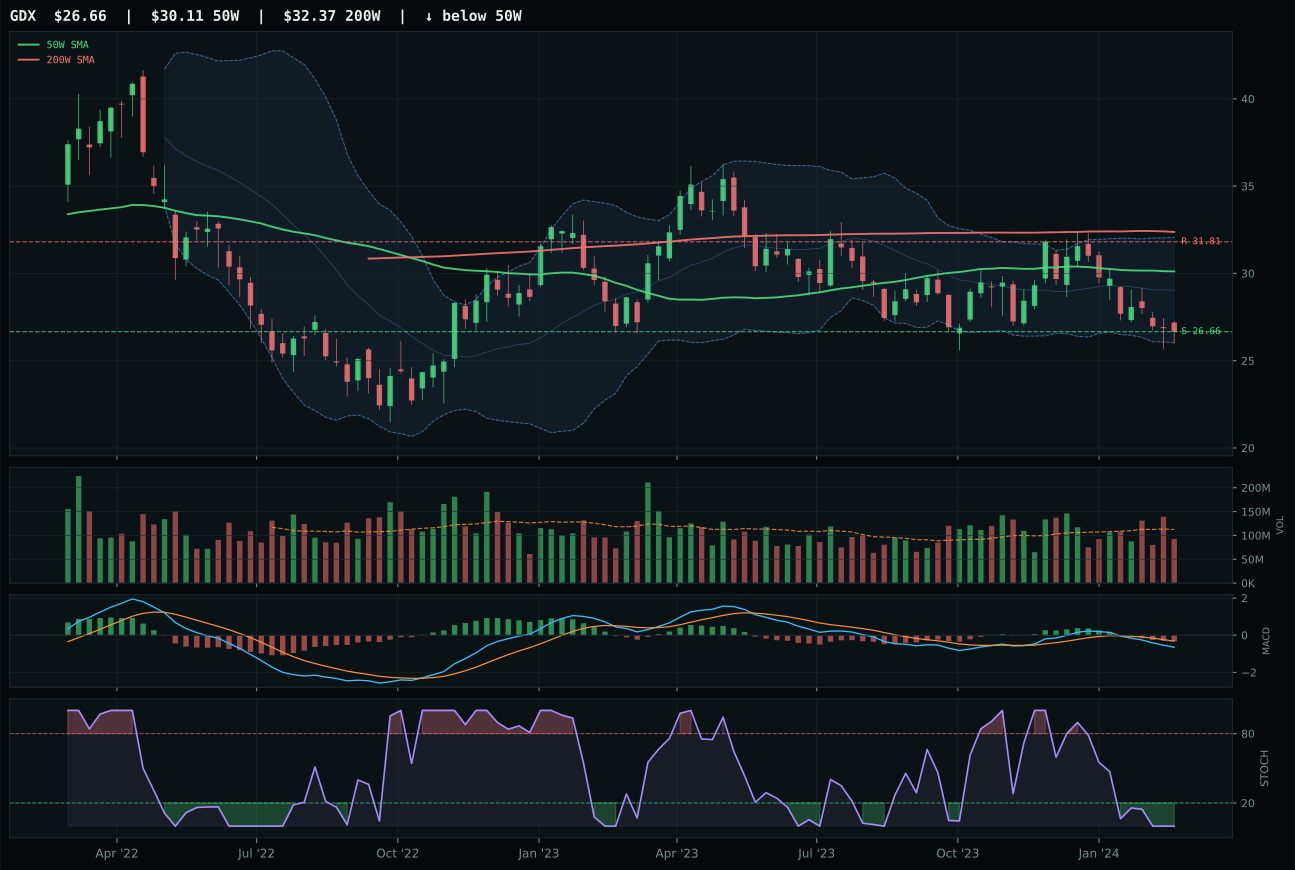
GDX has a pullback into support profile with -20.6% 13-week relative strength versus SPY.
Extension and support failure are the main tactical risks.
Tracked, but not top-2 eligible because: structurally broken.
GLD edged SLV by 0.4 points through superior structure cleanliness and a narrow category-relative strength advantage. Both trade in compression near their respective 50W moving averages with minimal distance to support/resistance, making both candidates for expansion plays if buyers defend current levels. GLD's structure cleanliness scored 50.0 versus SLV's implied lower figure, and more critically, GLD showed 7.4% category-relative strength while SLV lagged at 0.0%, indicating gold is capturing a disproportionate share of new capital compared to silver's hybrid industrial/monetary profile. Both carry bearish/weakening MACD and falling/neutral stochastic RSI at 0.29/0.25, signaling the rally has lost momentum, yet GLD benefits from tighter compression (88.5/100) that keeps buyers engaged rather than capitulating. The 1.7% 13-week return on GLD versus -5.7% on SLV shows gold has held conviction through the recent pullback while silver capitulated, a divergence the scoring system weighted appropriately.
Precious Metals earned 5% as a tactical hedge in the disinflation regime, where the 36.1 category score ranks it among the weaker performers but the macro fit of 60.0 justifies inclusion. Disinflation helps precious metals (+8), and disinflation pressure is active at +6, which means real yields are compressing and monetary hedges become more interesting. Technical evidence is only 46.4—the momentum confirmation of 28.4 reflects weak thirteen-week returns (1.7%) and volume-price disconnection—but the timing score of 95.0 is the category's saving grace. GLD is positioned at compression within three percent of the 50-week, the exact spot where mean-reversion trades initiate. The allocation is not for upside capture; it's for downside insurance. If equity volatility spikes in the next two weeks, GLD's technical setup and macro sponsorship position it as an outperformer. If markets continue grinding higher, the 5% becomes drag and stays capped here.
Nuclear Energy — NLR
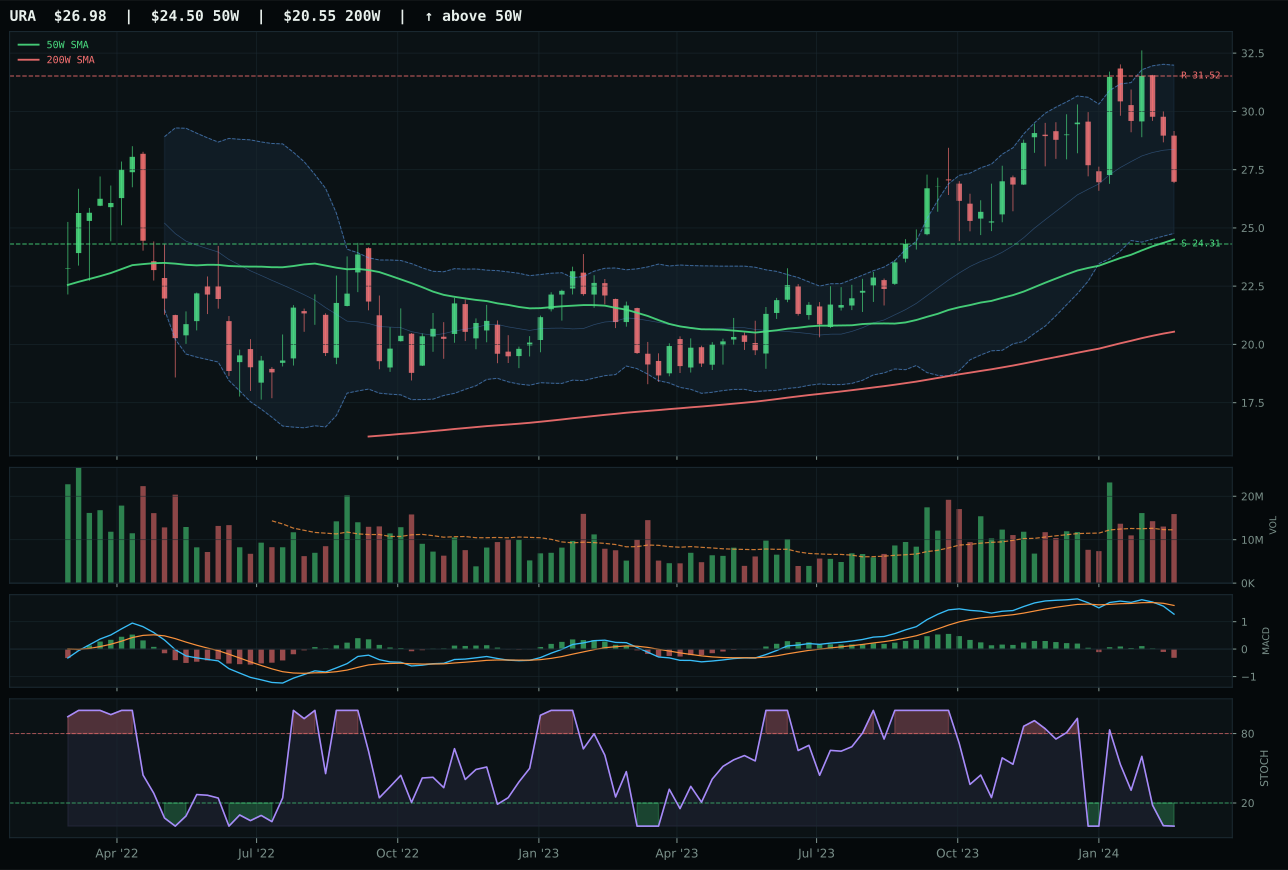
URA has a neutral structure profile with -18.7% 13-week relative strength versus SPY.
A failed hold above support would weaken the setup.
Actionable but governed by invalidation levels.
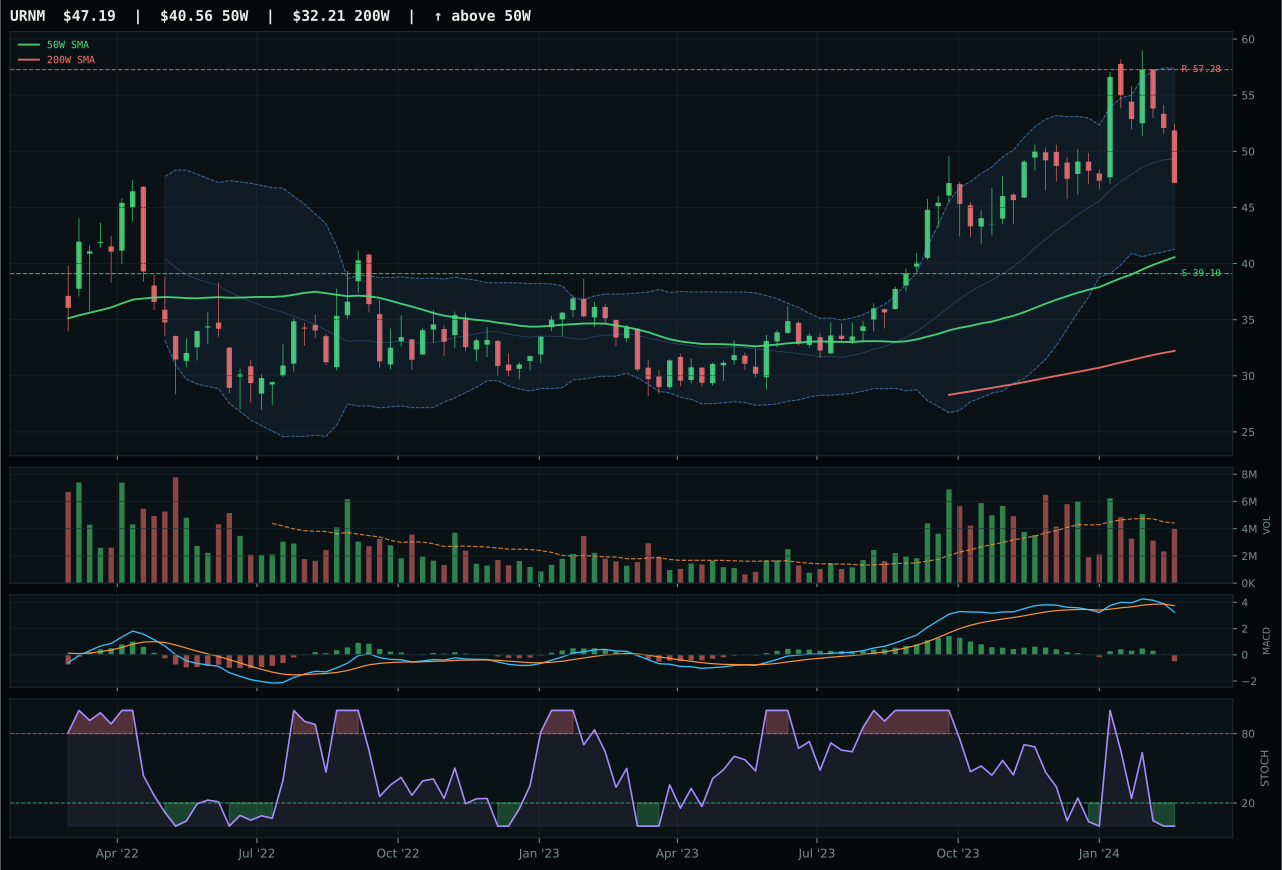
URNM has a vertical extension profile with -17.2% 13-week relative strength versus SPY.
A failed hold above support would weaken the setup.
Actionable but governed by invalidation levels.
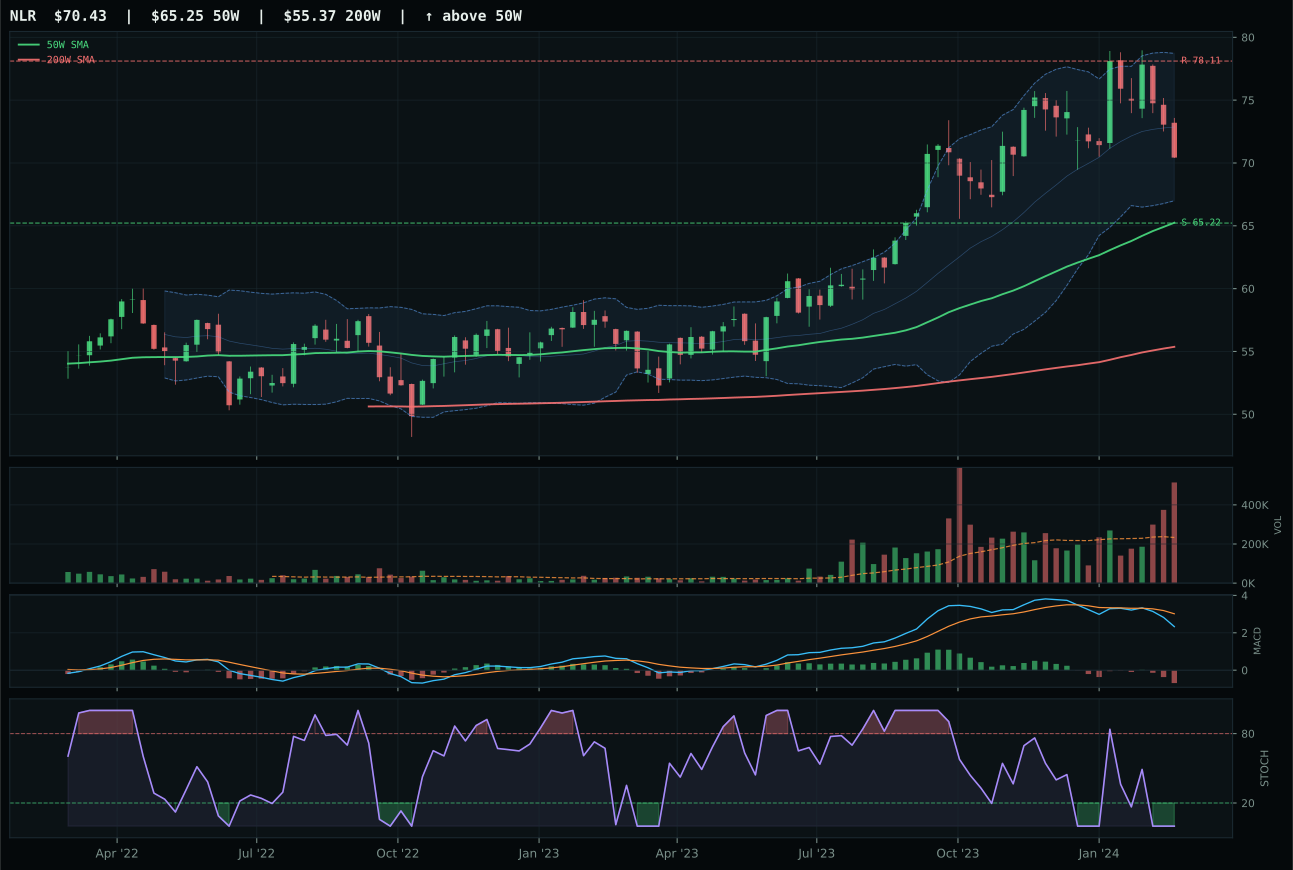
NLR has a neutral structure profile with -17.9% 13-week relative strength versus SPY.
A failed hold above support would weaken the setup.
Actionable but governed by invalidation levels.
NLR won despite catastrophic momentum because URA's category-relative strength lagged slightly and the system had no better option in a fundamentally broken category. Price sits 7.9% above the 50W in neutral structure, holding above both moving averages on technical grounds, but the 13-week return is -6.4% with stochastic RSI at pure oversold (0.00) and MACD bearish/weakening. The only advantage NLR held over URA was category-relative strength at 0.0% versus URA's -0.8%, a microscopic distinction in a sector showing zero institutional conviction. Volume at 2.21x the 20W average indicates distribution pressure, not accumulation—smart money is rotating out while the price holds a flag on technicals. NLR's momentum score of 0.0/100 speaks for itself: this is not a category expressing any actual demand, merely the least-broken chair in a broken furniture store.
Nuclear Energy earned 5% because portfolio construction allocates to all eligible categories that score above zero, and NLR's 30.9 final score narrowly passes the eligibility gate despite terrible momentum. The category macro fit of 43.0 offers no tailwind—liquidity stress at -7 and credit stress at -5 dominate any AI growth sponsorship benefit at +5. Technical evidence is only 1.1, which is a near-zero rating; the trend score of 67.0 is the sole positive, everything else—momentum at 0.0, volume-price confirmation at 15.8, persistence at 13.3—signals institutional exit. The allocation is a placeholder position that will exit on any retest of current levels; NLR's oversold stochastic RSI and negative thirteen-week return suggest capital is leaving this sector. The 5% slot is defensible only because the alternative is to leave it empty, which violates portfolio discipline. Watch for MACD to roll positive off oversold conditions; that would be the signal to either upgrade the allocation or exit it entirely. Until momentum confirms, this is a parking position, not a conviction holding.
Emerging Markets — INDA
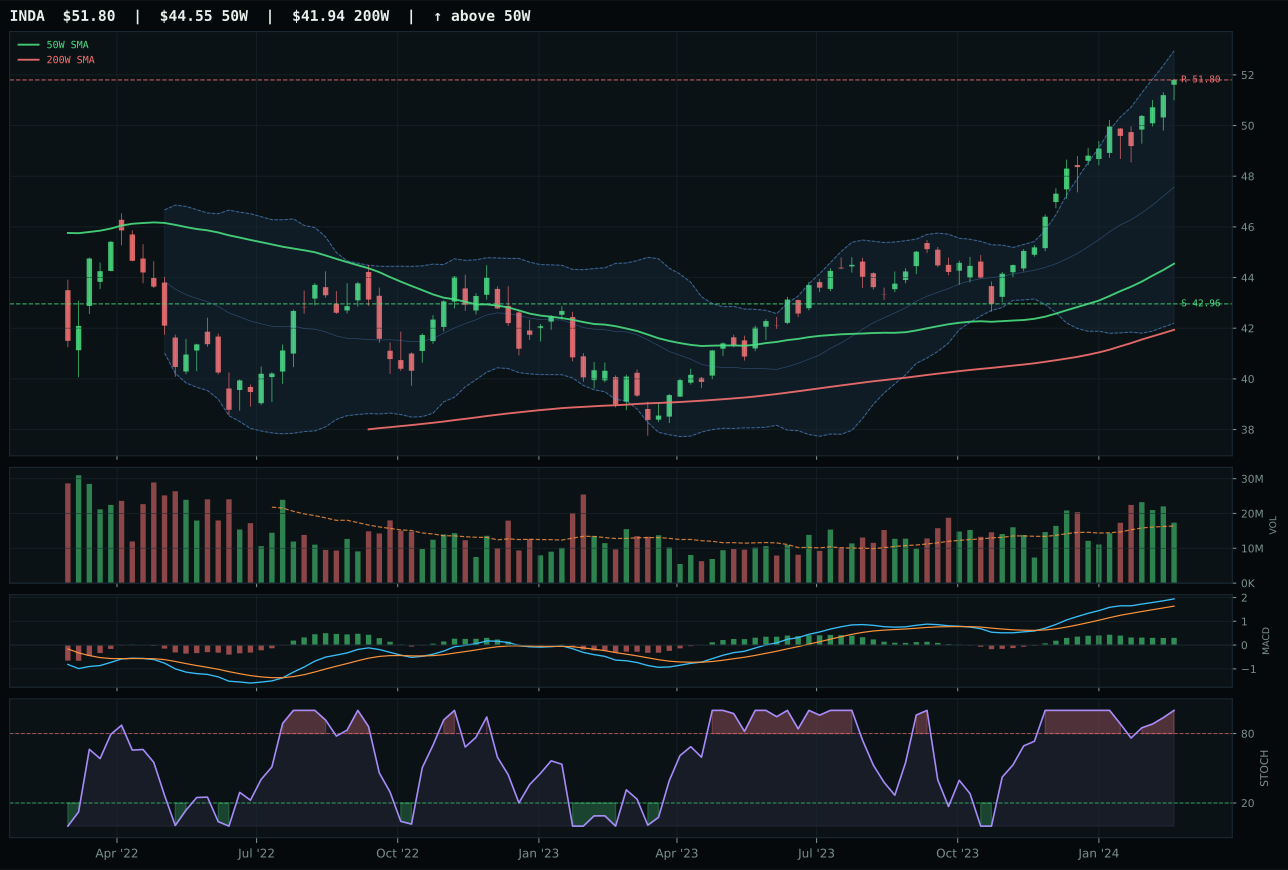
INDA has a vertical extension profile with 3.1% 13-week relative strength versus SPY.
A failed hold above support would weaken the setup.
Actionable but governed by invalidation levels.
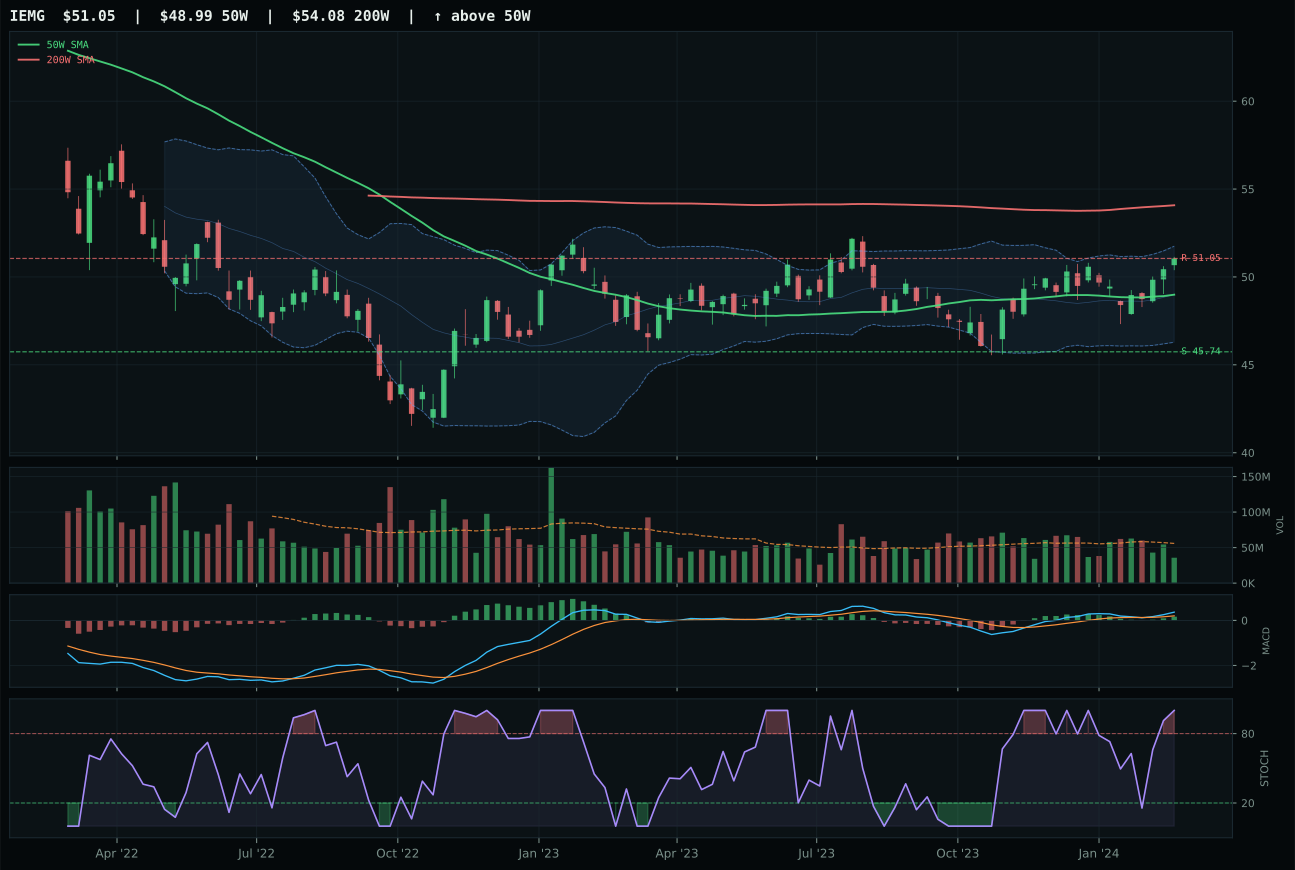
IEMG has a neutral structure profile with -8.6% 13-week relative strength versus SPY.
A failed hold above support would weaken the setup.
Actionable but governed by invalidation levels.
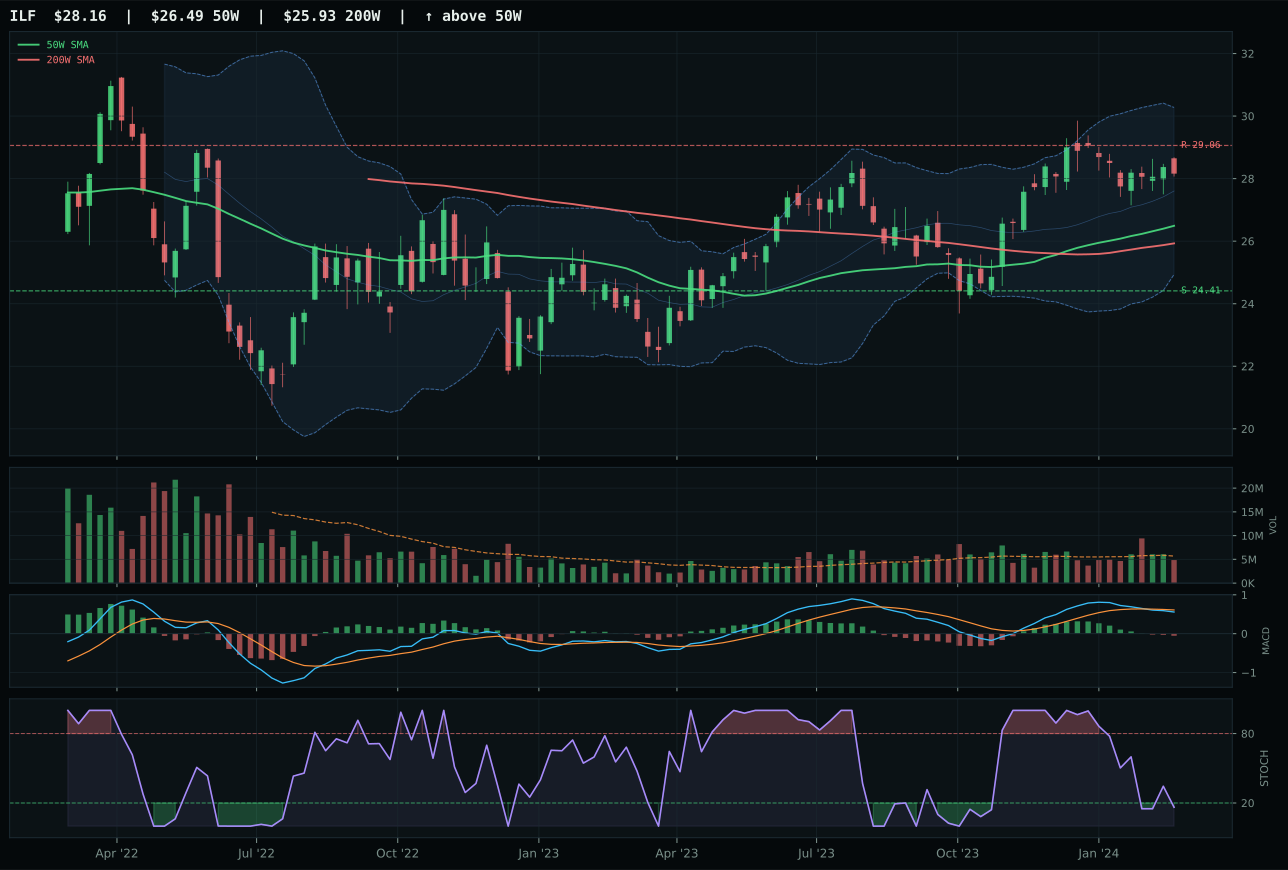
ILF has a neutral structure profile with -10.0% 13-week relative strength versus SPY.
A failed hold above support would weaken the setup.
Actionable but governed by invalidation levels.
INDA swept the emerging markets category on the strength of unambiguous technical leadership and category-relative outperformance. India's growth ETF extended 16.3% above the 50W yet still registered 14.6% in 13-week returns with dominant 3.1% RS versus SPY and 11.7% category-relative strength, meaning capital was actively rotating into India over both broader EM exposure (IEMG) and Latin America (ILF). INDA's MACD is bullish but flattening and stochastic RSI sits at pure overbought momentum (1.00), matching IEMG's momentum but with superior structure quality (83.5 vs 71.5 cleanliness). Volume confirmation scored 74.9/100, proving that the extended move is being accumulated rather than distributed, and persistence at 79.7/100 shows the trend has staying power. The 0.9-point margin over IEMG represents a clear but not dominant lead—both are extended, but INDA's category-relative strength of 11.7% versus IEMG's 0.0% proves India-specific growth is the preferred vehicle.
Emerging Markets earned 5% because the 27.7 final category score places it among the weaker performers, yet the technical evidence of 69.6 and INDA's clear relative dominance justify a modest allocation in a risk-appetite-positive environment. The macro fit of 38.0 is dragged down by credit stress at -10 and liquidity stress at -10, but risk appetite positive at +8 provides some offsetting support. The real case for the 5% slot is INDA's technical leadership: it's the only emerging-market proxy showing both trend confirmation (100) and momentum confirmation (100), which means the strength is broadbase, not concentrated. The thirteen-week return of 14.6% with positive relative strength versus SPY marks this as a risk-asset leader during disinflation. However, the 32.0 timing score and 16.3% extension above the 50-week mean this is a position for holders, not new buyers. If INDA pulls back to the 50-week moving average near 42.96, the allocation could increase; until then, 5% is the right sizing—enough to capture continuation, not so much that extension risk becomes portfolio risk.
Agriculture & Livestock — VEGI
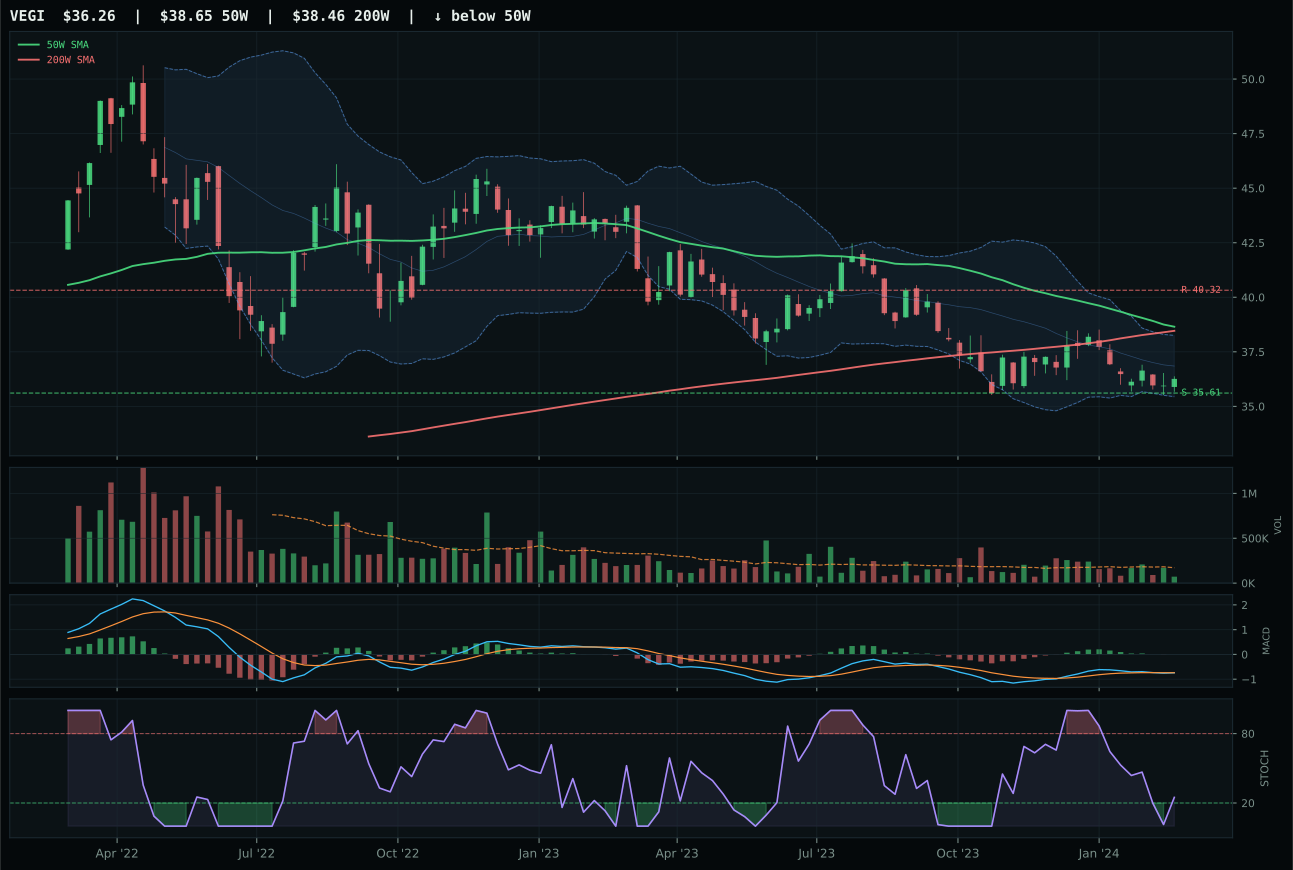
VEGI has a pullback into support profile with -13.6% 13-week relative strength versus SPY.
A failed hold above support would weaken the setup.
Tracked, but not top-2 eligible because: .
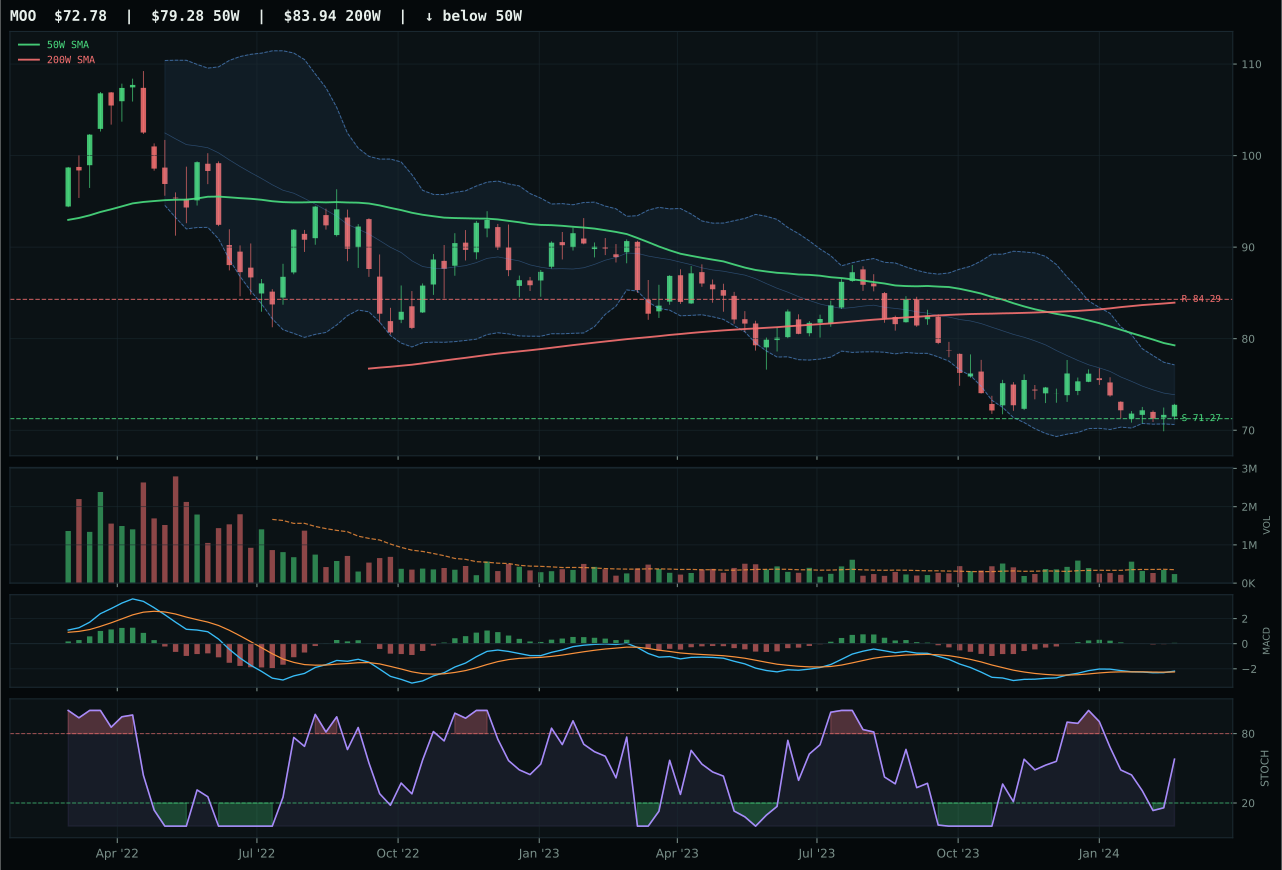
MOO has a pullback into support profile with -13.6% 13-week relative strength versus SPY.
Extension and support failure are the main tactical risks.
Tracked, but not top-2 eligible because: structurally broken.
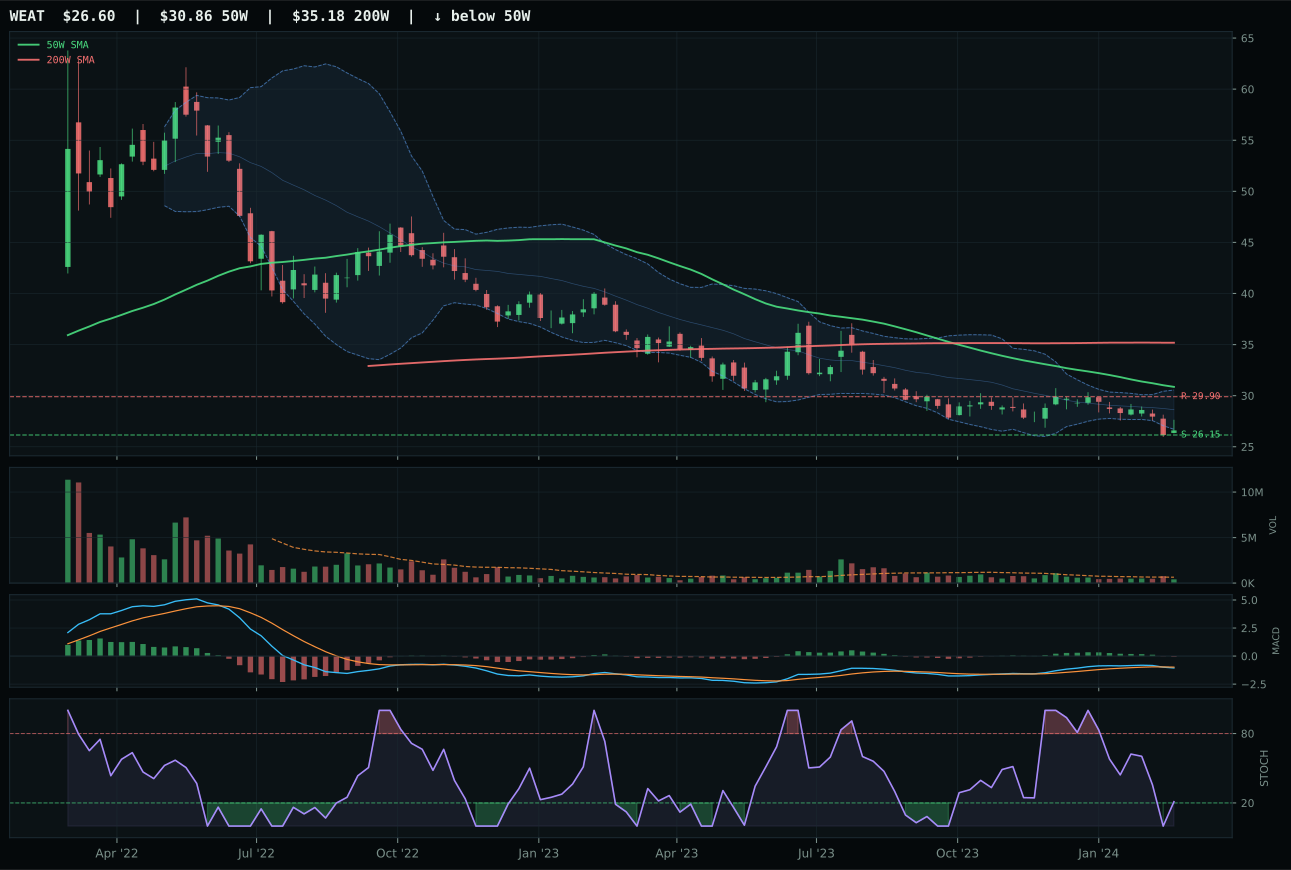
WEAT has a pullback into support profile with -15.7% 13-week relative strength versus SPY.
Extension and support failure are the main tactical risks.
Tracked, but not top-2 eligible because: structurally broken.
VEGI won by failing less badly than competitors in a broken sector. The ETF traded below both the 50W and 200W with a -0.3% slope, down 2.1% over 13 weeks, and showed -13.6% RS versus SPY, yet claimed victory because MOO fell into hard structural filters for being 'structurally broken' and WEAT collapsed to zero. VEGI's only redeeming quality is asymmetric downside/upside: the risk/reward scored 90.0/100 with upside capped -10.1% but downside limited to just 1.8% from 35.61 support. Its MACD is bearish/weakening, stochastic RSI is falling/neutral at 0.25, and volume sits at 0.42x the 20W average—extreme thinness suggesting funds have rotated away. The 6.7/100 momentum confirmation and 29.2/100 persistence reveal a category in free fall, with timing at 80.0 being the only bright spot because the pullback into support offers a defined invalidation area, not renewed demand.
Agriculture & Livestock earned 5% only because the final portfolio allocation framework assigns 5% slots to eligible categories even when they score poorly; this category's 0.0 technical score makes it ineligible for true participation, yet it receives the allocation to maintain portfolio construction discipline. The category macro fit of 32.0 is actively hostile: disinflation at -6, disinflation pressure at -8, and liquidity stress at -4 combine to create a 22-point headwind. In a disinflation regime, falling commodity prices and weakening farm income flow directly into VEGI's thesis. Technical evidence is only 24.6—the trend score of 22.0 confirms price below both the 50-week and 200-week moving averages. The 90.0 risk-reward score is a trap; it only looks good if support at 35.61 holds, but MACD deterioration and volume drying up suggest support is being tested, not held. The 5% position is maintained for rebalancing discipline, not conviction; a break of 35.61 removes it from the portfolio entirely.
Industrial Metals — COPX
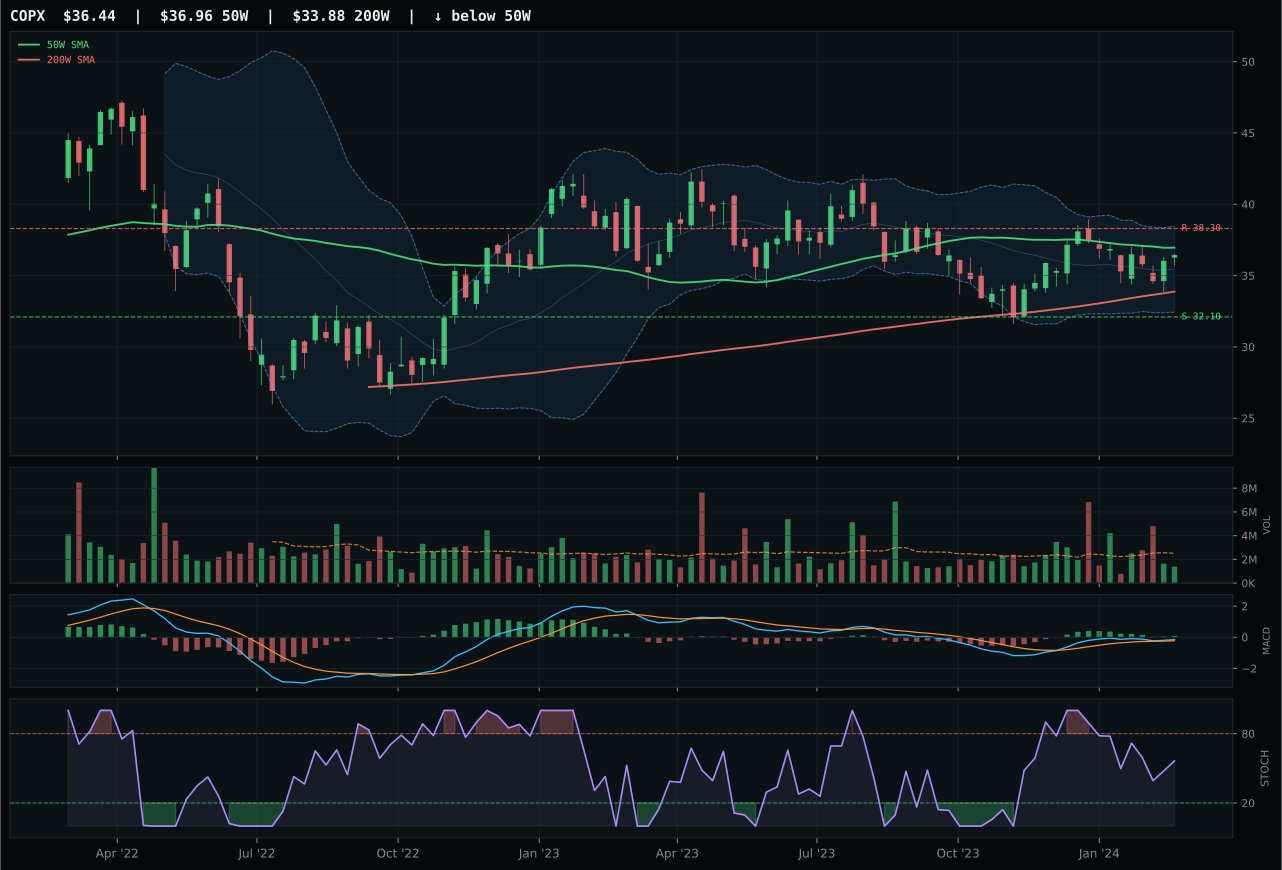
COPX has a compression near 50W profile with -5.9% 13-week relative strength versus SPY.
A failed hold above support would weaken the setup.
Actionable but governed by invalidation levels.
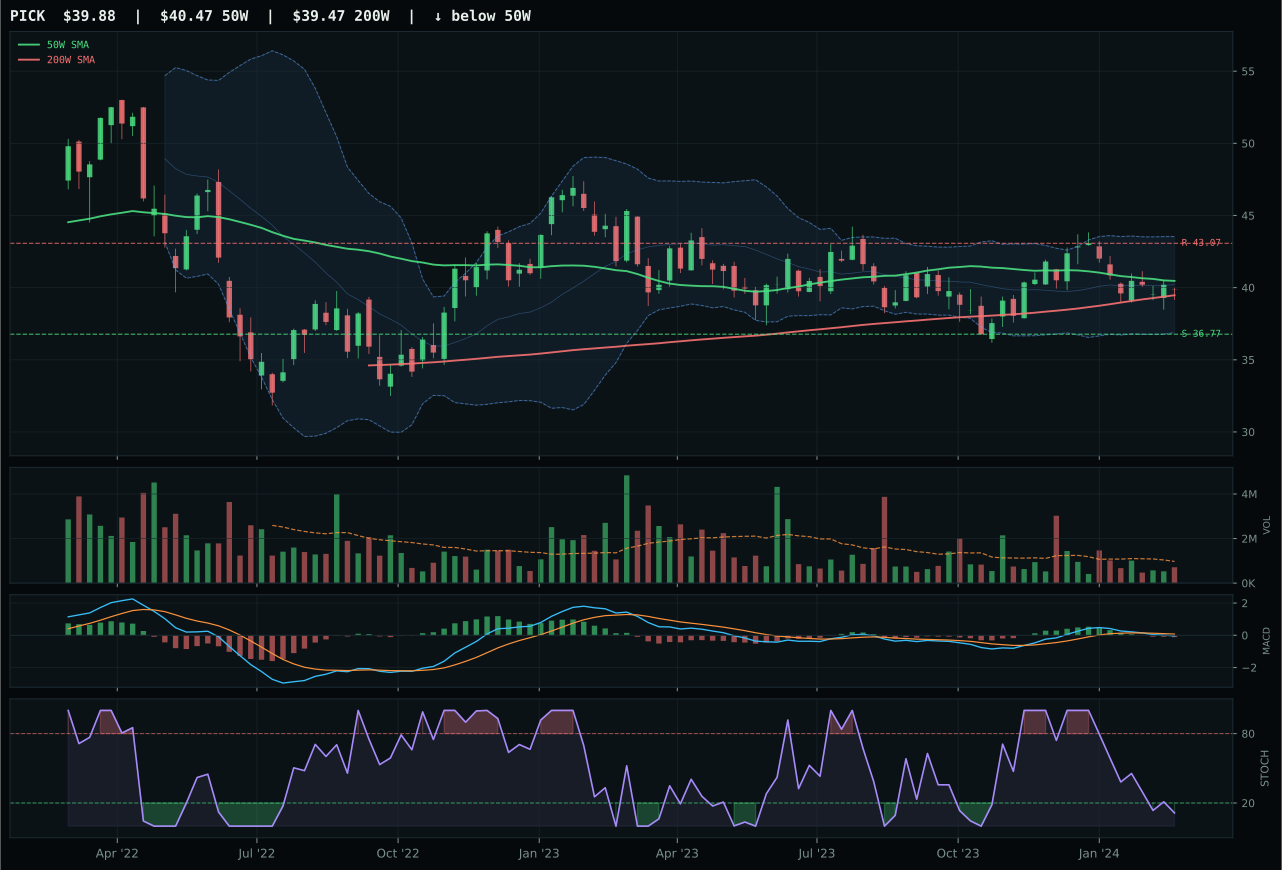
PICK has a compression near 50W profile with -13.2% 13-week relative strength versus SPY.
A failed hold above support would weaken the setup.
Actionable but governed by invalidation levels.
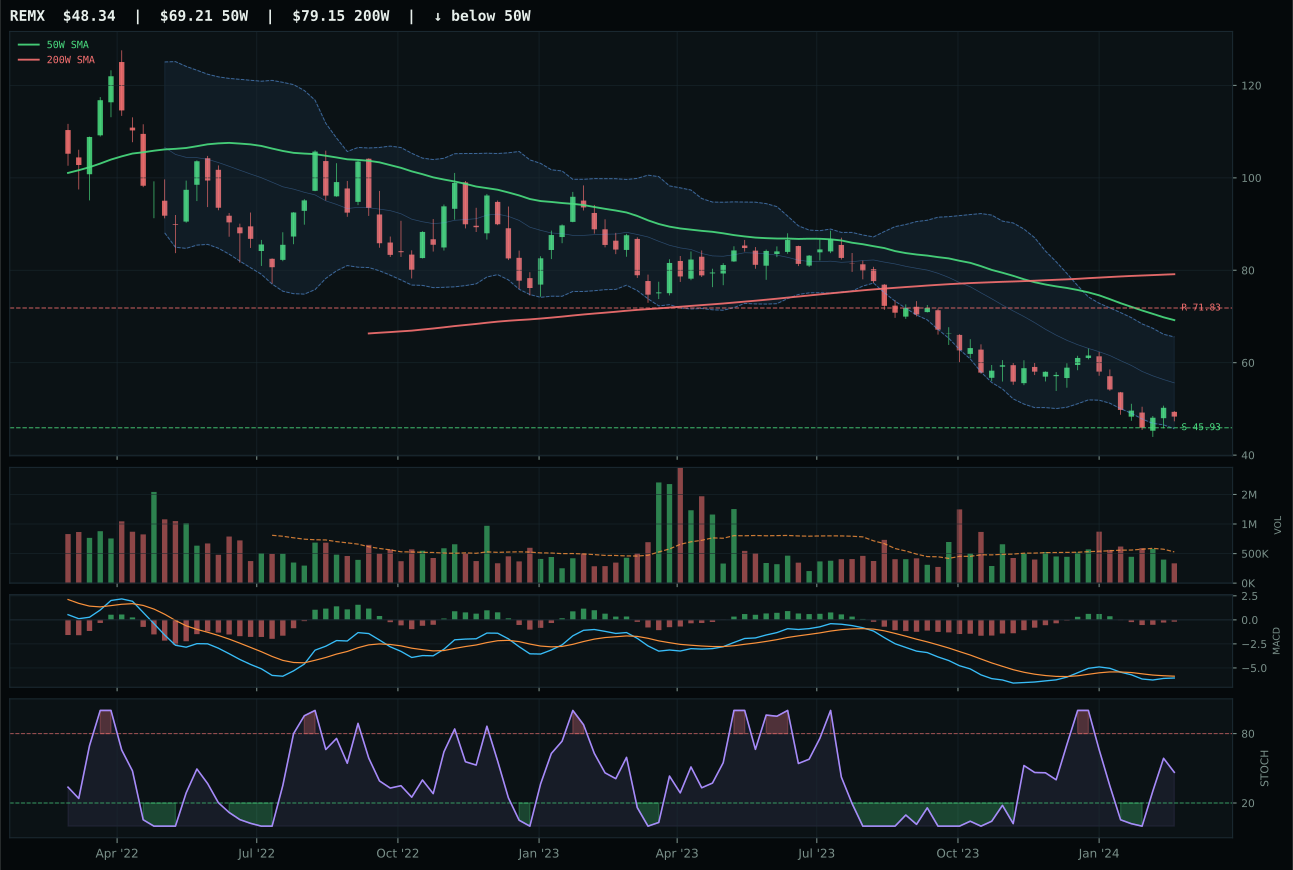
REMX has a neutral structure profile with -28.3% 13-week relative strength versus SPY.
Extension and support failure are the main tactical risks.
Tracked, but not top-2 eligible because: structurally broken.
COPX claimed the category despite price sitting -1.4% below the 50W because the setup provides the clearest defined risk/reward among a deteriorating cohort. The ETF trades in compression near the moving average with perfect timing at 100.0/100—the exact setup that allows buyers to contest mean reversion without chasing an extended move. COPX showed 5.7% in 13-week returns with 7.3% category-relative strength, both respectable in a sector where PICK fell into breakdown mode and REMX collapsed. The decisive factor was MACD: COPX held bullish but flattening confirmation while PICK shifted to bearish/weakening, a signal that copper had more institutional sponsorship than the broader mining bucket. Volume remains thin at 0.55x the 20W average, yet the compression into support at 32.10 and against overhead resistance at 38.30 creates a clean trade setup—buyers defending support suggest conviction rather than resignation.
Industrial Metals earned 0% allocation despite COPX winning the category because the 24.3 final score falls outside the eligible range and the macro fit of 49.0 is too weak to justify a position. Metals scarcity is active at +14, which is the only positive signal, but liquidity stress at -8 and credit stress at -7 offset that benefit into neutral territory. Technical evidence is 70.2—strong for trend and timing, weak for momentum—but the category reasoning layer applies hard filters, and industrial metals simply don't pass the eligibility gate in a disinflation regime. COPX's technical setup, while superior to PICK's deterioration, is not sufficiently compelling to override the category-level macro headwinds. This is a watch-and-wait situation: if COPX closes above 38.30 with improving MACD and volume expansion, the category could become eligible again. Until that confirmation arrives, capital is better deployed in categories with clearer macro sponsorship and stronger technical breadth.
Traditional Energy — XLE
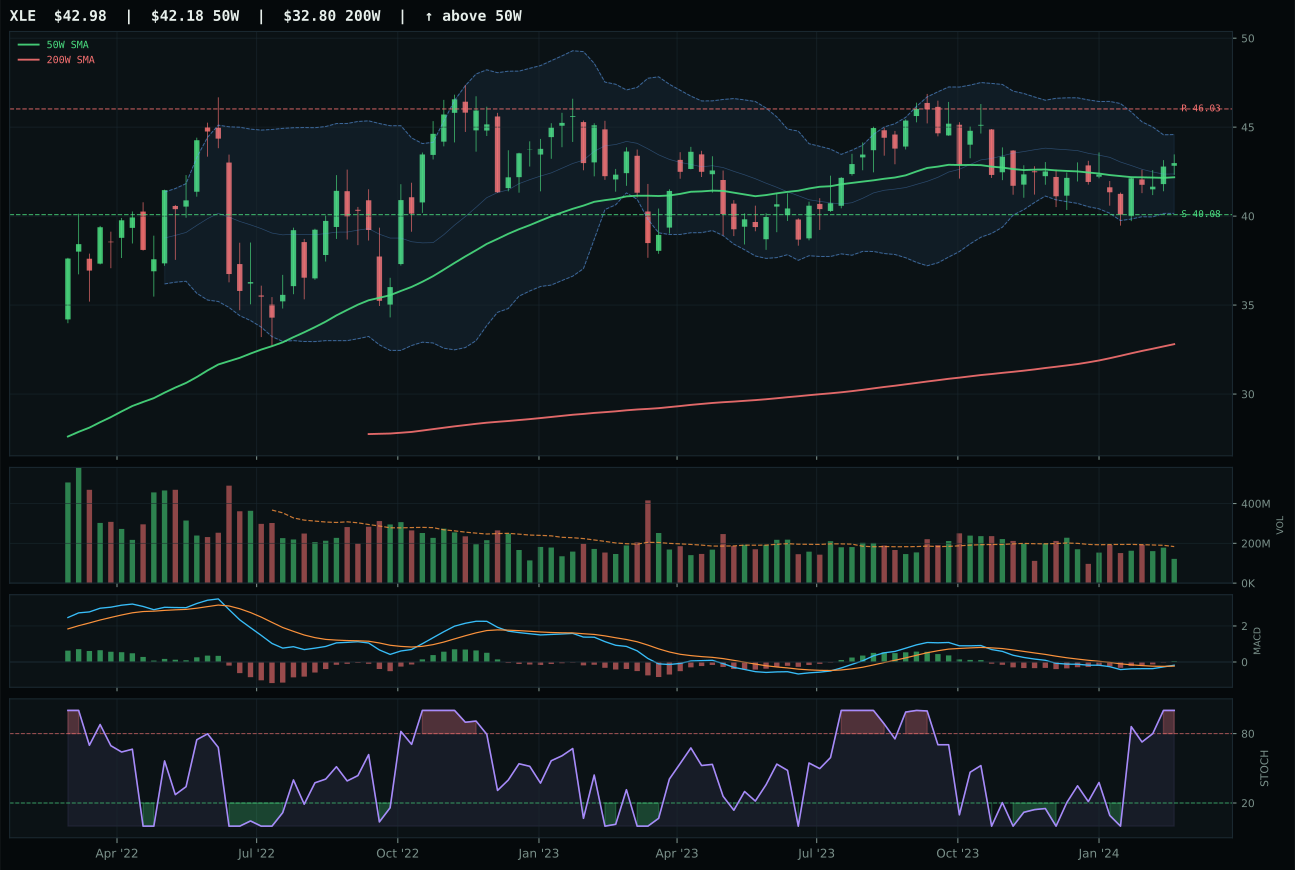
XLE has a compression near 50W profile with -10.3% 13-week relative strength versus SPY.
A failed hold above support would weaken the setup.
Actionable but governed by invalidation levels.
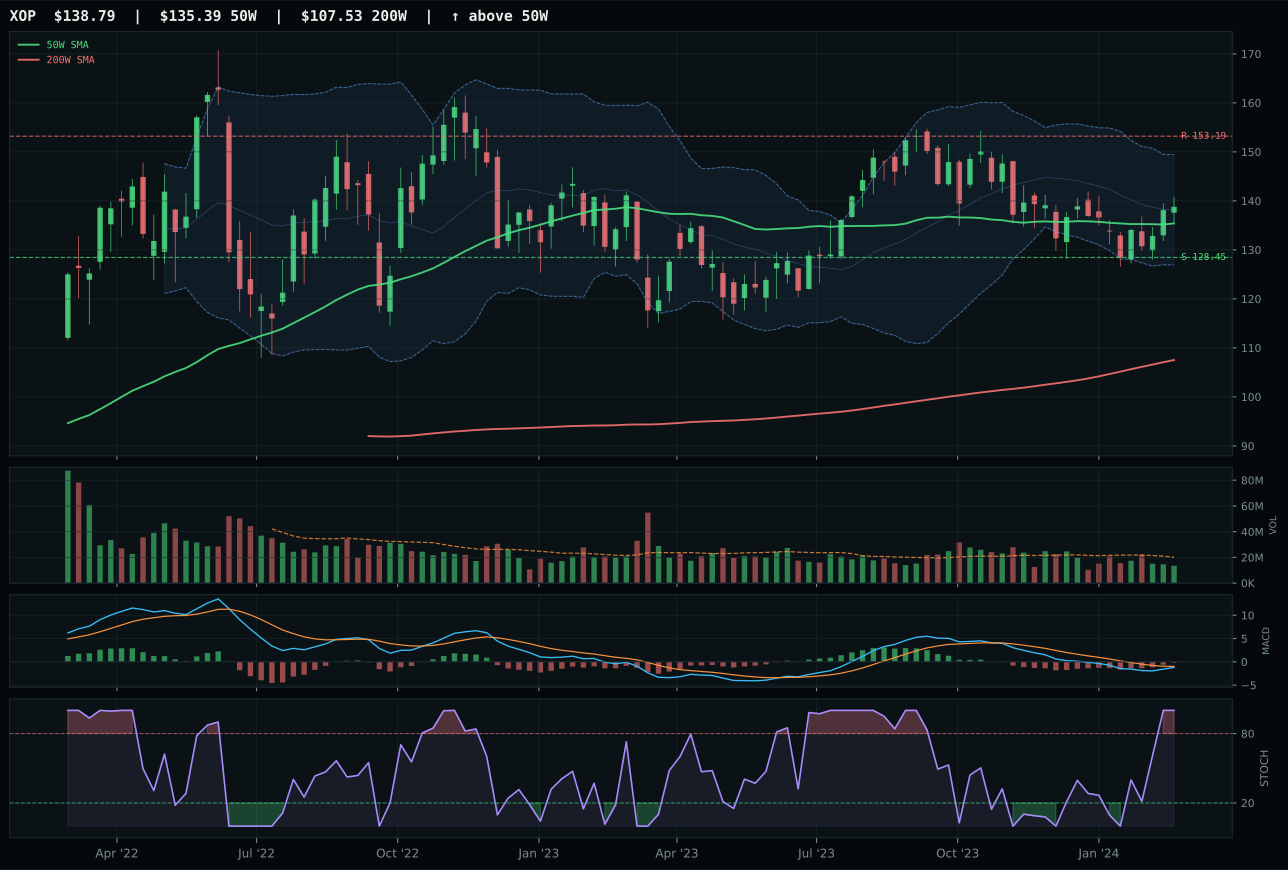
XOP has a compression near 50W profile with -11.9% 13-week relative strength versus SPY.
A failed hold above support would weaken the setup.
Actionable but governed by invalidation levels.
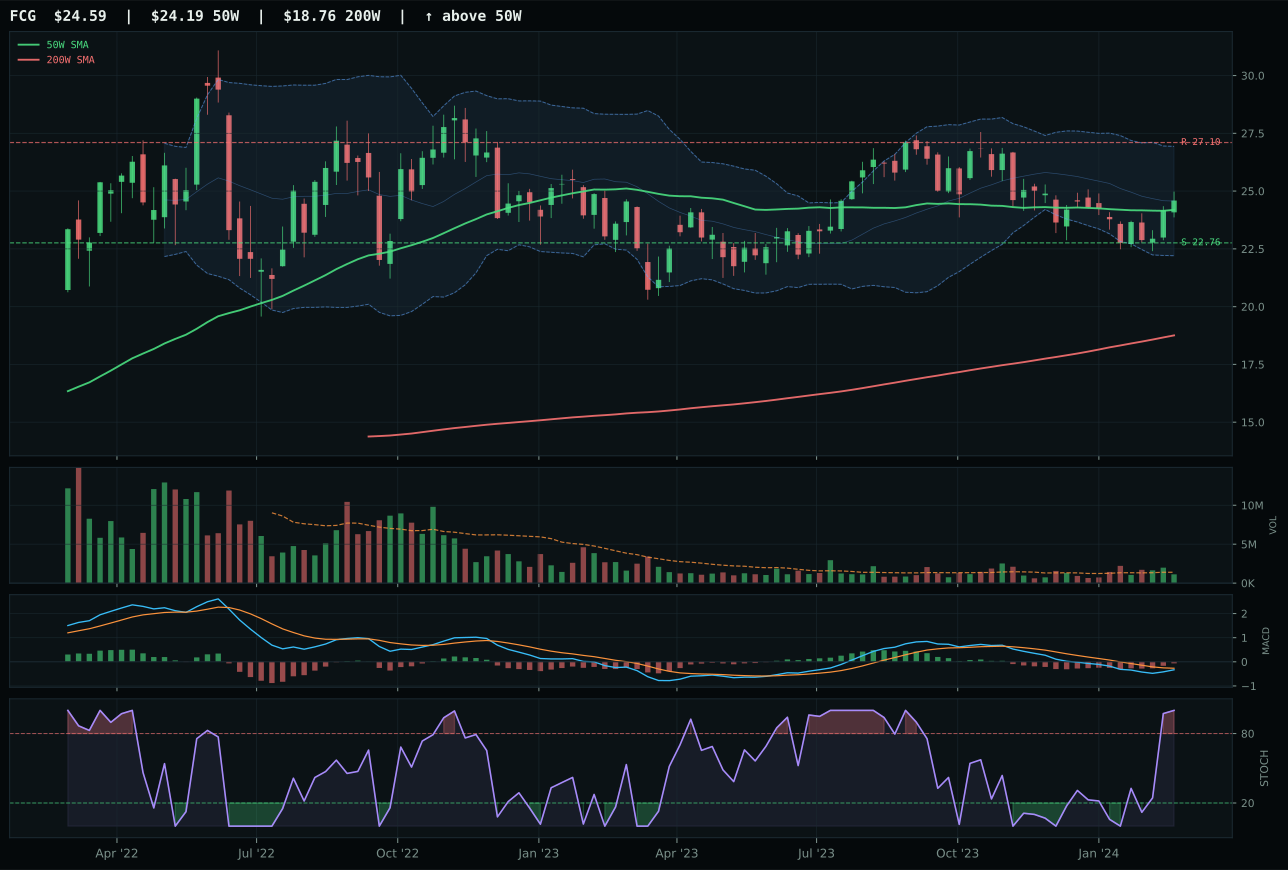
FCG has a compression near 50W profile with -13.2% 13-week relative strength versus SPY.
A failed hold above support would weaken the setup.
Actionable but governed by invalidation levels.
XLE won by the narrowest margin (3.8 points over XOP) through superior volume/price sponsorship and MACD conviction in a sector where the macro regime is actively bearish. Both trade in compression near the 50W with near-perfect timing at 100.0/100, but XLE's MACD is bullish and improving while XOP's is bearish but improving, a distinction that signals XLE is attracting fresh capital while XOP is merely stabilizing. Structure quality was nearly identical (70.1 vs 69.1), yet XLE captured category-relative strength at 1.6% versus XOP's 0.0%, showing integrated majors (XLE) are outpacing exploration beta (XOP) in a disinflation regime. Volume participation remains thin at 0.66x on both, but XLE's 55.7/100 volume-price confirmation slightly exceeded XOP's implied score, reflecting that buyers of integrated energy cash flow are more committed than speculators in the exploration bucket.
Traditional Energy earned 0% despite XLE's technical superiority because the category macro fit of 16.0 is actively hostile to new capital allocation. Disinflation hurts this exposure by -10, disinflation pressure is active at -10, and liquidity stress at -7 and credit stress at -7 combine into a 34-point macro headwind. Technical evidence is a respectable 75.2—XLE's trend and timing scores are strong—but no technical setup can overcome a category-level macro rejection of this magnitude. In a disinflation regime, energy demand weakens, refinery spreads compress, and E&P spending gets deferred. XLE's 1.2% thirteen-week return and -10.3% relative strength versus SPY are the market's way of saying this sector is fighting the regime. The allocation remains zero because deploying capital here means fighting both momentum decay and macro headwinds simultaneously. If risk appetite deteriorated sharply or inflation re-accelerated, this category would requalify; until then, the bandwidth goes to categories with disinflation sponsorship.