
2024-02-16
Informational purposes only. The content in this report, including allocations, analysis, and commentary, is provided solely for informational and educational purposes. It does not constitute financial advice, investment advice, trading advice, or any other type of advice. Past performance does not guarantee future results. Always conduct your own research and consult a qualified financial professional before making investment decisions.
Weekly Allocation
| Ticker | Category | Weight | Role |
|---|---|---|---|
| FBTC | 50% | Overlay | |
| SMH | AI | 10% | Top-2 (10%) |
| CIBR | Technology | 10% | Top-2 (10%) |
| XAR | Defense & Aerospace | 5% | Tier-2 (5%) |
| GLD | Precious Metals | 5% | Tier-2 (5%) |
| NLR | Nuclear Energy | 5% | Tier-2 (5%) |
| PAVE | Utilities & Infrastructure | 5% | Tier-2 (5%) |
| INDA | Emerging Markets | 5% | Tier-2 (5%) |
| VEGI | Agriculture & Livestock | 5% | Tier-2 (5%) |
Trade Instructions — Monday Open
Sell the tranche from 2024-01-19 (completing its 4-week hold). Buy the new tranche. Instructions show net portfolio changes — same-asset positions cancel, weight changes show the delta.
| Action | Ticker | Instruction |
|---|---|---|
| SELL | XLK | Sell 50% of XLK position (reduce 5.00% → 2.50%) |
| SELL | URNM | Sell 25% of URNM position (reduce 5.00% → 3.75%) |
| SELL | ITA | Sell 25% of ITA position (reduce 5.00% → 3.75%) |
| SELL | MOO | Sell 25% of MOO position (reduce 5.00% → 3.75%) |
| SELL | COPX | Sell entire COPX position (1.25% of portfolio) |
| BUY | INDA | Buy INDA — 16.67% of freed cash (adds 1.25% to portfolio) |
| BUY | CIBR | Buy CIBR — 33.33% of freed cash (adds 2.50% to portfolio) |
| BUY | XAR | Buy XAR — 16.67% of freed cash (adds 1.25% to portfolio) |
| BUY | NLR | Buy NLR — 16.67% of freed cash (adds 1.25% to portfolio) |
| BUY | VEGI | Buy VEGI — 16.67% of freed cash (adds 1.25% to portfolio) |
Current Portfolio After Trade
Combined holdings across all 4 active tranches. Each tranche is 25% of the portfolio.
| Ticker | % of Portfolio | Weight Bar |
|---|---|---|
| FBTC | 50.00% | |
| SMH | 10.00% | |
| PAVE | 5.00% | |
| GLD | 5.00% | |
| IGV | 5.00% | |
| URNM | 3.75% | |
| ITA | 3.75% | |
| MOO | 3.75% | |
| XLK | 2.50% | |
| XLE | 2.50% | |
| INDA | 2.50% | |
| CIBR | 2.50% | |
| XAR | 1.25% | |
| NLR | 1.25% | |
| VEGI | 1.25% |
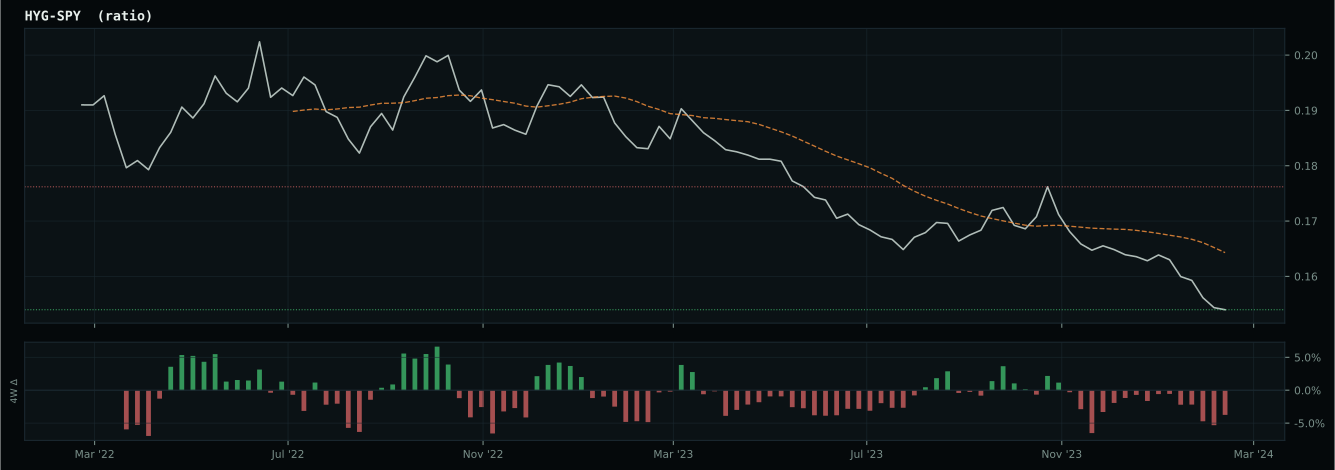
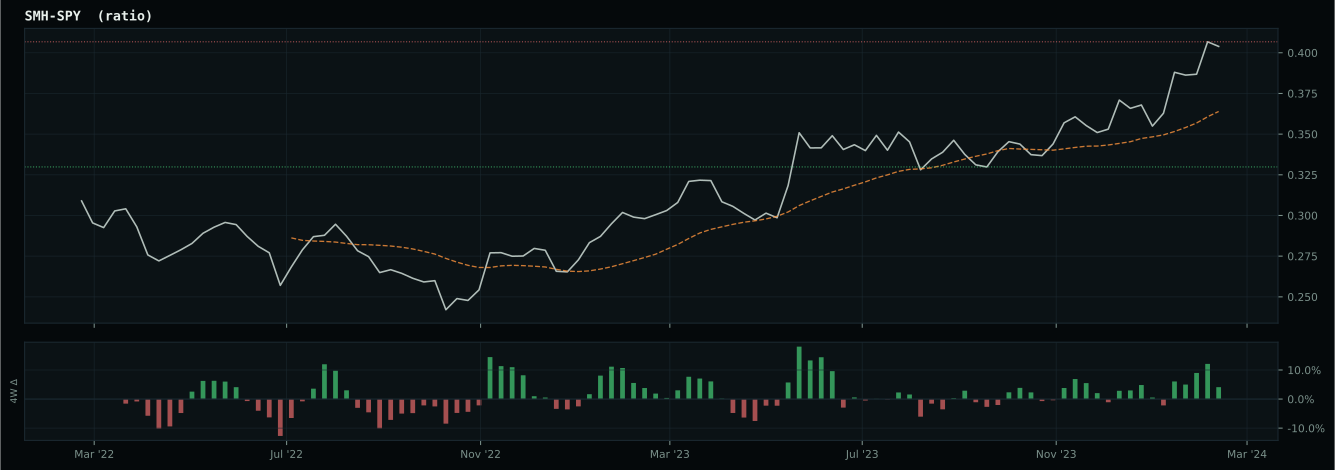
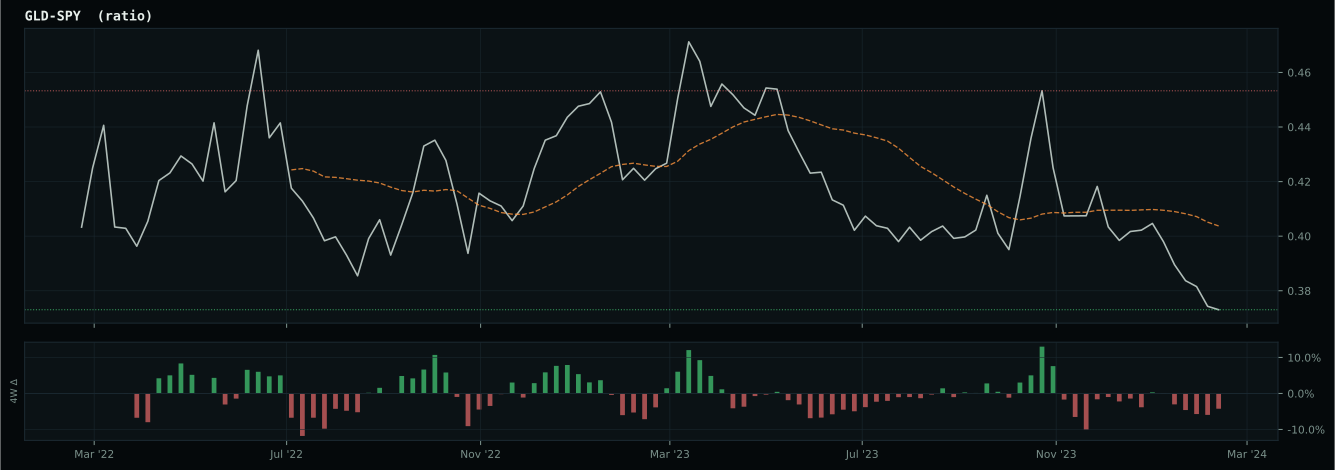
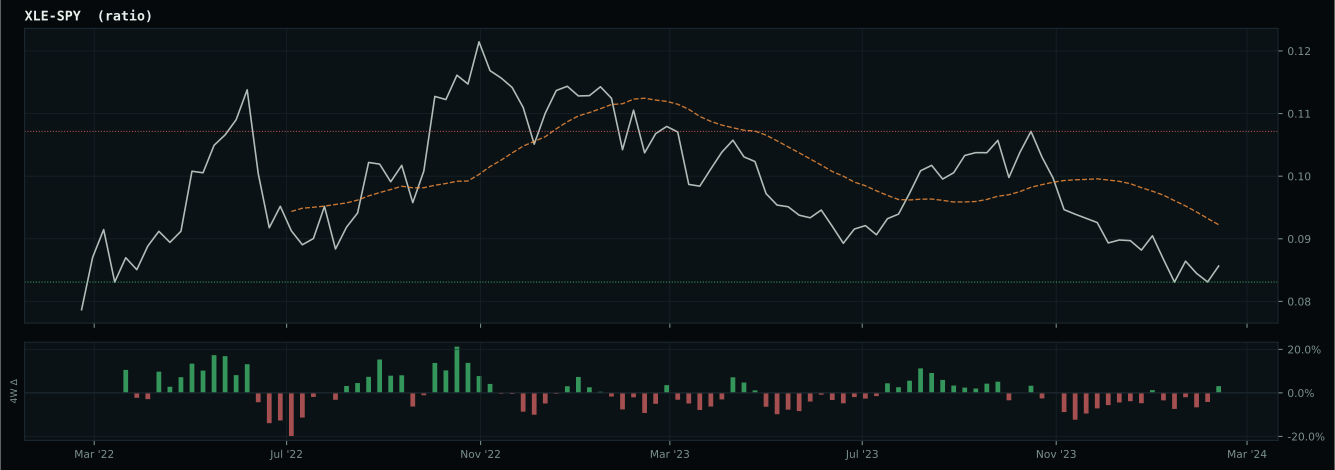
Macro Regime — Disinflation
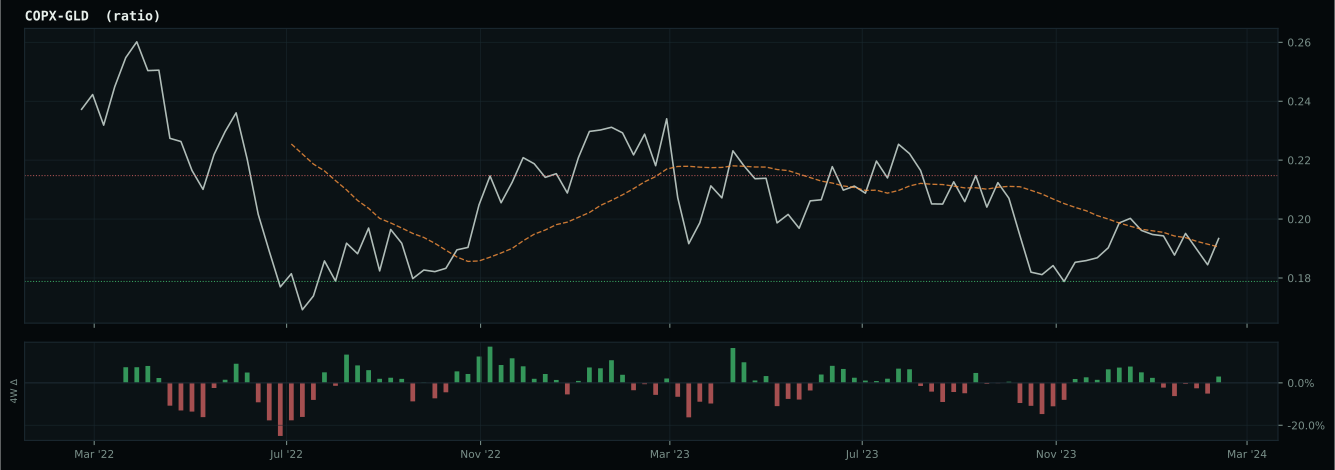
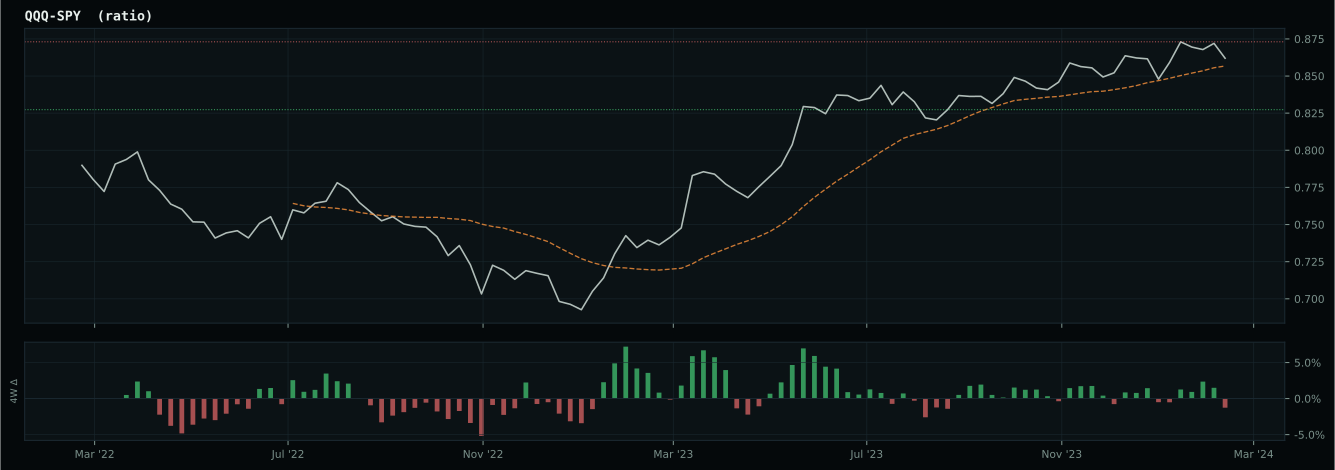
Macro Evidence Charts
Market-implied signals behind the macro regime scores. Each ratio compares two assets; the direction and slope of the ratio is what the macro engine reads.
Crypto Regime — TrendBTC
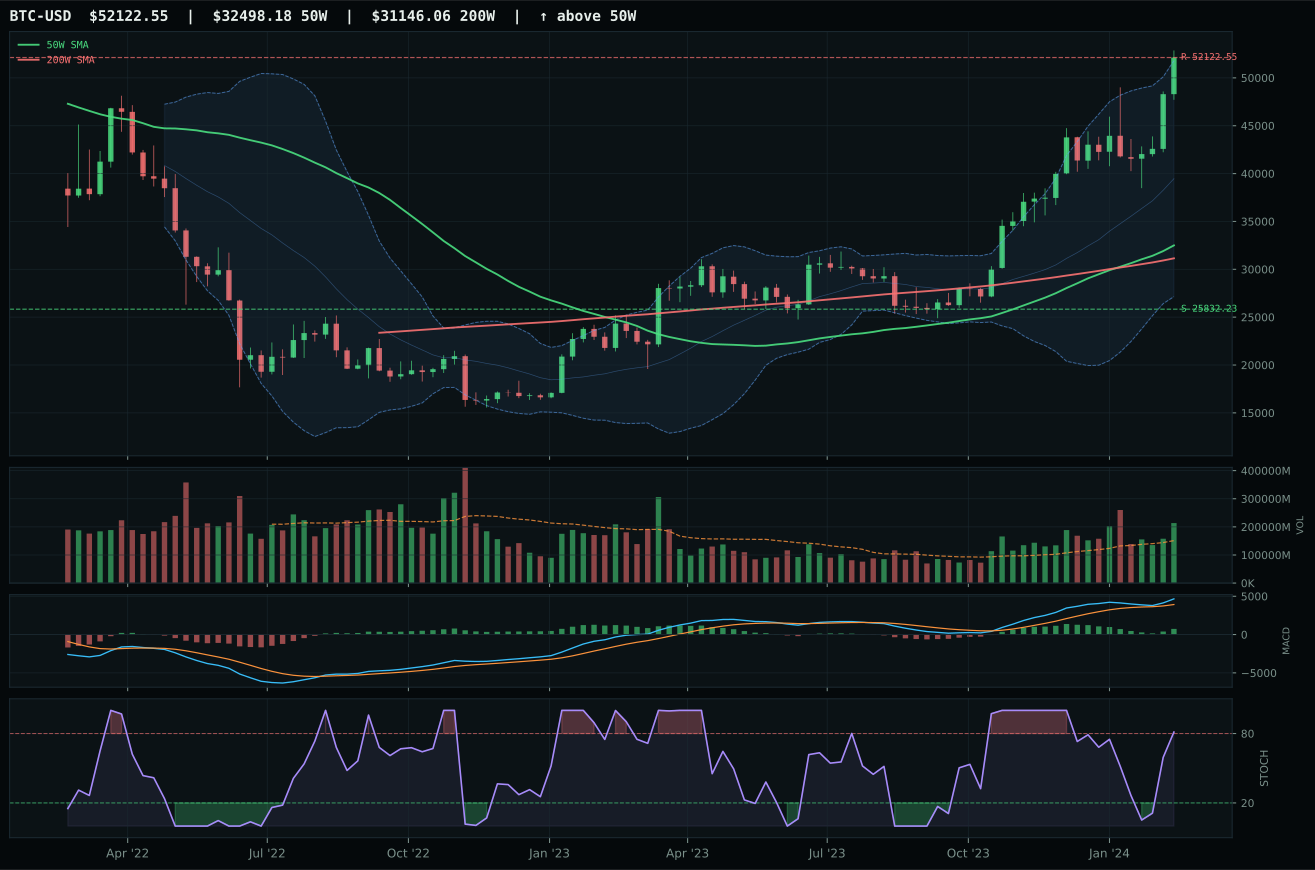
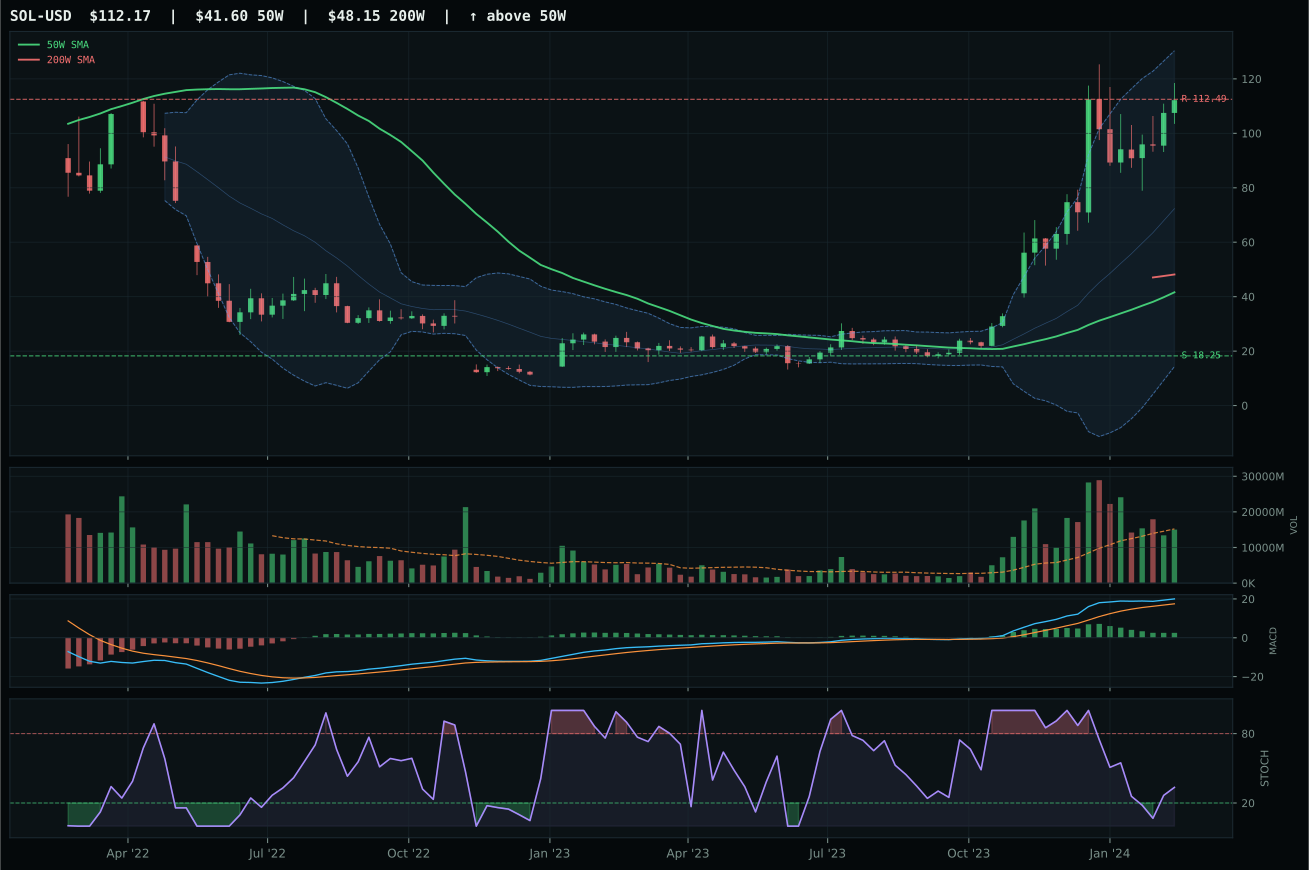
post-touch structure is too wide to count as a range; max/min close ratio is 2.90
TrendBTC confirmed: 2 consecutive closes above rising/flat 50W SMA
one or more available conditions failed
Category Rankings
| Rank | Category | Winner | Score | Alloc | 4W Ret | Peers (4W) |
|---|---|---|---|---|---|---|
| 1 | AI | SMH | 63.1 | 20% | +10.94% | BOTZ +6.7% · AIQ +3.4% |
| 2 | Technology | CIBR | 59.6 | 20% | -2.46% | XLK +2.8% · IGV -0.9% |
| 3 | Defense & Aerospace | XAR | 50.9 | 10% | +2.06% | ITA +1.3% · ROKT -2.4% |
| 4 | Precious Metals | GLD | 37.7 | 10% | +6.22% | SLV +9.3% · GDX +9.8% |
| 5 | Nuclear Energy | NLR | 35.4 | 10% | +0.97% | URNM -7.0% · URA -2.8% |
| 6 | Utilities & Infrastructure | PAVE | 33.2 | 10% | +5.86% | IGF +2.9% · XLU +3.1% |
| 7 | Emerging Markets | INDA | 30.7 | 10% | -1.57% | IEMG +1.6% · ILF -1.9% |
| 8 | Industrial Metals | COPX | 25.1 | 10% | +15.42% | PICK +2.0% · REMX +5.3% |
| 9 | Traditional Energy | XLE | 9.6 | 0% | +6.46% | FCG +8.6% · XOP +7.8% |
| 10 | Agriculture & Livestock | VEGI | — | 0% | +3.87% | MOO +2.5% · WEAT -2.3% |
AI — SMH
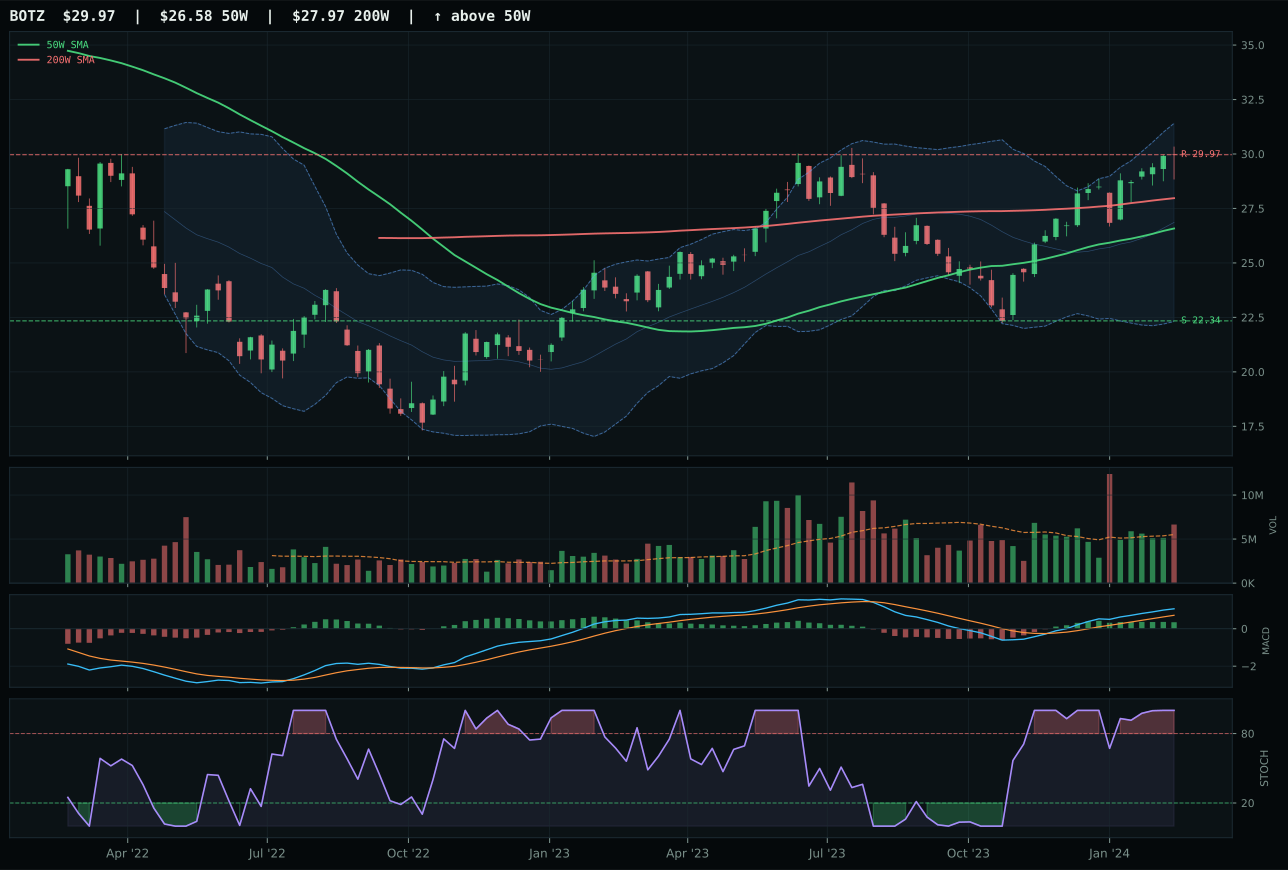
BOTZ has a neutral structure profile with 5.1% 13-week relative strength versus SPY.
A failed hold above support would weaken the setup.
Actionable but governed by invalidation levels.
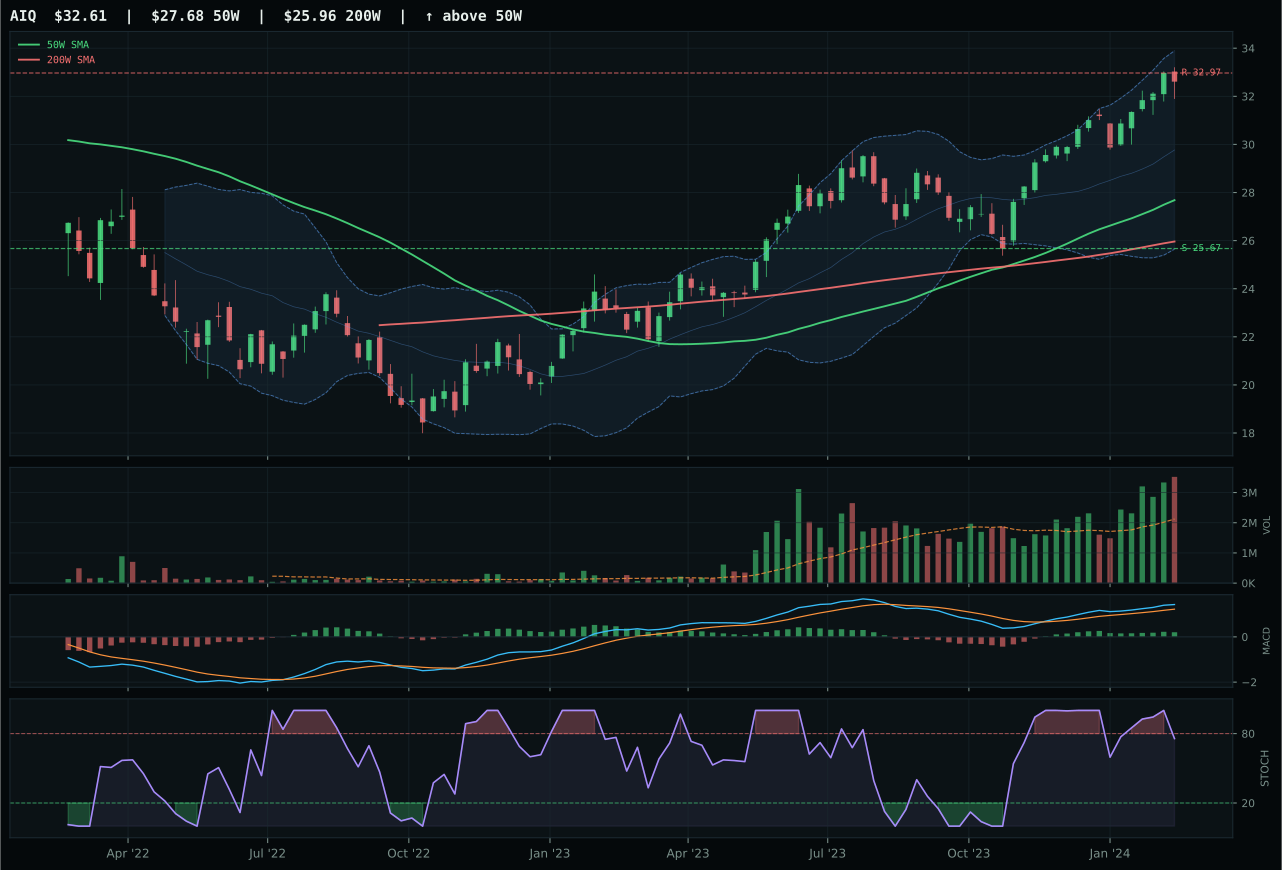
AIQ has a vertical extension profile with 0.7% 13-week relative strength versus SPY.
A failed hold above support would weaken the setup.
Actionable but governed by invalidation levels.
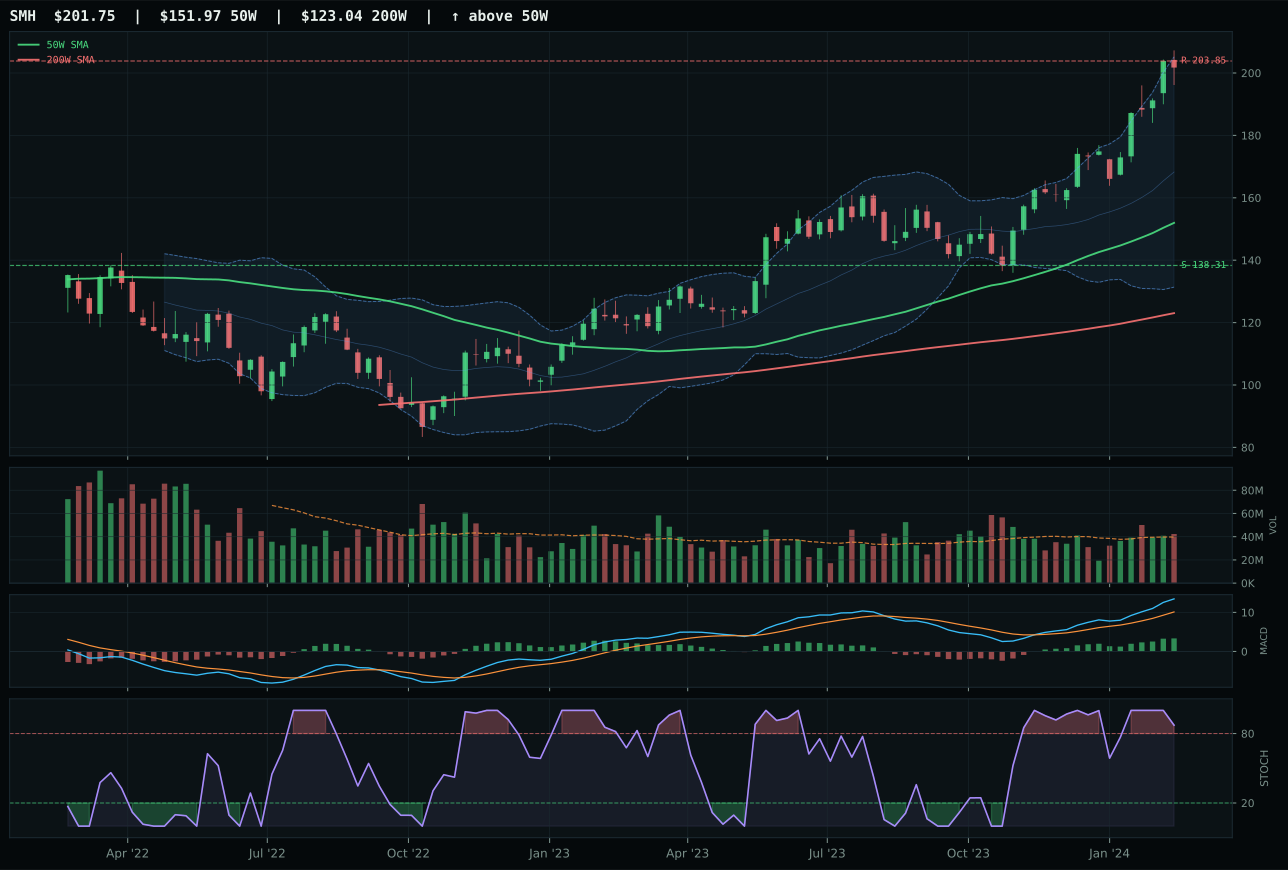
SMH has a vertical extension profile with 13.3% 13-week relative strength versus SPY.
A failed hold above support would weaken the setup.
Actionable but governed by invalidation levels.
SMH defeats BOTZ by a decisive 16.4-point margin, claimed despite BOTZ's higher technical evidence score (79.2 versus 59.0), because the portfolio's macro regime and category-specific sponsorship collapse BOTZ's edge. SMH extends 32.8% above the 50W with price above the 200W, a 13W return of 24.1%, and 13.3% SPY relative strength that trounces BOTZ's 5.1%. MACD is bullish and improving on SMH versus bullish but flattening on BOTZ, and crucially, SMH's 8.2% category-relative strength laps BOTZ's 0.0% performance within the AI basket. Volume sits neutral on SMH at 1.06x the 20W average, confirming that the rally is neither being given away nor distributed aggressively. BOTZ's robotics theme carries better structural health (neutral setup versus SMH's extended vertical), but the semiconductor compute-power narrative owns the macro narrative under AI growth sponsorship (+14 boost), rendering the robotics cyclicality less relevant. The 24.1% thirteen-week return on SMH, paired with bullish and improving MACD, places entry risk but confirms the trade is still being accumulated.
AI ranked second among all 10 categories this week and earned the top-2 overweight at 10% allocation alongside Technology. The final category score of 63.1 reflects SMH's dominance in a three-deep basket where BOTZ scored 71.5 on the reasoned proof order but SMH still won the category representative slot due to higher persistence, volume-price confirmation, and leadership quality. AI growth sponsorship is active at +14 points, a significant macro driver that aligns with the technical evidence. Liquidity stress active (-12 points) and credit stress active (-8 points) create drag, but the +10 point boost from risk appetite positive keeps the category in the portfolio's top tier. The disinflation regime is neutral to slightly beneficial for AI hardware (compute costs normalize), and SMH's 24.1% 13-week return sits at the portfolio's growth frontier. Extension and timing penalties ensure this is not a screaming buy, but relative strength, macro sponsorship, and the fact that semiconductor supply remains constrained justify a full top-2 allocation.
Technology — CIBR
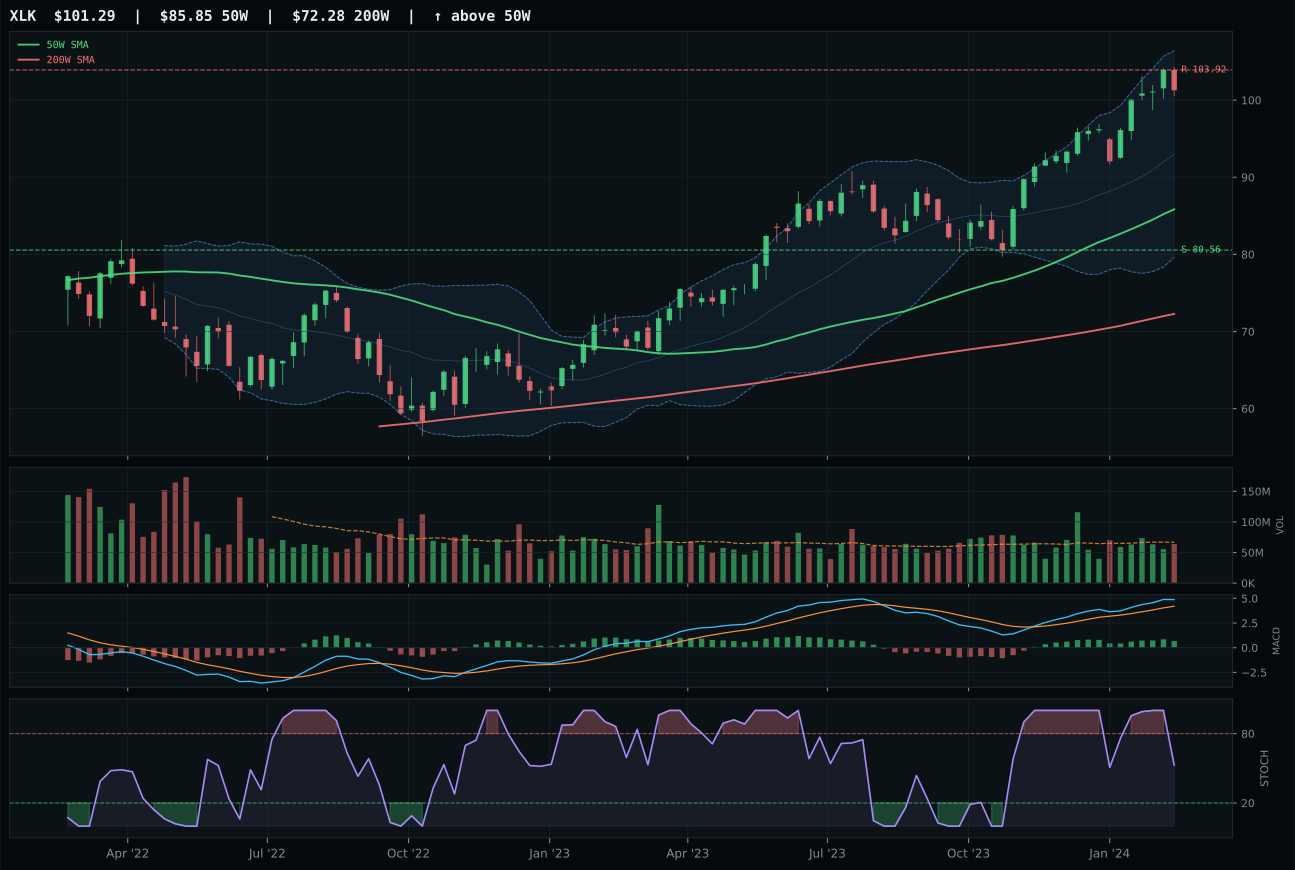
XLK has a vertical extension profile with 0.0% 13-week relative strength versus SPY.
A failed hold above support would weaken the setup.
Actionable but governed by invalidation levels.
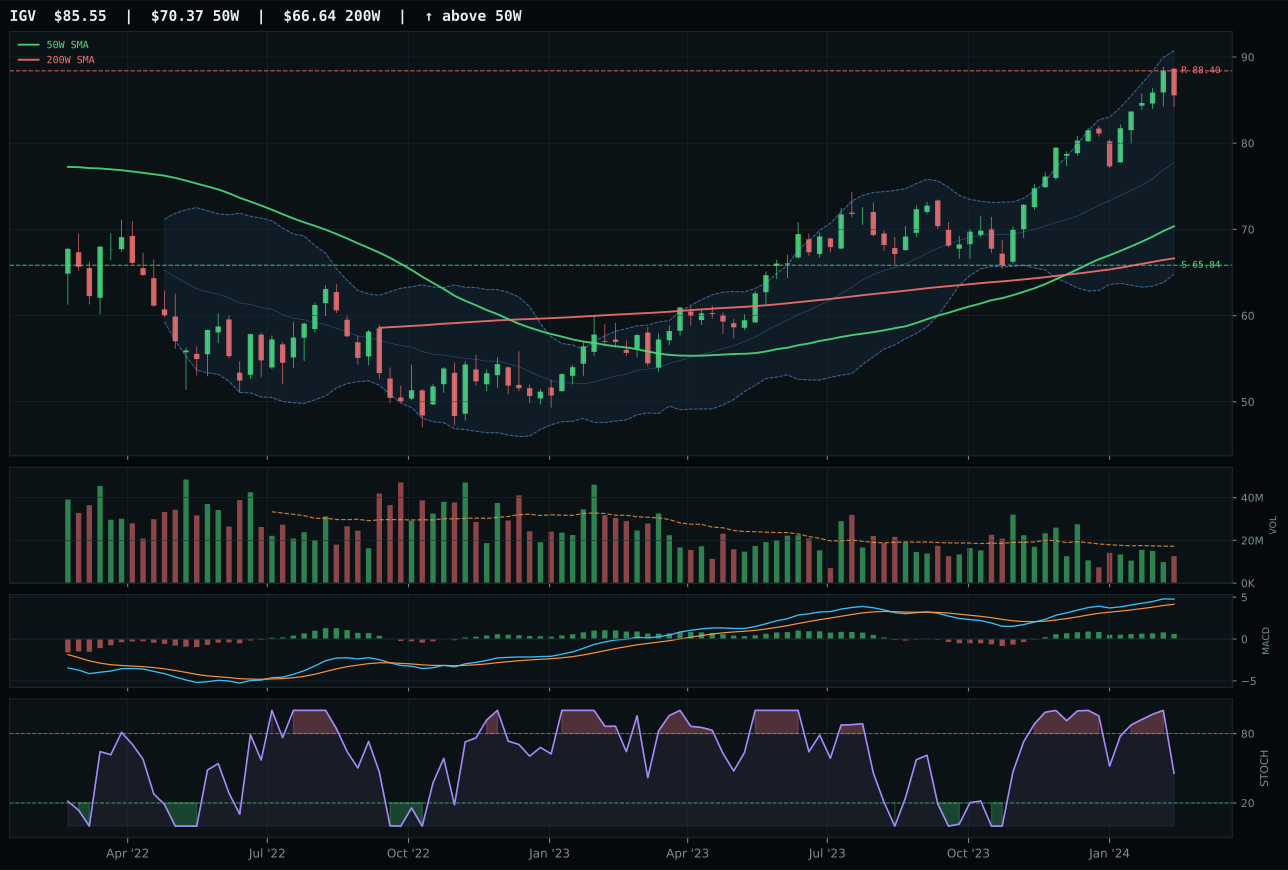
IGV has a vertical extension profile with 3.6% 13-week relative strength versus SPY.
A failed hold above support would weaken the setup.
Actionable but governed by invalidation levels.
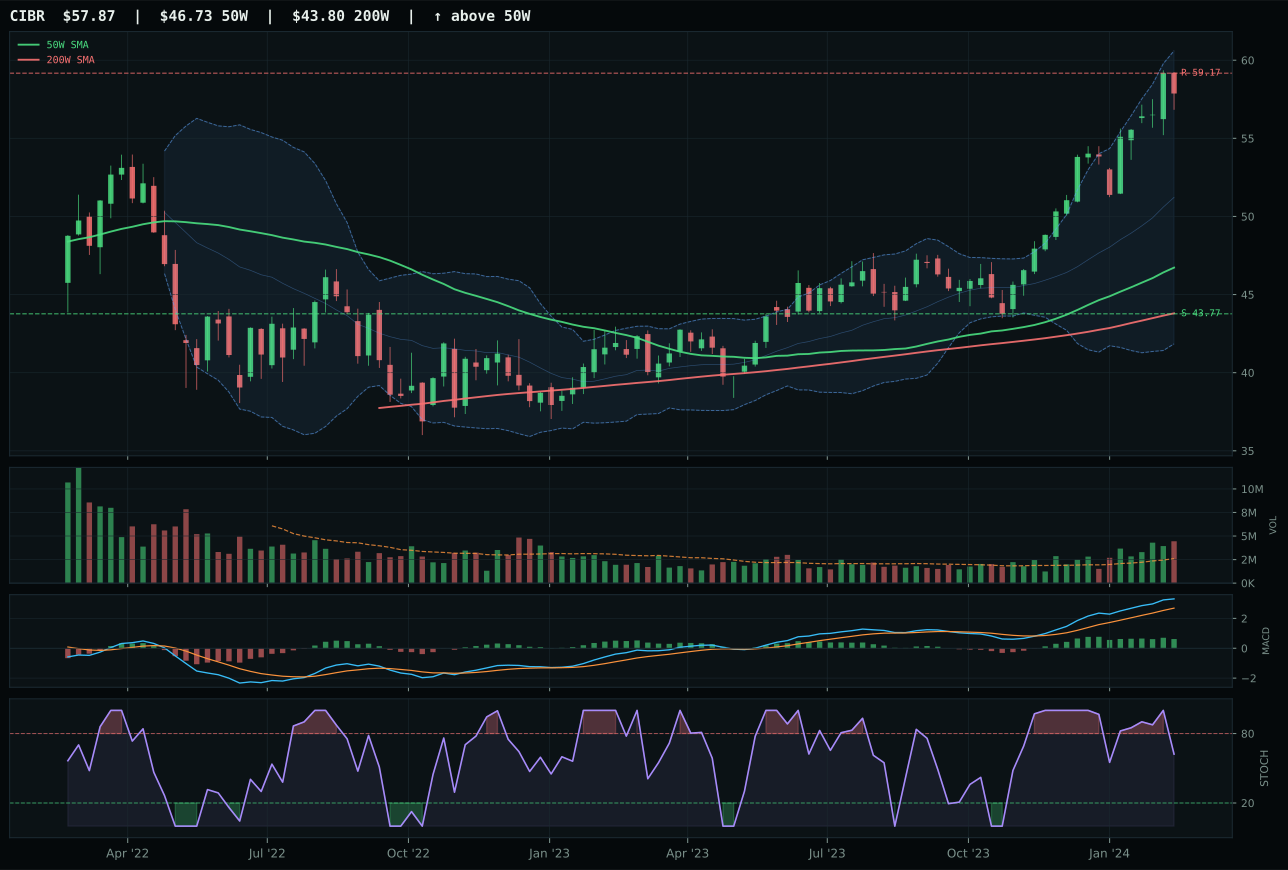
CIBR has a vertical extension profile with 9.9% 13-week relative strength versus SPY.
A failed hold above support would weaken the setup.
Actionable but governed by invalidation levels.
CIBR wins the category with a 3.1-point lead over XLK by virtue of superior relative strength and volume sponsorship at a critical juncture. The cybersecurity ETF carries a 9.9% gain versus SPY over 13 weeks and outperforms its category peers by 6.3%, signaling that fresh capital is flowing into this specific thematic rather than chasing broad technology. XLK's MACD is bullish and improving while CIBR's is bullish but flattening—a technical divergence that matters when both charts sit extended 24–33% above their 50-week averages. Volume at 1.71x the 20-week average tells a distribution story for CIBR: buyers are taking profits into strength, but the trend remains intact because the 50W slope hasn't rolled over. The setup is a classic momentum extension with timing penalties, meaning every new entry is late, but the relative strength inside the basket and category persistence of 59.6 justify holding the position despite entry risk.
Technology earned the top-2 overweight at 10% allocation as one of the two highest-scoring categories this week. Disinflation and active AI growth sponsorship provide tailwind for compute and software regardless of near-term technicals, and CIBR's 20.7% 13-week return reflects that macro sponsorship hitting real money. The category score of 59.6 reflects a 62/38 split favoring technical evidence over narrative fit, and that technical edge comes from CIBR's 100/100 trend score and 97.5/100 momentum confirmation. Credit stress is active and dragging on the category (-6 points at the ETF level), but risk appetite positive and AI growth sponsorship (+9 and +6 points, respectively) more than offset that headwind. The tension here is real: extension and timing penalties argue for caution, but relative strength breadth, macro support, and volume confirmation that this is not a bounce argue for staying long. This allocation assumes the disinflation regime persists and risk appetite remains constructive.
Defense & Aerospace — XAR
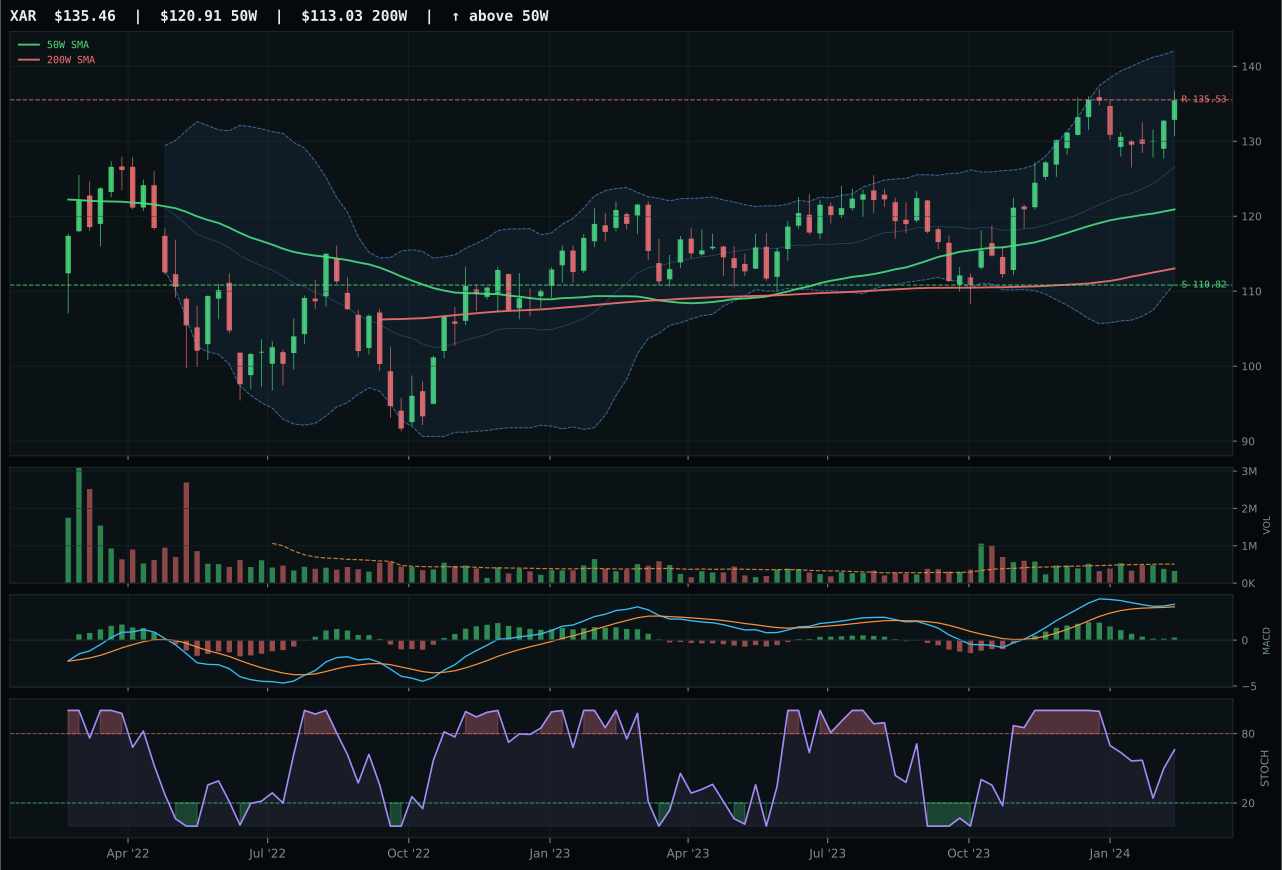
XAR has a neutral structure profile with -2.0% 13-week relative strength versus SPY.
A failed hold above support would weaken the setup.
Actionable but governed by invalidation levels.
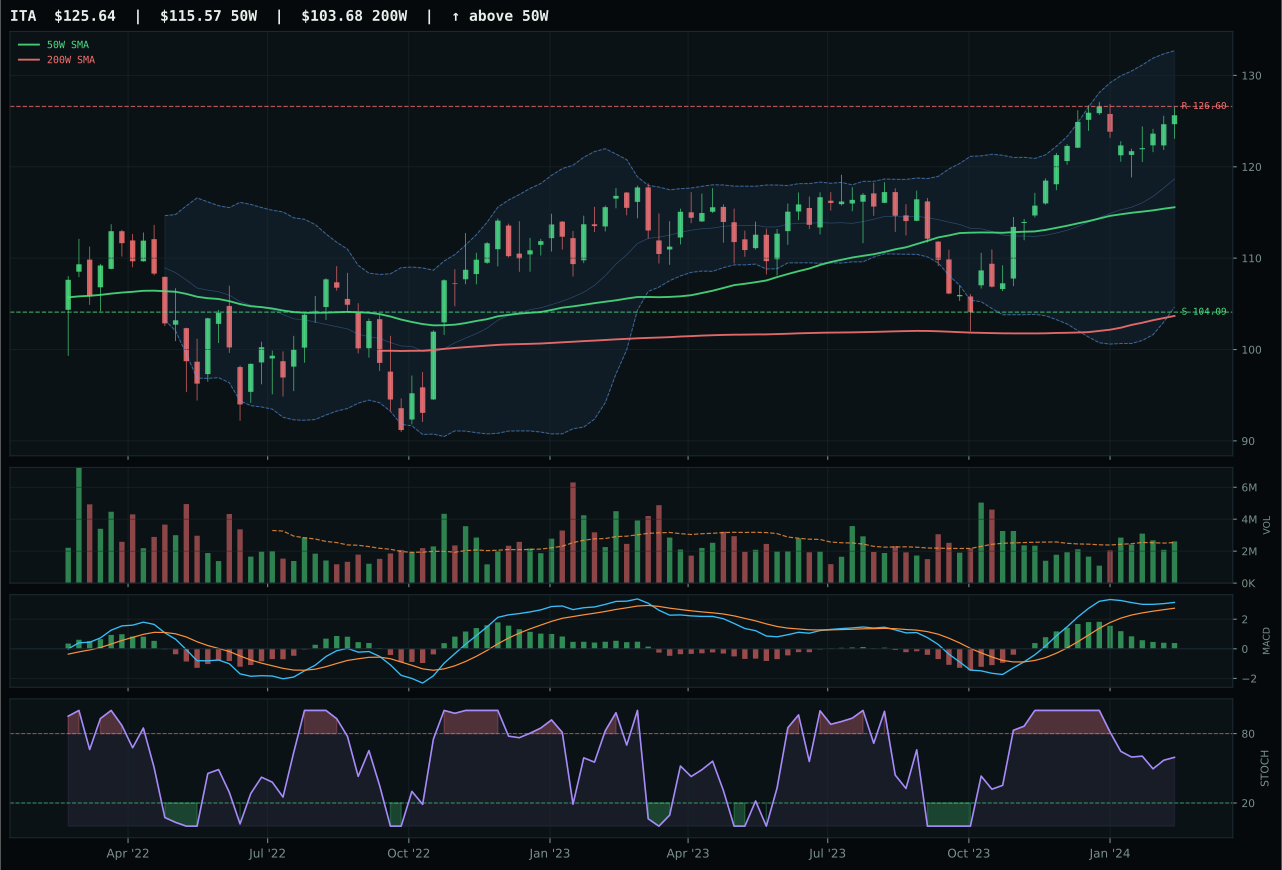
ITA has a neutral structure profile with -2.3% 13-week relative strength versus SPY.
A failed hold above support would weaken the setup.
Actionable but governed by invalidation levels.
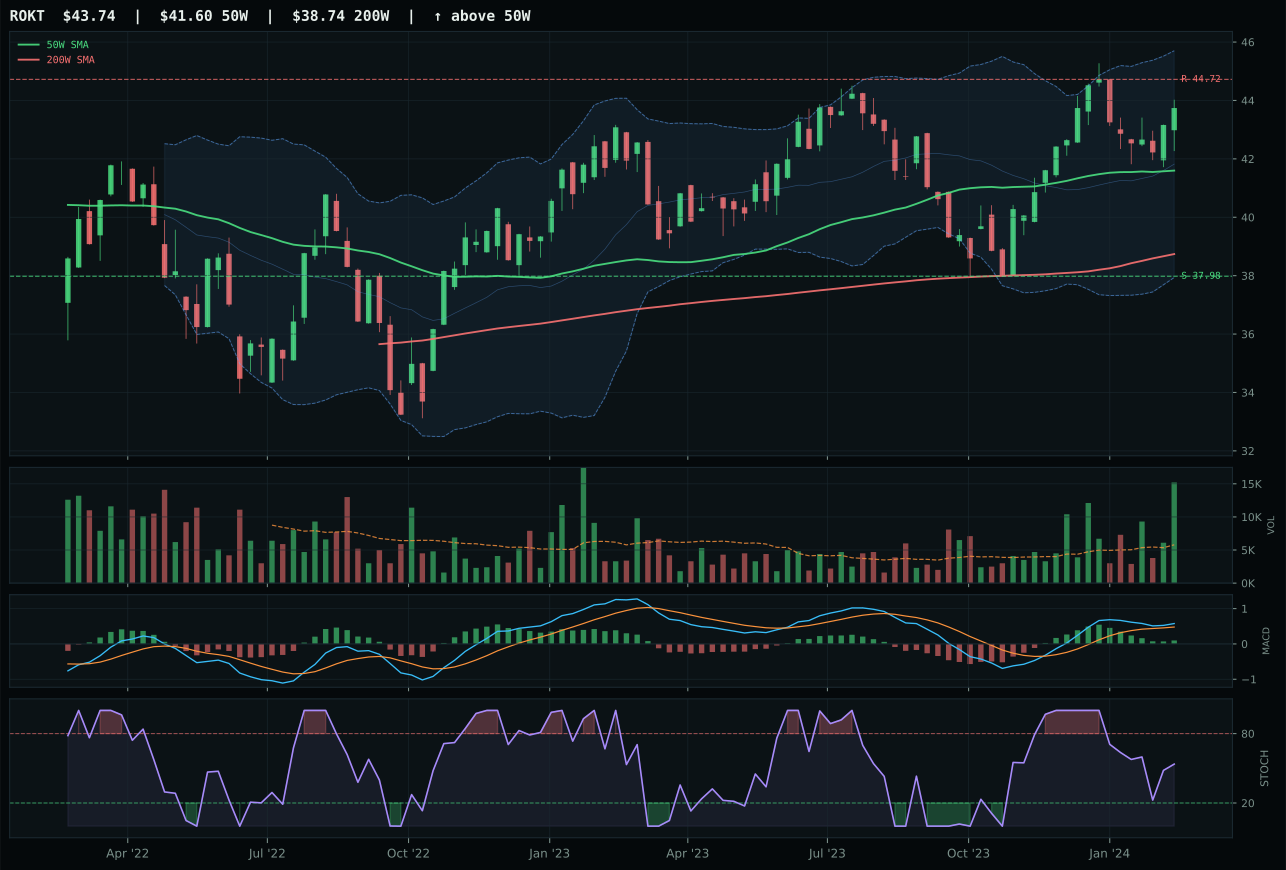
ROKT has a neutral structure profile with -3.8% 13-week relative strength versus SPY.
A failed hold above support would weaken the setup.
Tracked, but not top-2 eligible because: .
XAR edges ITA by only 1.1 points in a tight category decision, winning on timing and stochastic positioning rather than on momentum or breadth. Both ETFs hold neutral structure setups with price above the 50W and 200W; XAR sits 12.0% above the 50W while ITA matches at 12.0%, making distance parity. The difference emerges in momentum confirmation: XAR's stochastic RSI is rising mid-zone at 0.66, signaling a potential shift from oversold repair toward fresh buying, while ITA's falls neutral, suggesting momentum is fading. XAR's 13W return of 8.8% lags ITA's 8.5% marginally, but category-relative strength breaks the tie (0.3% for XAR versus 0.0% for ITA), handing the representative role to XAR despite a near-identical technical profile. Volume is thin at 0.64x for XAR, which limits conviction but does not invalidate. MACD is bullish but flattening on both names, confirming neither setup is an aggressive buy—this is sideways holding in a category with no clear macro profile boost or headwind.
Defense & Aerospace holds a tier-2 5% allocation after ranking outside the top two, bringing practical exposure to credit stress (+2 active) and moderate geopolitical bid without committing the leverage of top-tier slots. The category score of 50.9 sits well below the top-2 threshold because macro fit is flat and technical evidence across the three-ETF basket averages only moderately bullish. Liquidity stress is active (-4 points), a headwind that constrains the category even as credit stress provides a small offset. The disinflation regime is not a natural tailwind for defense hardware; cyclical capex contracts when rates fall. A top-2 slot would demand either stronger technical confirmation from BOTZ-like momentum or a shift in the macro descriptor profile toward credit stress or geopolitical risk escalation. For now, 5% is a defensive holding: it provides ballast if equity markets correct, but it does not represent conviction in aerospace cyclicality or a bet on military spending acceleration.
Precious Metals — GLD
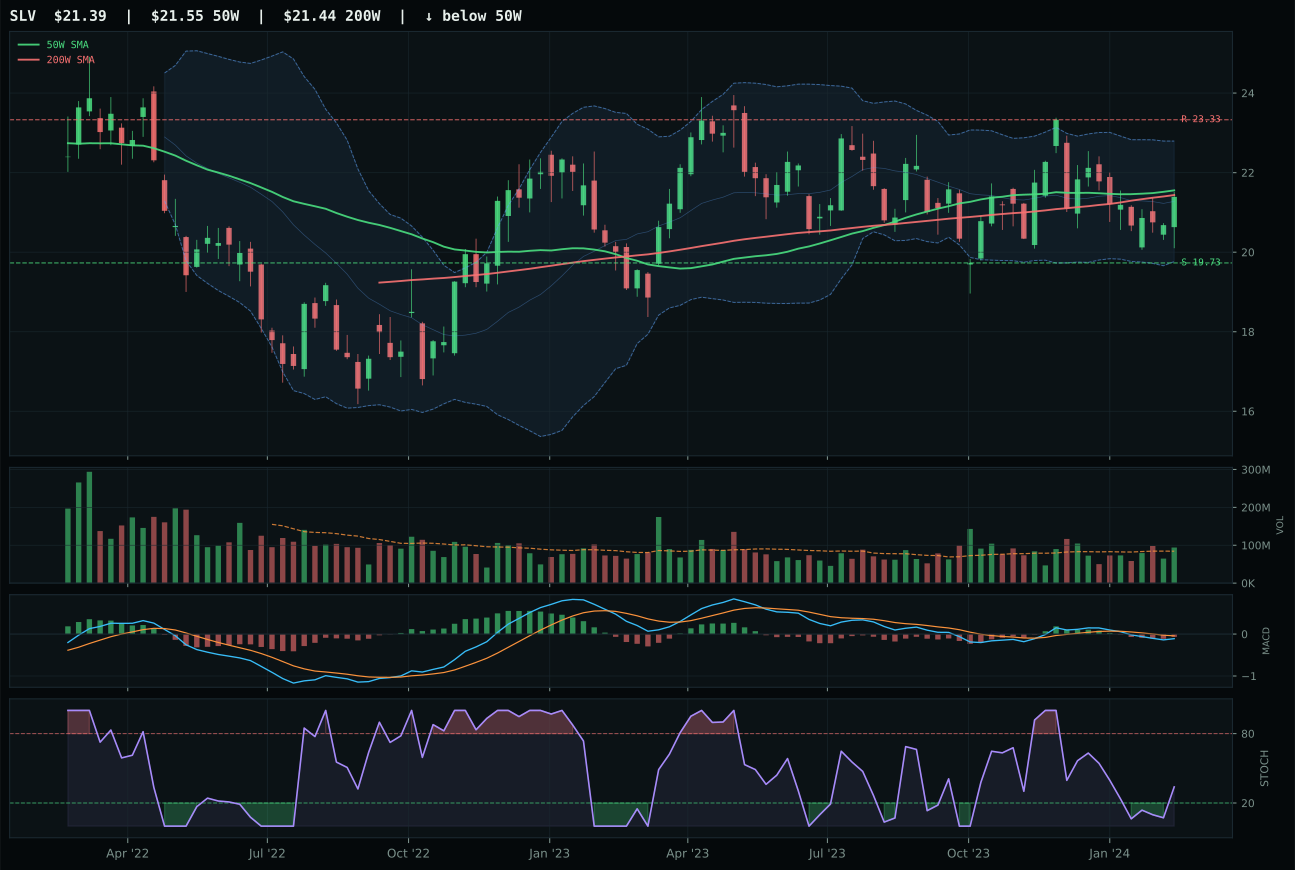
SLV has a compression near 50W profile with -12.5% 13-week relative strength versus SPY.
A failed hold above support would weaken the setup.
Actionable but governed by invalidation levels.
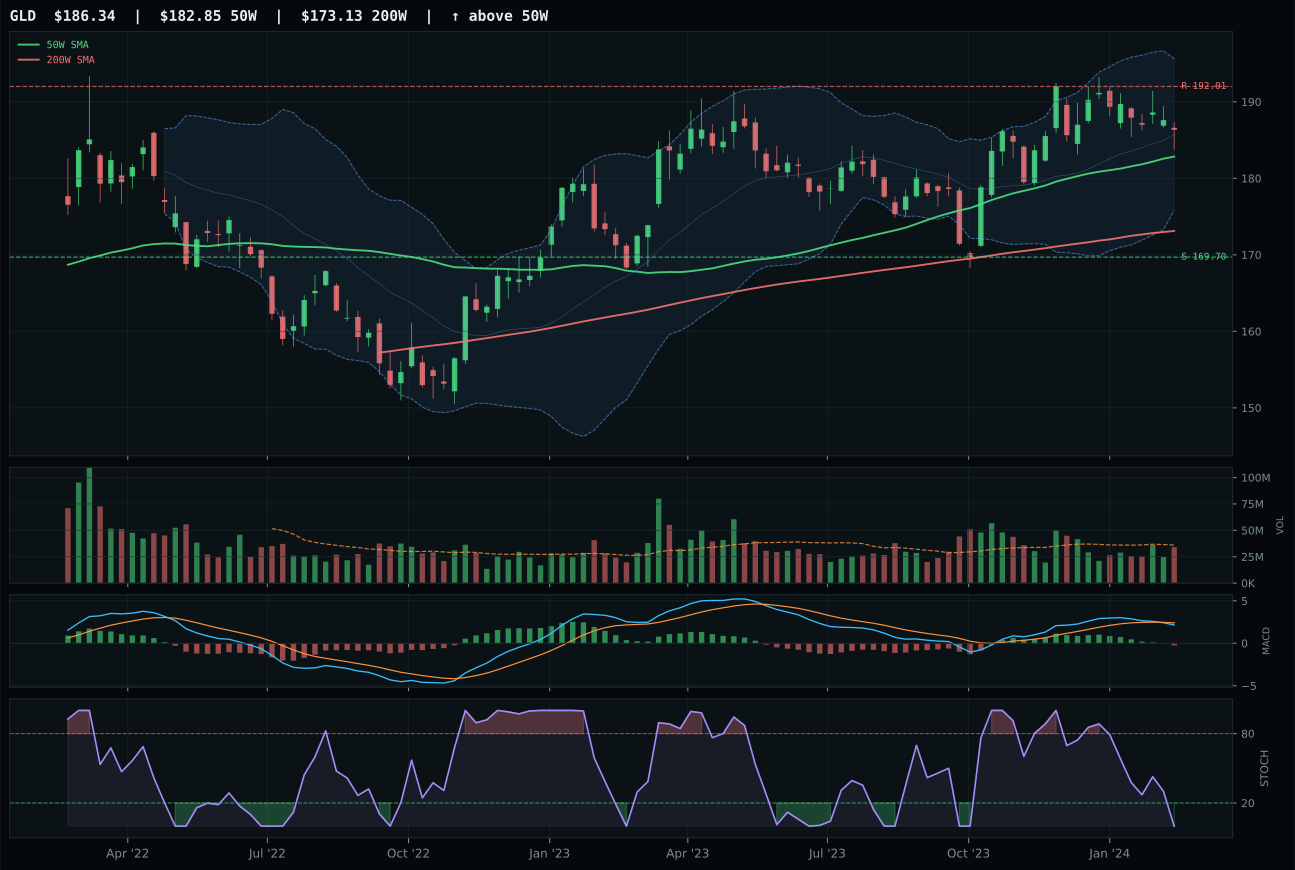
GLD has a compression near 50W profile with -9.4% 13-week relative strength versus SPY.
A failed hold above support would weaken the setup.
Actionable but governed by invalidation levels.
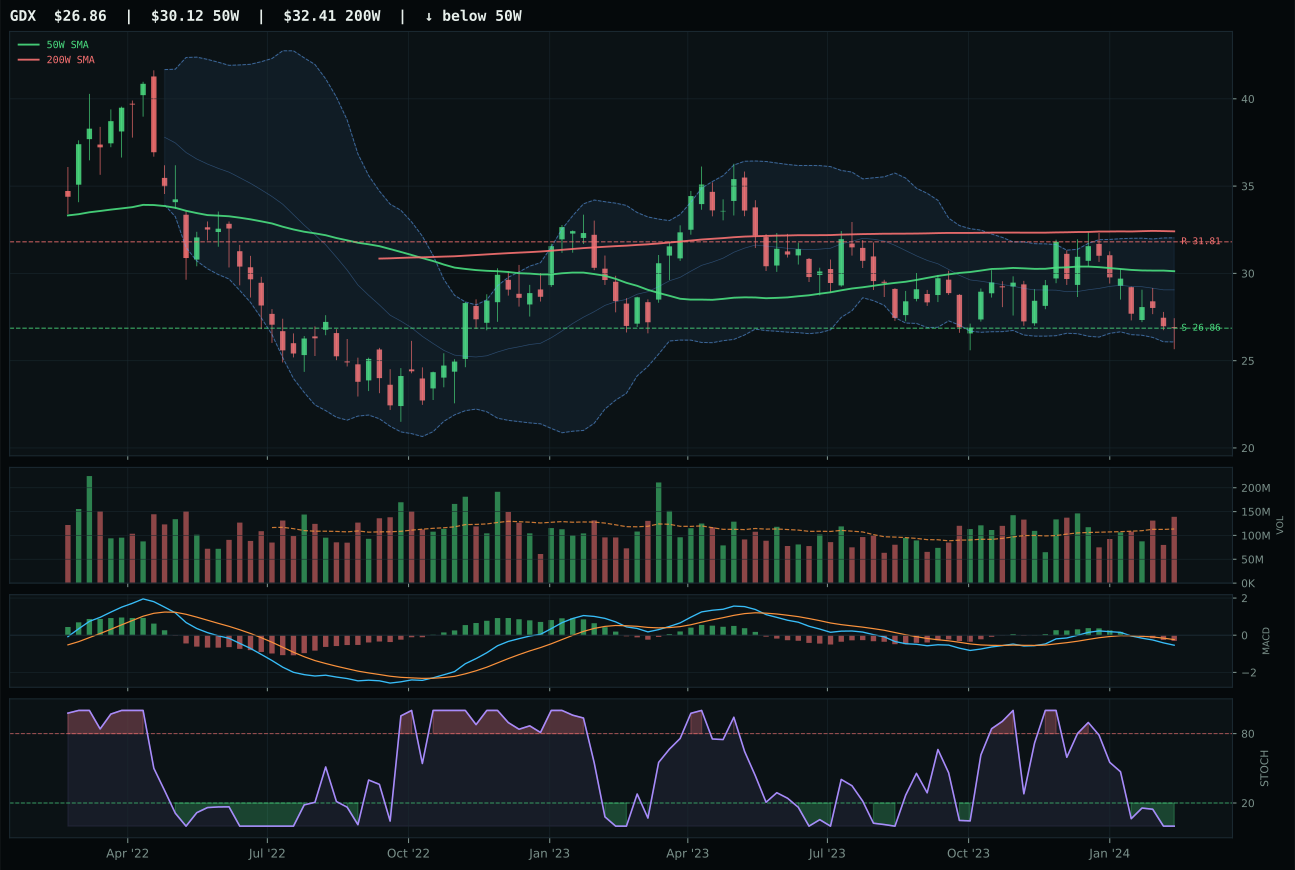
GDX has a pullback into support profile with -16.3% 13-week relative strength versus SPY.
Extension and support failure are the main tactical risks.
Tracked, but not top-2 eligible because: structurally broken.
GLD wins precious metals by a thin 1.9-point margin over SLV, capturing the representative role despite SLV's superior technical evidence score (62.3 versus 44.9). The decision hinges on setup cleanliness and category-relative strength: GLD holds 73.3 structure score versus SLV's 70.3, and GLD's category-relative strength of 3.1% beats SLV's 0.0%, indicating GLD is the preferred expression within the metals basket. Both names sit compressed near the 50W (GLD 1.9% above, SLV 2.3% above), offering tight timing with Fib zones in upper retracement. MACD diverges critically: GLD's is bearish and weakening while SLV's is bearish but improving, suggesting SLV has slightly more momentum uptick potential. However, SLV's volume (above-average participation at 1.71x 20W) and stochastic RSI (rising mid-zone at 0.63) signal more aggressive absorption, making SLV technically superior on paper. GLD wins because its compression is cleaner and its category leadership within the three-ETF basket (GLD, SLV, GDX) gives it the nod as the steadier hedge vehicle; SLV's industrial hybrid beta and better momentum setup are subordinate to GLD's monetary clarity.
Precious Metals holds a tier-2 5% allocation and ranks outside the top two, justified as a liquidity and credit stress hedge rather than a momentum position. The category score of 37.7 sits below top-2 thresholds because technical evidence is weak (momentum confirmation is only 24.6/100 and persistence 43.2/100) and macro fit is mixed. Disinflation pressure is active at +8 points, which helps metals on a real-rate basis, but risk appetite positive is flagged at -4 points, dragging the category down. The disinflation regime does offer tailwind: falling nominal yields and lower inflation expectations can stabilize gold valuations. However, the regime's risk-on bias and AI growth sponsorship pull capital toward equities and semiconductors instead. A 5% allocation in GLD provides ballast—a consolidation setup near the 50W suggests the metal is not collapsing, but it is not attracting fresh flows. To push metals to tier-1 status would require either a credit stress escalation, equity market correction, or an explicit shift in the macro descriptor profile away from risk appetite positive.
Nuclear Energy — NLR
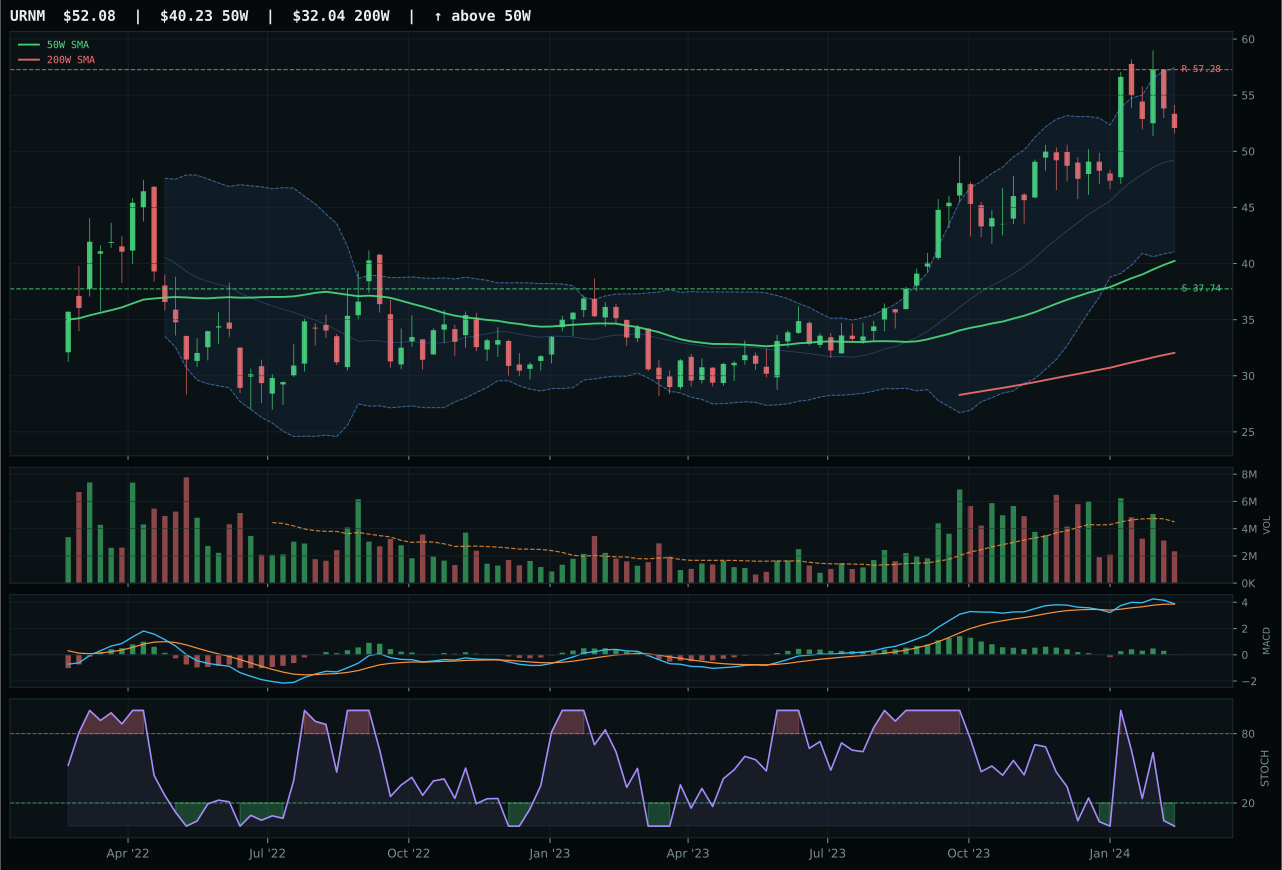
URNM has a vertical extension profile with -4.7% 13-week relative strength versus SPY.
A failed hold above support would weaken the setup.
Actionable but governed by invalidation levels.
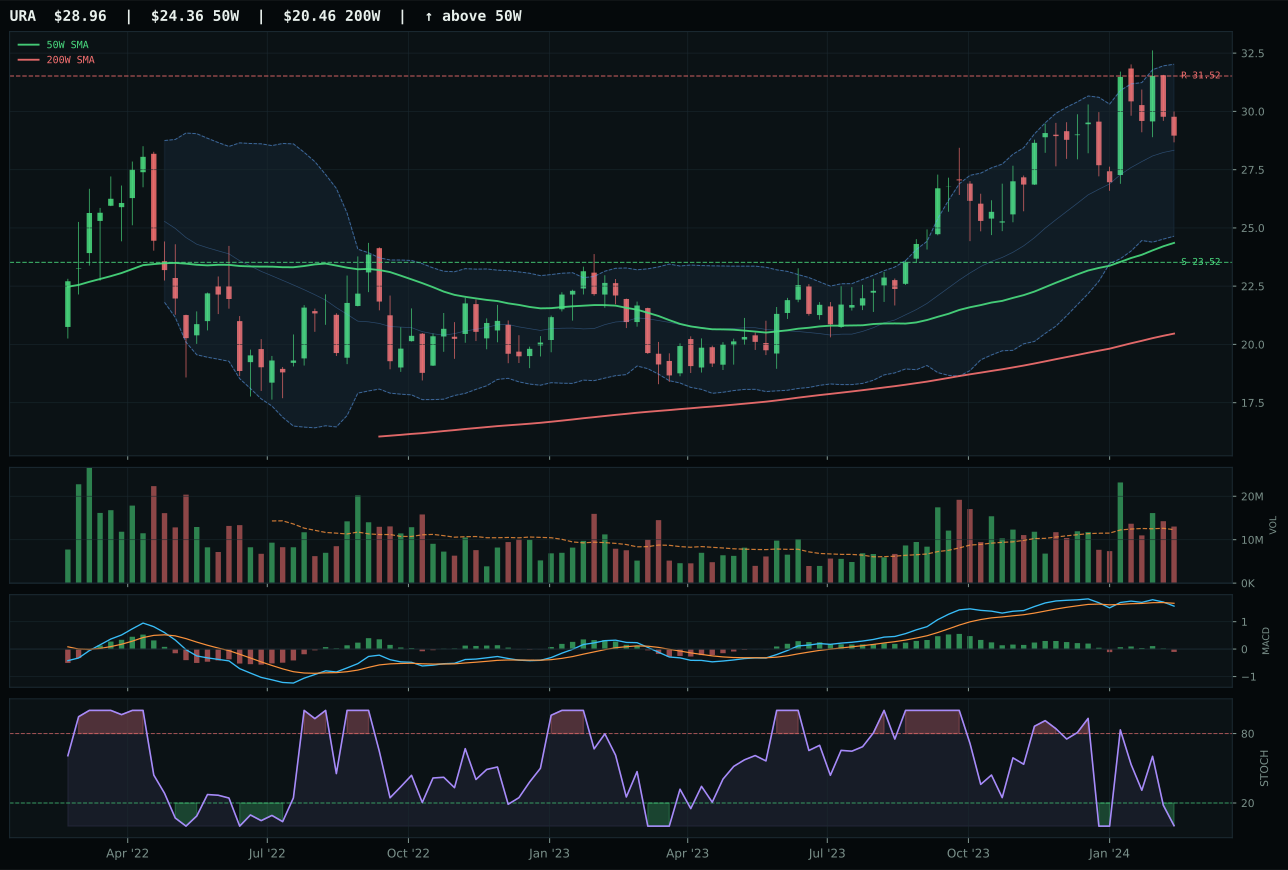
URA has a vertical extension profile with -9.7% 13-week relative strength versus SPY.
A failed hold above support would weaken the setup.
Actionable but governed by invalidation levels.
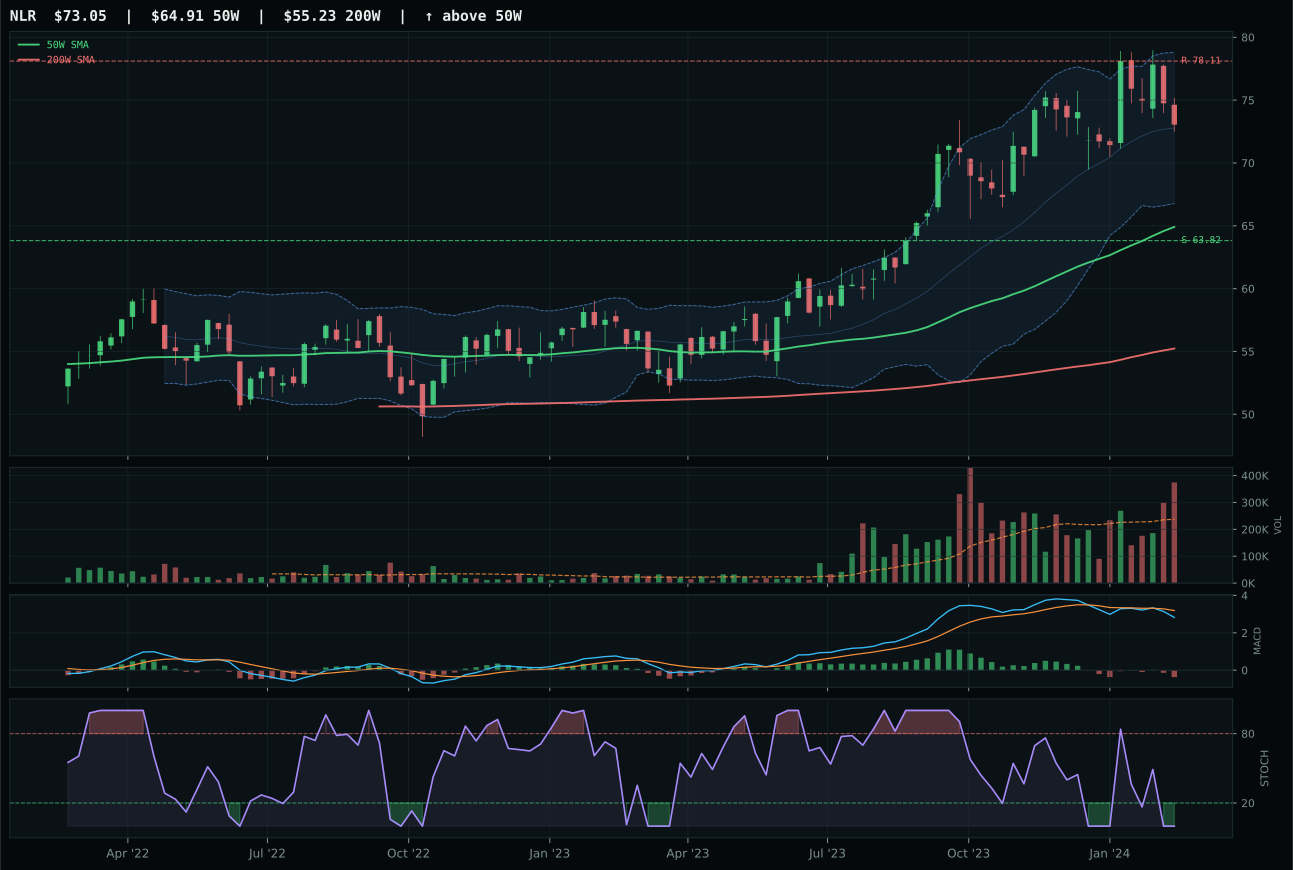
NLR has a neutral structure profile with -12.4% 13-week relative strength versus SPY.
A failed hold above support would weaken the setup.
Actionable but governed by invalidation levels.
NLR wins nuclear energy by 9.9 points over URNM despite URNM's vastly superior technical evidence (44.6 versus 0.0 on NLR), a collapse driven by NLR's superior timing and structural simplicity. URNM extends 29.4% above the 50W with a vertical extension setup and bullish-but-flattening MACD, pricing in strong uranium-miner sentiment; NLR sits only 12.5% extended with neutral structure and bearish-weakening MACD, making it the less aggressive choice. NLR's timing score (70.0) crushes URNM's (48.0) because price sits closer to the 50W in upper retracement, signaling better balance than URNM's extreme extension. Stochastic RSI is oversold on both (0.00), but NLR's neutral structure offers more room for support consolidation, while URNM's vertical extension leaves it vulnerable to profit-taking. Category-relative strength barely separates them (URNM +5.1% versus NLR -2.7%), but NLR's cleaner setup and lower entry risk justify the win. Volume distribution pressure on NLR (1.58x 20W) and thin participation on URNM add to the complexity, but the timing advantage to NLR is decisive in a near-tied momentum race.
Nuclear Energy holds a tier-2 5% allocation despite the category's profound technical weakness because the macro descriptor AI growth sponsorship (+5 points) and the risk appetite positive shift (+5 points in the category mix) offer structural support to uranium demand. The final category score of 35.4 reflects a 62/38 split where technical evidence is poor but macro narrative is constructive. URNM scored highest in the reasoned proof order at 44.0 but NLR won the category representative slot on timing and structure cleanliness—a critical reminder that the reasoned order and the final winner are not the same. Credit stress is active (-5 points), creating headwind, and liquidity stress is active (-7 points), which constrains the entire category. The case for 5% is purely macro: uranium scarcity and nuclear demand growth are real trends that survive the current disinflation phase because AI data centers require baseload power and governments are repositioning nuclear as climate-friendly. However, NLR's -1.6% 13W return and 0.0/100 momentum confirmation score warn that this is a contrarian long—a bet that sentiment shifts, not a position with current technical sponsorship. The allocation assumes patient capital willing to hold through choppy pricing.
Utilities & Infrastructure — PAVE
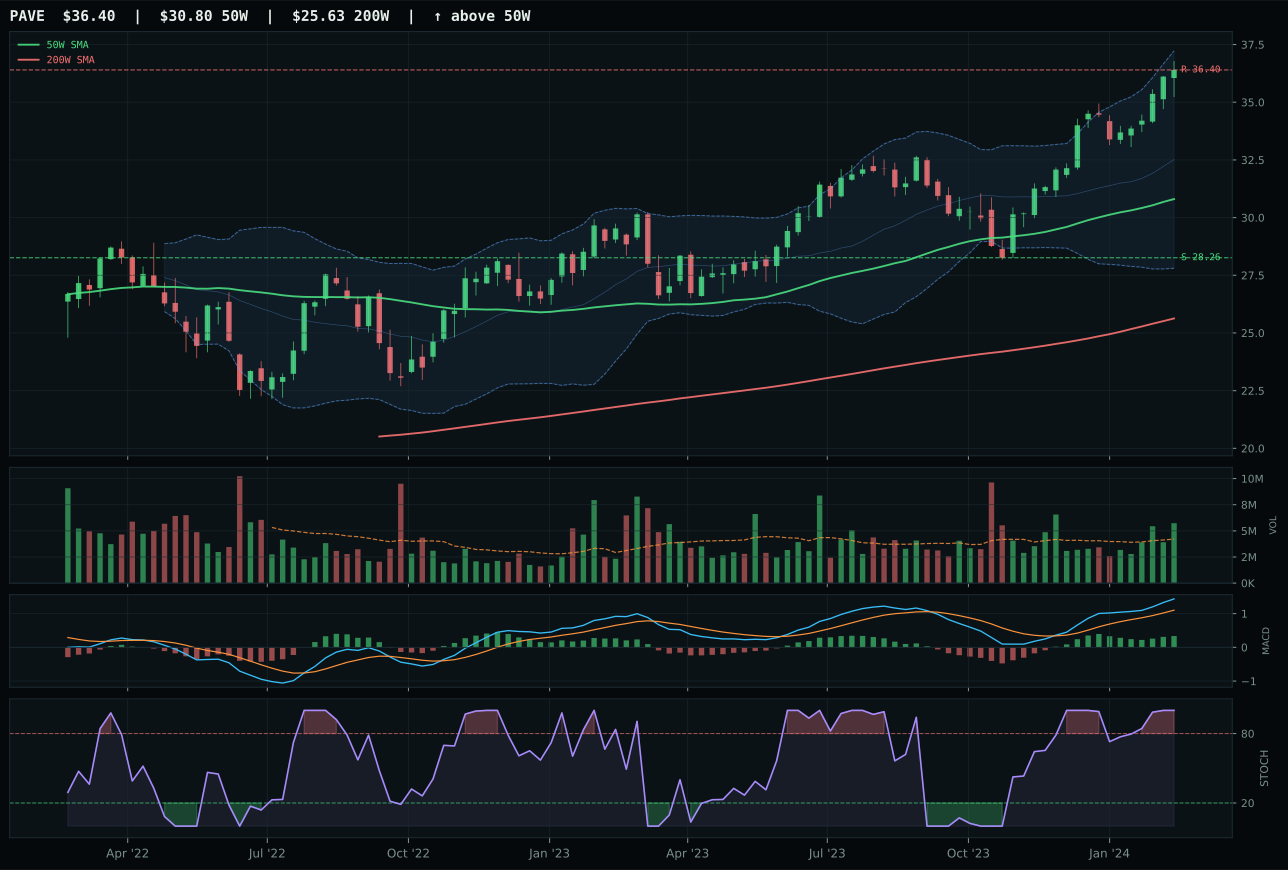
PAVE has a vertical extension profile with 5.6% 13-week relative strength versus SPY.
A failed hold above support would weaken the setup.
Actionable but governed by invalidation levels.
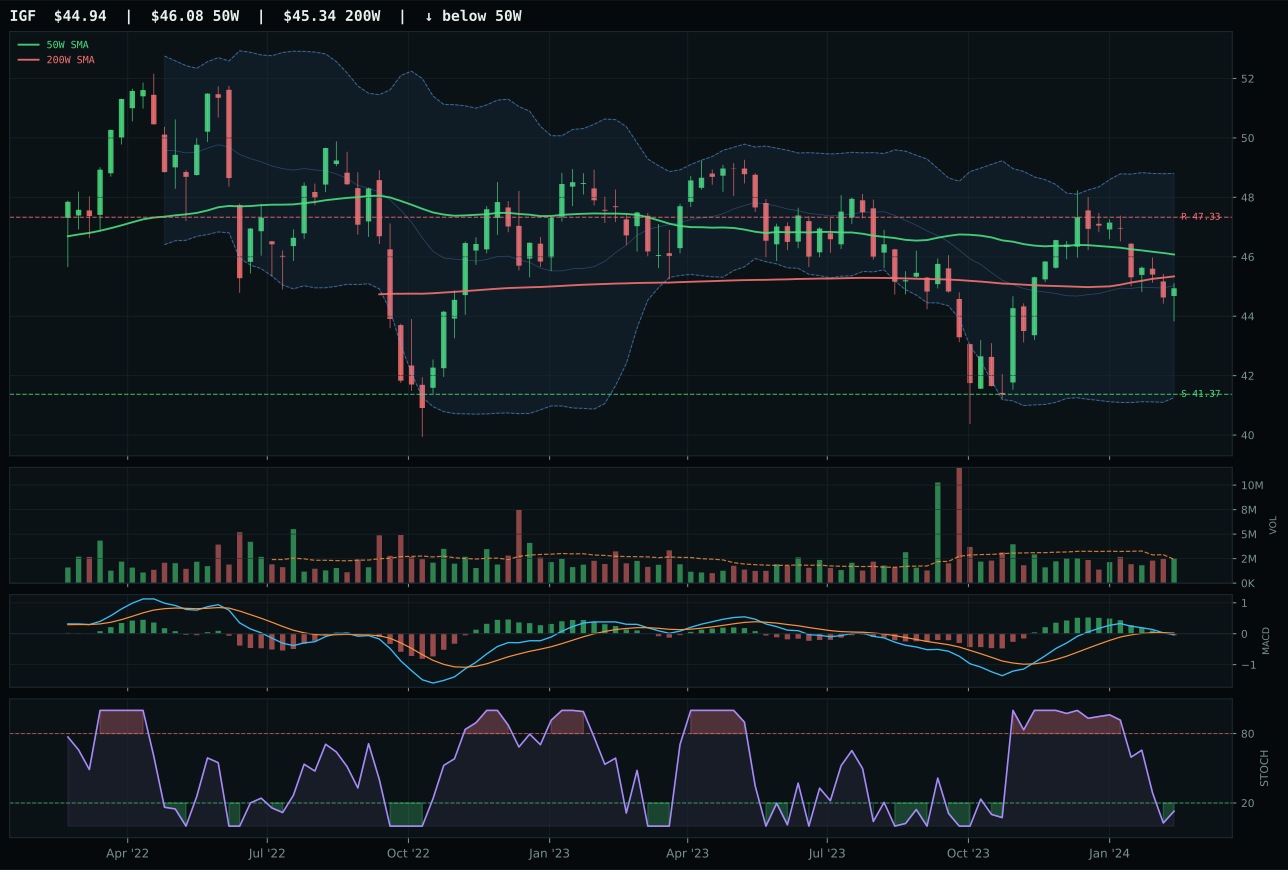
IGF has a compression near 50W profile with -11.6% 13-week relative strength versus SPY.
A failed hold above support would weaken the setup.
Actionable but governed by invalidation levels.
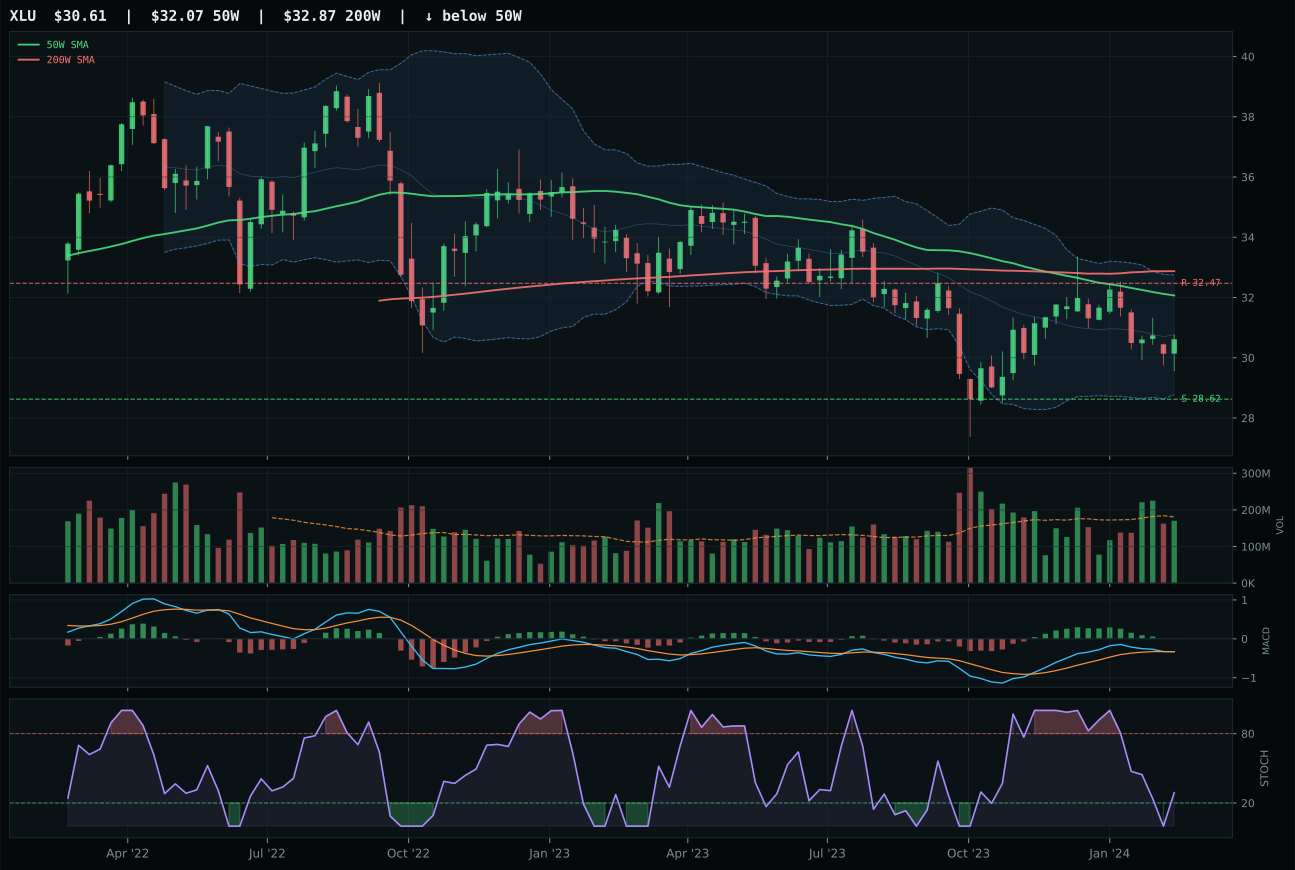
XLU has a neutral structure profile with -12.5% 13-week relative strength versus SPY.
Extension and support failure are the main tactical risks.
Tracked, but not top-2 eligible because: structurally broken.
PAVE dominates utilities and infrastructure, defeating IGF by a stunning 29.8 points—the largest single-category margin in this week's allocation. PAVE extends 18.2% above the 50W with a vertical extension setup, but the technical quality is exceptional: 85.4 structure score, 83.3% cleanliness, 100.0 trend score (price above both moving averages with 0.4% 50W slope), and critically, MACD bullish and improving versus IGF's bearish and weakening. PAVE's 13W return of 16.4% shatters IGF's -0.8%, and category-relative strength (PAVE 17.3% versus IGF 0.0%) confirms PAVE is the only name with institutional sponsorship. Volume on PAVE is above-average at 1.36x 20W and confirms accumulation; IGF's neutral volume shows no conviction. Stochastic RSI is overbought momentum on PAVE (1.00) and oversold on IGF (0.00), the extremes of price action divergence. This is not a close call—PAVE is the clear portfolio leader within utilities, with domestic infrastructure capex and roadwork demand driving breadth.
Utilities & Infrastructure holds a tier-2 5% allocation based on PAVE's exceptional technical evidence (93.5/100) and the category's macro alignment with disinflation and infrastructure spend. The final category score of 33.2 sits below top-2 thresholds because PAVE's 87.0/100 persistence and 82.5/100 volume-price confirmation are strong but not enough to overcome modest tier-1 tier opportunities in Technology and AI. The category-level macro fit of 62.0/100 is the highest among tier-2 slots, reflecting genuine tailwind from disinflation (+7 points) and active descriptor support for infrastructure capex. Risk appetite positive is active but flagged as a -2 point drag (suggesting some infrastructure themes overbought in the bounce), while liquidity stress active (-3 points) and credit stress active (-5 points) create modest headwind. PAVE's 16.4% 13W return demonstrates that infrastructure is not a defensive play but a growth bet on Biden-era capex acceleration meeting disinflation stimulus. The extension and overbought oscillators require honest entry discipline, but the 5% allocation captures genuine domestic-demand momentum without overcommitting to what is clearly an extended chart. This position will be first to trim if PAVE fails the 28.26 support or MACD rolls over.
Emerging Markets — INDA
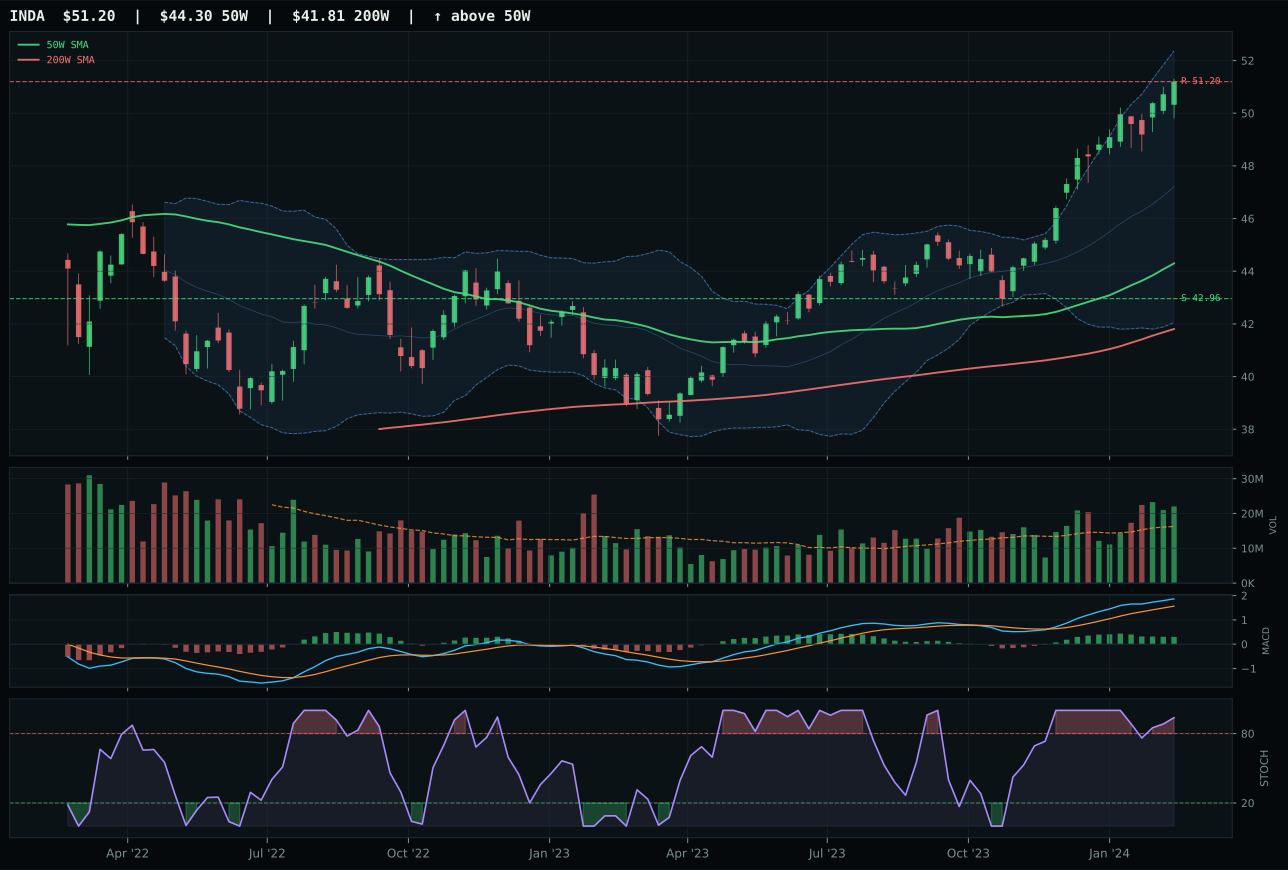
INDA has a vertical extension profile with 2.8% 13-week relative strength versus SPY.
A failed hold above support would weaken the setup.
Actionable but governed by invalidation levels.
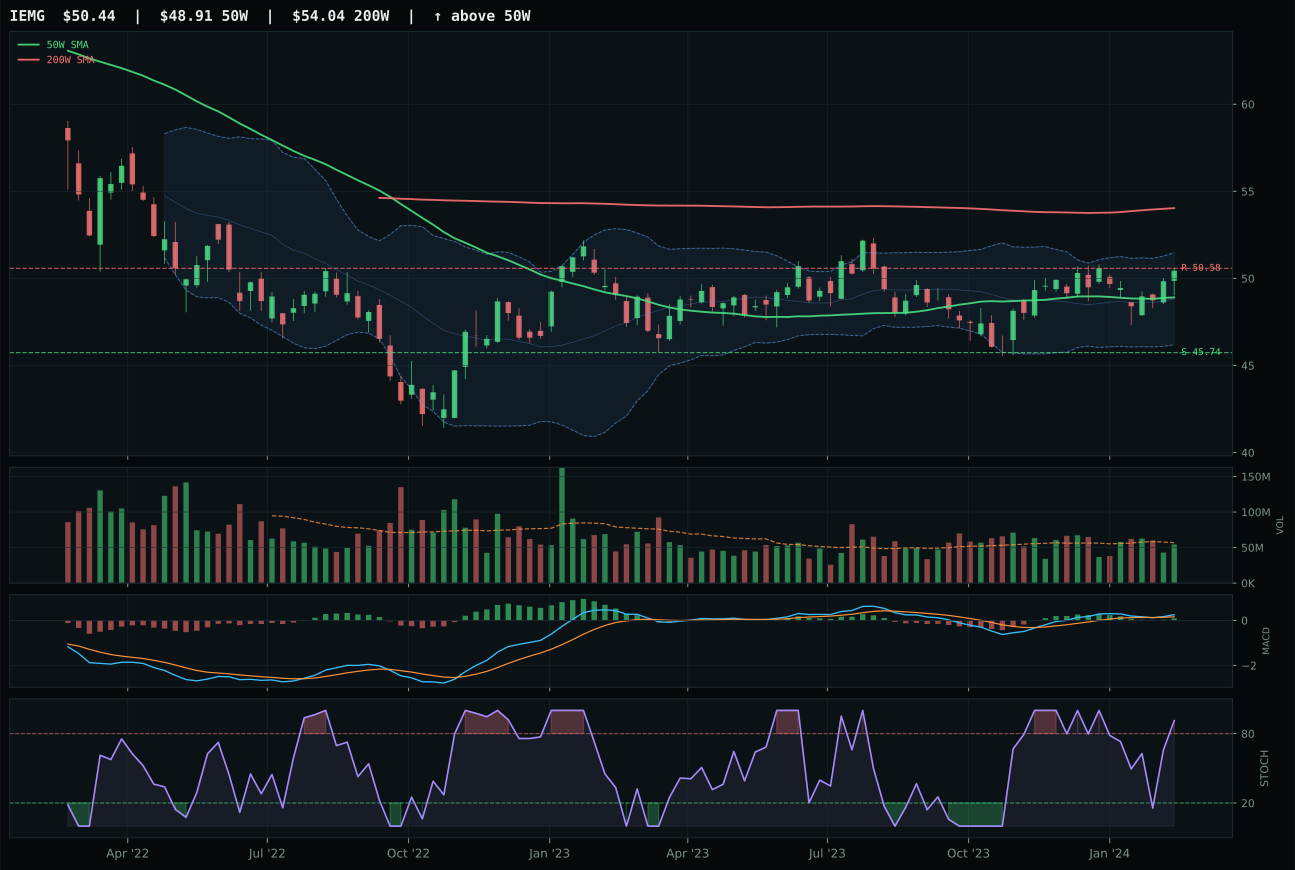
IEMG has a neutral structure profile with -8.6% 13-week relative strength versus SPY.
A failed hold above support would weaken the setup.
Actionable but governed by invalidation levels.
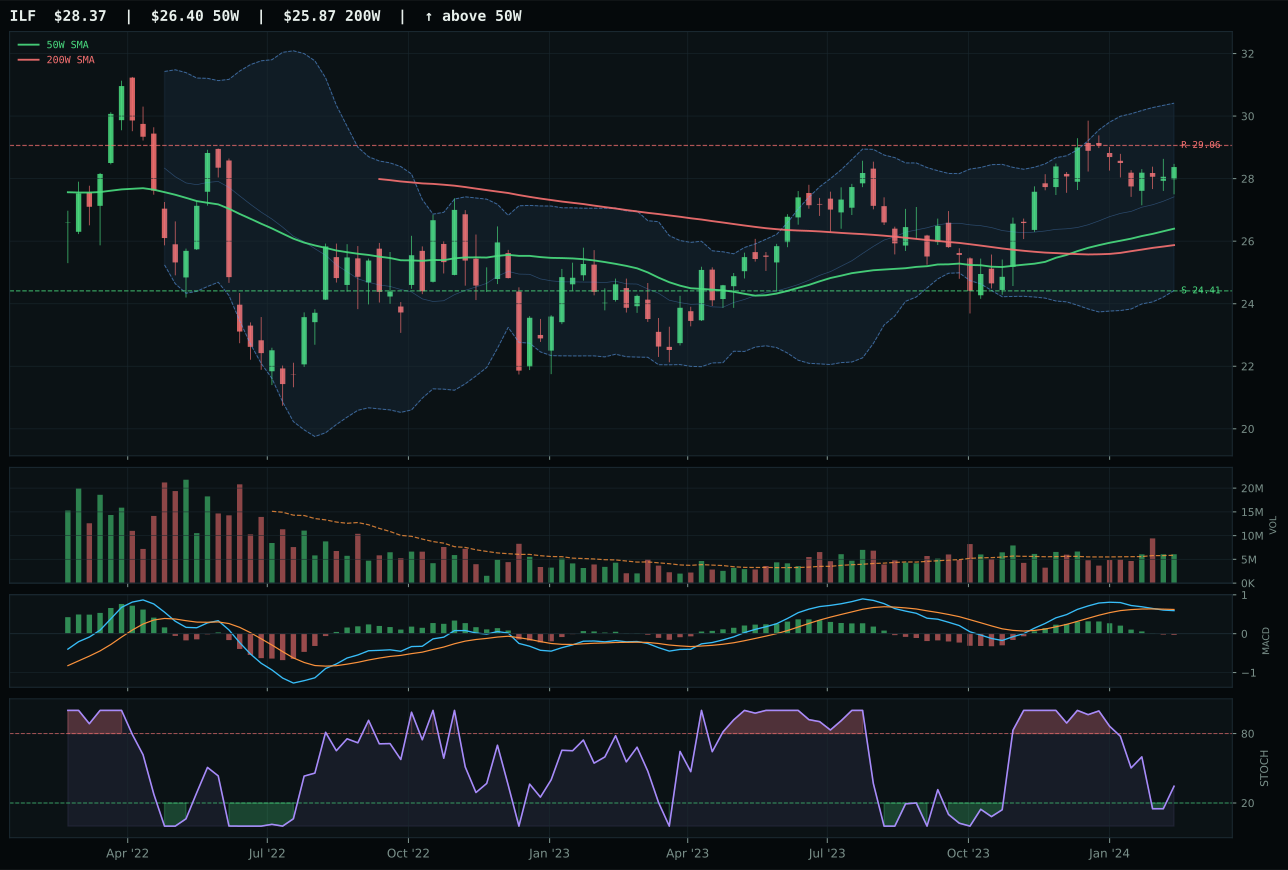
ILF has a neutral structure profile with -7.9% 13-week relative strength versus SPY.
A failed hold above support would weaken the setup.
Actionable but governed by invalidation levels.
INDA defeats IEMG by a mere 0.5 points in a photo-finish category decision, winning on structure cleanliness and volume sponsorship rather than on fundamental momentum shift. INDA extends 15.6% above the 50W with a vertical extension setup and 86.2 structure score (including 83.3% cleanliness), while IEMG holds neutral structure at 73.1 and lower cleanliness, immediately signaling INDA's superior technical hygiene. INDA's 13W return of 13.7% towers over IEMG's 2.3%, and category-relative strength (INDA 10.8% versus IEMG -0.6%) confirms India is the accretive story within emerging markets. Volume on INDA (above-average at 1.35x 20W) signals active accumulation; IEMG's neutral volume suggests indifference. MACD is bullish but flattening on INDA and bullish and improving on IEMG, a minor edge to IEMG, but stochastic RSI oversold on both at 0.94 (INDA) and 0.92 (IEMG) removes any timing differentiation. INDA's SPY relative strength of 2.8% and category leadership override IEMG's broader market exposure; India's growth profile outweighs diversification in this regime.
Emerging Markets earned a tier-2 5% allocation despite ranking outside top-2 because INDA's 82.1/100 technical evidence and 100/100 momentum confirmation offer genuine growth optionality in a portfolio overweight in defensive metals and energy. The final category score of 30.7 is dragged down by macro fit of only 38.0/100 because credit stress is active (-10 points) and liquidity stress is active (-10 points), both significant headwinds for EM. Risk appetite positive provides a +8 point offset, which keeps the category barely solvent. The disinflation regime is neutral to slightly negative for broad emerging markets because falling yields reduce carry trade attraction and slower global growth dampens demand. However, INDA specifically benefits from AI infrastructure buildout—chip design, software talent, data center demand—all themes that transcend the macro regime. India's 13.7% 13W return demonstrates that this is not a mean-reversion coil but genuine momentum from structural demand. To earn tier-1 status would require either the macro descriptor profile to shift away from credit stress and liquidity stress, or INDA's extension at 15.6% above the 50W to consolidate and re-offer entry. For now, 5% is a growth sleeve: modest, but positioned for the next leg of AI-driven capex if EM sentiment stabilizes.
Agriculture & Livestock — VEGI
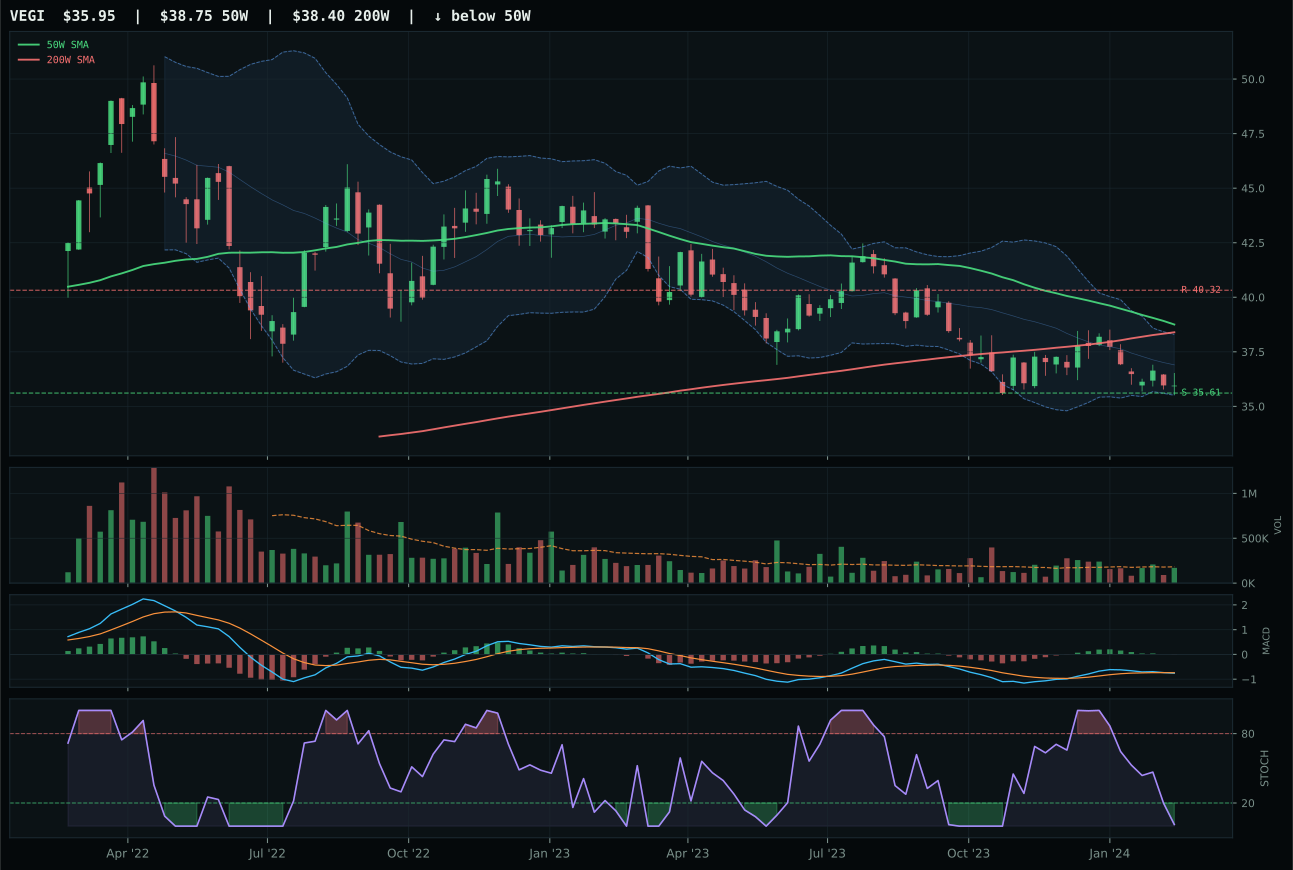
VEGI has a pullback into support profile with -14.4% 13-week relative strength versus SPY.
A failed hold above support would weaken the setup.
Tracked, but not top-2 eligible because: .
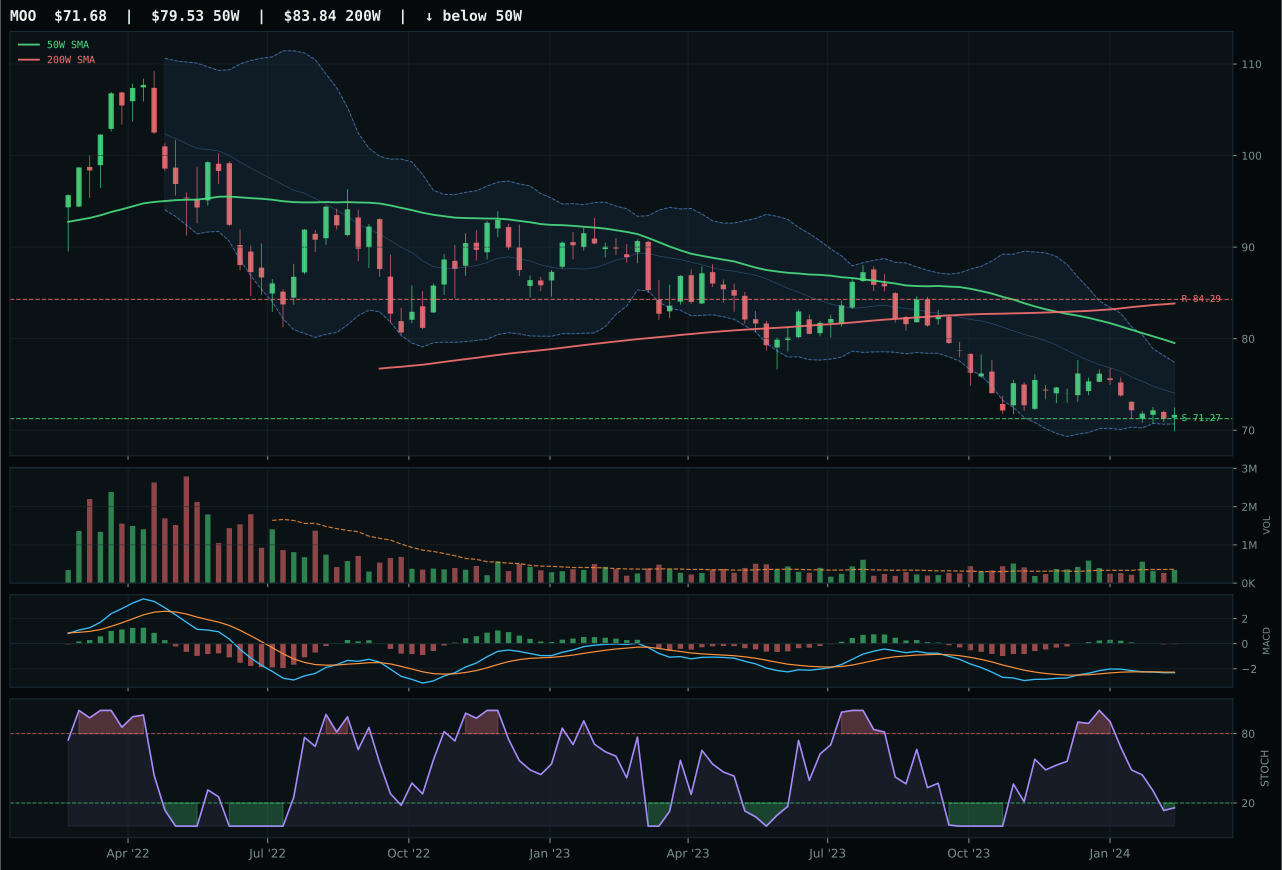
MOO has a pullback into support profile with -15.9% 13-week relative strength versus SPY.
Extension and support failure are the main tactical risks.
Tracked, but not top-2 eligible because: structurally broken.
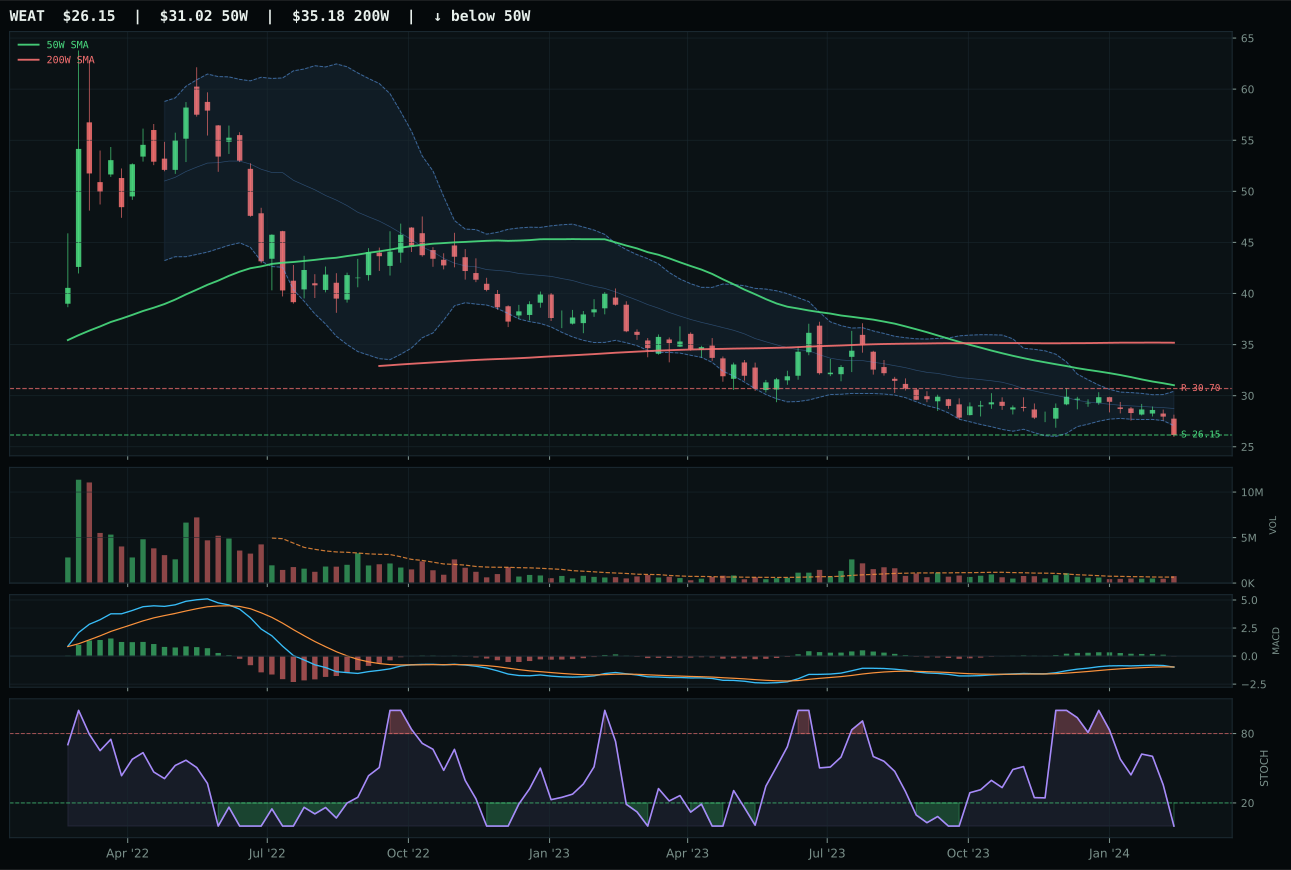
WEAT has a pullback into support profile with -16.9% 13-week relative strength versus SPY.
Extension and support failure are the main tactical risks.
Tracked, but not top-2 eligible because: structurally broken.
VEGI wins the agriculture category by 10.7 points over MOO, though both are fundamentally broken setups—VEGI simply breaks less badly. Price sits 7.2% below the 50W and below the 200W entirely, placing both names in repair/pullback-into-support mode. VEGI's structure score (67.8) edges MOO's (40.2) because the chart is pulling toward support at 35.61 with cleaner compression ratios, offering a defined support zone and a mathematical risk/reward of 90.0/100 upside to resistance versus only 1.0% downside to support. MACD is bearish and weakening on both, stochastic RSI sits oversold at 0.01 on VEGI, and volume is neutral across both names. The category-relative strength separates them: VEGI at 1.5% versus MOO at 0.0%, indicating VEGI is at least outperforming its peers in a sinking boat. Thirteen-week returns are negative (VEGI -3.6%, MOO -5.0%), confirming this category lacks sponsorship. VEGI's win is a default; it is the least-damaged name in a category that scored 0.0 after eligibility filters failed.
Agriculture & Livestock received 5% allocation this week and is, marked ineligible in the category reasoner. The final score of 0.0 reflects two hard filters: disinflation actively hurts this exposure (-6 macro points at category level), and disinflation pressure is flagged as active at -8 points additional penalty. Falling food prices and agricultural deflation are the natural outcome of the current regime, making this entire category structurally misaligned with monetary conditions. The 3/2/1 reasoned ETF proof order—VEGI 29.0, MOO 26.4, WEAT 12.0—shows no breakout candidate, and technical evidence across all three sits at or near 0.0/100 trend for the worst performers. To earn even a tier-2 5% slot, agriculture would need either a shift away from disinflation (inflation print surprise, geopolitical supply shock) or a dramatic MACD recovery and relative strength bounce. Today it has neither. The oversold stochastic and support structure in VEGI may offer a speculative entry, but it does not justify portfolio capital allocation in the current macro state.
Industrial Metals — COPX
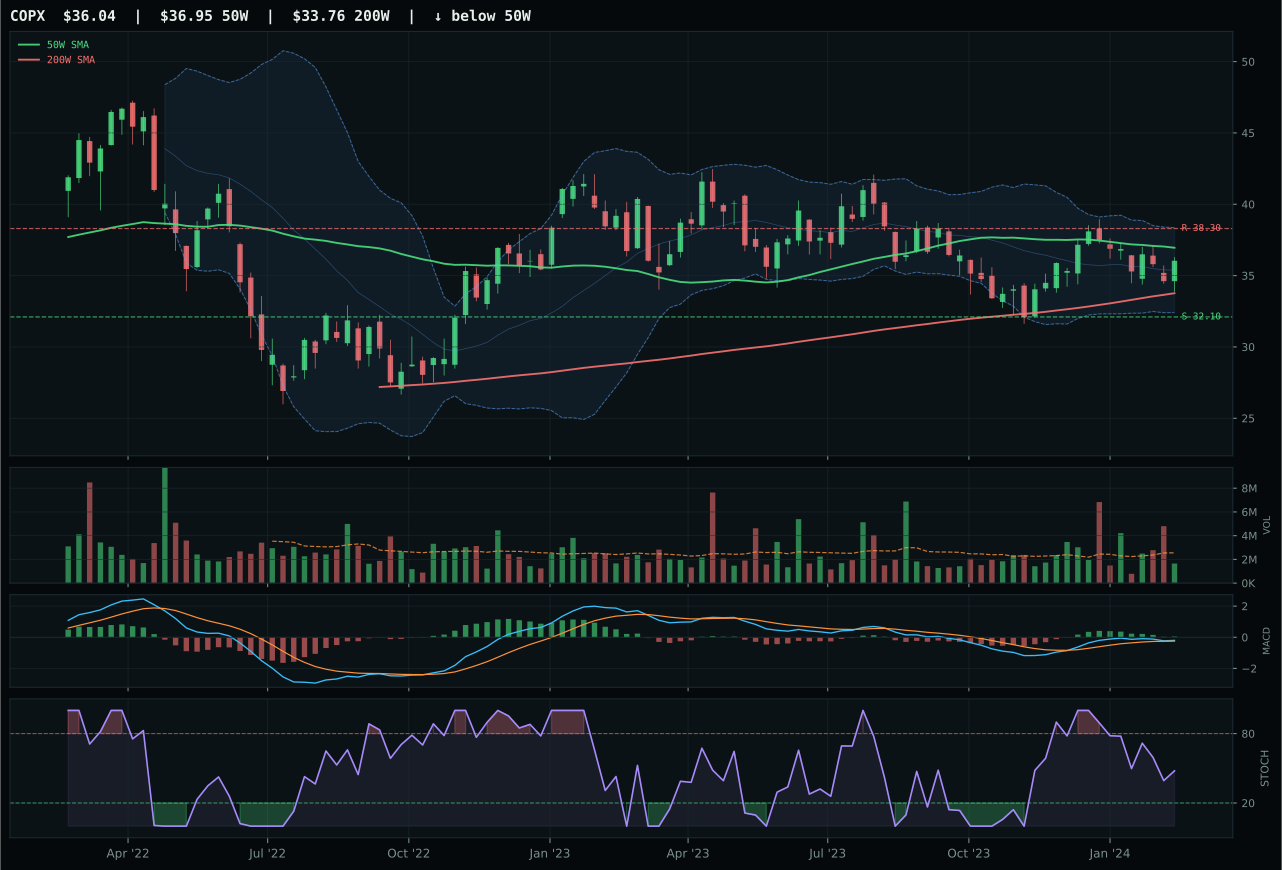
COPX has a compression near 50W profile with -4.9% 13-week relative strength versus SPY.
A failed hold above support would weaken the setup.
Actionable but governed by invalidation levels.
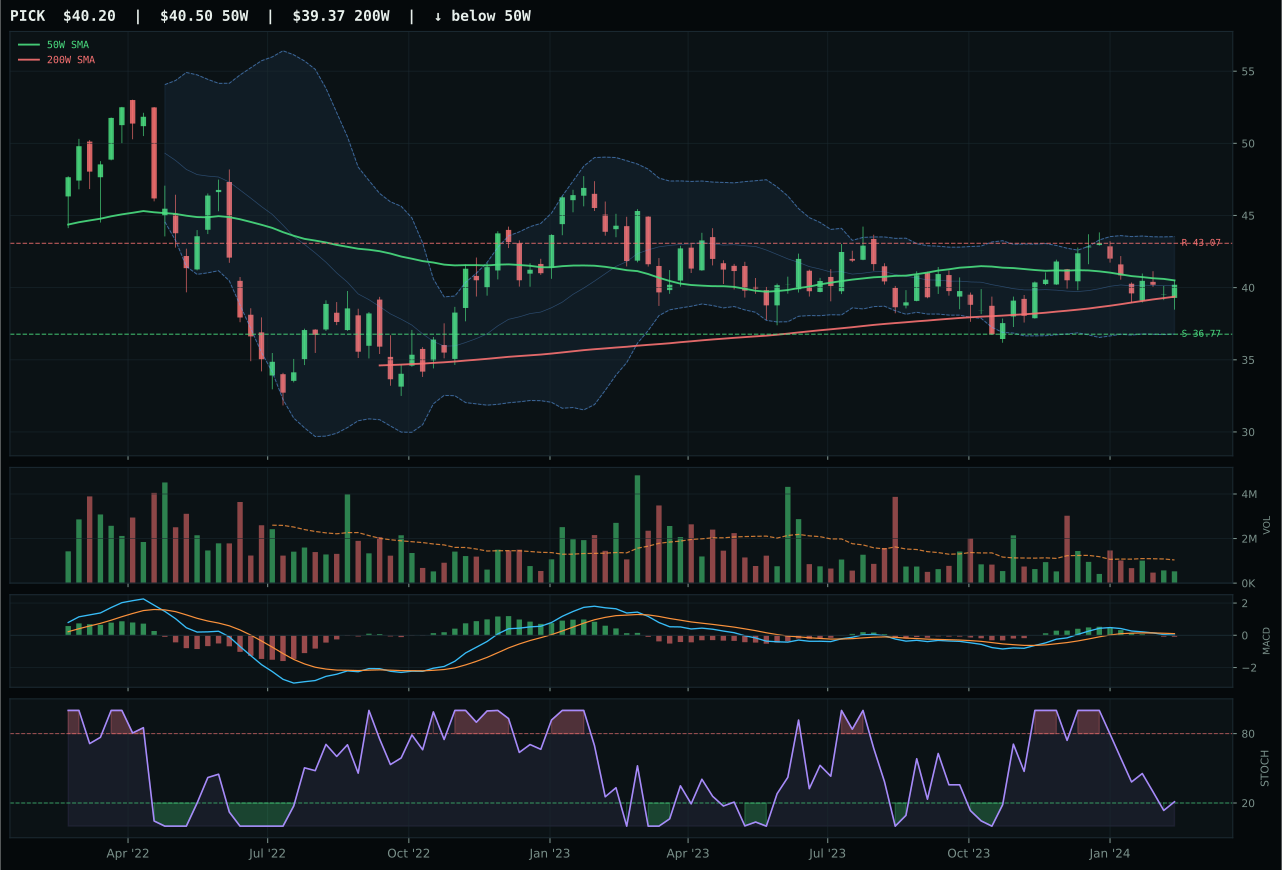
PICK has a compression near 50W profile with -11.2% 13-week relative strength versus SPY.
A failed hold above support would weaken the setup.
Actionable but governed by invalidation levels.
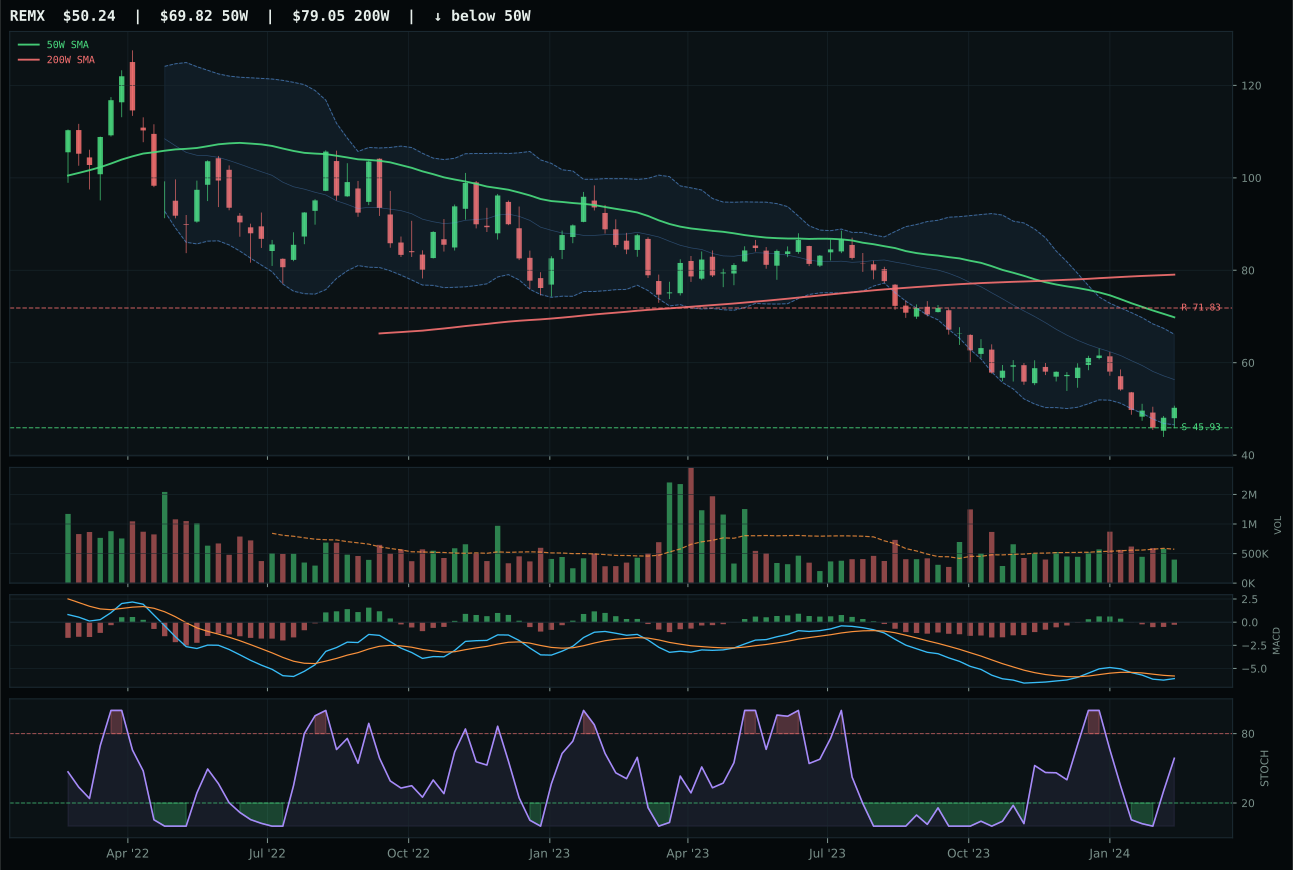
REMX has a neutral structure profile with -25.4% 13-week relative strength versus SPY.
Extension and support failure are the main tactical risks.
Tracked, but not top-2 eligible because: structurally broken.
COPX wins industrial metals by 22.8 points over PICK, a decisive gap that reflects COPX's only moderately better technical picture in a structurally challenged category. COPX sits 2.5% below the 50W but still above the 200W, positioning it as a pullback/reset rather than a collapse, while PICK's bearish MACD (versus COPX's bullish but flattening) immediately signals weaker momentum. COPX's timing score of 100.0 versus PICK's 100.0 ties on Fib placement (both in middle retracement), but COPX's category-relative strength (6.3%) demolishes PICK's (0.0%), indicating COPX is the only name with relative sponsorship within the three-ETF basket. COPX's 13W return of 5.9% edges PICK's negative -0.4%, and stochastic RSI at 0.48 (falling/neutral) offers more room for improvement than PICK's identical score. Volume is thin on both at 0.65x, but COPX's +12 metals scarcity macro boost to its individual fit score elevates it above PICK's +6. This win is narrow because both names are structurally weak; COPX simply has the only visible institutional bid.
Industrial Metals earned 0% allocation and ranks outside the portfolio entirely, excluded despite COPX's technical victory. The final category score of 25.1 fails to reach tier-2 status because macro fit is poor and technical evidence is thin across all three ETFs. Metals scarcity is active at +14 points at the category level, a genuine tailwind for industrial demand, but it is overwhelmed by liquidity stress (-8 points) and credit stress (-7 points) at the reasoned proof order. The disinflation regime offers no natural support to copper, zinc, or mining equities because the cycle's softness suppresses demand and input costs fall. COPX's 5.9% 13W return and bullish-but-flattening MACD suggest the commodity is finding a floor, but the setup requires metals scarcity to drive demand forward—something not visible in current order flows or macro conditions. To earn a 5% slot, industrial metals would need credit stress to activate or risk appetite to shift sharply. For now, the category sits dormant: tactically sound but strategically out of alignment with both the disinflation regime and the liquidity/credit environment.
Traditional Energy — XLE
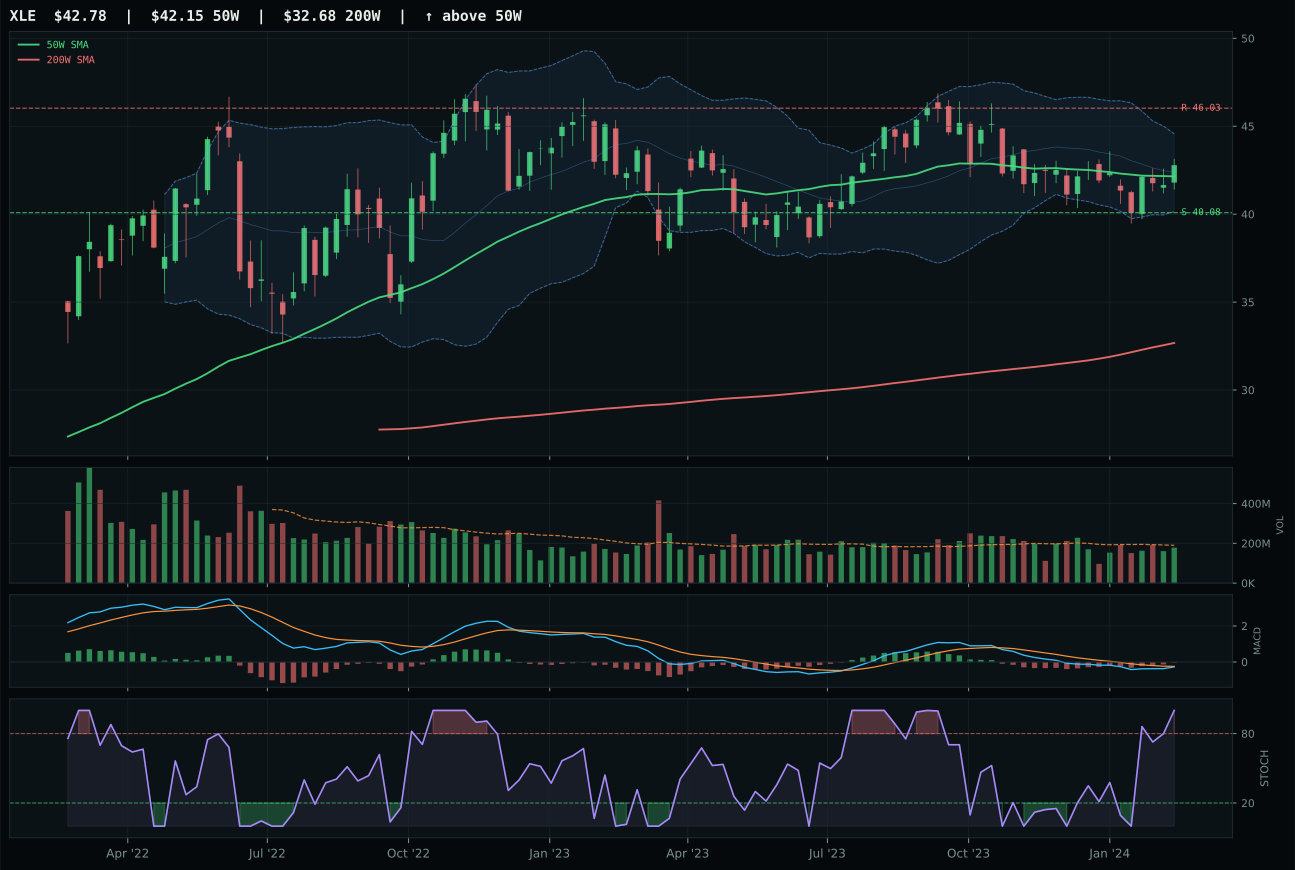
XLE has a compression near 50W profile with -9.8% 13-week relative strength versus SPY.
A failed hold above support would weaken the setup.
Actionable but governed by invalidation levels.
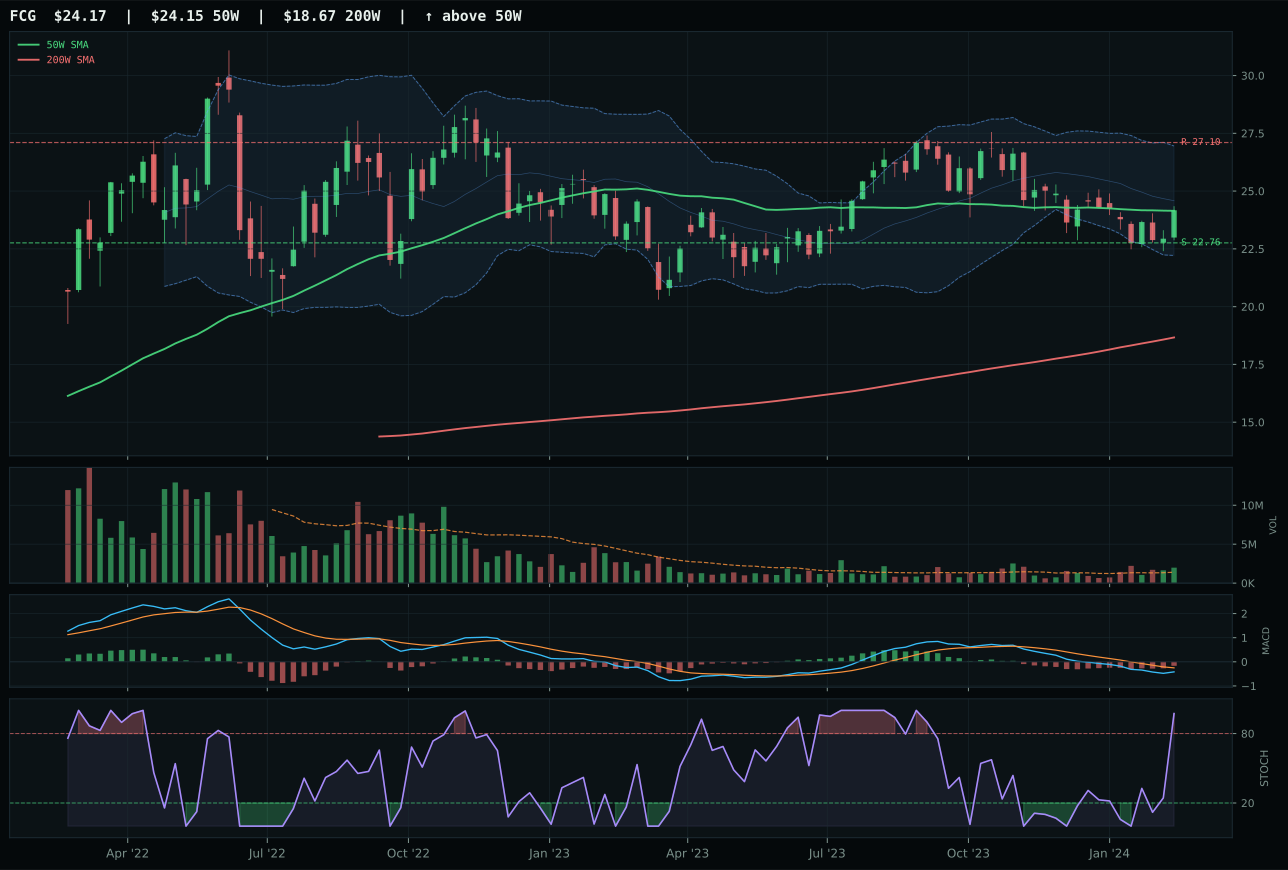
FCG has a compression near 50W profile with -14.3% 13-week relative strength versus SPY.
A failed hold above support would weaken the setup.
Actionable but governed by invalidation levels.
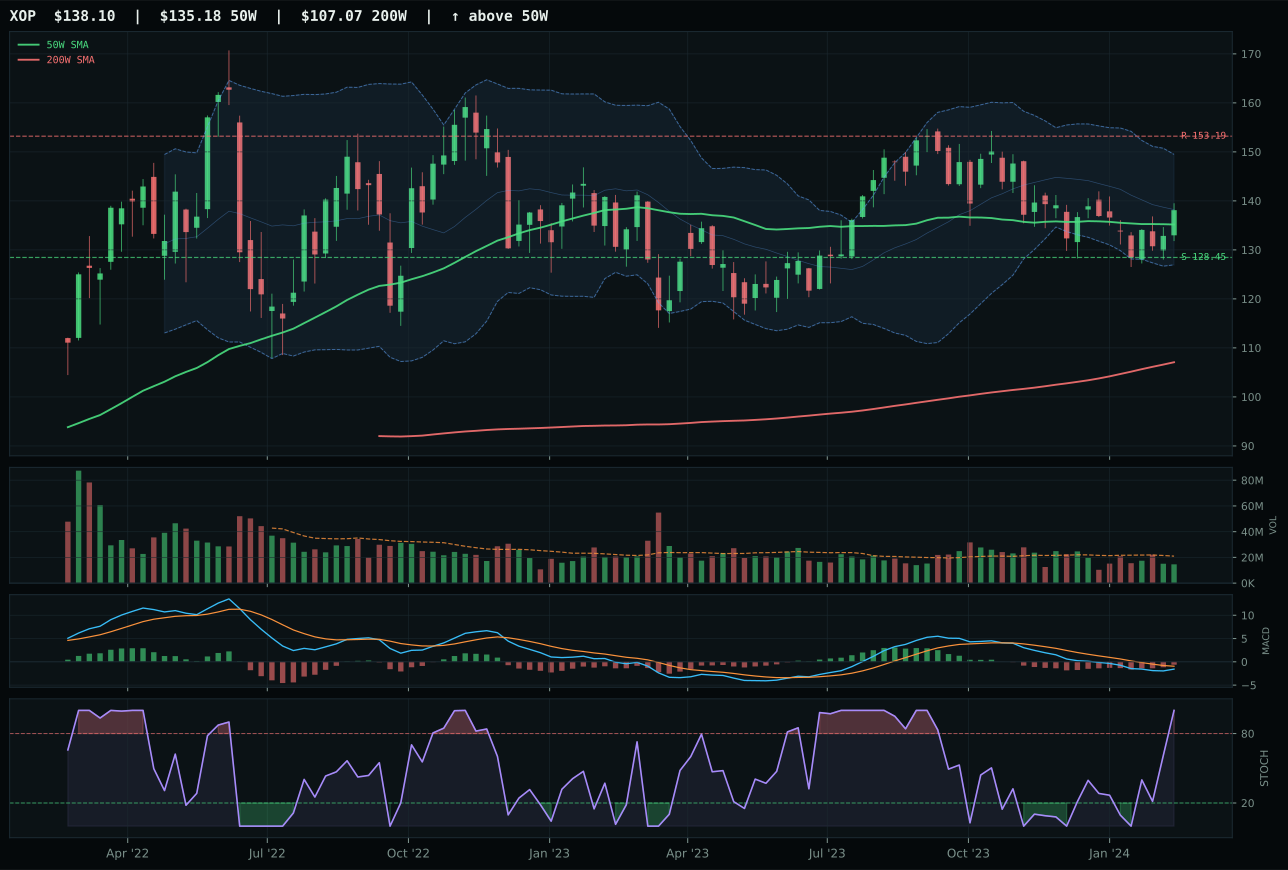
XOP has a compression near 50W profile with -11.9% 13-week relative strength versus SPY.
A failed hold above support would weaken the setup.
Actionable but governed by invalidation levels.
XLE wins traditional energy by only 3.9 points over FCG in a category so weak that the gap is nearly academic. Both names sit compressed near the 50W (XLE 1.5% above, FCG very close), offering identical timing Fib locations in the middle retracement zone. XLE's structure score (71.8) barely edges FCG's (71.1), and the separation comes from stochastic RSI (XLE overbought at 1.00 versus FCG overbought) and category-relative strength (XLE 2.2% versus FCG -2.4%). XLE's 13W return of 1.0% inches ahead of FCG's -3.5%, confirming XLE has at least stabilized while natural gas remains in decline. MACD is bearish but improving on both names, offering no clear momentum signal. Volume on XLE is neutral at 0.94x, matching FCG's participation baseline but without XLE's above-average participation on FCG, creating a slight advantage in breadth for XLE. This is not a strong win—it is the least-bad name in a category crushed by disinflation pressure.
Traditional Energy earned 0% allocation and is excluded entirely from the portfolio this week. The final category score of 9.6 is the second-lowest among all 10 categories, reflecting catastrophic macro misalignment with the disinflation regime. Disinflation hurts this exposure (-10 macro points at category level), and both disinflation pressure (-10 points) and credit stress (-7 points) and liquidity stress (-7 points) are active headwinds with no offsetting tailwind. XLE's 68.3/100 trend is respectable—price above both moving averages—but the 50W slope is flat at -0.0%, meaning momentum is stalling. The category reasoned proof order shows XLE 54.4, FCG 50.0, and XOP 41.2, a thin gradient of technical evidence with no breakout candidate. Falling inflation expectations and Fed easing bias collapse energy demand and lower realized margins. A 5% allocation would require either an inflation print surprise, OPEC production cuts that durably tighten supply, or a shift in the macro descriptor profile away from disinflation. None of these are in sight. Energy remains structurally out of favor until the macro regime shifts.