
2024-02-09
Informational purposes only. The content in this report, including allocations, analysis, and commentary, is provided solely for informational and educational purposes. It does not constitute financial advice, investment advice, trading advice, or any other type of advice. Past performance does not guarantee future results. Always conduct your own research and consult a qualified financial professional before making investment decisions.
Weekly Allocation
| Ticker | Category | Weight | Role |
|---|---|---|---|
| FBTC | 50% | Overlay | |
| SMH | AI | 10% | Top-2 (10%) |
| IGV | Technology | 10% | Top-2 (10%) |
| ITA | Defense & Aerospace | 5% | Tier-2 (5%) |
| URNM | Nuclear Energy | 5% | Tier-2 (5%) |
| PAVE | Utilities & Infrastructure | 5% | Tier-2 (5%) |
| GLD | Precious Metals | 5% | Tier-2 (5%) |
| MOO | Agriculture & Livestock | 5% | Tier-2 (5%) |
| INDA | Emerging Markets | 5% | Tier-2 (5%) |
Trade Instructions — Monday Open
Sell the tranche from 2024-01-12 (completing its 4-week hold). Buy the new tranche. Instructions show net portfolio changes — same-asset positions cancel, weight changes show the delta.
| Action | Ticker | Instruction |
|---|---|---|
| SELL | BOTZ | Sell entire BOTZ position (2.50% of portfolio) |
| SELL | CIBR | Sell entire CIBR position (2.50% of portfolio) |
| SELL | XAR | Sell entire XAR position (1.25% of portfolio) |
| BUY | SMH | Buy SMH — 40.00% of freed cash (adds 2.50% to portfolio) |
| BUY | ITA | Buy ITA — 20.00% of freed cash (adds 1.25% to portfolio) |
| BUY | IGV | Buy IGV — 40.00% of freed cash (adds 2.50% to portfolio) |
Current Portfolio After Trade
Combined holdings across all 4 active tranches. Each tranche is 25% of the portfolio.
| Ticker | % of Portfolio | Weight Bar |
|---|---|---|
| FBTC | 50.00% | |
| SMH | 10.00% | |
| URNM | 5.00% | |
| PAVE | 5.00% | |
| MOO | 5.00% | |
| GLD | 5.00% | |
| XLK | 5.00% | |
| ITA | 5.00% | |
| IGV | 5.00% | |
| XLE | 2.50% | |
| COPX | 1.25% | |
| INDA | 1.25% |
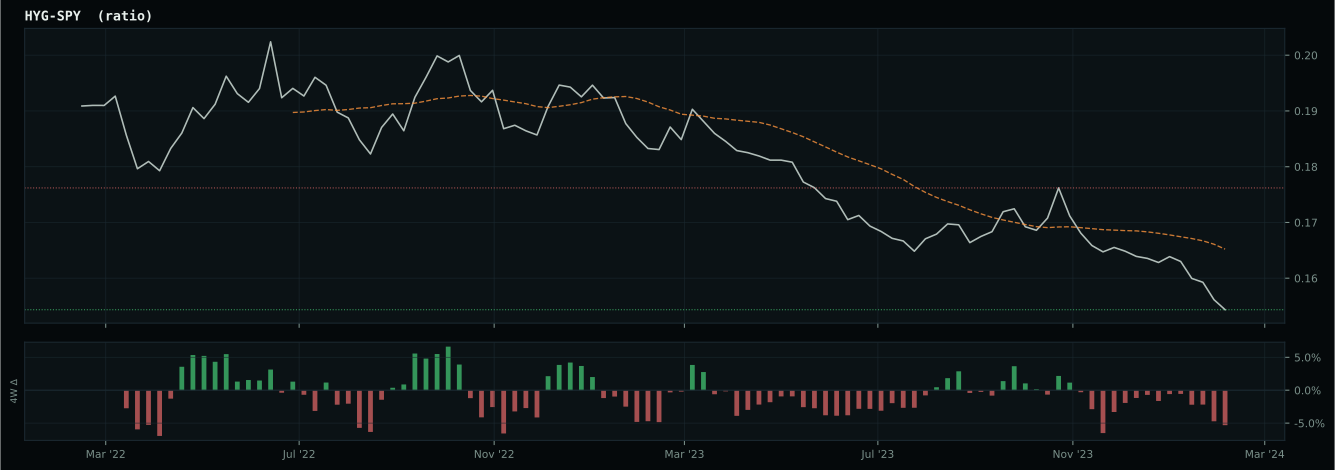
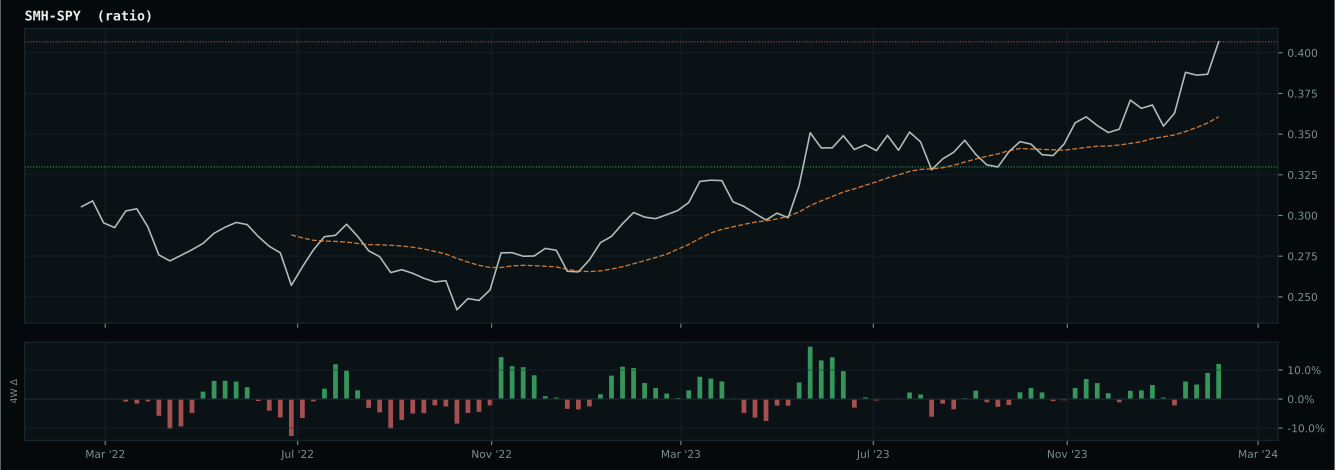
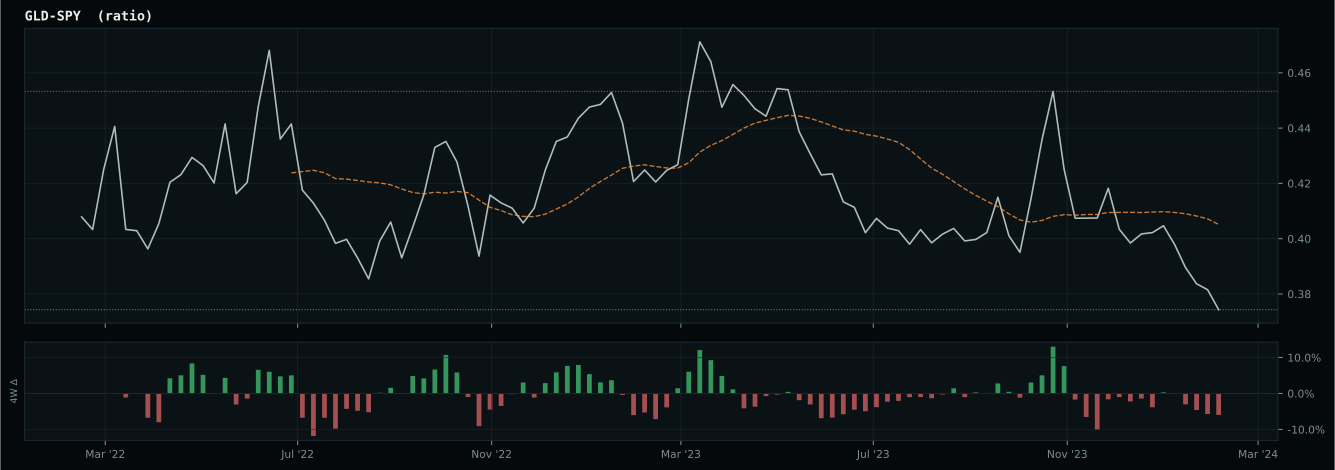
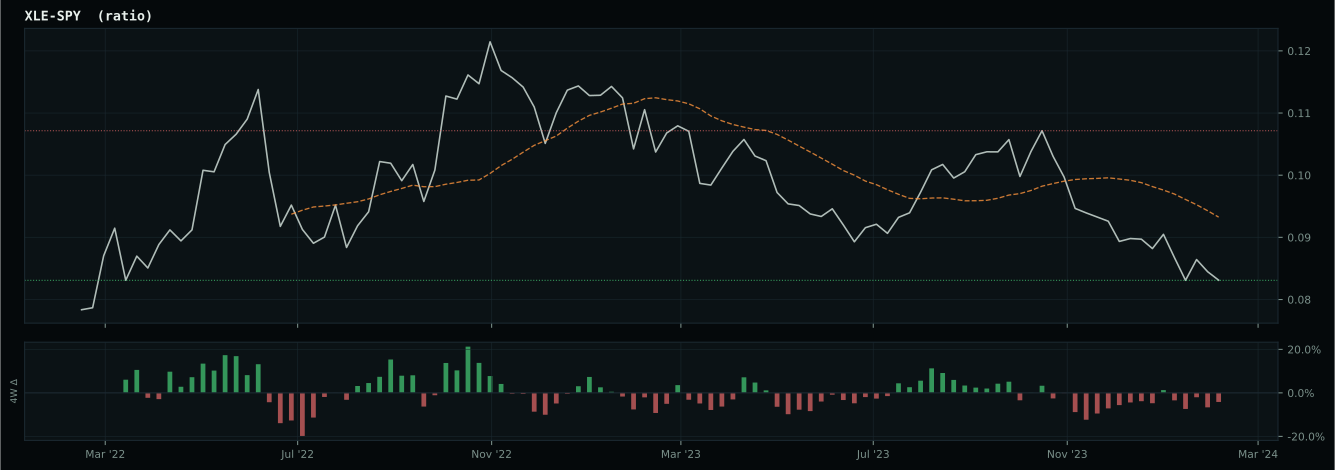
Macro Regime — Disinflation
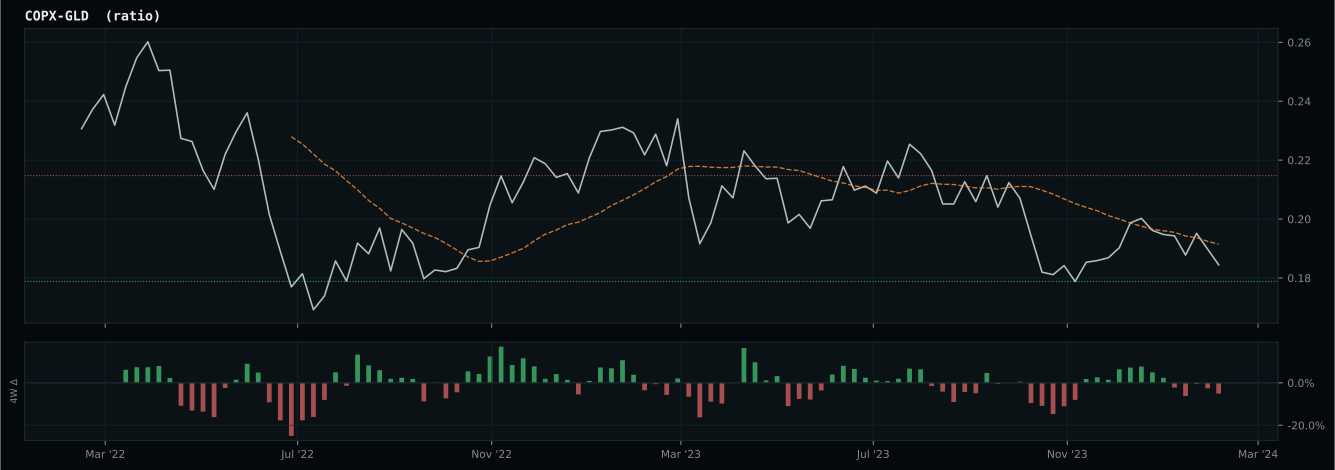
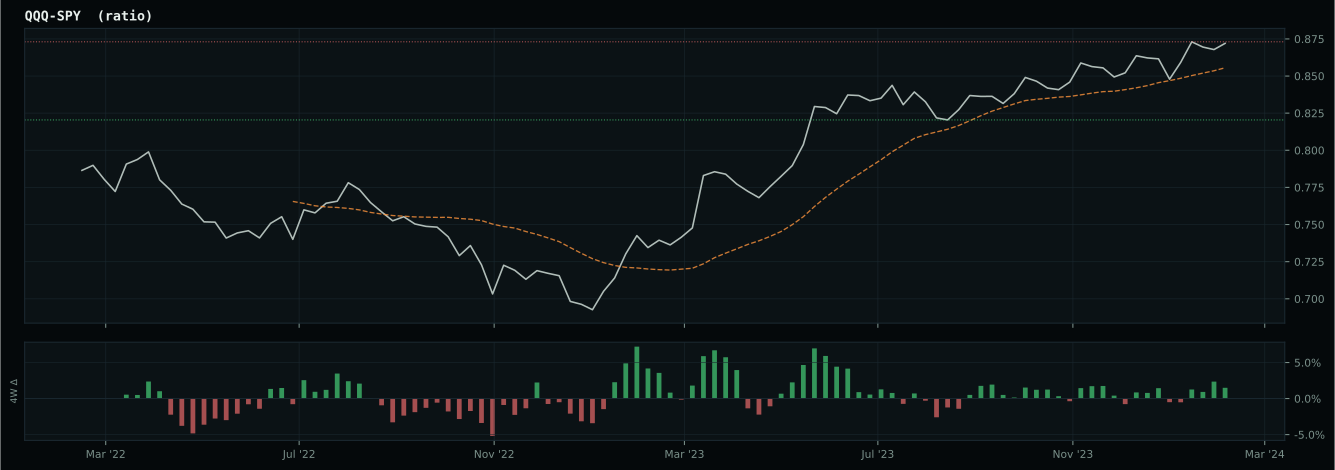
Macro Evidence Charts
Market-implied signals behind the macro regime scores. Each ratio compares two assets; the direction and slope of the ratio is what the macro engine reads.
Crypto Regime — TrendBTC
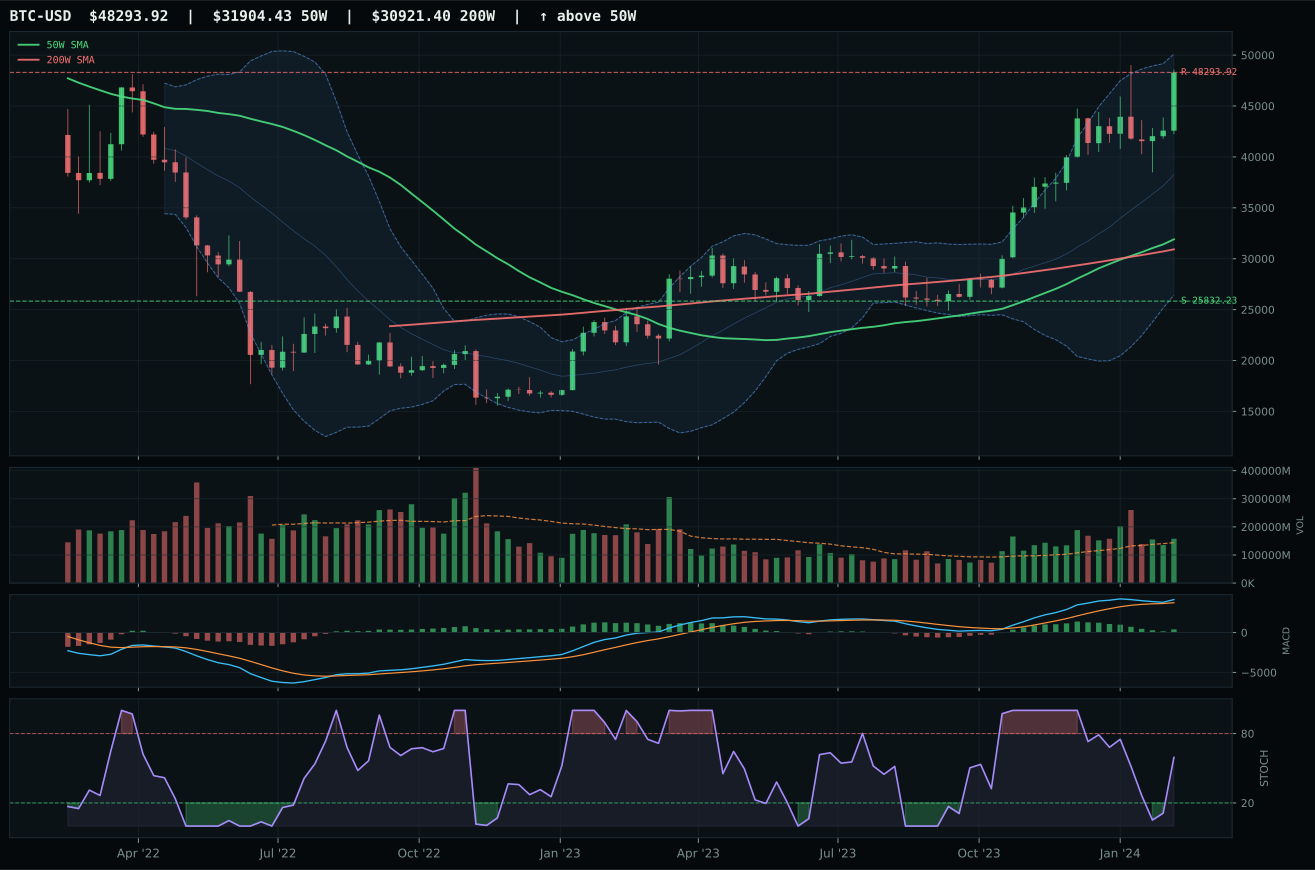
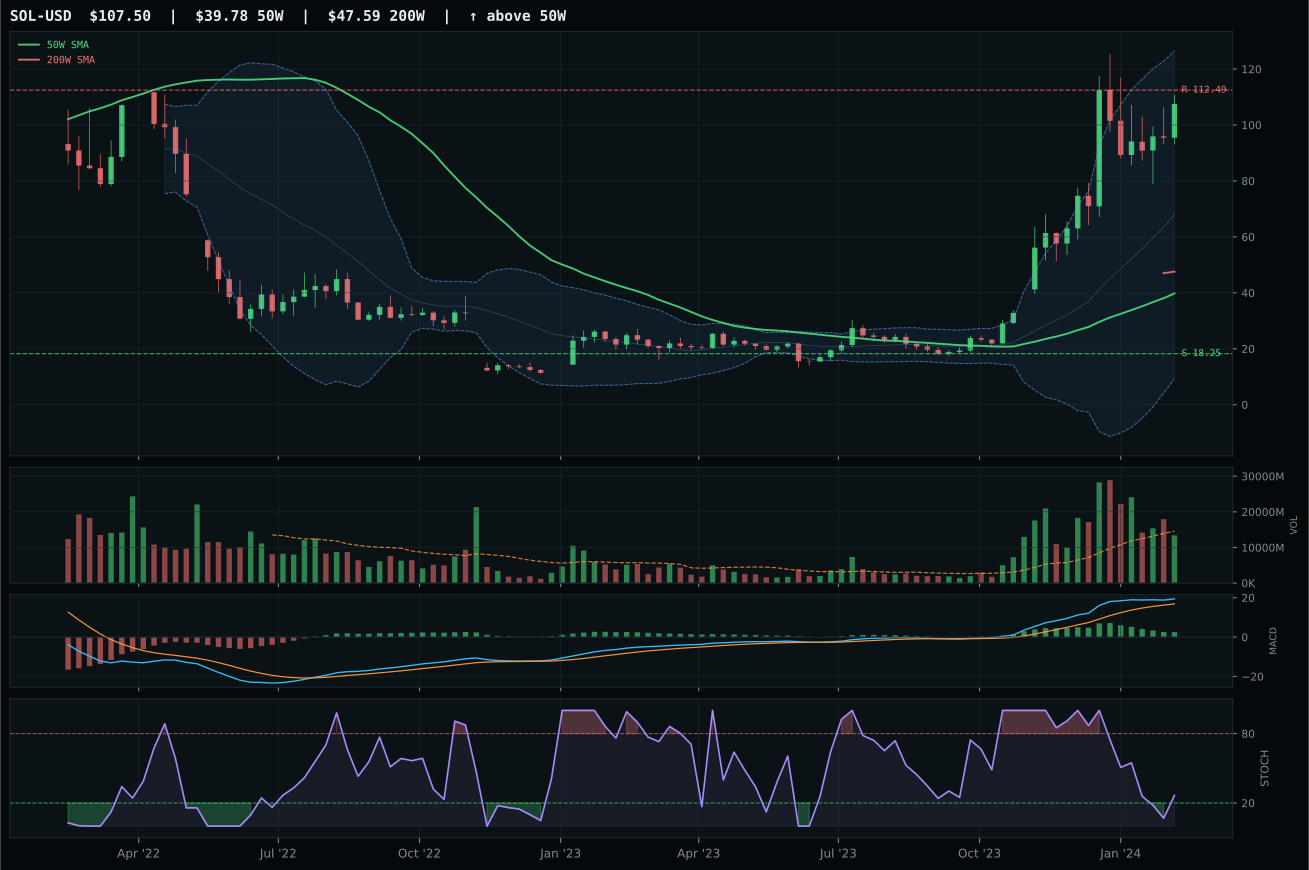
post-touch structure is too wide to count as a range; max/min close ratio is 2.64
TrendBTC confirmed: 2 consecutive closes above rising/flat 50W SMA
one or more available conditions failed
Category Rankings
| Rank | Category | Winner | Score | Alloc | 4W Ret | Peers (4W) |
|---|---|---|---|---|---|---|
| 1 | AI | SMH | 72.8 | 20% | +8.79% | AIQ +1.7% · BOTZ +7.2% |
| 2 | Technology | IGV | 67.9 | 20% | -4.72% | CIBR -3.7% · XLK -0.7% |
| 3 | Defense & Aerospace | ITA | 50.3 | 10% | +3.46% | XAR +6.0% · ROKT +2.3% |
| 4 | Nuclear Energy | URNM | 47.0 | 10% | -9.45% | URA -5.7% · NLR -0.3% |
| 5 | Utilities & Infrastructure | PAVE | 34.7 | 10% | +5.91% | IGF +3.6% · XLU +5.6% |
| 6 | Precious Metals | GLD | 34.0 | 10% | +8.10% | SLV +8.2% · GDX +10.0% |
| 7 | Emerging Markets | INDA | 26.6 | 10% | +3.34% | IEMG +3.1% · ILF -1.6% |
| 8 | Industrial Metals | COPX | 24.0 | 10% | +9.36% | PICK +1.0% · REMX +5.5% |
| 9 | Traditional Energy | XLE | 1.6 | 0% | +5.49% | XOP +7.1% · FCG +10.2% |
| 10 | Agriculture & Livestock | MOO | — | 0% | +1.54% | VEGI +2.4% · WEAT -8.1% |
AI — SMH
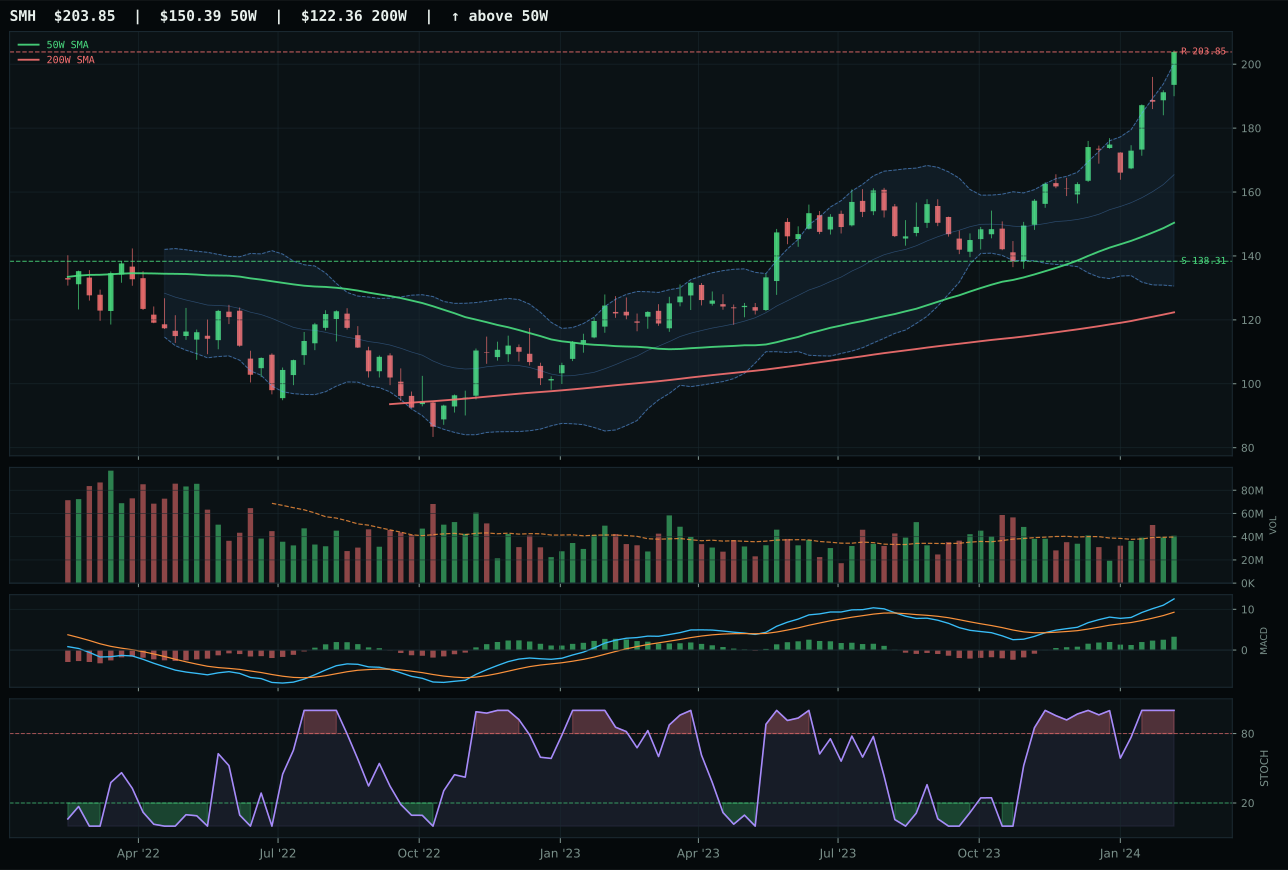
SMH has a vertical extension profile with 15.9% 13-week relative strength versus SPY.
A failed hold above support would weaken the setup.
Actionable but governed by invalidation levels.
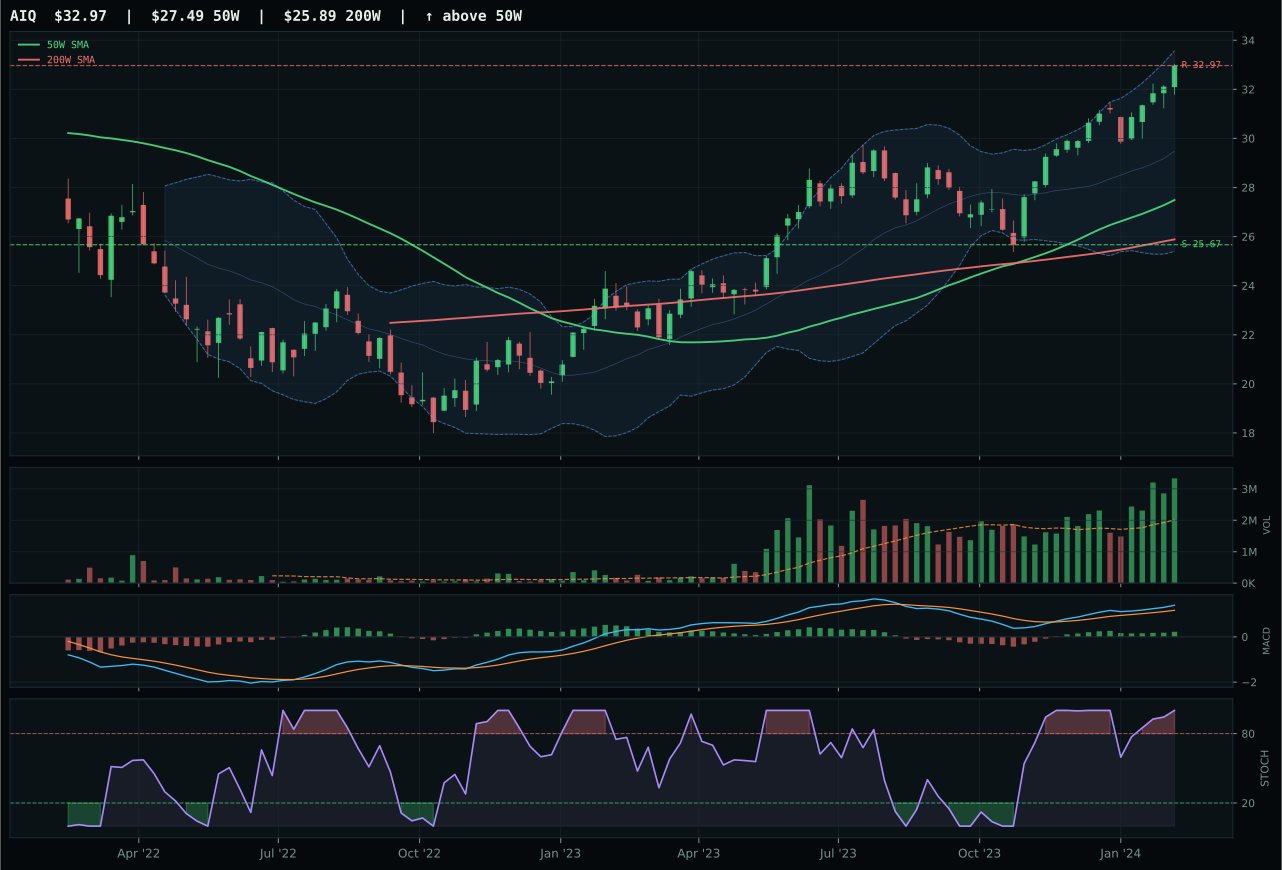
AIQ has a vertical extension profile with 3.0% 13-week relative strength versus SPY.
A failed hold above support would weaken the setup.
Actionable but governed by invalidation levels.
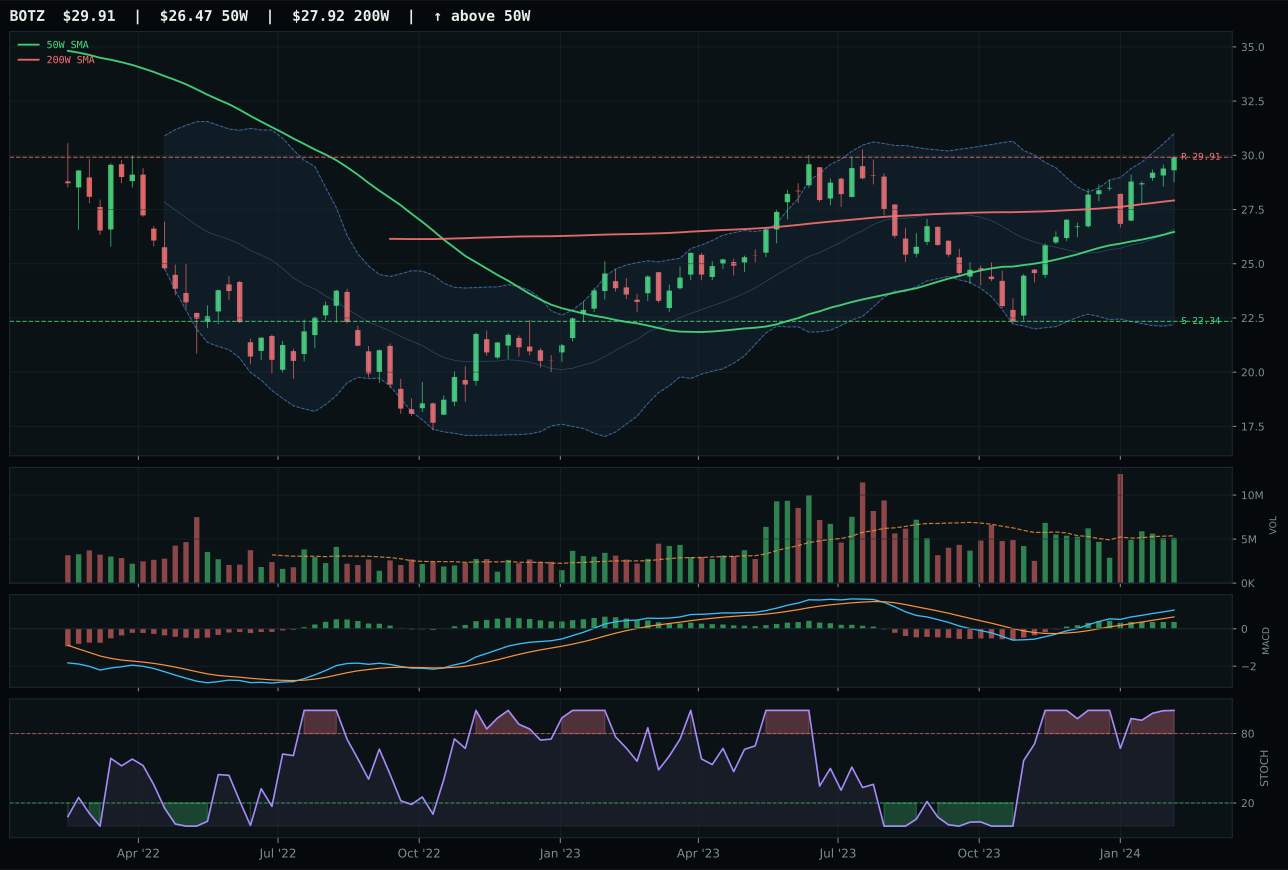
BOTZ has a neutral structure profile with 8.0% 13-week relative strength versus SPY.
A failed hold above support would weaken the setup.
Actionable but governed by invalidation levels.
SMH won the AI category on superior category-relative strength of 7.9% versus AIQ's -5.0%, a decisive 12.9-point spread that reflected semiconductor hardware's outperformance of AI software in the 13-week period. The technical evidence for SMH was 72.4/100—lower than AIQ's 91.1—yet the final decision favored the semiconductor leader because volume-price confirmation (77.5/100) and persistence (84.9/100) proved that the 29.6% 13-week return was being accumulated rather than distributed. Price at 35.5% above the 50W invited timing criticism (37.0/100), but MACD bullish and improving, neutral volume at 1.03x the 20W average, and a 15.9% SPY-relative return overcame the extension penalty. AIQ's vertical extension setup and bullish MACD matched SMH's structure, yet AIQ's 3.0% relative strength and weak category standing forced it into second place despite posting a 27.1% 13-week return that appeared stronger on its surface.
AI ranks second among all ten categories with a final score of 72.8 and earns the paired 10% allocation alongside Technology, making it a co-lead in the portfolio's growth exposure. The category-level macro fit of 59.0 is anchored by AI growth sponsorship (+14), which carries the heaviest active descriptor weight, and risk appetite positive (+10) provides additional support in the disinflation environment. Liquidity stress (-12) and credit stress (-8) are the primary detractors, but they trail the bullish narrative by a wide margin. SMH's 13-week return of 29.6%, persistent strength relative to category median, and intact uptrend structure justify the allocation despite the extended price action; this is a category where the macro regime (disinflation, risk-on) and technical evidence align to form one of the week's cleanest risk-reward profiles. At 10% in a 50% overlay portfolio, AI represents conviction that semiconductor and compute demand will remain the portfolio's primary growth engine.
Technology — IGV
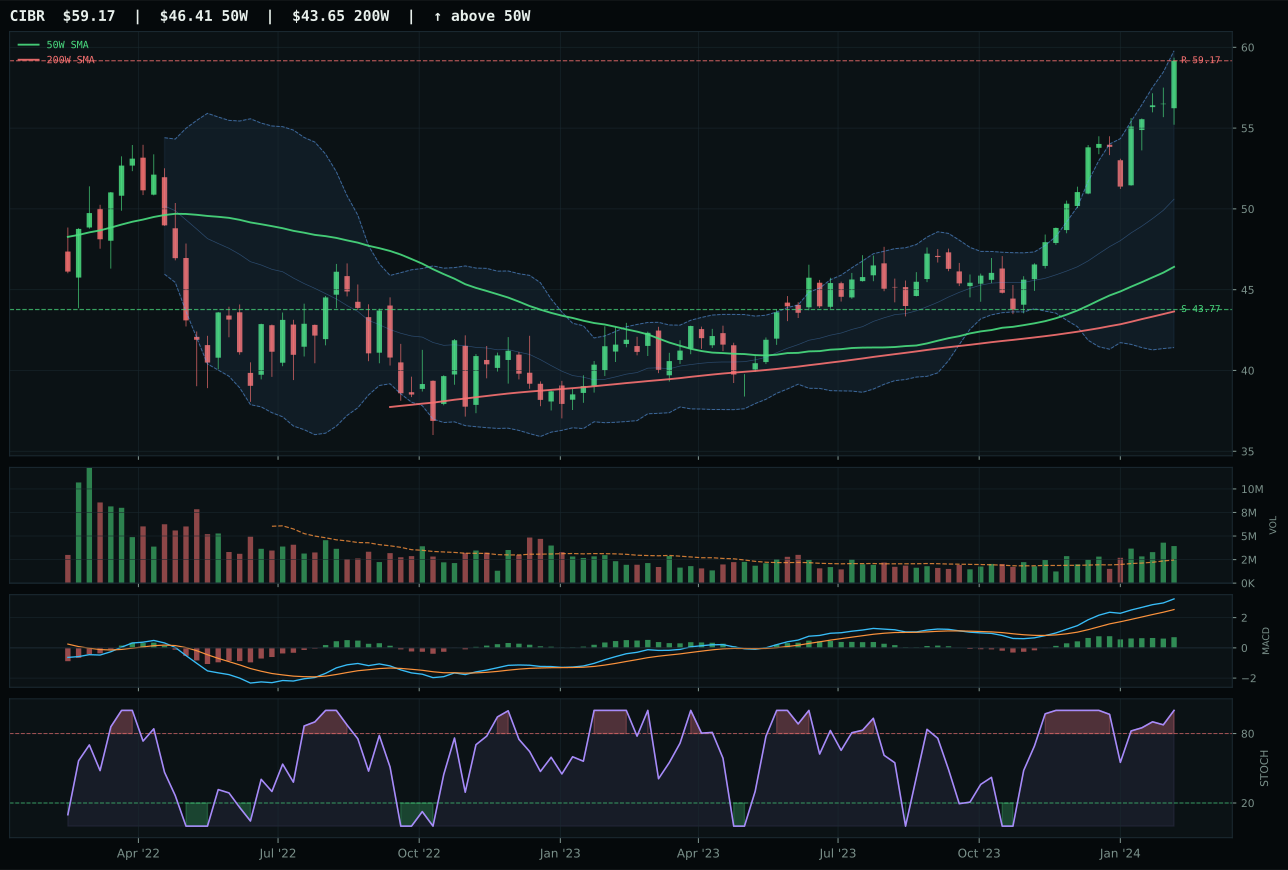
CIBR has a vertical extension profile with 13.3% 13-week relative strength versus SPY.
A failed hold above support would weaken the setup.
Actionable but governed by invalidation levels.
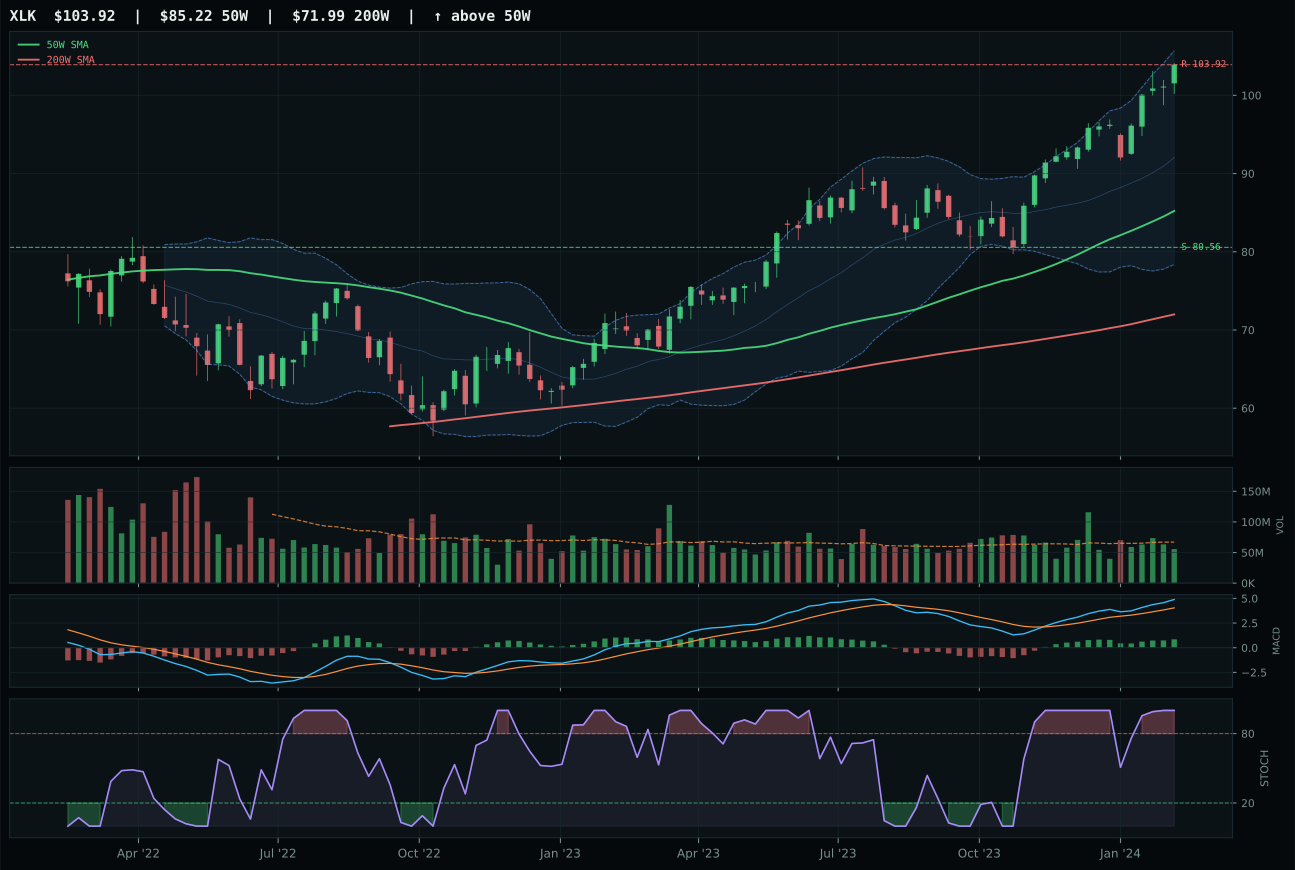
XLK has a vertical extension profile with 2.0% 13-week relative strength versus SPY.
A failed hold above support would weaken the setup.
Actionable but governed by invalidation levels.
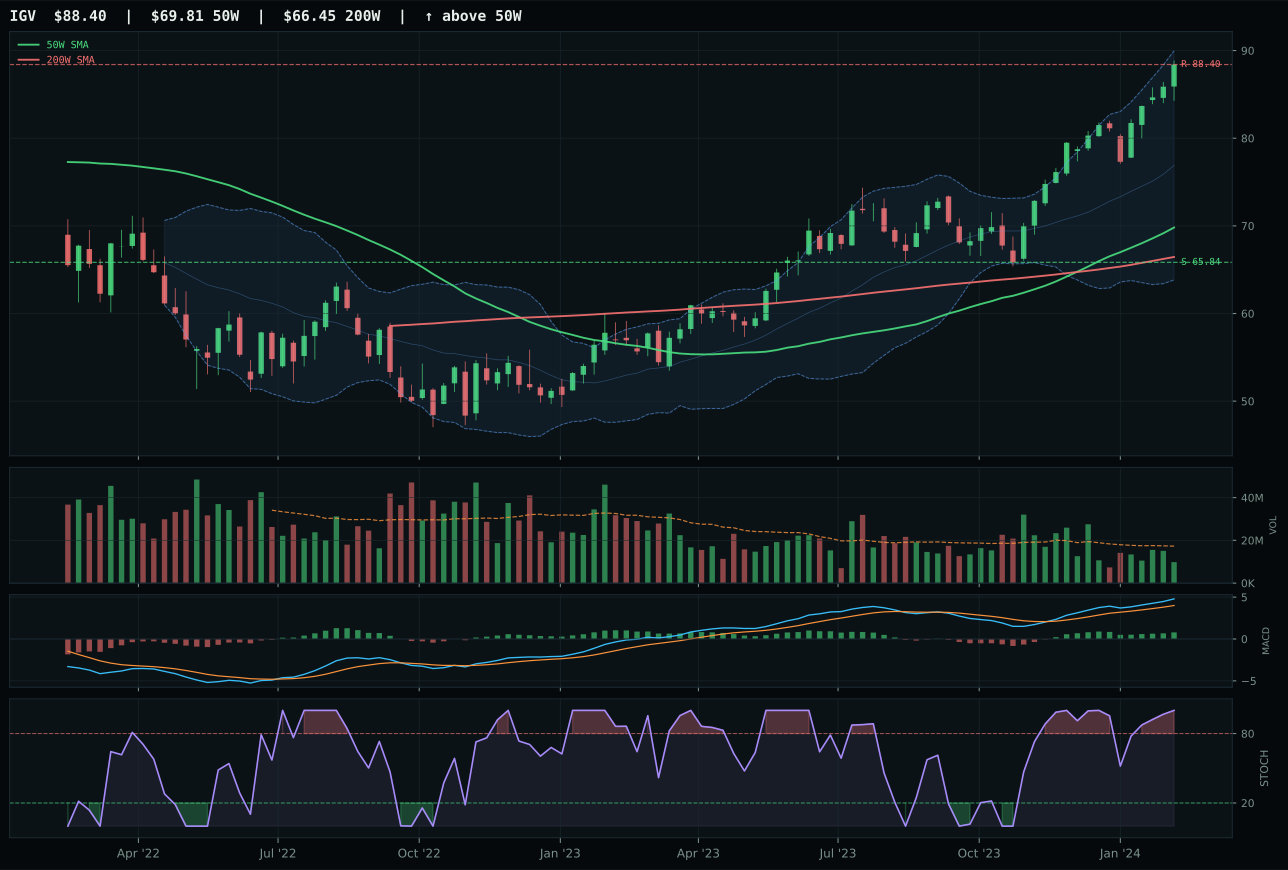
IGV has a vertical extension profile with 7.6% 13-week relative strength versus SPY.
A failed hold above support would weaken the setup.
Actionable but governed by invalidation levels.
IGV captured the category win despite trading 26.6% above its 50-week moving average, a penalty for late entry that reflects the extension's risk. The setup itself is clean—price above both the 50W and 200W, MACD bullish and improving, stochastic RSI at overbought 1.00—but momentum confirmation scored a full 100 because the 13-week return of 21.3% and 7.6% relative strength versus SPY justified the commitment. CIBR, the runner-up, posted superior technical evidence (92.4 vs 56.8) and category-relative strength of 5.7%, yet lost ground on the allocation decision because IGV's composite scoring edged it out by 2.6 points. Volume thin participation at 0.57x the 20-week average prevented IGV from reaching a higher overall confidence level, but the vertical extension setup with resistance at 88.40 remains the category's best risk-adjusted entry point given current positioning.
Technology earned its spot as a top-2 category at 10% allocation weight, matching AI's tier status as the two strongest opportunities in the current disinflation regime. The category score of 67.9 reflects a blend of solid trend strength (100/100), reasonable structure (78.1/100), and persistence (70.6/100) that survived both the extended price action and a macro environment where disinflation pressure (+7) and risk appetite (+9) provide tailwinds. Credit stress (-9) and liquidity stress (-10) are active headwinds, but they weigh less than the technical dominance and AI growth sponsorship (+6) driving hardware and software names higher. The timing score of 37.0 signals that buyers are paying for extension, which constrains upside but does not disqualify the category; at 10% allocation in a 50% crypto overlay regime, this represents appropriate capital deployment to a category leading on both momentum and narrative fit.
Defense & Aerospace — ITA
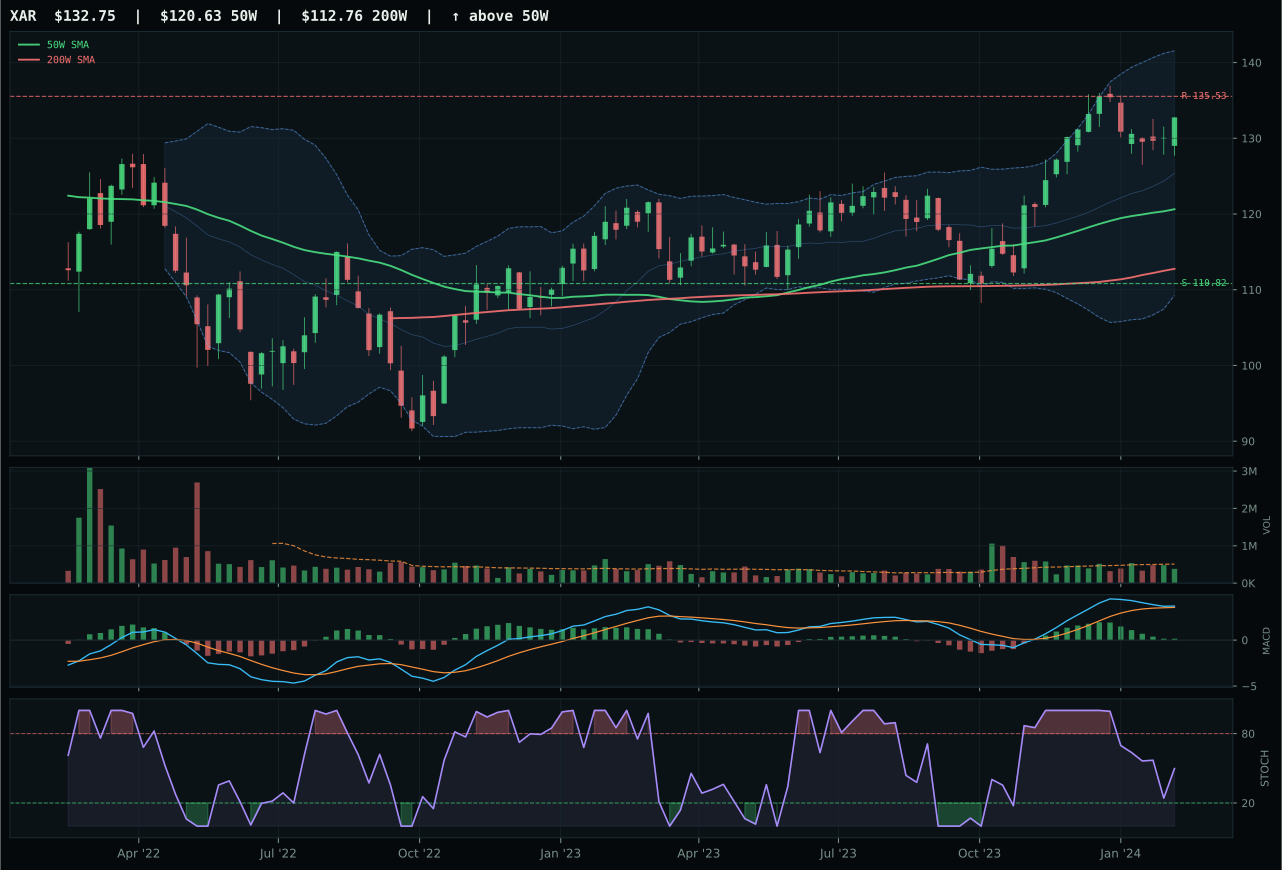
XAR has a neutral structure profile with -4.0% 13-week relative strength versus SPY.
A failed hold above support would weaken the setup.
Actionable but governed by invalidation levels.
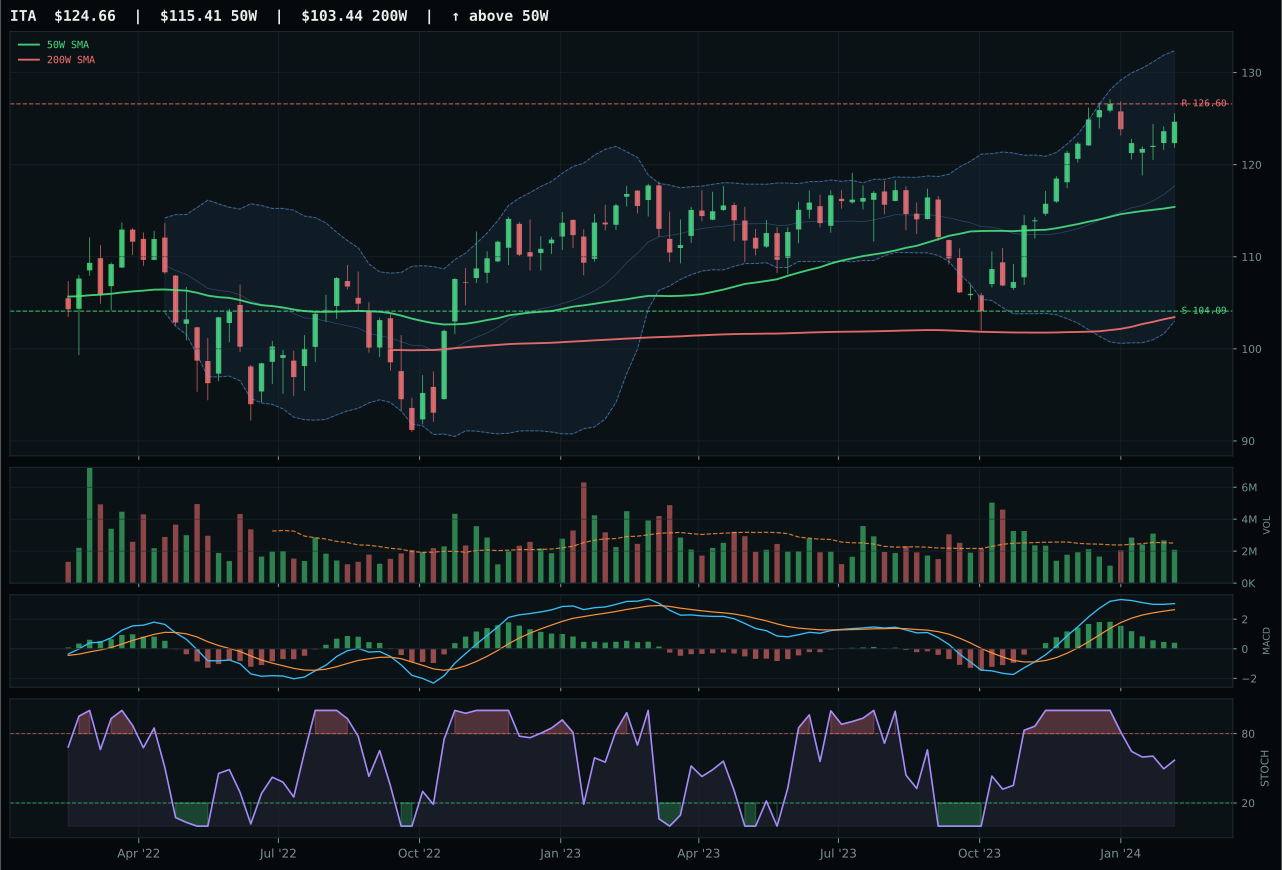
ITA has a neutral structure profile with -4.4% 13-week relative strength versus SPY.
A failed hold above support would weaken the setup.
Actionable but governed by invalidation levels.
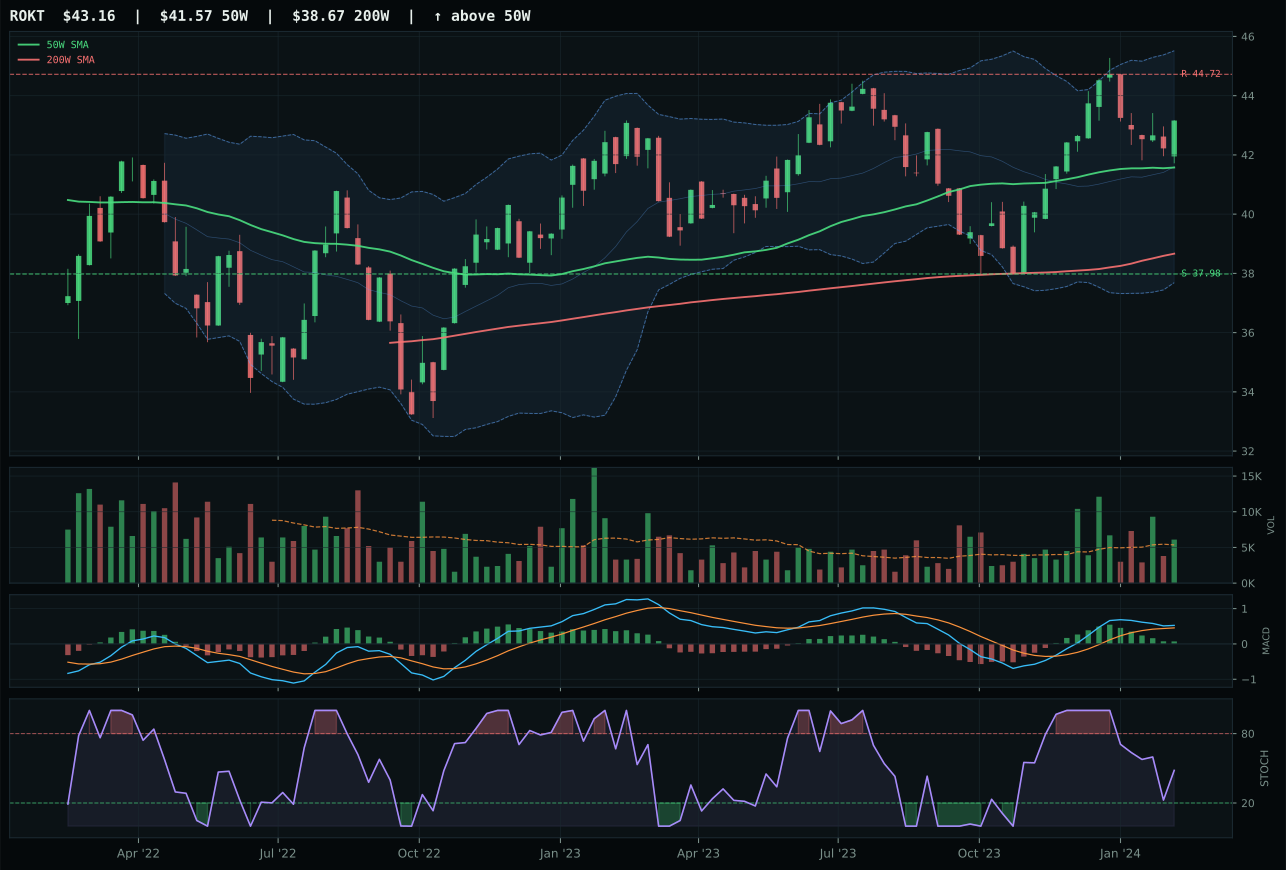
ROKT has a neutral structure profile with -6.0% 13-week relative strength versus SPY.
A failed hold above support would weaken the setup.
Tracked, but not top-2 eligible because: .
ITA won the Defense & Aerospace category by a slim 1.1-point margin over XAR, with both setups displaying neutral structure and both held up by trend strength (89.5/100 for ITA, 90/100 estimated for XAR) rather than momentum acceleration. The deciding factor was structure cleanliness: ITA's 80.8 score versus XAR's 77.7 reflected fewer conflicting signals on support and resistance clustering. ITA trades only 8.0% above its 50W, positioning it as a reset within an uptrend rather than an extended chase—a setup that offers timing advantage when momentum is fading. The 13-week return of 9.4% trails category options, and the -4.4% relative strength versus SPY signals that defense is underperforming the broad market, which explains why timing scored 70.0 despite MACD bullish but flattening and stochastic RSI falling into neutral. This is a category win by default durability rather than by acceleration, with ITA's 0.0% category-relative strength earning the nod as the most stable option in a weakening group.
Defense & Aerospace received a tier-2 allocation of 5%, reflecting its rank outside the top-2 despite an eligible technical setup and positive trend alignment. The category score of 50.3 is held down by weak relative strength (both ITA and XAR at -4% to -4.4% versus SPY), thin momentum confirmation (61.5/100 for the winner), and a macro environment where liquidity stress (-4) and the neutral macro fit (51.0/100 overall) offer limited tailwind. Disinflation does not favor or hurt defense materially, and no category-specific macro descriptors are active to amplify the setup. The allocation decision rests on the principle that Defense offers stability and a defined support level near 104 for ITA, which can serve as a portfolio stabilizer when growth falters. The 5% sleeve is appropriate for a category that is neither broken nor leading—it preserves exposure to a traditionally defensive profile without committing capital to a higher-conviction bet where technical strength is evidently absent.
Nuclear Energy — URNM
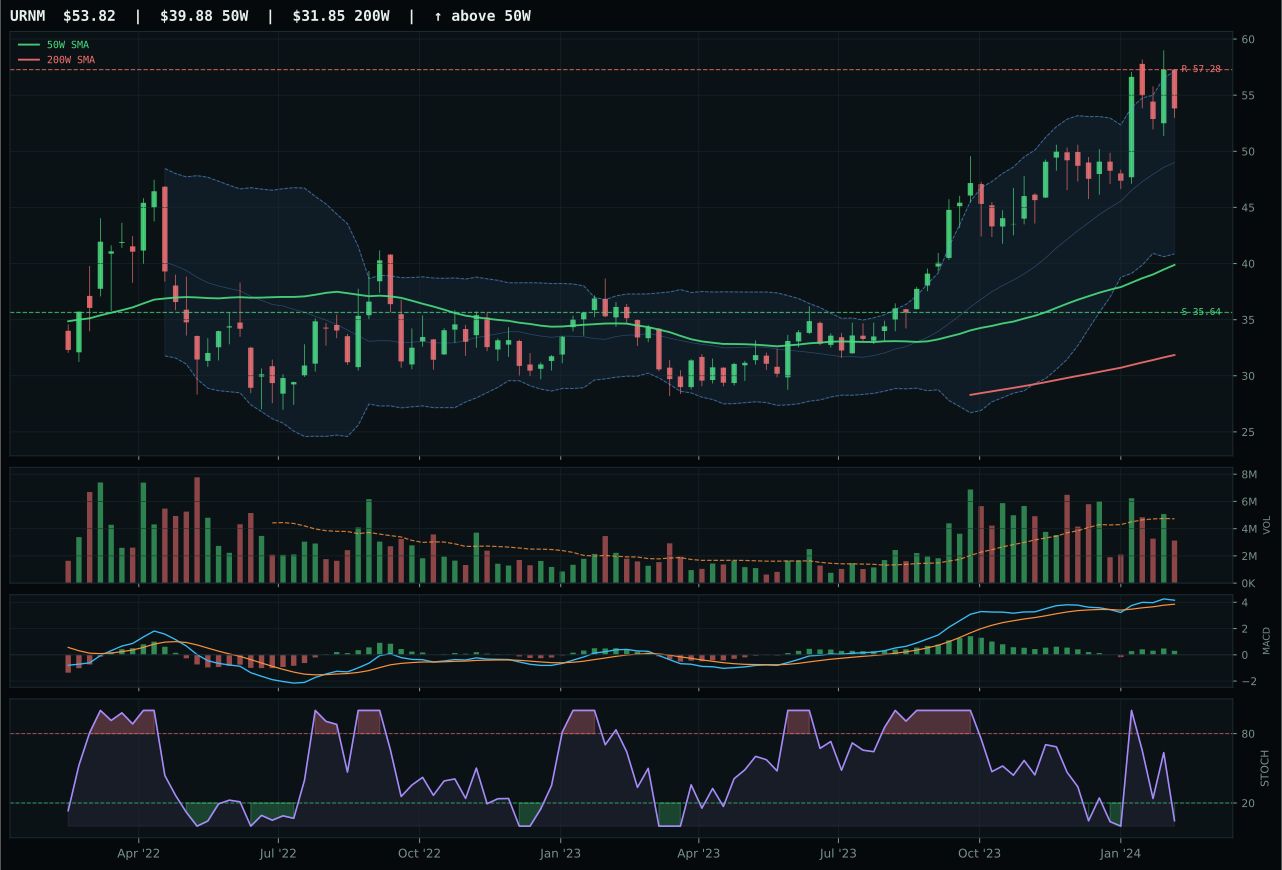
URNM has a vertical extension profile with 4.1% 13-week relative strength versus SPY.
A failed hold above support would weaken the setup.
Actionable but governed by invalidation levels.
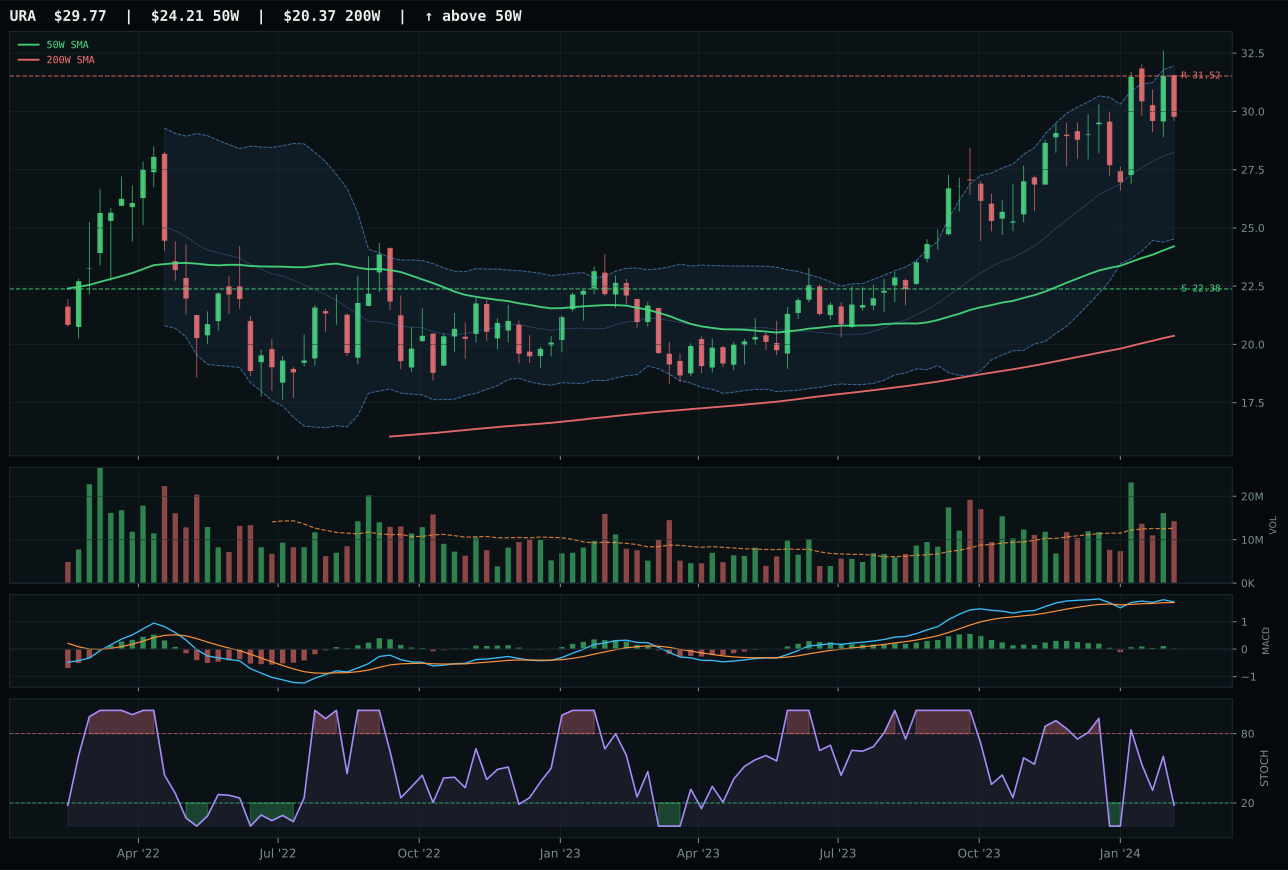
URA has a vertical extension profile with -2.9% 13-week relative strength versus SPY.
A failed hold above support would weaken the setup.
Actionable but governed by invalidation levels.
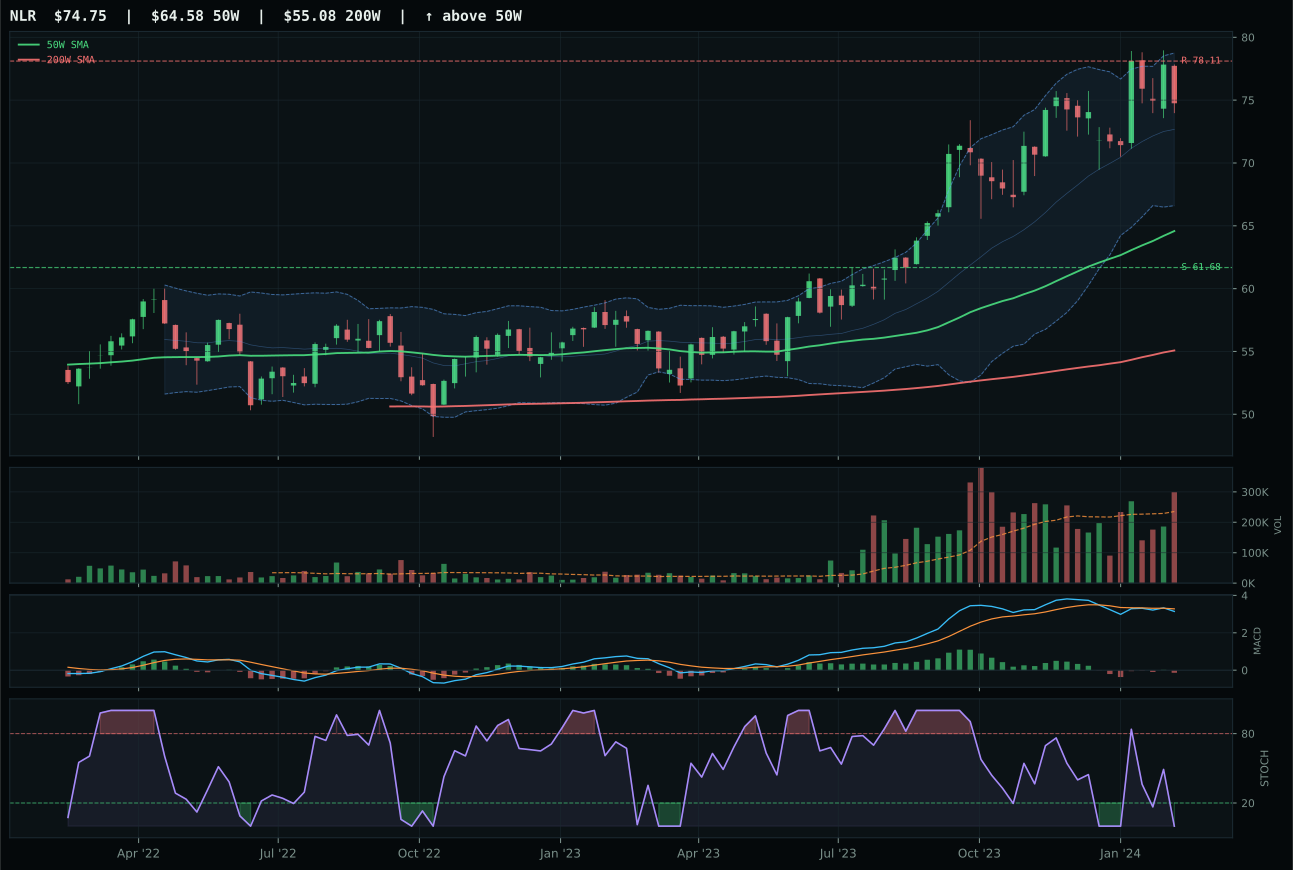
NLR has a vertical extension profile with -8.0% 13-week relative strength versus SPY.
A failed hold above support would weaken the setup.
Actionable but governed by invalidation levels.
URNM won Nuclear Energy despite trailing the reasoned ranking order, with AIQ and URA posting higher technical evidence (91.1 and 59.1 respectively vs URNM's 64.6) but URNM capturing the representative slot through superior category-relative strength (7.1% vs 0.0% for URA) and the cleanest MACD confirmation (bullish and improving vs bullish but flattening). Price at 35.0% above the 50W signals extended positioning, and the structure score of 60.9 reflects vertical extension that penalizes timing entries; however, the 17.9% 13-week return and outsized category-relative strength prove that buyers are active and willing to chase. MACD bullish and improving carries more weight than URA's flattening MACD because it signals momentum is not yet fading, and stochastic RSI oversold (0.05) indicates that pullback opportunity may arrive. Volume thin participation at 0.66x the 20W average is a cautionary flag, yet the persistence score of 70.2 confirms that the trend is holding despite the thin participation, which is bullish evidence for a scarcity-driven trade. The score gap of -6.2 to URA is narrow, but the technical clarity favored URNM.
Nuclear Energy earned a tier-2 allocation of 5% with a final category score of 47.0, placing it in the middle band of eligible categories and reflecting a balance between bullish technical structure and muted macro sponsorship. The category macro fit of 43.0 benefits from AI growth sponsorship (+5)—nuclear power is positioned as a long-term enabler of data center expansion—but liquidity stress (-7) and credit stress (-5) create financing headwinds for capital-intensive uranium miners. URNM's 17.9% 13-week return is the strongest momentum in the tier-2 group, yet the 35.0% extension above the 50W demands prudent position sizing. The allocation decision reflects the view that Nuclear is a compounding structural story (AI power demand) trading through a cyclical entry point, which warrants the 5% sleeve as both a hedge to energy weakness and a participation vehicle in the long-term power transition narrative. Relative to Emerging Markets and Utilities, Nuclear Energy offers better trend structure and clearer momentum confirmation, justifying its position ahead of those peers. If URNM breaks below support at 35.64, the allocation thesis weakens materially and would require reassessment; until that break, the 5% commitment balances exposure to an emerging energy source with acknowledgment of the current technical extension.
Utilities & Infrastructure — PAVE
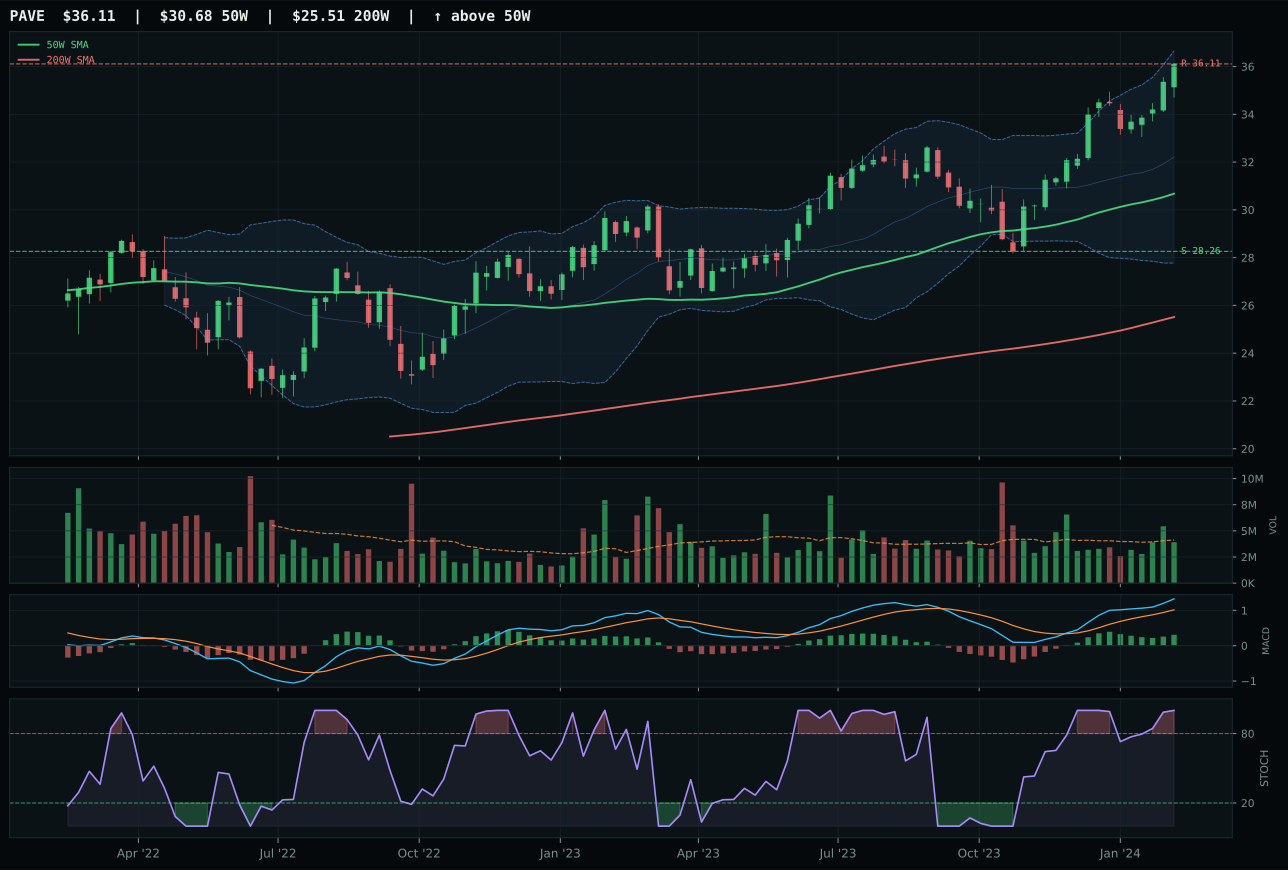
PAVE has a vertical extension profile with 5.9% 13-week relative strength versus SPY.
A failed hold above support would weaken the setup.
Actionable but governed by invalidation levels.
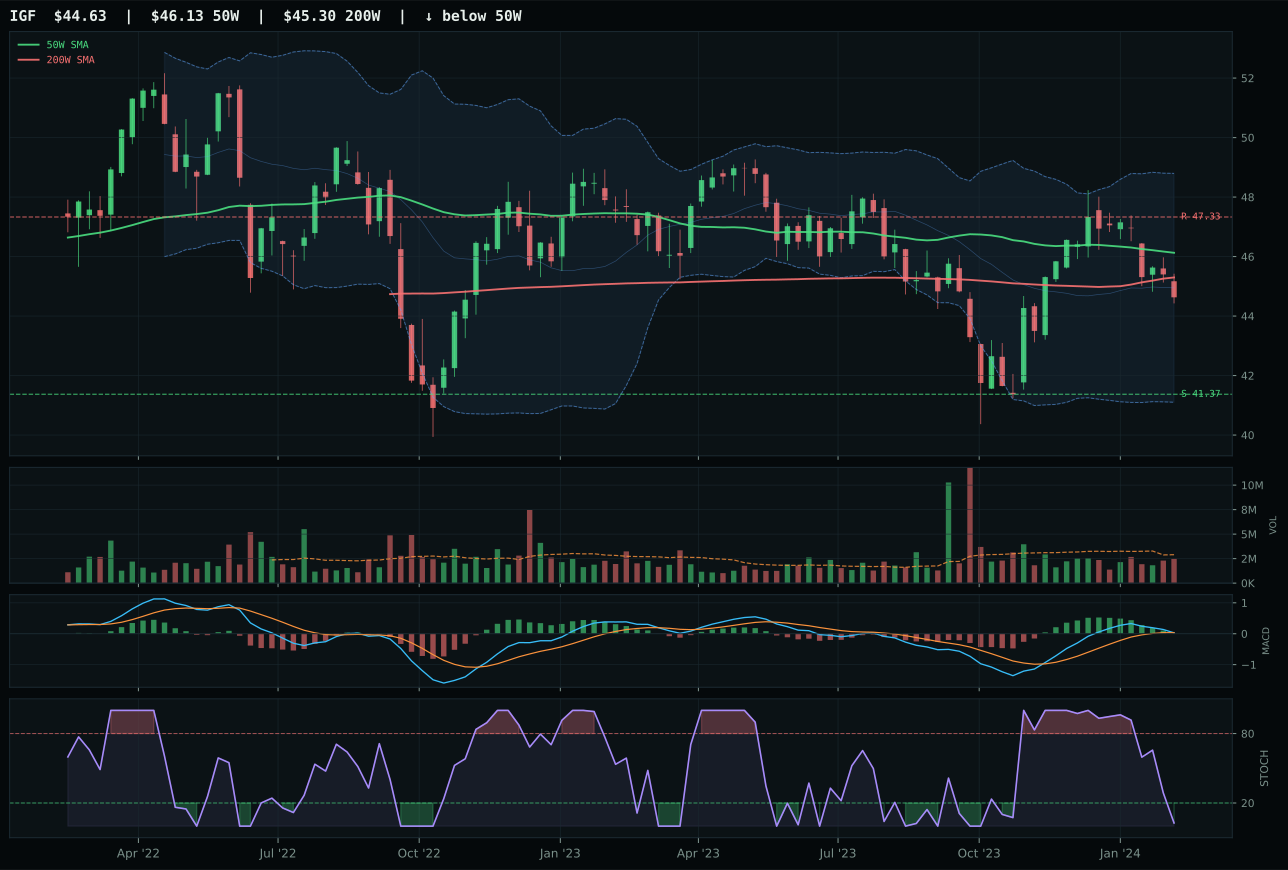
IGF has a neutral structure profile with -11.2% 13-week relative strength versus SPY.
A failed hold above support would weaken the setup.
Actionable but governed by invalidation levels.
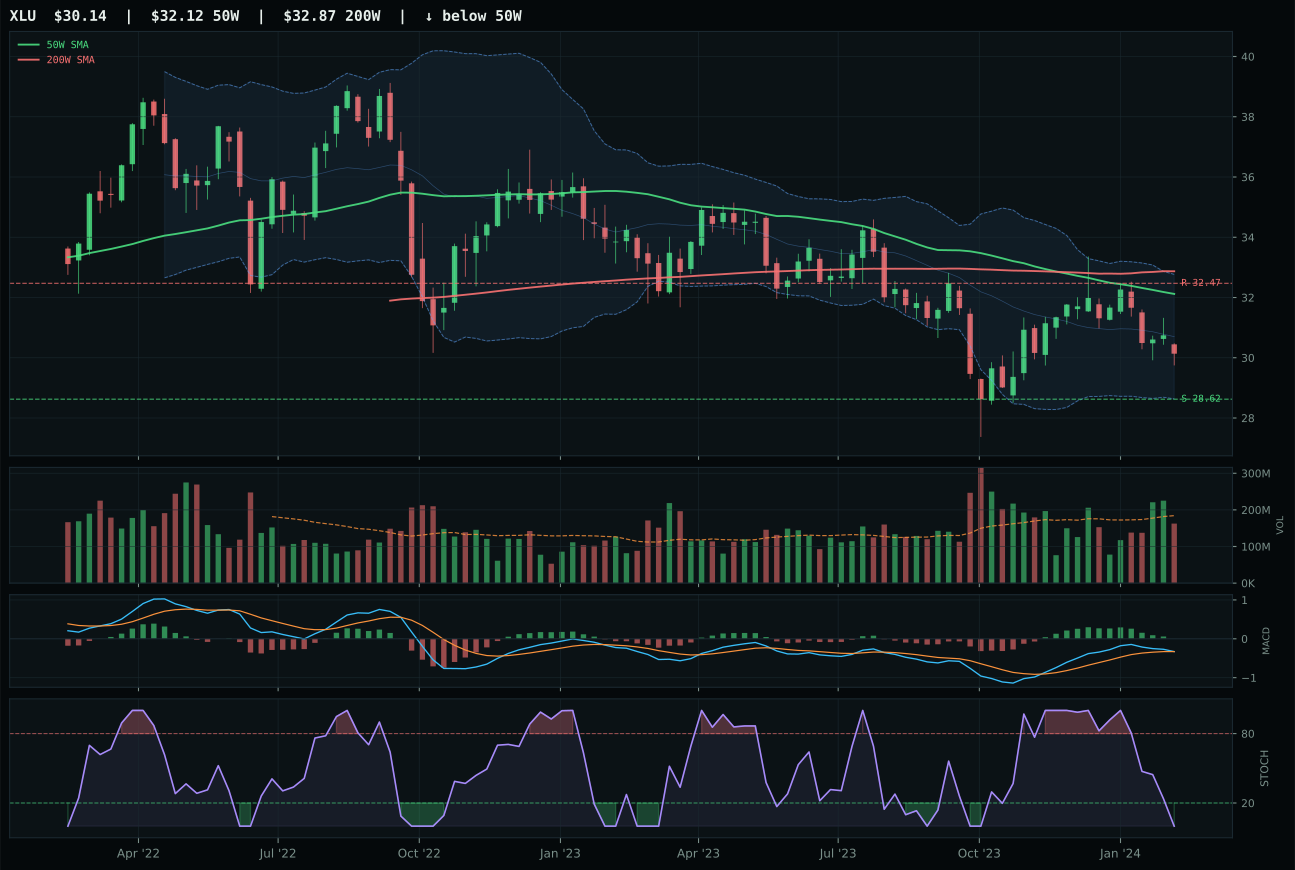
XLU has a neutral structure profile with -13.8% 13-week relative strength versus SPY.
Extension and support failure are the main tactical risks.
Tracked, but not top-2 eligible because: structurally broken.
PAVE won Utilities & Infrastructure with a decisive 35.2-point gap over IGF, demonstrating clear category leadership on trend (100/100 vs 22/100), momentum confirmation (100/100 vs 10/100), and category-relative strength (17.1% vs 0.0%). The setup is vertical extension at 17.7% above the 50W, yet PAVE's clean structure (82.9/100) and bullish MACD with overbought stochastic RSI signal that the momentum is intact and broad-based. The 19.6% 13-week return and 5.9% relative strength versus SPY reflect that infrastructure and utilities are benefiting from the disinflation regime (lower discount rates favor stable cash flows), and the volume-price confirmation (80.0/100) and persistence (86.1/100) prove that buyers remain in control. Support is defined at 28.26, offering a clear invalidation level if the trend breaks. IGF, the runner-up, is trading in a bearish/weakening MACD environment with no category-relative strength, making PAVE's dominance a straightforward technical decision. The score gap of 35.2 is among the widest of all categories, indicating that PAVE is the unambiguous leader in its peer set.
Utilities & Infrastructure earned a tier-2 allocation of 5%, reflecting PAVE's strong technical setup and favorable macro positioning despite the category ranking outside the top-2. The macro fit of 62.0 is tied for the highest among all categories (equal to Precious Metals), benefiting from disinflation pressure (+6), which supports duration-sensitive utilities, and the broader transition theme (+4). Risk appetite positive is slightly active at -2, a minor headwind that does not materially impair the allocation. PAVE's 19.6% 13-week return and clean uptrend structure position it as one of the portfolio's highest-conviction growth vehicles, yet the category ranks tier-2 because the momentum concentration is narrower than AI or Technology—utilities lack the broad-based sponsorship that would elevate the category to co-leadership. The allocation decision reflects a macro thesis where stable, cash-flow-generative assets benefit from disinflation, and PAVE's infrastructure angle (toll roads, broadband, energy transmission) offers a hedge to rates volatility. At 5% allocation, Utilities serves as a portfolio anchor that can absorb capital when growth positions are trimmed, and the defined support level at 28.26 provides tactical clarity. If disinflation were to reverse or if rates began rising, this allocation would be the first candidate for reduction; for now, PAVE's momentum and macro fit justify the tier-2 positioning.
Precious Metals — GLD
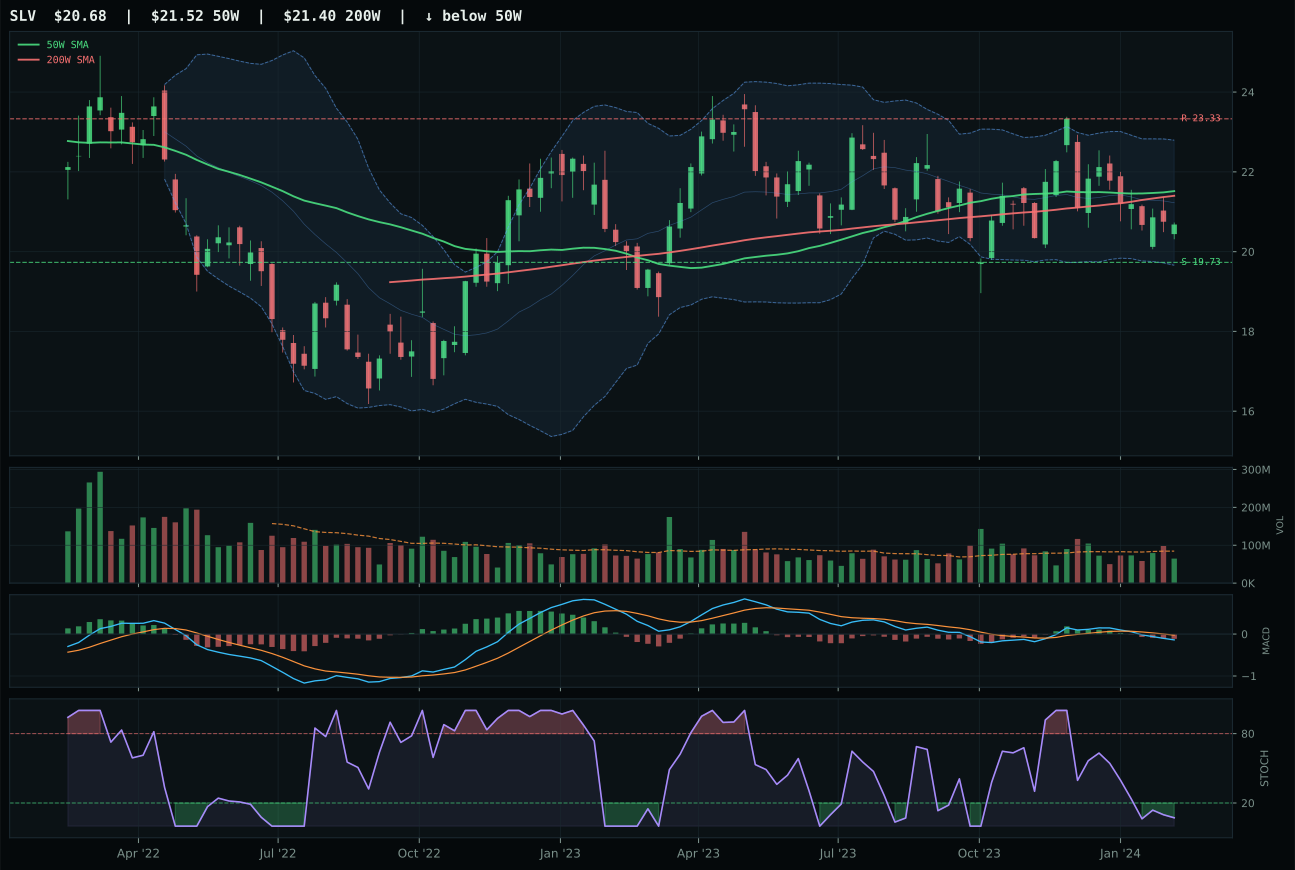
SLV has a pullback into support profile with -12.1% 13-week relative strength versus SPY.
A failed hold above support would weaken the setup.
Actionable but governed by invalidation levels.
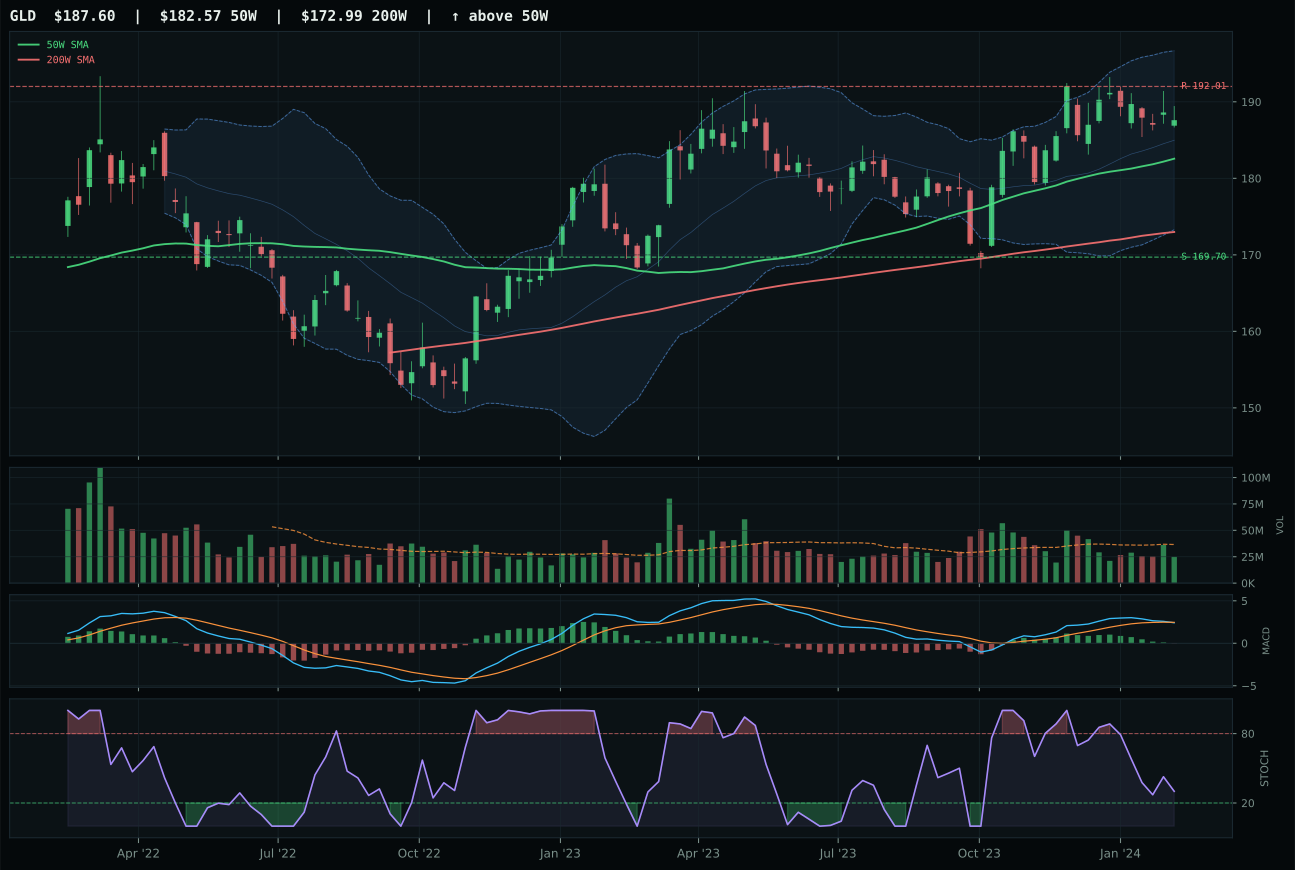
GLD has a compression near 50W profile with -9.2% 13-week relative strength versus SPY.
A failed hold above support would weaken the setup.
Actionable but governed by invalidation levels.
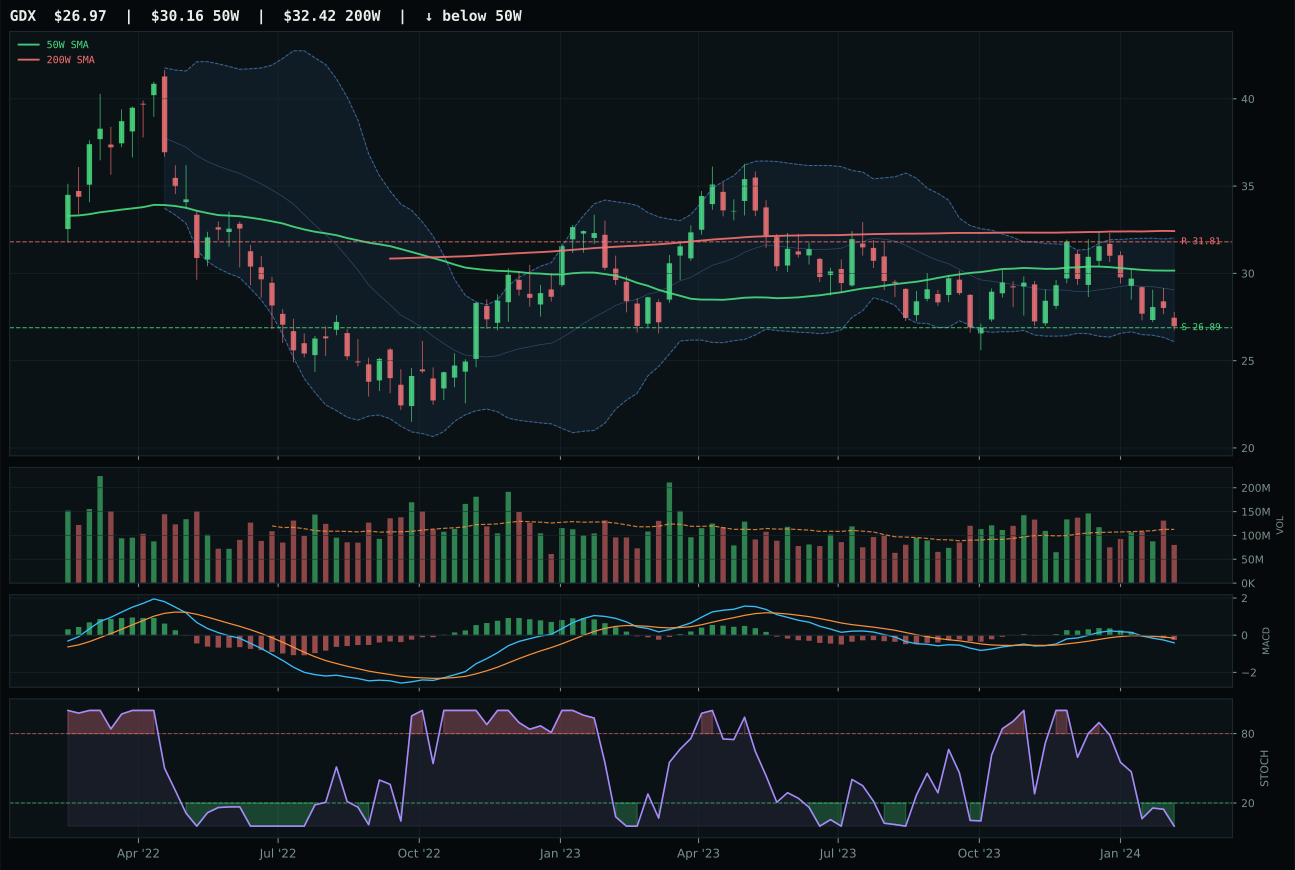
GDX has a pullback into support profile with -14.8% 13-week relative strength versus SPY.
Extension and support failure are the main tactical risks.
Tracked, but not top-2 eligible because: structurally broken.
GLD captured Precious Metals over SLV by winning on structure cleanliness (74.0 vs 67.6) and category-relative strength (2.8% vs 0.0%), despite both setups showing bearish MACD and both sitting in middle-to-upper retracement zones. GLD's critical advantage is compression near the 50W at a 2.8% distance, which can signal a potential consolidation before directional expansion, whereas SLV is already in a pullback-into-support mode (19.73 support level). The 13-week returns favor SLV at 1.7% versus GLD's 4.5%, but GLD's neutral timing score (95.0/100) reflects that it is positioned to defend the 50W if selling accelerates, whereas SLV is already testing oversold conditions with stochastic RSI at a low turning upward. Volume is thin participation in both cases (0.68x for GLD, neutral for SLV), preventing either from scoring high on confirmation. The 14.2-point gap to SLV reflects GLD's cleaner structure and better category positioning, even though neither ETF is generating strong momentum confirmation.
Precious Metals earned a tier-2 allocation of 5% with a category score of 34.0, placing it outside the top-2 yet eligible for portfolio inclusion because GLD's structural setup and timing (95.0/100) offer defined risk management. The macro fit of 60.0 benefits from disinflation pressure (+8) and disinflation helping the exposure (+7), as falling nominal rates typically support real yields on non-yielding gold. Risk appetite positive (-4) is a minor headwind, but it does not override the disinflation tailwind. Liquidity stress and credit stress are not active descriptors for precious metals this week. The category ranks in the middle of the allocation tier-2 grouping: it is neither as weak as Energy nor as strong as Defense, occupying the role of a duration hedge when nominal yields are falling. At 5% allocation, GLD provides a defined retracement zone (169.70 support, 187.28 near-term resistance) and offers tactical value as a portfolio stabilizer when equity positioning becomes extended, which is the case across Technology and AI. The thin volume participation limits upside explosiveness, but that same thin volume means any mean-reversion bounce into the 50W would occur on minimal supply, creating a favorable asymmetry for patient allocators.
Emerging Markets — INDA
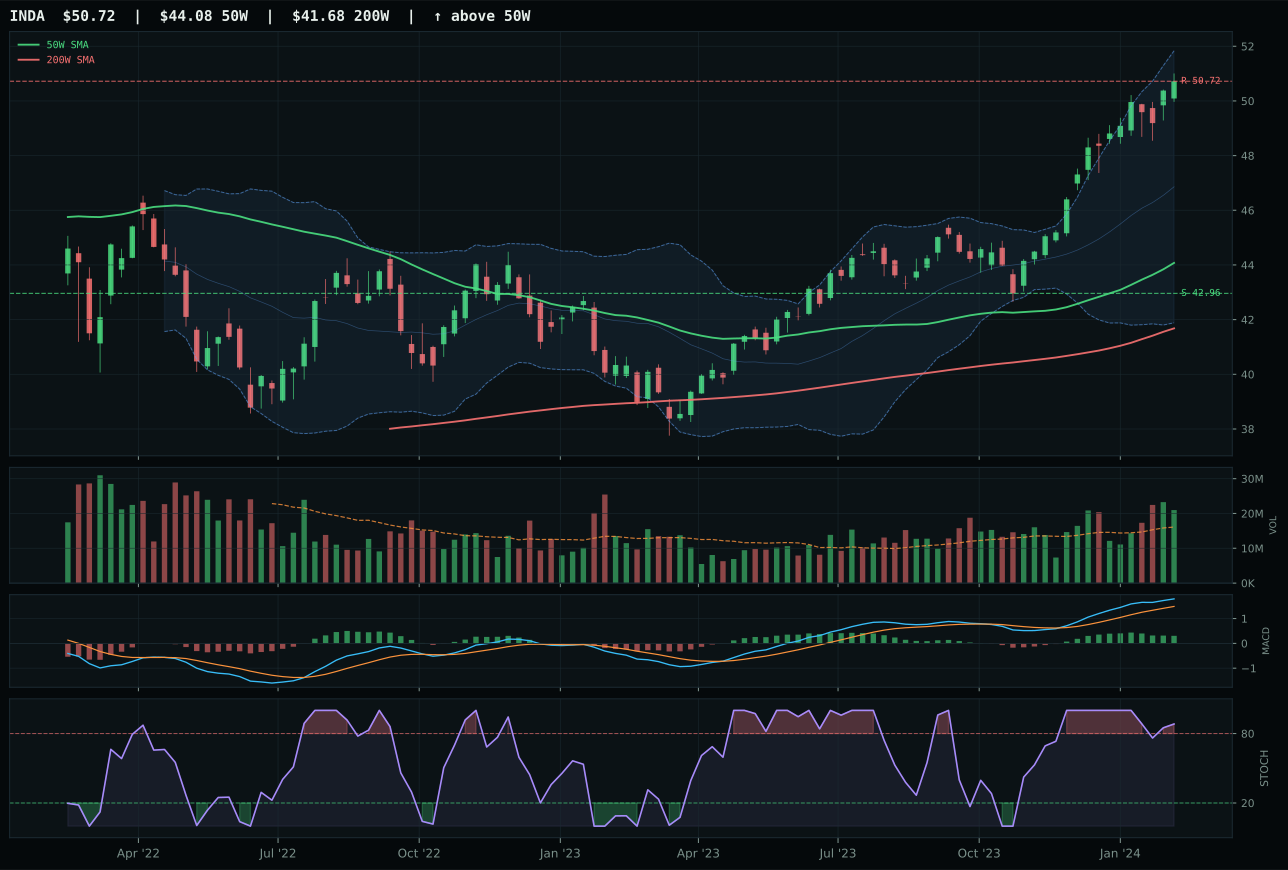
INDA has a vertical extension profile with 0.3% 13-week relative strength versus SPY.
A failed hold above support would weaken the setup.
Actionable but governed by invalidation levels.
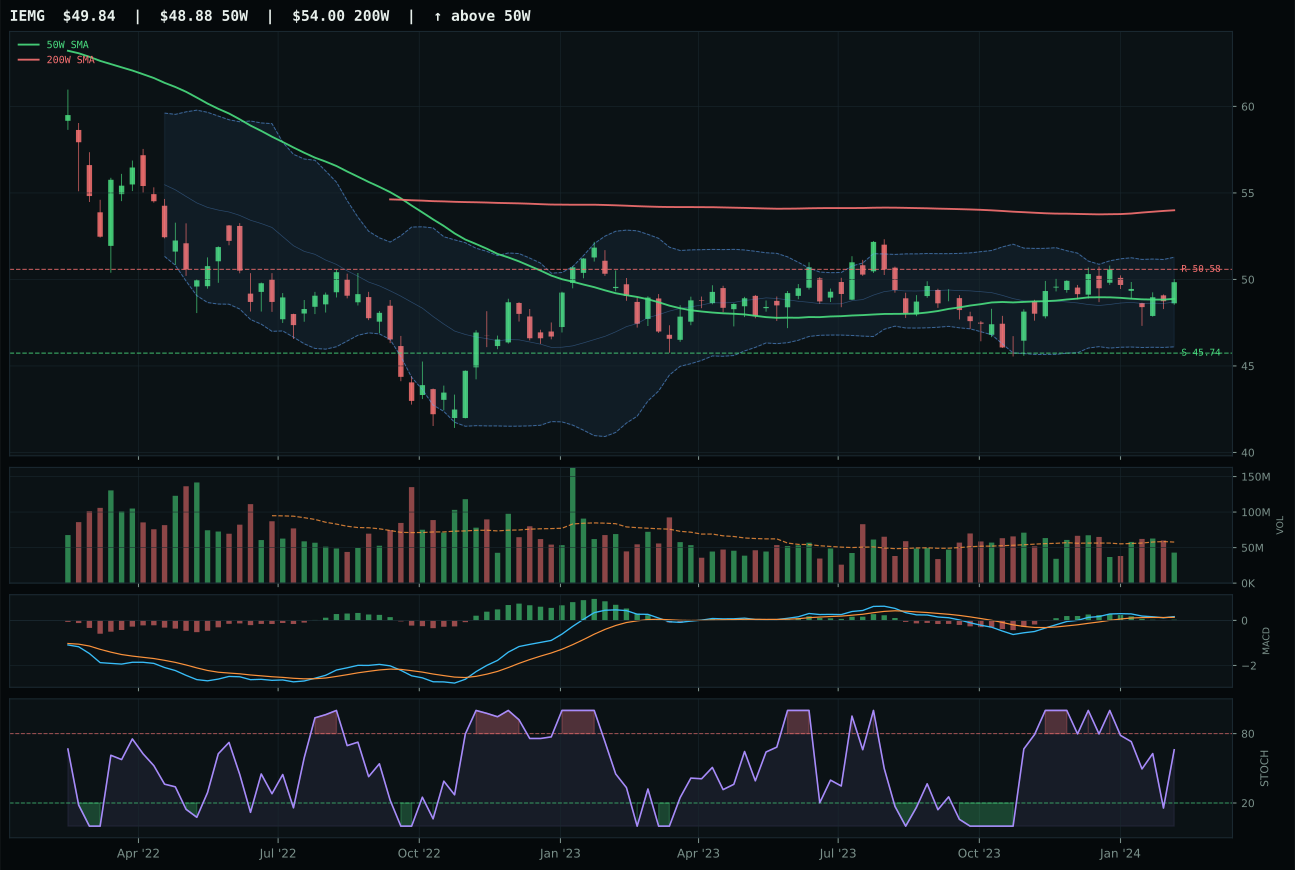
IEMG has a compression near 50W profile with -10.0% 13-week relative strength versus SPY.
A failed hold above support would weaken the setup.
Actionable but governed by invalidation levels.
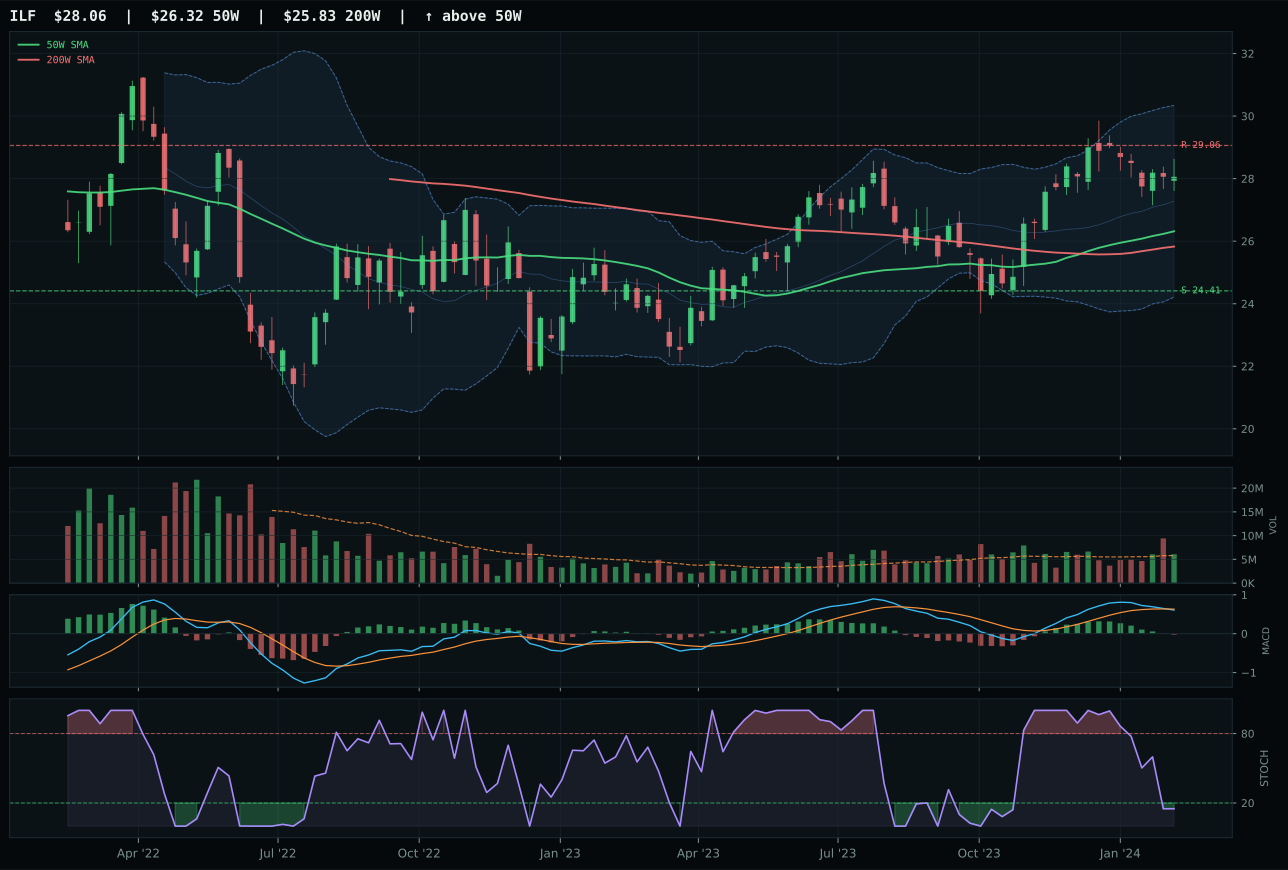
ILF has a neutral structure profile with -8.2% 13-week relative strength versus SPY.
A failed hold above support would weaken the setup.
Actionable but governed by invalidation levels.
INDA won Emerging Markets by clearing the category-relative strength hurdle at 8.4% versus IEMG's -1.8%, a decisive 10.2-point spread that reflected India's outperformance within a broad emerging-market basket. INDA's structure is clean and vertical (86.3/100) with strong trend confirmation (96.4/100), yet the setup is extended 15.1% above the 50W, which compressed the timing score to 22.0. The critical differentiator is volume: INDA trades at above-average participation (1.30x the 20W average), whereas IEMG shows thin participation and IEMG's MACD is bullish but flattening. INDA's stochastic RSI is overbought rolling over at 0.88, warning of near-term pullback risk, yet the 14.0% 13-week return and positive SPY-relative strength (0.3%) justify the win. Momentum confirmation scored 81.4 for INDA because the strong recent returns and above-average participation proved that the move has buyer sponsorship. IEMG's compressed structure (71.3) and thin volume prevented it from overcoming INDA's category-relative advantage despite IEMG posting a superior timing score (100/100 vs 22/100).
Emerging Markets earned a tier-2 allocation of 5% with a final category score of 26.6, placing it toward the lower end of the allocation tier-2 group and reflecting macro headwinds that offset INDA's strong technical setup. Risk appetite positive (+8) is active and supports emerging-market positioning, yet credit stress (-10) and liquidity stress (-10) are both active and carry significant weight in a macro environment where capital outflow risks are present. The category macro fit of 38.0 is the second-weakest among all categories (ahead only of Agricultural), constraining conviction despite INDA's 14.0% 13-week return. The allocation decision rests on the asymmetry between INDA's technical strength and the category's macro fragility: INDA is the best-positioned emerging-market name, and the 5% sleeve provides participation in India's structural growth (AI, software, outsourcing) without overcommitting to a category where macro stress could trigger rapid unwinds. At 5% allocation, Emerging Markets serves as a modest growth kicker that can be quickly trimmed if credit stress or liquidity stress indicators deteriorate further. If risk appetite were to weaken materially, this slot would be reduced first; conversely, if emerging-market credit spreads compress and liquidity stress lifts, the allocation could expand into a higher conviction level.
Agriculture & Livestock — MOO
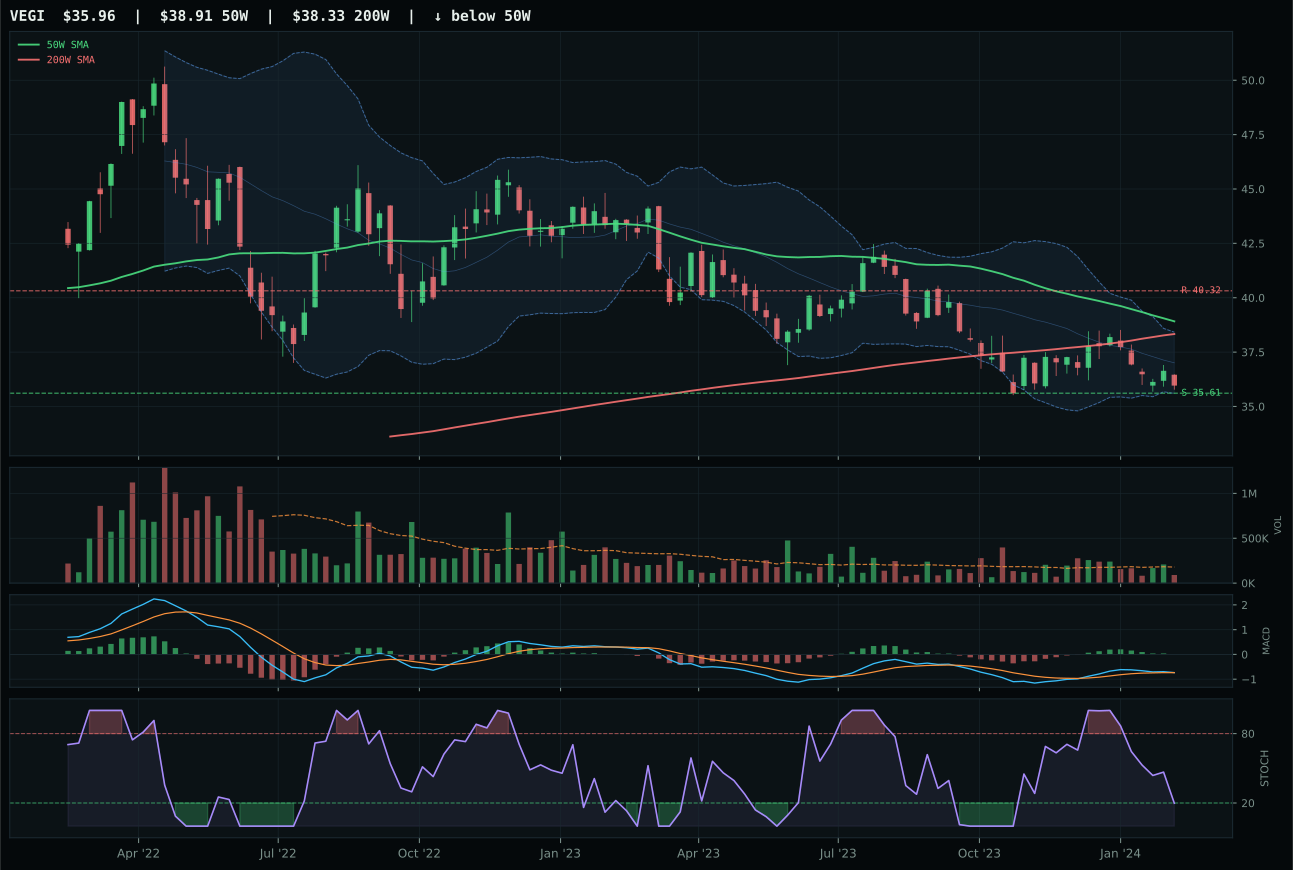
VEGI has a pullback into support profile with -14.0% 13-week relative strength versus SPY.
A failed hold above support would weaken the setup.
Tracked, but not top-2 eligible because: .
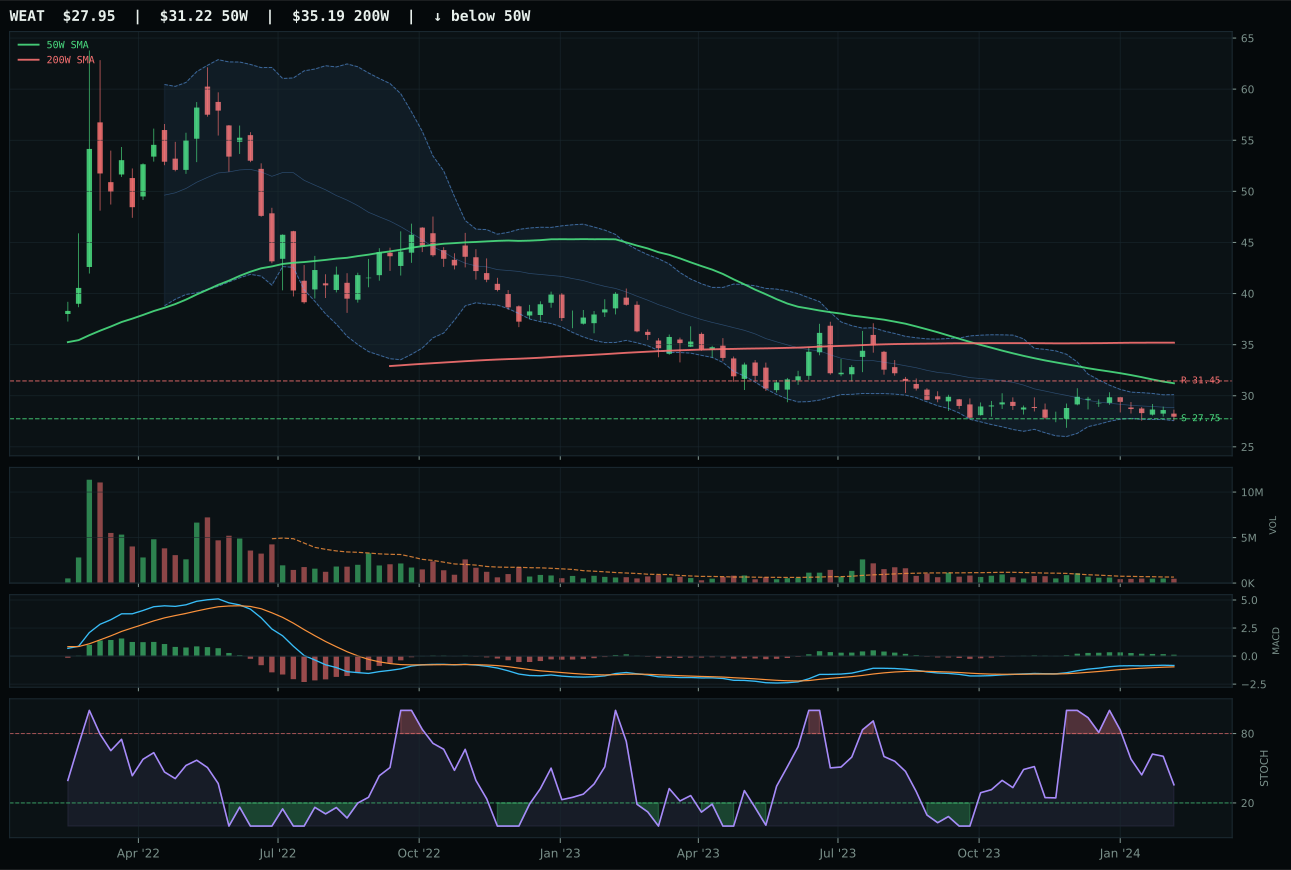
WEAT has a pullback into support profile with -16.7% 13-week relative strength versus SPY.
Extension and support failure are the main tactical risks.
Tracked, but not top-2 eligible because: structurally broken.
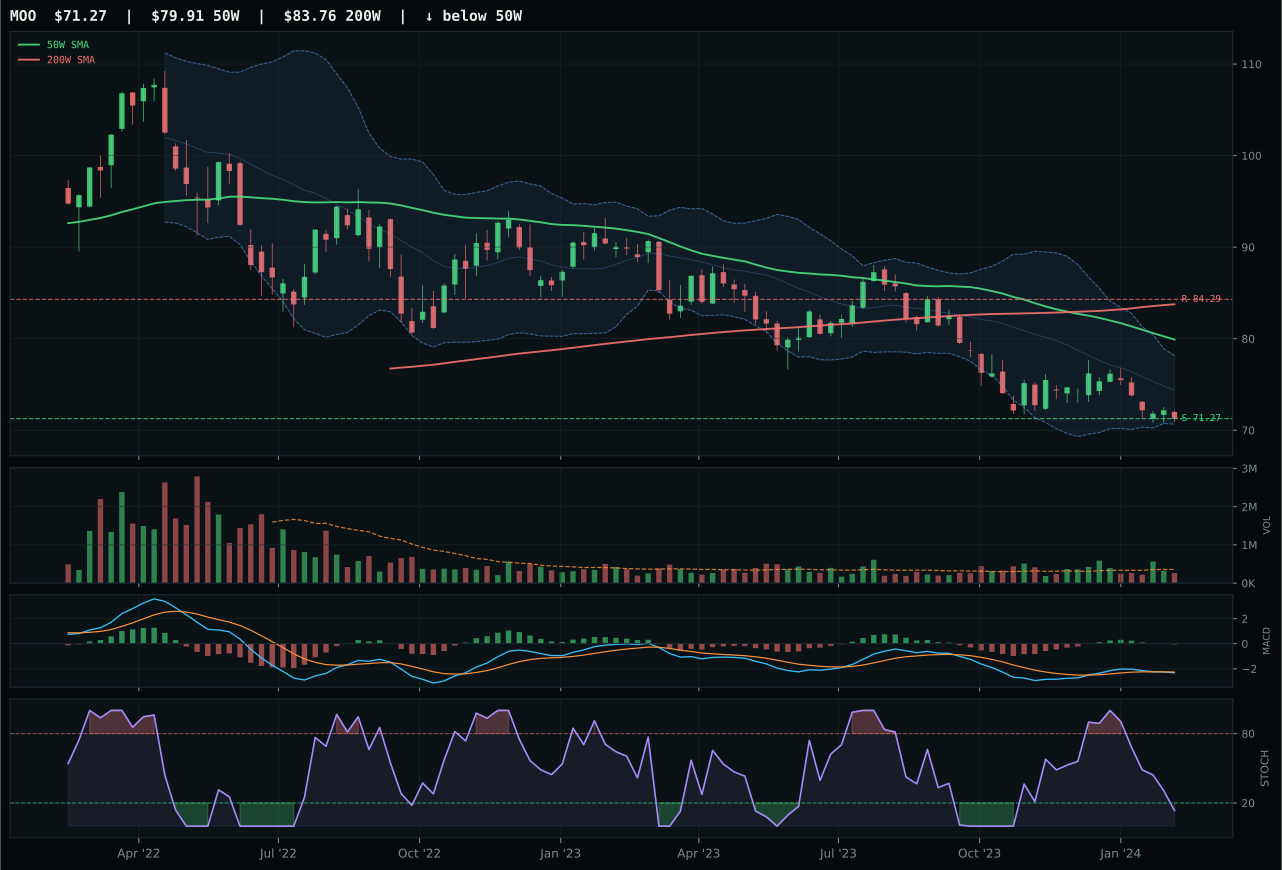
MOO has a pullback into support profile with -15.8% 13-week relative strength versus SPY.
Extension and support failure are the main tactical risks.
Tracked, but not top-2 eligible because: structurally broken.
MOO won the Agriculture & Livestock category despite registering the lowest composite score of all winners (6/100), a reflection of the category's structural deterioration rather than any strength in MOO itself. Price is 10.8% below the 50W, MACD is bearish and weakening, stochastic RSI is deeply oversold at 0.14, and the setup is a pullback into support near 71.27 with no bullish confirmation on the chart. MOO's 13-week return is -2.0%, category-relative strength is 0.0%, and momentum confirmation scored 0.0/100 because the four-week return was negative and MACD is deteriorating. The only structural merit is the risk-reward profile: downside to support is 0.0%, meaning that if the support level holds, the asymmetry favors a bounce attempt. VEGI, the runner-up, posted a higher technical evidence score (45.0 vs 16.9) and a bullish-but-flattening MACD, yet lost the decision because MOO's score gap was -33.3 points, indicating that this category is not competitive enough to recommend for allocation.
Agriculture & Livestock earned 5% allocation despite the final category score of 0.0 and an ineligible status flag, a result driven by disinflation pressure (-8) and liquidity stress (-4) that dragged the entire basket below portfolio relevance. The category-level macro fit is only 32.0, the lowest among all categories, and both MOO and its peers face a macro headwind where falling food prices reduce margins for agriculture equities. The 13-week return of -2.0% and category-relative strength of -15.8% versus SPY document outright weakness, not consolidation. The decision to allocate 5% is a residual positioning choice given the overlay structure: in a 50% crypto regime, all non-crypto sleeves are halved, so the 5% represents a minimal hedge rather than a conviction bet. If disinflation pressure were to reverse or if risk appetite were to collapse into a flight-to-safety dynamic favoring food security names, Agriculture could emerge as a portfolio stabilizer; until then, MOO holds the slot as the least-offensive option in a category that offers no compelling macro or technical case for capital allocation.
Industrial Metals — COPX
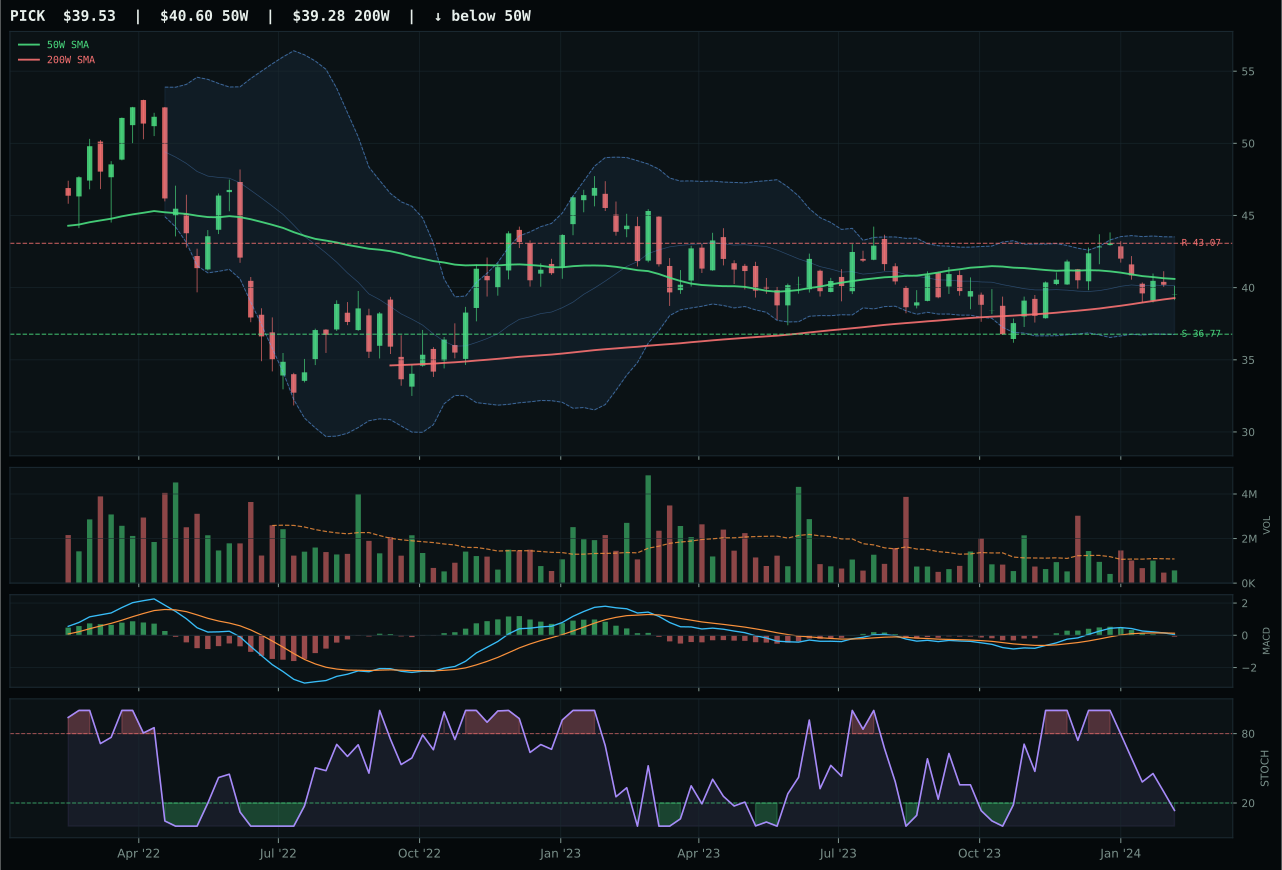
PICK has a compression near 50W profile with -9.9% 13-week relative strength versus SPY.
A failed hold above support would weaken the setup.
Actionable but governed by invalidation levels.
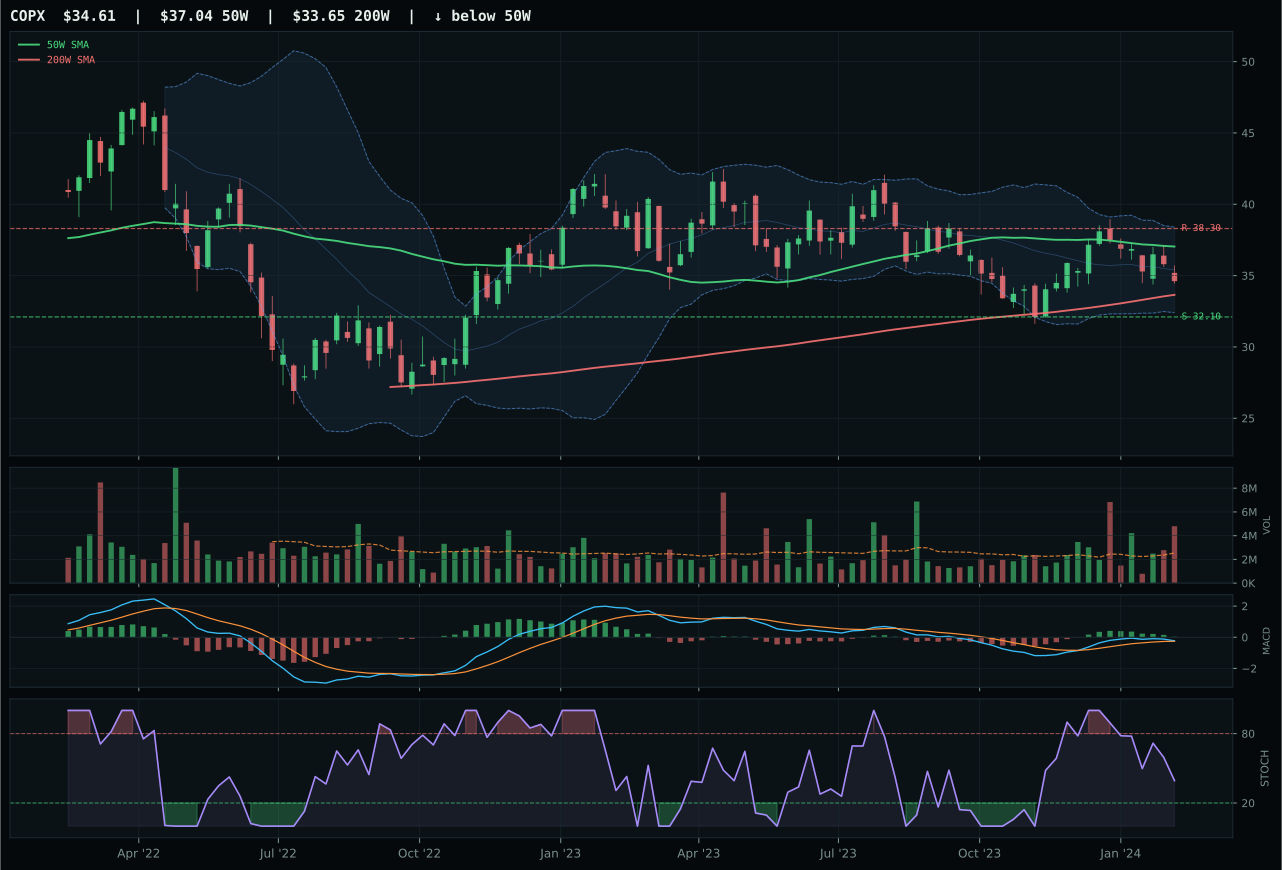
COPX has a neutral structure profile with -5.9% 13-week relative strength versus SPY.
A failed hold above support would weaken the setup.
Actionable but governed by invalidation levels.
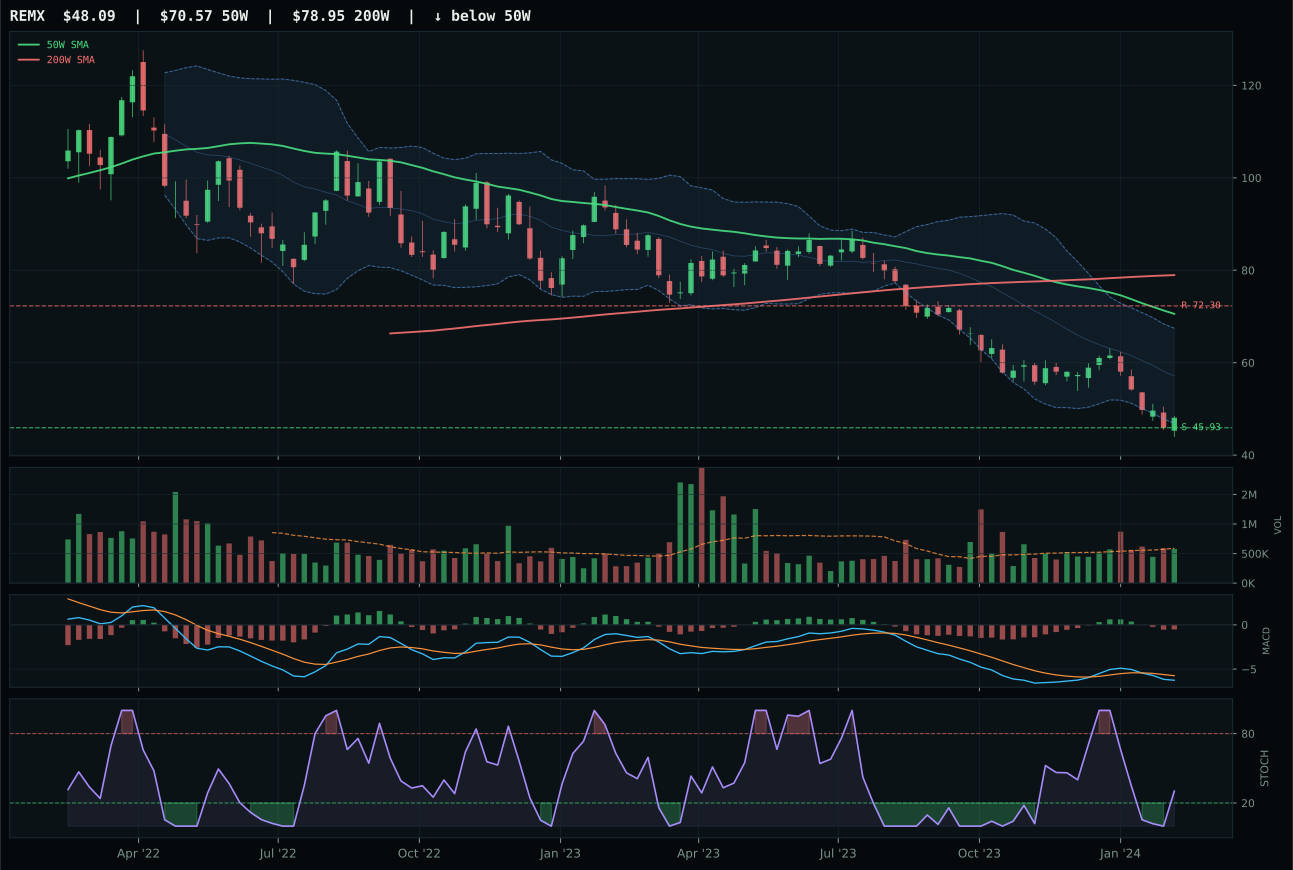
REMX has a pullback into support profile with -27.7% 13-week relative strength versus SPY.
Extension and support failure are the main tactical risks.
Tracked, but not top-2 eligible because: structurally broken.
COPX won Industrial Metals by 3.7 points over PICK, the decision hinging on MACD confirmation (bullish but flattening vs bearish/weakening) and category-relative strength (3.9% vs 0.0%). COPX is 6.6% below the 50W, positioning it as a reset within the longer-term uptrend, whereas PICK sits near the 50W in a compression setup that lacks directional commitment. The 13-week return of 7.8% for COPX tops PICK's 3.9%, and COPX's MACD remains above zero despite flattening, which is preferable to PICK's already-bearish MACD that signals fading conviction. Volume at 1.89x the 20W average for COPX indicates distribution pressure, a negative sign, yet the risk/reward of 67.2 reflects potential upside if the metal scarcity narrative remains intact. PICK scored higher on timing (100/100 vs 77/100) because its near-50W position is a decision point, but that same proximity to the 50W means support is close—just 36.77—and the chart offers little room for error. The winner is the less broken of two broken setups, a distinction appropriate for a category that lacks bullish sponsorship.
Industrial Metals earned 0% allocation this week, ranked 9th among the ten categories with a final score of 24.0 and an eligible status that permitted consideration but failed the allocation threshold. The metals scarcity descriptor (+14) is active and offers tactical support for a category that should benefit from AI-driven demand for copper and rare earths, yet the category score of 24.0 is dragged down by liquidity stress (-8) and credit stress (-7), which create a macro environment where risk appetite is fragile. COPX's distribution volume (1.89x the 20W average) is a warning signal that smart money is exiting positions, and the -5.9% relative strength versus SPY confirms that copper is lagging the broad market despite the scarcity narrative. The decision to exclude Industrial Metals from the allocation reflects the hierarchy of opportunity: Technology and AI are scoring in the 68-73 range with better trend structure, Defense and Precious Metals are scoring 34-50 with defined support, whereas Industrial Metals at 24.0 offers only a margin-of-safety argument without compelling directional catalysts. For Industrial Metals to earn a 5% sleeve, either COPX would need to post positive relative strength and show MACD confirmation, or the credit stress descriptor would need to flip from active to inactive, signaling that financial conditions were loosening.
Traditional Energy — XLE
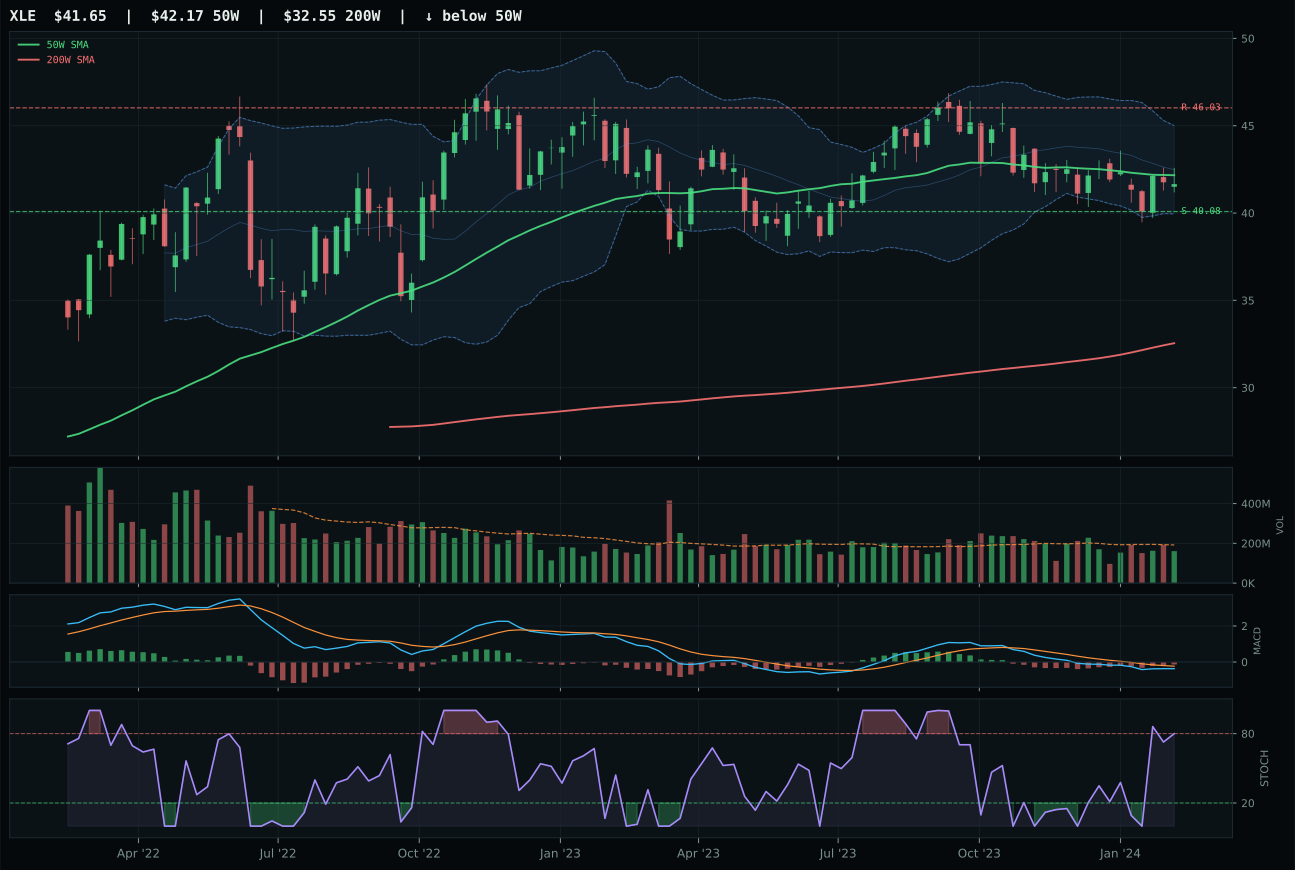
XLE has a pullback into support profile with -13.9% 13-week relative strength versus SPY.
A failed hold above support would weaken the setup.
Actionable but governed by invalidation levels.
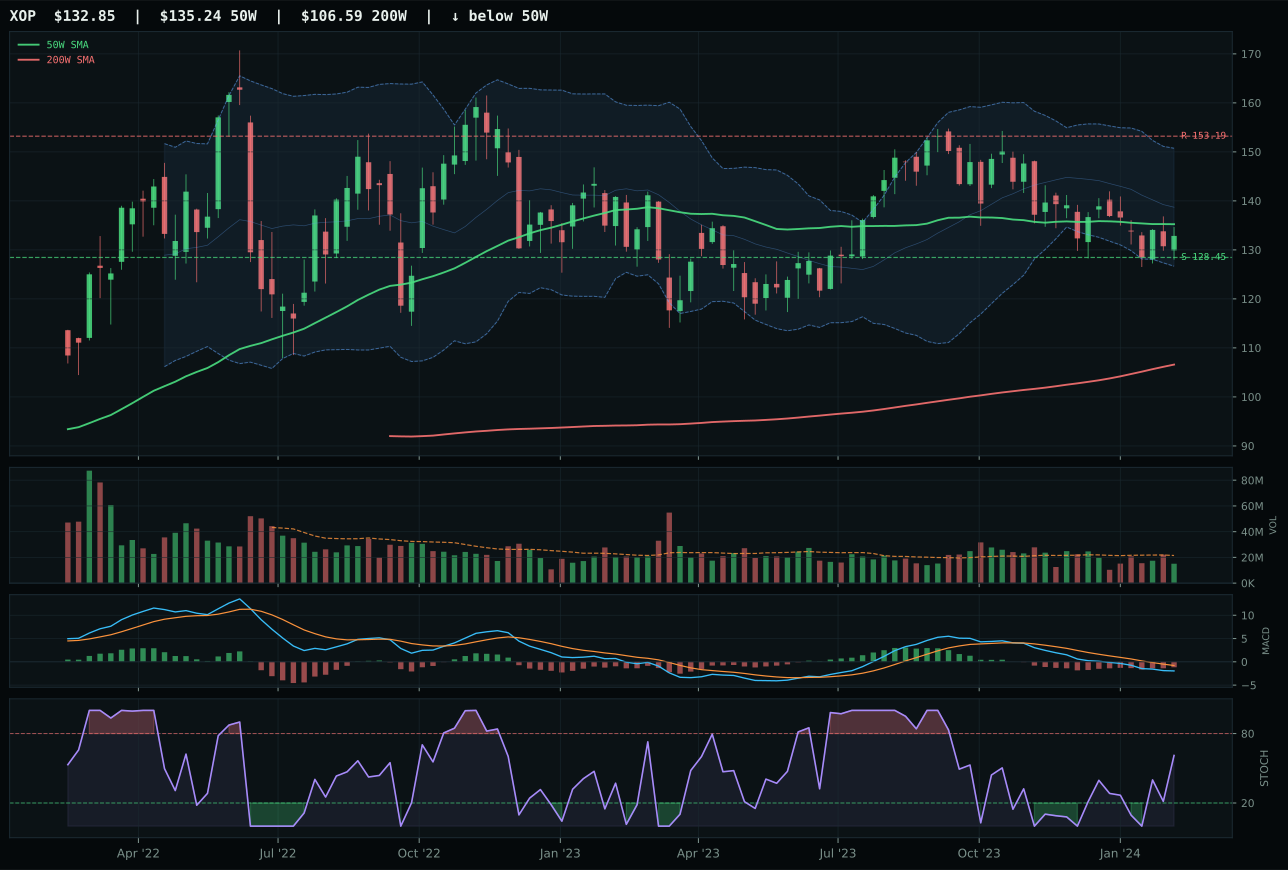
XOP has a pullback into support profile with -16.9% 13-week relative strength versus SPY.
A failed hold above support would weaken the setup.
Actionable but governed by invalidation levels.
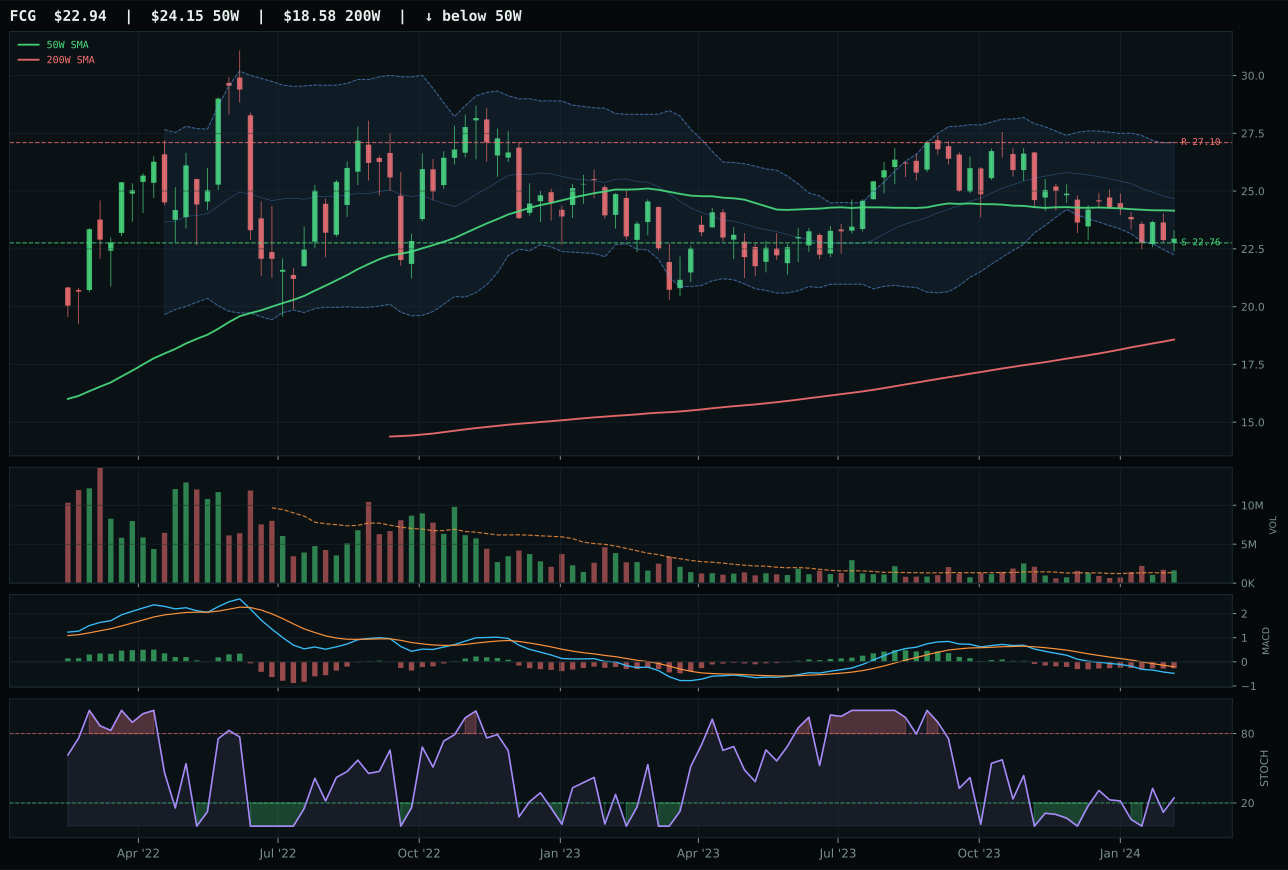
FCG has a pullback into support profile with -20.5% 13-week relative strength versus SPY.
A failed hold above support would weaken the setup.
Actionable but governed by invalidation levels.
XLE won Traditional Energy by 7.5 points over XOP, a decision driven almost entirely by structure cleanliness (71.5 vs 63.4) and timing accuracy (100.0/100 vs 100.0/100 for both, but different risk/reward expression). XLE trades only 1.2% below the 50W in a pullback-into-support setup near 40.08, and the risk/reward is exceptional at 96.6/100: upside to resistance is a modest -9.5%, but downside to support is only 3.9%, creating a 2.6x asymmetry if support holds. MACD is bearish but improving, stochastic RSI is rising mid-zone at 0.80, and the Fibonacci zone is the decision level (middle retracement / 0.618), all signs of potential mean-reversion. XOP trades lower with more extension risk (16.9% weaker relative to SPY) and thinner volume confirmation (thin participation vs neutral), which explains the structural gap. Both ETFs show -13% to -17% weakness versus SPY, reflecting that energy is out of favor in a disinflation regime, but XLE's proximity to support and superior risk/reward asymmetry earned it the category win despite neither offering compelling directional conviction.
Traditional Energy earned 0% allocation with a final category score of 1.6, ranking 10th among all ten categories and reflecting the severe headwinds of disinflation pressure (-10) and a macro fit of only 16.0. The descriptor checklist shows liquidity stress (-7) and credit stress (-7) both active, creating a perfect storm for energy equities: falling nominal rates reduce commodity demand forecasts, tighter financial conditions constrain working capital for exploration, and the 13-week return of -0.1% for XLE confirms that energy is in stall mode. XLE's exceptional risk/reward (96.6/100) and perfect timing score (100.0/100) are mathematical artifacts of the pullback-into-support structure, not evidence of strength; when an asset class is this weak relative to SPY (-13.9%), a good risk/reward on a bounce is a contrarian fade, not a conviction trade. For Traditional Energy to earn even a tier-2 allocation, disinflation pressure would need to reverse—either through a surprise inflation print or a pivot to economic stimulus—and the energy complex would need to post positive relative strength confirmation. Until that regime change occurs, XLE's support level at 40.08 is noted for potential tactical re-entry, but the category is excluded from the current allocation structure.