
2024-02-02
Informational purposes only. The content in this report, including allocations, analysis, and commentary, is provided solely for informational and educational purposes. It does not constitute financial advice, investment advice, trading advice, or any other type of advice. Past performance does not guarantee future results. Always conduct your own research and consult a qualified financial professional before making investment decisions.
Weekly Allocation
| Ticker | Category | Weight | Role |
|---|---|---|---|
| FBTC | 50% | Overlay | |
| SMH | AI | 10% | Top-2 (10%) |
| IGV | Technology | 10% | Top-2 (10%) |
| URNM | Nuclear Energy | 5% | Tier-2 (5%) |
| ITA | Defense & Aerospace | 5% | Tier-2 (5%) |
| PAVE | Utilities & Infrastructure | 5% | Tier-2 (5%) |
| MOO | Agriculture & Livestock | 5% | Tier-2 (5%) |
| XLE | Traditional Energy | 5% | Tier-2 (5%) |
| GLD | Precious Metals | 5% | Tier-2 (5%) |
Trade Instructions — Monday Open
Sell the tranche from 2024-01-05 (completing its 4-week hold). Buy the new tranche. Instructions show net portfolio changes — same-asset positions cancel, weight changes show the delta.
| Action | Ticker | Instruction |
|---|---|---|
| SELL | PAVE | Sell 20% of PAVE position (reduce 6.25% → 5.00%) |
| SELL | GLD | Sell 20% of GLD position (reduce 6.25% → 5.00%) |
| SELL | CIBR | Sell 33% of CIBR position (reduce 3.75% → 2.50%) |
| SELL | INDA | Sell 50% of INDA position (reduce 2.50% → 1.25%) |
| BUY | SMH | Buy SMH — 25.00% of freed cash (adds 1.25% to portfolio) |
| BUY | XLE | Buy XLE — 25.00% of freed cash (adds 1.25% to portfolio) |
| BUY | IGV | Buy IGV — 50.00% of freed cash (adds 2.50% to portfolio) |
Current Portfolio After Trade
Combined holdings across all 4 active tranches. Each tranche is 25% of the portfolio.
| Ticker | % of Portfolio | Weight Bar |
|---|---|---|
| FBTC | 50.00% | |
| SMH | 7.50% | |
| PAVE | 5.00% | |
| GLD | 5.00% | |
| MOO | 5.00% | |
| URNM | 5.00% | |
| XLK | 5.00% | |
| ITA | 3.75% | |
| CIBR | 2.50% | |
| BOTZ | 2.50% | |
| XLE | 2.50% | |
| IGV | 2.50% | |
| INDA | 1.25% | |
| XAR | 1.25% | |
| COPX | 1.25% |
Macro Regime — Disinflation
Macro Evidence Charts
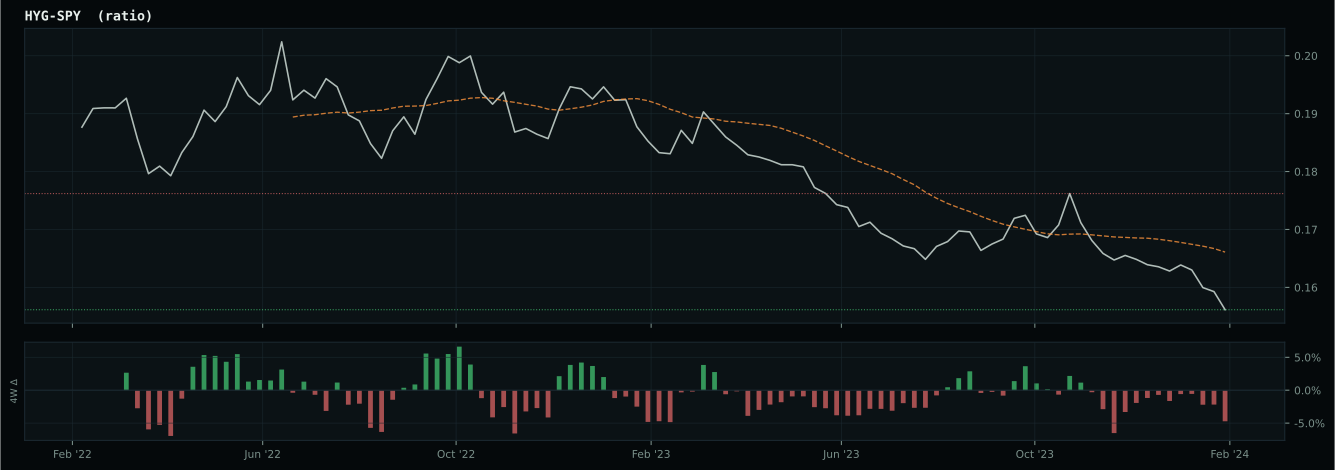
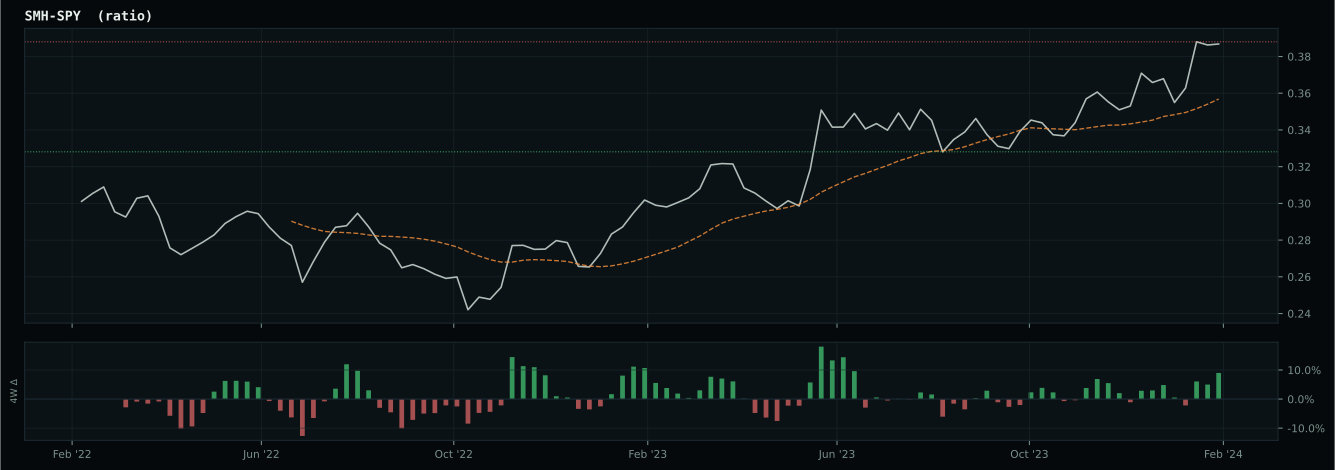
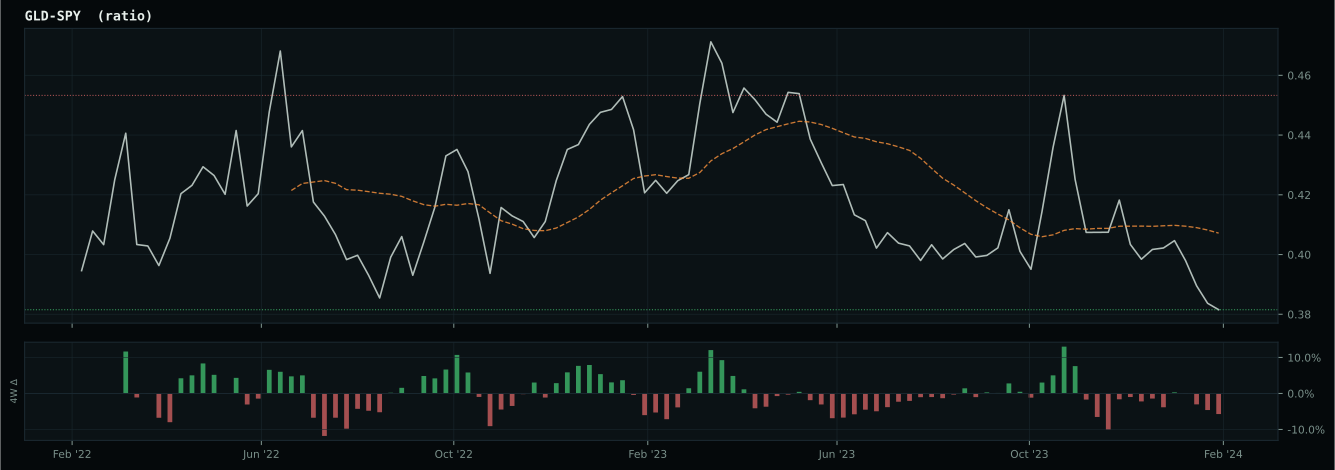
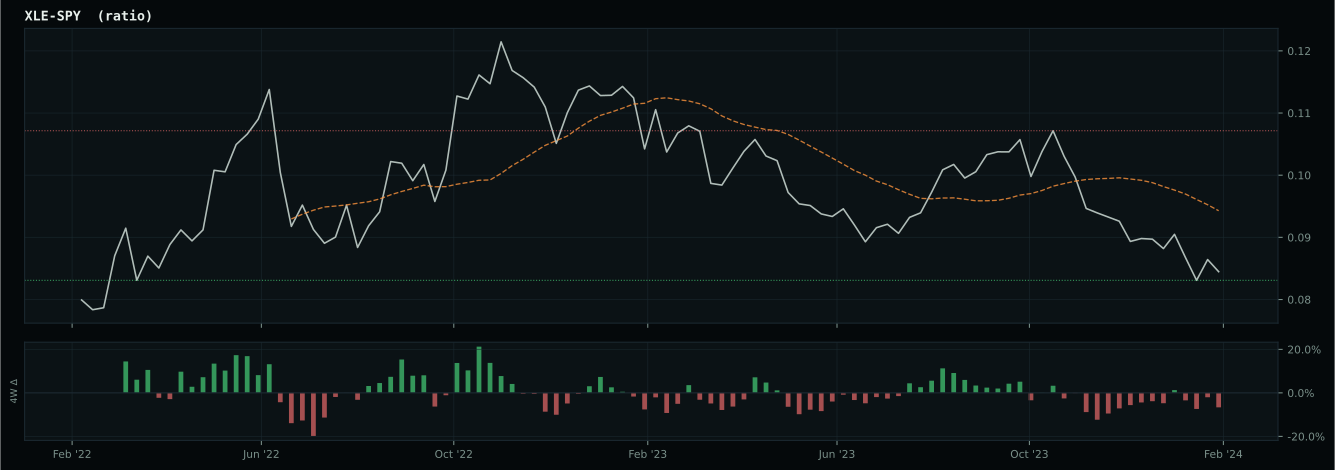
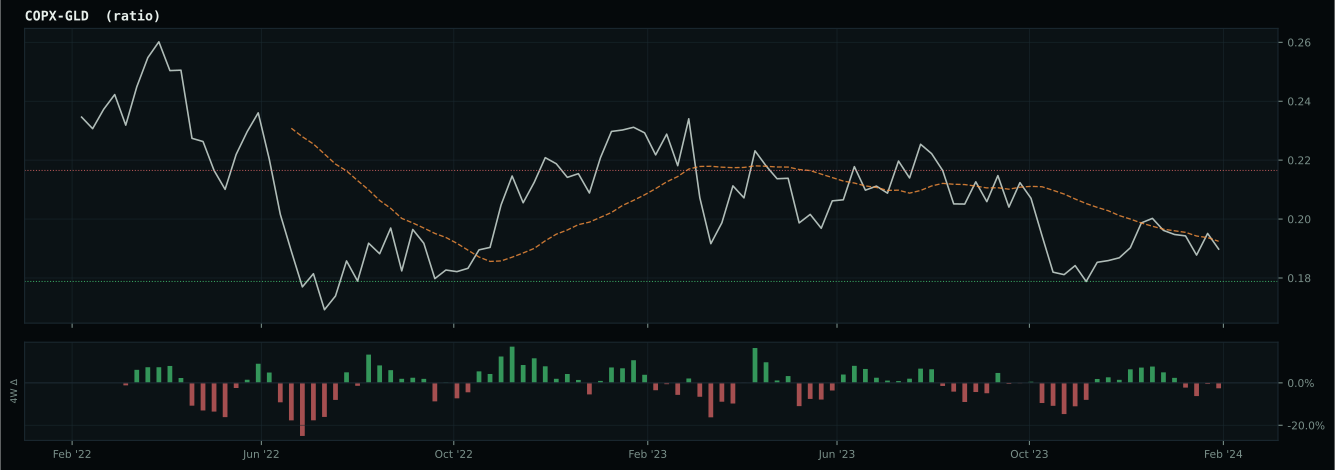
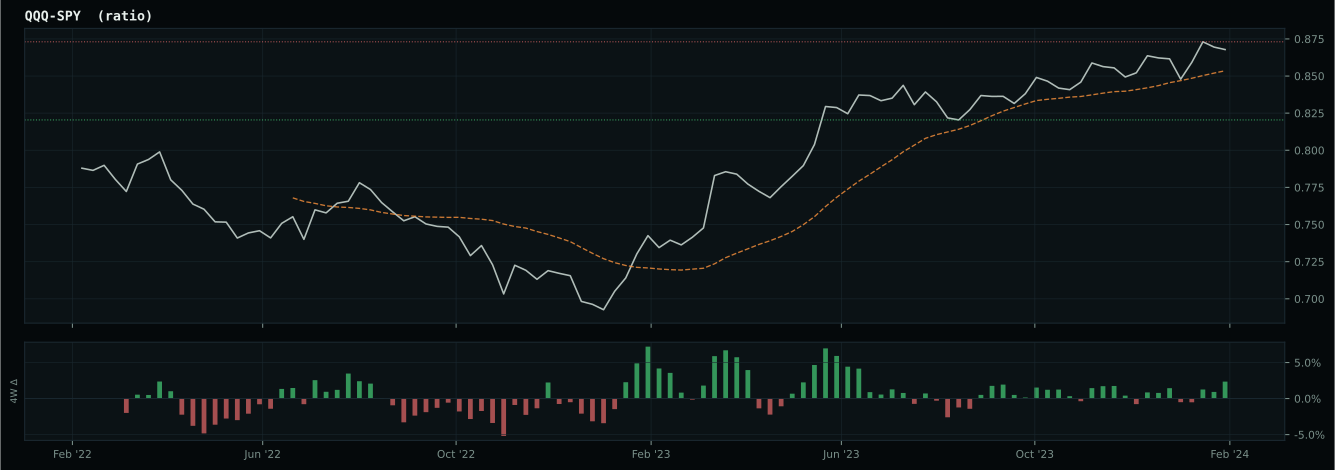
Market-implied signals behind the macro regime scores. Each ratio compares two assets; the direction and slope of the ratio is what the macro engine reads.
Crypto Regime — TrendBTC
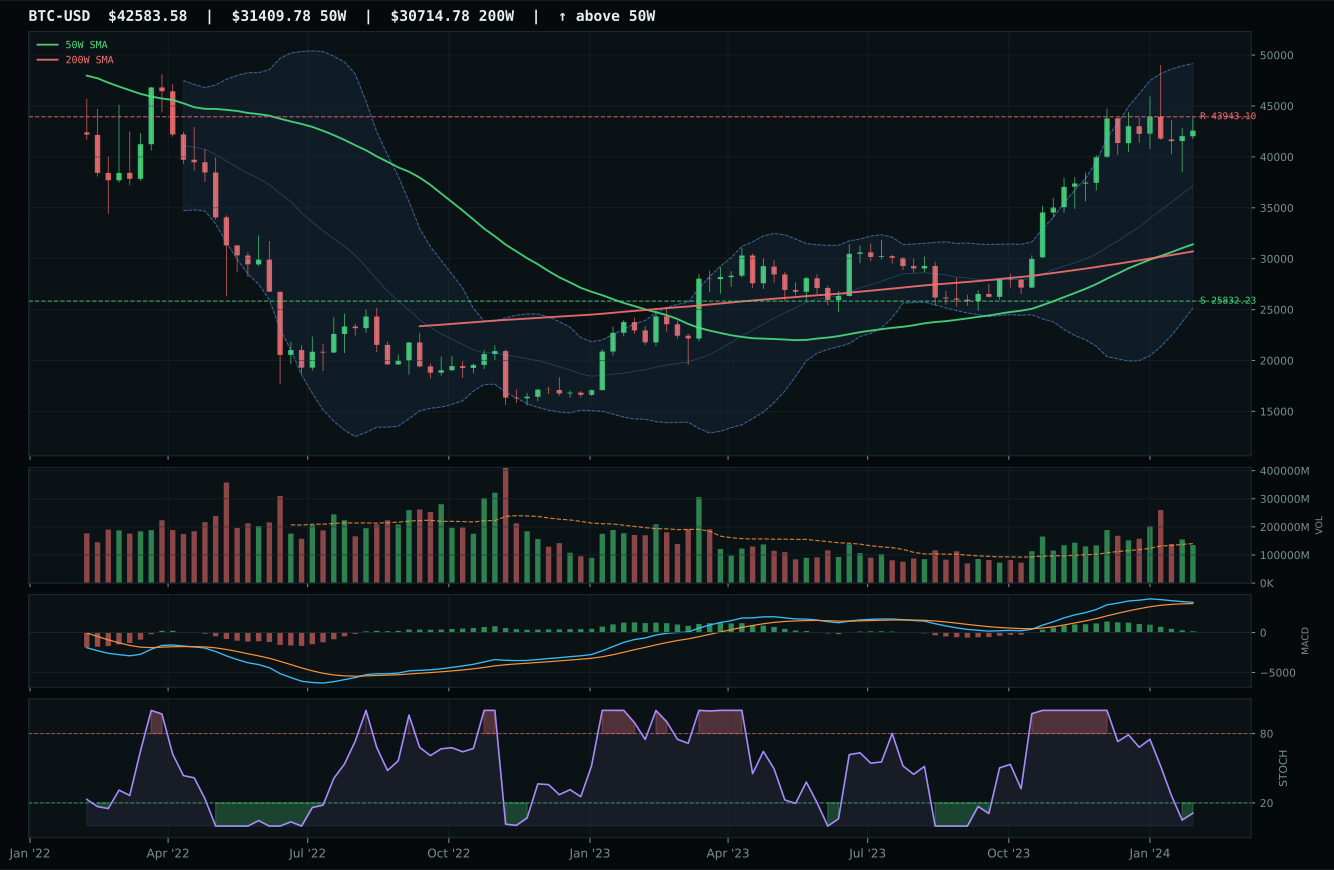
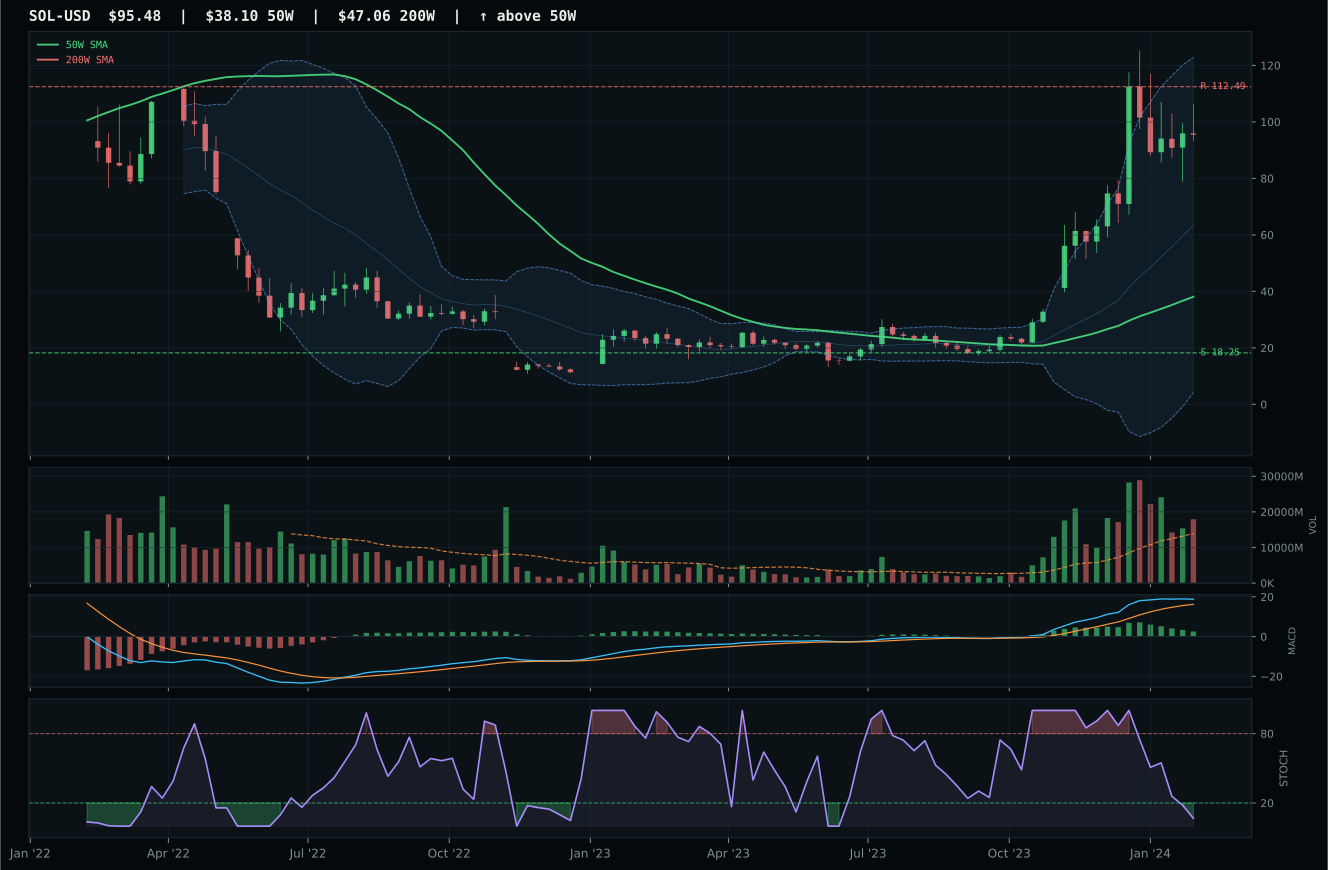
post-touch structure is too wide to count as a range; max/min close ratio is 2.64
TrendBTC confirmed: 2 consecutive closes above rising/flat 50W SMA
one or more available conditions failed
Category Rankings
| Rank | Category | Winner | Score | Alloc | 4W Ret | Peers (4W) |
|---|---|---|---|---|---|---|
| 1 | AI | SMH | 71.4 | 20% | +15.74% | BOTZ +9.3% · AIQ +6.0% |
| 2 | Technology | IGV | 71.0 | 20% | +0.79% | CIBR +3.1% · XLK +3.6% |
| 3 | Nuclear Energy | URNM | 55.8 | 10% | -13.34% | URA -9.2% · NLR -3.0% |
| 4 | Defense & Aerospace | ITA | 48.8 | 10% | +4.55% | XAR +7.3% · ROKT +5.6% |
| 5 | Utilities & Infrastructure | PAVE | 44.7 | 10% | +8.23% | IGF +0.8% · XLU +0.9% |
| 6 | Precious Metals | GLD | 33.0 | 10% | +3.89% | SLV +4.8% · GDX +1.2% |
| 7 | Industrial Metals | COPX | 25.0 | 10% | +3.69% | PICK +0.6% · REMX +20.0% |
| 8 | Emerging Markets | INDA | 13.0 | 10% | +3.77% | ILF +1.1% · IEMG +4.9% |
| 9 | Agriculture & Livestock | MOO | — | 0% | +0.87% | VEGI -0.3% · WEAT -7.1% |
| 10 | Traditional Energy | XLE | — | 0% | +4.92% | FCG +11.9% · XOP +10.0% |
AI — SMH
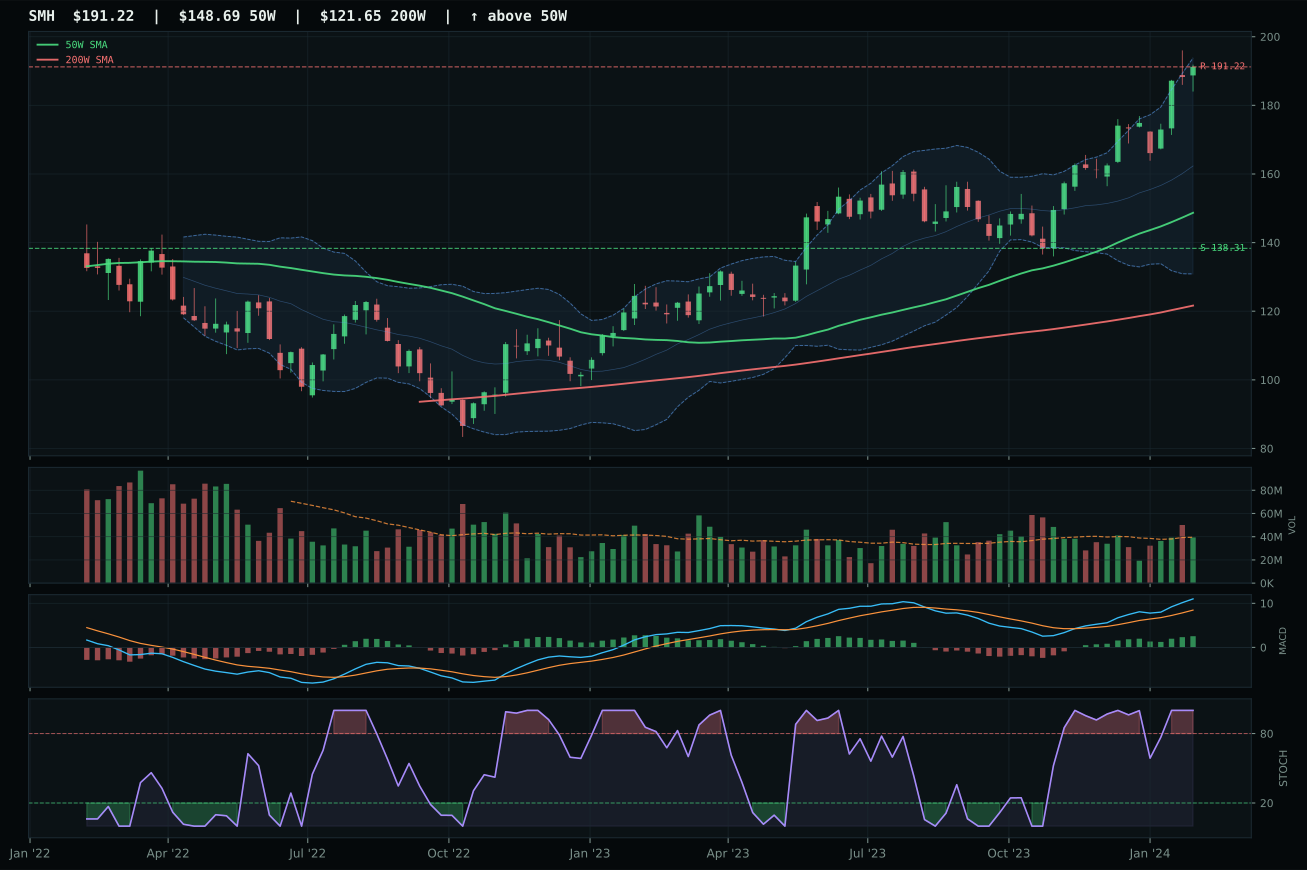
SMH has a vertical extension profile with 14.2% 13-week relative strength versus SPY.
A failed hold above support would weaken the setup.
Actionable but governed by invalidation levels.
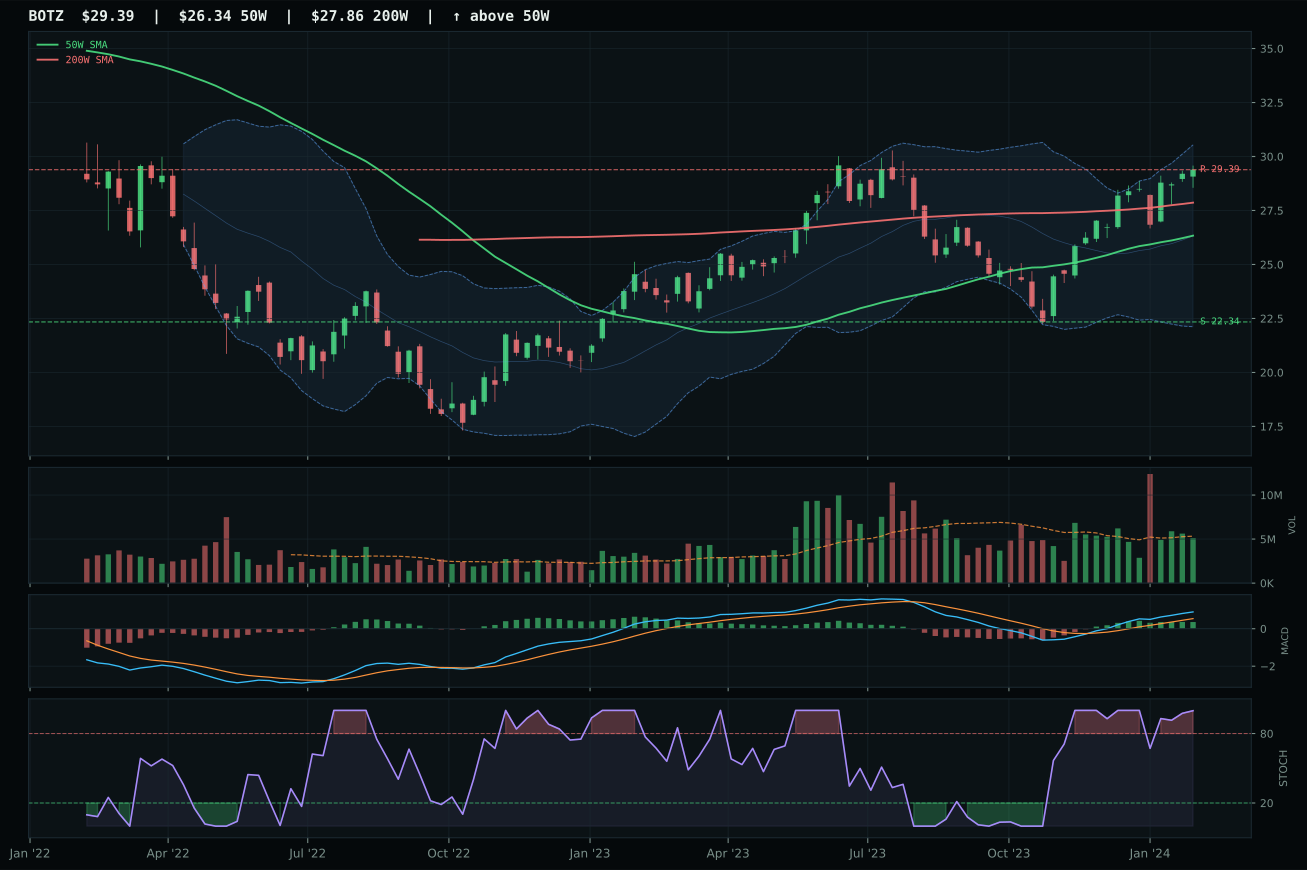
BOTZ has a neutral structure profile with 6.5% 13-week relative strength versus SPY.
A failed hold above support would weaken the setup.
Actionable but governed by invalidation levels.
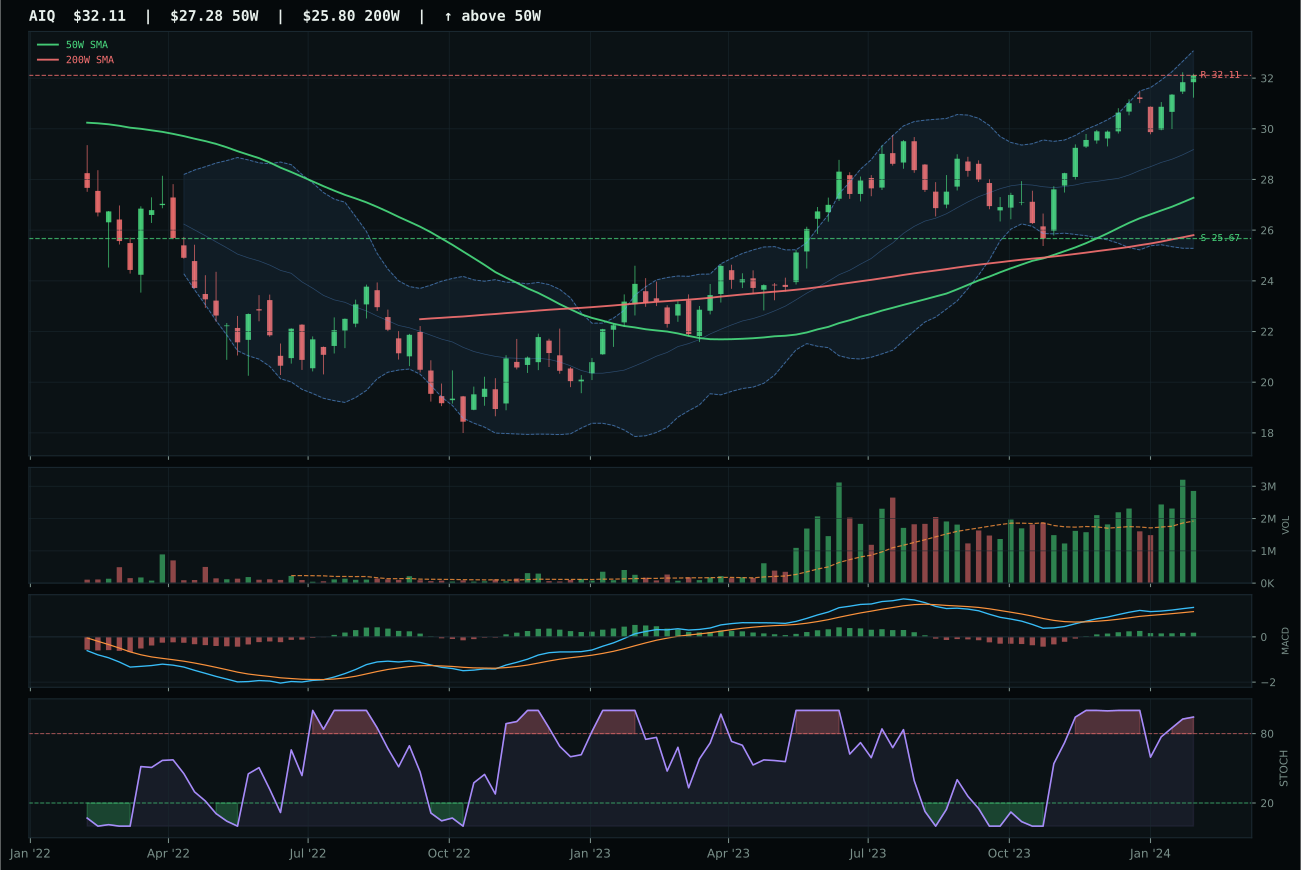
AIQ has a vertical extension profile with 2.6% 13-week relative strength versus SPY.
A failed hold above support would weaken the setup.
Actionable but governed by invalidation levels.
SMH won the AI category despite scoring lower than BOTZ on technical evidence (71.4 vs 85.0) because it captured the only meaningful category-relative strength advantage at 7.7% versus BOTZ's flat 0.0%. The 27.9% 13-week return, combined with 14.2% SPY-relative strength and 28.6% extension above the 50W, signals that semiconductor compute leadership has achieved the highest conviction among allocators—every trader recognizes the trend, which raises entry risk but confirms the magnitude of the move. BOTZ's neutral structure setup and lower category-relative strength revealed fewer new buyers accumulating into robotics despite its superior timing and risk/reward profiles. The differentiator was volume-price confirmation at 77.2% for SMH versus BOTZ's 80%, a small gap that masked the broader truth: SMH's vertical extension with MACD bullish improvement and stochastic RSI overbought at 1.00 indicates synchronized buyer participation across all time frames.
AI ranked second among all categories with a final score of 71.4 and received the top-2 tier at 10% allocation, matching Technology's overweight. The category benefited enormously from AI growth sponsorship active at +14 macro points and risk appetite positive at +10, creating a tailwind that offset liquidity stress (-10) and credit stress (-6). SMH's persistence score of 80.4 was the highest in its three-ETF basket, signaling that the trend showed no signs of rollover despite extended valuation. The allocation reflects conviction that semiconductor supply chain constraints and data center capex cycles will remain drivers in a disinflation environment where nominal growth concerns are muted. At 10%, the position sizes aggressively on the thesis that AI compute leadership will sustain higher multiples as real rates settle lower, but the 45.1% extension in URNM and elevated entry risk across all three names warn that a macro surprise could quickly punish crowded trades.
Technology — IGV
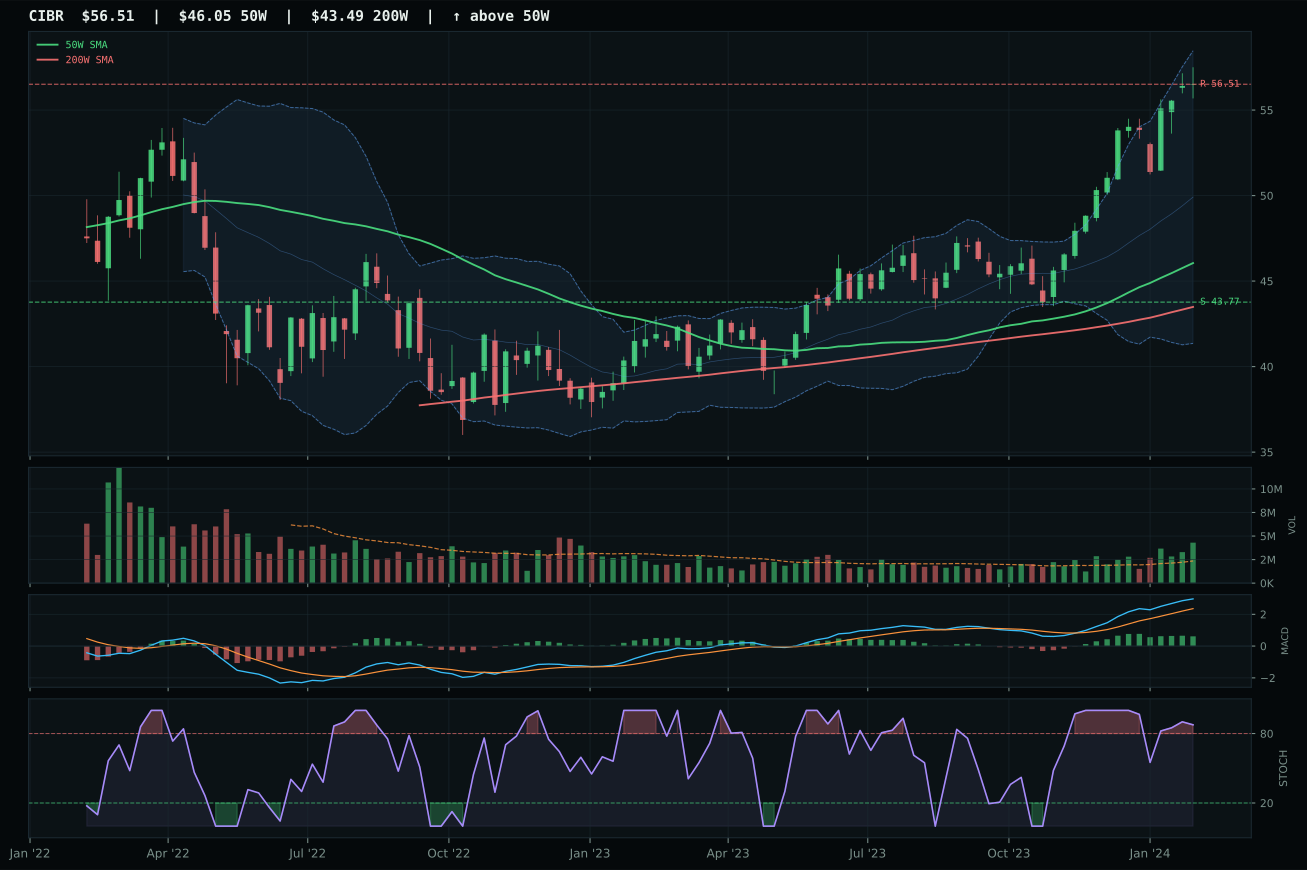
CIBR has a vertical extension profile with 10.1% 13-week relative strength versus SPY.
A failed hold above support would weaken the setup.
Actionable but governed by invalidation levels.
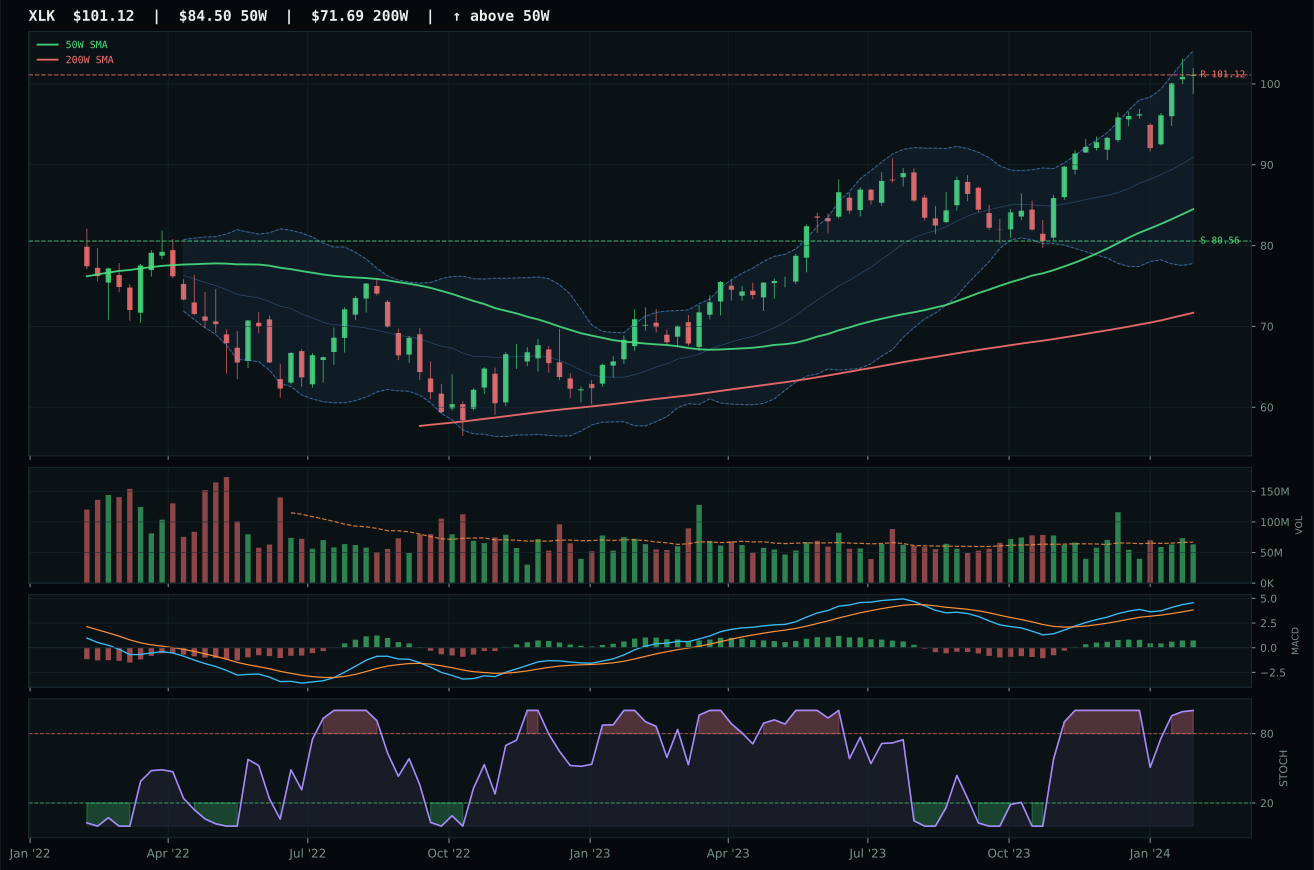
XLK has a vertical extension profile with 4.0% 13-week relative strength versus SPY.
A failed hold above support would weaken the setup.
Actionable but governed by invalidation levels.
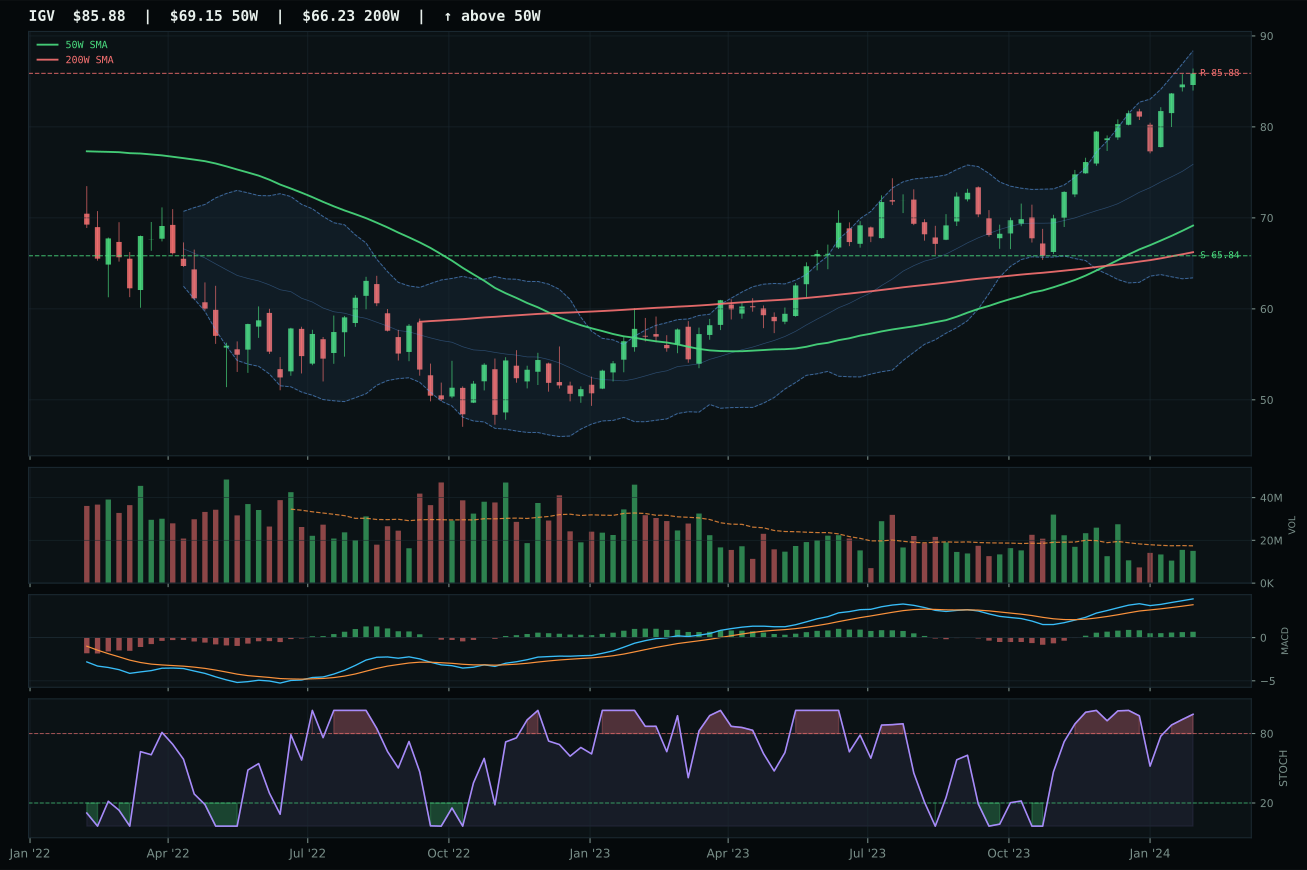
IGV has a vertical extension profile with 9.0% 13-week relative strength versus SPY.
A failed hold above support would weaken the setup.
Actionable but governed by invalidation levels.
IGV claimed the Technology category by assembling the cleanest blend of persistent uptrend and relative strength leadership within its peer set. Price sits 24.2% above the 50-week moving average with a 0.8% slope—still advancing—while the 13-week return of 22.7% and SPY-relative strength of 9.0% demonstrate genuine accumulation rather than mere momentum extension. CIBR posted a stronger 23.9% 13-week return and carried higher category-relative strength at 1.1%, yet IGV's superior structure score (79.8 vs CIBR's composite rating) and tighter cleanliness metrics gave it the edge where timing matters most. The setup is vertical extension into the Fibonacci 0.236 zone near 78.62—strength is being penalized for late entry, but MACD bullish improvement and stochastic RSI overbought momentum confirm that distribution has not yet set in.
Technology earned the top-2 tier and received 10% allocation as one of the two highest-scoring categories at 71.0, reflecting a disinflation-positive macro regime that favors duration-sensitive growth. The category's 62% technical weight and 38% macro weighting elevated it above tier-2 contenders because both enterprise software (IGV) and cybersecurity (CIBR) benefited from active AI growth sponsorship (+6 macro boost) and risk appetite positive signals (+9), offsetting some credit stress headwinds. Liquidity stress did weigh the category down by 10 points, but the persistence of relative strength inside the basket and the breadth of volume-price confirmation across all three ETFs justified the overweight. In a disinflation regime, growth equities with strong pricing power and momentum tend to outperform defensive positions, making the 10% allocation appropriate for a portfolio tilted toward risk appetite.
Nuclear Energy — URNM
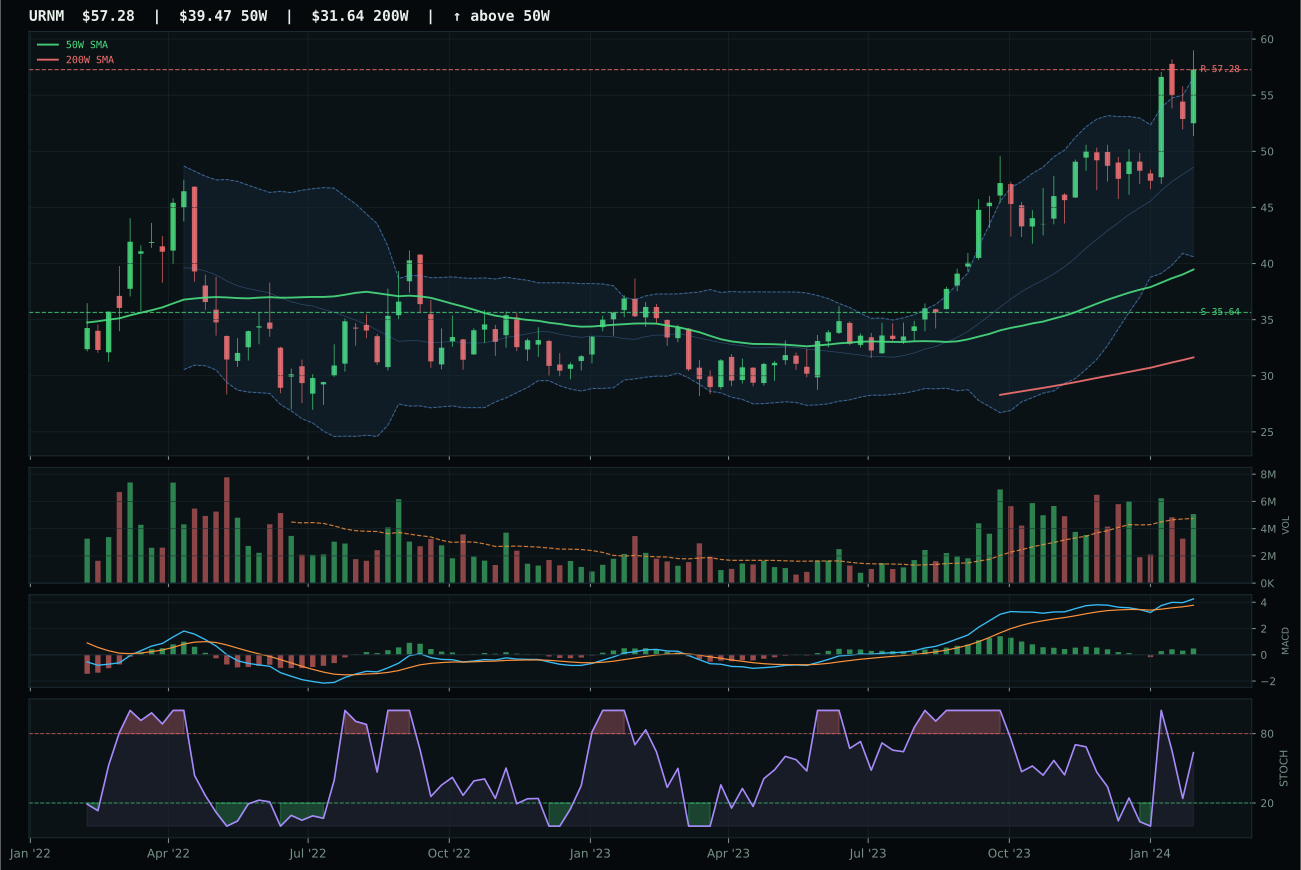
URNM has a vertical extension profile with 10.8% 13-week relative strength versus SPY.
A failed hold above support would weaken the setup.
Actionable but governed by invalidation levels.
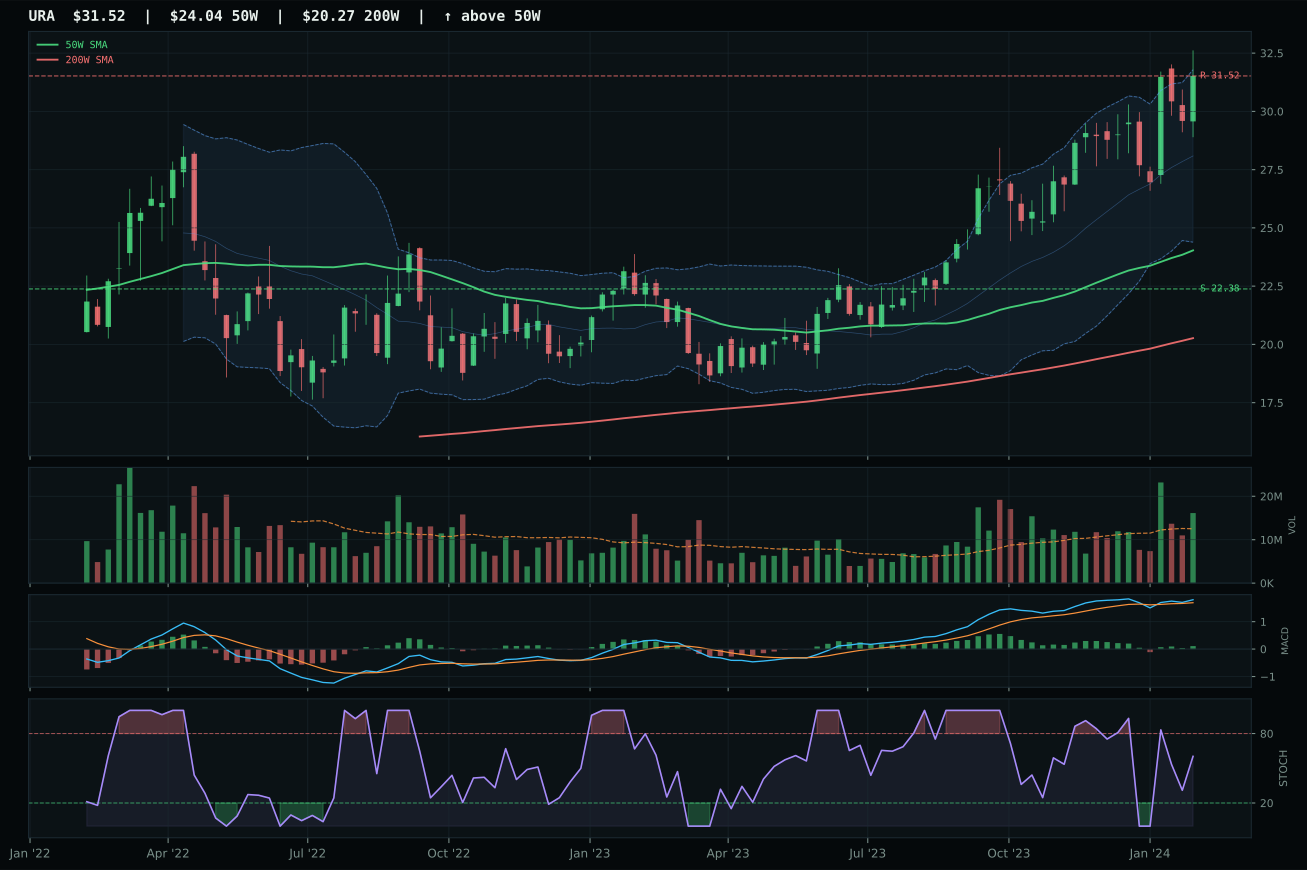
URA has a vertical extension profile with 3.0% 13-week relative strength versus SPY.
A failed hold above support would weaken the setup.
Actionable but governed by invalidation levels.
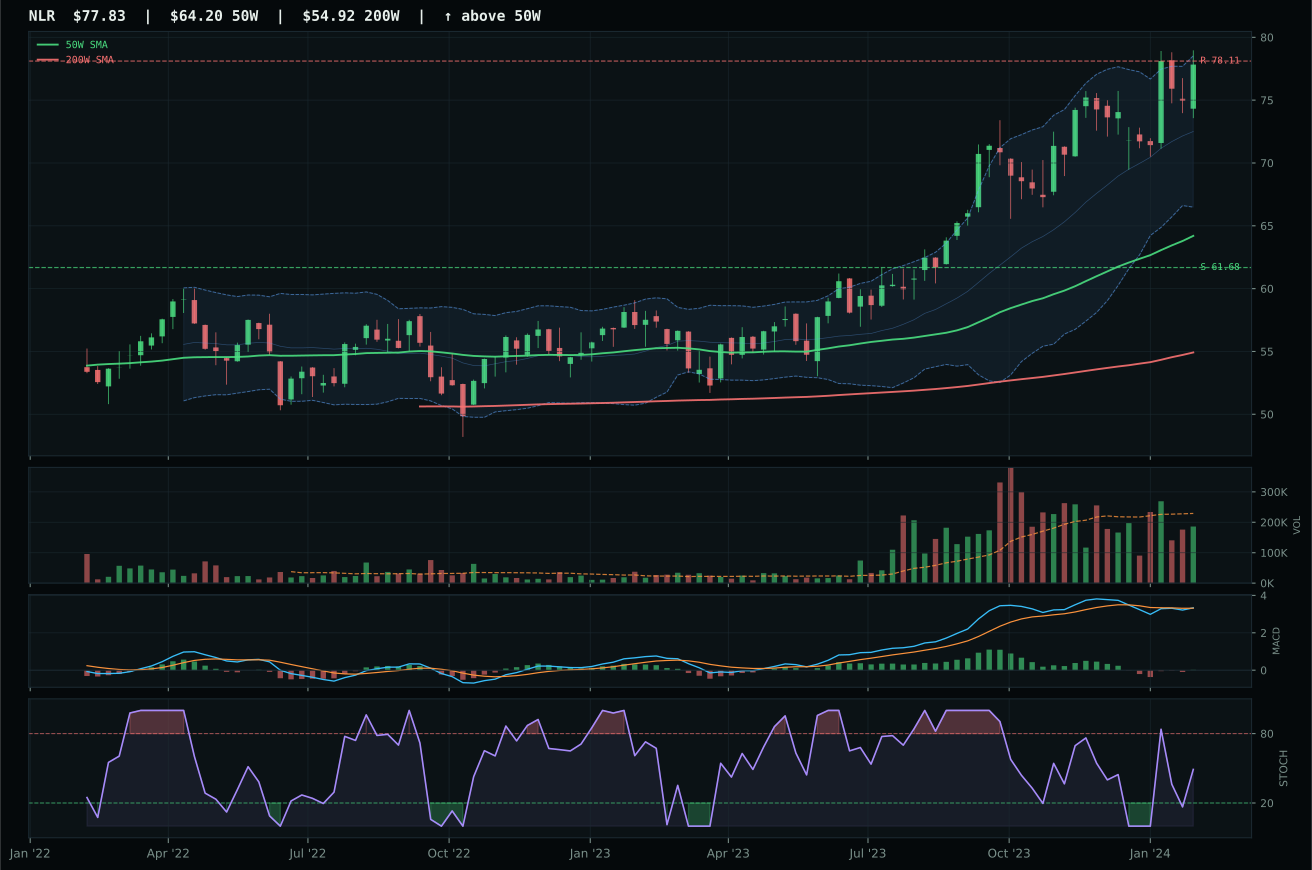
NLR has a vertical extension profile with -4.7% 13-week relative strength versus SPY.
A failed hold above support would weaken the setup.
Actionable but governed by invalidation levels.
URNM narrowly defeated URA by 0.6 points despite lower technical evidence scores (71.4 vs URA's 73.7) by capturing 7.8% category-relative strength versus URA's flat 0.0%, a crucial margin in a vertical-extension setup where peer differentiation matters most. Both names sit extended 45.1% and 45% respectively above their 50W moving averages, with bullish-improving MACD and falling-but-neutral stochastic RSI confirming that the uranium rally has not yet exhausted despite extreme positioning. URNM's 24.5% 13-week return and 10.8% SPY-relative strength proved stronger than URA's 16.7% and 3.0% respective readings, indicating that uranium mining corporates are receiving more aggressive accumulation than the ETF vehicle. URA's above-average volume participation suggested institutional rebalancing into the category rather than fresh alpha-seeking capital, whereas URNM's neutral volume at 1.07x marked pure momentum participation—in extended setups, momentum often lasts longer than rebalancing flows.
Nuclear Energy scored 55.8 and received the tier-2 allocation of 5%, placing it 4th in the allocation hierarchy after technology and AI but ahead of defense. The category's 43.0 macro fit was weak, burdened by credit stress (-5) and liquidity stress (-7), yet AI growth sponsorship (+5) and risk appetite positive (implied positive) provided modest tailwinds in an equity-friendly regime. URNM's 100.0% trend score and 100.0% momentum confirmation established it as one of the portfolio's purest momentum trades, profitable so long as positioning remains constructive and no exogenous shock kills risk appetite. At 5% allocation, the position sizes aggressively on the thesis that uranium supply scarcity will persist and that energy density concerns will drive policy support for nuclear buildout. However, URNM's 60.7% downside to support against 0.0% upside to resistance represents extreme extension risk; the allocation is a confidence bet, not a mean-reversion setup, and requires active position management to avoid catastrophic downside if positioning unwinds.
Defense & Aerospace — ITA
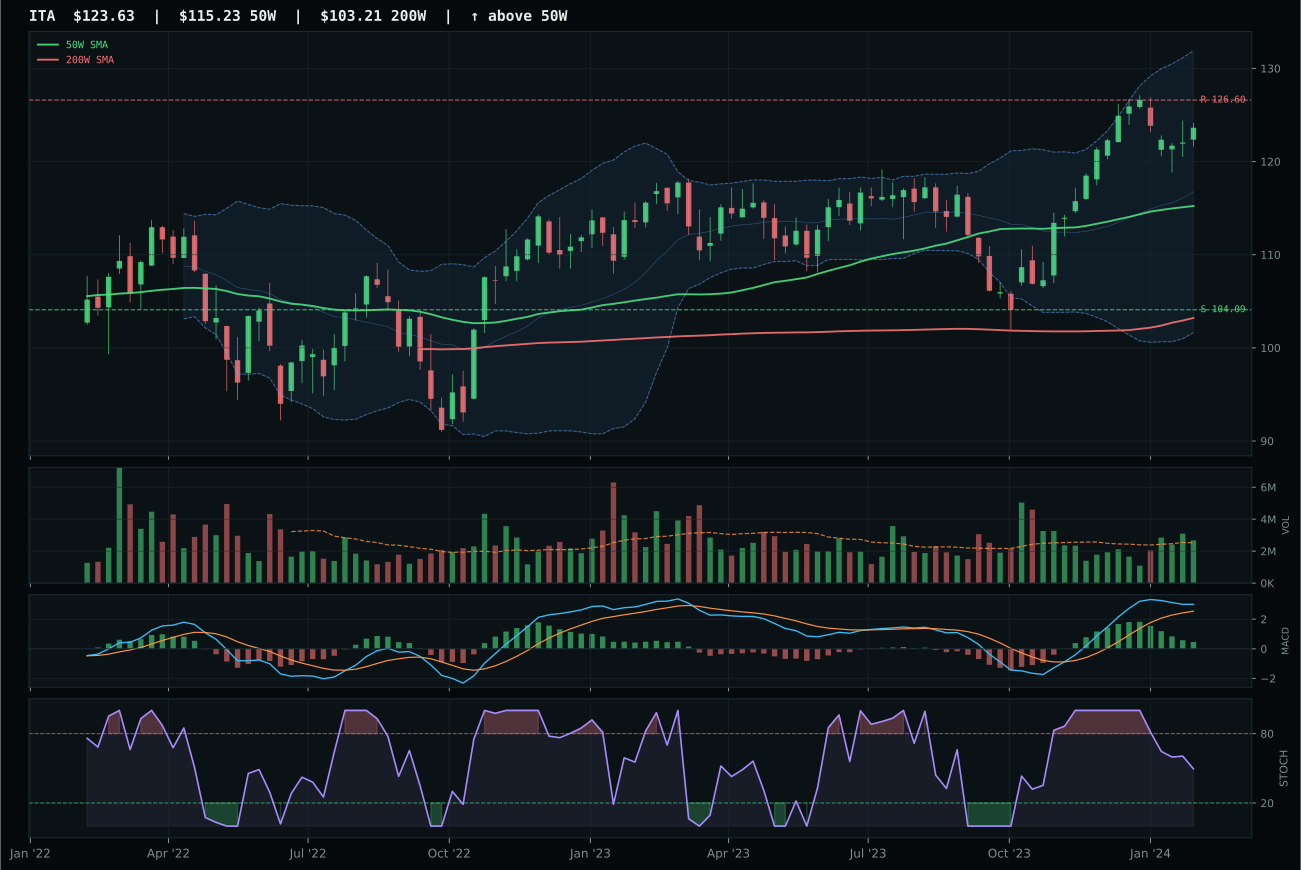
ITA has a neutral structure profile with -4.7% 13-week relative strength versus SPY.
A failed hold above support would weaken the setup.
Actionable but governed by invalidation levels.
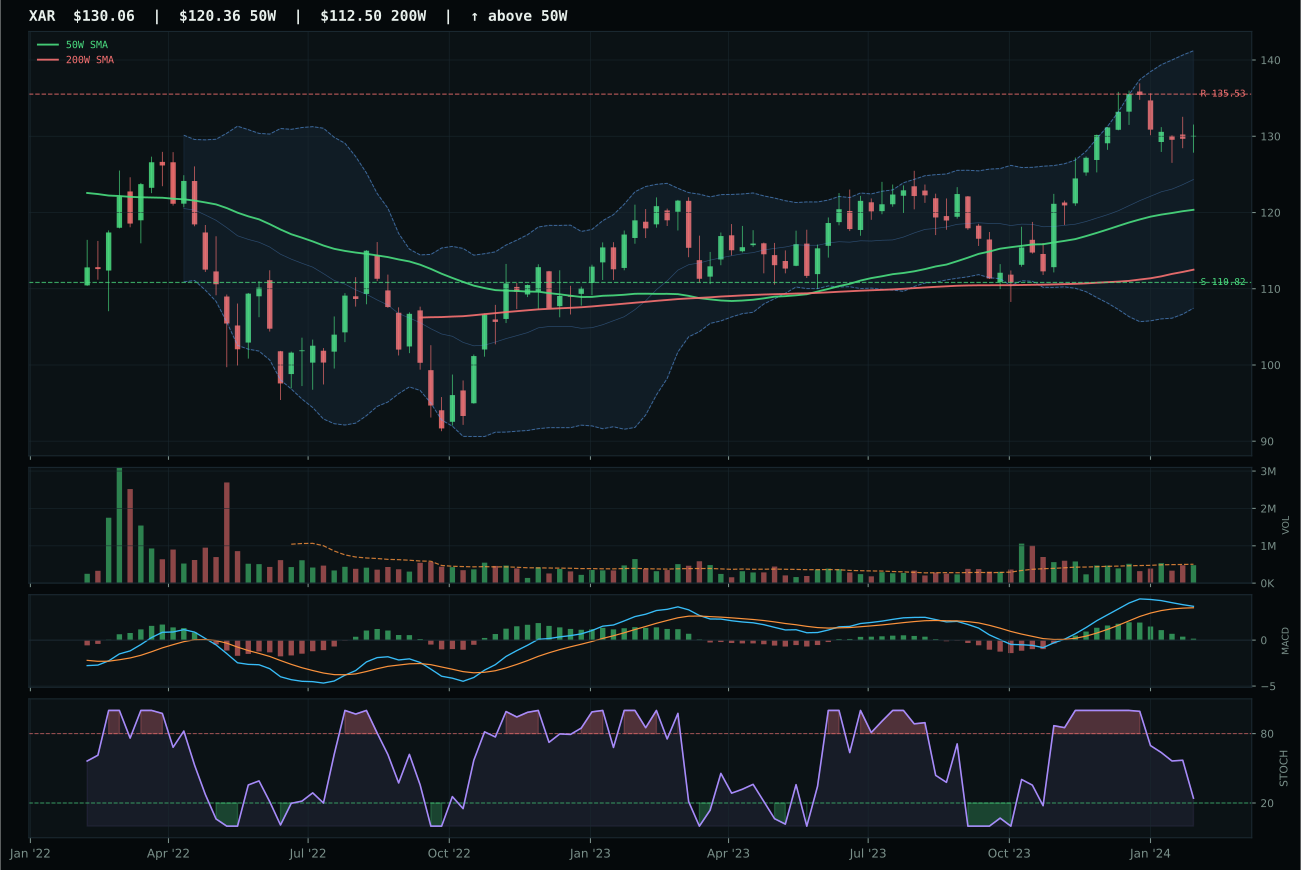
XAR has a neutral structure profile with -6.4% 13-week relative strength versus SPY.
A failed hold above support would weaken the setup.
Actionable but governed by invalidation levels.
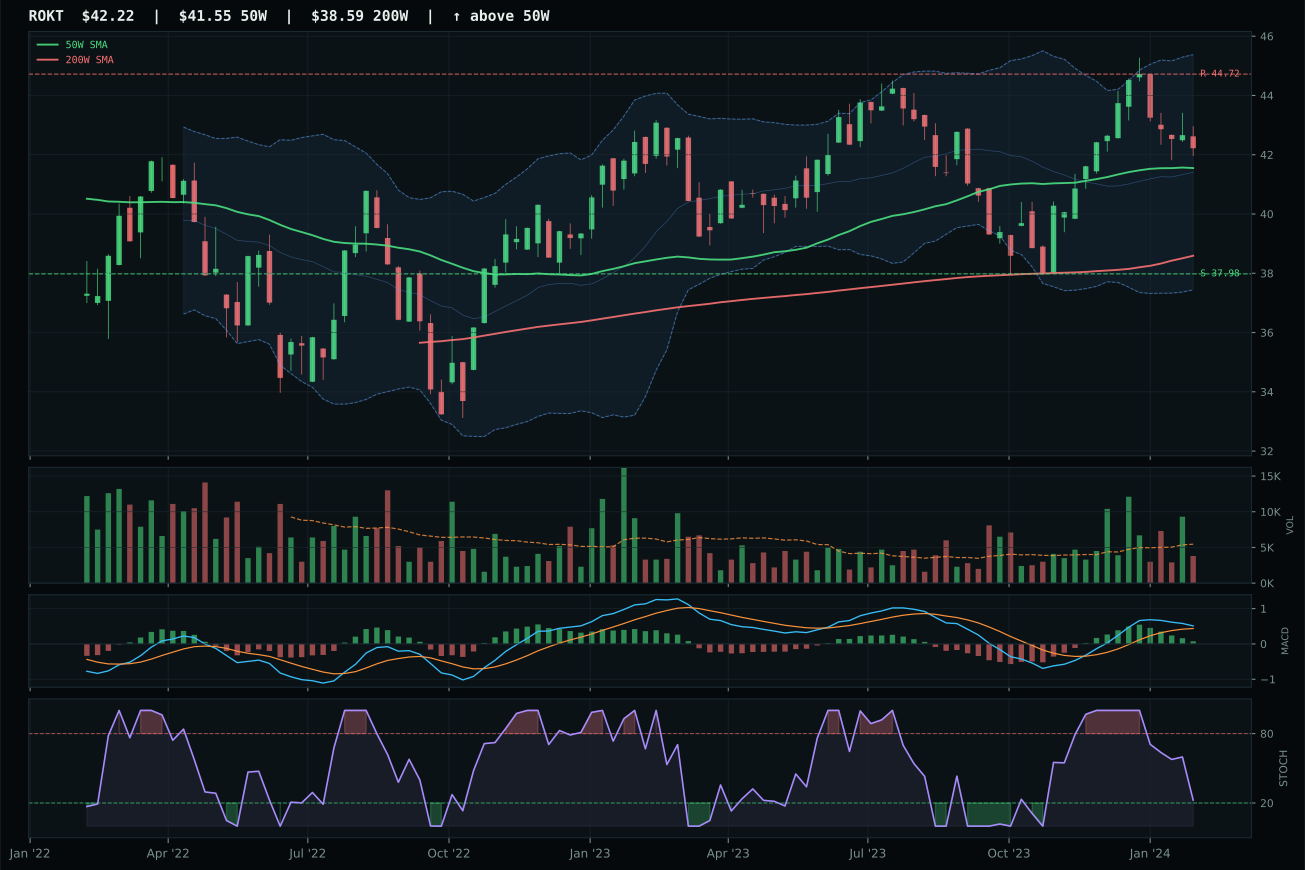
ROKT has a compression near 50W profile with -8.9% 13-week relative strength versus SPY.
A failed hold above support would weaken the setup.
Tracked, but not top-2 eligible because: .
ITA defeated XAR by 2.2 points despite lower momentum scores because it delivered cleaner structure (80.5 vs 77.3) and fractionally better category-relative strength (1.6% vs 0.0%), a small but decisive edge in a category where neither name achieved meaningful breadth. Price sits just 7.3% above the 50W with a near-flat 0.1% slope—this is not a breakout chase but rather a durable, disciplined uptrend with full 88.9% trend score backing from both moving average positions. MACD is bullish but flattening, stochastic RSI falling back to 0.50, and the risk/reward at 47.2 reflects the 18.8% downside to support balanced against flat upside to resistance. The 9.0% 13-week return and -4.7% SPY-relative weakness signal that defense has lagged the broad market, yet the category-median outperformance by 1.6% demonstrates that ITA is the least-damaged name when investors rotate into cyclical durable exposure.
Defense & Aerospace ranked 3rd among all categories at 48.8 points and earned the tier-2 allocation of 5% in the standard 20%/10%/5% sleeve structure. The category's macro fit of 51.0 revealed neutral-to-slightly-positive conditions: credit stress added 2 points, transition/mixed tailwinds contributed 3 points, but liquidity stress subtracted 4, creating a tense backdrop for capital-intensive, government-contract dependent business models. ITA's 65.6% technical evidence score reflected solid trend confirmation but weakness in momentum (59.2) and volume-price feedback (63.3), suggesting that defense holdings lack the sponsorship surge seen in AI or technology. The 5% position acknowledges that defense performs best in geopolitical risk-off regimes or when real rates normalize higher—neither is the current macro setup. Hold this sleeve as a trailing position that can scale if risk appetite falters or military expenditure becomes a policy tool in a disinflation shock.
Utilities & Infrastructure — PAVE
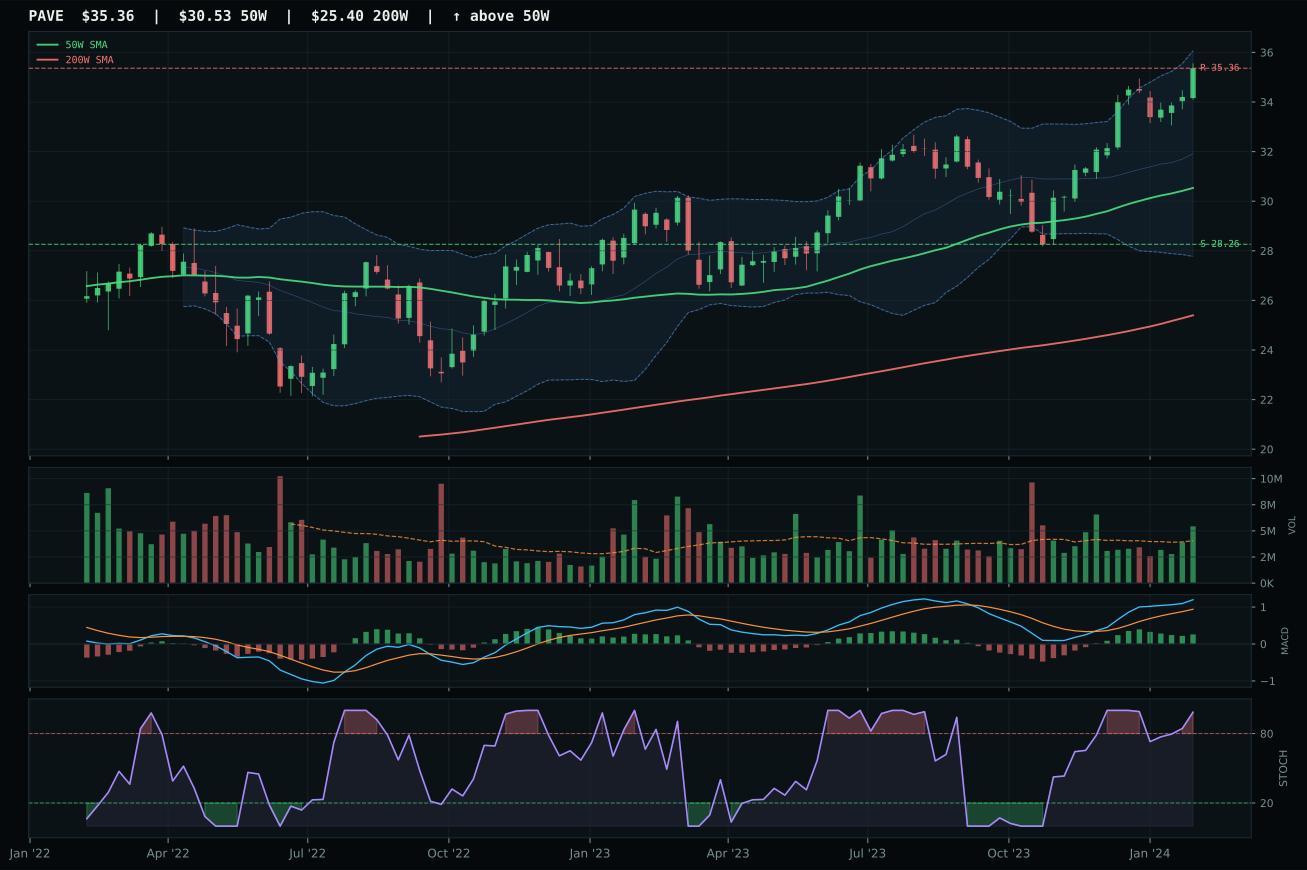
PAVE has a vertical extension profile with 3.6% 13-week relative strength versus SPY.
A failed hold above support would weaken the setup.
Actionable but governed by invalidation levels.
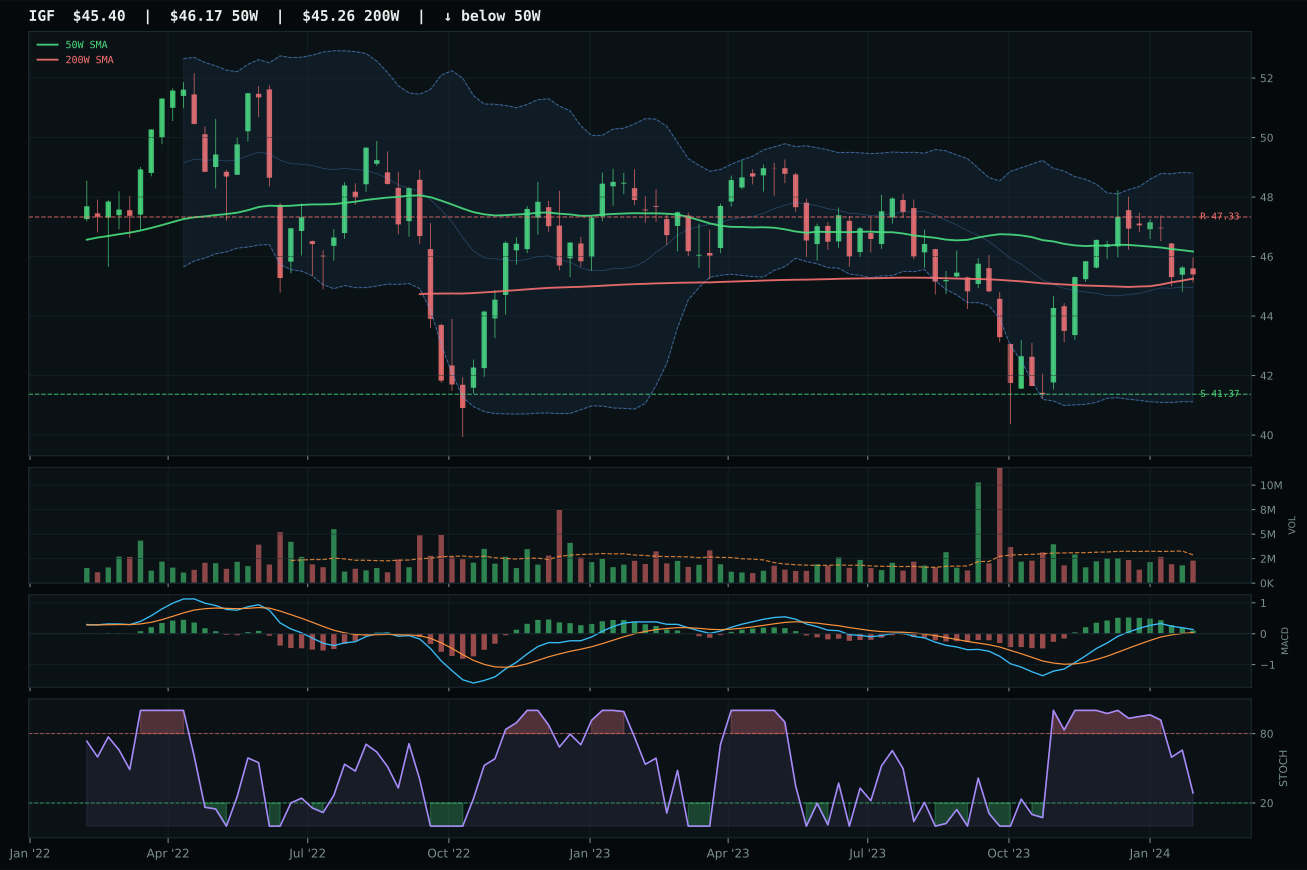
IGF has a compression near 50W profile with -11.2% 13-week relative strength versus SPY.
A failed hold above support would weaken the setup.
Actionable but governed by invalidation levels.
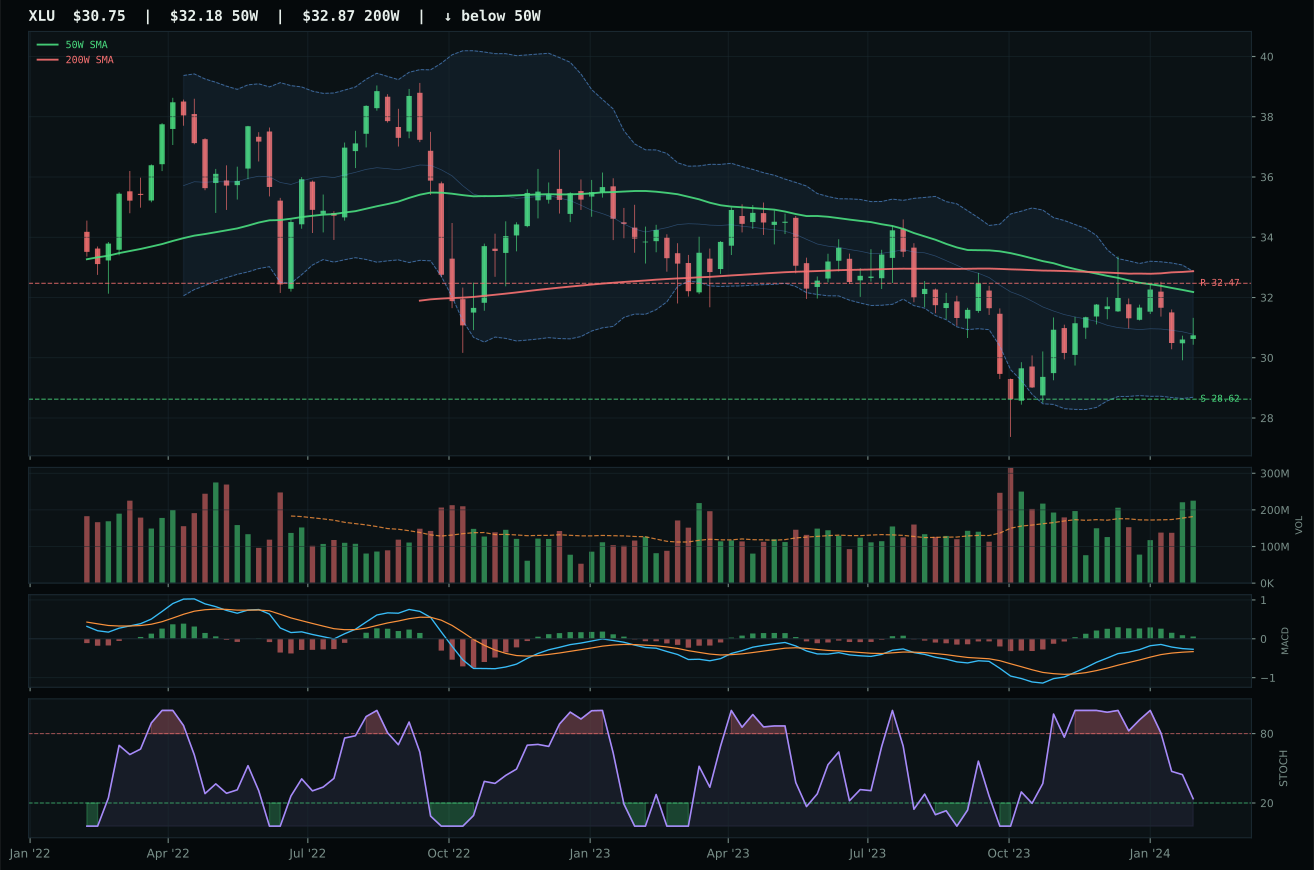
XLU has a neutral structure profile with -14.3% 13-week relative strength versus SPY.
Extension and support failure are the main tactical risks.
Tracked, but not top-2 eligible because: structurally broken.
PAVE defeated IGF and XLU by assembling the highest trend score (100.0), highest momentum confirmation (100.0), and strongest category-relative strength (14.8% versus IGF's 0.0%), establishing it as the unambiguous leadership position within the infrastructure sleeve. Price extended 15.8% above the 50W with a 0.4% slope—still advancing smoothly—while the 17.3% 13-week return and 3.6% SPY-relative strength confirmed that infrastructure capital expenditure cycles are outpacing broader equity appreciation. PAVE's above-average volume at 1.34x and overbought stochastic RSI at 0.98 indicated synchronized retail and institutional accumulation into the capex thesis, versus IGF's compression near the 50W and thin participation that marked passive index rebalancing. The 85.4% structure score (cleanliness 83.3, compression 84.9) provided the cleanest technical vehicle, while IGF's 75.3 structure revealed a looser, less conviction-driven setup.
Utilities & Infrastructure scored 44.7 and received the tier-2 allocation of 5%, placing it 6th in the final ranking despite respectable technical credentials. The category's 62.0 macro fit was the portfolio's strongest, driven by disinflation pressure helping the exposure (+7), transition/mixed tailwinds (+4), and disinflation fundamentals (+6), creating a 17-point macro tailwind offset by modest liquidity stress (-3) and risk appetite negative (-2). In a disinflation environment, utility and infrastructure yields become more attractive in real terms as nominal bond yields compress, while the capex cycle remains durable because government policy supports spending regardless of growth outlook. PAVE's 100.0 momentum confirmation and 83.1 persistence score established it as the highest-quality infrastructure proxy, though the 15.8% extension and zero upside to resistance warned of crowded positioning. At 5% allocation, the position captures the macro-technical sweet spot where disinflation tailwinds and government capex support justify owning domestic infrastructure, but the extension signals that a tactical pullback could offer better entry for aggressive risking.
Precious Metals — GLD
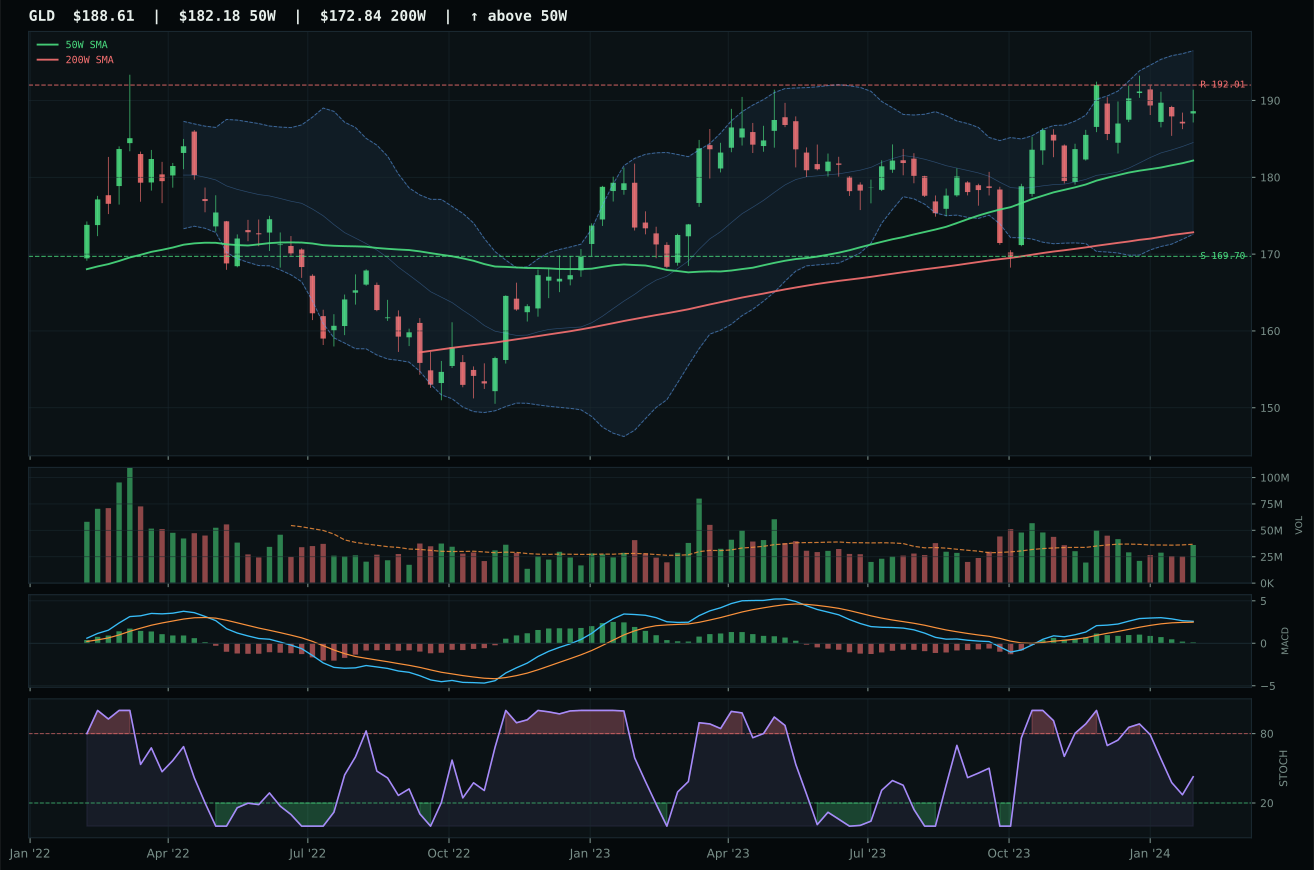
GLD has a neutral structure profile with -11.7% 13-week relative strength versus SPY.
A failed hold above support would weaken the setup.
Actionable but governed by invalidation levels.
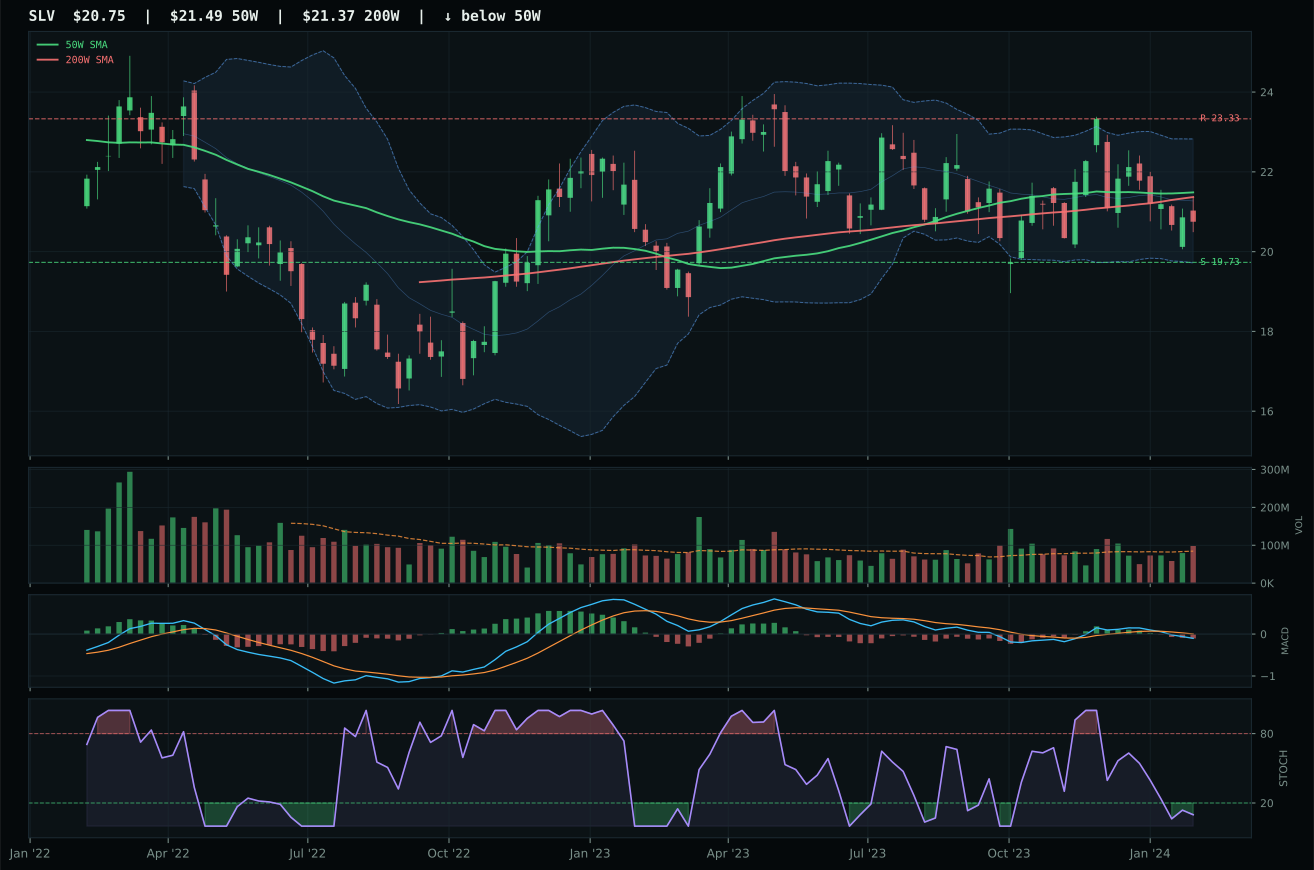
SLV has a neutral structure profile with -15.9% 13-week relative strength versus SPY.
A failed hold above support would weaken the setup.
Actionable but governed by invalidation levels.
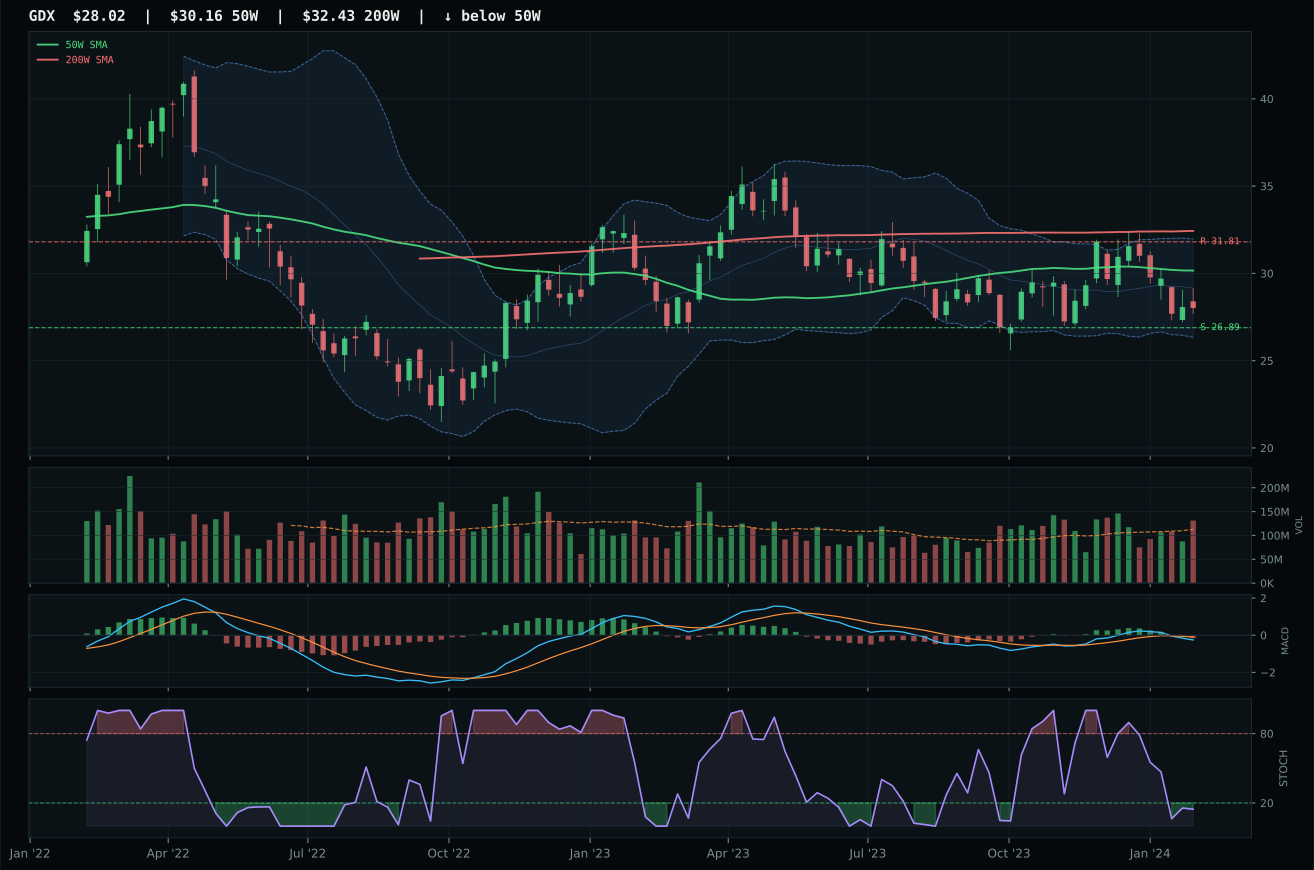
GDX has a pullback into support profile with -18.6% 13-week relative strength versus SPY.
Extension and support failure are the main tactical risks.
Tracked, but not top-2 eligible because: structurally broken.
GLD emerged as the least-impaired precious metals choice by virtue of cleaner structure (78.3 vs SLV's 72.6) and superior MACD trajectory—bullish but flattening versus SLV's bearish/weakening—despite a soft 2.1% 13-week return that trails disinflation-benefiting peers. Price at 3.5% above the 50W is nearly flush against trend reference, offering minimal extension risk, while category-relative strength of 4.3% positioned GLD as the marginal holder gaining slight inflows. SLV's oversold stochastic RSI and distribution-pressure volume profile suggested capitulation selling rather than strategic accumulation, disqualifying it despite the metals scarcity macro tailwind (+7 boost). GLD's 81.0% trend score and 85.0% timing score established it as the most disciplined entry point, though momentum confirmation at just 44.8 reflects gold's muted 4W return of -0.4%, signaling that monetary hedge buying has plateaued.
Precious Metals scored 33.0 and received the tier-2 allocation of 5%, placing it 5th among all categories in the allocation hierarchy. Category-level macro fit of 60.0 provided a genuine tailwind: disinflation pressure scored +8 points and disinflation helped the exposure +7 additional points, reflecting the market's perception of gold as the ultimate duration hedge in a disinflationary cycle. Risk appetite positive subtracted 4 points, implying that if equity risk appetites surge, gold faces selling pressure; this tension was visible in GLD's modest 2.1% 13-week return despite a -11.7% SPY-relative weakness that should have driven money into the metal. At 5% allocation, the position is defensive ballast that pays off in macro shocks or surprise policy shifts toward negative real rates. The allocation signals conviction that disinflation will persist and that equity volatility will require a non-correlated ballast; however, GLD's weak momentum confirmation and SLV's clear distribution warn that even this macro tailwind is not generating aggressive new buying.
Agriculture & Livestock — MOO
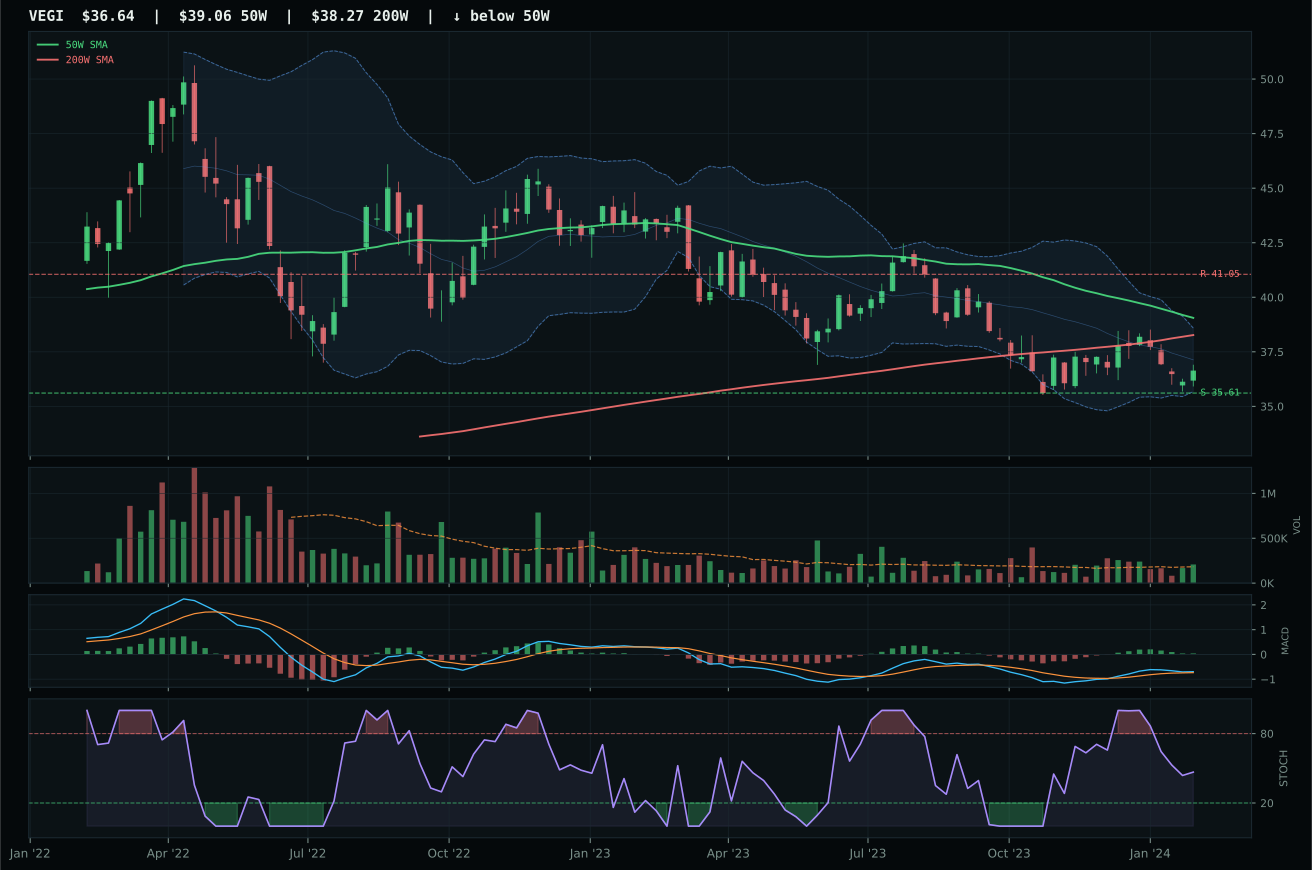
VEGI has a pullback into support profile with -15.3% 13-week relative strength versus SPY.
A failed hold above support would weaken the setup.
Tracked, but not top-2 eligible because: .
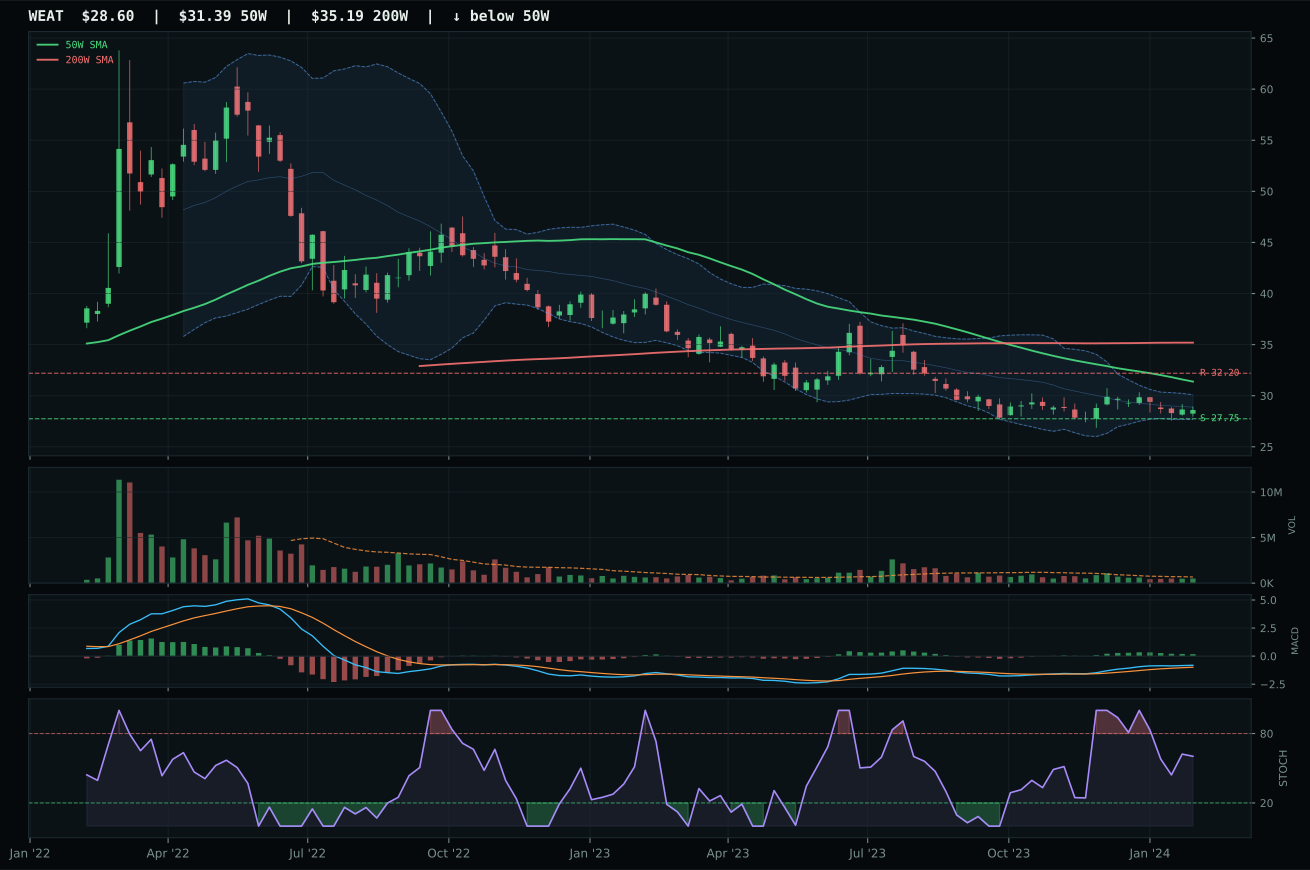
WEAT has a pullback into support profile with -14.6% 13-week relative strength versus SPY.
Extension and support failure are the main tactical risks.
Tracked, but not top-2 eligible because: structurally broken.
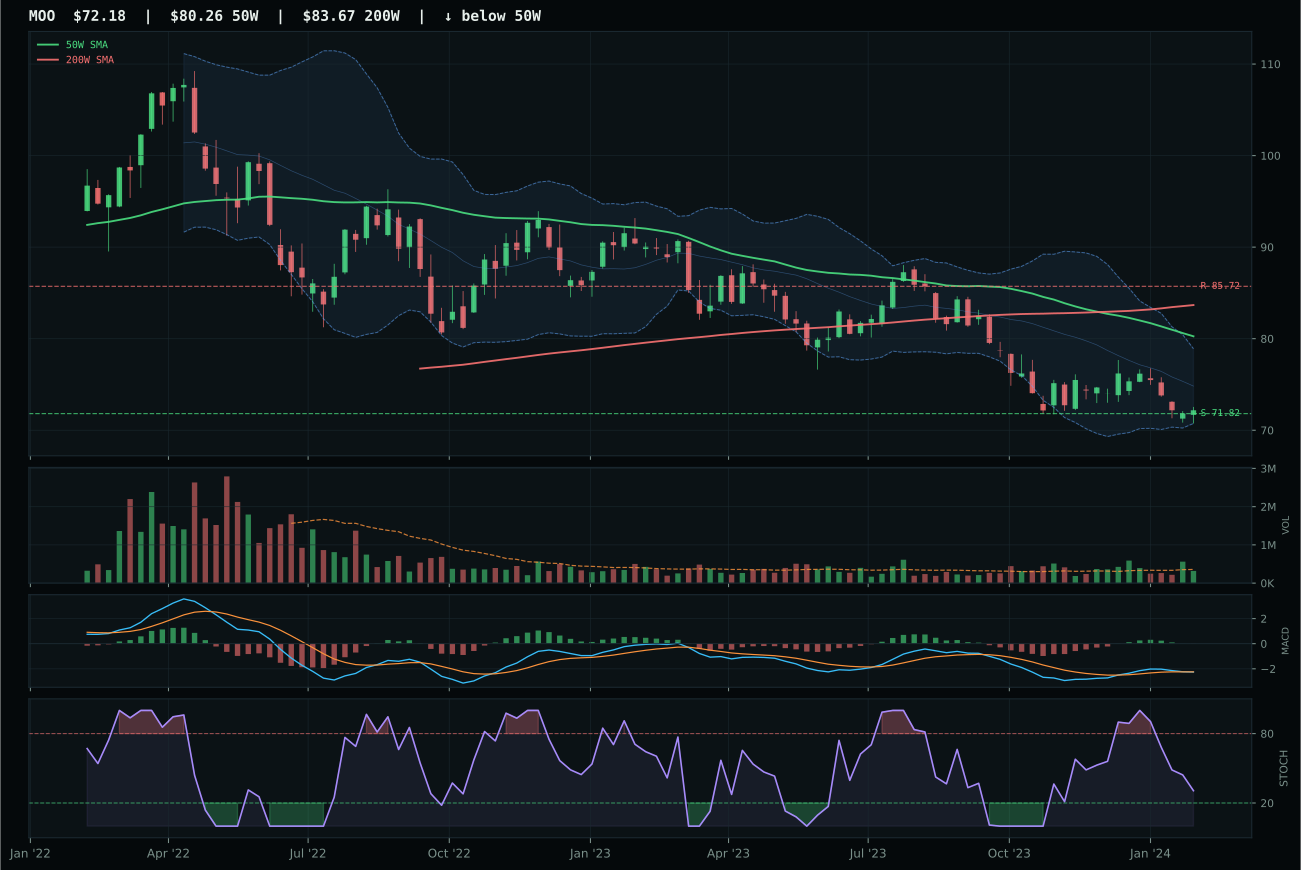
MOO has a pullback into support profile with -17.7% 13-week relative strength versus SPY.
Extension and support failure are the main tactical risks.
Tracked, but not top-2 eligible because: structurally broken.
MOO won the Agriculture category only by default: all three names failed eligibility tests, rendering the entire category ineligible for top-2 consideration and dropping it to zero allocation. MOO's 0.0 momentum confirmation score and bearish/weakening MACD exposed the harsh technical reality—price is 10.1% below the 50W, MACD is deteriorating, stochastic RSI sits at 0.31 falling, and the 13-week return of -3.9% with -17.7% SPY-relative weakness reveals wholesale rotation out of agribusiness. Yet MOO posted 90.0% risk/reward because the downside to support of just 0.5% creates an extreme asymmetry: any bounce from the 71.82 support level would reverse -3% to -5%, but failure breaks to new lows. VEGI scored 45.0 on technical evidence versus MOO's 0.0, but VEGI's above-average volume participation signaled distribution pressure rather than accumulation, disqualifying it as the representative despite better fundamentals.
Agriculture & Livestock scored 0.0 and received zero allocation this week, ranking as ineligible across all three ETFs due to failed macro-technical synthesis. The category-level macro fit of 32.0 was poisoned by disinflation pressure (-8 points, the largest single drag), liquidity stress (-4), and the structural headwind that commodity prices compress under disinflation while input costs remain sticky. The 3/2/1 weighted ETF basket began at 36.9 but the category reasoner rejected all three names because persistence and volume-price confirmation scores fell below acceptance thresholds—no basket member showed sustained accumulation into a weakening trend. MOO's -3.9% 13-week return and -17.7% SPY relative weakness were catastrophic relative to the broad equity market. This category will not re-enter the allocation until either a 50W crossback occurs with volume confirmation, or macro descriptors shift to inflationary pressure; in a disinflation regime, commodity agriculture is structurally uncompetitive against technology and healthcare.
Traditional Energy — XLE
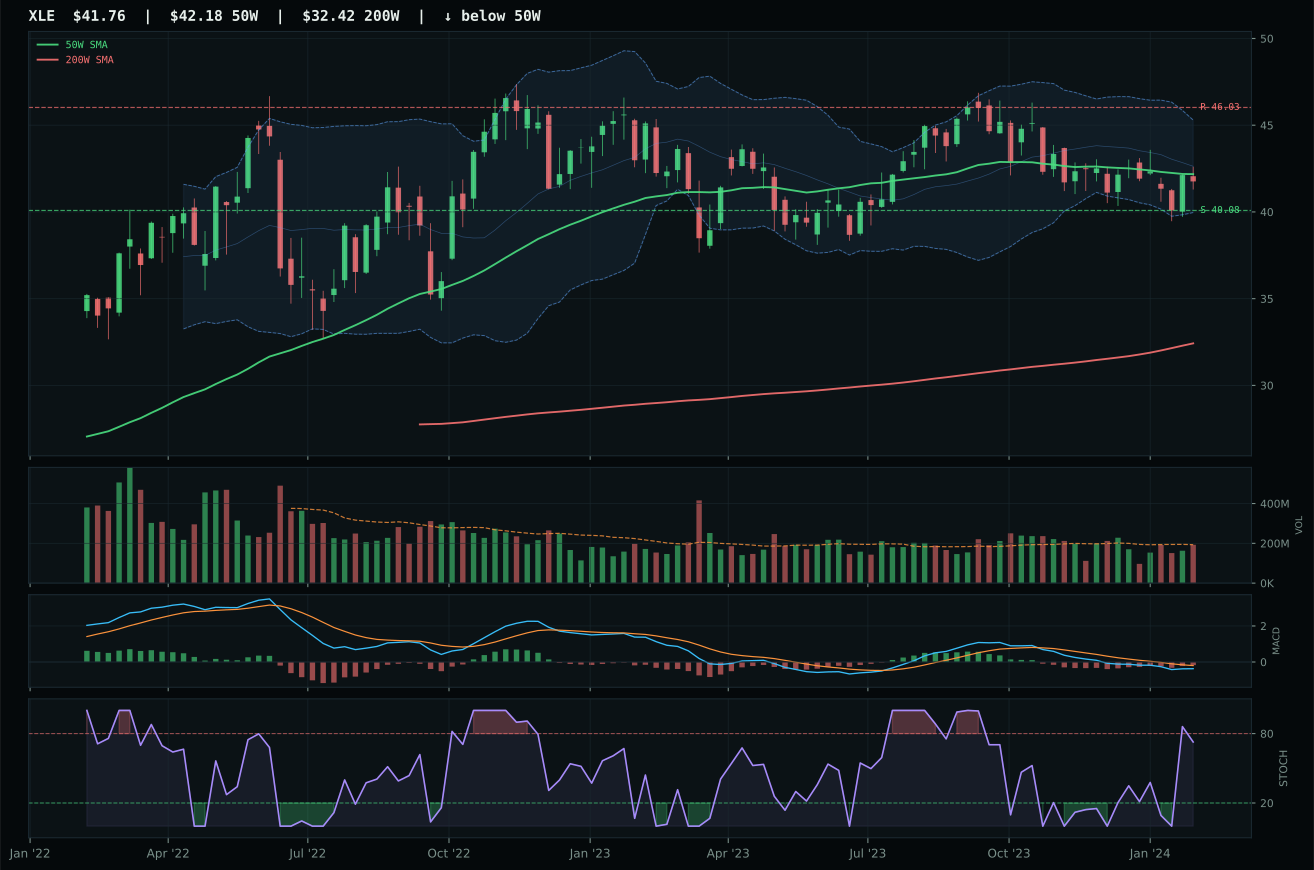
XLE has a pullback into support profile with -17.4% 13-week relative strength versus SPY.
A failed hold above support would weaken the setup.
Actionable but governed by invalidation levels.
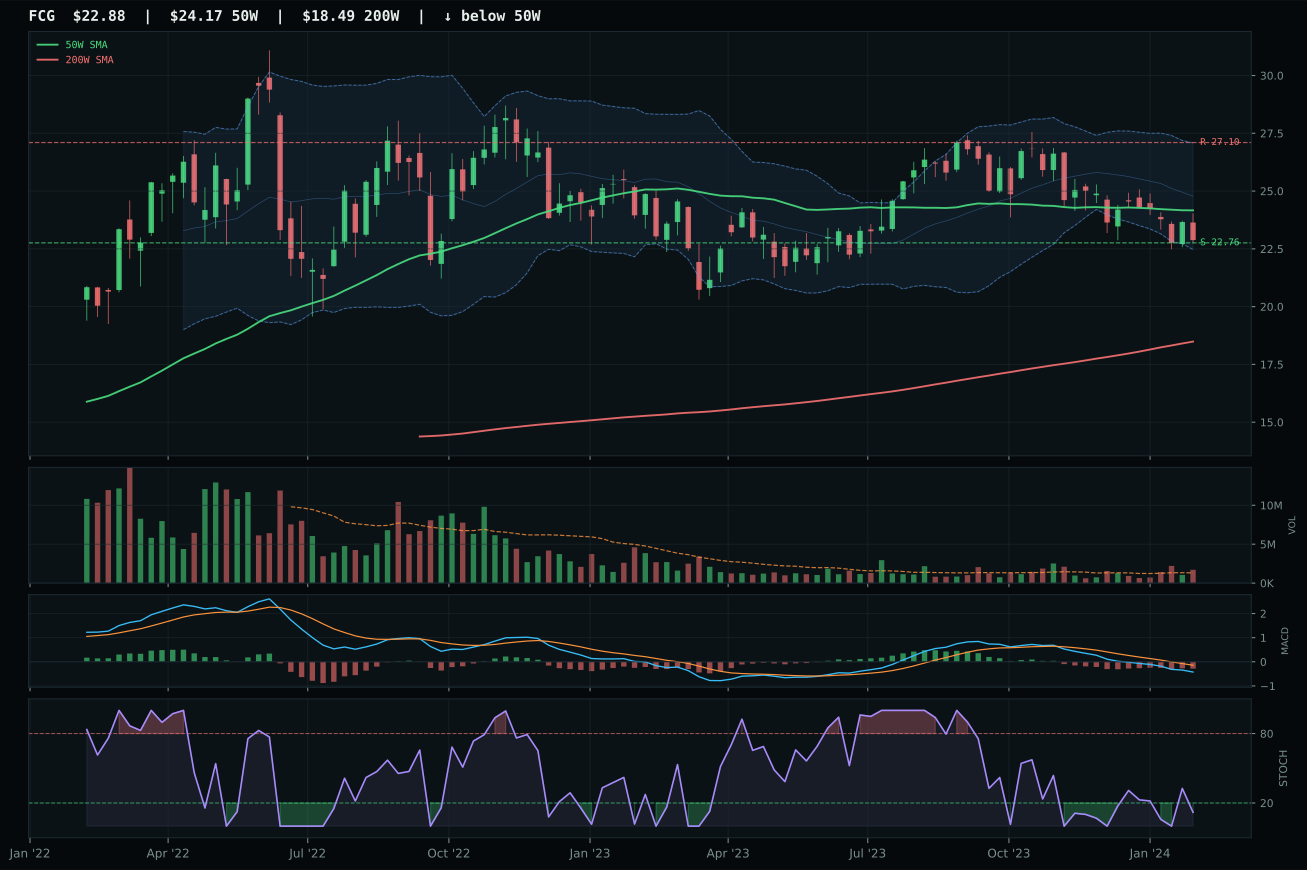
FCG has a pullback into support profile with -27.8% 13-week relative strength versus SPY.
A failed hold above support would weaken the setup.
Actionable but governed by invalidation levels.
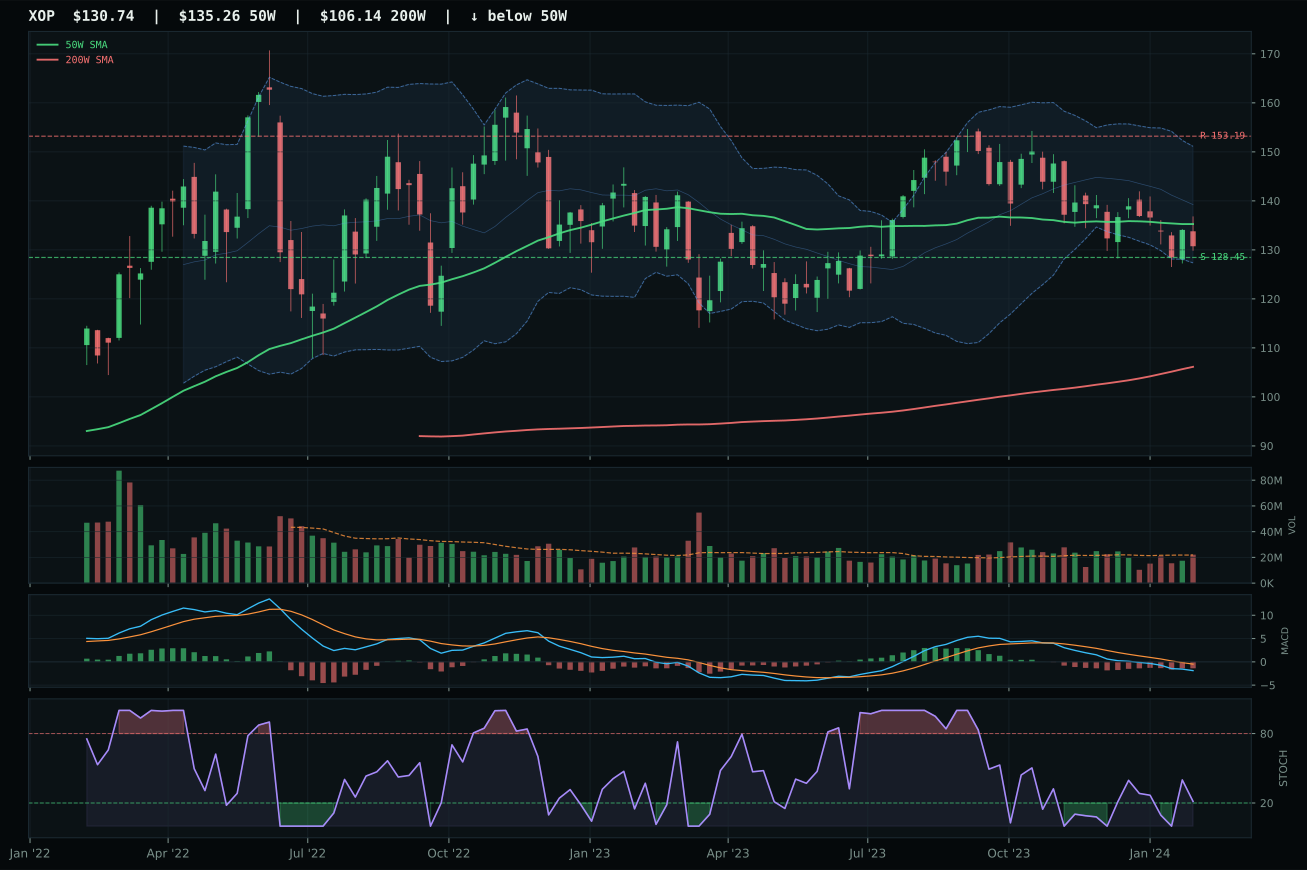
XOP has a pullback into support profile with -25.2% 13-week relative strength versus SPY.
A failed hold above support would weaken the setup.
Actionable but governed by invalidation levels.
XLE won the energy category with a razor-thin margin over XOP and FCG by offering the best timing setup and category-relative strength edge despite all three sitting deep in downtrends with negative momentum. Price pulled to just 1.0% below the 50W near the Fibonacci 0.500 decision zone, with stochastic RSI rising mid-zone at 0.73 and MACD bearish but improving—this is the textbook exhaustion setup where the bearish pressure is losing force without yet confirming reversal. XLE's 100.0% timing score captured the setup's proximity to trend reference, while the 92.9% risk/reward (9.3% downside, 4.2% upside) offered the most defined return asymmetry for mean-reversion exposure. XLE's 7.8% category-relative strength broke a tie that FCG's better risk/reward (98.0) could not overcome, as FCG's -27.8% SPY relative weakness and bearish/weakening MACD confirmed deeper structural damage.
Traditional Energy scored 0.0 and received zero allocation this week, representing a complete exclusion despite XLE's respectable technical setup. The category's macro fit of 16.0 was devastated by disinflation pressure (-10 points), credit stress (-7), and liquidity stress (-7), creating a 24-point headwind that no technical bounce could overcome. Disinflation explicitly hurts energy exposure by depressing global demand, lowering nominally-priced futures, and raising real discount rates for perpetual cash flow streams—the perfect macro storm for integrated energy equities. XLE's -17.4% SPY-relative weakness and -3.6% 13-week return confirmed that even respectable technical setups in energy are being shorted into any relief bounce, indicating that institutional capital has rotated away permanently until either geopolitical risk spikes or inflation re-accelerates. The 5% allocation slot that would normally capture a mean-reversion candidate is held by growth and defense names; energy requires a macro regime shift to earn capital.
Industrial Metals — COPX
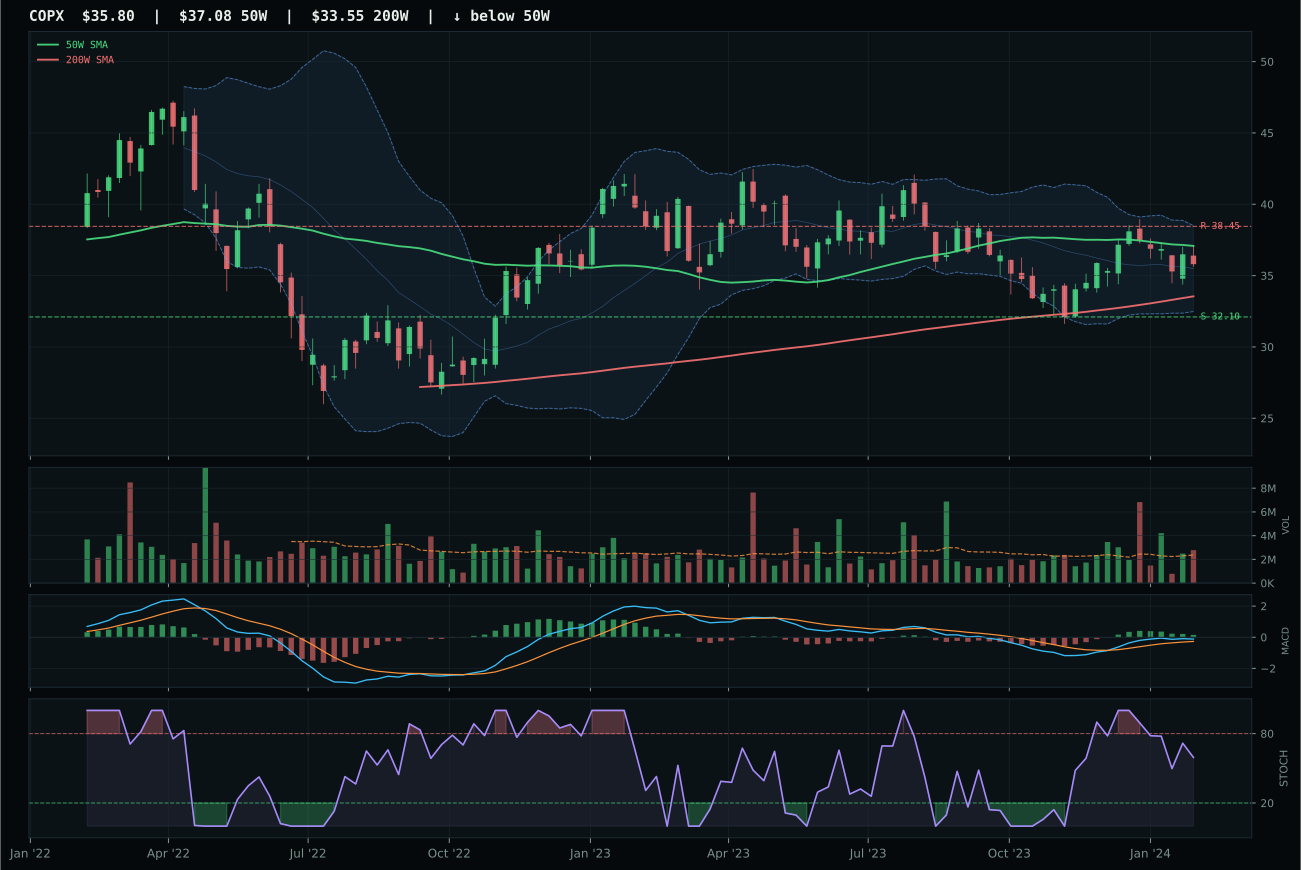
COPX has a neutral structure profile with -8.6% 13-week relative strength versus SPY.
A failed hold above support would weaken the setup.
Actionable but governed by invalidation levels.
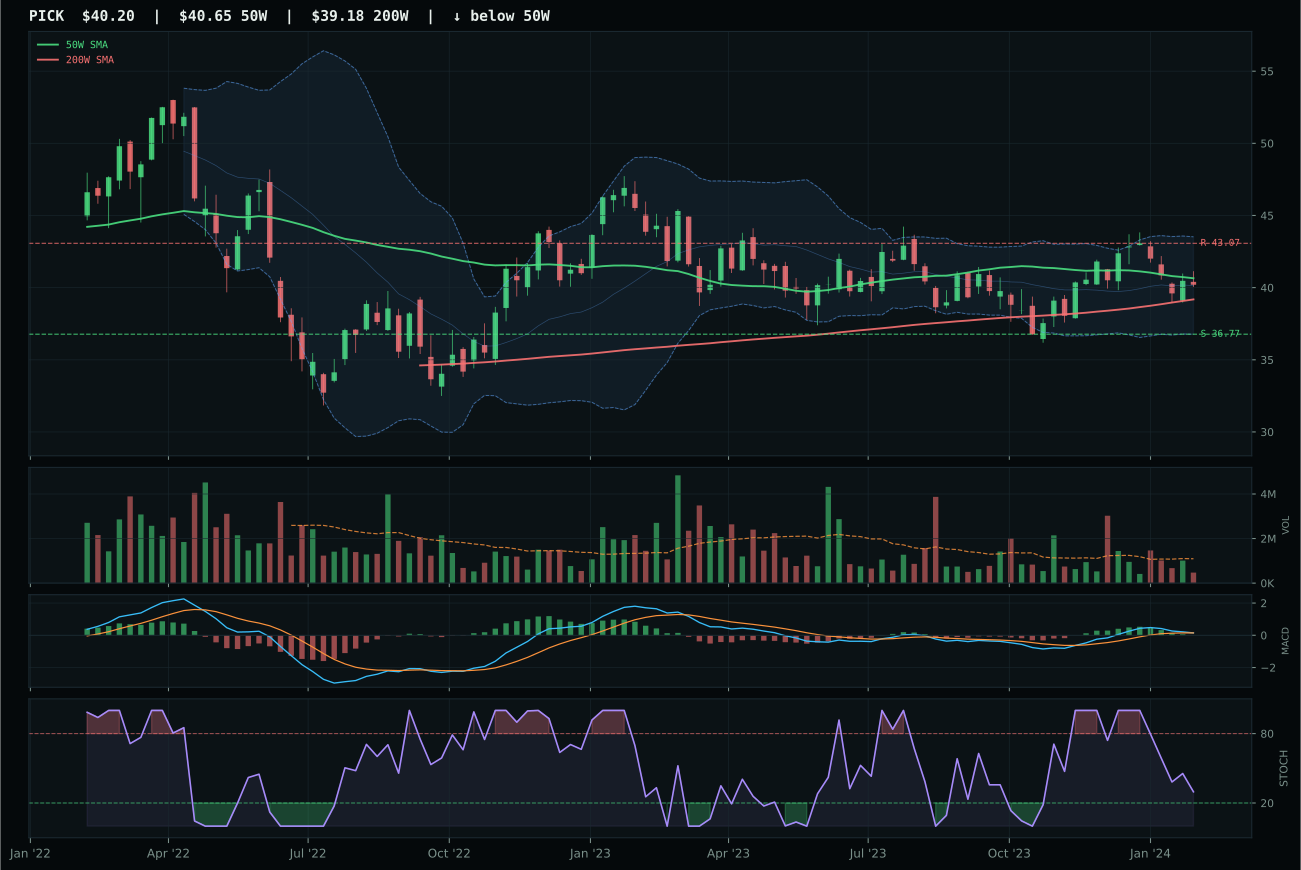
PICK has a compression near 50W profile with -10.9% 13-week relative strength versus SPY.
A failed hold above support would weaken the setup.
Actionable but governed by invalidation levels.
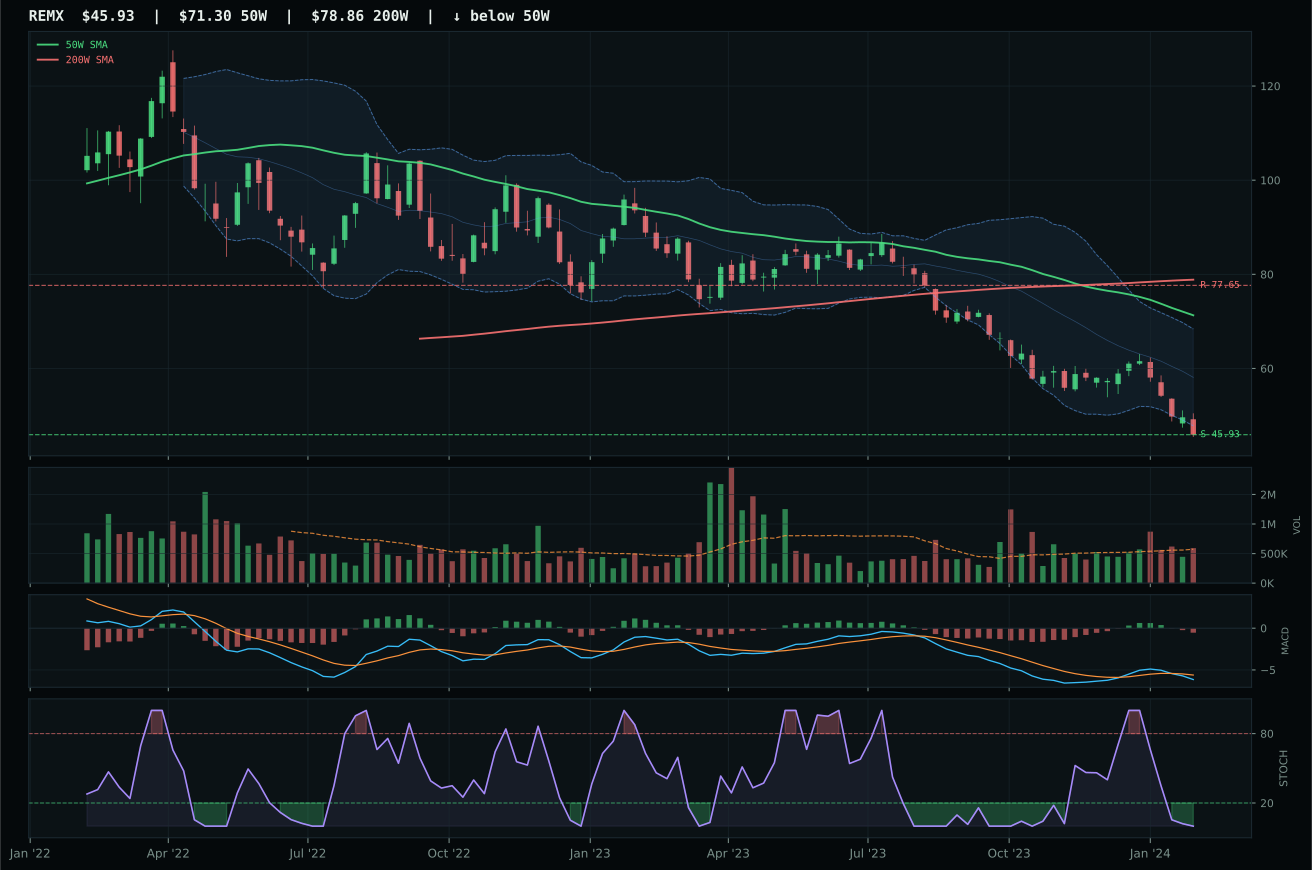
REMX has a pullback into support profile with -36.5% 13-week relative strength versus SPY.
Extension and support failure are the main tactical risks.
Tracked, but not top-2 eligible because: structurally broken.
COPX defeated PICK because it sustained bullish MACD (bullish but flattening) versus PICK's bearish/weakening, and captured 2.4% category-relative strength versus PICK's flat 0.0%, despite both sitting in pullback-into-support setups with modest 5.2% and 2.8% 13-week returns respectively. Price 3.5% below the 50W on above-average volume (1.17x) suggested accumulation into a reset—the Fibonacci 0.618 decision zone at 35.77 and 11.5% downside to support gave COPX a defined risk floor for mean-reversion traders. PICK's compression near the 50W and thin participation volume (24% relative strength, 0.0% category advantage) indicated passive de-risking rather than active buying. COPX's timing score of 92.0 was exceptional, reflecting proximity to the 50W and a stochastic RSI falling-but-not-oversold profile at 0.59—the setup offered a low-risk entry for patients traders willing to wait for a 50W retest.
Industrial Metals scored 25.0 and received zero allocation, placing it 9th in the final ranking outside the portfolio this week. The category's technical evidence was middling (55.4% for COPX), and macro fit of 49.0 combined disinflation headwinds with strong metals scarcity tailwinds (+14 points), creating internal conflict that the reasoner resolved in favor of exclusion. Liquidity stress (-8) and credit stress (-7) subtracted 15 points from macro support, and COPX's -8.6% SPY-relative weakness signaled that the broader market was indifferent to copper supply dynamics. The allocation would require either a 50W breakback with volume confirmation or an active inflation re-acceleration signal to earn inclusion; in the current disinflation regime, risk appetite positive is pulling money away from hard assets. COPX's above-average volume participation provided a glimmer of hope—accumulation is occurring—but it was insufficient to overcome the macro headwind and move the category into the tier-2 5% sleeve.
Emerging Markets — INDA
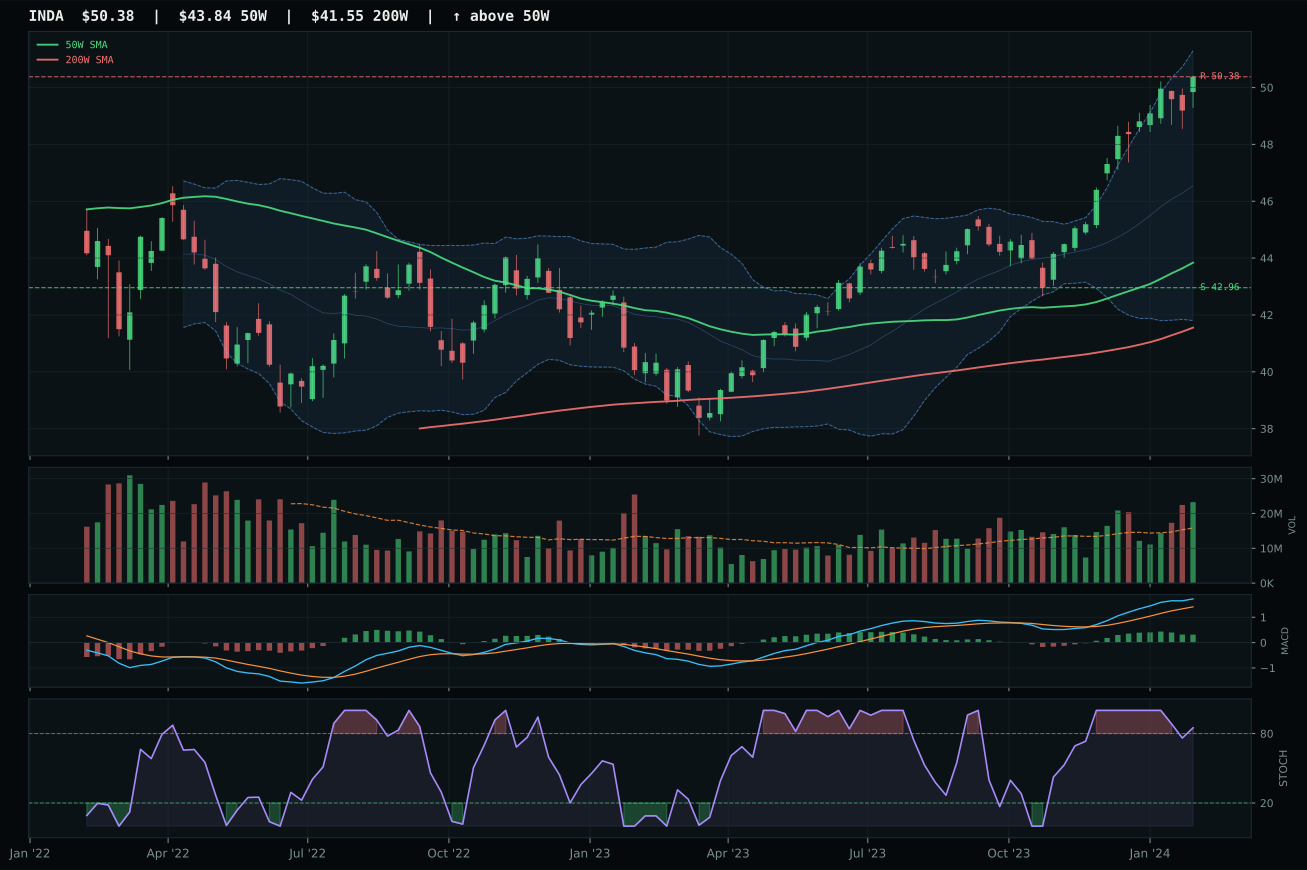
INDA has a neutral structure profile with 0.4% 13-week relative strength versus SPY.
A failed hold above support would weaken the setup.
Actionable but governed by invalidation levels.
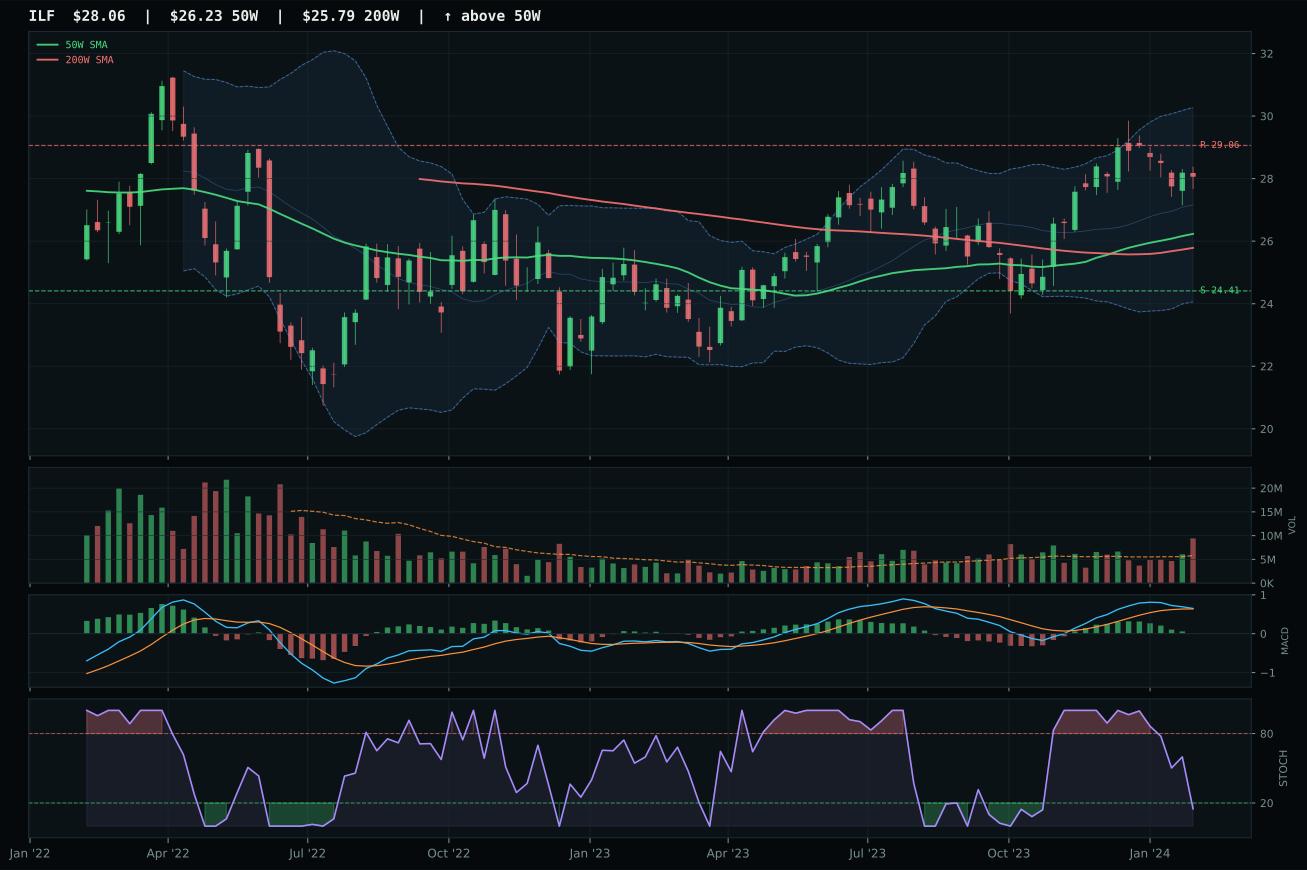
ILF has a neutral structure profile with -8.1% 13-week relative strength versus SPY.
A failed hold above support would weaken the setup.
Actionable but governed by invalidation levels.
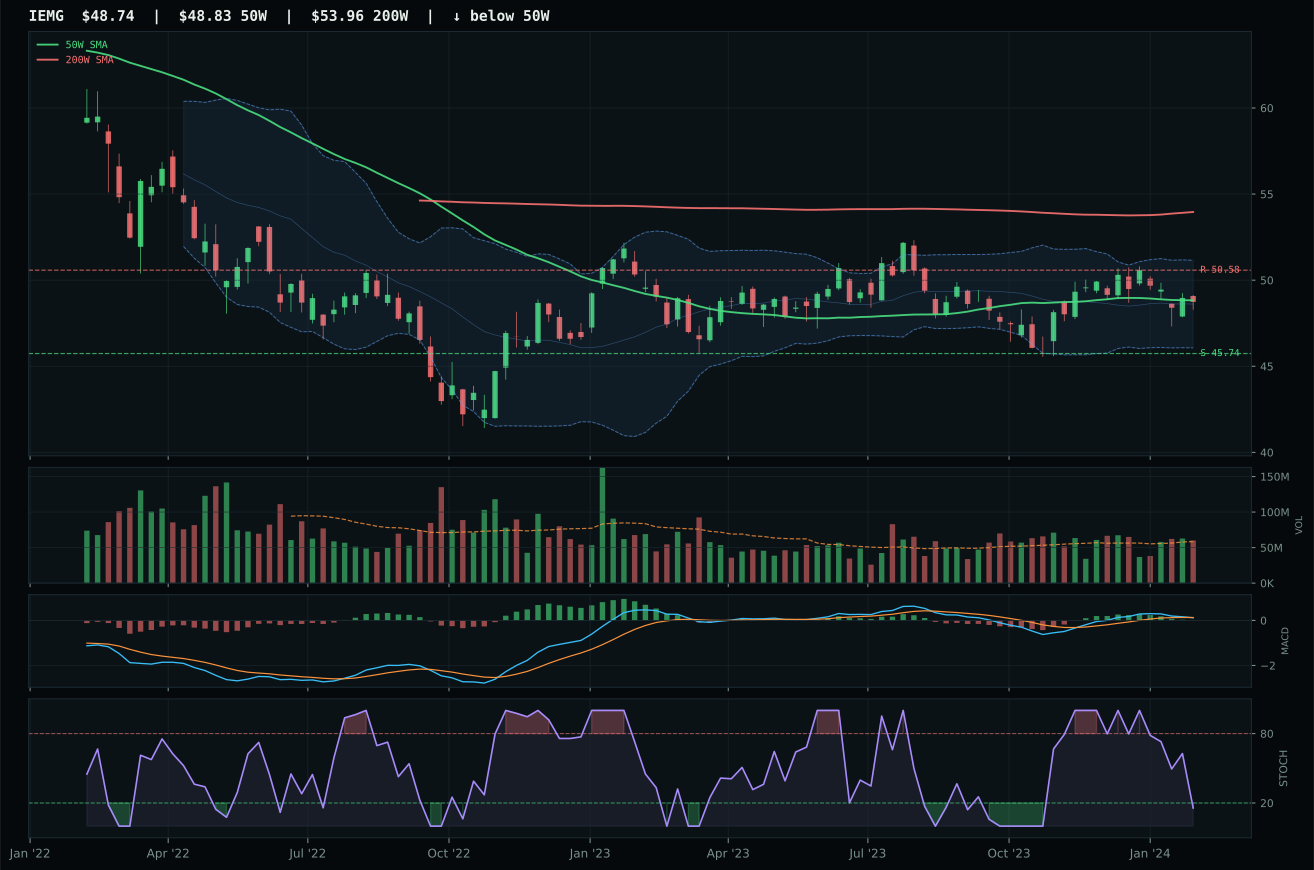
IEMG has a compression near 50W profile with -12.5% 13-week relative strength versus SPY.
Extension and support failure are the main tactical risks.
Tracked, but not top-2 eligible because: structurally broken.
INDA triumphed over ILF and IEMG by posting the highest technical evidence score (68.0) and the strongest category-relative strength at 8.5% versus ILF's flat 0.0%, translating India's quality growth narrative into measurable peer outperformance. The 14.1% 13-week return and neutral 0.4% SPY-relative strength placed INDA in the optimal window—strong enough to confirm internal momentum without lagging broader equities so badly that the position looks broken. Price at 14.9% above the 50W triggered the timing penalty, yet the 86.3% structure score (cleanest of all peer categories) and 83.8% momentum confirmation revealed that INDA's extension is being built on broad participation rather than narrow technical positioning. ILF's distribution-pressure volume and oversold stochastic RSI signaled institutional de-risking, while IEMG's compression setup and bearish/weakening MACD confirmed the basket was rotating away from generic emerging exposure toward India-specific quality.
Emerging Markets scored 13.0 and received zero allocation, ranking 10th and ineligible despite INDA's respectable 68.0 technical score. The category-level macro fit of 38.0 was crushed by credit stress (-10) and liquidity stress (-10)—a 20-point macro deficit—which overwhelmed the modest risk appetite positive contribution of +8. In a disinflation regime with credit stress active, emerging market currencies tend to weaken against the dollar, reducing local-currency returns in dollar-denominated portfolios, while liquidity stress causes foreign capital flows to reverse toward home markets. INDA's above-average volume participation at 1.47x the 20W average and 14.9% extension above the 50W were red flags for late-stage positioning rather than institutional commitment; the overbought stochastic RSI rolling over at 0.85 suggested that short-term sentiment was peaked. The allocation slot is held by technology and AI, which offer superior risk/reward in a dollar-strong, credit-stressed environment where domestic growth is more defensible than emerging market multiple expansion.