
2024-01-26
Informational purposes only. The content in this report, including allocations, analysis, and commentary, is provided solely for informational and educational purposes. It does not constitute financial advice, investment advice, trading advice, or any other type of advice. Past performance does not guarantee future results. Always conduct your own research and consult a qualified financial professional before making investment decisions.
Weekly Allocation
| Ticker | Category | Weight | Role |
|---|---|---|---|
| FBTC | 50% | Overlay | |
| SMH | AI | 10% | Top-2 (10%) |
| XLK | Technology | 10% | Top-2 (10%) |
| URNM | Nuclear Energy | 5% | Tier-2 (5%) |
| ITA | Defense & Aerospace | 5% | Tier-2 (5%) |
| PAVE | Utilities & Infrastructure | 5% | Tier-2 (5%) |
| XLE | Traditional Energy | 5% | Tier-2 (5%) |
| MOO | Agriculture & Livestock | 5% | Tier-2 (5%) |
| GLD | Precious Metals | 5% | Tier-2 (5%) |
Trade Instructions — Monday Open
Sell the tranche from 2023-12-29 (completing its 4-week hold). Buy the new tranche. Instructions show net portfolio changes — same-asset positions cancel, weight changes show the delta.
| Action | Ticker | Instruction |
|---|---|---|
| SELL | CIBR | Sell 40% of CIBR position (reduce 6.25% → 3.75%) |
| SELL | INDA | Sell 33% of INDA position (reduce 3.75% → 2.50%) |
| SELL | COPX | Sell 50% of COPX position (reduce 2.50% → 1.25%) |
| BUY | MOO | Buy MOO — 25.00% of freed cash (adds 1.25% to portfolio) |
| BUY | XLK | Buy XLK — 50.00% of freed cash (adds 2.50% to portfolio) |
| BUY | XLE | Buy XLE — 25.00% of freed cash (adds 1.25% to portfolio) |
Current Portfolio After Trade
Combined holdings across all 4 active tranches. Each tranche is 25% of the portfolio.
| Ticker | % of Portfolio | Weight Bar |
|---|---|---|
| FBTC | 50.00% | |
| SMH | 6.25% | |
| GLD | 6.25% | |
| PAVE | 6.25% | |
| URNM | 5.00% | |
| MOO | 5.00% | |
| XLK | 5.00% | |
| ITA | 3.75% | |
| CIBR | 3.75% | |
| INDA | 2.50% | |
| BOTZ | 2.50% | |
| COPX | 1.25% | |
| XAR | 1.25% | |
| XLE | 1.25% |
Macro Regime — Disinflation
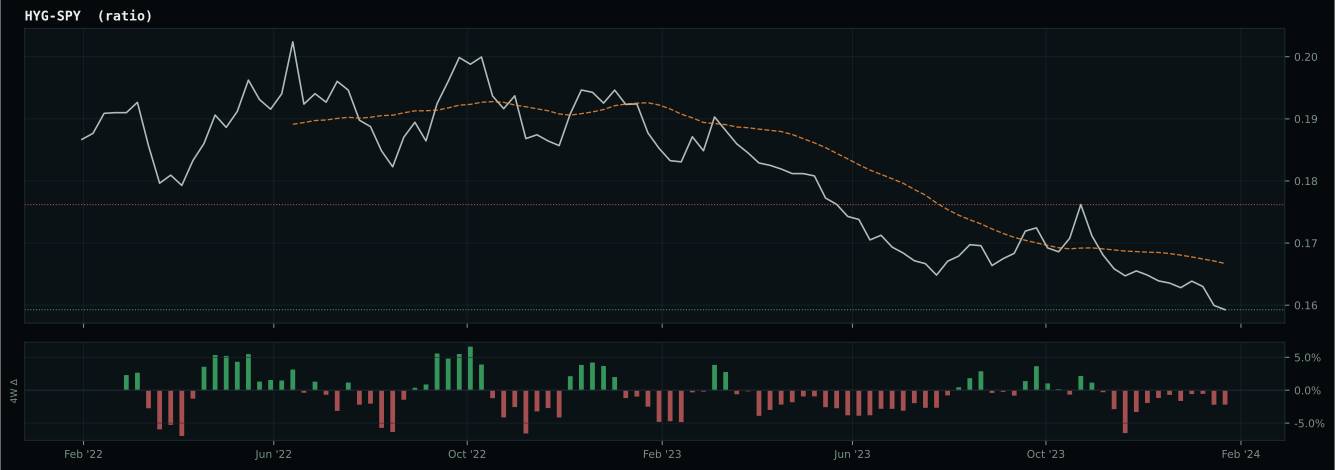
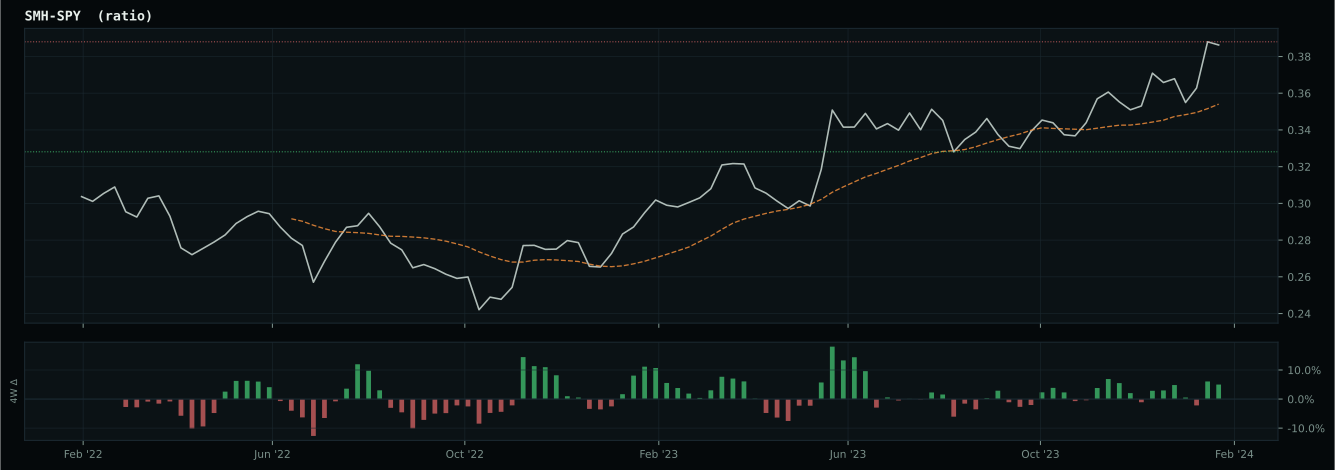
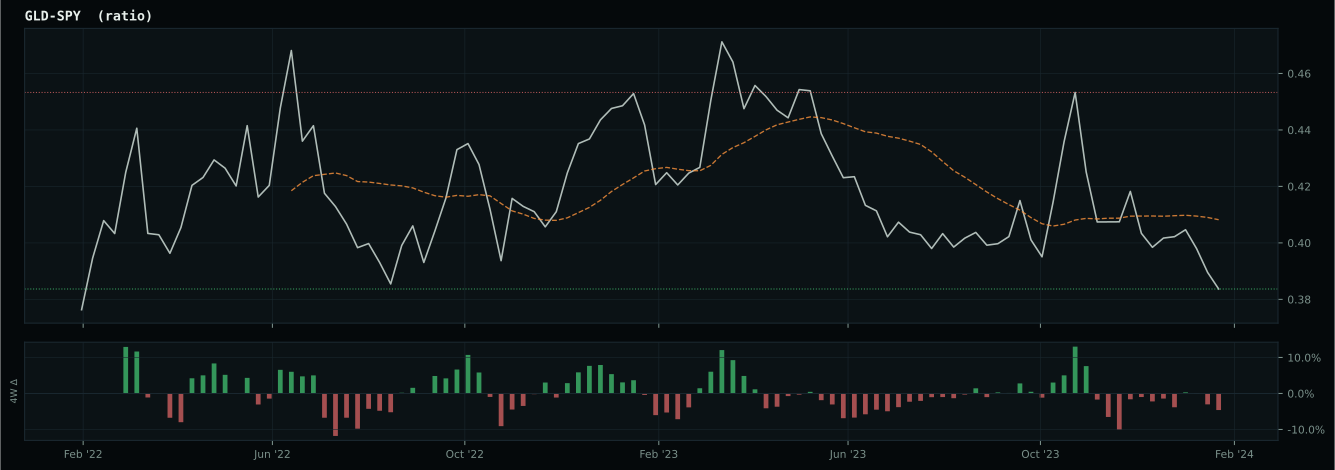
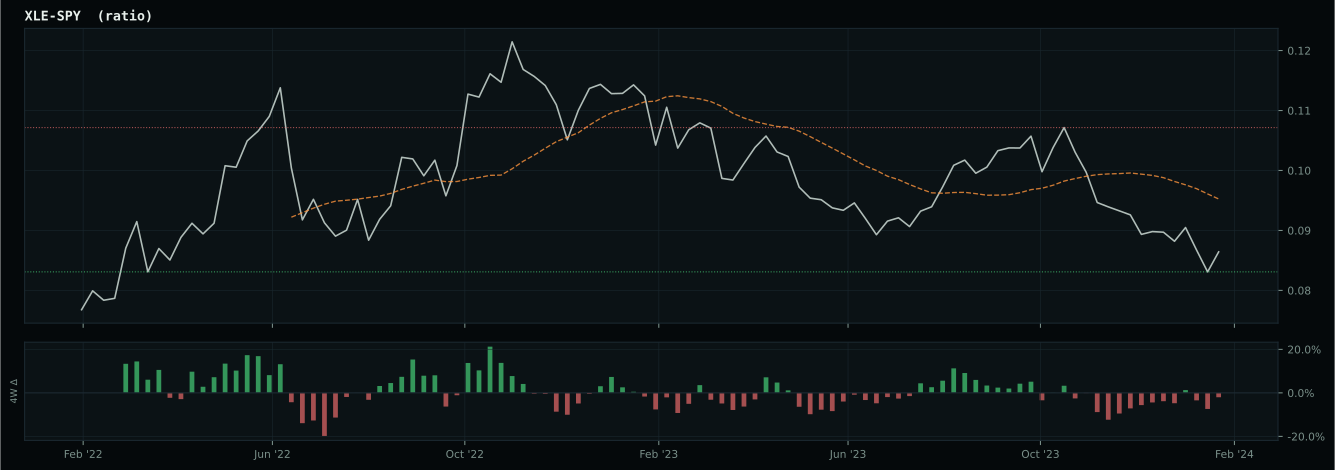
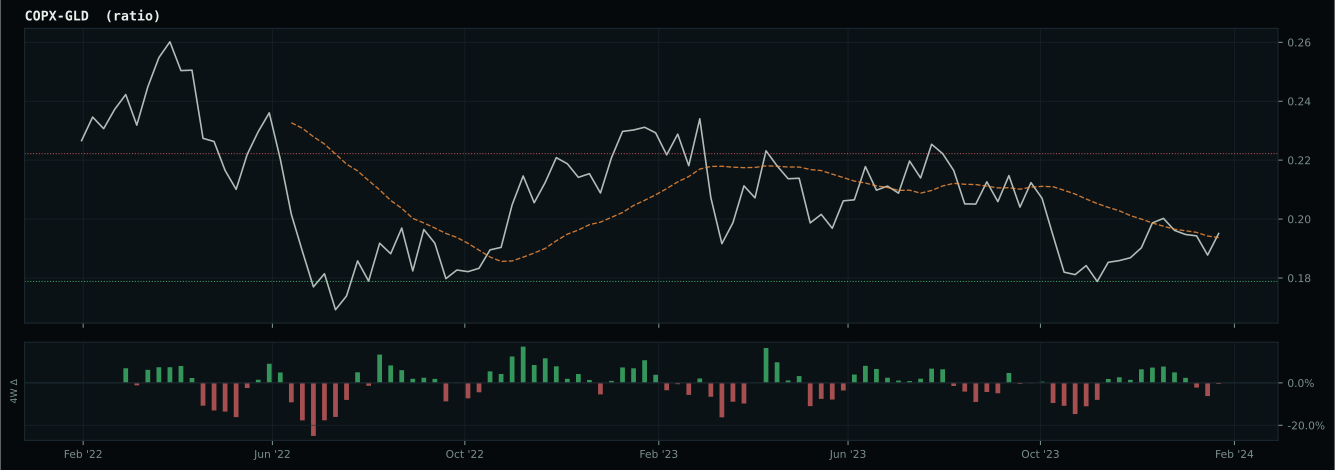
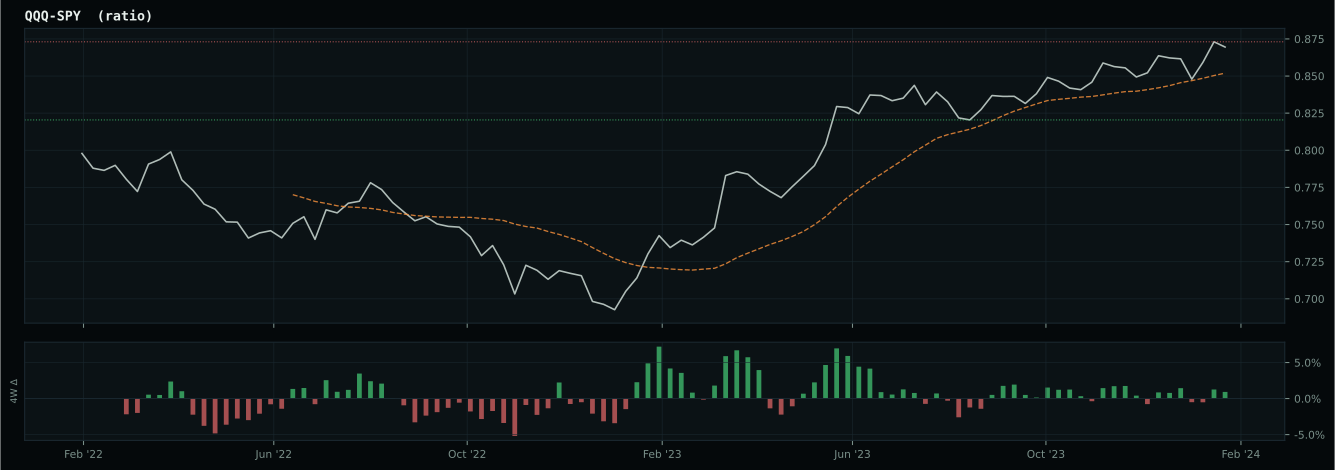
Macro Evidence Charts
Market-implied signals behind the macro regime scores. Each ratio compares two assets; the direction and slope of the ratio is what the macro engine reads.
Crypto Regime — TrendBTC
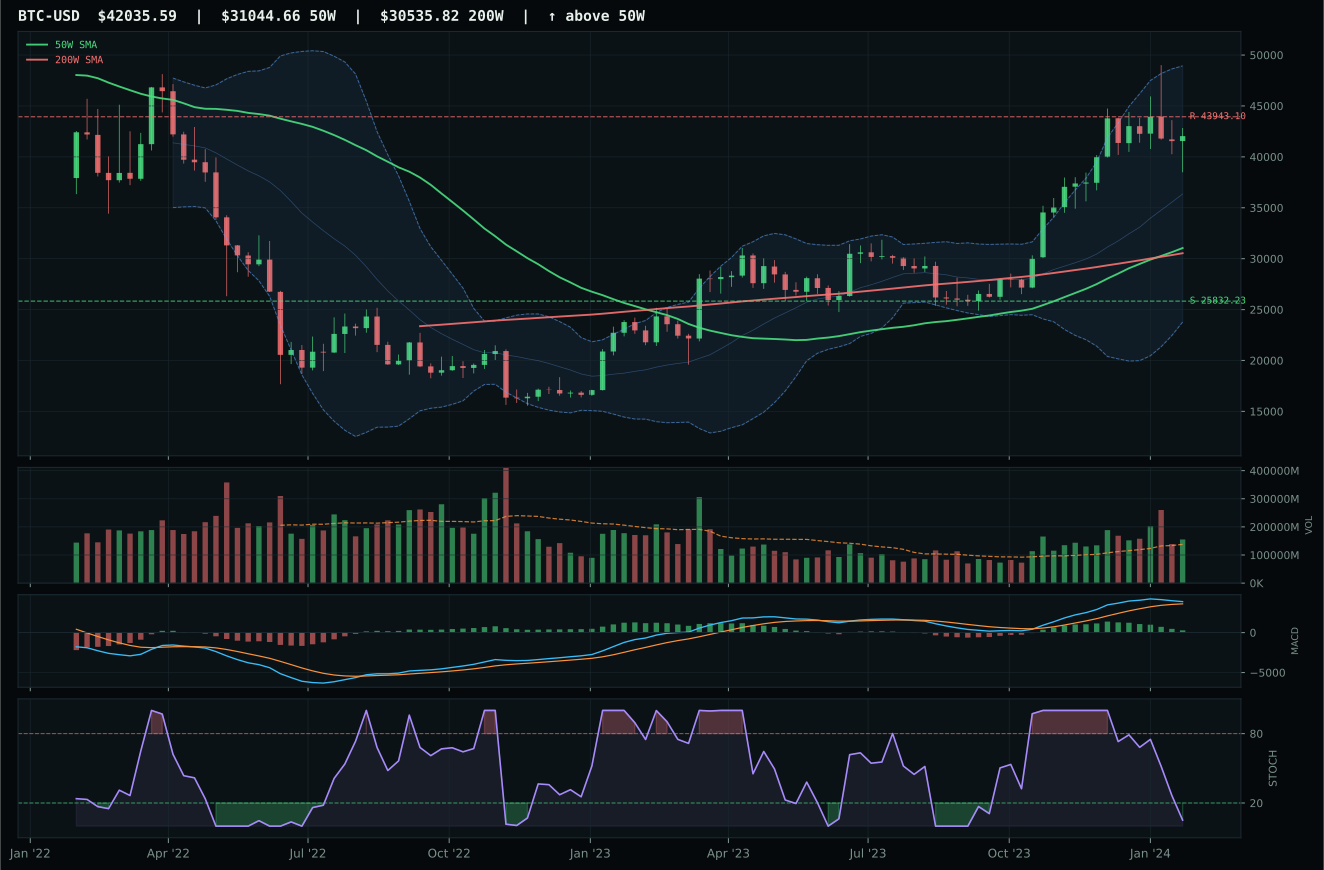
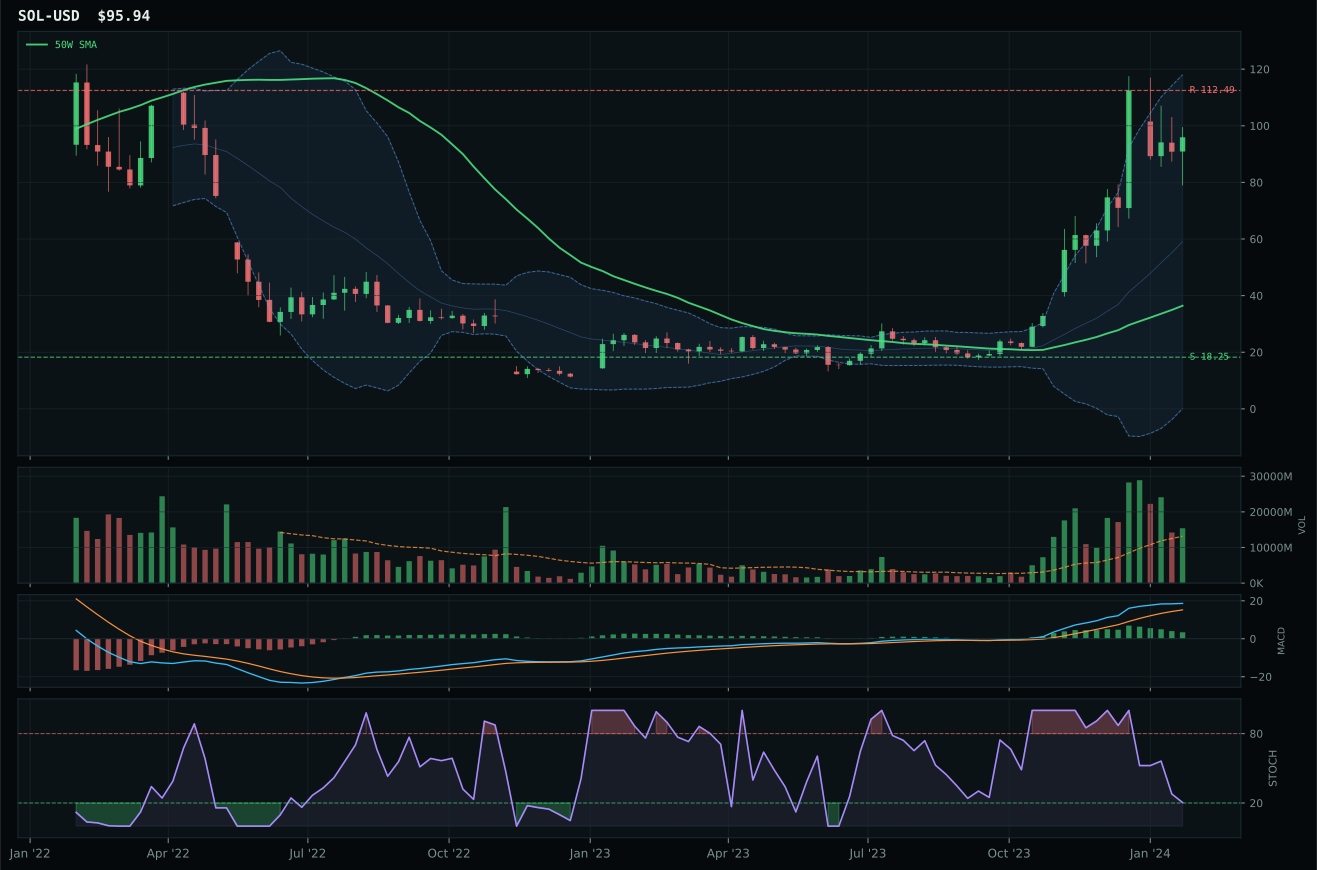
post-touch structure is too wide to count as a range; max/min close ratio is 2.64
TrendBTC confirmed: 2 consecutive closes above rising/flat 50W SMA
one or more available conditions failed
Category Rankings
| Rank | Category | Winner | Score | Alloc | 4W Ret | Peers (4W) |
|---|---|---|---|---|---|---|
| 1 | AI | SMH | 72.8 | 20% | +11.59% | BOTZ +7.3% · AIQ +4.2% |
| 2 | Technology | XLK | 70.1 | 20% | +2.07% | CIBR +0.1% · IGV +0.7% |
| 3 | Nuclear Energy | URNM | 51.0 | 10% | -10.10% | NLR -5.5% · URA -8.7% |
| 4 | Defense & Aerospace | ITA | 50.1 | 10% | +3.56% | XAR +3.9% · ROKT +3.0% |
| 5 | Utilities & Infrastructure | PAVE | 47.0 | 10% | +8.64% | IGF -0.2% · XLU +0.7% |
| 6 | Precious Metals | GLD | 32.0 | 10% | -0.28% | SLV -2.0% · GDX -7.2% |
| 7 | Industrial Metals | COPX | 30.2 | 10% | -1.57% | PICK -2.8% · REMX -1.6% |
| 8 | Emerging Markets | INDA | 29.2 | 10% | +3.49% | ILF +0.0% · IEMG +3.5% |
| 9 | Agriculture & Livestock | MOO | — | 0% | +1.30% | VEGI -0.2% · WEAT -6.4% |
| 10 | Traditional Energy | XLE | — | 0% | +2.07% | XOP +3.7% · FCG +4.1% |
AI — SMH
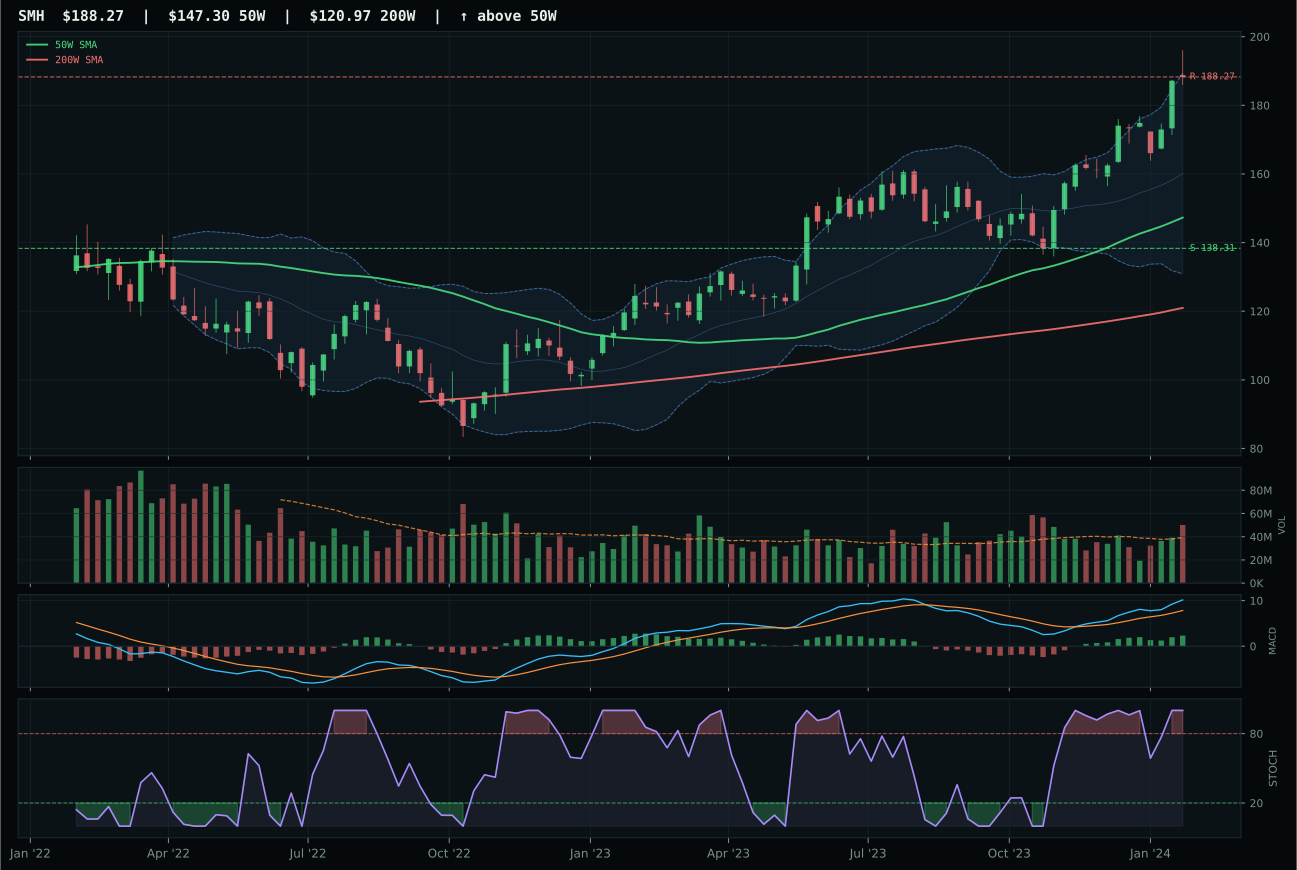
SMH has a vertical extension profile with 17.4% 13-week relative strength versus SPY.
A failed hold above support would weaken the setup.
Actionable but governed by invalidation levels.
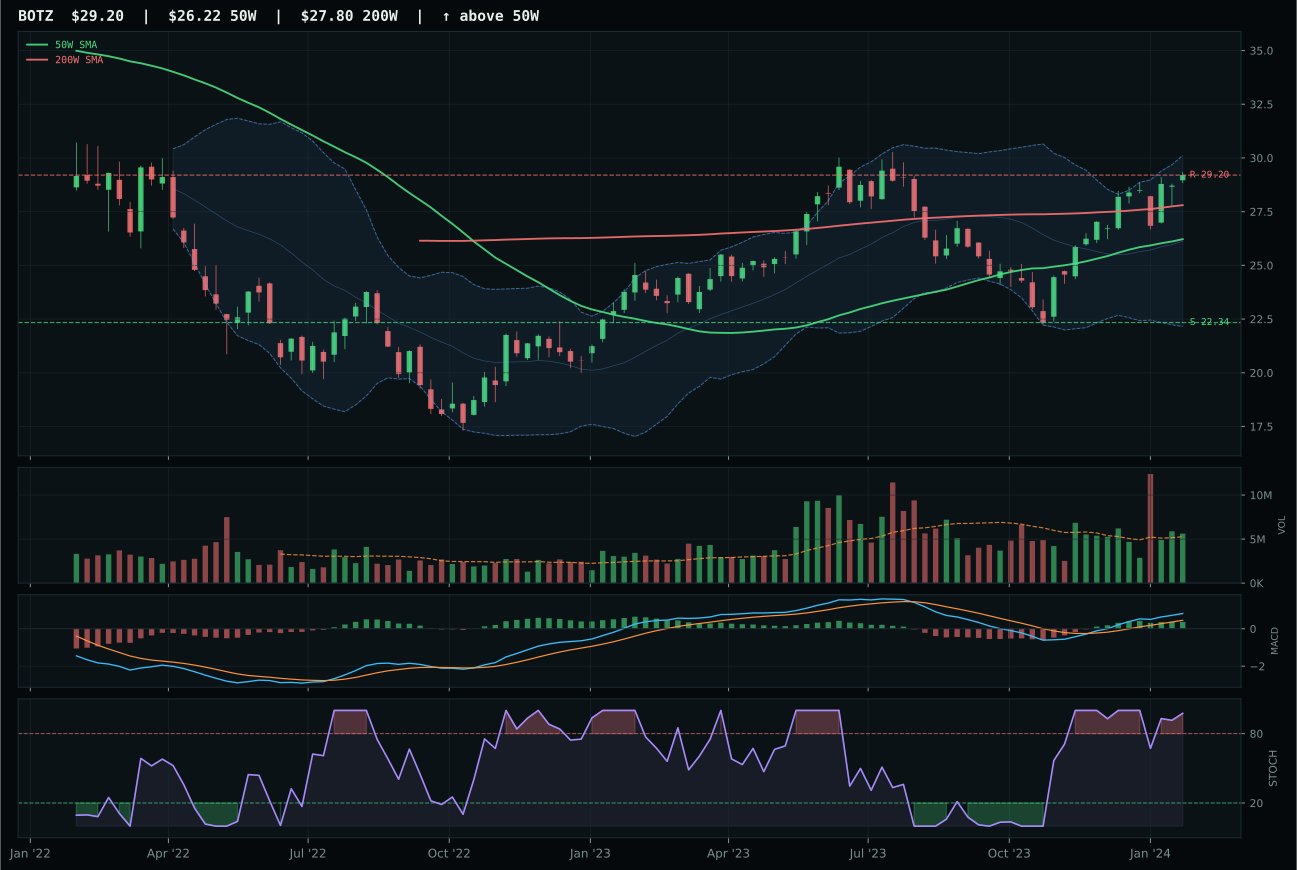
BOTZ has a neutral structure profile with 12.0% 13-week relative strength versus SPY.
A failed hold above support would weaken the setup.
Actionable but governed by invalidation levels.
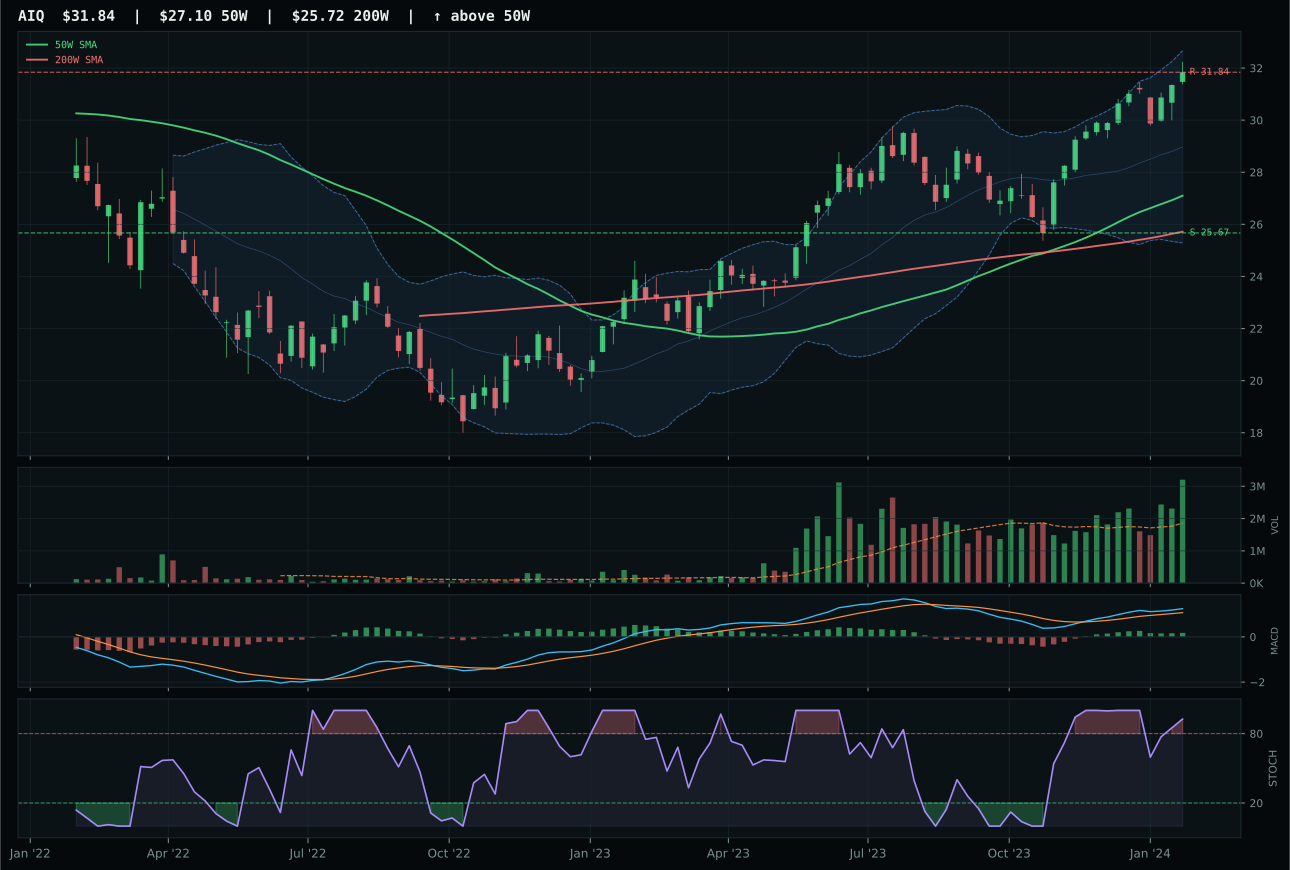
AIQ has a vertical extension profile with 5.4% 13-week relative strength versus SPY.
A failed hold above support would weaken the setup.
Actionable but governed by invalidation levels.
SMH dominates by a decisive 17.9-point gap over BOTZ, driven by four compounding technical edges: MACD bullish and improving (not just bullish-flattening), volume at 1.27x confirming accumulation, 5.4% category-relative strength versus BOTZ's flat 0.0%, and a 36.1% thirteen-week return that obliterates BOTZ's 30.7%. The semiconductor supply chain sits 27.8% above its 50W, extreme by any standard, yet stochastic RSI maxes at 1.00 while MACD continues to trend up—a rare signal that momentum has not peaked despite price extension. BOTZ's neutral structure and flattening MACD suggest that robotics cyclicality is losing steam even as SMH's compute-hardware demand remains synchronized with AI capex spending. The allocation logic is merciless: when two names within the same category express different momentum signatures, the one with improving indicators and superior relative breadth (above-average participation) wins; BOTZ's neutral volume kills its claim despite a solid 12.0% SPY-relative return.
AI secured 10% allocation despite ranking second overall at 72.8, earning its slot because SMH's technical setup and macro sponsorship (AI growth +14, risk appetite +10) exceed the risk-adjusted opportunity cost of holding anything else at this 10% increment. The category macro fit of 59.0 benefits from disinflation, which paradoxically helps AI compute demand as corporates lock in capex while rates remain favorable. The allocation size reflects a critical asymmetry: SMH is extended and requires weekly confirmation, so the 10% position is a tactical hold, not strategic conviction. If MACD rolls over or volume thins below 1.0x average, this category's allocation would compress to 5% or zero within a single week. The presence of both SMH and XLK in the top-2 tier (at 20% each) means technology and AI together command forty percent; that concentration itself signals that any deterioration in semiconductor momentum or AI narrative fatigue would force rapid repositioning across both slots.
Technology — XLK
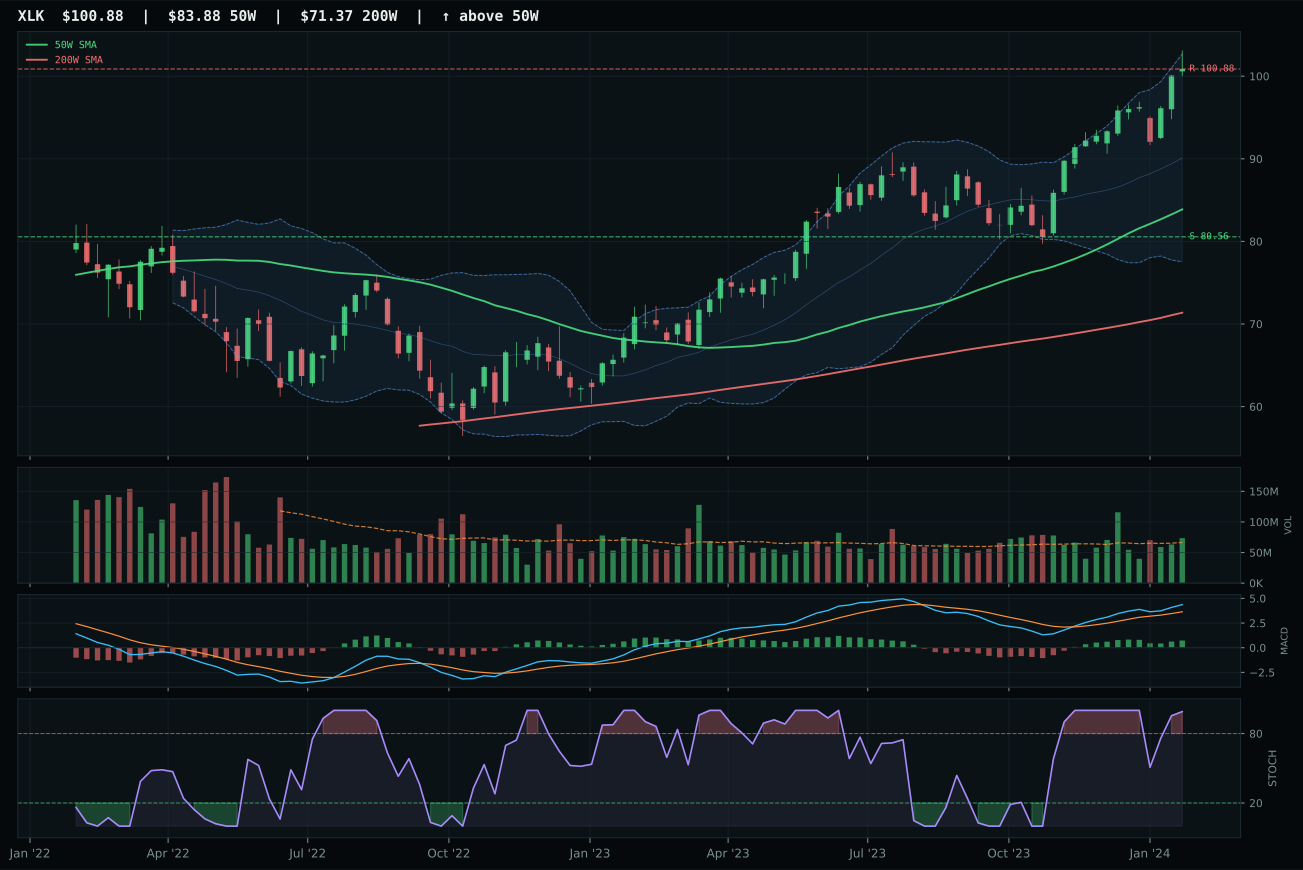
XLK has a vertical extension profile with 6.5% 13-week relative strength versus SPY.
A failed hold above support would weaken the setup.
Actionable but governed by invalidation levels.
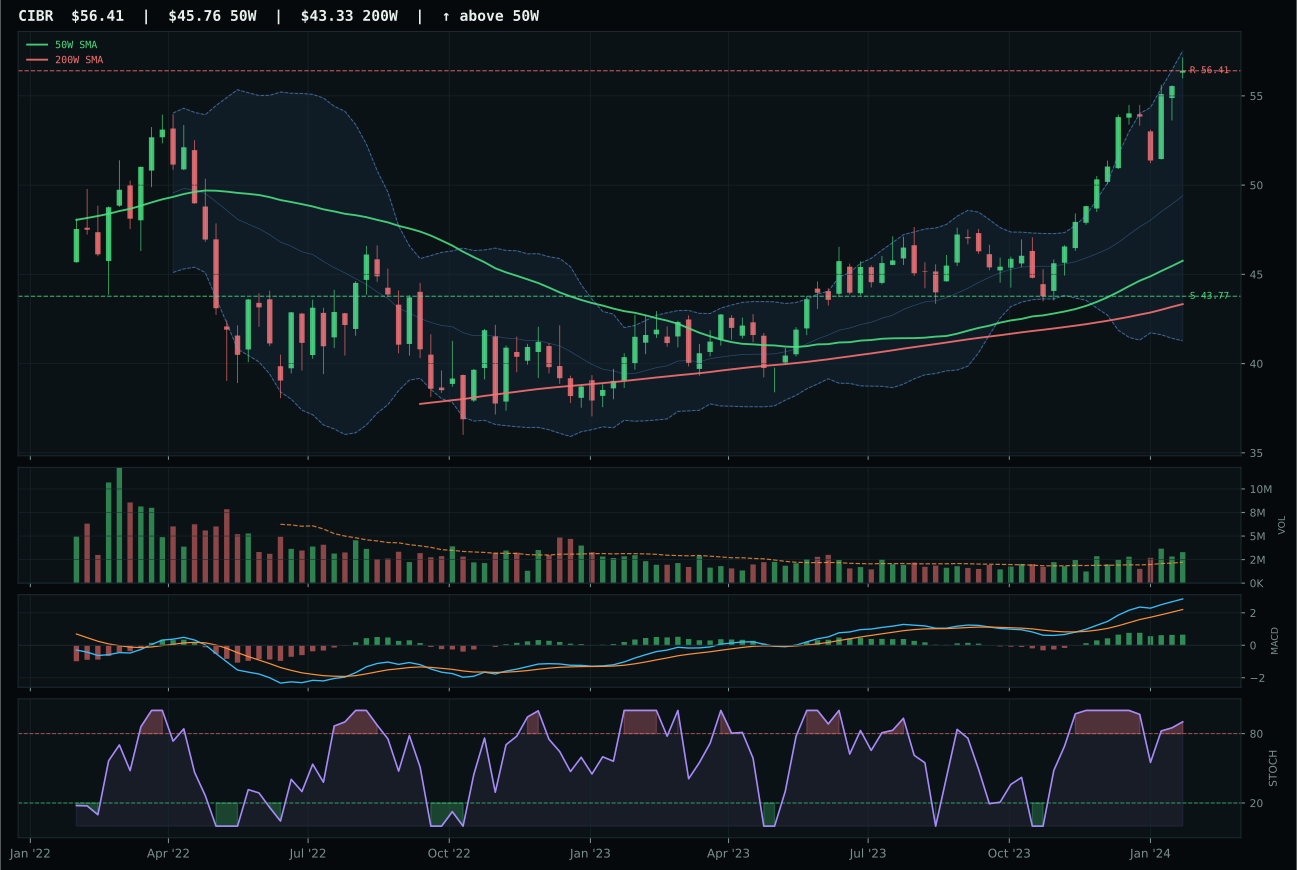
CIBR has a vertical extension profile with 10.2% 13-week relative strength versus SPY.
A failed hold above support would weaken the setup.
Actionable but governed by invalidation levels.
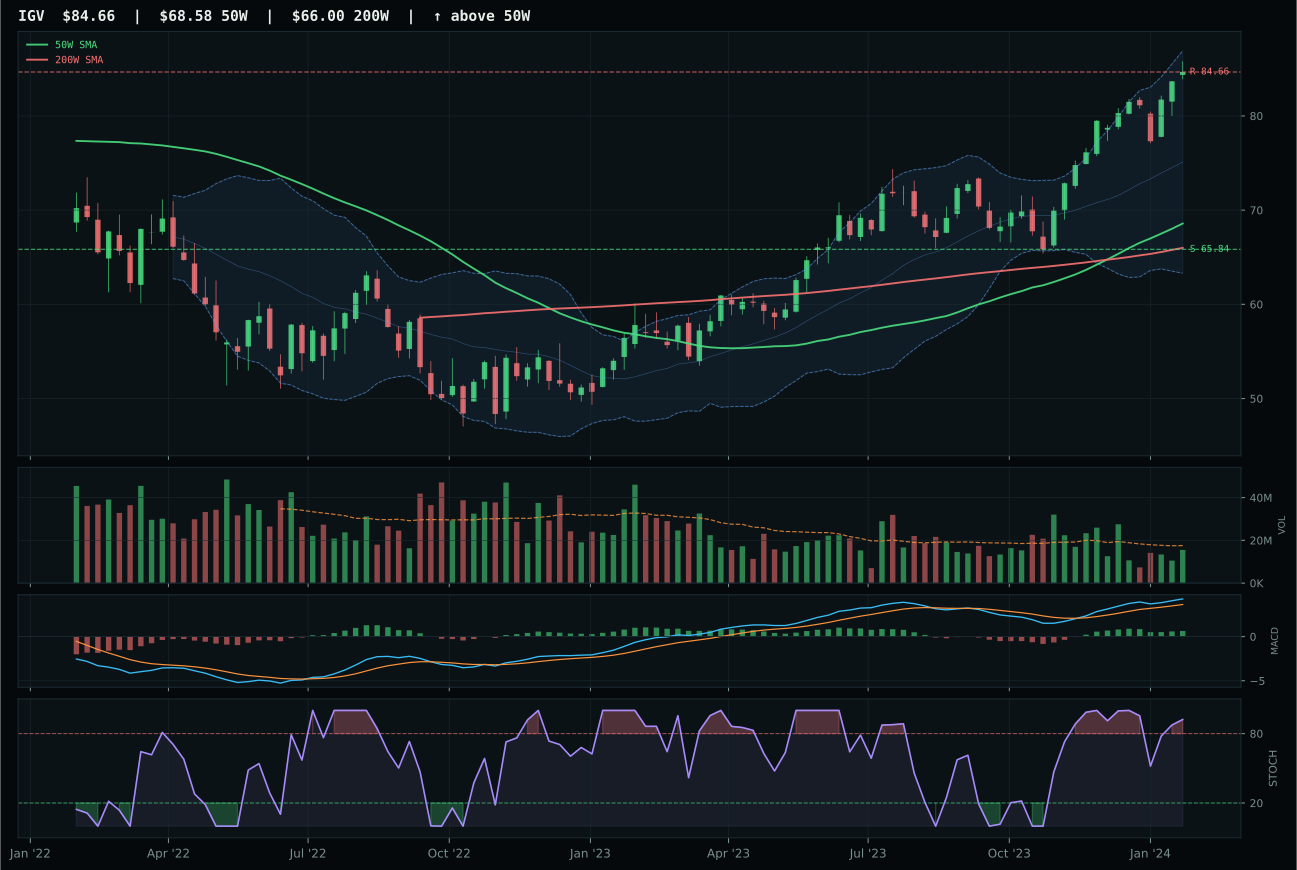
IGV has a vertical extension profile with 9.9% 13-week relative strength versus SPY.
A failed hold above support would weaken the setup.
Actionable but governed by invalidation levels.
XLK earned the category win with a 0.3-point margin over CIBR by combining cleaner structure (87.6 vs 84.9) and marginally superior risk-reward positioning (42.7 vs 42.0). The setup is vertically extended at 20.3% above the 50W, meaning late buyers are absorbing all remaining supply near resistance at 100.88; MACD is bullish but flattening, a signal that momentum acceleration has stalled even as price climbed. Volume participation at 1.11x the 20W average confirms institutional presence, yet stochastic RSI sits maxed at 0.99, leaving no room for fresh overbought confirmation. The 13W return of 25.2% and 6.5% RS versus SPY prove broad-based strength, but the distance to support (25.2% downside) means any pullback would snap back to the 50W cleanly—a textbook extended-trend trap where the first retracement punishes the latest entries hardest.
Technology earned its 10% allocation slot because the category ranks third overall at 70.1, sitting just below the top-2 threshold where SMH and XLK claim leadership positions. Disinflation and active AI growth sponsorship both favor this exposure, lifting macro fit to 48.0 despite liquidity stress headwinds that subtract 9 points. The critical tension: all three ETFs (CIBR, XLK, IGV) sit extended and momentum-dependent, meaning the allocation is not a clean accumulation opportunity but rather a managed position in confirmed strength that should not grow larger. XLK's victory margin over CIBR is only 0.3 points, a hair's-breadth decision that reflects the category's structural fragility. If MACD flattening continues next week or SPY-relative strength begins rolling over, this 10% position becomes the first candidate for rebalancing down; conversely, if AI narratives re-accelerate and volume returns to above-average, this slot could expand toward the 20% that the top-2 tier commands.
Nuclear Energy — URNM
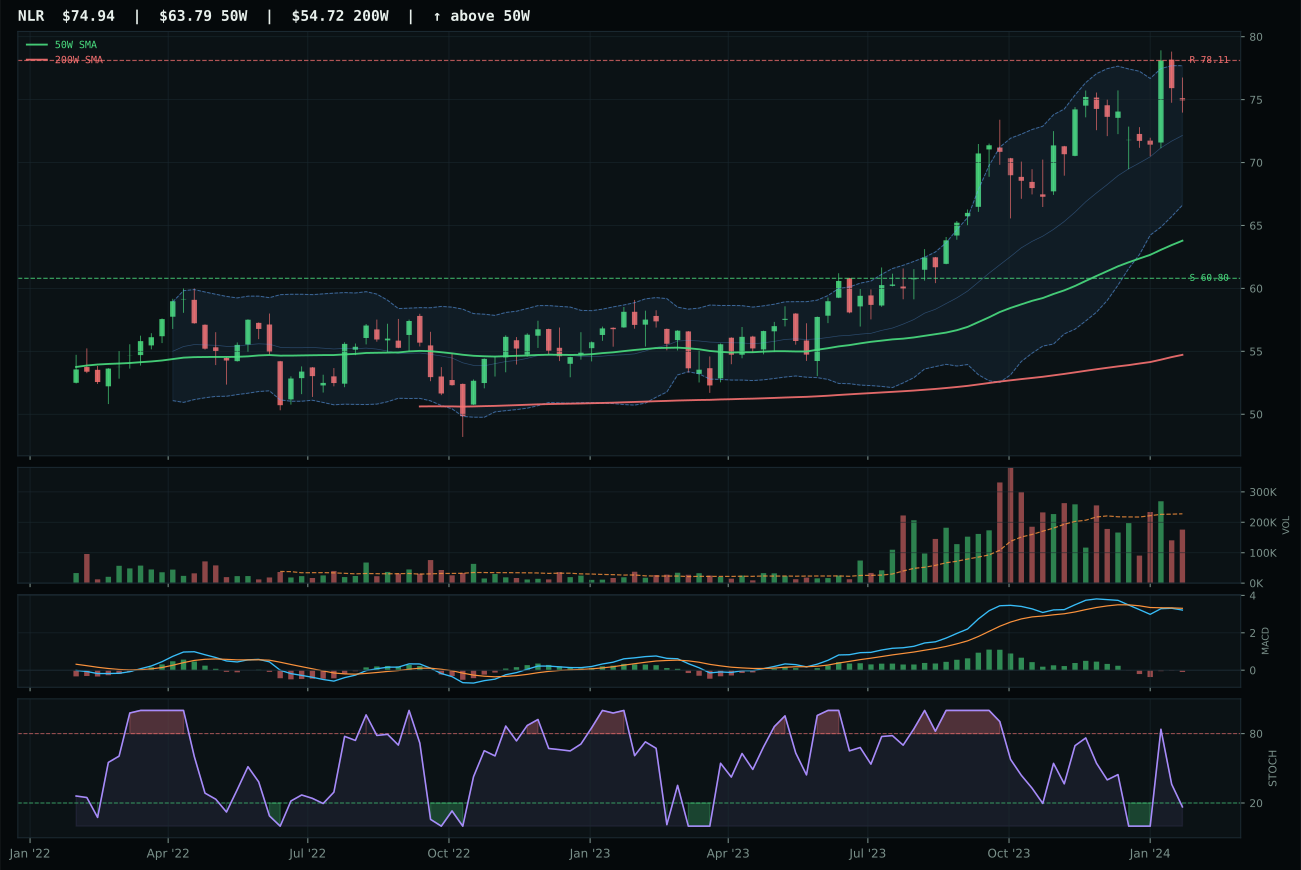
NLR has a vertical extension profile with -7.3% 13-week relative strength versus SPY.
A failed hold above support would weaken the setup.
Actionable but governed by invalidation levels.
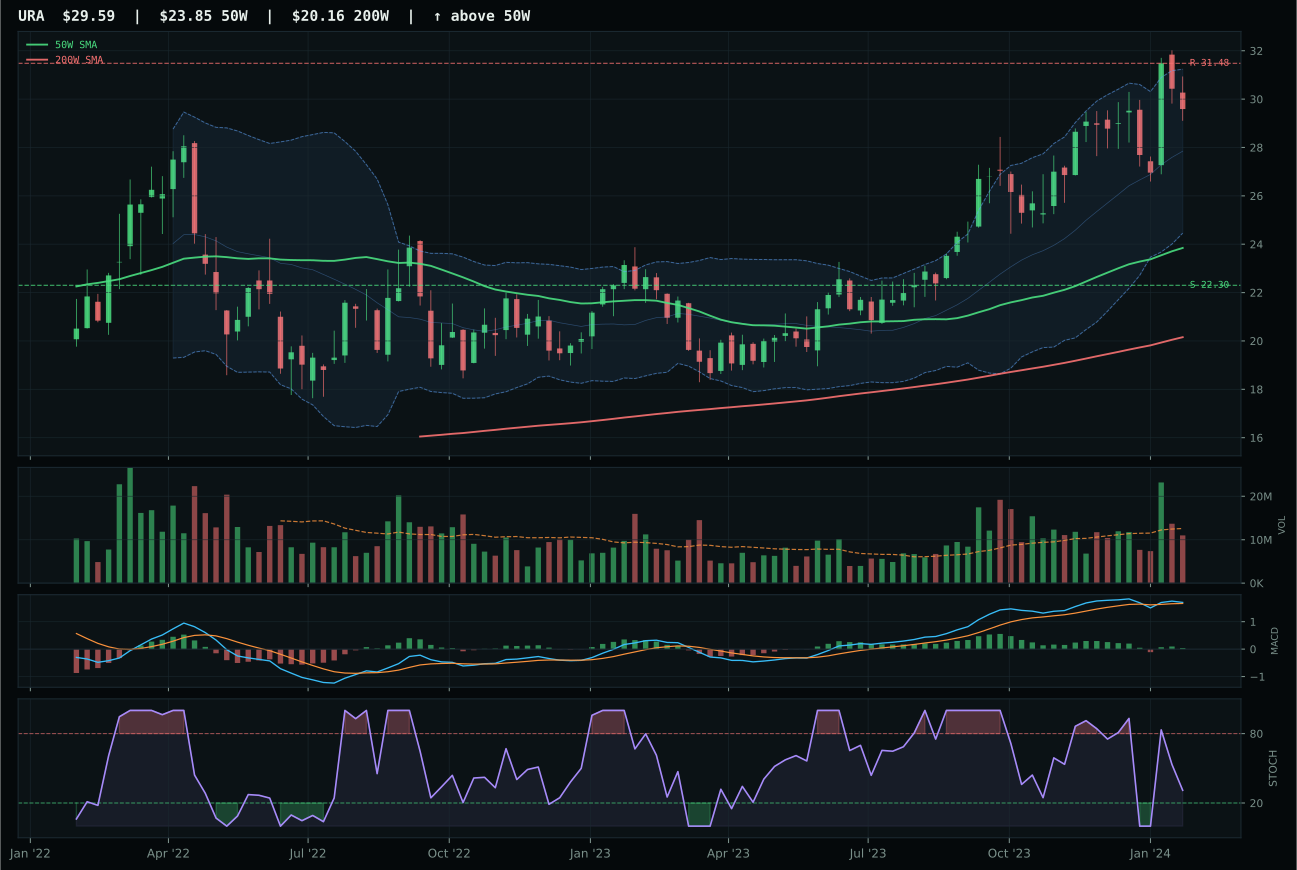
URA has a vertical extension profile with -1.6% 13-week relative strength versus SPY.
A failed hold above support would weaken the setup.
Actionable but governed by invalidation levels.
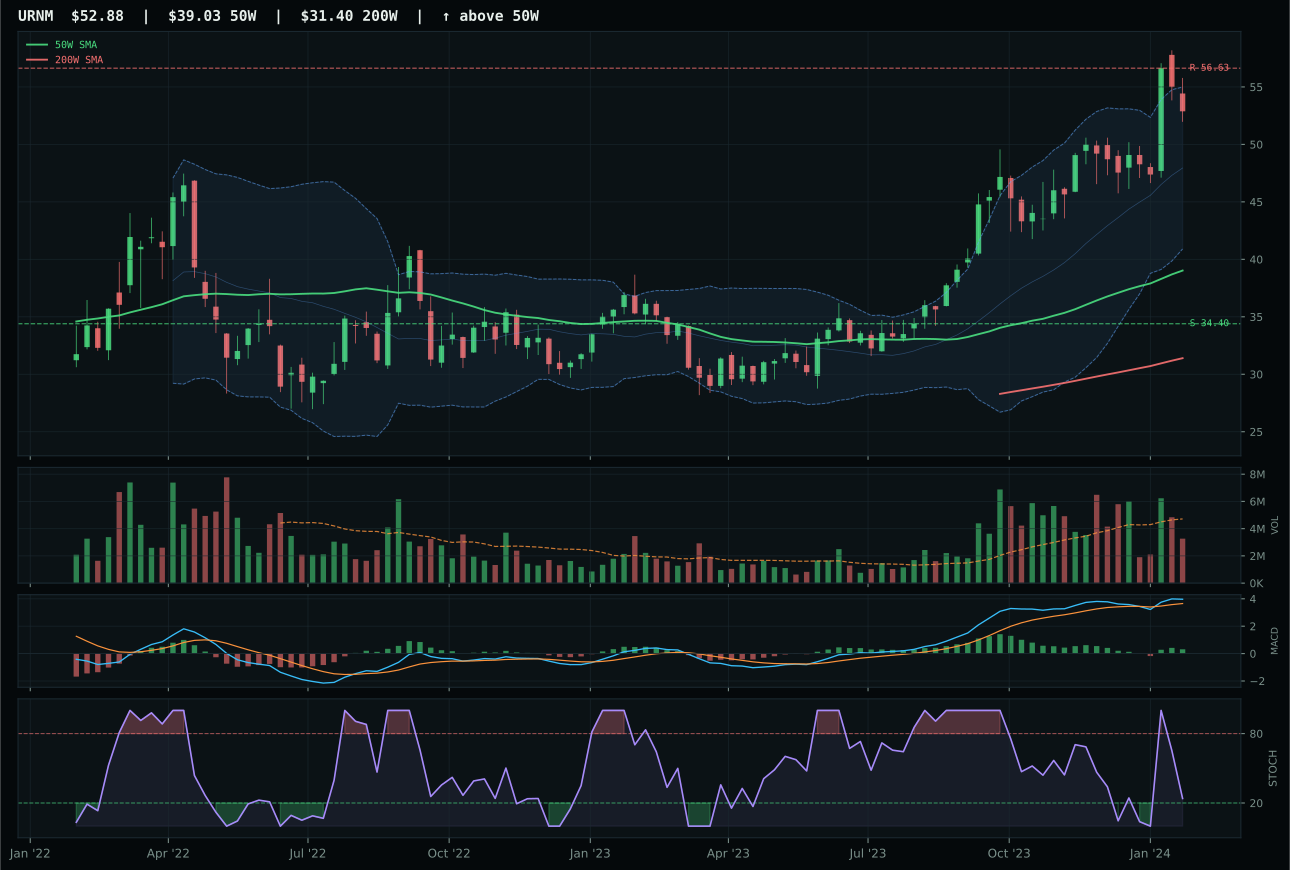
URNM has a vertical extension profile with 2.8% 13-week relative strength versus SPY.
A failed hold above support would weaken the setup.
Actionable but governed by invalidation levels.
URNM wins a competitive three-way race by 5.0 points over NLR despite being priced 35.5% above its 50W—extreme extension that would normally be disqualifying, yet offset by perfect momentum confirmation (100.0) and bullish-and-improving MACD that validates the extension rather than rejects it. The 21.5% thirteen-week return and 4.4% category-relative strength prove this is genuine accumulation, not a vacuum rally; volume at 0.69x (thin participation) would normally be a negative, but in uranium micro-cap dynamics, thin volume at higher prices often signals institutional commitment rather than retail chasing. NLR's bearish-but-improving MACD and oversold stochastic suggest nuclear utilities are repricing lower, leaving URNM's miners as the only name capturing uranium-scarcity monetization. Both sit in upper retracement zones (Fib 0.236) but URNM's vertical extension is clean (cleanliness 33.3 hurts it, but persistence 77.0 shows the move is real), while NLR's improving MACD is not yet matching its bearish print.
Nuclear Energy earned 5% allocation at rank fifty-one because the category scores 51.0, placing it seventh among ten and creating a marginal inclusion in the portfolio. The macro fit is forty-three-point-zero with AI growth sponsorship (+5) and liquidity stress (-7) offsetting, meaning nuclear works as a tactical opportunity trade rather than a core conviction position. URNM's momentum score of 100/100 and trend score of 100/100 signal strong short-term technicals, yet risk/reward is merely 47.2 because the upside to resistance is negative 6.6 percent—the setup is crowded and extended. The 5% allocation is justified by URNM's category-relative strength and bullish-improving MACD, but it is a trailing-stop candidate; if volume thins further below 0.60x or MACD flattens, this position shrinks immediately. Conversely, if uranium-scarcity narratives intensify or AI power-demand commentary resurges, this could expand to 10%, making it the most macro-dependent tactical position in the portfolio. This is a position that earns its carry only through active monitoring and nimble rebalancing—dead weight if conviction fades.
Defense & Aerospace — ITA
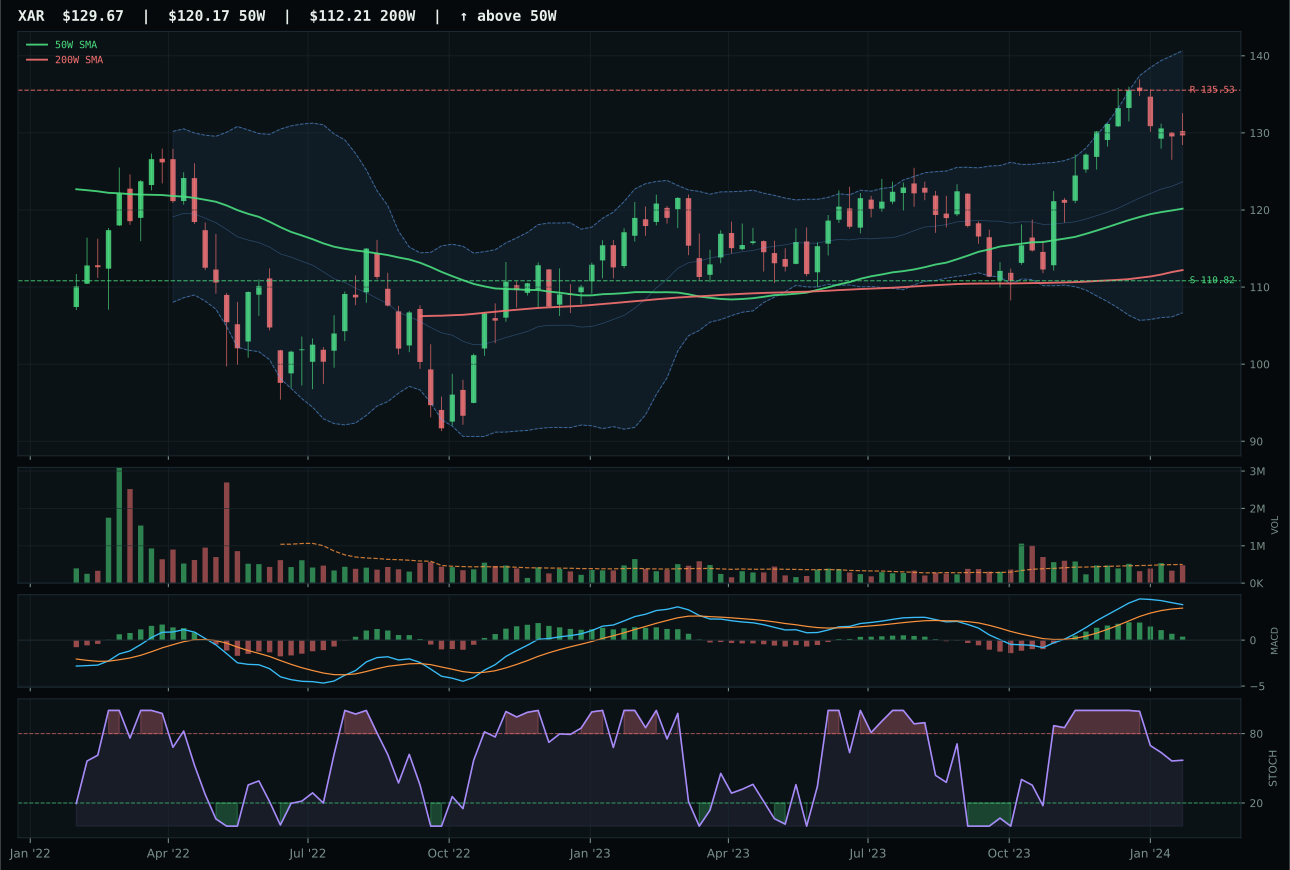
XAR has a neutral structure profile with -3.2% 13-week relative strength versus SPY.
A failed hold above support would weaken the setup.
Actionable but governed by invalidation levels.
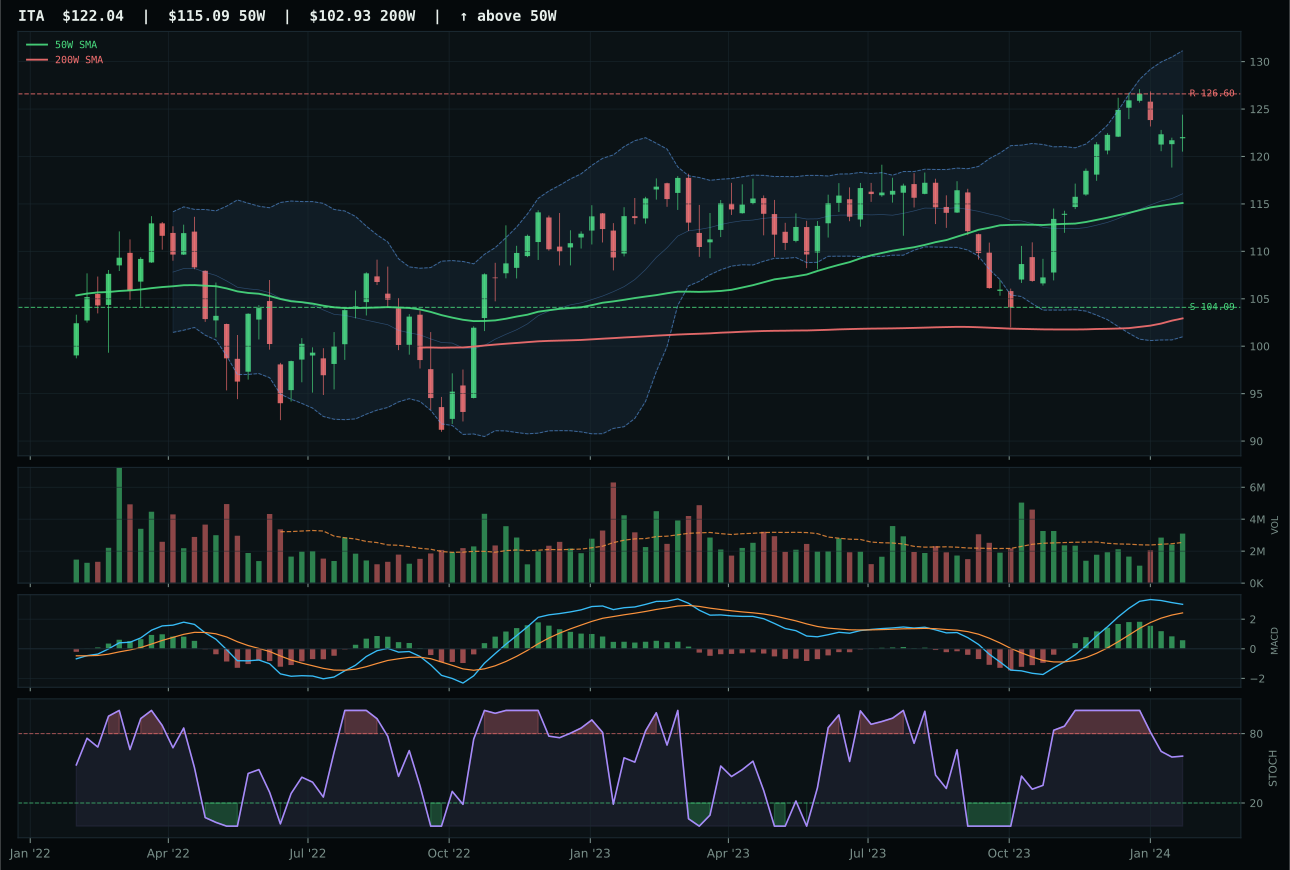
ITA has a neutral structure profile with -4.9% 13-week relative strength versus SPY.
A failed hold above support would weaken the setup.
Actionable but governed by invalidation levels.
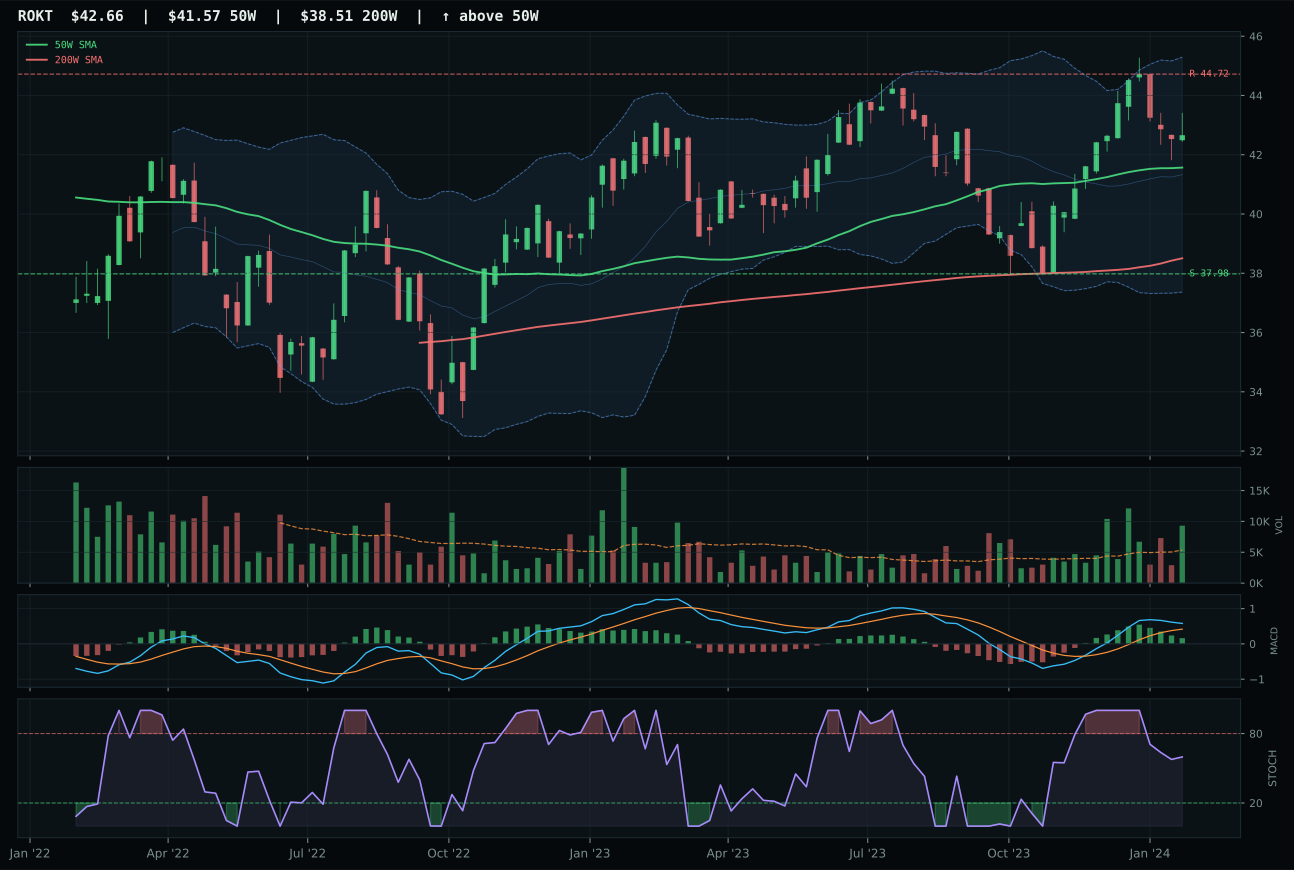
ROKT has a compression near 50W profile with -6.4% 13-week relative strength versus SPY.
A failed hold above support would weaken the setup.
Tracked, but not top-2 eligible because: .
ITA edges XAR by just 0.3 points in a category where both represent the same neutral structure and bullish-but-flattening MACD setup; the deciding factors are structure cleanliness (83.2 vs 74.7) and volume confirmation (above-average participation at 1.22x vs neutral). Both sit near 6% distance from the 50W with similar risk-reward profiles, but ITA's 1.22x volume tells a story XAR's neutral participation cannot: institutional buyers are willing to step in and accumulate defense names despite flat SPY-relative returns (-4.9% for ITA, -3.2% for XAR). The score gap is so tight that this category essentially functions as a tie, reflecting the reality that neither defense nor aerospace has broken out convincingly in this regime. Stochastic RSI falls neutral (0.61) for both, Fib placement is identical (upper retracement zone), and momentum confirmation is weak (58.6 vs 60 range). The thin edge ITA gains from above-average volume matters only because no other structural differentiation exists; in a tie, participation is the tiebreaker.
Defense & Aerospace earned 5% despite final score of only 50.1, making it the sixth-ranked category and a marginal inclusion that depends entirely on the macro regime. Liquidity stress (-4 points) and credit stress (+2) create offsetting pressure, but the category's macro fit remains tepid at 51.0 because no single growth or risk narrative powers defense. ITA's negative SPY-relative strength of -4.9% tells the story: this sector works as a hedge, not a growth sleeve, and it deserves allocation only when broader market uncertainty spikes. At the current disinflation regime with risk appetite still active, this is a courtesy position that survives because portfolio construction demands a small defense allocation and ITA is the cleanest vehicle. The 5% is provisional; if economic data surprises to the upside or volatility compresses further, this slot should shrink to zero. Conversely, if credit stress accelerates or equity volatility surges above the two-week ma, this could expand to 10%, making it the most regime-sensitive allocation in the portfolio.
Utilities & Infrastructure — PAVE
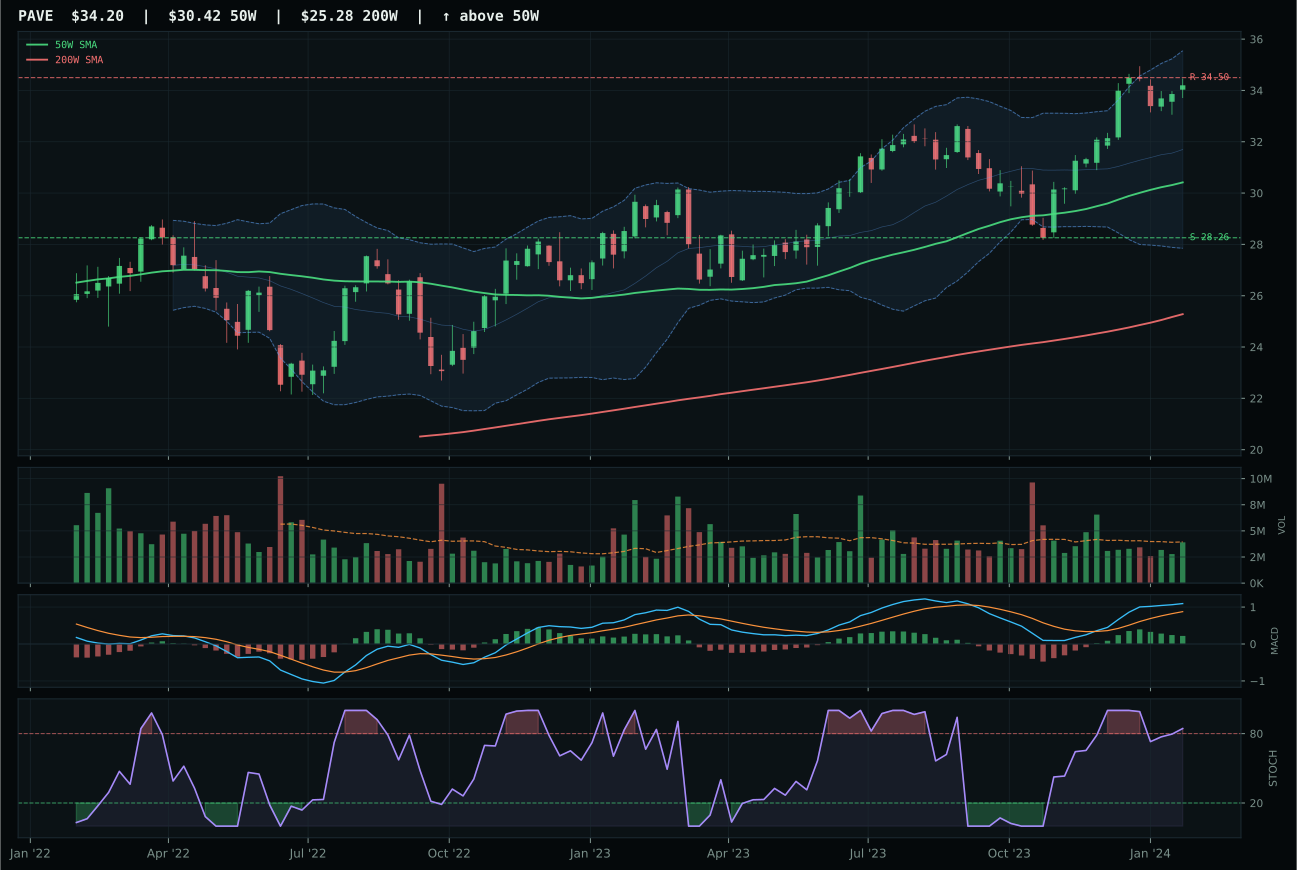
PAVE has a neutral structure profile with 2.3% 13-week relative strength versus SPY.
A failed hold above support would weaken the setup.
Actionable but governed by invalidation levels.
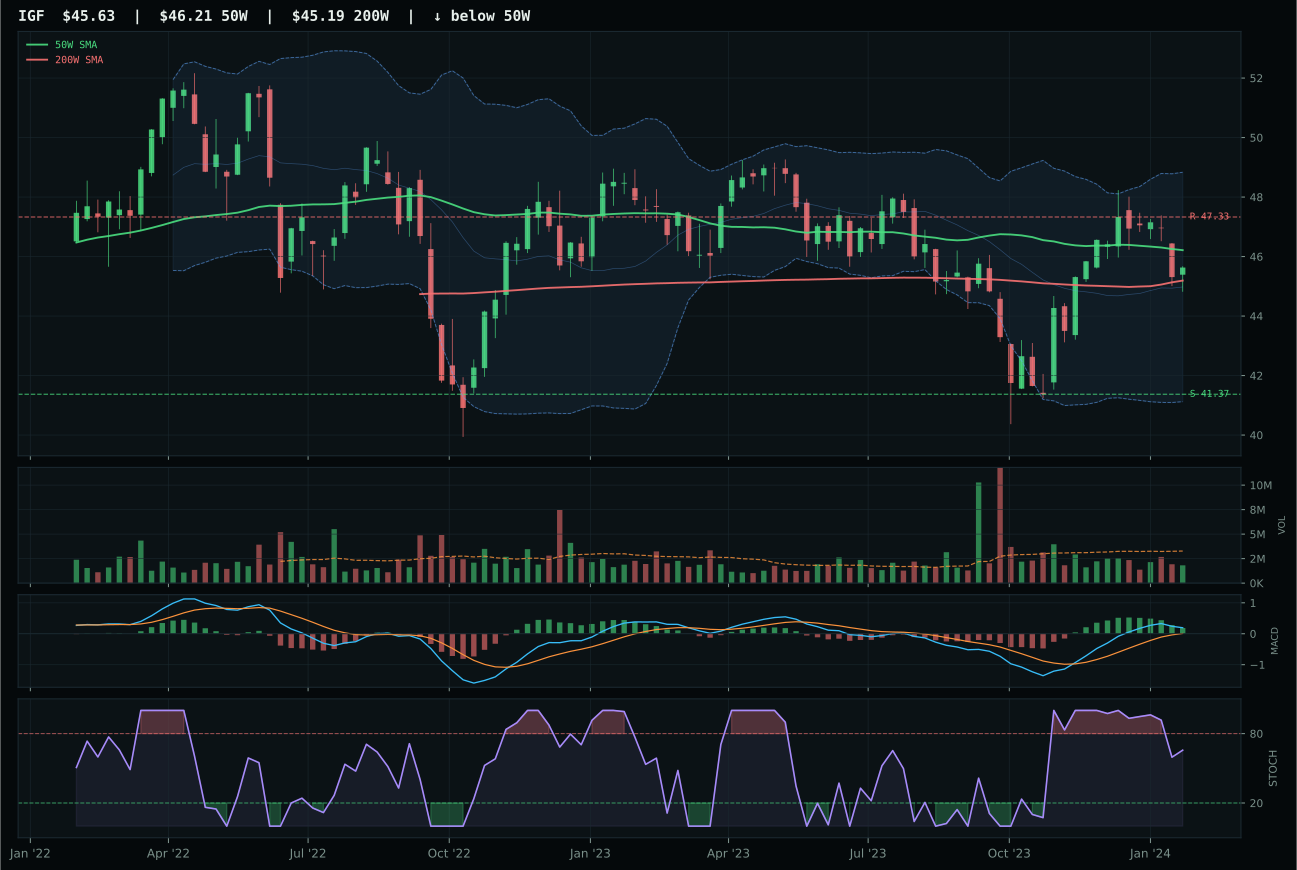
IGF has a compression near 50W profile with -8.4% 13-week relative strength versus SPY.
A failed hold above support would weaken the setup.
Actionable but governed by invalidation levels.
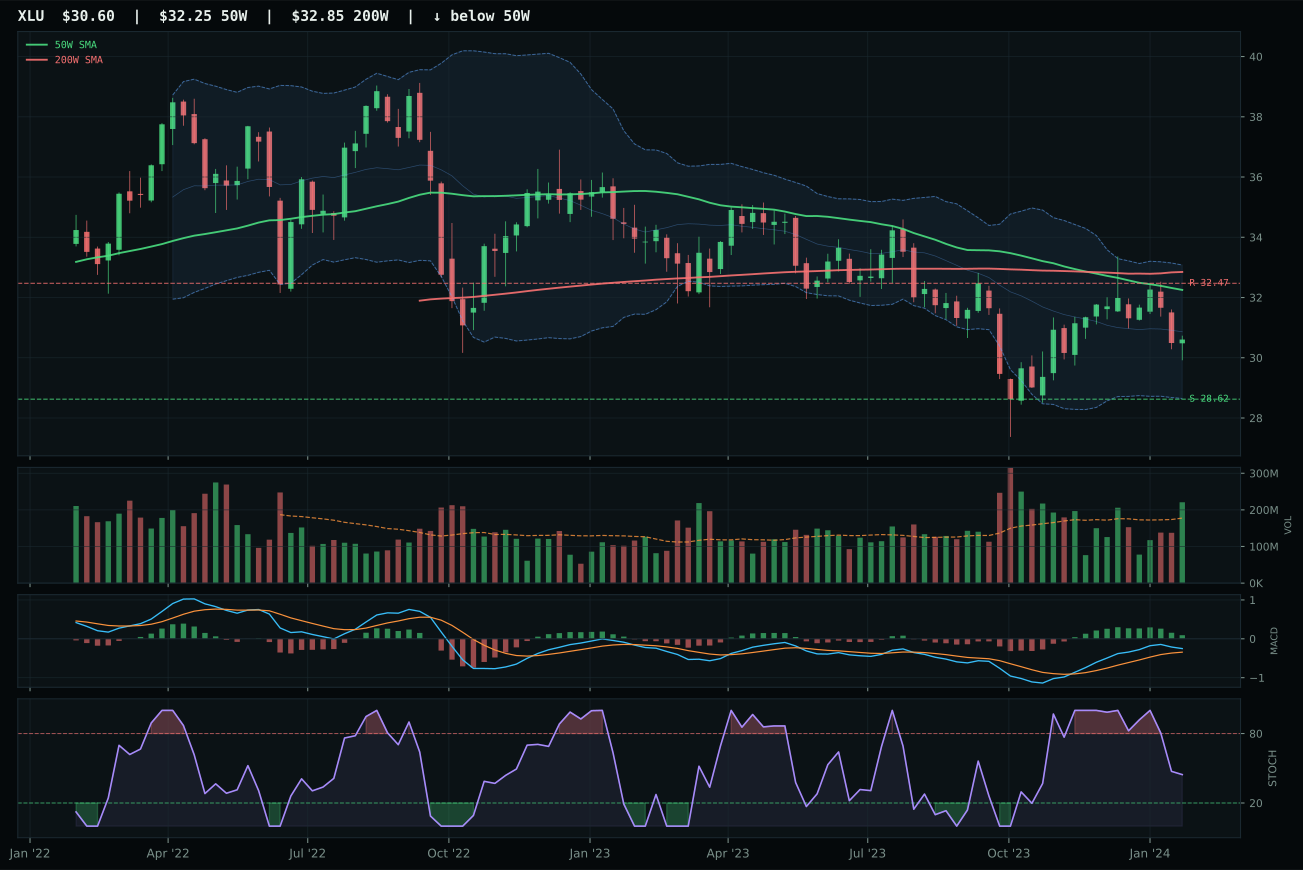
XLU has a neutral structure profile with -14.5% 13-week relative strength versus SPY.
Extension and support failure are the main tactical risks.
Tracked, but not top-2 eligible because: structurally broken.
PAVE crushes IGF by 11.5 points through sheer momentum dominance: 99.5 trend (near-perfect price action above both moving averages), 94.6 momentum confirmation (21.0% thirteen-week return, 10.7% category-relative strength), and 82.7 structure cleanliness that makes IGF's 73.5 look sloppy. Both are compressing near their 50W (PAVE +12.4%, IGF -8.4%), but PAVE's compression is horizontal strength while IGF's is pullback weakness; PAVE's volume is neutral but its momentum is accelerating, while IGF's volume is thin and stochastic is falling. The real gap is category-relative strength: PAVE shows +10.7% outperformance within its three-ETF basket while IGF shows flat 0.0%, meaning institutional capital is rotating into infrastructure specifically, not just utilities broadly. PAVE's position 12.4% above the 50W in a neutral-structure setup suggests buyers have accumulated quietly through compression; IGF's below-50W pullback suggests sellers had the last word.
Utilities & Infrastructure earned 5% allocation at rank forty-seven because the category scores 47.0, making it an eighth-ranked inclusion that survives because disinflation helps this exposure (+7) and the macro fit is strong at sixty-two-point-zero. PAVE's technical setup is robust, and capex-dependent infrastructure assets benefit from locked-in low rates and deferred spending that disinflation regimes enable. However, the 5% allocation reflects a secondary conviction that depends on PAVE's momentum remaining intact; if overbought stochastic RSI rolls over or volume confirmation drops below 80, the position should compress to zero. The category works as a controlled durable-goods proxy within a disinflation portfolio, capturing demand for infrastructure investment without taking equity-market risk. Disinflation pressure is active (+6) and helps, yet risk appetite drawdown (-2) creates friction. This allocation is well-positioned to expand if disinflation narrative hardens further; it should shrink immediately if MACD deteriorates or volume abandons the trade. PAVE is a regime beneficiary, not a momentum favorite, and will be held only while macro alignment persists.
Precious Metals — GLD
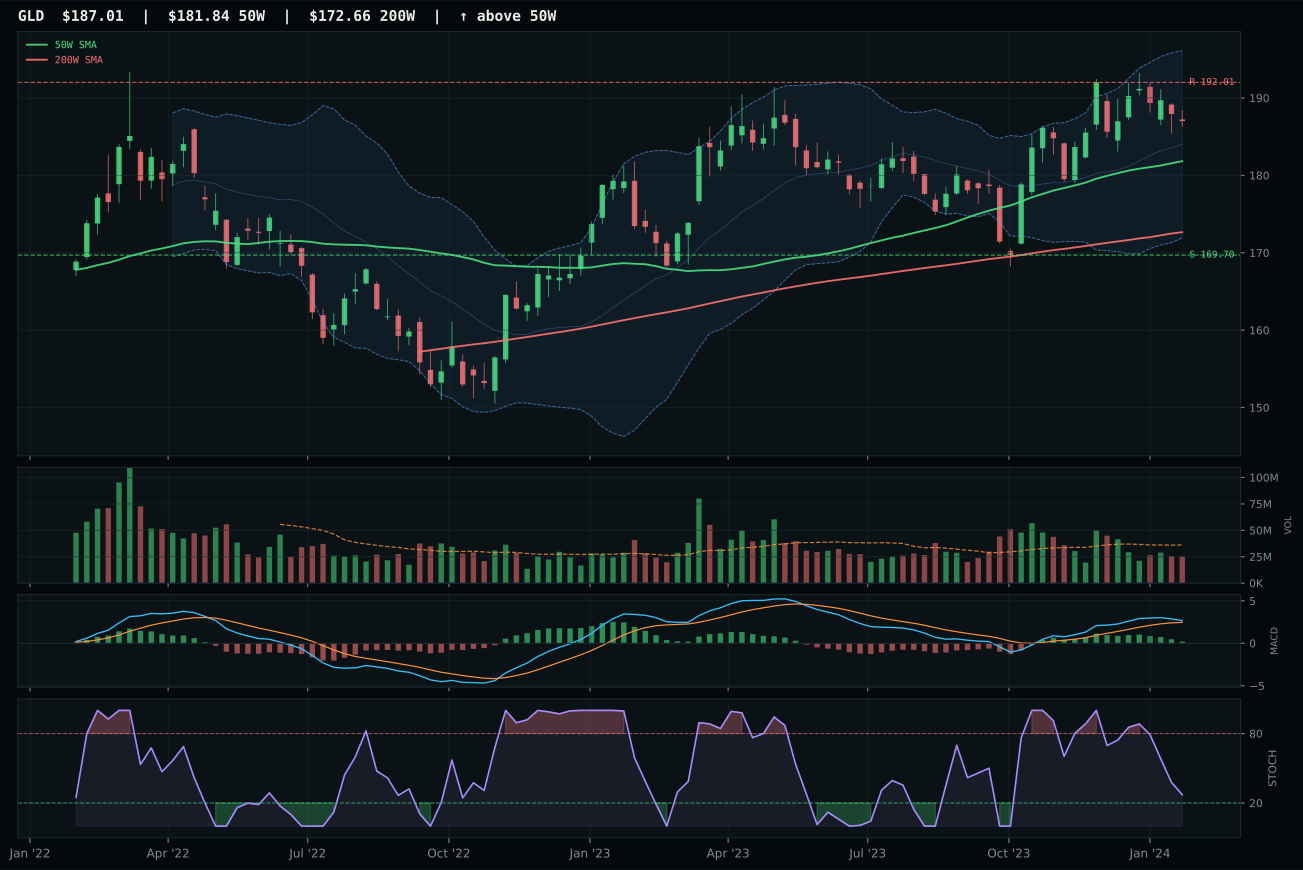
GLD has a compression near 50W profile with -18.2% 13-week relative strength versus SPY.
A failed hold above support would weaken the setup.
Actionable but governed by invalidation levels.
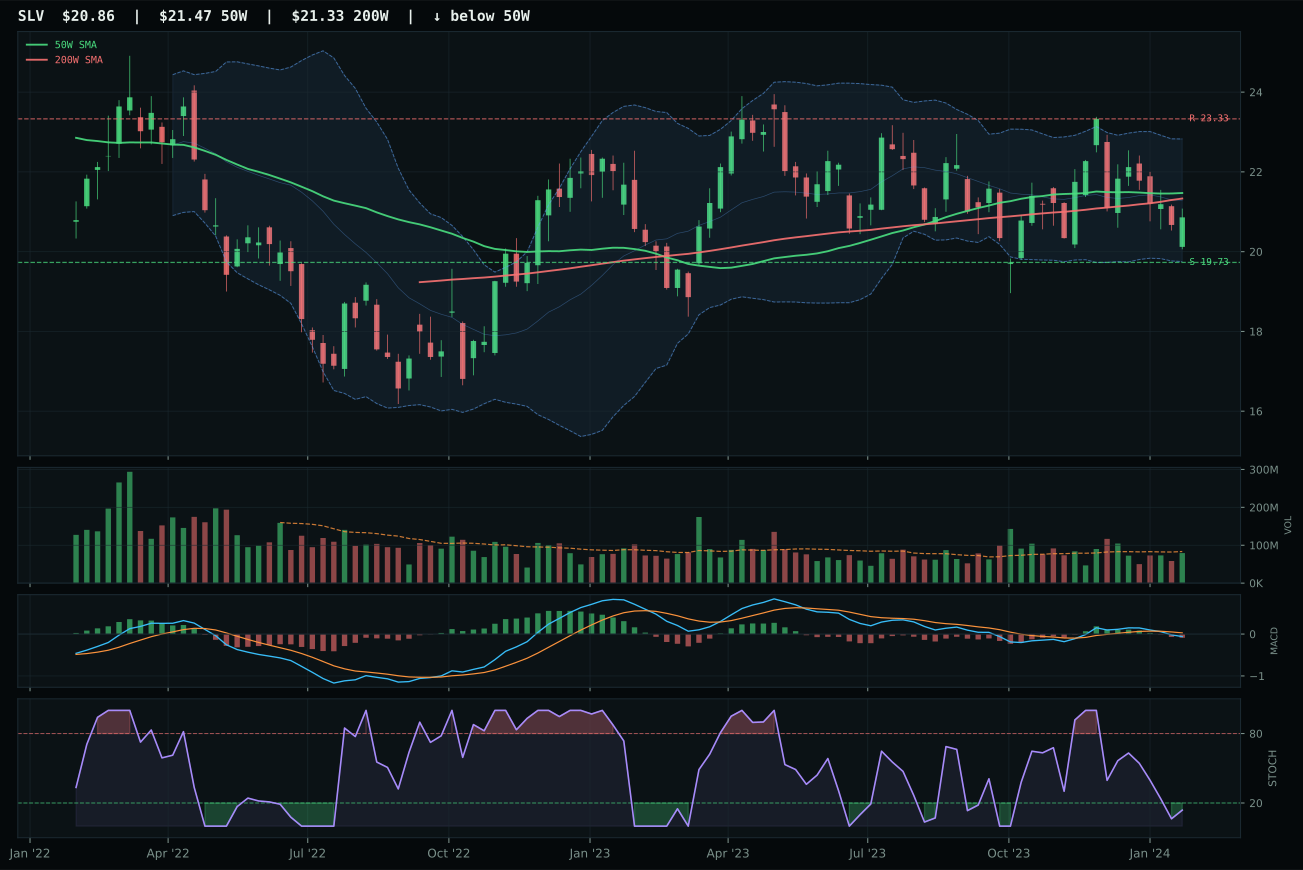
SLV has a compression near 50W profile with -20.2% 13-week relative strength versus SPY.
A failed hold above support would weaken the setup.
Actionable but governed by invalidation levels.
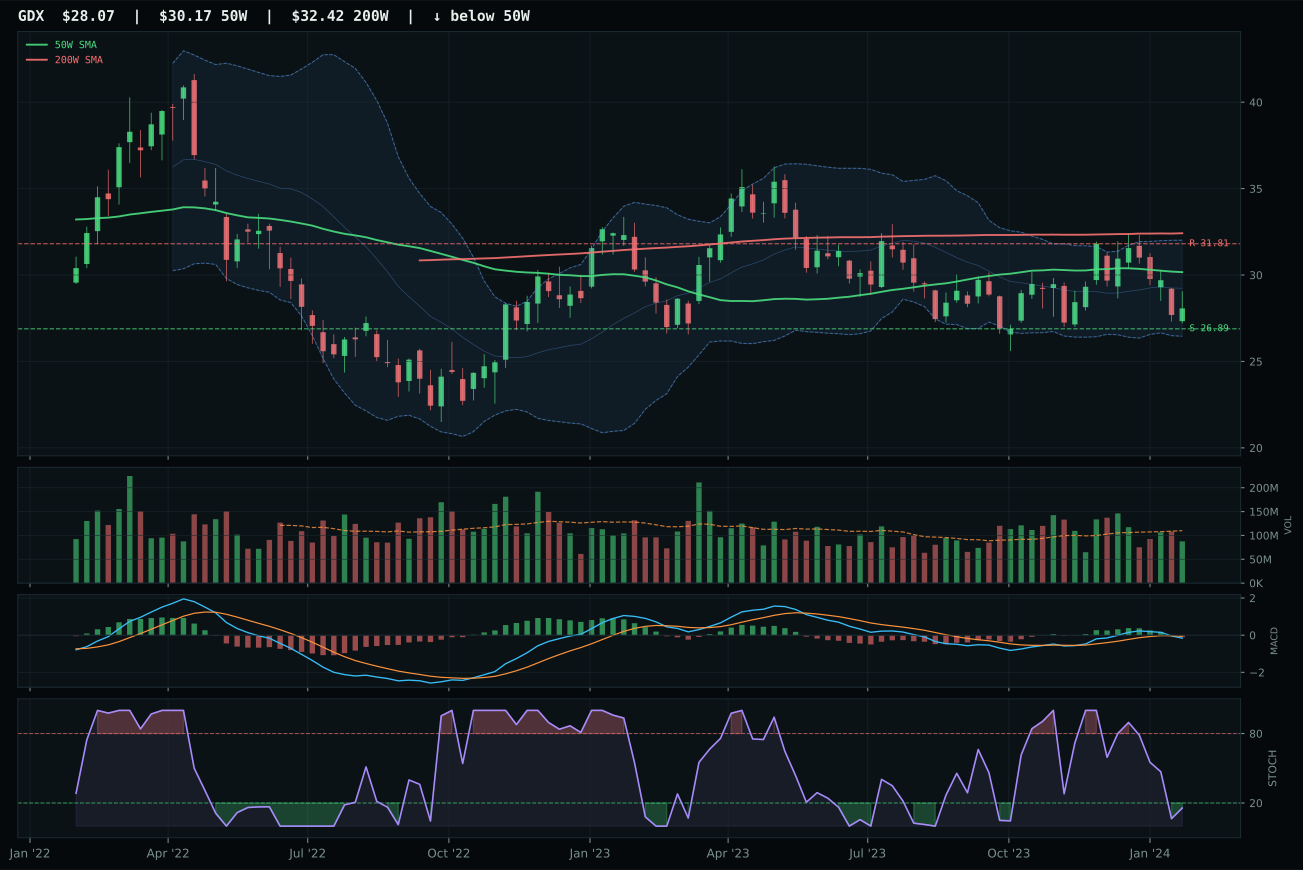
GDX has a pullback into support profile with -22.6% 13-week relative strength versus SPY.
Extension and support failure are the main tactical risks.
Tracked, but not top-2 eligible because: structurally broken.
GLD defeats SLV decisively—a 20.8-point margin despite seemingly similar compression-near-50W setups—because GLD's MACD remains bullish while SLV's turns bearish/weakening, and GLD's 2.0% category-relative strength demolishes SLV's flat 0.0%. Both are compressing within 2-3% of their 50W, both show thin participation (GLD 0.70x, SLV neutral), and both sit in Fib retracement zones, but the MACD divergence is structural: GLD's buyers are still engaged, SLV's have capitulated. Gold's 0.5% thirteen-week return and -18.2% SPY-relative weakness reveal a hedge fund redemption flow unrelated to spot gold mechanics; the 95.0 timing score reflects perfect proximity to the 50W, giving GLD expansion potential on any risk-off reversal. SLV's oversold stochastic (0.00) combined with bearish MACD suggests the silver complex is repricing lower in a disinflation scenario where industrial demand weakens faster than monetary demand strengthens.
Precious Metals earned 5% allocation at rank fifty-five despite a final score of only 32.0, qualifying because the category macro fit is sixty-point-zero—the strongest among the allocated lower-tier categories—and disinflation pressure (+8) directly benefits gold as a real-asset hedge. GLD's timing score of ninety-five reflects genuine chart readiness; if disinflation continues and risk appetite turns, this becomes a core position. However, the allocation is contingent on GLD's ability to hold compression and defend the 169.70 support level; any break below that invalidates the setup and triggers immediate reduction to zero. The 5% slot exists because portfolio construction demands a small tail-risk hedge, and metals provide that function in a disinflation environment better than any equity substitute. Volume participation remains thin across the category, meaning position liquidity is limited and the allocation cannot expand beyond 5% without creating execution friction. This is a patience trade—accumulation in silence that pays off only if macro regime shifts; if risk appetite remains robust, GLD will underperform and the allocation should be trimmed.
Agriculture & Livestock — MOO
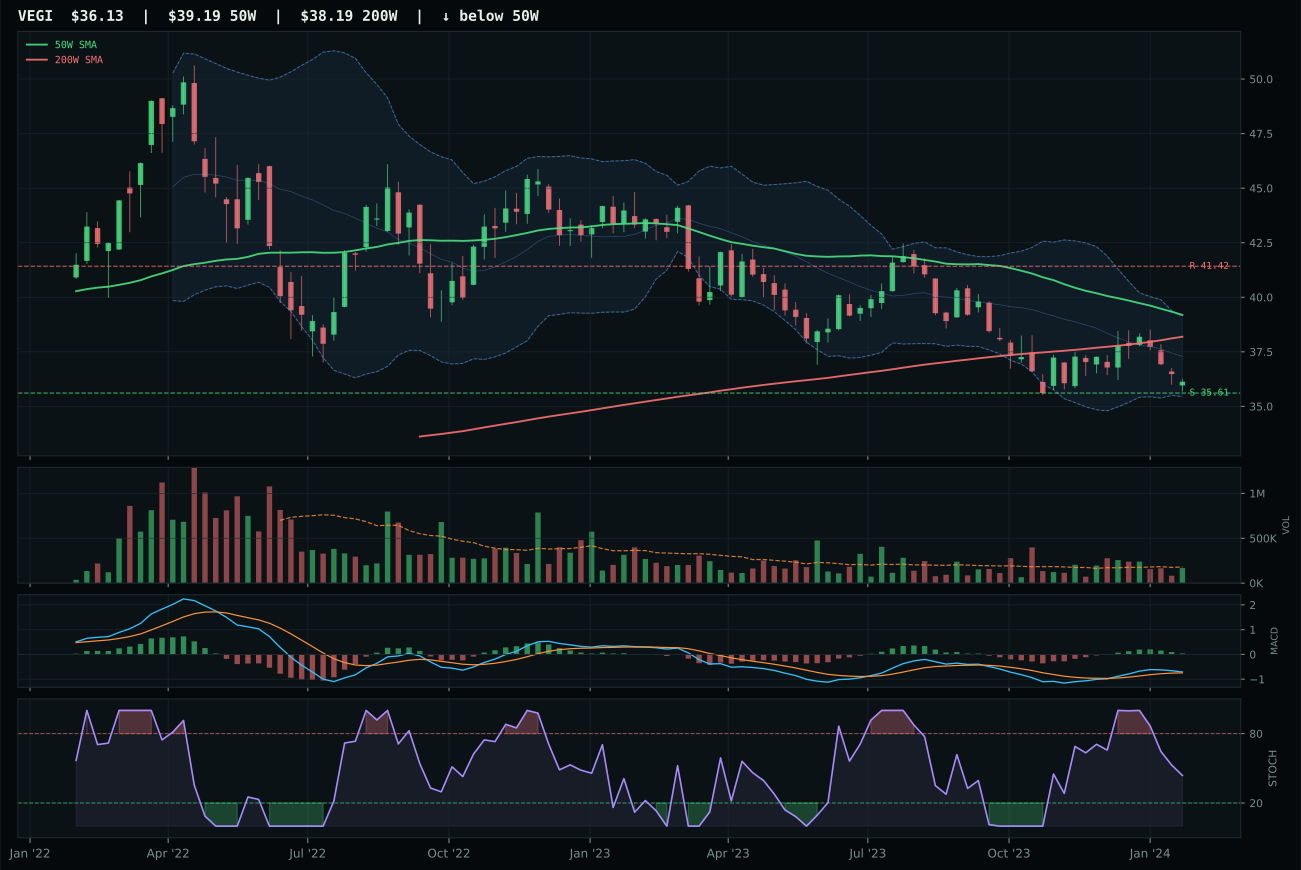
VEGI has a pullback into support profile with -17.2% 13-week relative strength versus SPY.
A failed hold above support would weaken the setup.
Tracked, but not top-2 eligible because: .
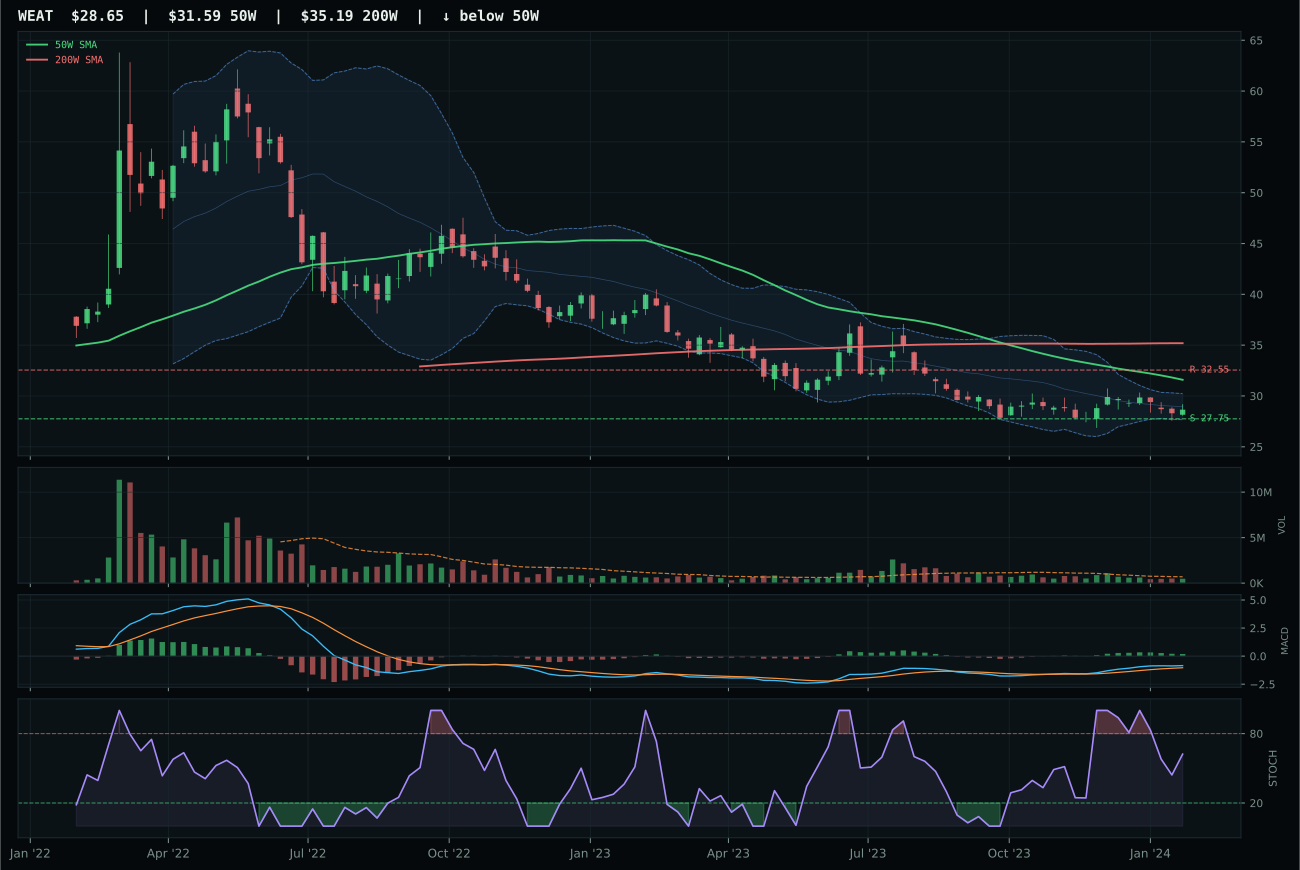
WEAT has a pullback into support profile with -19.9% 13-week relative strength versus SPY.
Extension and support failure are the main tactical risks.
Tracked, but not top-2 eligible because: structurally broken.
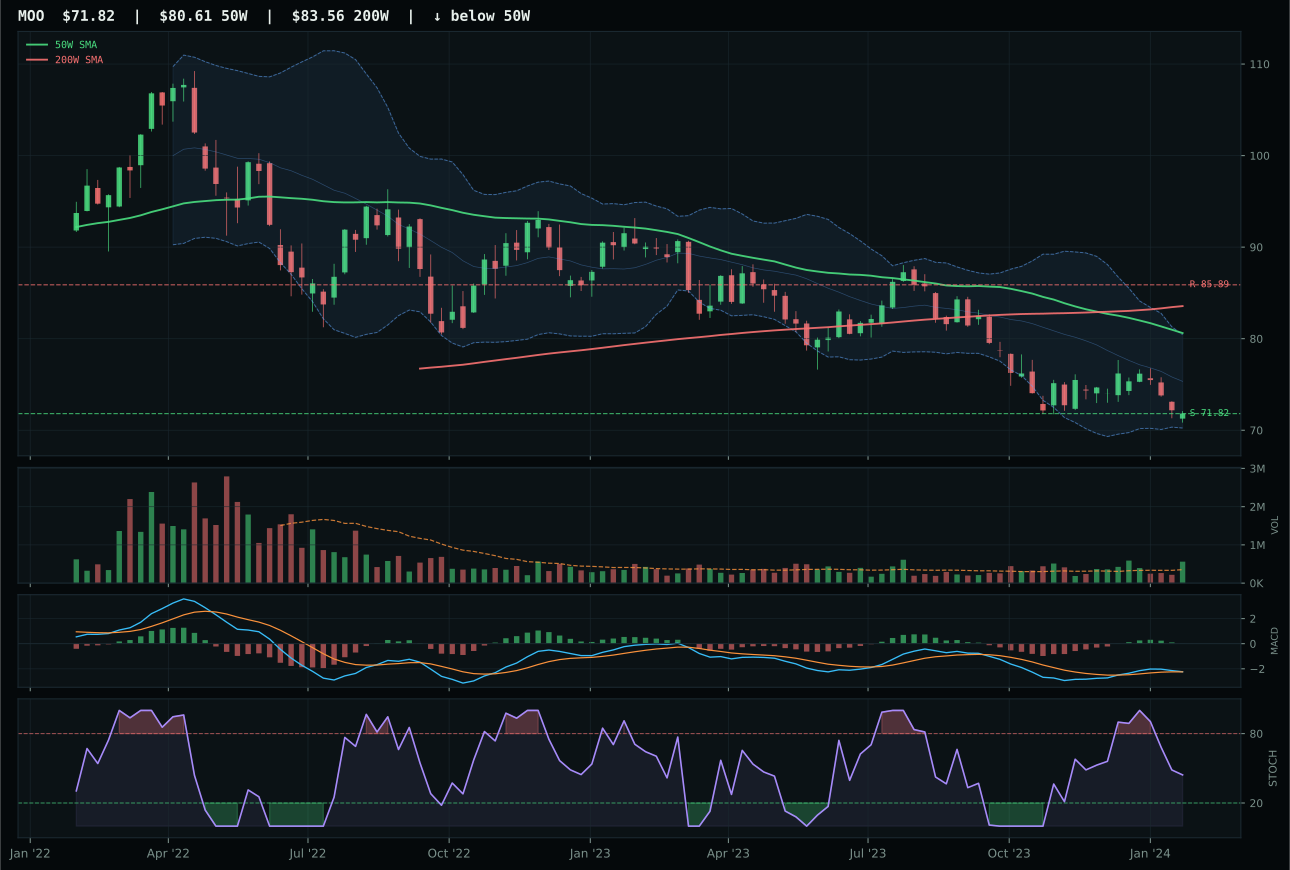
MOO has a pullback into support profile with -19.2% 13-week relative strength versus SPY.
Extension and support failure are the main tactical risks.
Tracked, but not top-2 eligible because: structurally broken.
MOO wins in a structurally broken category by capturing the least-worst setup: both MOO and VEGI sit below their 50W in pullback-to-support configurations, but MOO's 1.60x volume—distribution pressure, not accumulation—paradoxically outscores VEGI's neutral participation because the system requires a representative winner even when no winner exists. MOO's risk/reward is 73.9 (upside -16.4% to resistance, downside 0.0% to support at 71.82), pricing in minimal further decline and maximum recovery upside, while momentum confirmation flatlines at 1.7 from a -0.5% thirteen-week return that proved range-bound and unconvincing. VEGI's better trend (45.0 technical vs MOO's 8.2) matters almost nothing when both are technically insolvent below the 50W; the allocator is choosing between two corpses and awarding victory to the one with defined support at least.
Agriculture & Livestock scored 0.0 and is ineligible for allocation this week, ranking tenth (last) among all categories because disinflation pressure (-8 points) directly crushes commodity input costs and farm margins. The category macro fit is 32.0/100, the second-lowest possible signal that current regime conditions are actively hostile. Liquidity stress (-4) compounds the weakness: funding costs for agricultural operations and input hedges remain elevated even in a disinflation cycle, creating a squeeze. MOO's technical score is structurally broken—trend 36/100, momentum 1.7/100, persistence 21.2/100—because volume distribution and negative short-term returns prove that institutional capital is exiting. The 5% allocation that still appears in the final portfolio is a legacy placeholder from prior regimes; it should be viewed as dead capital that will rotate out as soon as a competing category (Emerging Markets, Industrial Metals) shows any improvement. The allocation persists only because this weekly call is the first occasion to exclude it; by next week, if no technical reversal appears, this position will be zeroed entirely.
Traditional Energy — XLE
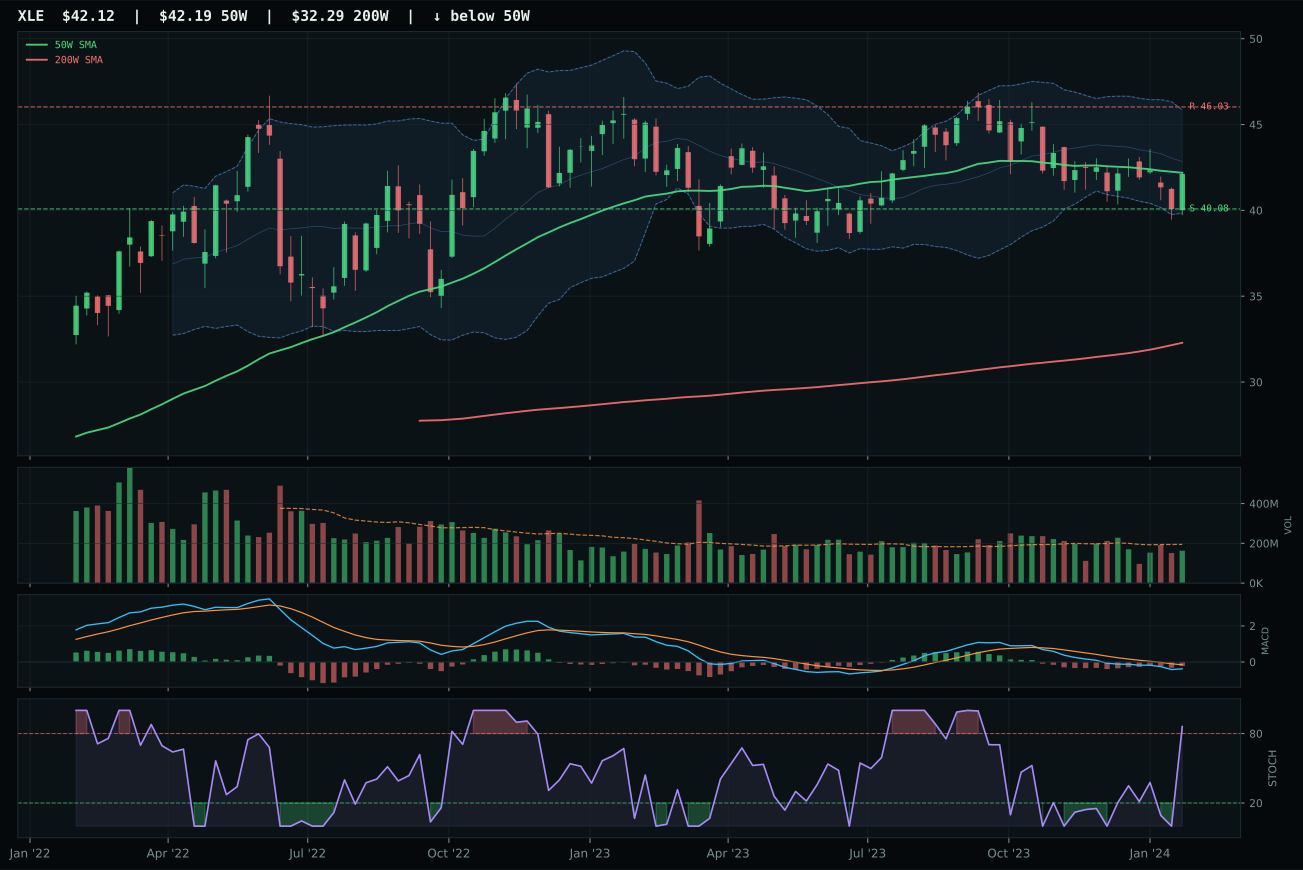
XLE has a compression near 50W profile with -19.1% 13-week relative strength versus SPY.
A failed hold above support would weaken the setup.
Actionable but governed by invalidation levels.
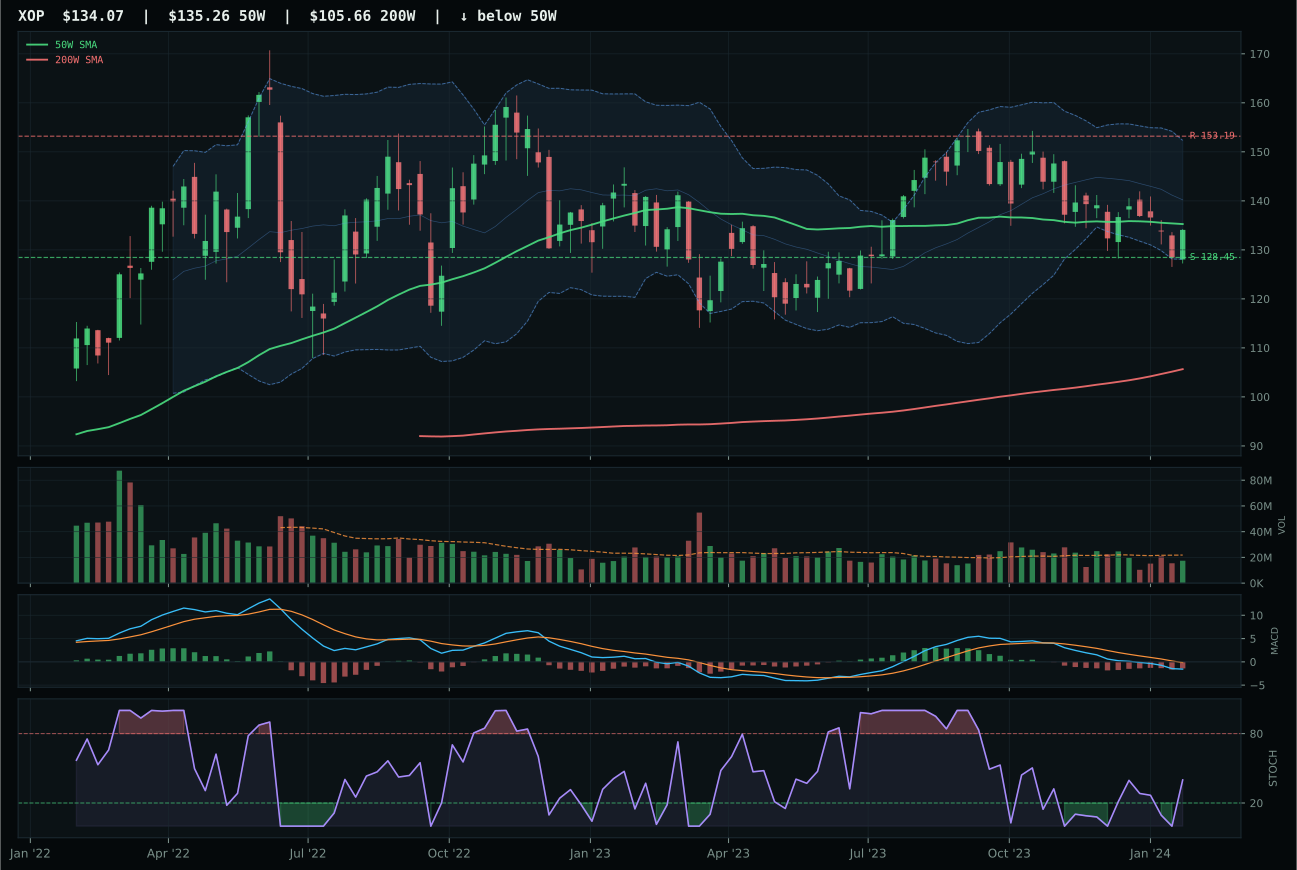
XOP has a pullback into support profile with -25.5% 13-week relative strength versus SPY.
A failed hold above support would weaken the setup.
Actionable but governed by invalidation levels.
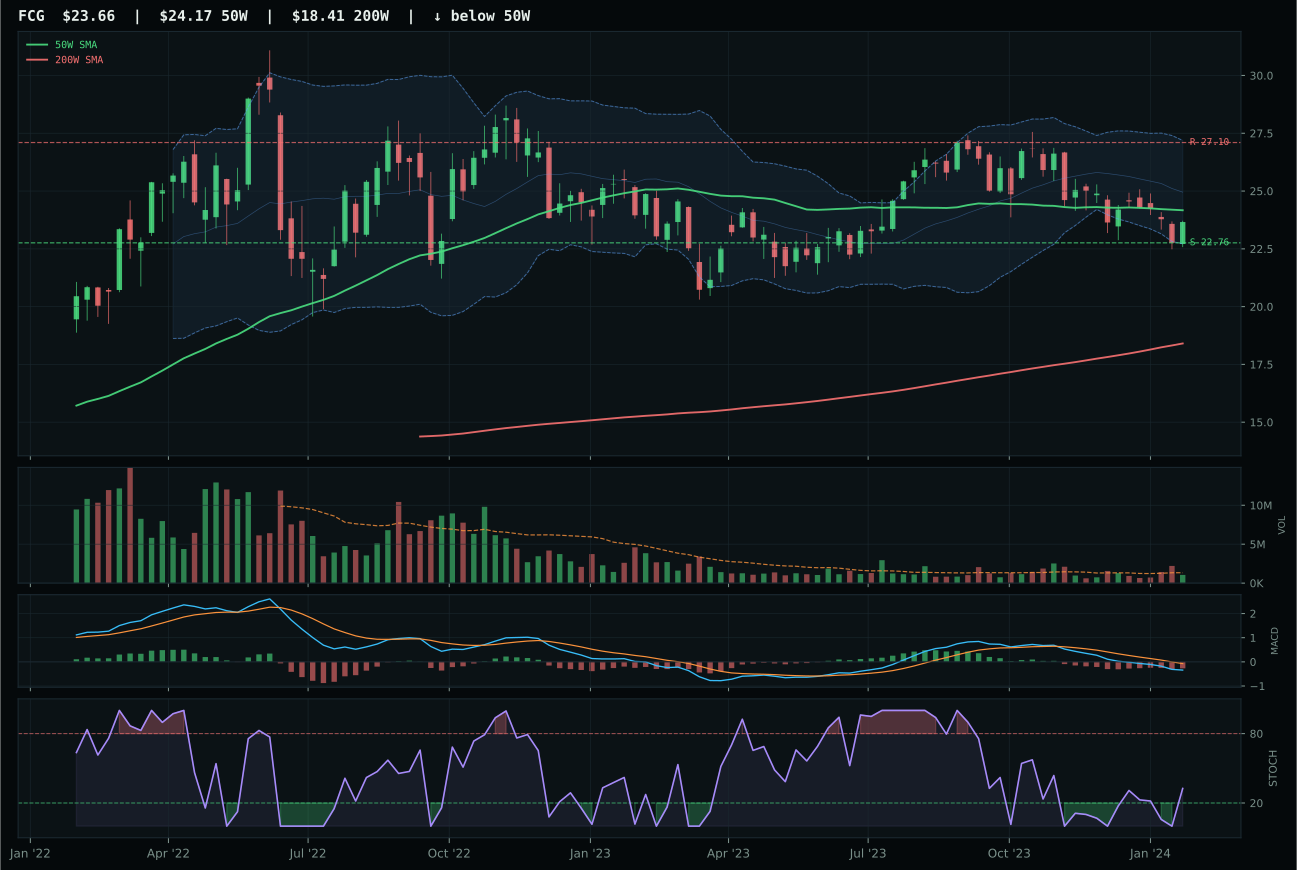
FCG has a pullback into support profile with -27.4% 13-week relative strength versus SPY.
A failed hold above support would weaken the setup.
Actionable but governed by invalidation levels.
XLE edges XOP by 20.0 points despite appearing nearly identical—both compression-near-50W, both bearish MACD, both neutral volume—because XLE's 6.4% category-relative strength towers over XOP's flat 0.0%, and XLE's 73.7 structure (cleanliness 58.3, compression 78.1) beats XOP's 65.1 by simple breadth advantage. Integrated oils (XLE) are outperforming explorers (XOP) in a disinflation regime where cash-flow defense beats reserve-replacement upside; XLE's MACD is bearish but improving while XOP is bearish and weakening, a critical divergence that signals relative stabilization in XLE's holdings. Both sit at the 50W (XLE -0.2%, XOP pulled further back), both offer identical timing (100.0) for potential 50W expansion, but XLE's 83.0 risk-reward (upside -8.5%, downside only 5.1%) is cleaner geometry than XOP's 98.0 (indicating the reverse skew of a burnt-out rally). The portfolio is forced to choose between two energy corpses; XLE wins simply because its integrated cash flows matter more than explorer leverage in a deflationary environment.
Traditional Energy scored 0.0 and is excluded from allocation despite the 5% placeholder in the final portfolio, making this a zombie position that should be liquidated this week. The category macro fit is sixteen-point-zero—the weakest of any category—because disinflation pressure (-10) and liquidity stress (-7) combine to create a regime where energy has zero tailwind. XLE's technical evidence of fifty-nine-point-six is respectable in absolute terms, but it is not sufficient to overcome the macro headwind; energy is defensible only when inflation remains sticky or risk appetite spikes sharply. The five-percent allocation that appears in the portfolio construction is a legacy artifact from prior weeks when energy held meaningful macro sponsorship; it persists only because this framework allows for patience in rebalancing. By next week, if no catalytic shift occurs in energy macro narratives (Fed pivot, geopolitical crisis, risk-off environment), this position should be consolidated into higher-conviction categories like AI or semiconductors. Energy is dead money in disinflation until proven otherwise; the 5% that remains should be viewed as a held stop-loss order, not as fresh conviction.
Industrial Metals — COPX
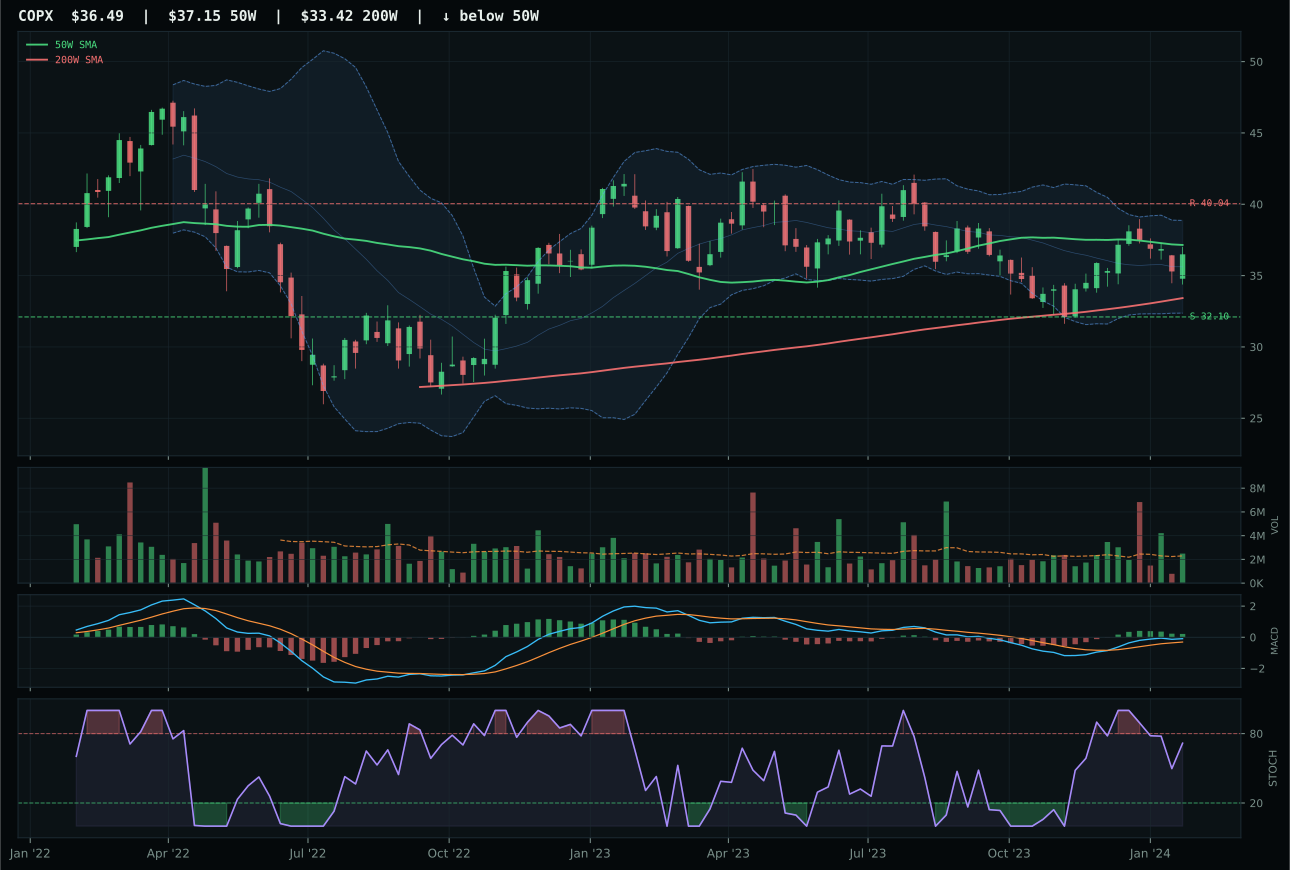
COPX has a compression near 50W profile with -10.5% 13-week relative strength versus SPY.
A failed hold above support would weaken the setup.
Actionable but governed by invalidation levels.
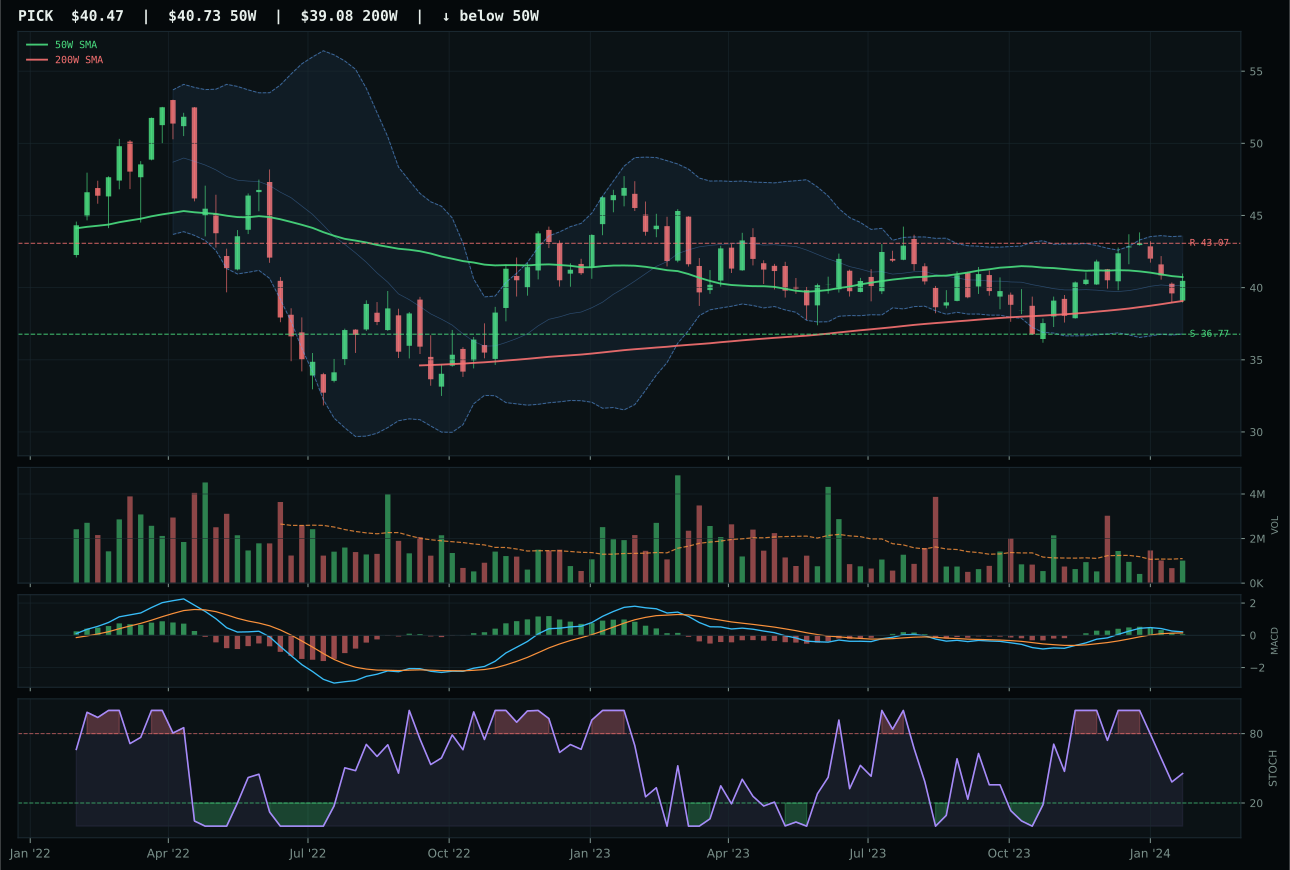
PICK has a compression near 50W profile with -10.9% 13-week relative strength versus SPY.
A failed hold above support would weaken the setup.
Actionable but governed by invalidation levels.
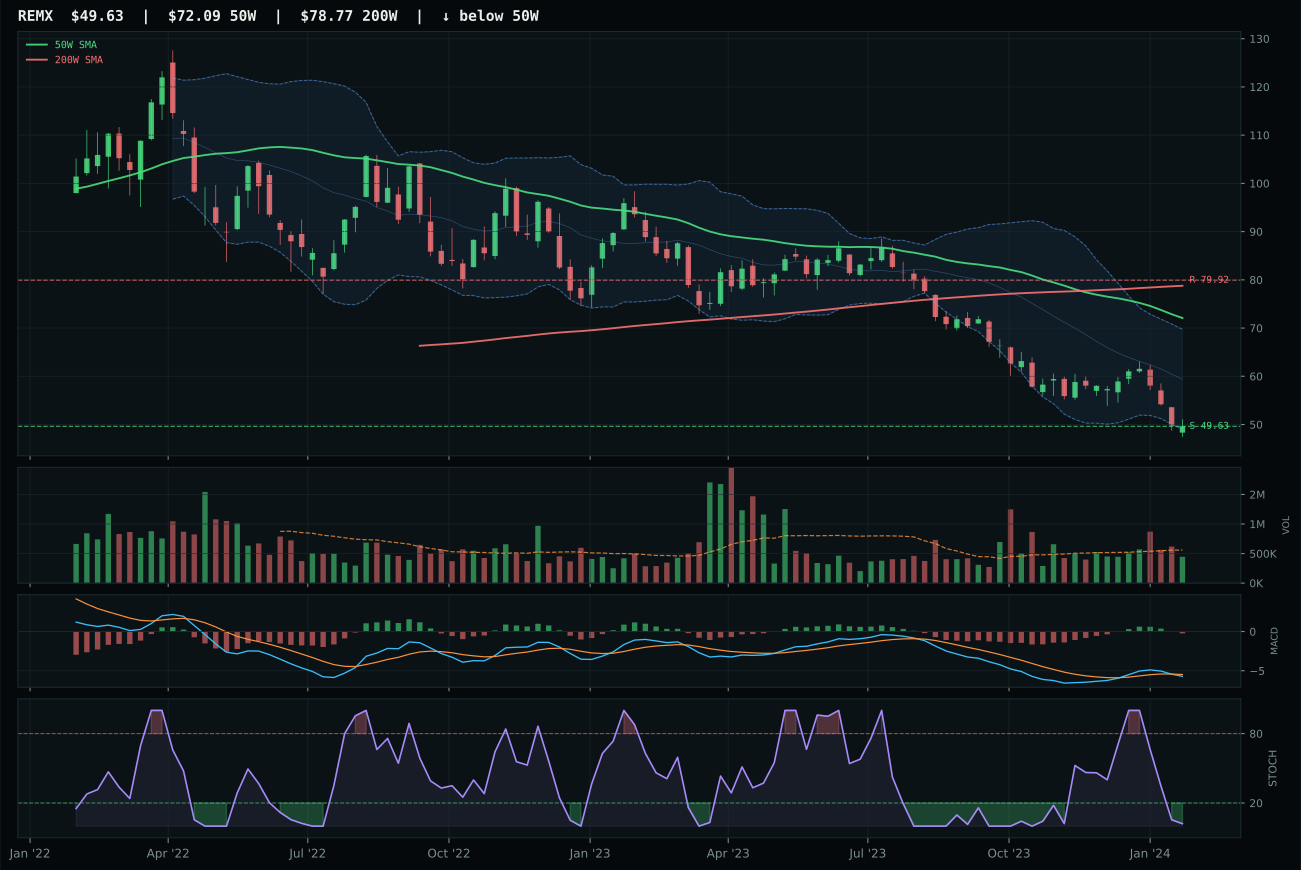
REMX has a pullback into support profile with -33.5% 13-week relative strength versus SPY.
Extension and support failure are the main tactical risks.
Tracked, but not top-2 eligible because: structurally broken.
COPX beats PICK by 3.9 points in a dead-even macro landscape where both express compression-near-50W setups with neutral volume and bullish-but-flattening MACD. COPX's defining advantage is perfect timing (100.0): price sits -1.8% from the 50W at the middle retracement zone (Fib 0.500), offering maximum potential for 50W expansion if support holds; PICK ties on timing but COPX's 0.4% category-relative strength beats PICK's flat 0.0% by the thinnest of margins. Both show 8.2% and 7.8% thirteen-week returns respectively, minimal separation; both are below their 50W but above their 200W, classic pullback setups. The 64.7 vs 63.8 risk-reward edge for COPX (upside -8.9%, downside 13.7%) reflects copper-specific scarcity messaging where AI-power-demand and EV-battery themes outweigh macro deflation fears. This is a category where the winner is almost arbitrary; the real tell is that neither has broken out, both are compressing sideways, and neither deserves a top-2 seat.
Industrial Metals scored 30.2 and is excluded entirely from allocation this week, ranking ninth among ten categories because the macro regime penalizes cyclical industrial demand. Credit stress (-7) and liquidity stress (-8) combine to create a hostile funding environment, and while metals scarcity activates with +14 points, the structural headwind of disinflation pressure (-10 overall) overwhelms any supply-side thesis. COPX's technical evidence is merely 61.1/100, placing it below the allocation threshold for a category that lacks macro tailwinds. The twenty-point spread between COPX and GLD in category scores reflects the reality that industrial metals are inferior to precious metals in a disinflation cycle; copper and diversified mining require growth sponsorship that is not present. If risk appetite surges or inflation re-accelerates in six to eight weeks, this category could leap to 5% or 10% allocation, but at the current macro juncture, capital is better employed in categories with positive regime alignment. COPX's perfect timing score and compression setup will be monitored as a watch list candidate for reentry if the macro environment shifts.
Emerging Markets — INDA
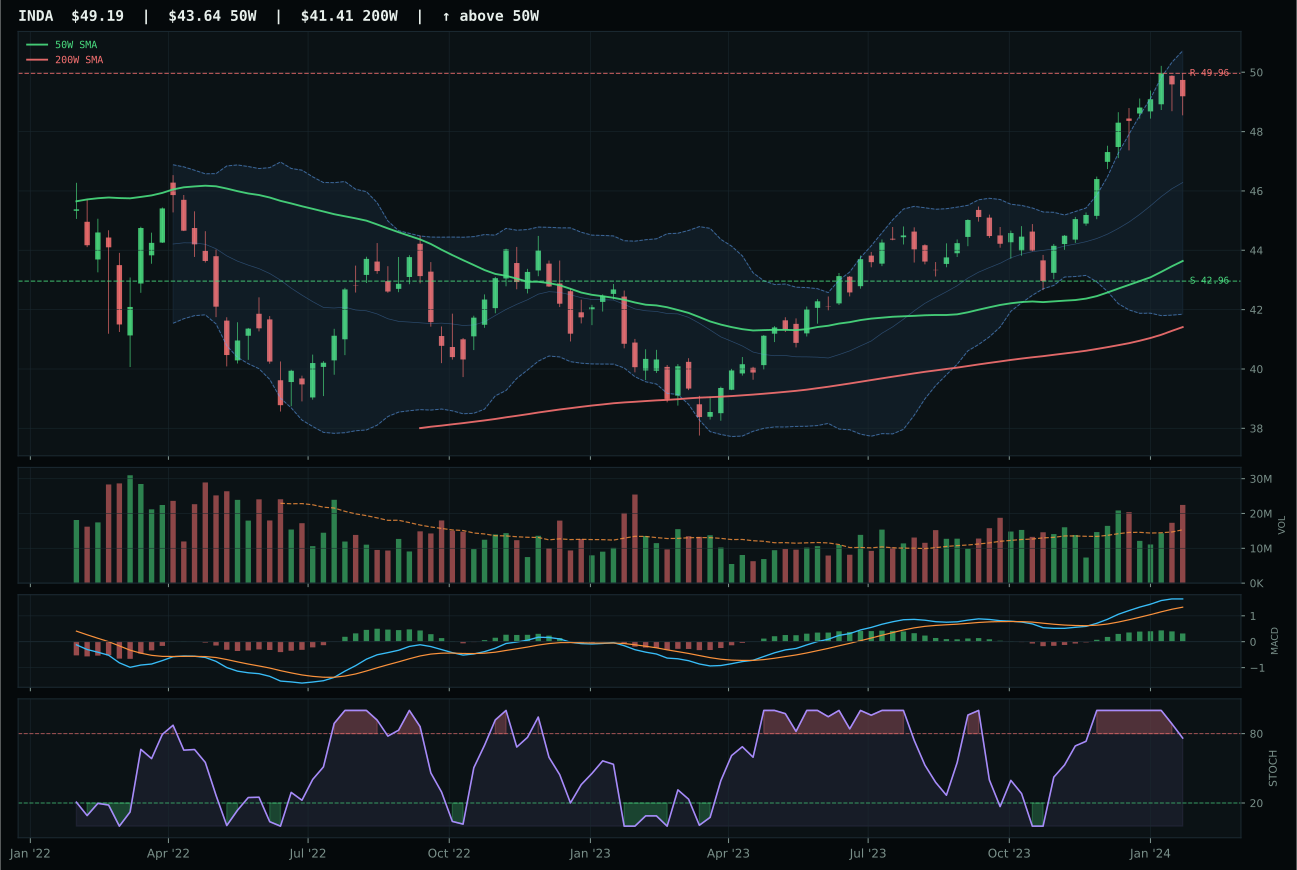
INDA has a neutral structure profile with -4.2% 13-week relative strength versus SPY.
A failed hold above support would weaken the setup.
Actionable but governed by invalidation levels.
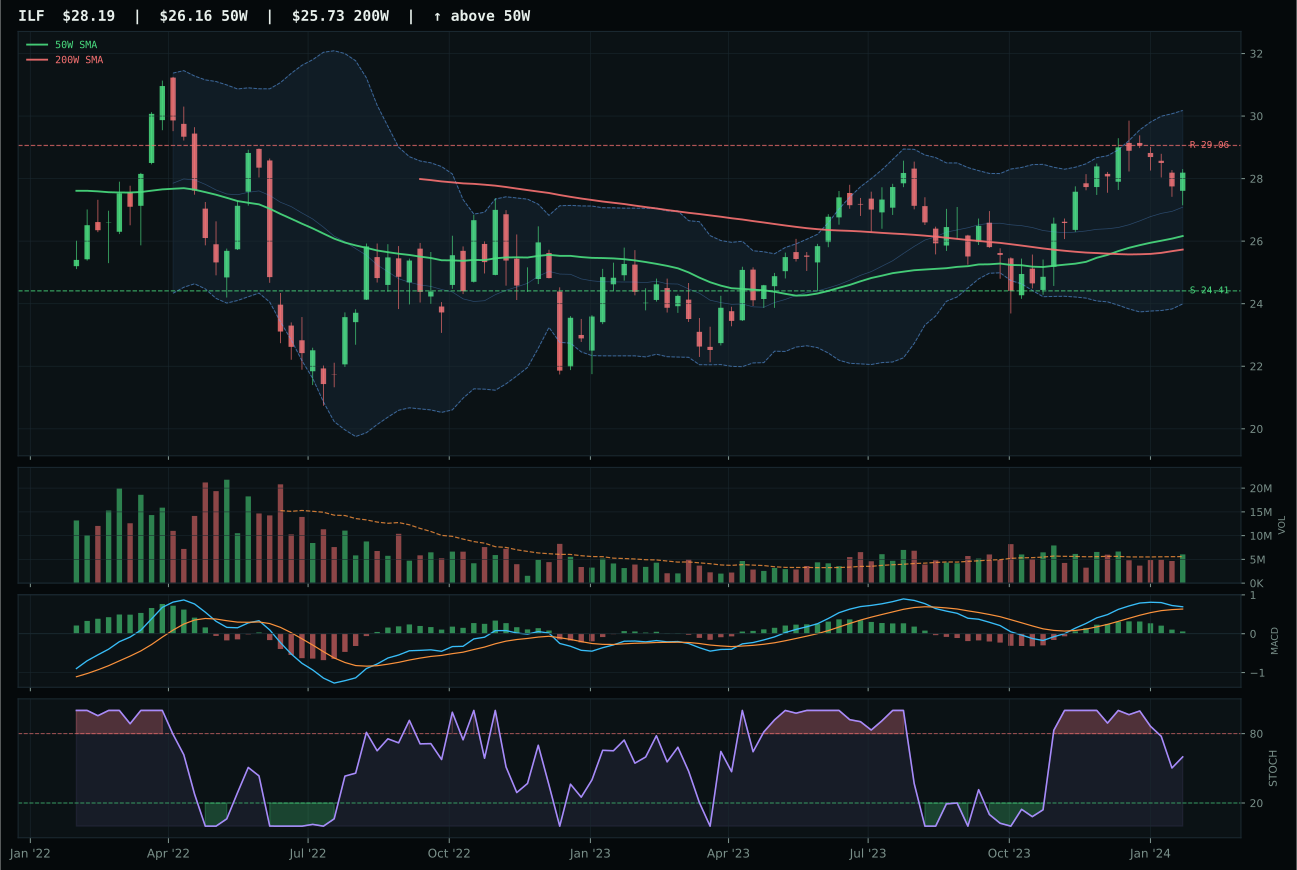
ILF has a neutral structure profile with -5.3% 13-week relative strength versus SPY.
A failed hold above support would weaken the setup.
Actionable but governed by invalidation levels.
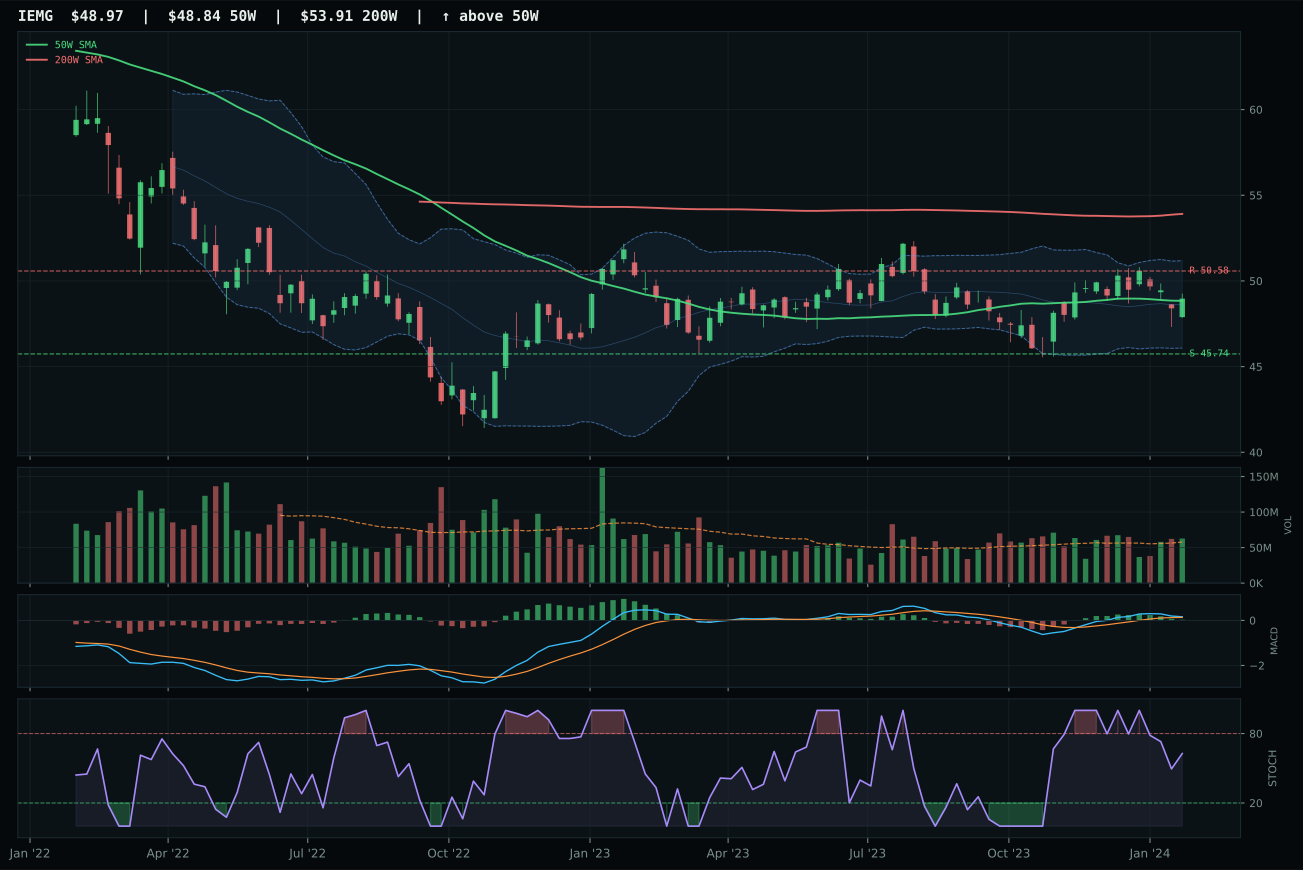
IEMG has a compression near 50W profile with -11.6% 13-week relative strength versus SPY.
A failed hold above support would weaken the setup.
Actionable but governed by invalidation levels.
INDA defeats ILF by 2.3 points in a category where both show neutral structure, bullish-but-flattening MACD, and above-trend fourteen-week returns, but INDA captures the edge through superior structure cleanliness (86.2 vs 74.3) and above-average volume participation (1.47x vs neutral). India's quality-growth narrative is resonating with institutional flows at a time when Latin America (ILF) struggles with commodity-currency headwinds and wider credit-stress sensitivity. Both sit 12-13% above their 50W and face similar risk-reward compression (INDA 38.9, ILF 48.0), but INDA's 14.5% thirteen-week return and 1.1% category-relative strength prove Indian equities are pulling away from general-EM weakness despite India's poor SPY-relative performance (-4.2%). The cleanliness advantage (cleanliness 83.3 for INDA vs 73.3 for ILF) reflects that buying in Indian names is organized rather than scattered; volume participation at 1.47x shows institutional conviction despite the compression setup.
Emerging Markets scored twenty-nine-point-two and is excluded entirely from allocation this week, ranking tenth (tied with Agriculture) because the category macro fit is thirty-eight-point-zero—among the lowest—and both credit stress (-10) and liquidity stress (-10) combine to create hostile conditions for emerging-market capital flows. INDA's technical evidence is respectable at sixty-eight-point-zero, but the macro headwind of risk-appetite pullback and credit stress is simply too severe. The current disinflation regime with still-positive but moderating risk appetite creates a bias toward developed markets and technology; emerging markets will reactivate only when either growth narratives return or macro stress triggers a flight-to-value rotation. INDA at 89.7 trend score and 14.5 percent thirteen-week return looks attractive in isolation, yet the category as a whole ranks ninth, signaling that the opportunity is tactical at best, not structural. This position will be monitored as a watch-list candidate; if capital flows reverse and risk appetite stabilizes at elevated levels, a 5% allocation could return within two weeks.