
2024-01-19
Informational purposes only. The content in this report, including allocations, analysis, and commentary, is provided solely for informational and educational purposes. It does not constitute financial advice, investment advice, trading advice, or any other type of advice. Past performance does not guarantee future results. Always conduct your own research and consult a qualified financial professional before making investment decisions.
Weekly Allocation
| Ticker | Category | Weight | Role |
|---|---|---|---|
| FBTC | 50% | Overlay | |
| SMH | AI | 10% | Top-2 (10%) |
| XLK | Technology | 10% | Top-2 (10%) |
| URNM | Nuclear Energy | 5% | Tier-2 (5%) |
| ITA | Defense & Aerospace | 5% | Tier-2 (5%) |
| PAVE | Utilities & Infrastructure | 5% | Tier-2 (5%) |
| MOO | Agriculture & Livestock | 5% | Tier-2 (5%) |
| GLD | Precious Metals | 5% | Tier-2 (5%) |
| COPX | Industrial Metals | 5% | Tier-2 (5%) |
Trade Instructions — Monday Open
Sell the tranche from 2023-12-22 (completing its 4-week hold). Buy the new tranche. Instructions show net portfolio changes — same-asset positions cancel, weight changes show the delta.
| Action | Ticker | Instruction |
|---|---|---|
| SELL | BOTZ | Sell 50% of BOTZ position (reduce 5.00% → 2.50%) |
| SELL | CIBR | Sell 29% of CIBR position (reduce 8.75% → 6.25%) |
| SELL | GDX | Sell entire GDX position (1.25% of portfolio) |
| SELL | XAR | Sell 50% of XAR position (reduce 2.50% → 1.25%) |
| SELL | INDA | Sell 25% of INDA position (reduce 5.00% → 3.75%) |
| SELL | URA | Sell entire URA position (1.25% of portfolio) |
| BUY | SMH | Buy SMH — 25.00% of freed cash (adds 2.50% to portfolio) |
| BUY | GLD | Buy GLD — 12.50% of freed cash (adds 1.25% to portfolio) |
| BUY | ITA | Buy ITA — 12.50% of freed cash (adds 1.25% to portfolio) |
| BUY | URNM | Buy URNM — 12.50% of freed cash (adds 1.25% to portfolio) |
| BUY | MOO | Buy MOO — 12.50% of freed cash (adds 1.25% to portfolio) |
| BUY | XLK | Buy XLK — 25.00% of freed cash (adds 2.50% to portfolio) |
Current Portfolio After Trade
Combined holdings across all 4 active tranches. Each tranche is 25% of the portfolio.
| Ticker | % of Portfolio | Weight Bar |
|---|---|---|
| FBTC | 50.00% | |
| PAVE | 6.25% | |
| SMH | 6.25% | |
| GLD | 6.25% | |
| CIBR | 6.25% | |
| URNM | 5.00% | |
| INDA | 3.75% | |
| ITA | 3.75% | |
| MOO | 3.75% | |
| BOTZ | 2.50% | |
| COPX | 2.50% | |
| XLK | 2.50% | |
| XAR | 1.25% |
Macro Regime — Disinflation
Macro Evidence Charts
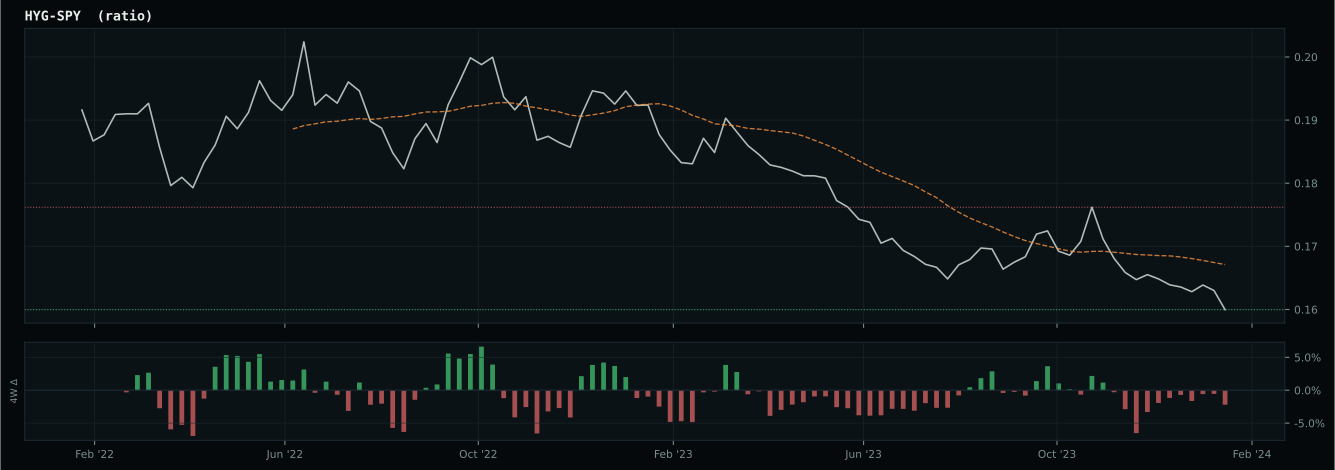
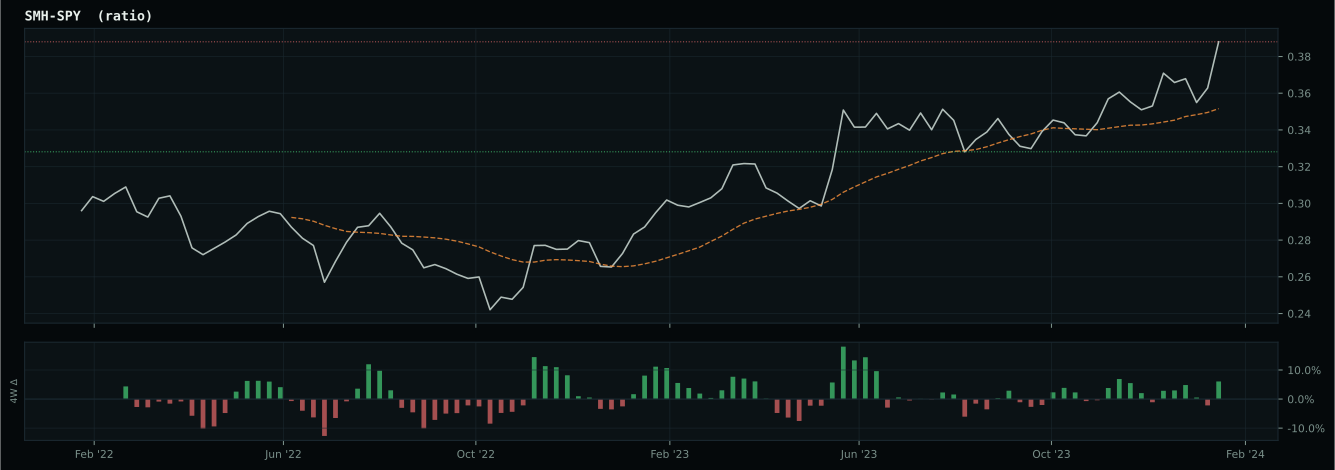
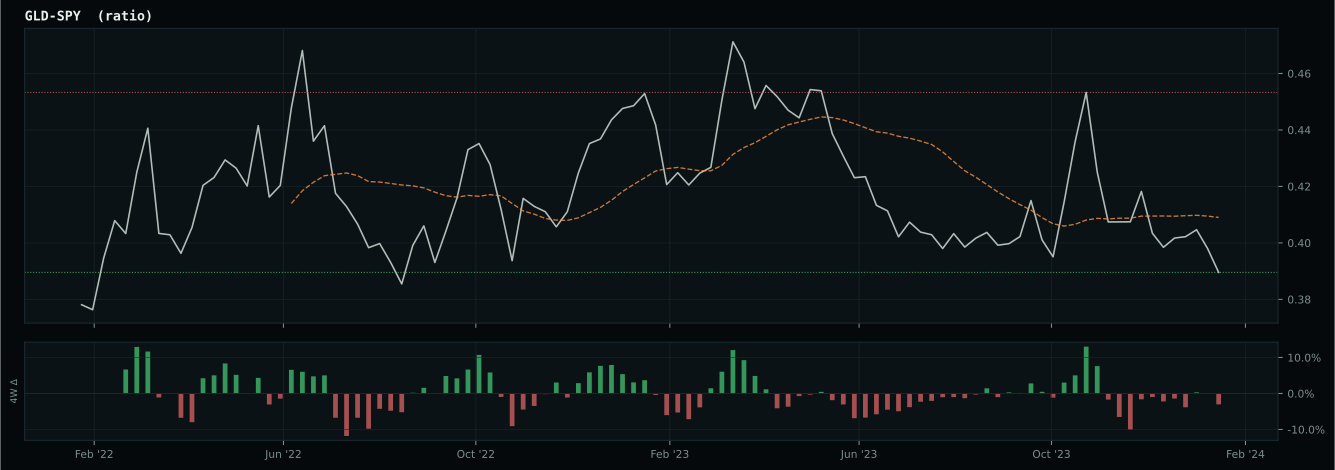
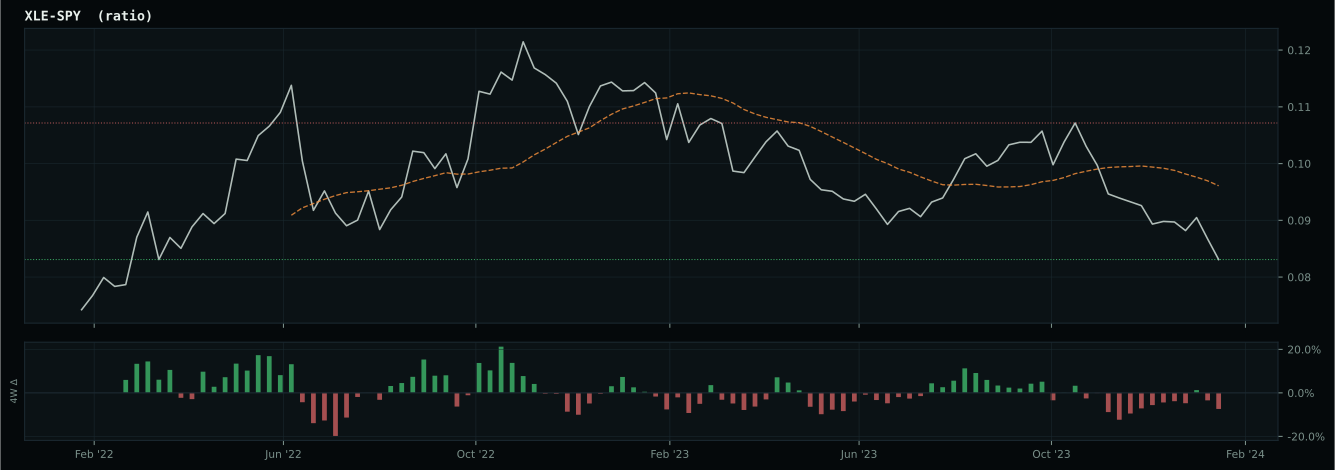
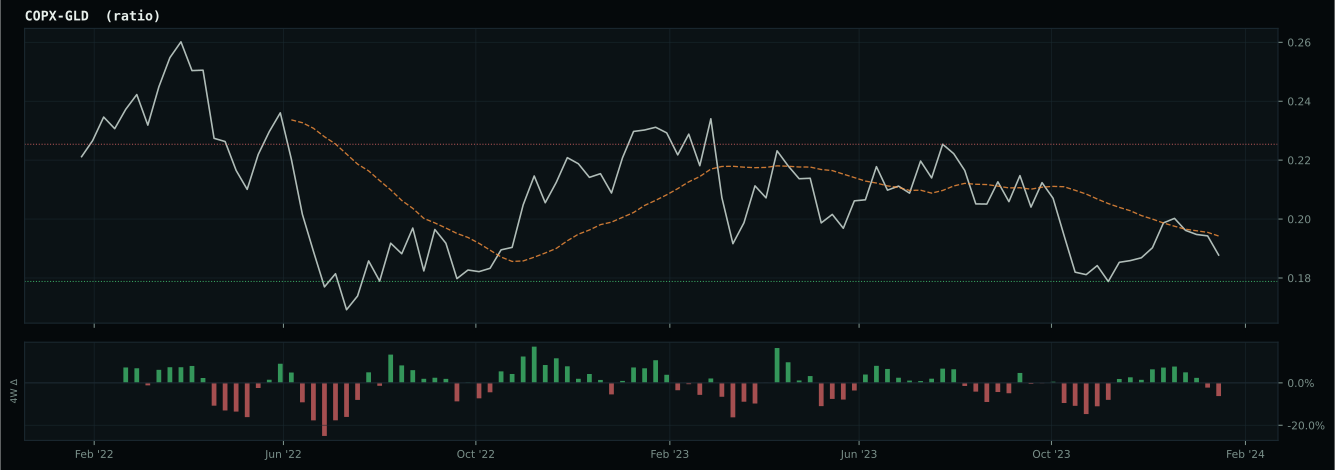
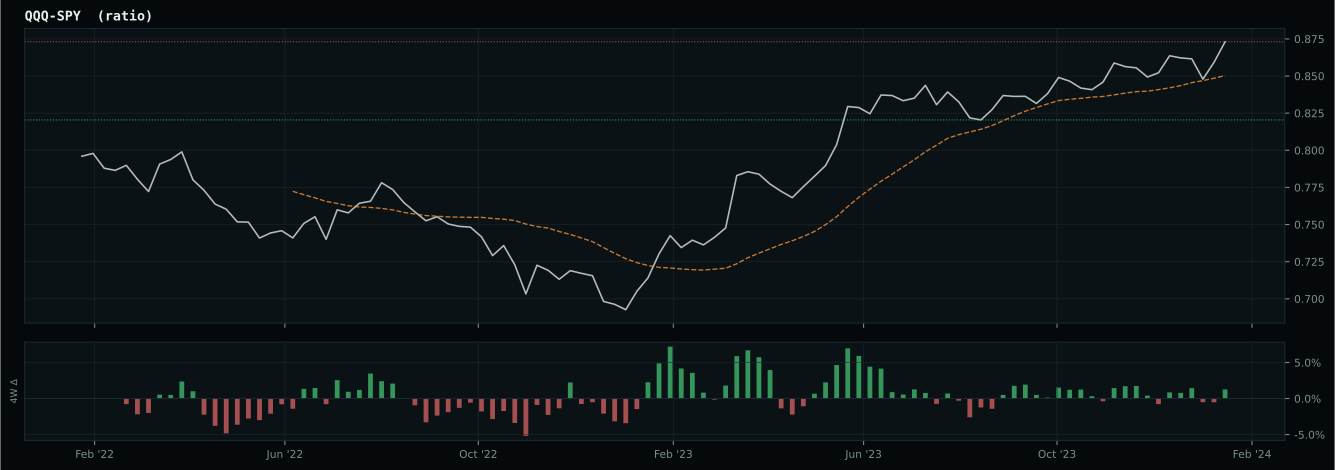
Market-implied signals behind the macro regime scores. Each ratio compares two assets; the direction and slope of the ratio is what the macro engine reads.
Crypto Regime — TrendBTC
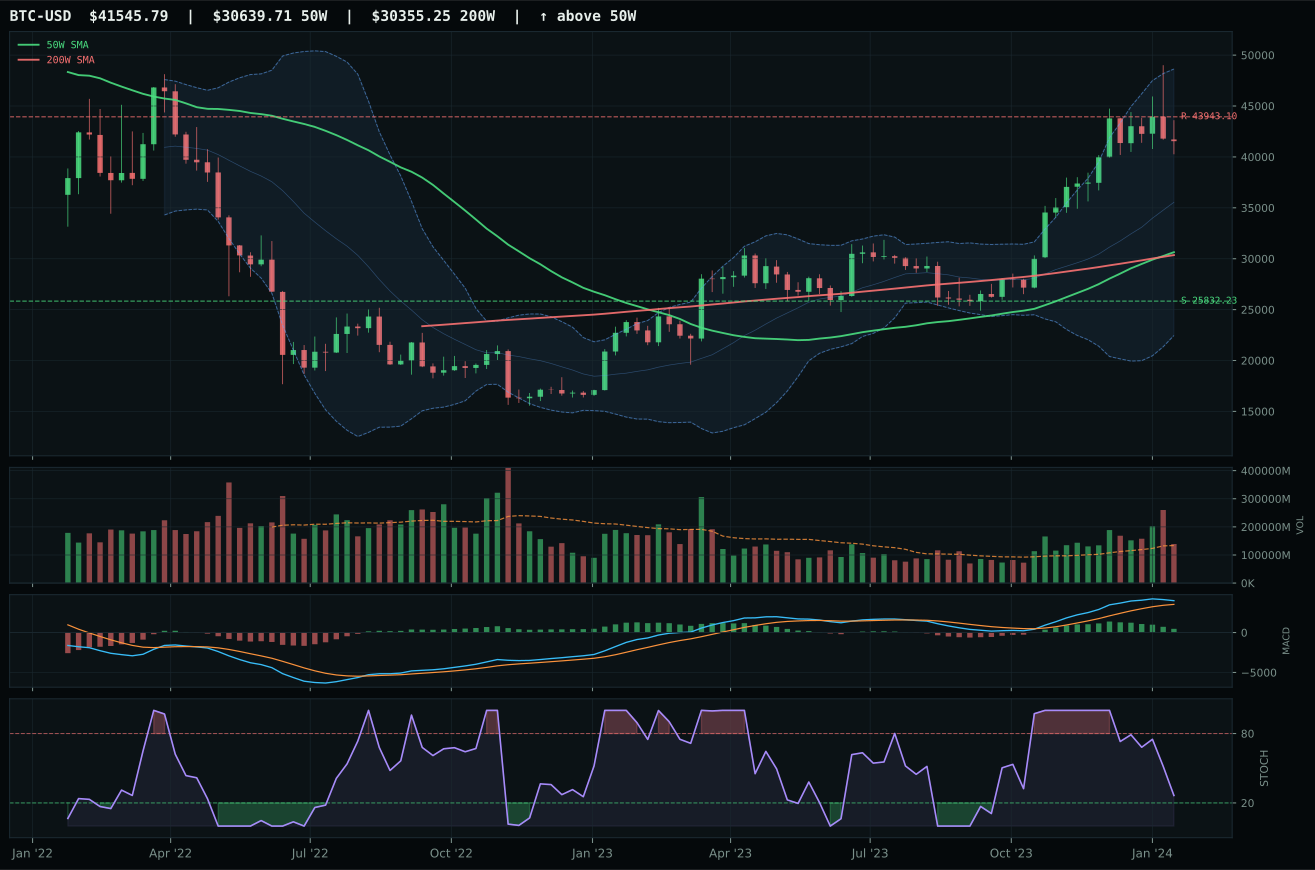
post-touch structure is too wide to count as a range; max/min close ratio is 2.67
TrendBTC confirmed: 2 consecutive closes above rising/flat 50W SMA
one or more available conditions failed
Category Rankings
| Rank | Category | Winner | Score | Alloc | 4W Ret | Peers (4W) |
|---|---|---|---|---|---|---|
| 1 | AI | SMH | 66.3 | 20% | +6.07% | BOTZ +3.8% · AIQ +3.2% |
| 2 | Technology | XLK | 54.1 | 20% | +0.11% | CIBR +2.4% · IGV +0.4% |
| 3 | Nuclear Energy | URNM | 50.2 | 10% | -4.72% | URA -4.3% · NLR -2.5% |
| 4 | Defense & Aerospace | ITA | 50.1 | 10% | +2.90% | XAR +3.8% · ROKT +2.8% |
| 5 | Utilities & Infrastructure | PAVE | 47.8 | 10% | +6.23% | IGF -0.4% · XLU +0.3% |
| 6 | Precious Metals | GLD | 31.5 | 10% | +0.39% | SLV +5.2% · GDX -0.5% |
| 7 | Industrial Metals | COPX | 29.9 | 10% | +4.26% | PICK +2.0% · REMX +2.2% |
| 8 | Emerging Markets | INDA | 24.9 | 10% | +3.76% | ILF +3.8% · IEMG +5.8% |
| 9 | Agriculture & Livestock | MOO | — | 0% | +0.32% | VEGI -0.2% · WEAT -6.4% |
| 10 | Traditional Energy | XLE | — | 0% | +7.08% | XOP +7.5% · FCG +6.0% |
AI — SMH
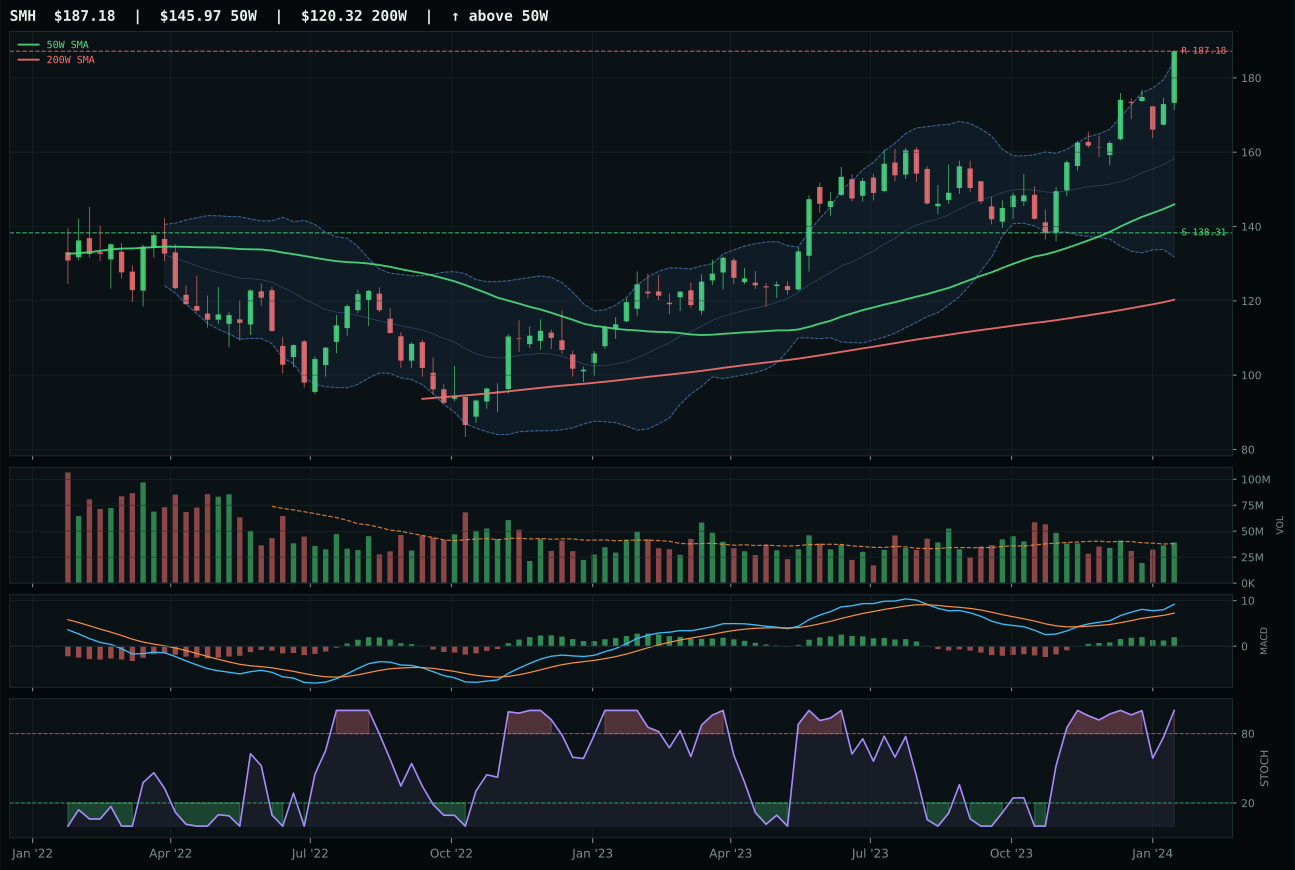
SMH has a vertical extension profile with 17.2% 13-week relative strength versus SPY.
A failed hold above support would weaken the setup.
Actionable but governed by invalidation levels.
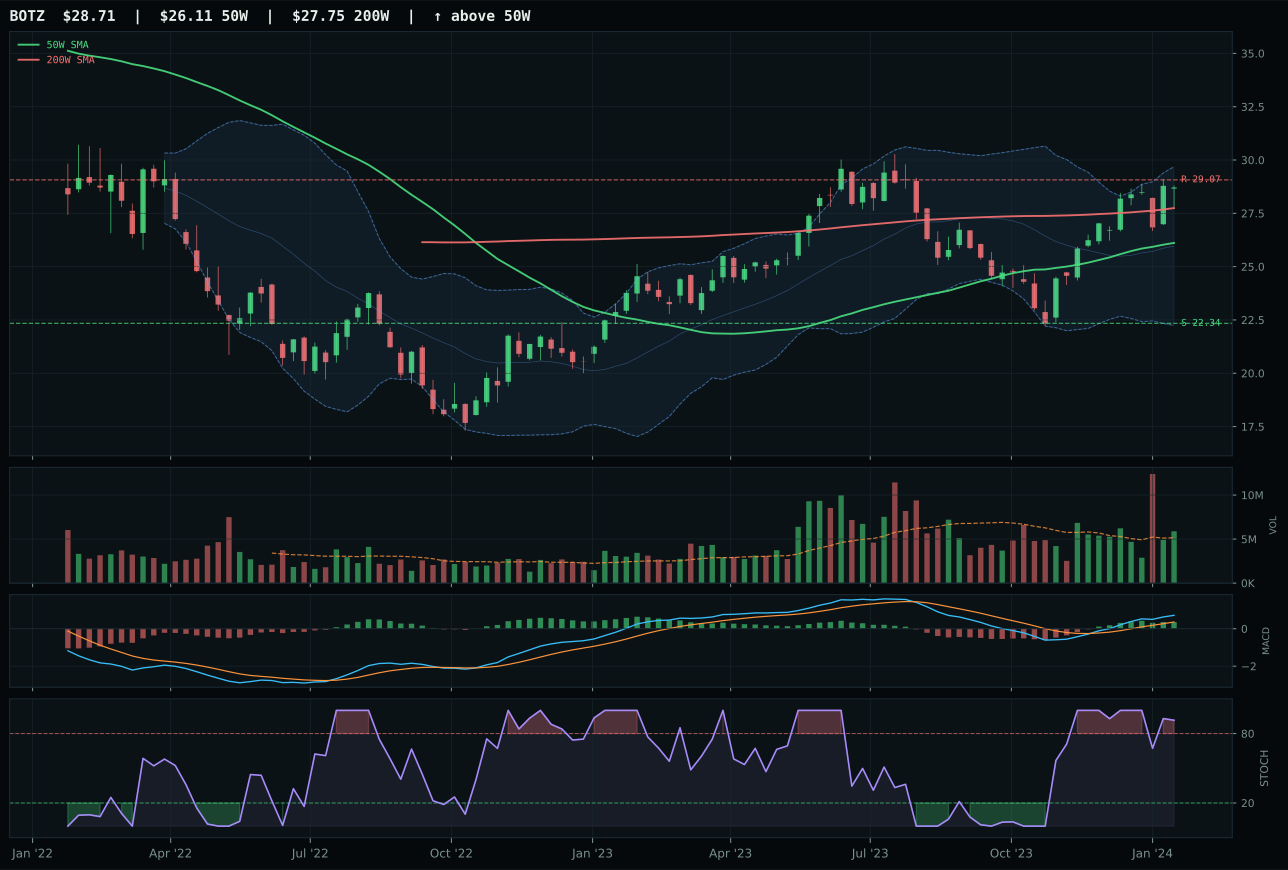
BOTZ has a neutral structure profile with 10.0% 13-week relative strength versus SPY.
A failed hold above support would weaken the setup.
Actionable but governed by invalidation levels.
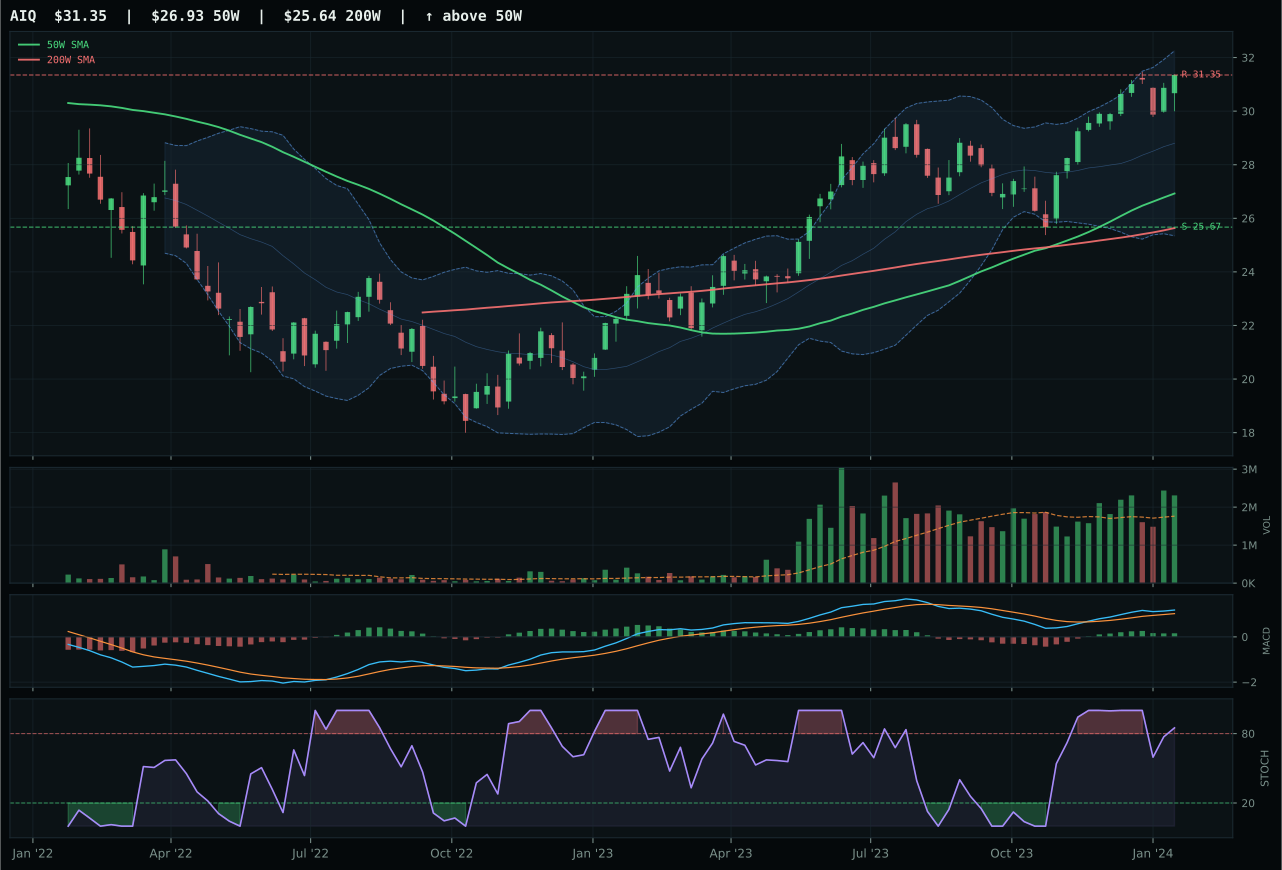
AIQ has a vertical extension profile with 4.8% 13-week relative strength versus SPY.
A failed hold above support would weaken the setup.
Actionable but governed by invalidation levels.
AI secures 10% allocation as the second top-2 category at a 66.3 final score, driven by the disinflation macro regime's explicit tailwind for growth stories and the active AI growth sponsorship descriptor adding 14 basis points to the reasoning layer. The category macro fit of 59.0/100 reflects that falling inflation erodes the opportunity cost of owning unprofitable-but-improving AI businesses, while liquidity stress detracts -12 points, leaving the decision to technical evidence at 62% weight versus macro at 38%. SMH's 100/100 momentum confirmation score and 82.2 persistence reading indicate this is not a narrow two-stock story but rather a broad semiconductor acceleration being pulled forward by AI datacenters. Against this, the timing score of 37.0/100 screams that entry here means catching a move already 28.2% extended above its moving average; the risk-reward asymmetry (41.1/100) shows there is more downside to support than upside to resistance. This is a conviction allocation despite poor entry geometry—the thesis is that AI capex momentum persists through the first quarter, and pullback buyers will hold rather than panic-sell.
Technology — XLK
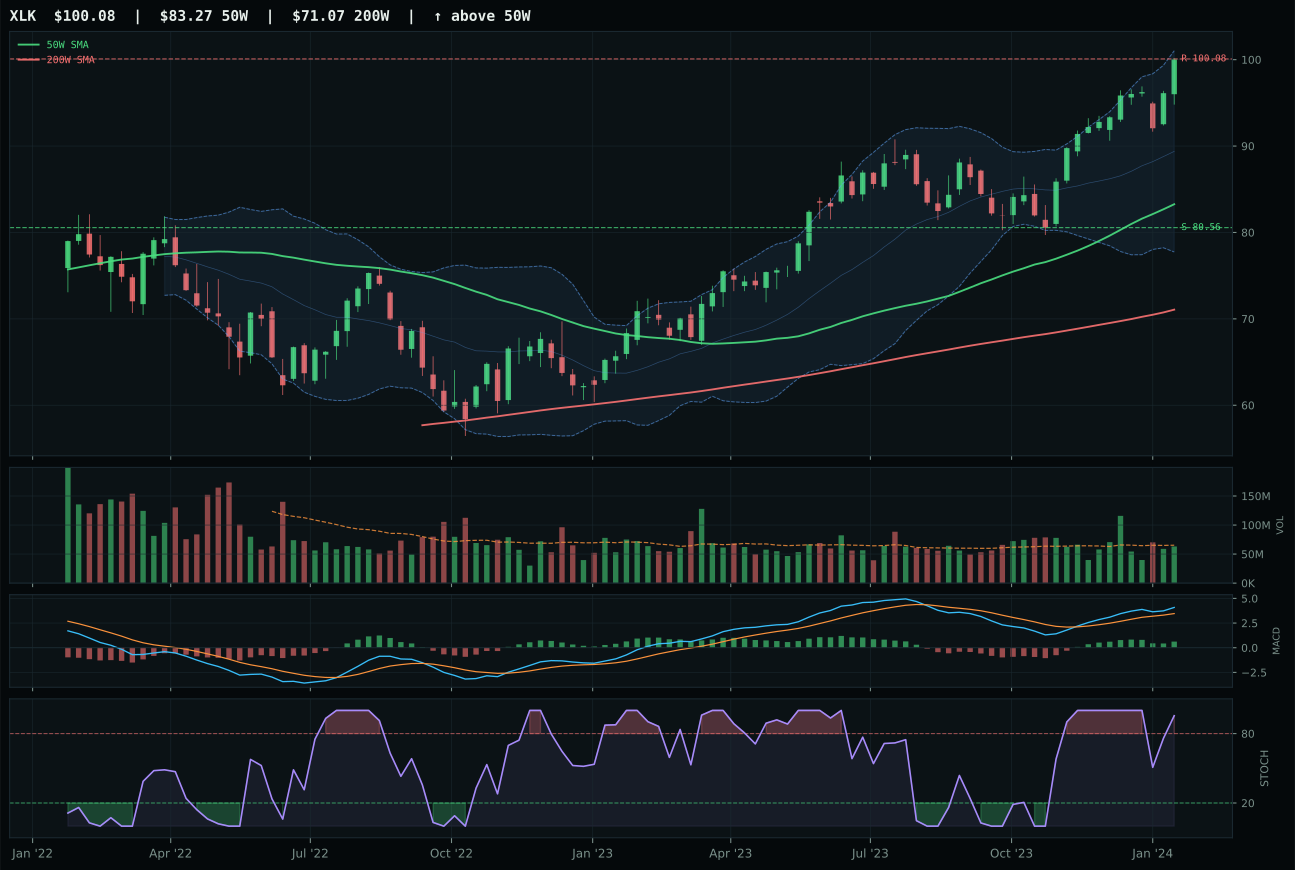
XLK has a vertical extension profile with 7.6% 13-week relative strength versus SPY.
A failed hold above support would weaken the setup.
Actionable but governed by invalidation levels.
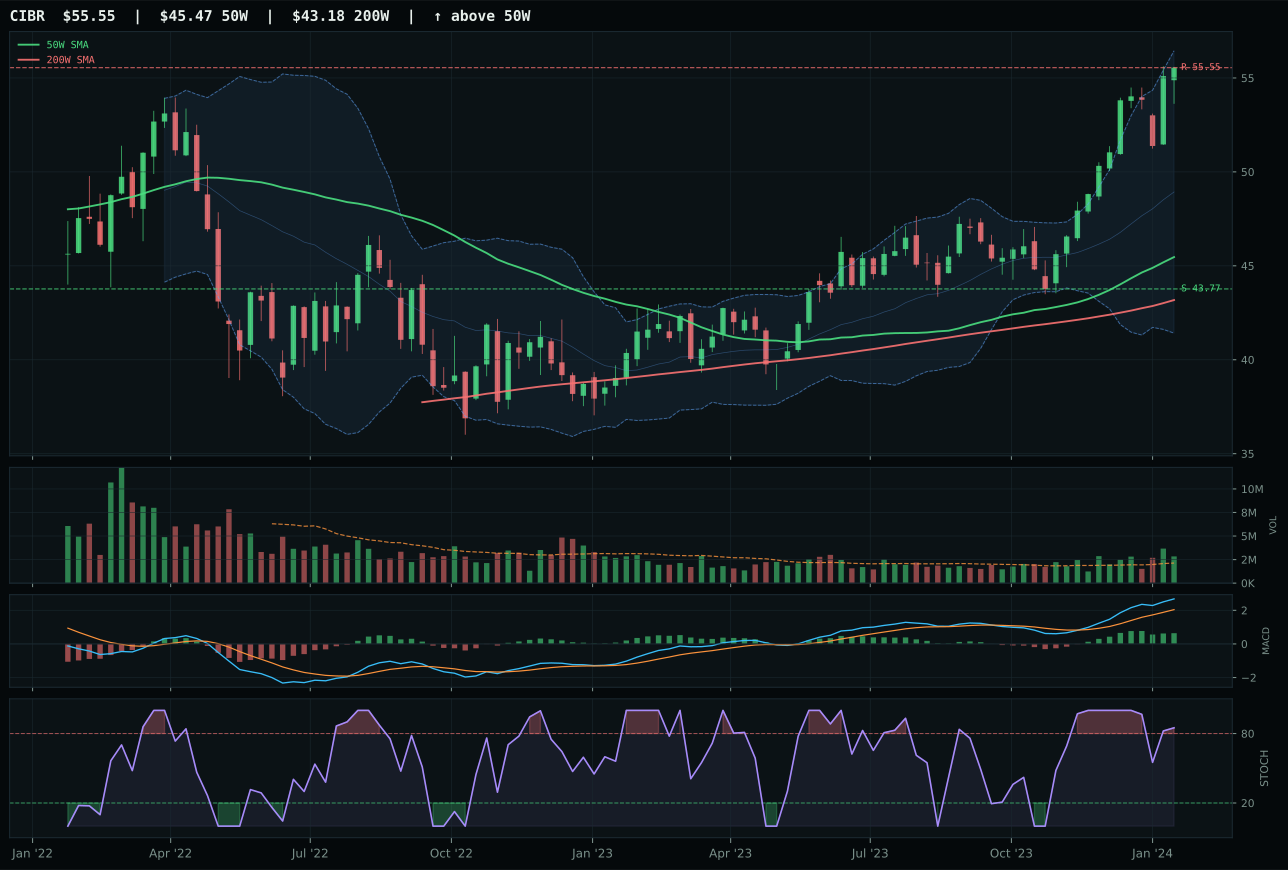
CIBR has a vertical extension profile with 9.4% 13-week relative strength versus SPY.
A failed hold above support would weaken the setup.
Actionable but governed by invalidation levels.
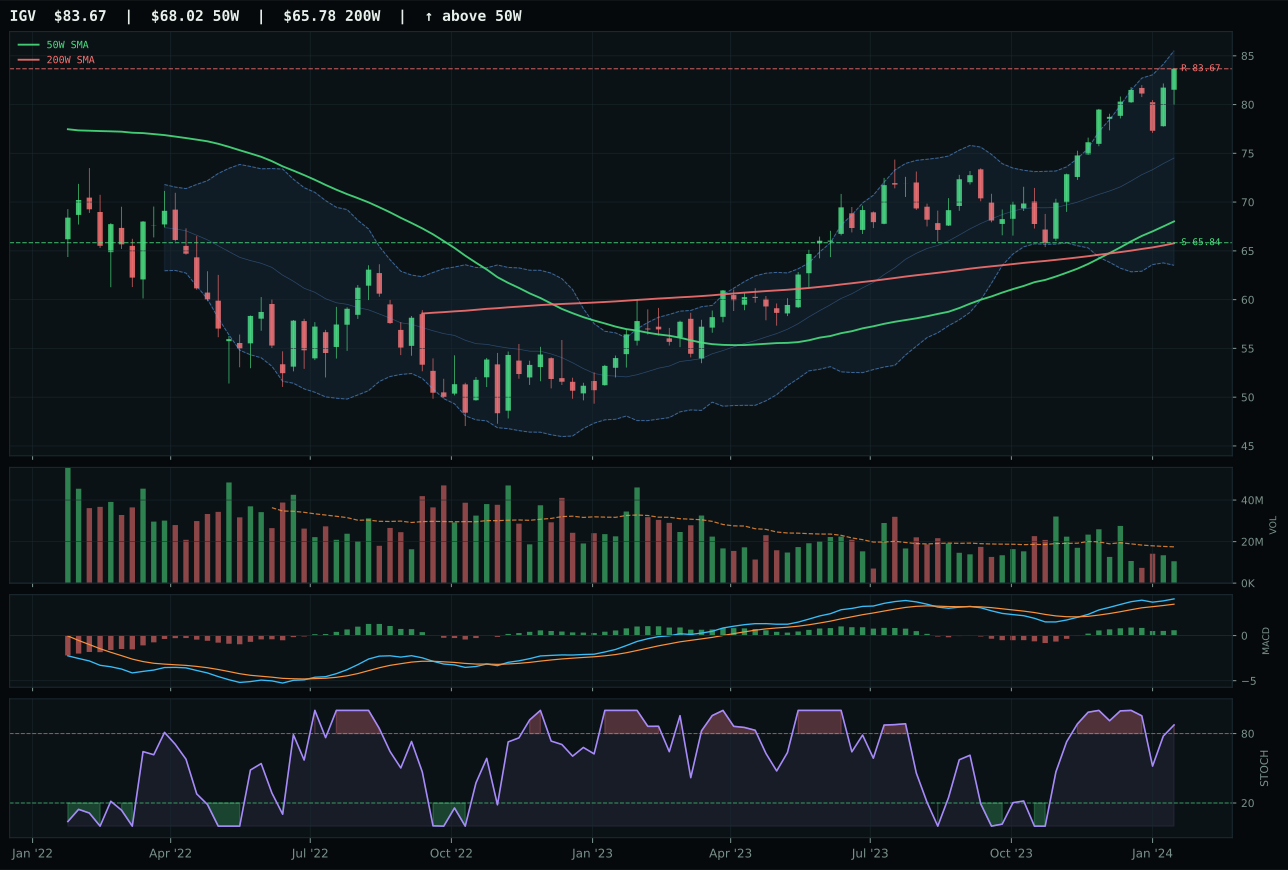
IGV has a vertical extension profile with 9.0% 13-week relative strength versus SPY.
A failed hold above support would weaken the setup.
Actionable but governed by invalidation levels.
XLK claims the category despite sitting 20.2% above its 50-week moving average, a position that would normally disqualify an entry on risk grounds alone. The separating factor is internal leadership: XLK's 7.6% relative strength versus SPY combined with a -1.4% relative strength against its own three-ETF peer set delivers enough proof that this extension is accumulation rather than capitulation. CIBR, the runner-up, posted a stronger 9.4% RS versus SPY and actually led the category in 13-week returns at 24.0% versus XLK's 22.1%, but CIBR's risk-reward calculation deteriorated slightly (42.4 vs 42.9) and its structural cleanliness scored 84.7 to XLK's 84.9—marginal gaps that compound when MACD momentum begins to flatten and entry risk peaks. Volume at 0.97x the 20-week average shows neither accumulation sponsorship nor rejection, leaving the decision to trend leadership and the fact that XLK's stochastic RSI is rolling over at 0.95, signaling that the next seller will likely find a bid from someone waiting for a pullback rather than a capitulation.
Technology earns a 10% allocation as one of the two highest-ranked categories this week, a decision rooted in the disinflation regime's structural support for profitable growth. The category's 54.1 composite score reflects a clean trend (100/100) offset by brutal timing penalties (22.0/100) that penalize any entry above the 50-week moving average in an overbought stochastic environment. Risk appetite remaining active and AI growth sponsorship both firing adds 15 basis points to the macro fit equation, but liquidity stress drags the category macro score to 60.0/100. The real case for allocating capital here is that Technology will benefit from three macro conditions simultaneously: falling real rates tighten in a disinflation regime, AI capex cycles remain structural not cyclical, and the broad SPY index is gaining relative strength versus emerging markets and commodities, which tends to precede a rotation into quality. Entry risk is genuine—every new buyer at this altitude is paying for continuation—but the alternative of waiting for a 15% correction leaves you on the sidelines if trend persistence holds through Q1.
Nuclear Energy — URNM
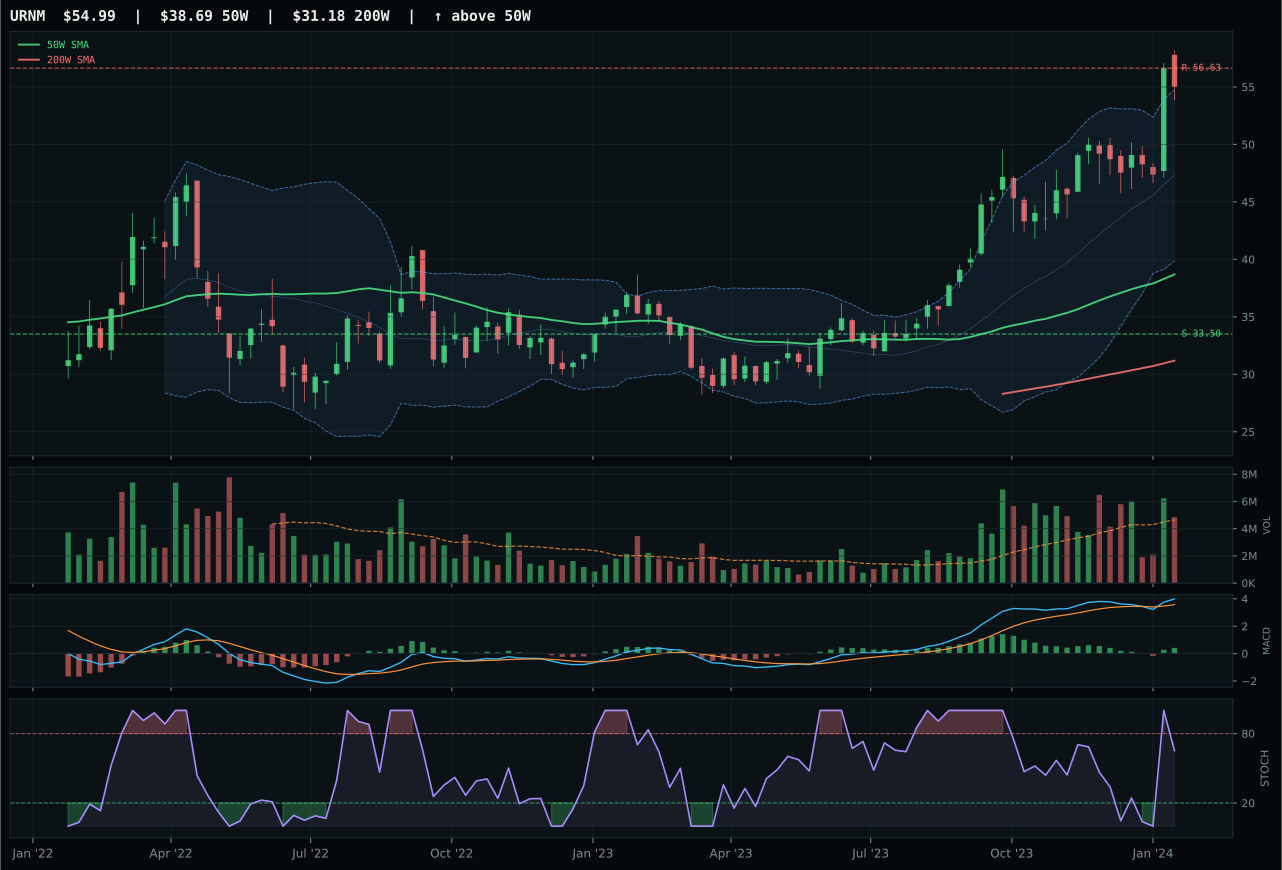
URNM has a vertical extension profile with 10.3% 13-week relative strength versus SPY.
A failed hold above support would weaken the setup.
Actionable but governed by invalidation levels.
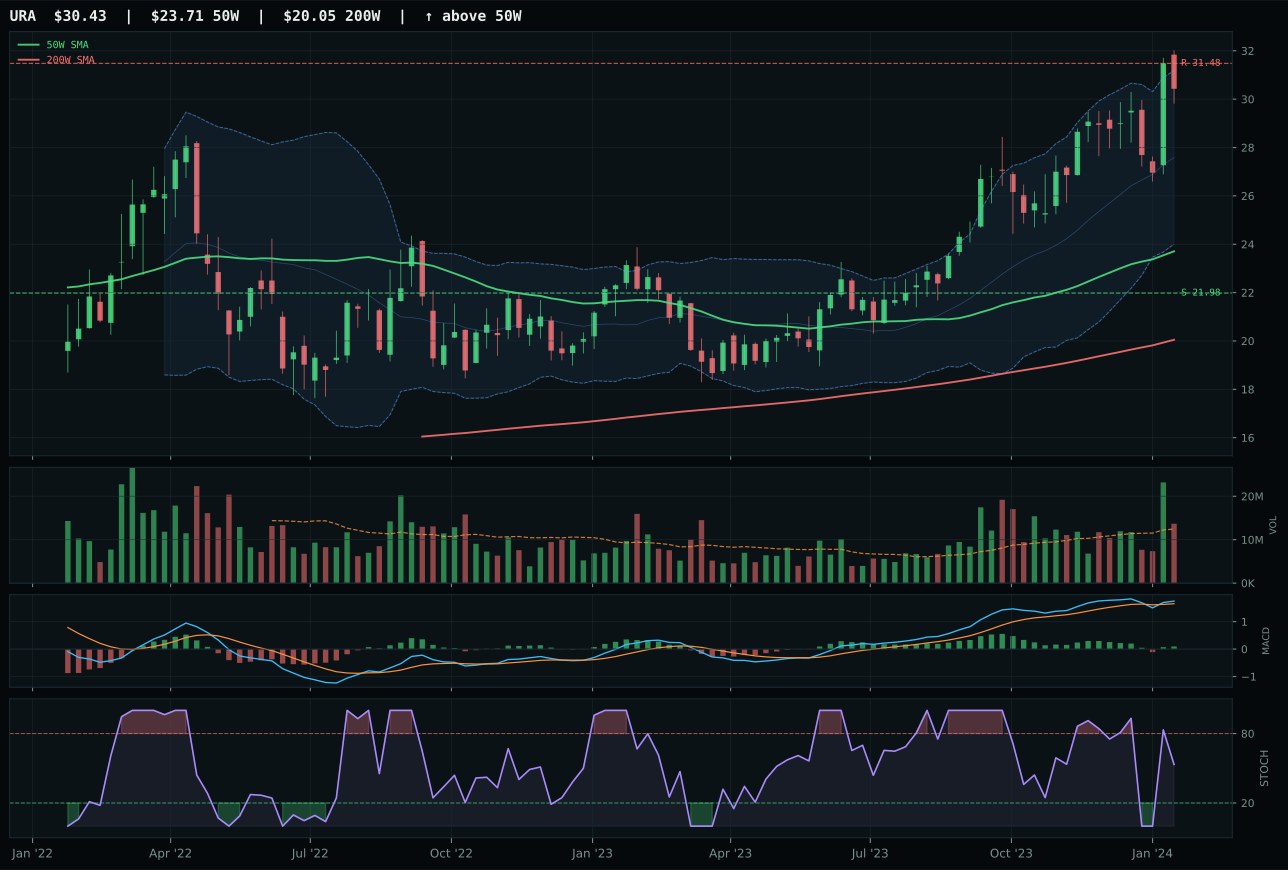
URA has a vertical extension profile with 3.9% 13-week relative strength versus SPY.
A failed hold above support would weaken the setup.
Actionable but governed by invalidation levels.
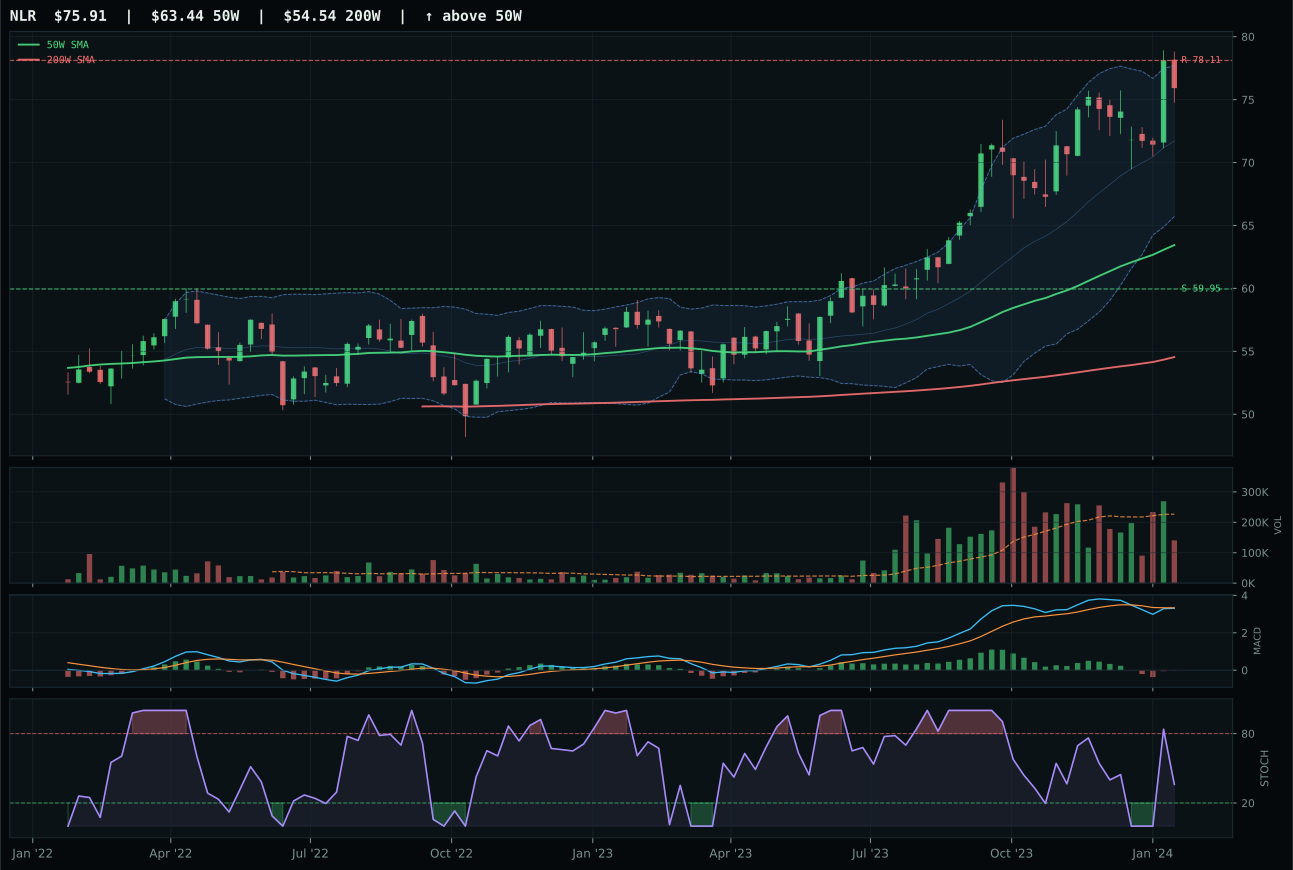
NLR has a vertical extension profile with -2.9% 13-week relative strength versus SPY.
A failed hold above support would weaken the setup.
Actionable but governed by invalidation levels.
Nuclear Energy earns 5% allocation as a tier-2 category with a final score of 50.2, a positioning that reflects strong technical merit (URNM's trend 100/100 and momentum 100/100 scores are elite) moderated by modest macro fit at 43.0/100 and a macro regime (disinflation) that is broadly neutral to defensive energy sectors. The category macro fit receives tailwinds from AI growth sponsorship (+5 basis points) but headwinds from liquidity stress (-7) and credit stress (-5), netting to a modest +0 contribution after weighting. URNM's technical evidence of 76.5/100 dominates the category reasoning, making this fundamentally a trend-following allocation rather than a macro thesis. The setup is problematic for new entries: the 42.1% extension above the 50-week moving average means capital is chasing already-realized returns, and the risk-reward of 45.8/100 shows limited upside (-2.9% to resistance) against 64.1% downside to support—a negative asymmetry masked by momentum perseverence. Allocate here if you believe uranium-supply scarcity and AI power-grid demand create a multi-quarter accumulation cycle; reduce to zero if URNM closes below support at 33.50 or MACD momentum begins to flatten.
Defense & Aerospace — ITA
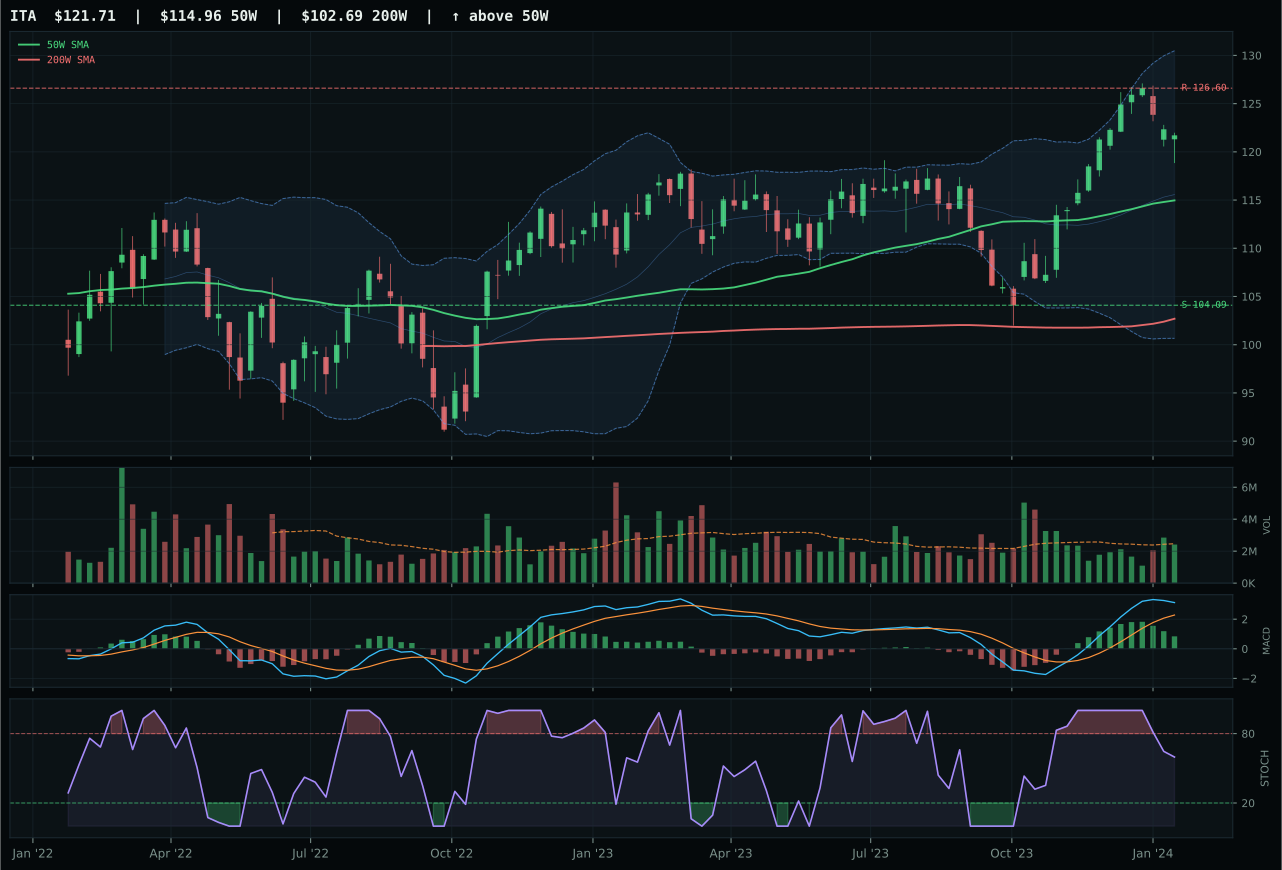
ITA has a neutral structure profile with -0.7% 13-week relative strength versus SPY.
A failed hold above support would weaken the setup.
Actionable but governed by invalidation levels.
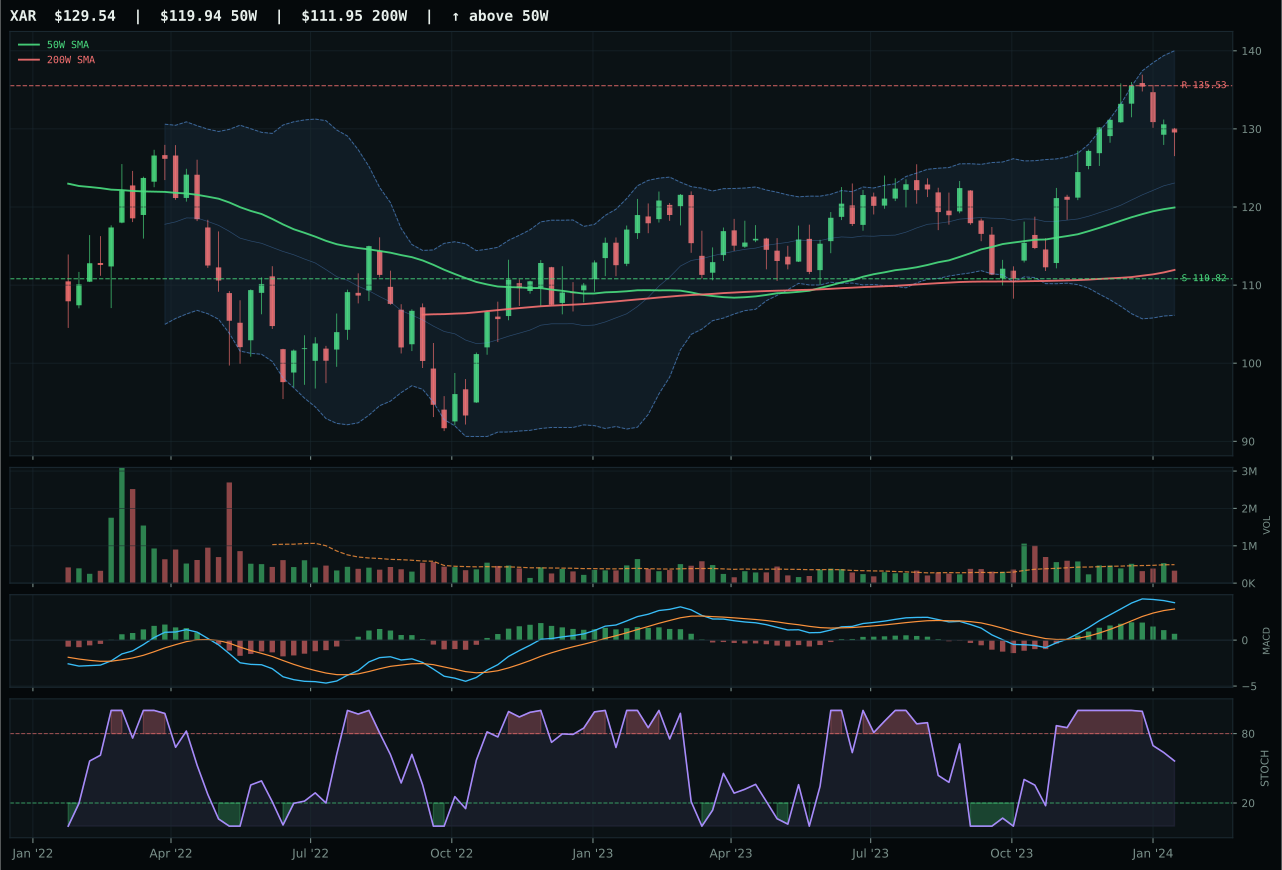
XAR has a neutral structure profile with -1.7% 13-week relative strength versus SPY.
A failed hold above support would weaken the setup.
Actionable but governed by invalidation levels.
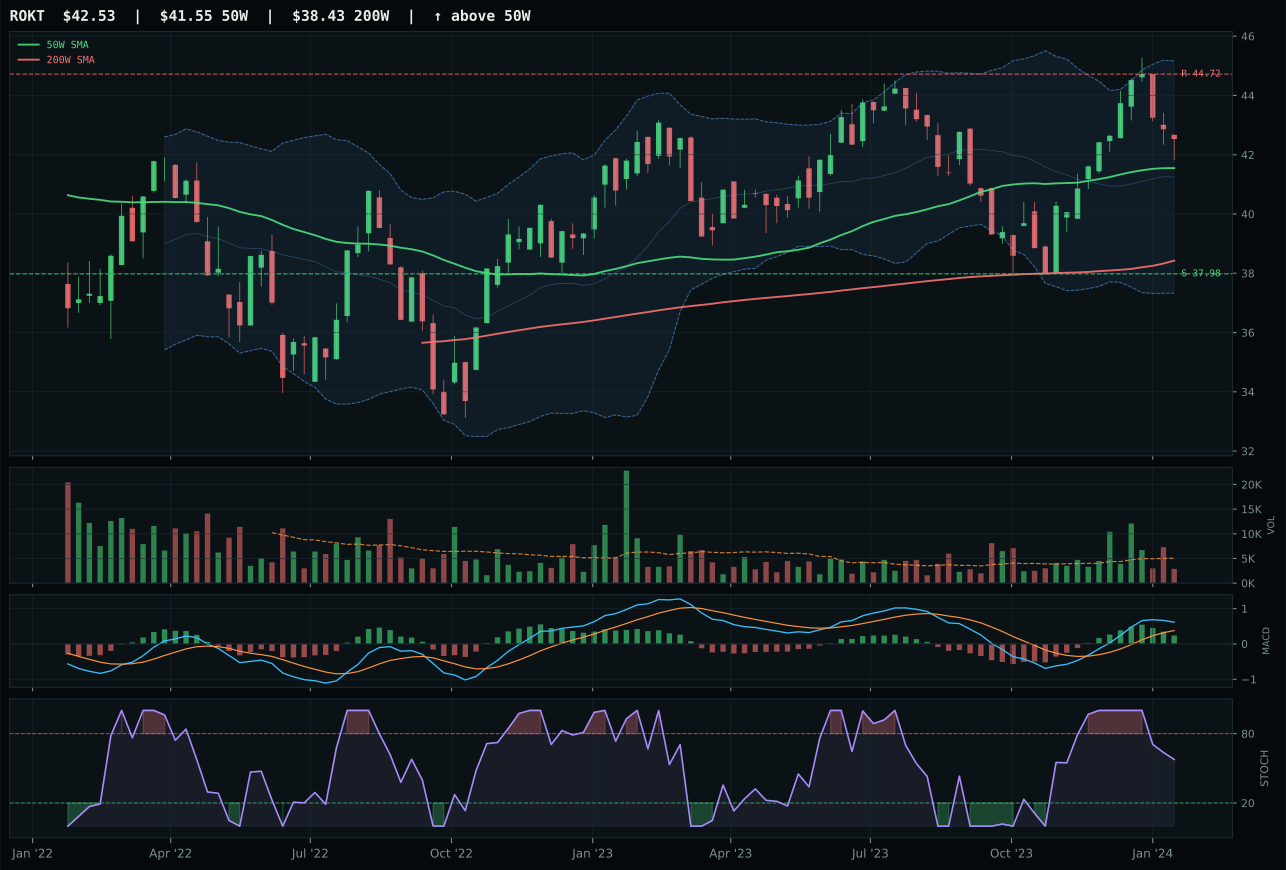
ROKT has a compression near 50W profile with -5.1% 13-week relative strength versus SPY.
A failed hold above support would weaken the setup.
Tracked, but not top-2 eligible because: .
Defense & Aerospace earns 5% allocation as a tier-2 category (ranks 3-8) at a 50.1 final score, reflecting neither the conviction of a top-2 nor the structural rejection of a zero. The category macro fit of 51.0/100 reveals a mismatch between technical evidence (62% weight) and the disinflation narrative: defense spending is typically a crowding-out story in tight fiscal environments, yet credit stress active at +2 basis points and transition/mixed macro state at +3 suggests some perception of geopolitical bifurcation supporting defense budgets. ITA's trend score of 95.0/100 (price above both moving averages) contrasts sharply with its timing penalty (70.0/100, defined primarily by MACD flattening and neutral stochastic), creating a chart that is structurally sound but temporally extended. The risk-reward of 49.1/100 shows limited upside (-3.9% to resistance) against 16.9% downside to support—a risk-on situation in a risk-on regime, which warrants a meaningful but not maximum position. Allocate here if you believe defense remains a crowding trade; rotate to zero if credit stress indicators begin to improve and fiscal discipline resurfaces.
Utilities & Infrastructure — PAVE
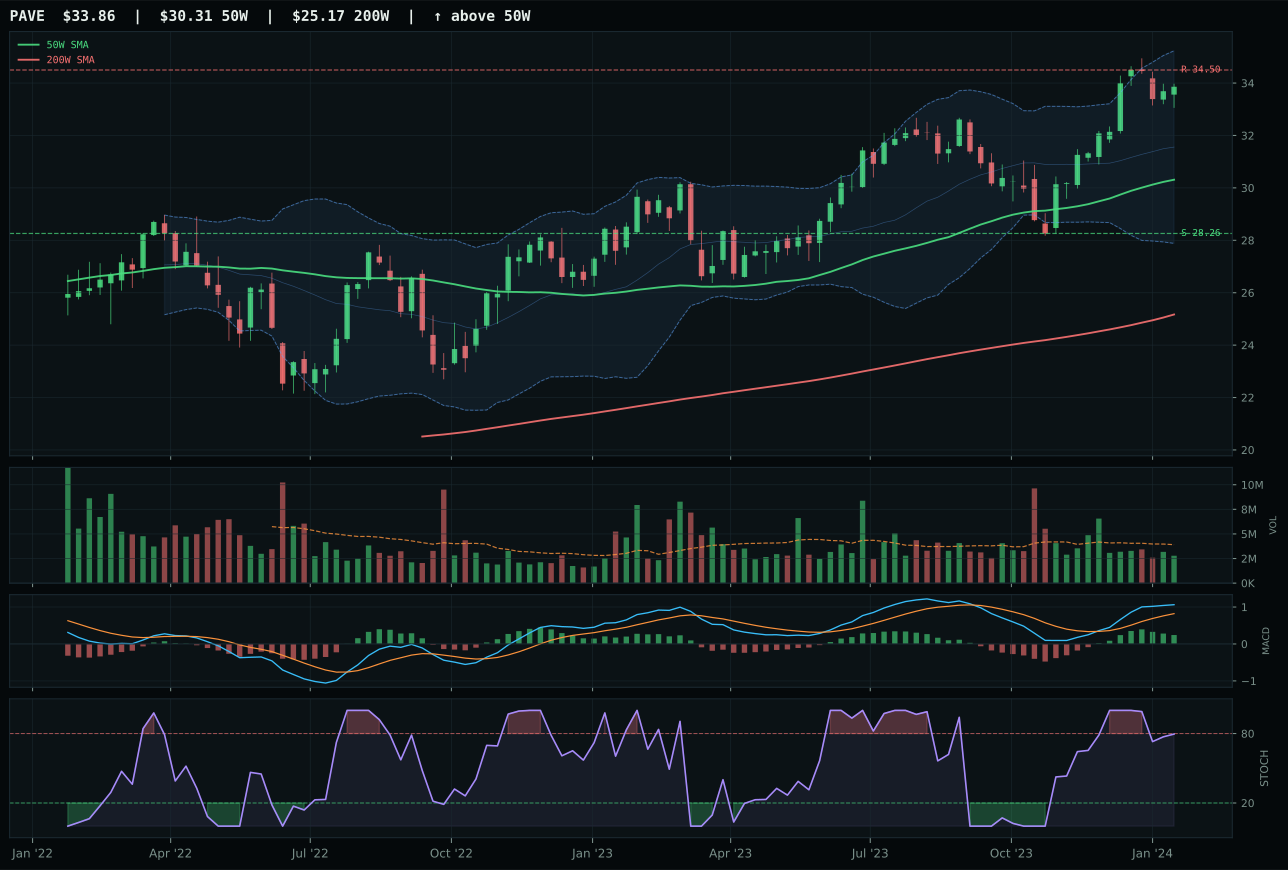
PAVE has a neutral structure profile with 3.2% 13-week relative strength versus SPY.
A failed hold above support would weaken the setup.
Actionable but governed by invalidation levels.
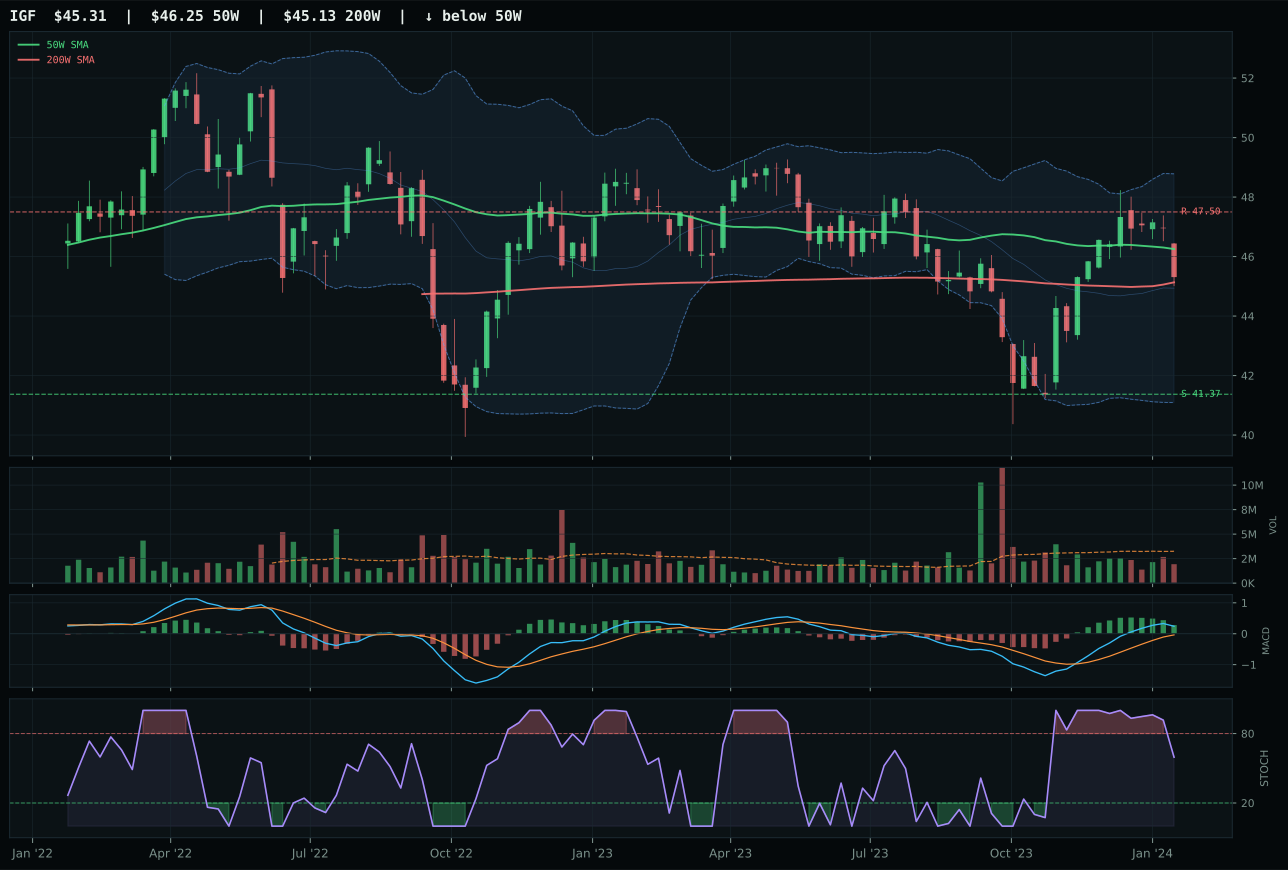
IGF has a compression near 50W profile with -5.8% 13-week relative strength versus SPY.
A failed hold above support would weaken the setup.
Actionable but governed by invalidation levels.
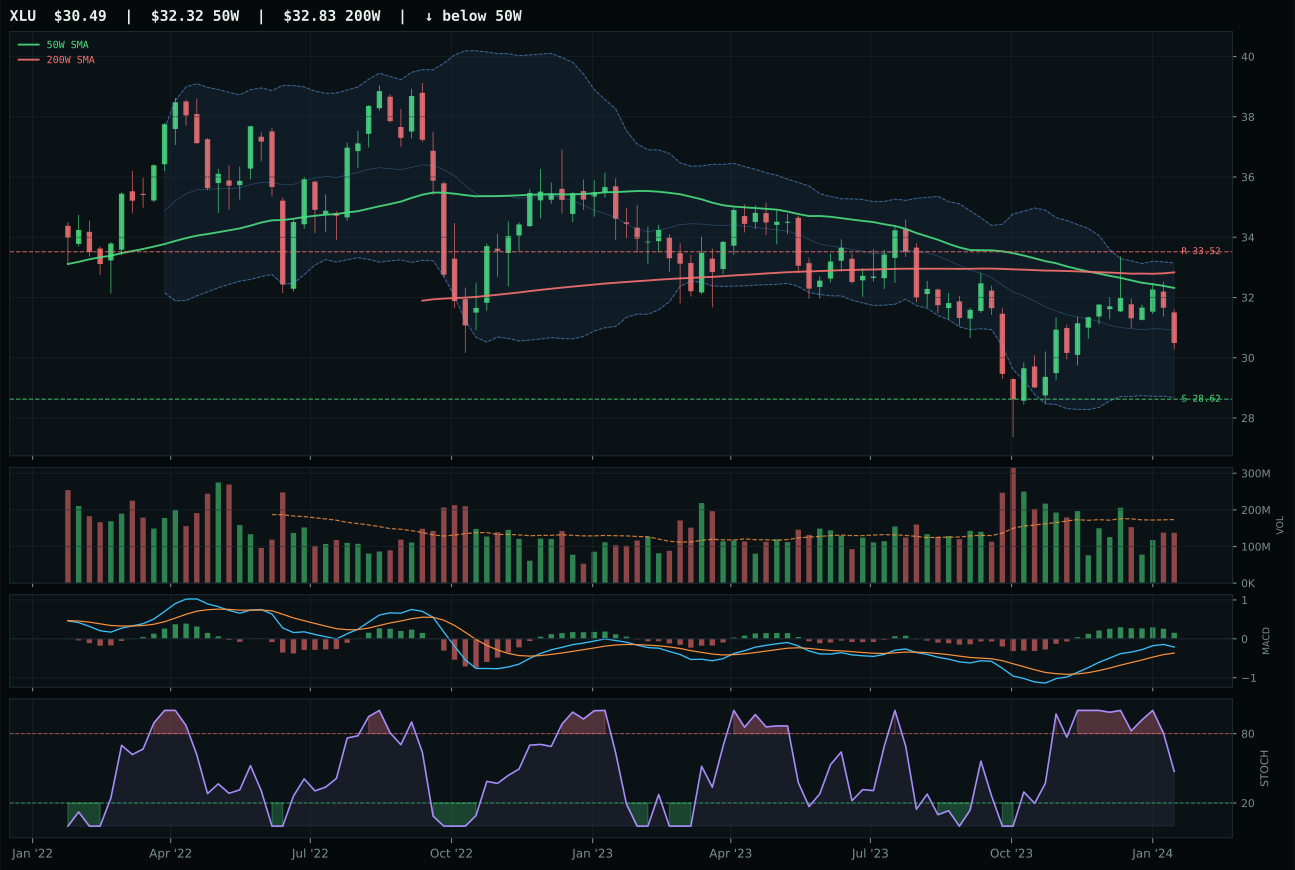
XLU has a neutral structure profile with -9.5% 13-week relative strength versus SPY.
Extension and support failure are the main tactical risks.
Tracked, but not top-2 eligible because: structurally broken.
Utilities & Infrastructure earns 5% allocation as a tier-2 category with a final score of 47.8, reflecting strong macro support (category macro fit 62.0/100 from disinflation regime effect +7, disinflation pressure active descriptor +6, and transition/mixed macro state +4) combined with technical evidence of 77.4/100. PAVE's 100/100 trend score indicates the chart is structurally sound despite sitting extended 11.7% above the 50-week moving average, a position that would normally signal entry risk but is mitigated by domestic infrastructure capex cycles and AI power-grid build narratives. The category's macro case is defensive: utilities and infrastructure are typically crowding-out trades in tight fiscal environments, yet the disinflation regime and falling real rates reduce the opportunity cost of owning low-yield infrastructure equity, creating a perception that infrastructure will outperform commodities and weak cyclicals. Risk-reward is limited (46.7/100 from -1.9% upside to resistance versus 19.8% downside to support), but the category is held because it offers stability in a portfolio dominated by growth momentum. Rotate to zero if credit-stress indicators spike or if PAVE closes below support at 28.26 on volume, signaling a structural break in domestic capex demand.
Precious Metals — GLD
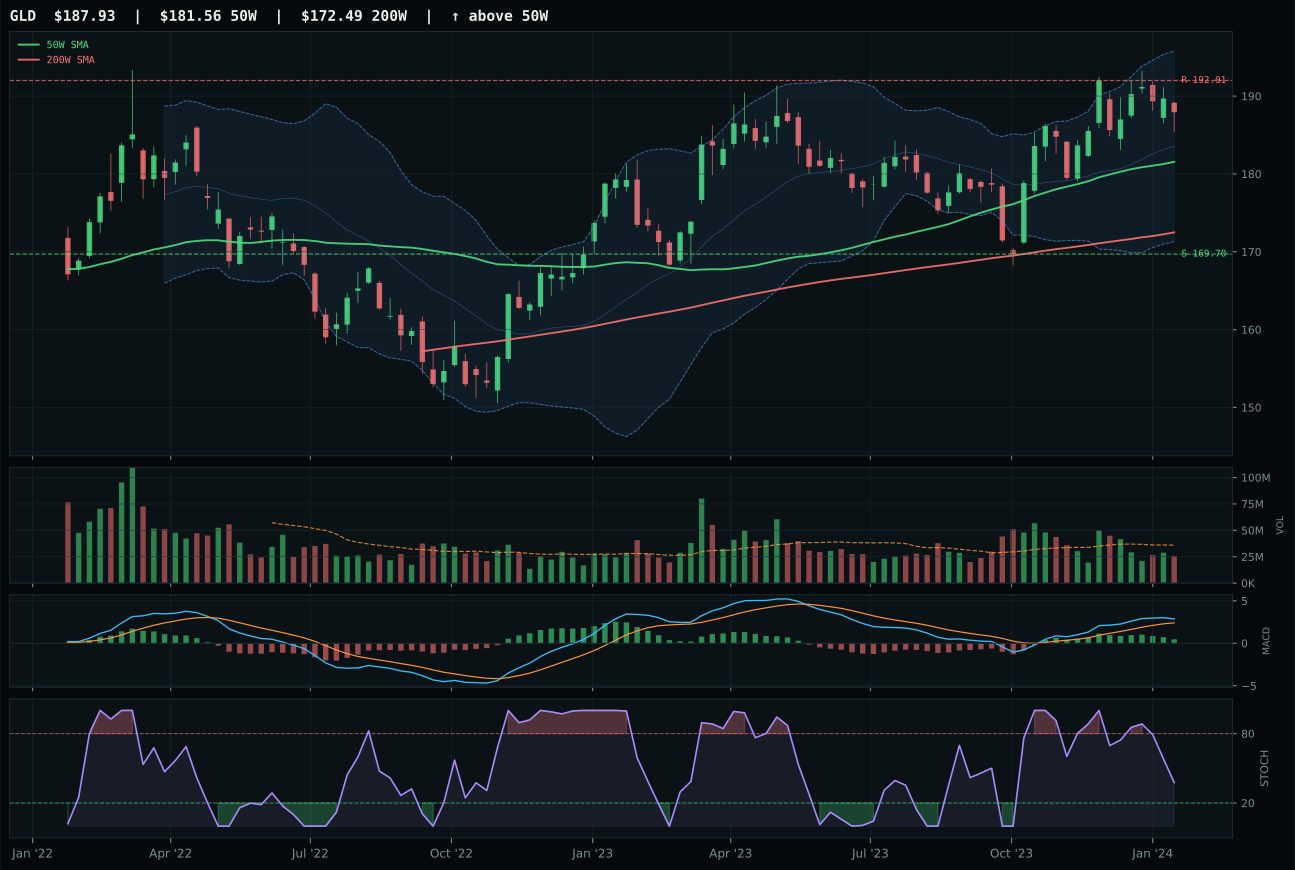
GLD has a neutral structure profile with -12.2% 13-week relative strength versus SPY.
A failed hold above support would weaken the setup.
Actionable but governed by invalidation levels.
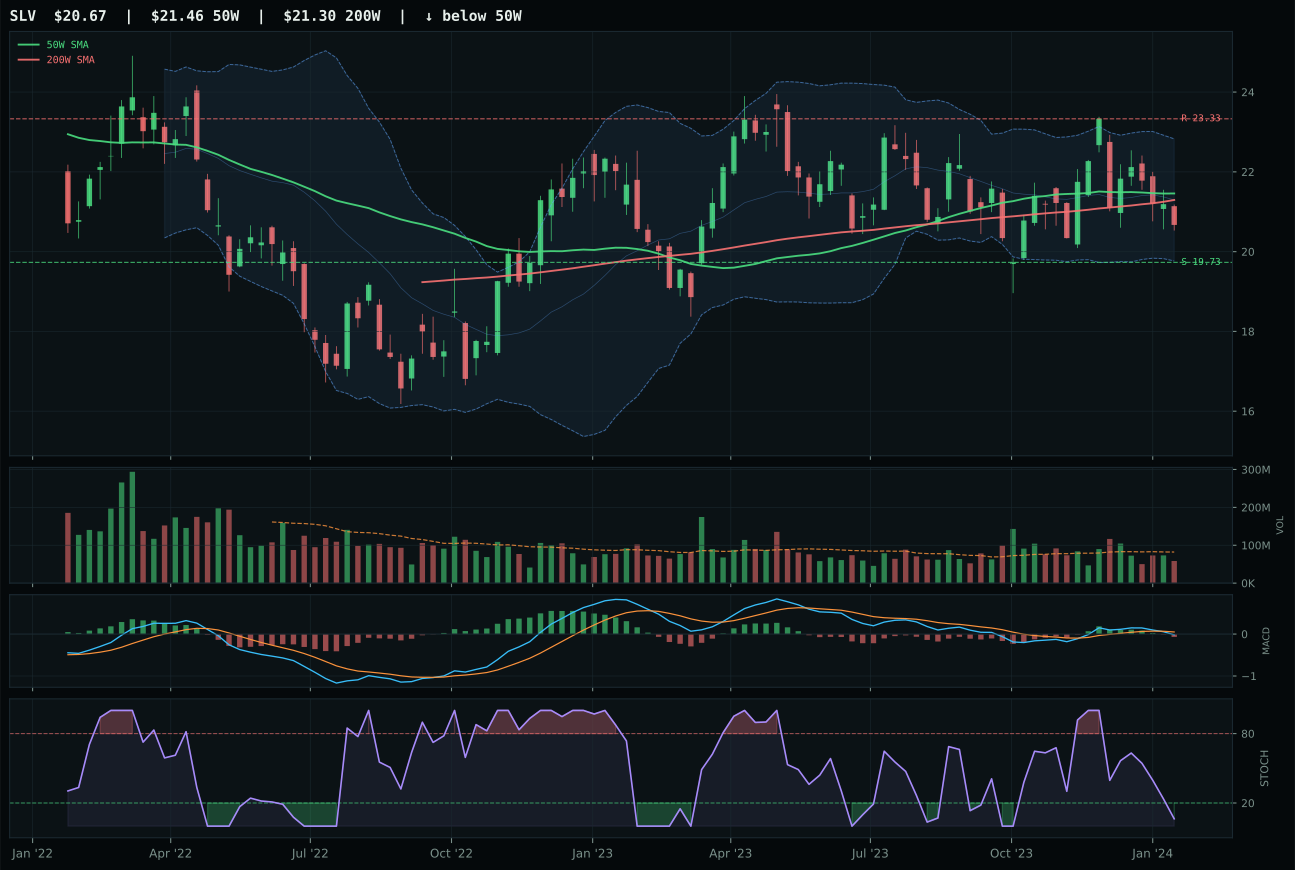
SLV has a pullback into support profile with -18.0% 13-week relative strength versus SPY.
A failed hold above support would weaken the setup.
Actionable but governed by invalidation levels.
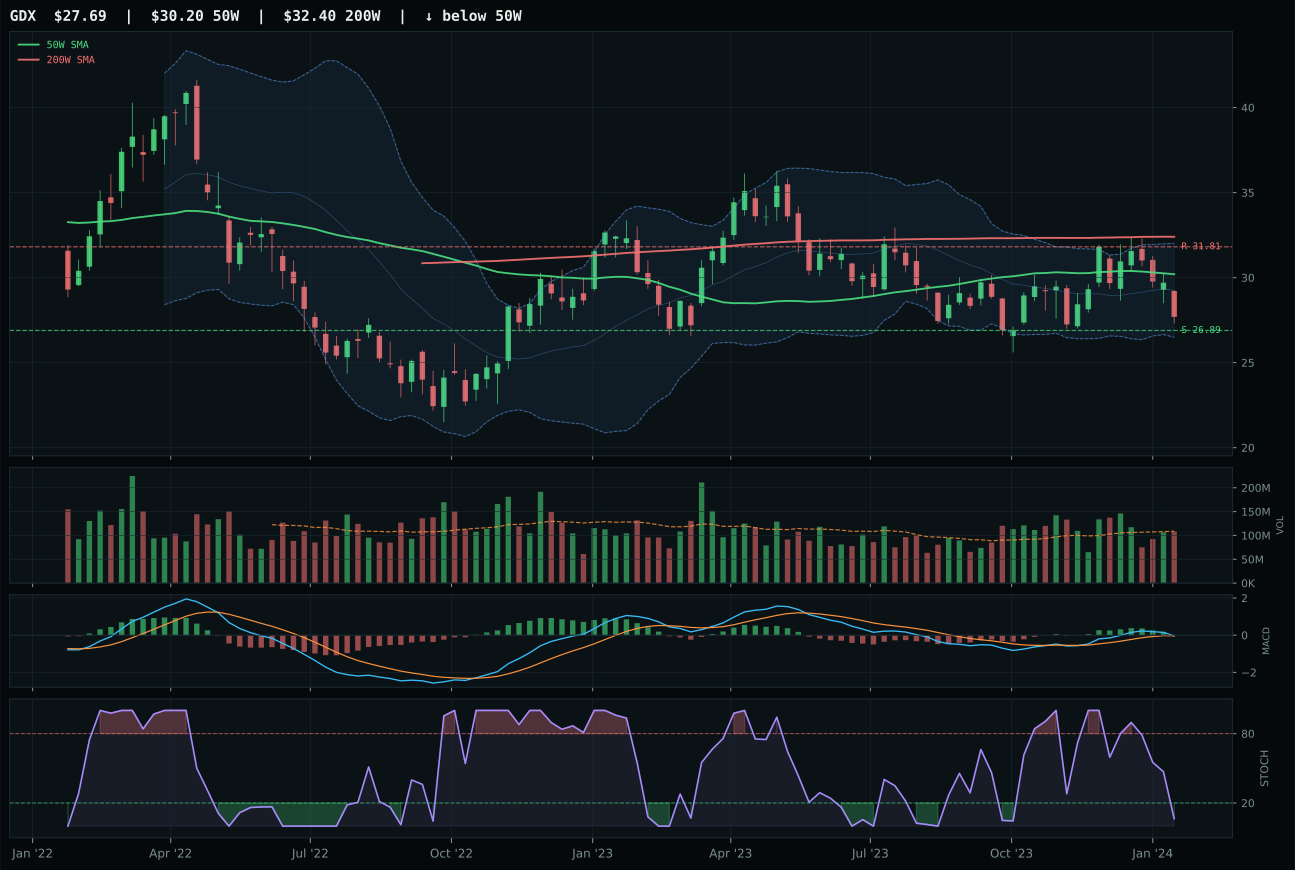
GDX has a pullback into support profile with -20.6% 13-week relative strength versus SPY.
Extension and support failure are the main tactical risks.
Tracked, but not top-2 eligible because: structurally broken.
Precious Metals earns 5% allocation as a tier-2 category (ranks 3-8) with a final score of 31.5, reflecting the disinflation regime's structural tailwind for monetary hedges (macro fit +8 basis points from disinflation regime effect, +6 from disinflation pressure active descriptor) offset by modest weight given to the category. GLD's technical evidence score of 60.4/100 combines with a macro fit of 54.0/100 to yield a composite that is competent but not commanding; the timing challenge (85.0/100 from proximity to the moving average versus 22.0/100 from MACD and stochastic flattening) creates tension between a clean structure and deteriorating momentum. Risk appetite active at -4 basis points suggests that gold's role as a macro insurance premium may diminish if equity sentiment remains positive through the quarter. The category allocation hinges on the conviction that disinflation will persist and that central banks will maintain accommodative posture, supporting real yields and opening a window for gold accumulation. If credit stress indicators improve or risk appetite turns euphoric, rotate this entire allocation to zero; hold if fiscal stress or banking sector volatility re-emerges.
Industrial Metals — COPX
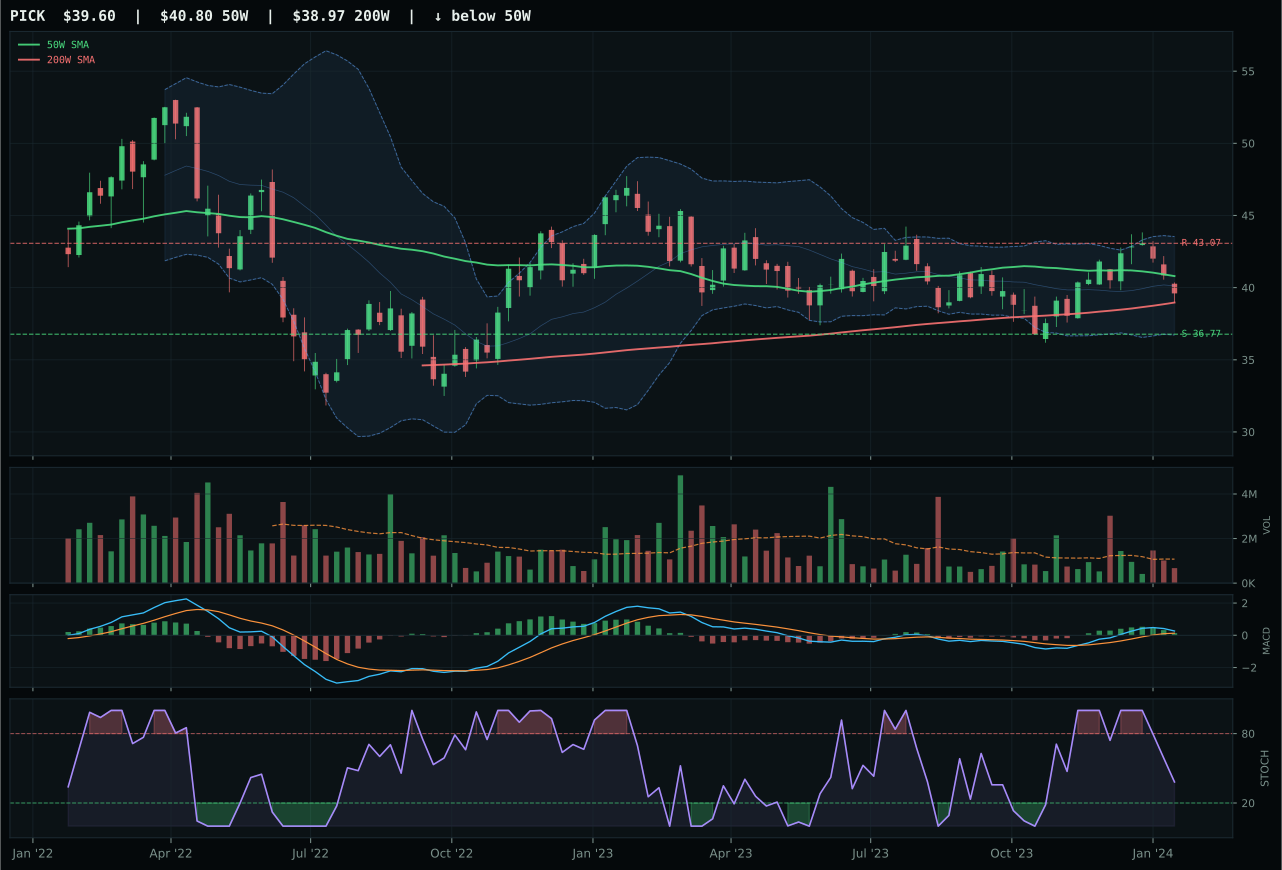
PICK has a compression near 50W profile with -6.8% 13-week relative strength versus SPY.
A failed hold above support would weaken the setup.
Actionable but governed by invalidation levels.
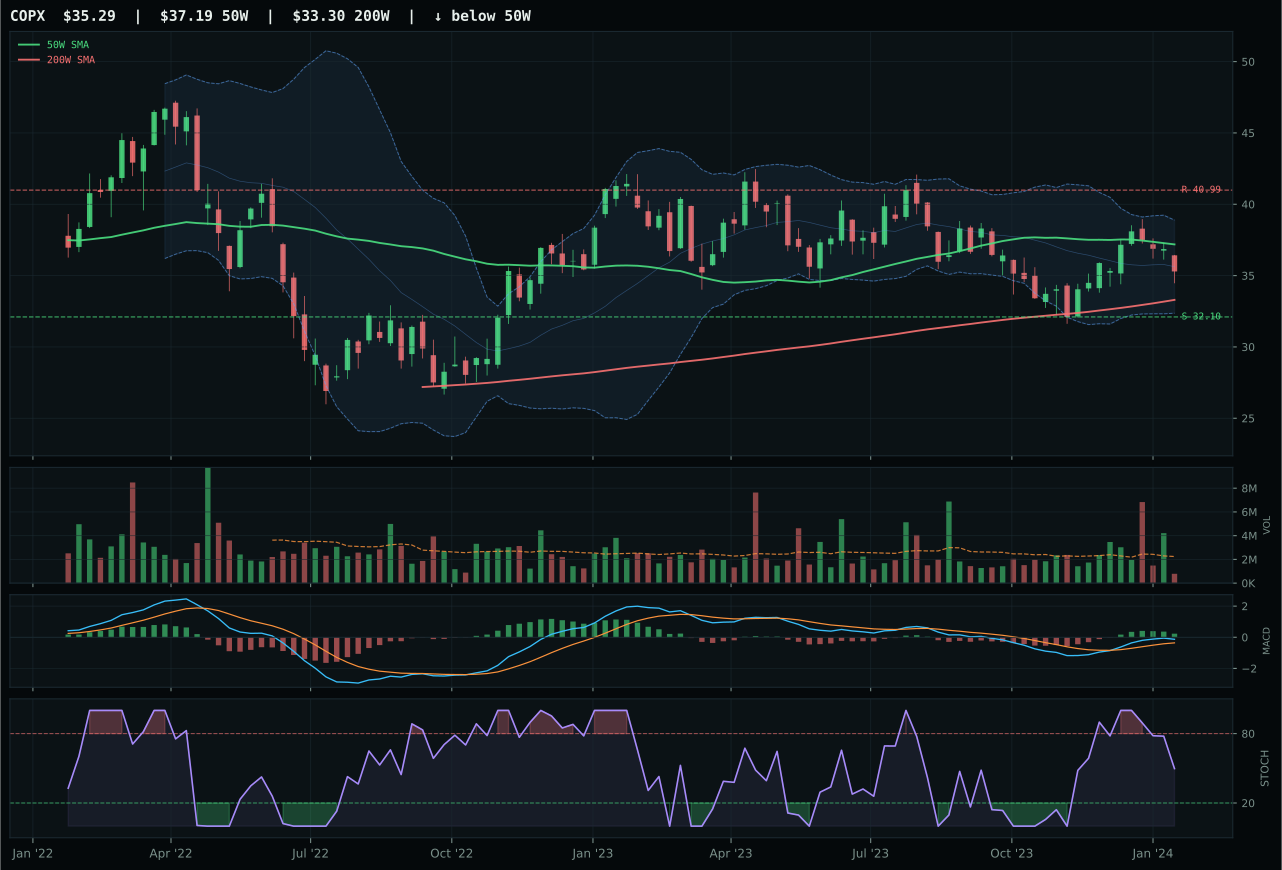
COPX has a neutral structure profile with -8.9% 13-week relative strength versus SPY.
A failed hold above support would weaken the setup.
Actionable but governed by invalidation levels.
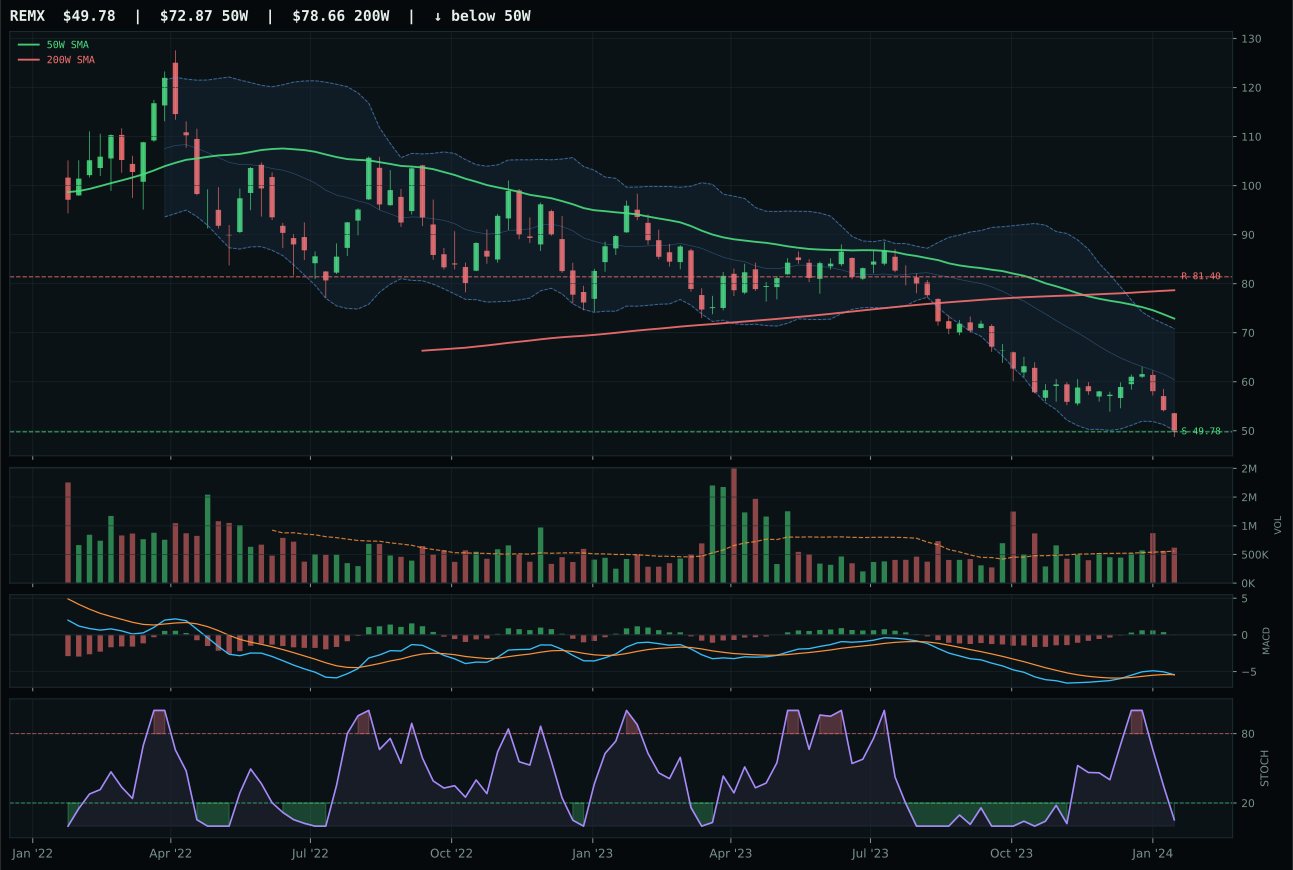
REMX has a pullback into support profile with -28.5% 13-week relative strength versus SPY.
Extension and support failure are the main tactical risks.
Tracked, but not top-2 eligible because: structurally broken.
Industrial Metals receives 5% allocation as a tier-2 category with a final score of 29.9, reflecting a macro case rooted in metals scarcity (+14 basis points from active descriptor) and AI growth demand for copper in power infrastructure, partially offset by liquidity stress (-8) and credit stress (-7). COPX's technical evidence of 49.5/100 combined with macro fit of 55.0/100 yields a composite that is salvageable but hardly compelling; the 13-week return of 5.6% with 0.0% category-relative strength shows no accumulation superiority. Timing is the critical weakness: the deep retracement near 0.618 offers value on an absolute basis but provides no momentum confirmation. Allocate here if you believe copper's structural demand from AI datacenters and renewable-energy infrastructure will override short-term disinflation headwinds, creating a layering opportunity as prices stabilize near support at 32.10. Monitor liquidity stress closely; if credit indicators deteriorate further or COPX breaks below 32.10 on volume, exit this entire sleeve immediately.
Agriculture & Livestock — MOO
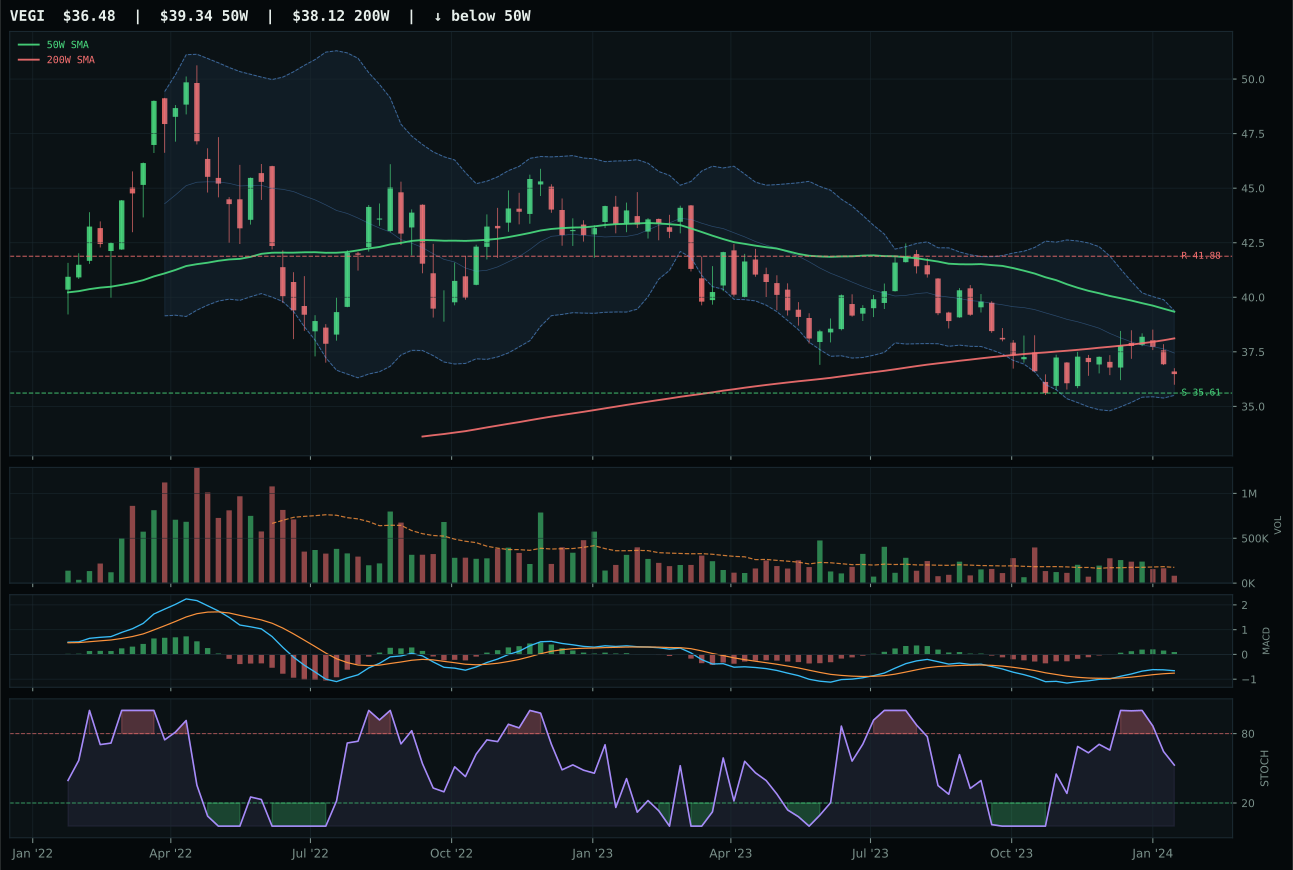
VEGI has a pullback into support profile with -14.9% 13-week relative strength versus SPY.
A failed hold above support would weaken the setup.
Tracked, but not top-2 eligible because: .
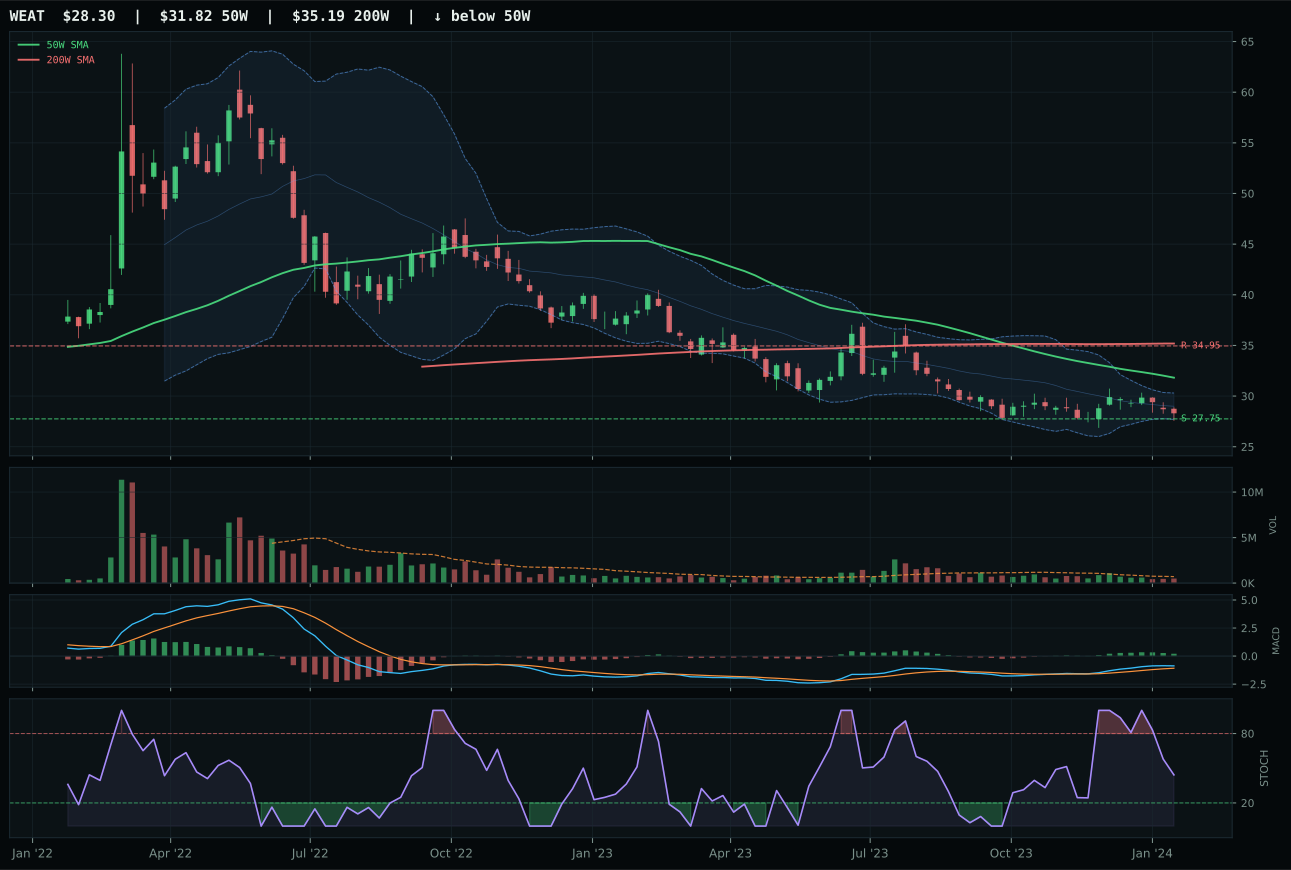
WEAT has a pullback into support profile with -18.1% 13-week relative strength versus SPY.
Extension and support failure are the main tactical risks.
Tracked, but not top-2 eligible because: structurally broken.
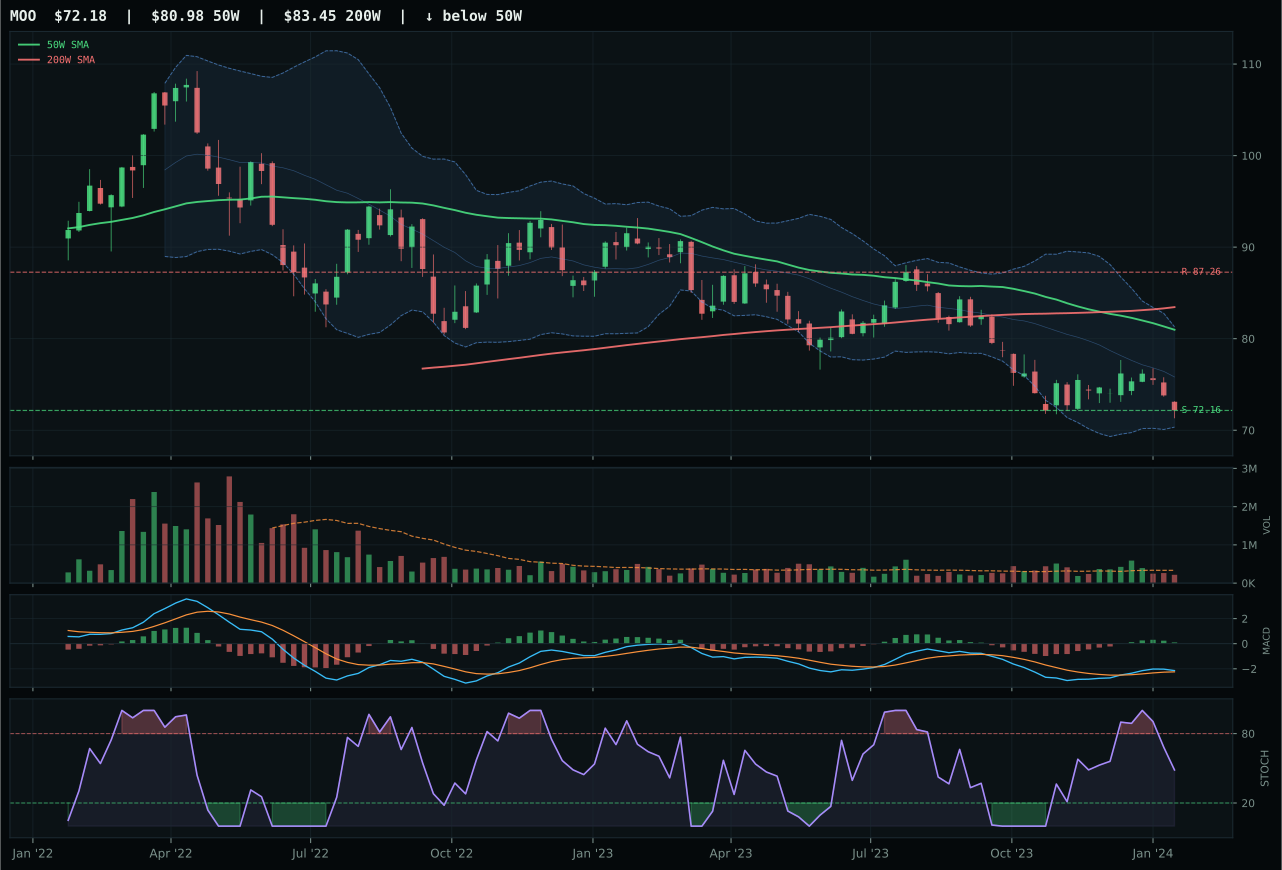
MOO has a pullback into support profile with -17.1% 13-week relative strength versus SPY.
Extension and support failure are the main tactical risks.
Tracked, but not top-2 eligible because: structurally broken.
Agriculture & Livestock receives 5% allocation despite a final category score of 0.0, which signals the category has been screened as ineligible for top-2 consideration but still merits a tier-2 sleeve. The category macro fit of 32.0/100 tells the full story: disinflation actively hurts agricultural commodities (-6 basis points macro regime effect, -8 disinflation pressure descriptor), liquidity stress contributes -4, and the entire three-ETF basket (VEGI, MOO, WEAT) sits below the 50-week moving average. MOO's technical evidence score of 38.7/100 and macro fit of 45.0/100 combine to yield a 50/50 weighting that simply cannot overcome the headwinds. Allocating 5% here is a defensive choice: agriculture tends to underperform in disinflation regimes when real yields are rising and demand destruction is spreading through commodity chains, but the category is cheap on absolute valuation and the bounce-into-support setup at 72.16 for MOO offers a defined risk entry if you believe disinflation will eventually stabilize and food security narratives resurface. This is a conviction fade, not a conviction buy; reduce to zero if support breaks.
Emerging Markets — INDA
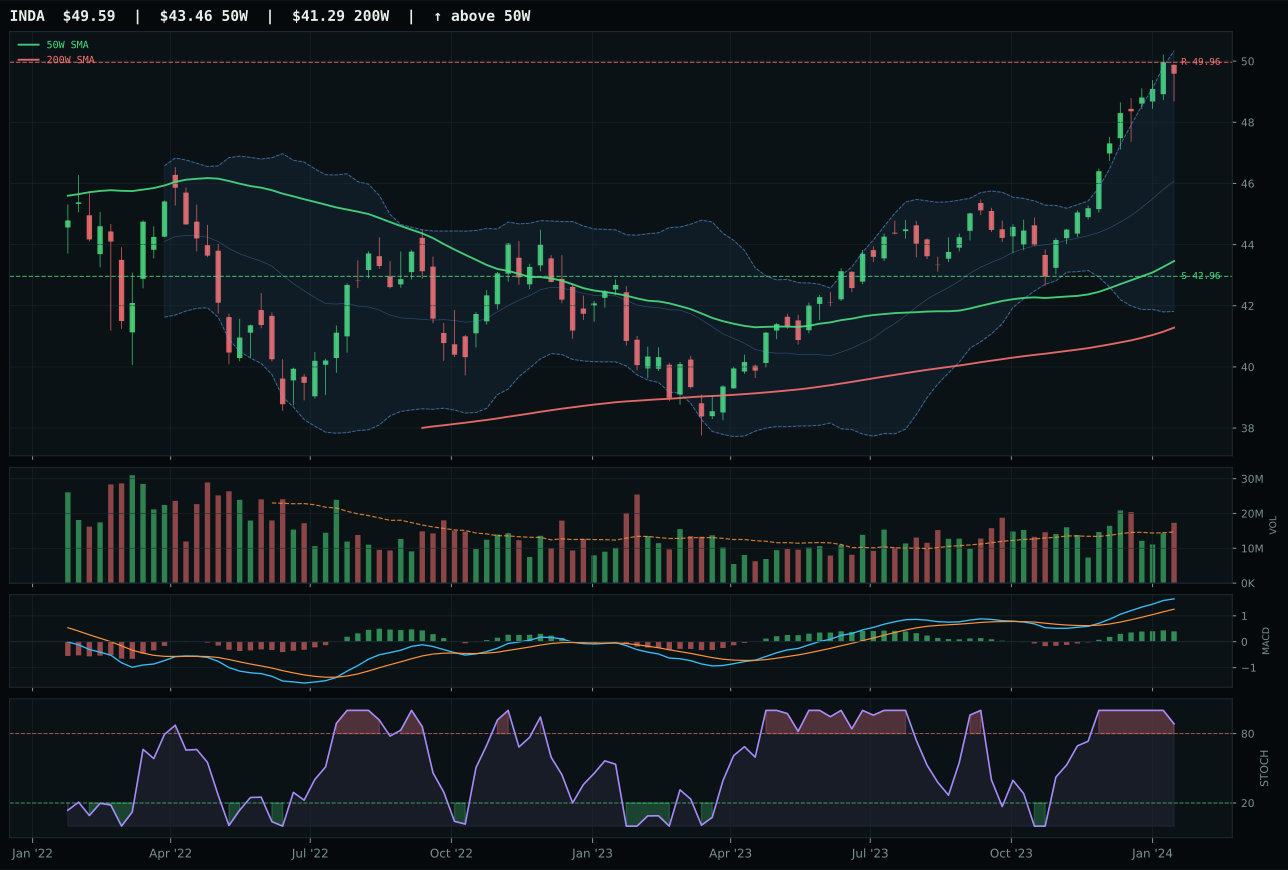
INDA has a neutral structure profile with -1.8% 13-week relative strength versus SPY.
A failed hold above support would weaken the setup.
Actionable but governed by invalidation levels.
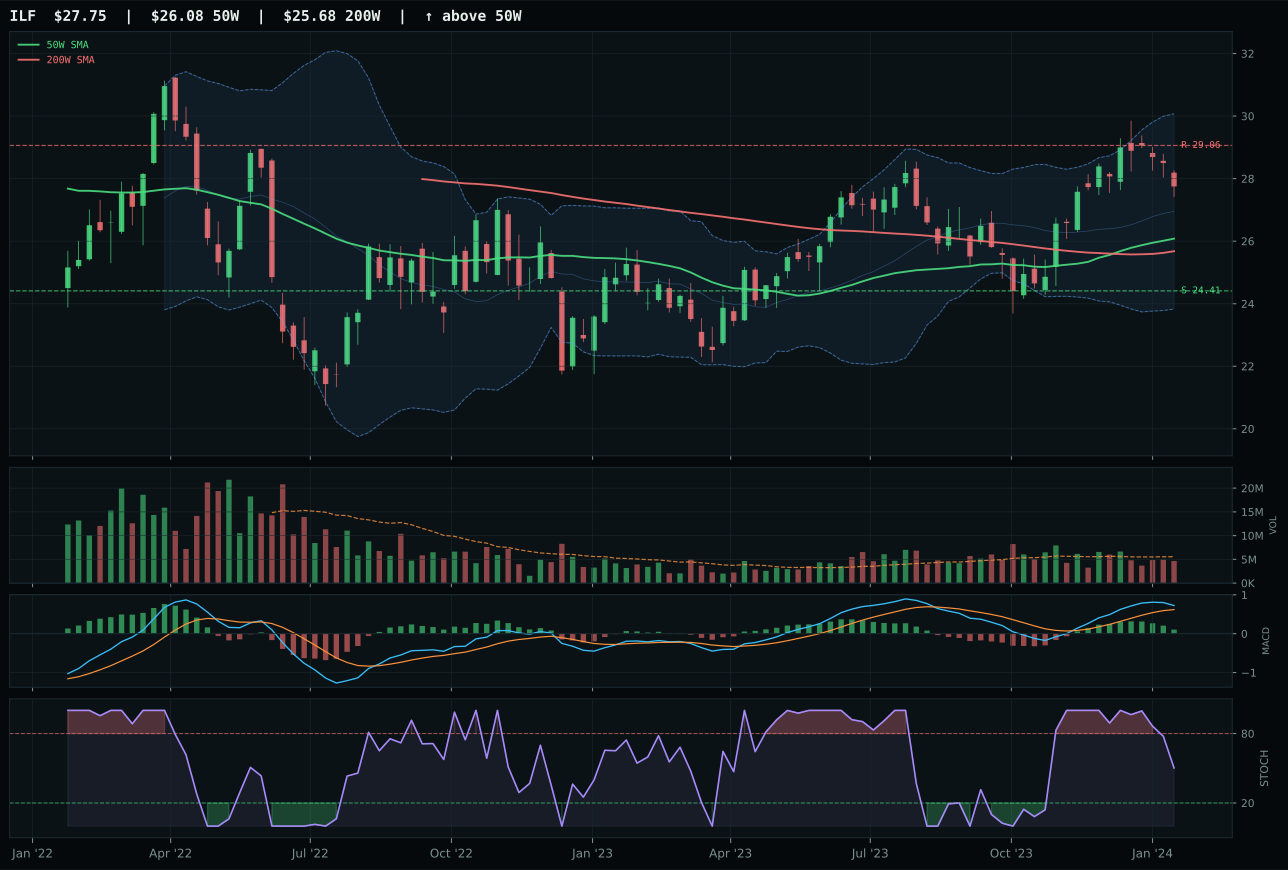
ILF has a neutral structure profile with -2.0% 13-week relative strength versus SPY.
A failed hold above support would weaken the setup.
Actionable but governed by invalidation levels.
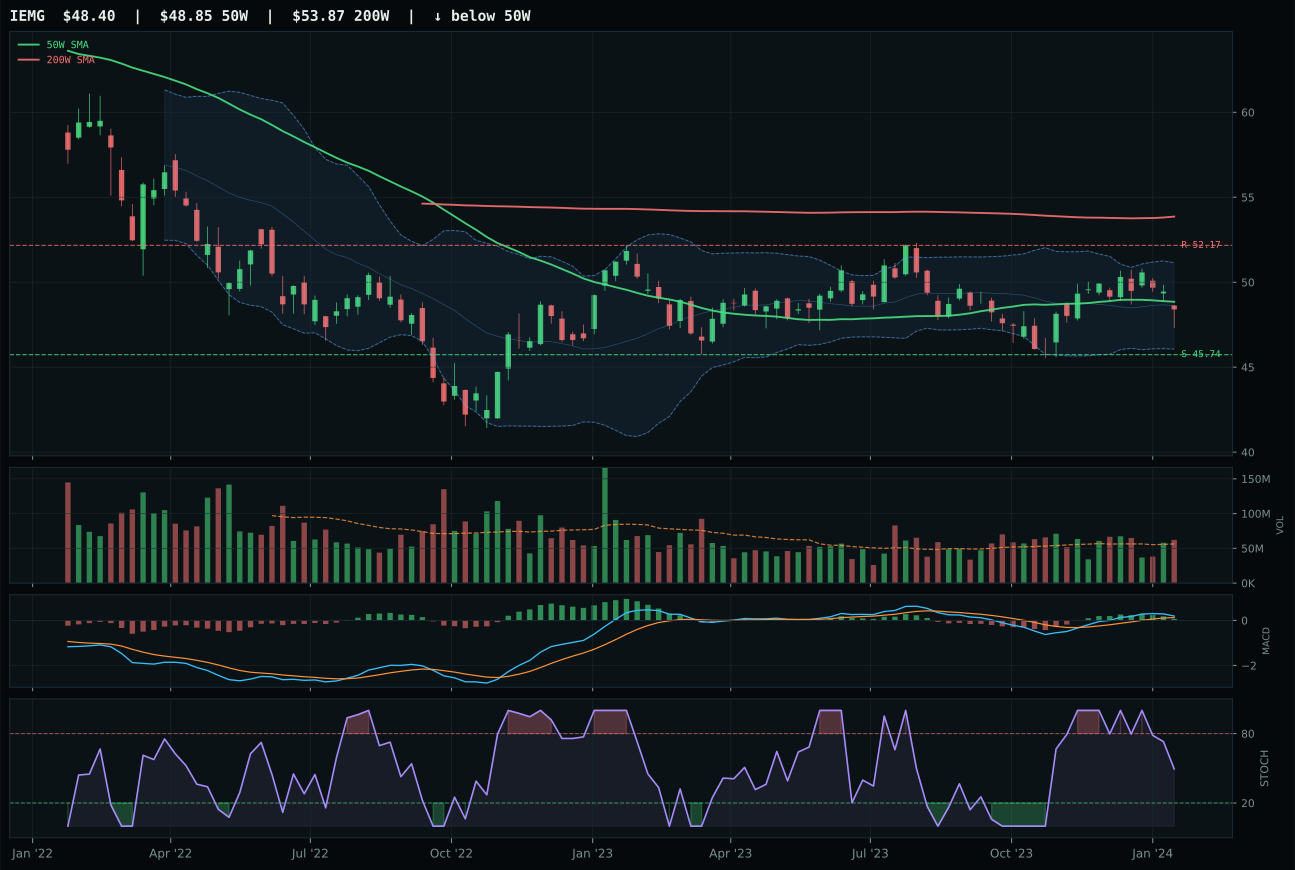
IEMG has a compression near 50W profile with -9.5% 13-week relative strength versus SPY.
Extension and support failure are the main tactical risks.
Tracked, but not top-2 eligible because: structurally broken.
Emerging Markets receives 0% allocation this week, placed outside the portfolio (ranked 9th or 10th) despite INDA's technical coherence and above-average volume participation. The category macro fit of 38.0/100 is the decisive factor: risk appetite active at +8 basis points is offset by credit stress (-10) and liquidity stress (-10), netting to a -12 macro headwind that cannot be overcome by solid technical evidence. INDA's 68.5/100 technical score combined with 48.0/100 macro fit yields a composite that passes eligibility thresholds but fails to rank among the top-2 categories competing for the 10% sleeves. The category's timing weakness (INDA at 49.0/100) reflects a chart extended 14.1% above the 50-week moving average with stochastic RSI overbought rolling over, a profile that offers poor risk-reward despite strong structure quality. The case against allocation hinges on the disinflation regime's negative correlation to emerging-market currency and credit spreads: tighter financial conditions in developed markets flow through to higher emerging-market funding costs and capital outflows. Reintroduce INDA if credit-stress indicators improve, if liquidity-stress signals ease materially, or if INDA pulls back to the 50-week moving average on declining volume.
Traditional Energy — XLE
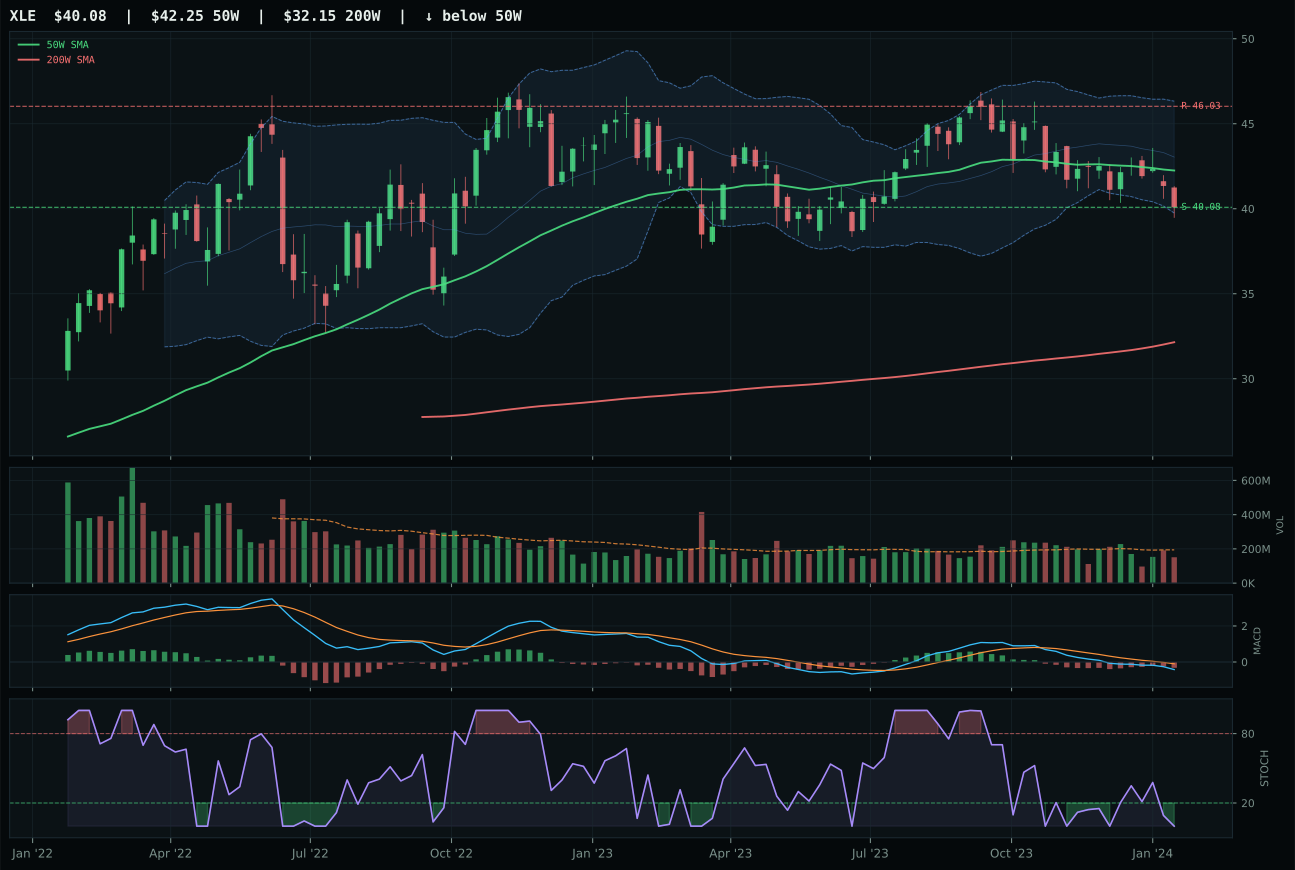
XLE has a pullback into support profile with -25.7% 13-week relative strength versus SPY.
A failed hold above support would weaken the setup.
Actionable but governed by invalidation levels.
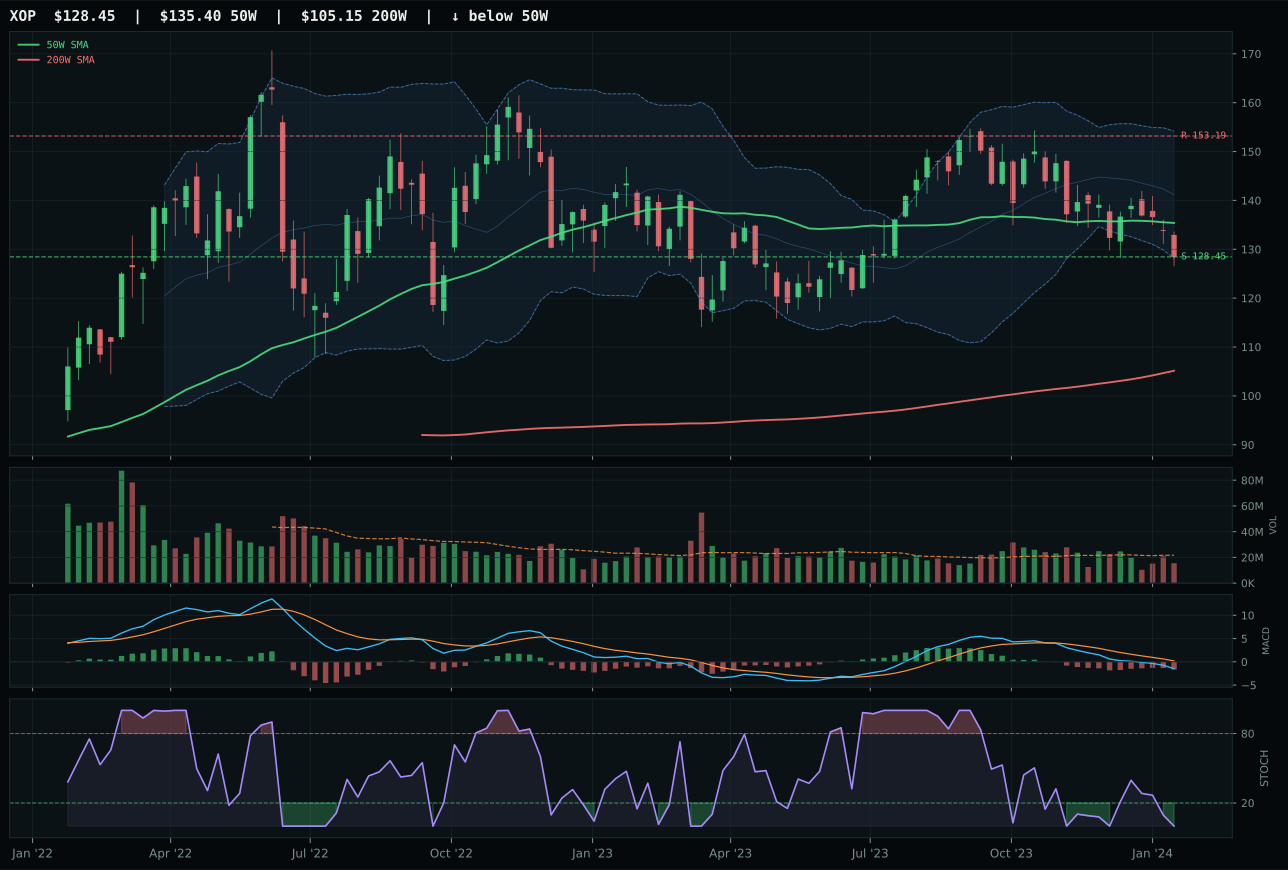
XOP has a pullback into support profile with -29.0% 13-week relative strength versus SPY.
A failed hold above support would weaken the setup.
Actionable but governed by invalidation levels.
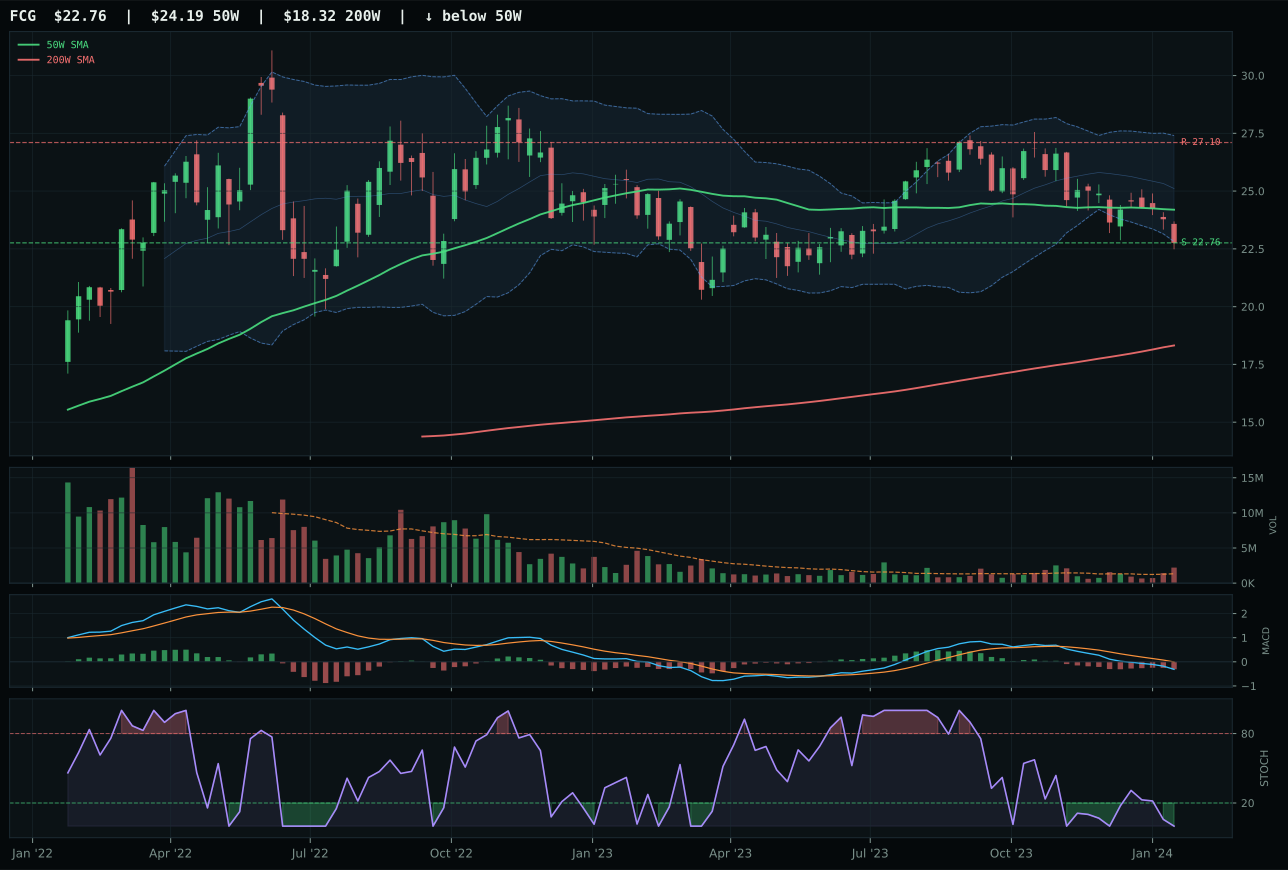
FCG has a pullback into support profile with -29.8% 13-week relative strength versus SPY.
A failed hold above support would weaken the setup.
Actionable but governed by invalidation levels.
Traditional Energy receives 0% allocation this week, placing it outside the portfolio entirely (ranked 9th or 10th among all 10 categories). The category macro fit of 16.0/100 is devastating: disinflation hurts this exposure by -10 basis points from macro regime effect and -10 from the disinflation pressure active descriptor, credit stress detracts -7, and liquidity stress contributes -7, creating a -34-point macro headwind with only modest offsets. XLE's technical evidence of 23.9/100 combined with macro fit of 42.0/100 yields a category score of 0.0 after eligibility filtering, signaling that energy fails both the technical sufficiency test and the macro regime fit test. The momentum confirmation score for both XLE and XOP is 0.0/100, confirming that there is no short-term accumulation sponsor and the setup is purely a bounce into an oversold stochastic—a tail-risk trade masquerading as a value setup. Reintroduce energy only if disinflation pressures ease, if credit stress indicators improve materially, or if XLE breaks above its 50-week moving average on above-average volume with MACD bullish confirmation.