
2024-01-12
Informational purposes only. The content in this report, including allocations, analysis, and commentary, is provided solely for informational and educational purposes. It does not constitute financial advice, investment advice, trading advice, or any other type of advice. Past performance does not guarantee future results. Always conduct your own research and consult a qualified financial professional before making investment decisions.
Weekly Allocation
| Ticker | Category | Weight | Role |
|---|---|---|---|
| FBTC | 50% | Overlay | |
| BOTZ | AI | 10% | Top-2 (10%) |
| CIBR | Technology | 10% | Top-2 (10%) |
| URNM | Nuclear Energy | 5% | Tier-2 (5%) |
| XAR | Defense & Aerospace | 5% | Tier-2 (5%) |
| INDA | Emerging Markets | 5% | Tier-2 (5%) |
| PAVE | Utilities & Infrastructure | 5% | Tier-2 (5%) |
| MOO | Agriculture & Livestock | 5% | Tier-2 (5%) |
| GLD | Precious Metals | 5% | Tier-2 (5%) |
Trade Instructions — Monday Open
Sell the tranche from 2023-12-15 (completing its 4-week hold). Buy the new tranche. Instructions show net portfolio changes — same-asset positions cancel, weight changes show the delta.
| Action | Ticker | Instruction |
|---|---|---|
| SELL | ITA | Sell 33% of ITA position (reduce 3.75% → 2.50%) |
| SELL | URA | Sell 50% of URA position (reduce 2.50% → 1.25%) |
| SELL | COPX | Sell 33% of COPX position (reduce 3.75% → 2.50%) |
| BUY | XAR | Buy XAR — 33.33% of freed cash (adds 1.25% to portfolio) |
| BUY | URNM | Buy URNM — 33.33% of freed cash (adds 1.25% to portfolio) |
| BUY | MOO | Buy MOO — 33.33% of freed cash (adds 1.25% to portfolio) |
Current Portfolio After Trade
Combined holdings across all 4 active tranches. Each tranche is 25% of the portfolio.
| Ticker | % of Portfolio | Weight Bar |
|---|---|---|
| FBTC | 50.00% | |
| CIBR | 8.75% | |
| PAVE | 6.25% | |
| BOTZ | 5.00% | |
| GLD | 5.00% | |
| INDA | 5.00% | |
| SMH | 3.75% | |
| URNM | 3.75% | |
| ITA | 2.50% | |
| COPX | 2.50% | |
| XAR | 2.50% | |
| MOO | 2.50% | |
| URA | 1.25% | |
| GDX | 1.25% |
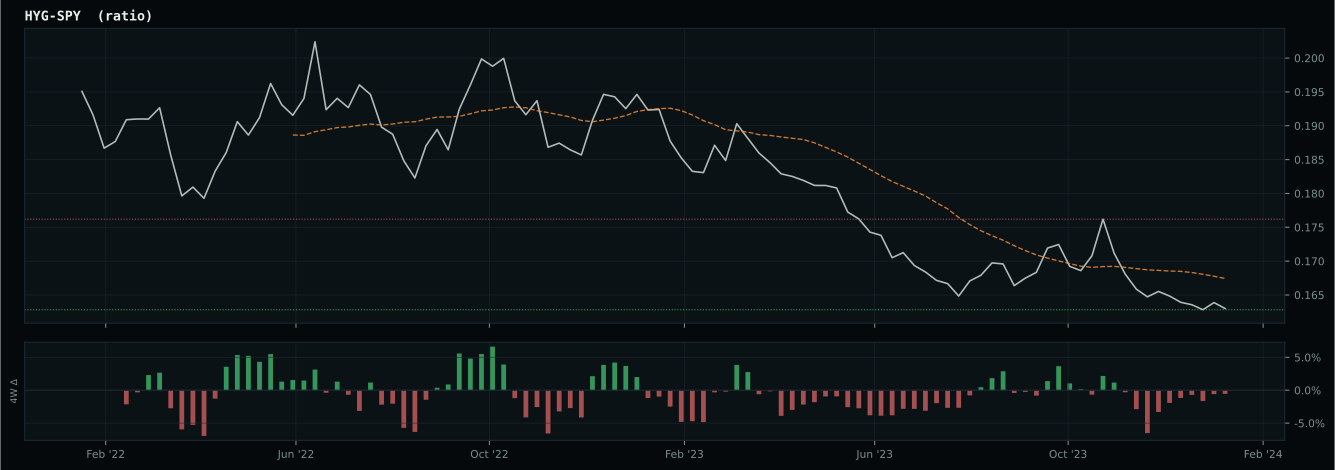
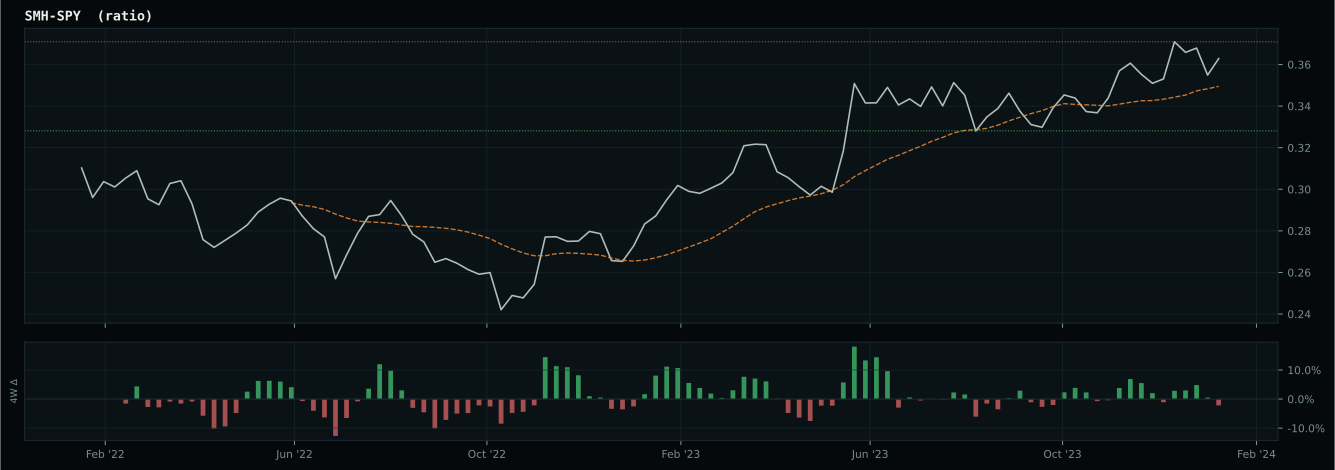
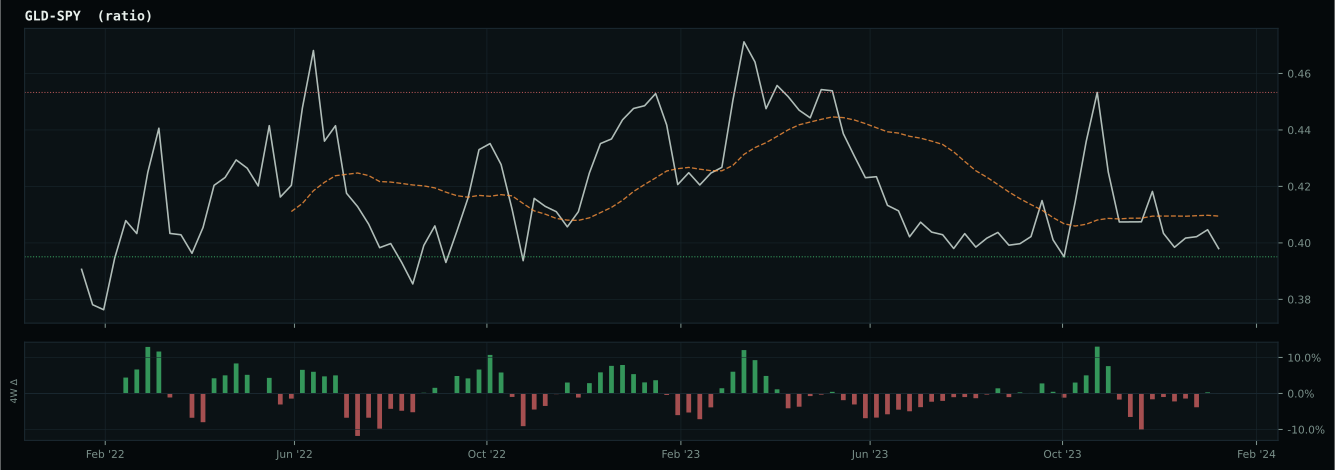
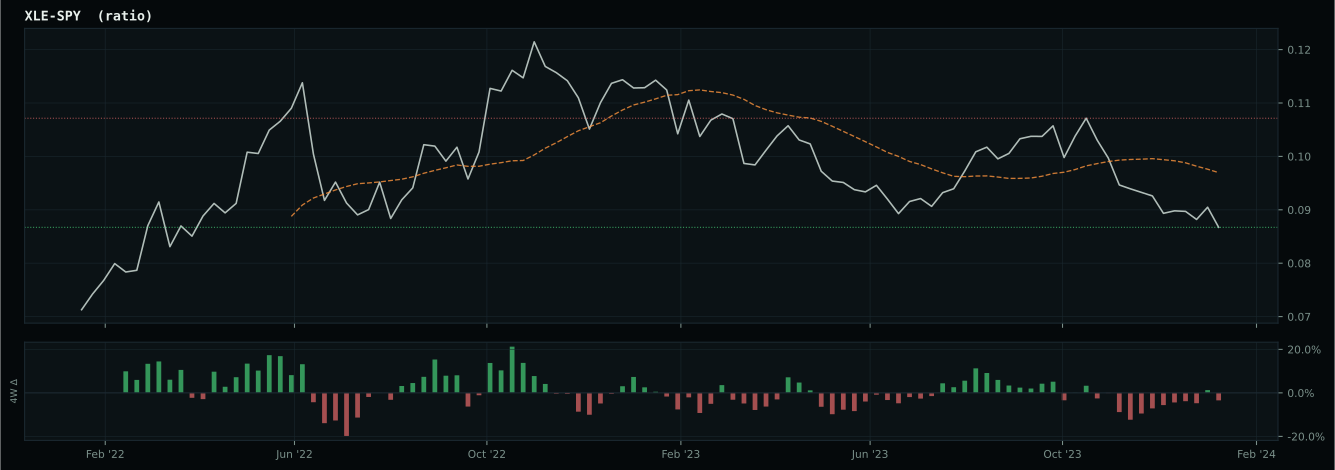
Macro Regime — Disinflation
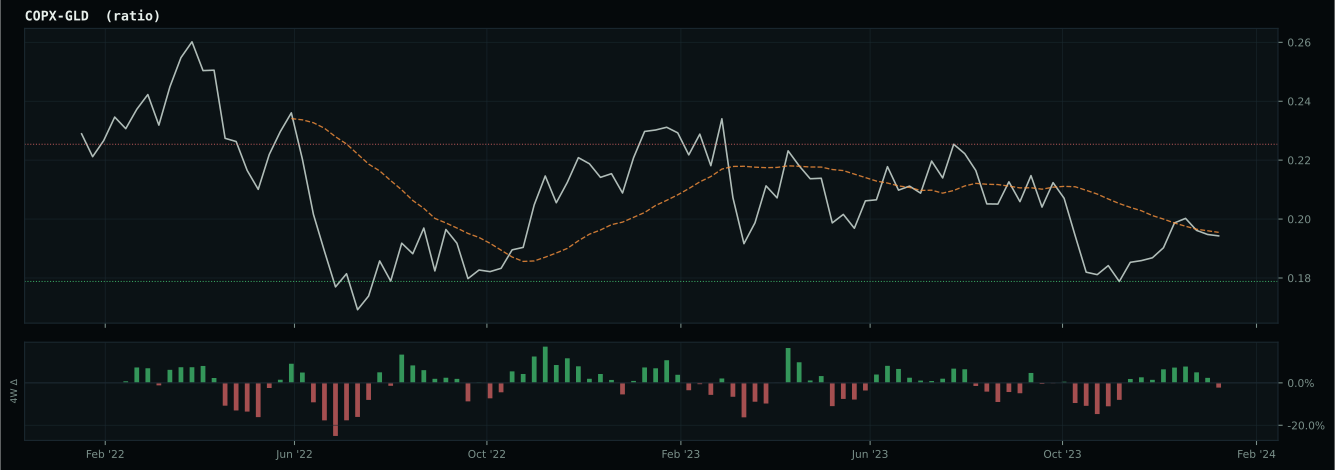
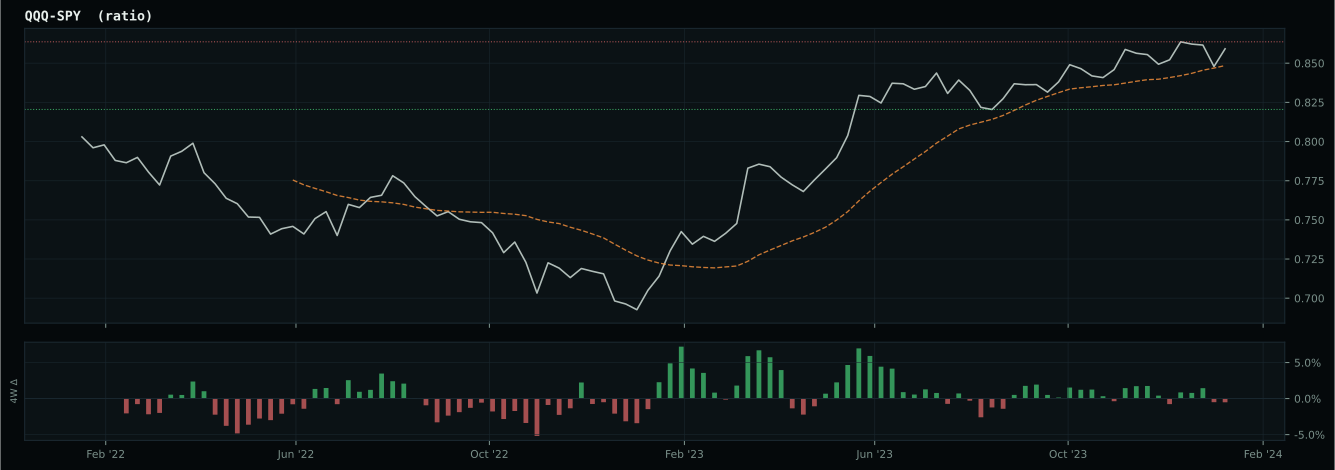
Macro Evidence Charts
Market-implied signals behind the macro regime scores. Each ratio compares two assets; the direction and slope of the ratio is what the macro engine reads.
Crypto Regime — TrendBTC
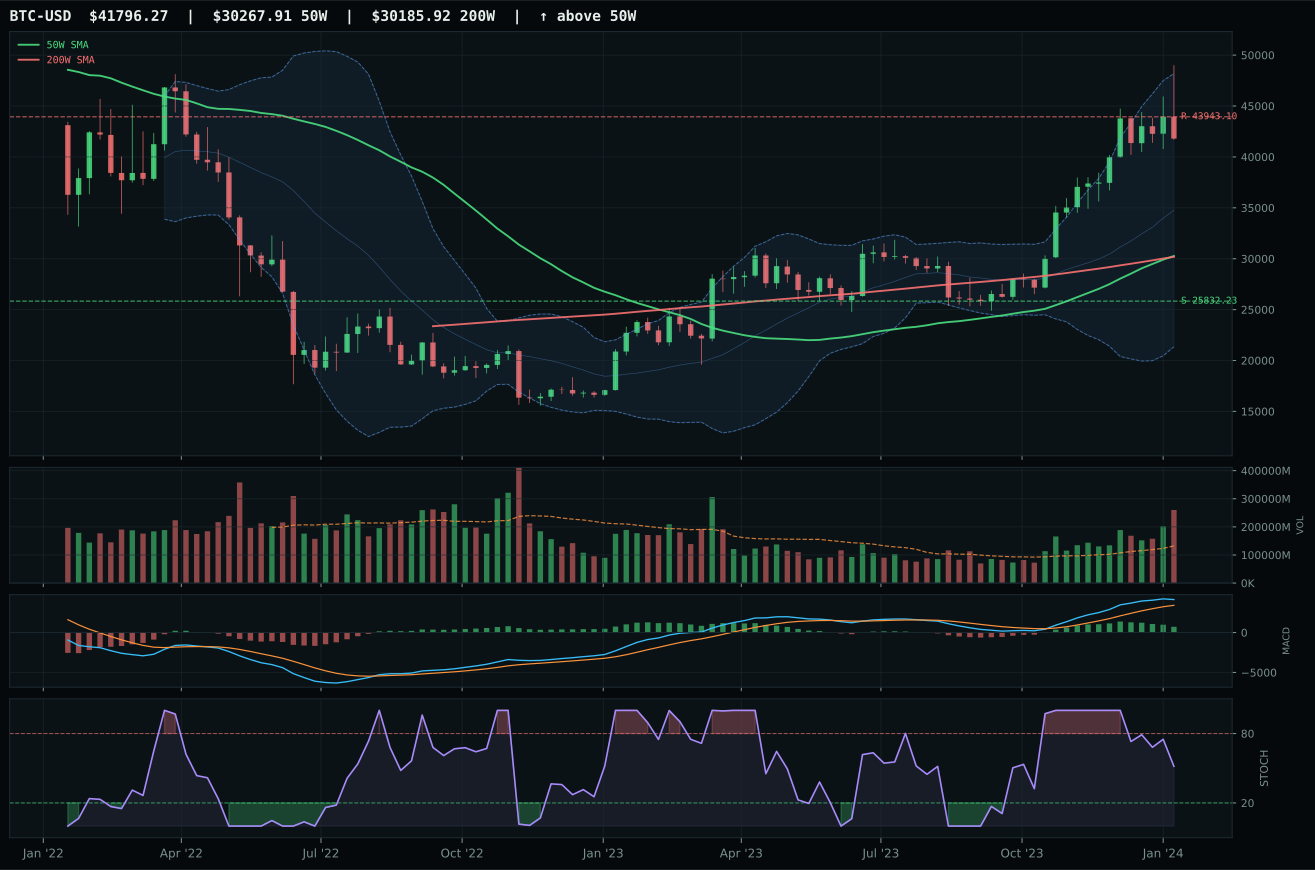
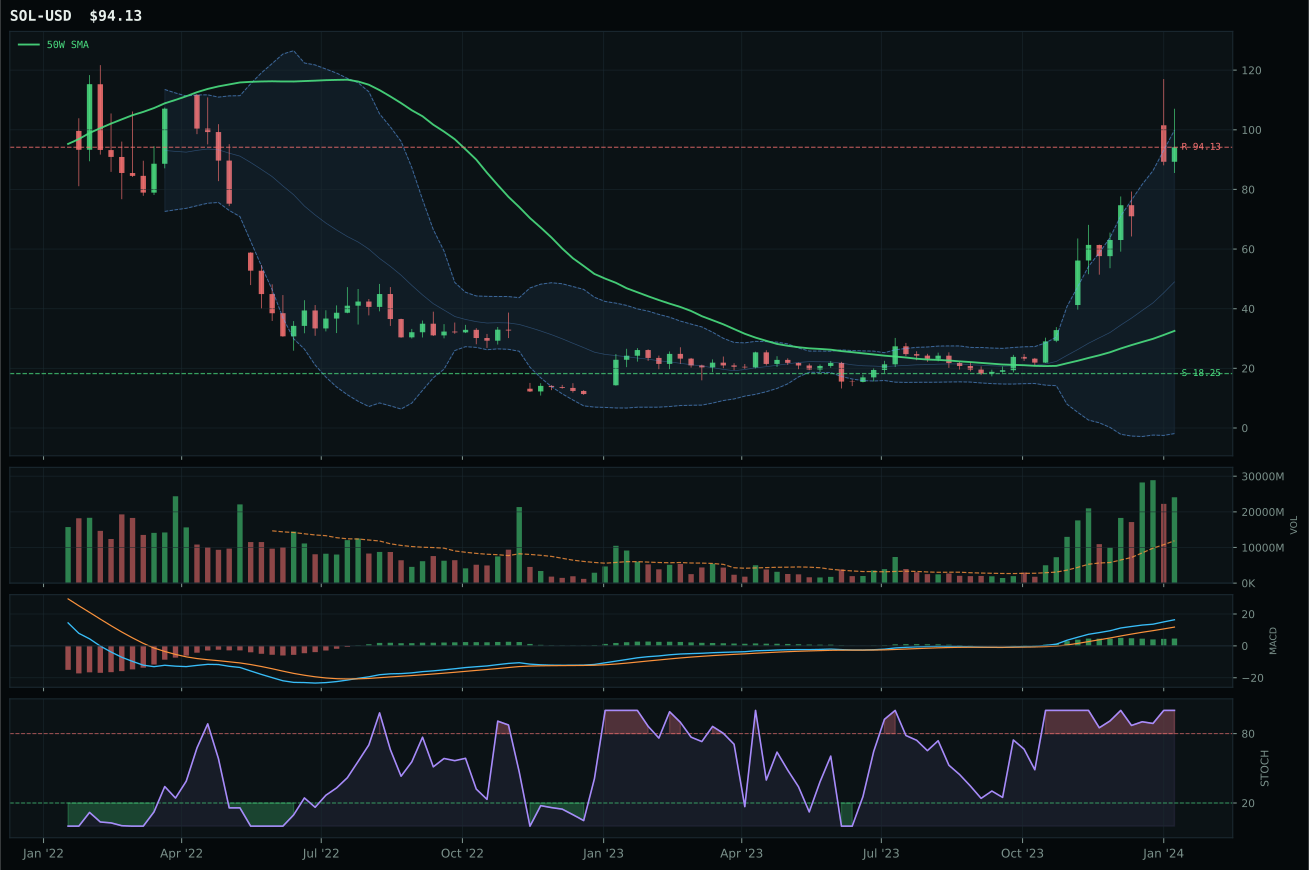
post-touch structure is too wide to count as a range; max/min close ratio is 2.70
TrendBTC confirmed: 2 consecutive closes above rising/flat 50W SMA
one or more available conditions failed
Category Rankings
| Rank | Category | Winner | Score | Alloc | 4W Ret | Peers (4W) |
|---|---|---|---|---|---|---|
| 1 | AI | BOTZ | 66.2 | 20% | +4.68% | AIQ +7.7% · SMH +17.8% |
| 2 | Technology | CIBR | 65.8 | 20% | +7.87% | IGV +8.8% · XLK +8.2% |
| 3 | Nuclear Energy | URNM | 56.0 | 10% | -7.70% | URA -6.5% · NLR -4.5% |
| 4 | Defense & Aerospace | XAR | 52.1 | 10% | +2.16% | ITA +2.8% · ROKT +0.7% |
| 5 | Emerging Markets | INDA | 50.5 | 10% | +0.88% | ILF -0.7% · IEMG +2.5% |
| 6 | Utilities & Infrastructure | PAVE | 48.3 | 10% | +7.42% | IGF -3.8% · XLU -4.3% |
| 7 | Precious Metals | GLD | 39.7 | 10% | -1.35% | SLV -2.4% · GDX -7.8% |
| 8 | Industrial Metals | COPX | 14.1 | 10% | -4.97% | PICK -2.4% · REMX -10.4% |
| 9 | Traditional Energy | FCG | 1.6 | 0% | -2.50% | XLE +1.3% · XOP +0.0% |
| 10 | Agriculture & Livestock | MOO | — | 0% | -2.37% | VEGI -1.9% · WEAT -3.5% |
AI — BOTZ
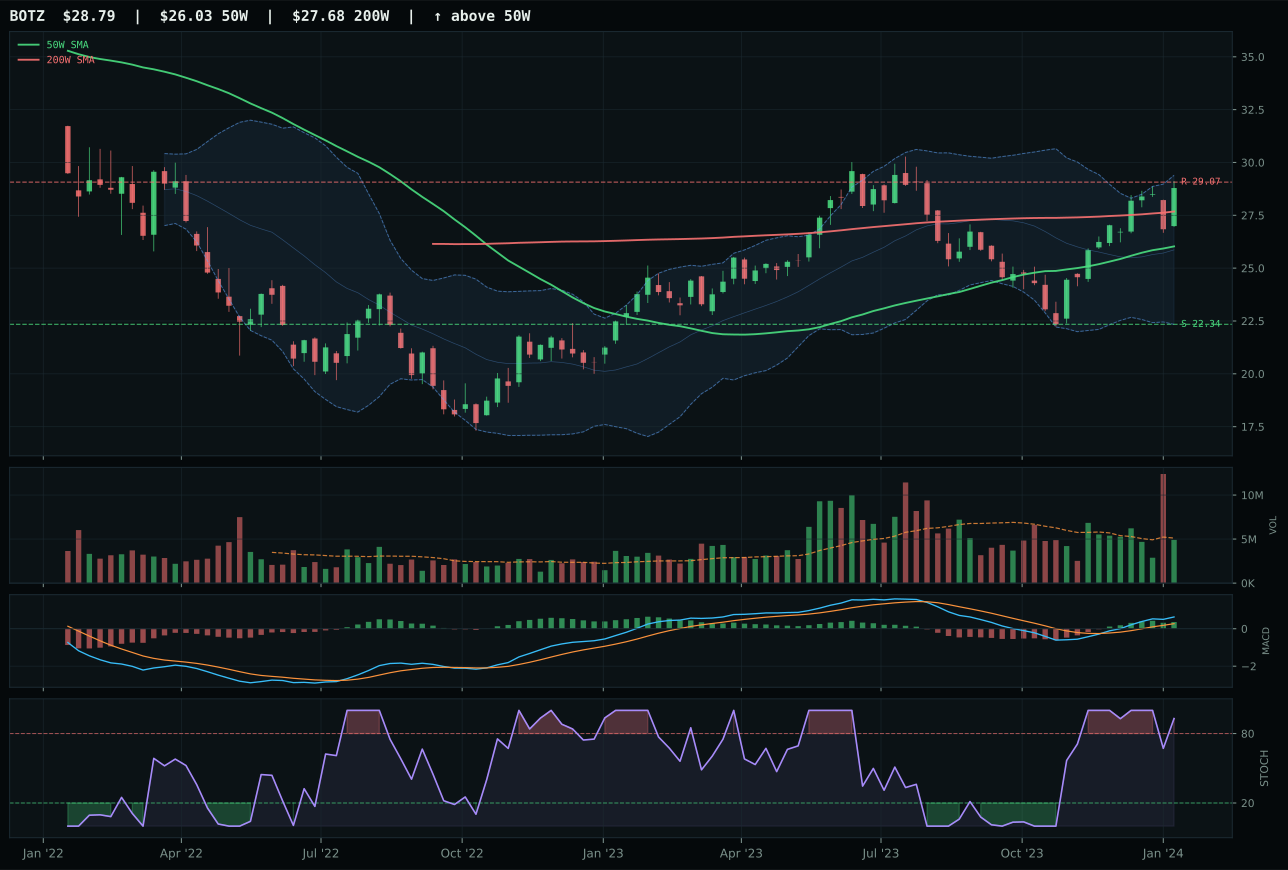
BOTZ has a neutral structure profile with 8.1% 13-week relative strength versus SPY.
A failed hold above support would weaken the setup.
Actionable but governed by invalidation levels.
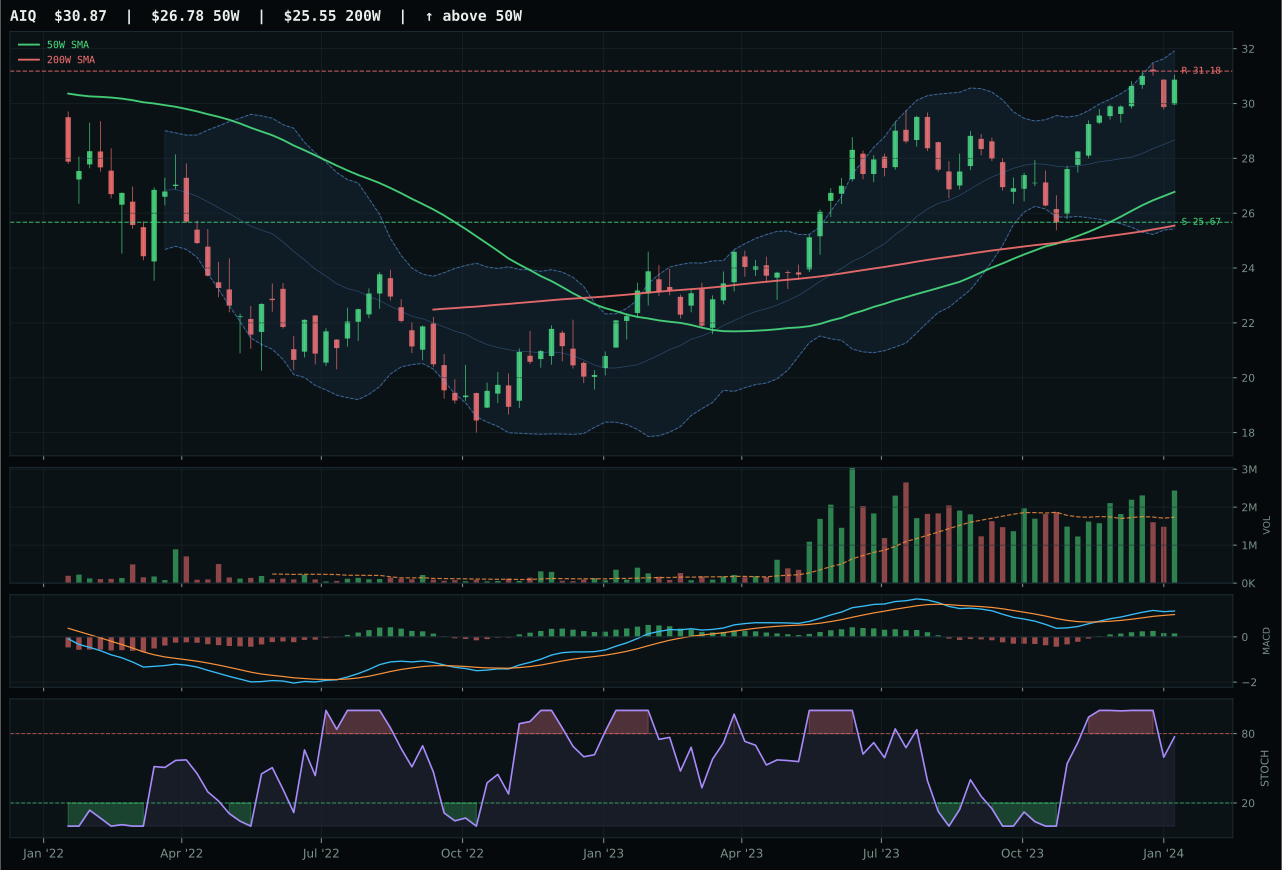
AIQ has a vertical extension profile with 3.4% 13-week relative strength versus SPY.
A failed hold above support would weaken the setup.
Actionable but governed by invalidation levels.
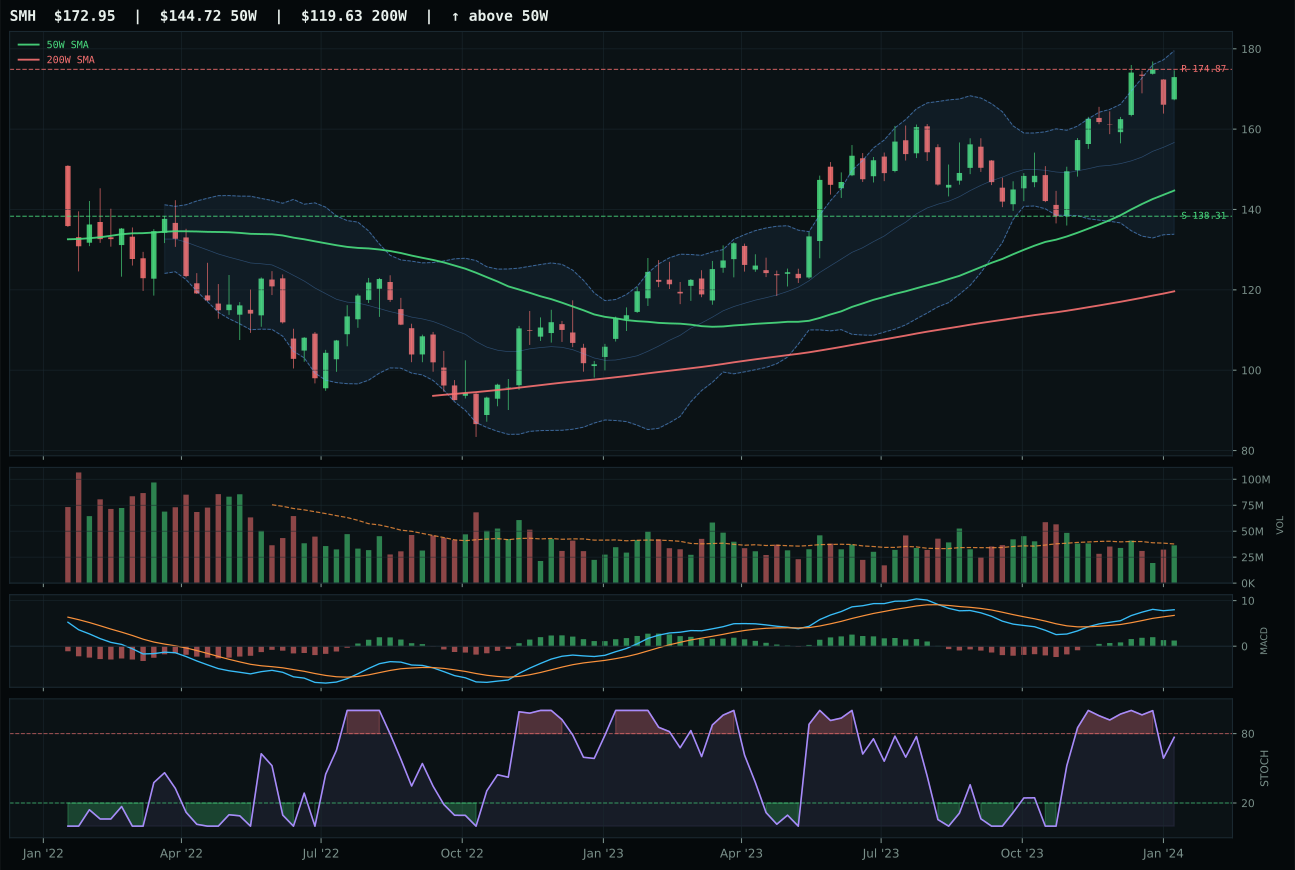
SMH has a vertical extension profile with 6.1% 13-week relative strength versus SPY.
A failed hold above support would weaken the setup.
Actionable but governed by invalidation levels.
BOTZ won cleanly because its 8.1% relative strength versus SPY and 2.0% category-relative strength translated into measurable buying power without the extension penalty that crushed timing scores elsewhere. The 10.6% distance from the 50W represents ideal entry tension—close enough to confirm trend strength, far enough to avoid being purely a momentum tail chase—and MACD's improving confirmation (bullish and improving, not just bullish) separated it sharply from AIQ's flattening progression. Volume at 0.96x average proved neutral rather than rejecting, which matters in robotics where industrial demand cycles matter as much as sentiment; AIQ's above-average participation actually hurt its case because it suggested distribution into strength rather than institutional accumulation. A fifteen-point gap to AIQ reflects not statistical noise but structural divergence: BOTZ's setup is neutral structure (room for expansion) while AIQ sits in vertical extension (exhaustion territory), and that setup difference compounds across trend, timing, and risk/reward.
AI's 66.2 category score secured the second top-2 slot, and the allocation followed at 10%. The 14-point AI growth sponsorship boost from the active macro checklist provided tailwind for both BOTZ and the category, but the real driver was BOTZ's technical superiority—81.8 technical evidence versus 71.7 for CIBR, the other top-2 candidate. The disinflation regime supports growth exposure, and robotics specifically benefits from the intersection of capital reallocation and productivity cyclicality. Risk lies in the 45.6 risk/reward score: upside to resistance sits virtually at parity, meaning any rejection near 29.07 invites immediate pressure downward 28.9% to support. The allocation stays at 10% on the strength of momentum confirmation and relative strength, but this is a leader that will move fast in either direction if macro conditions shift toward credit stress or risk-off.
Technology — CIBR
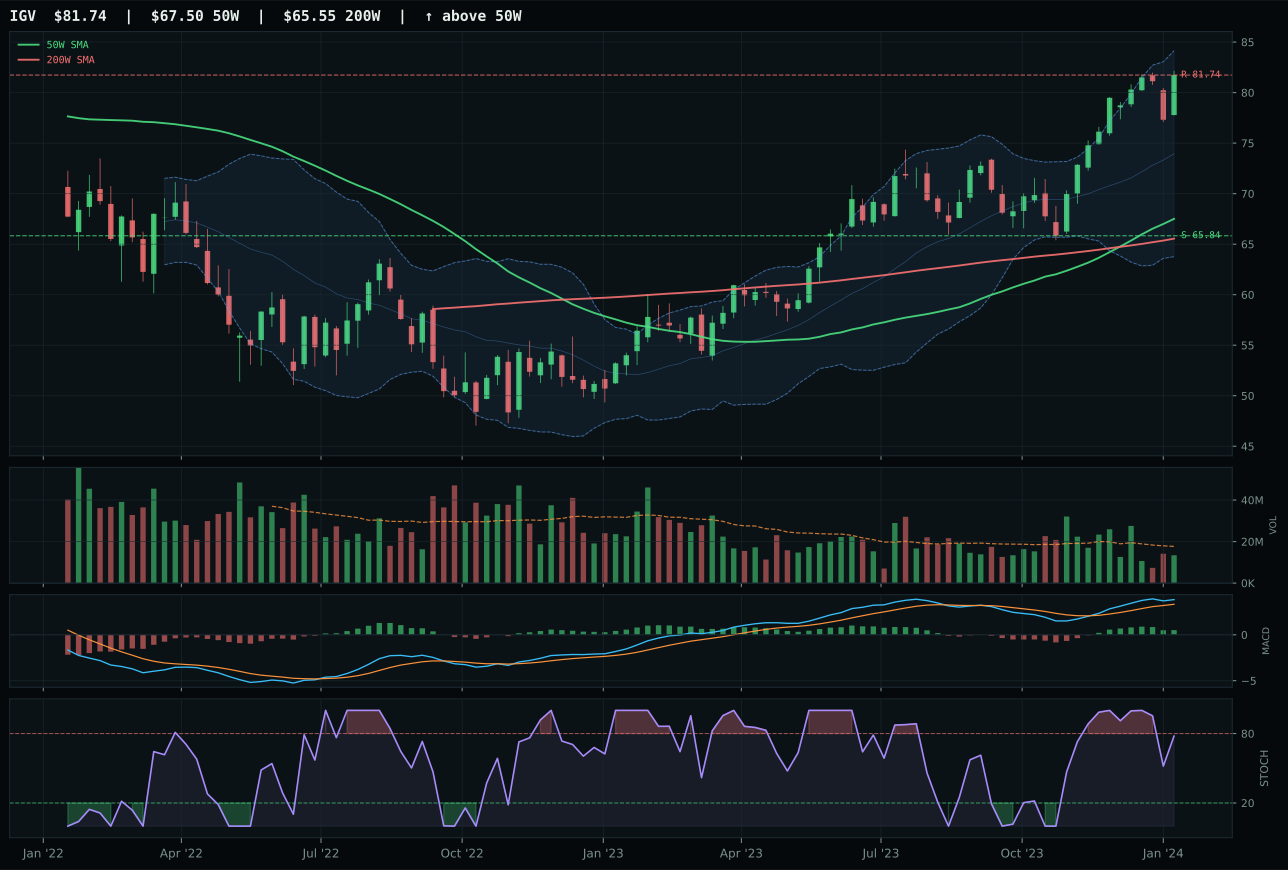
IGV has a vertical extension profile with 6.5% 13-week relative strength versus SPY.
A failed hold above support would weaken the setup.
Actionable but governed by invalidation levels.
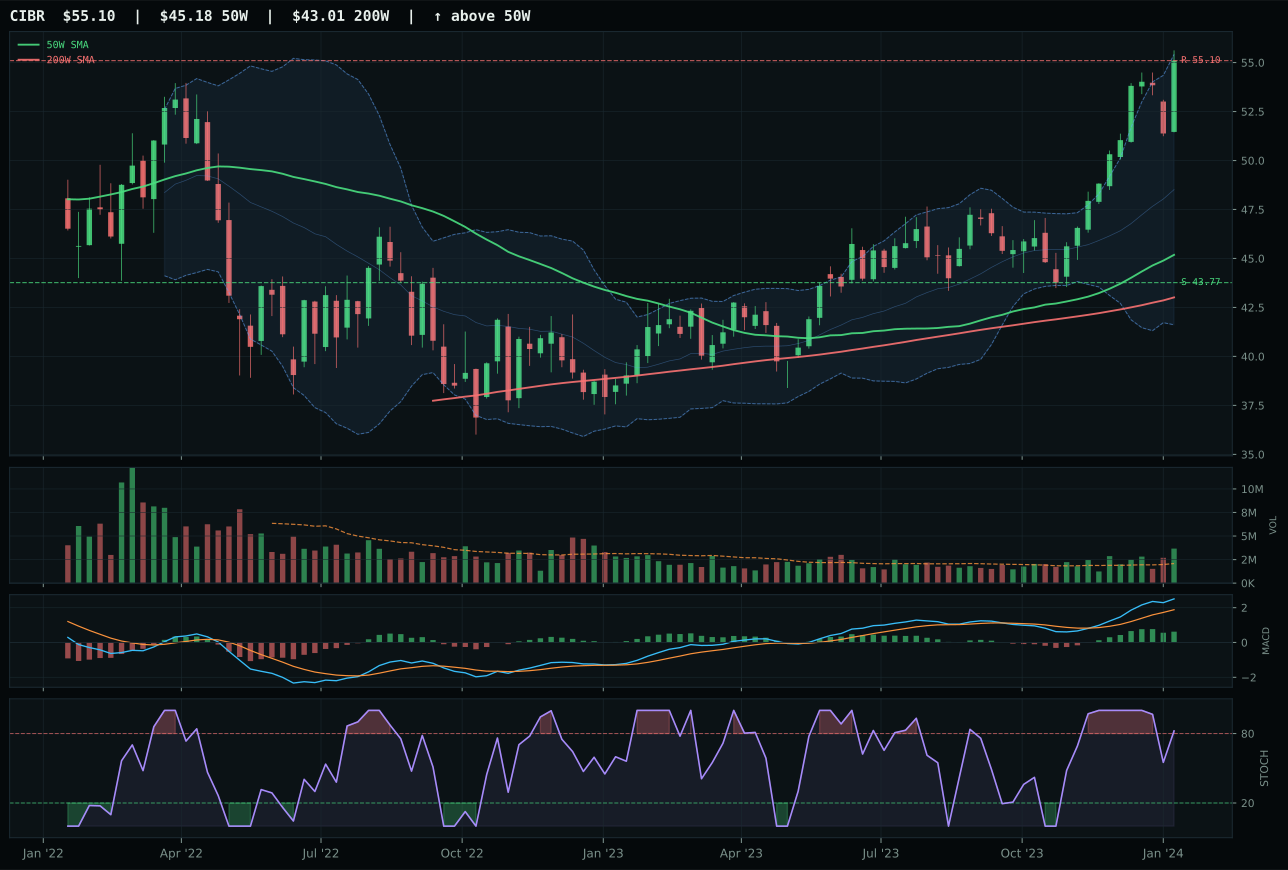
CIBR has a vertical extension profile with 9.2% 13-week relative strength versus SPY.
A failed hold above support would weaken the setup.
Actionable but governed by invalidation levels.
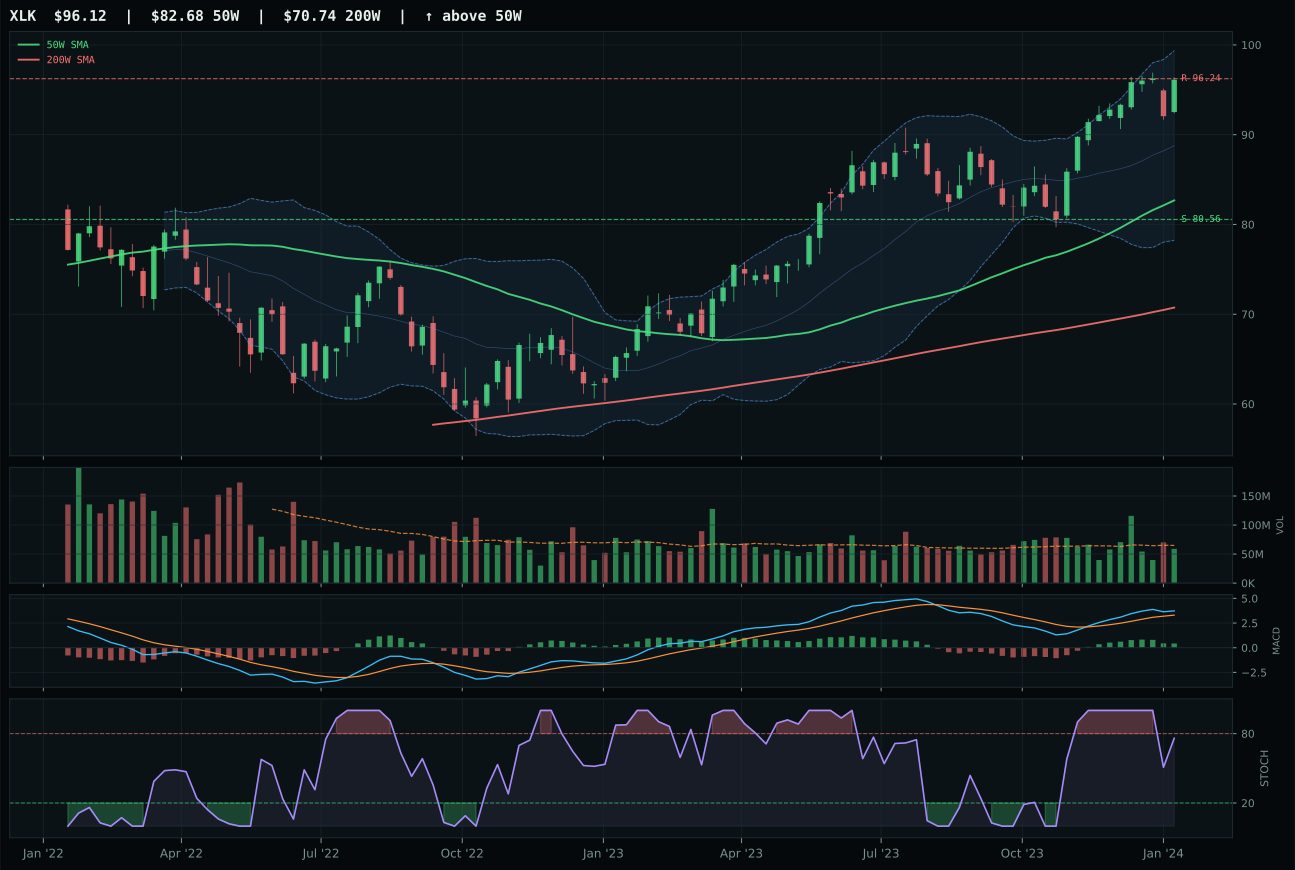
XLK has a vertical extension profile with 3.5% 13-week relative strength versus SPY.
A failed hold above support would weaken the setup.
Actionable but governed by invalidation levels.
CIBR seized the category by combining clean vertical extension—21.9% above the 50W—with genuine volume sponsorship at 1.76x the 20W average and category-relative strength of 2.7%. The 19.7% thirteen-week return proved sustainable rather than speculative because MACD remained bullish despite flattening, and the stochastic RSI's overbought roll-over at 0.82 arrived within defined resistance at 55.10, not beyond it. IGV, the runner-up, surrendered on three technical fronts: weaker structure scoring (76.9 vs 85.8), neutral volume confirmation versus accumulation pressure, and inferior category-relative strength at 0.0%, leaving it fighting against extension price action without the breadth to justify higher entry risk. The 1.5-point gap between winners masks CIBR's superior sponsorship—pure momentum without volume is noise, and CIBR had both.
Technology earned its 10% allocation as the stronger of two eligible top-2 candidates, but the 65.8 category score masks real tension between setup quality and timing risk. The disinflation macro backdrop helps growth names, and the active AI sponsorship descriptor adds juice, but CIBR sits 21.9% extended into a Fibonacci 0.236 zone where every buyer from here is chasing strength that's already priced in. The 22.0 timing score—half of what a mean-reversion setup would show—reflects this asymmetry. Allocation stayed in the portfolio because technical leadership was clean enough to warrant the seat, but the category is vulnerable to any broadening of credit stress or rotation away from defensive tech; any deterioration in the 50W slope or volume confirmation would immediately signal a step down to 5% or exclusion.
Nuclear Energy — URNM
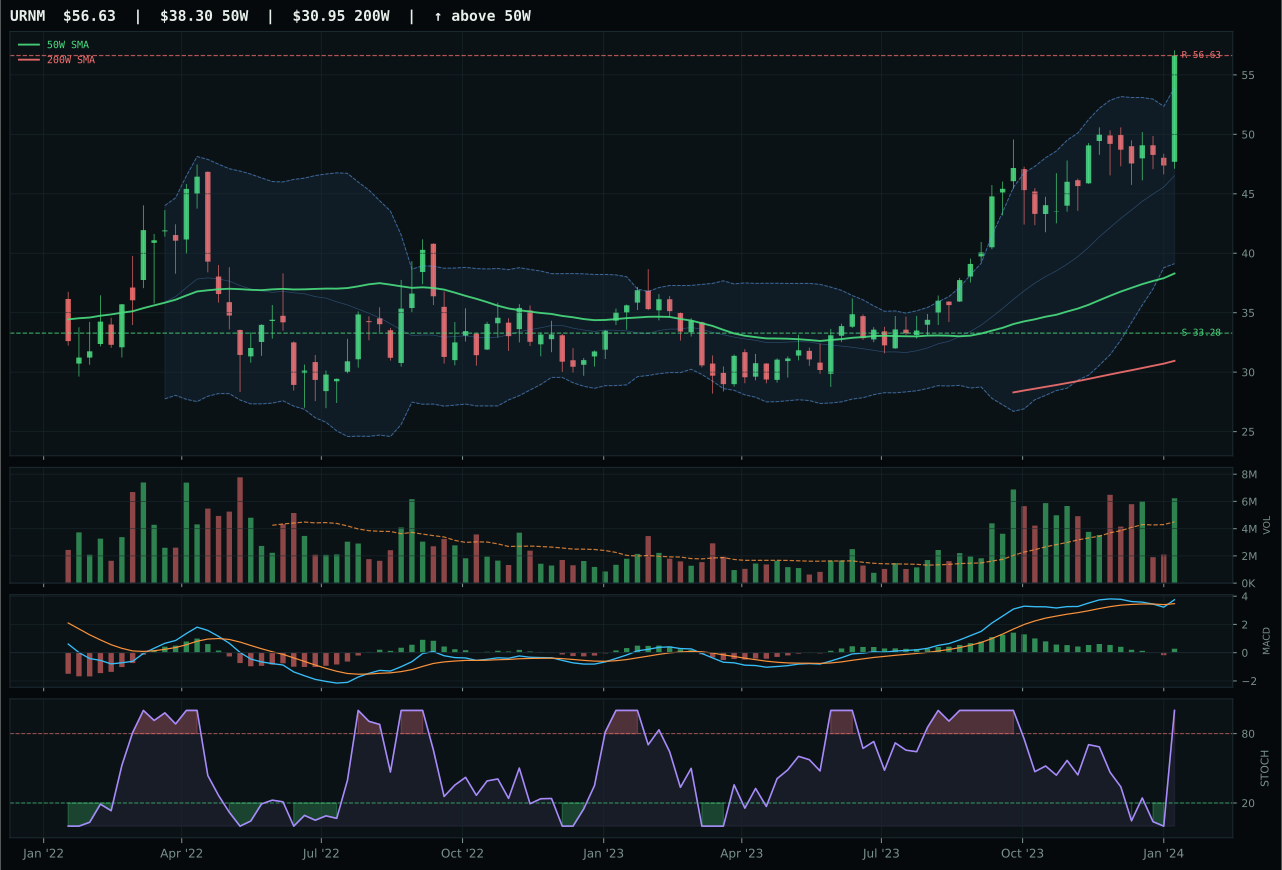
URNM has a vertical extension profile with 20.3% 13-week relative strength versus SPY.
A failed hold above support would weaken the setup.
Actionable but governed by invalidation levels.
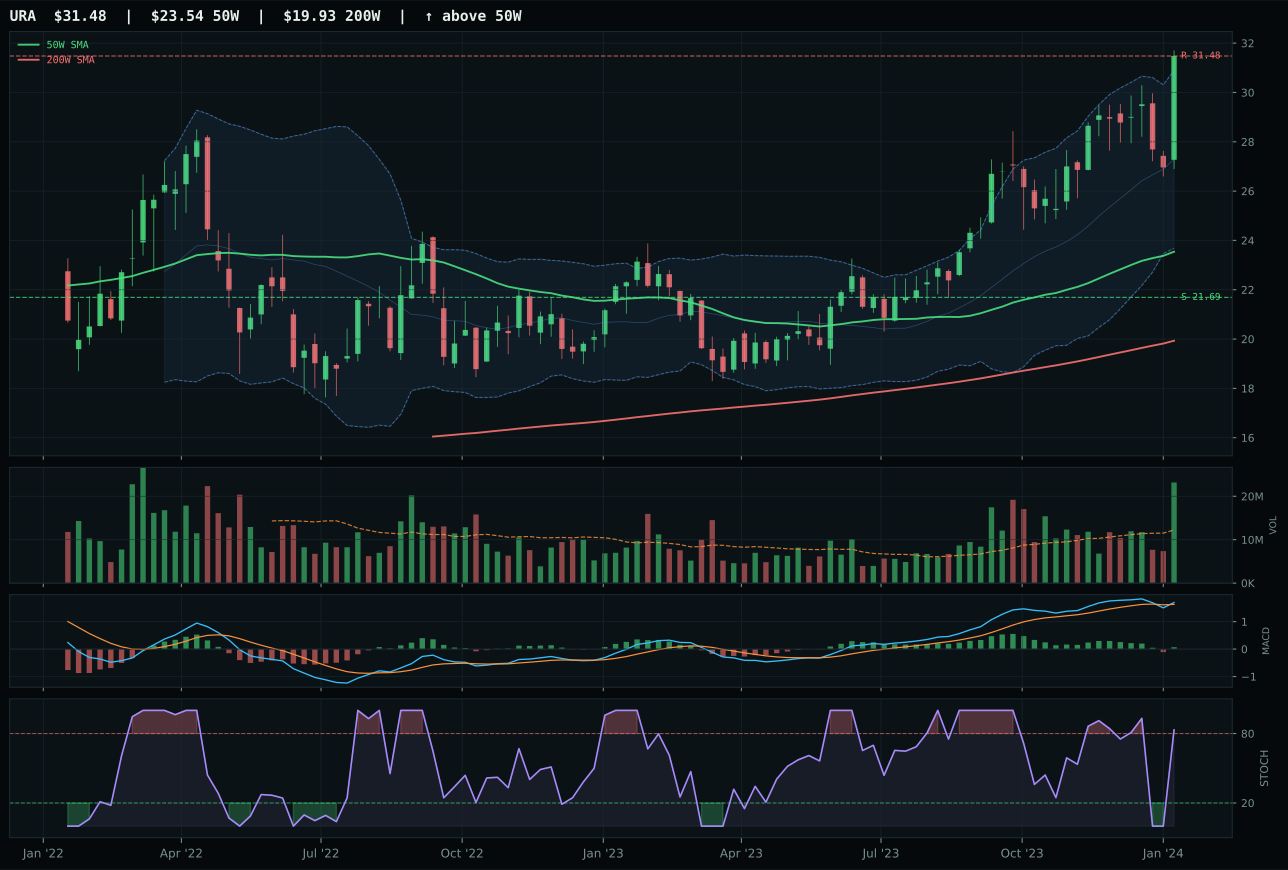
URA has a vertical extension profile with 14.0% 13-week relative strength versus SPY.
A failed hold above support would weaken the setup.
Actionable but governed by invalidation levels.
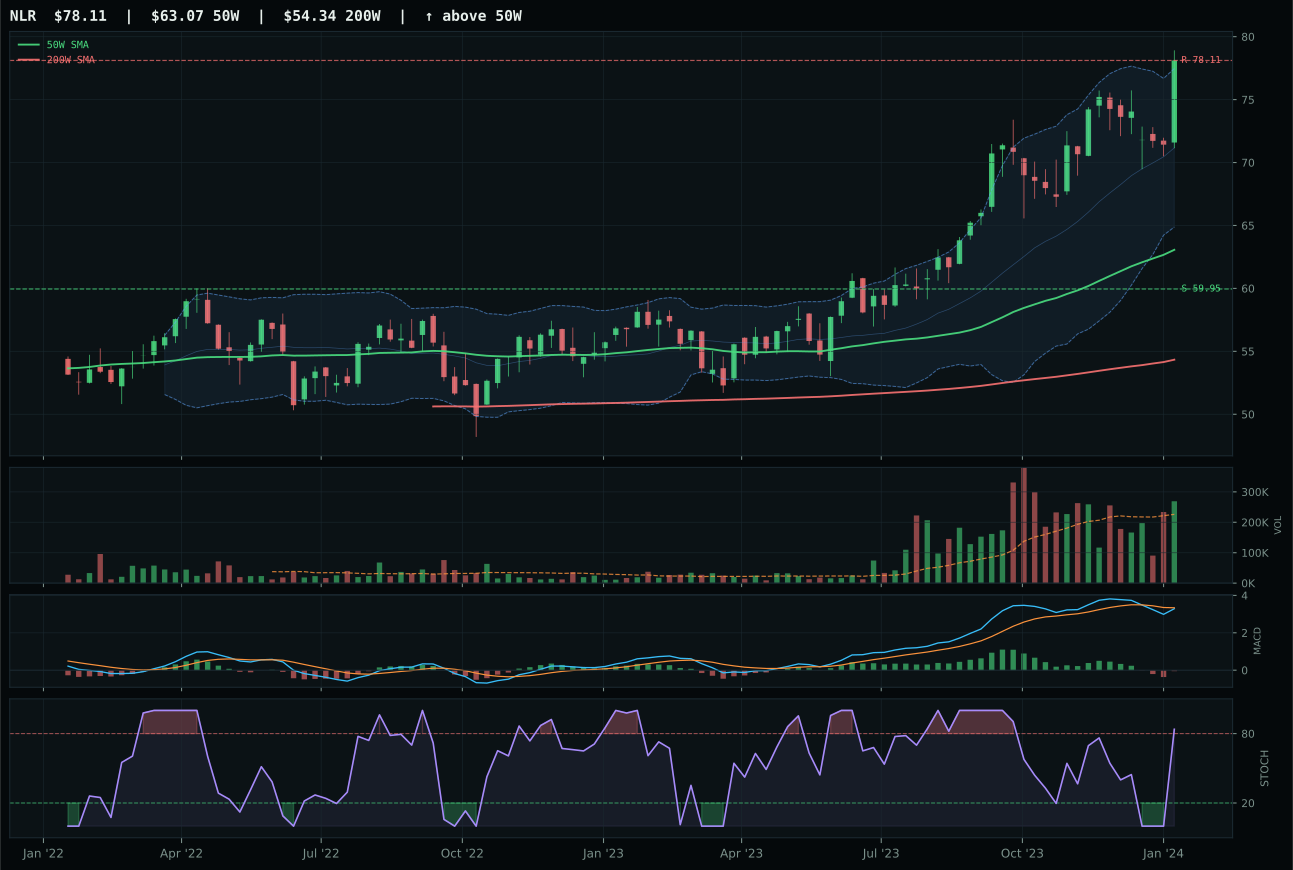
NLR has a vertical extension profile with 3.5% 13-week relative strength versus SPY.
A failed hold above support would weaken the setup.
Actionable but governed by invalidation levels.
URNM dominated a close category (1.5-point edge over URA) because momentum confirmation scored a perfect 100.0 against URA's 100.0—identical on raw returns—but MACD's improving confirmation versus URA's flattening progression proved decisive. URNM's 30.8% thirteen-week return and 20.3% relative strength to SPY created momentum that was both real and confirmed by improving technical breadth, whereas URA's 24.4% return in the same period accompanied flattening momentum confirmation, suggesting the rally was losing power even as it persisted. The structure difference matters equally: URNM sits 47.9% extended from the 50W in pure vertical extension, which normally screams exit signals, but the persistence score (93.0) and volume confirmation (above-average participation at 1.39x) prove buyers are still active and accumulating rather than distributing into exhaustion. Timing scored only 37.0 for URNM because extension always damages timing scores, yet the 93.0 persistence tells the truth—this is a real move with sponsorship, not a momentum tail chase with deteriorating breadth.
Nuclear earned 5% allocation despite a 56.0 category score (ranked 6th) because URNM's technical momentum is exceptional and risk appetite is currently active. The macro fit of 43.0 is neutral—no category-specific descriptor advantage, but risk appetite positive (+5) and AI growth sponsorship (+5) provide modest tailwind in a TrendBTC regime that favors momentum. The real tension is the 39.0 risk/reward: URNM has zero upside to resistance at 56.63 (already there), but a steep 70.2% downside to support at 33.28 if the move reverses. This is a momentum-extension position, not a value buy. Allocation at 5% is justified only because the move is genuinely extended (not marginal), MACD is improving (not flattening), and the macro backdrop tolerates risk-on exposure. The position is vulnerable to any uptick in credit stress or rotation toward defensive assets; if stochastic RSI rolls over from 1.00 while MACD flattens, the category immediately converts to 0%. Hold for momentum persistence, exit on first technical breakdown.
Defense & Aerospace — XAR
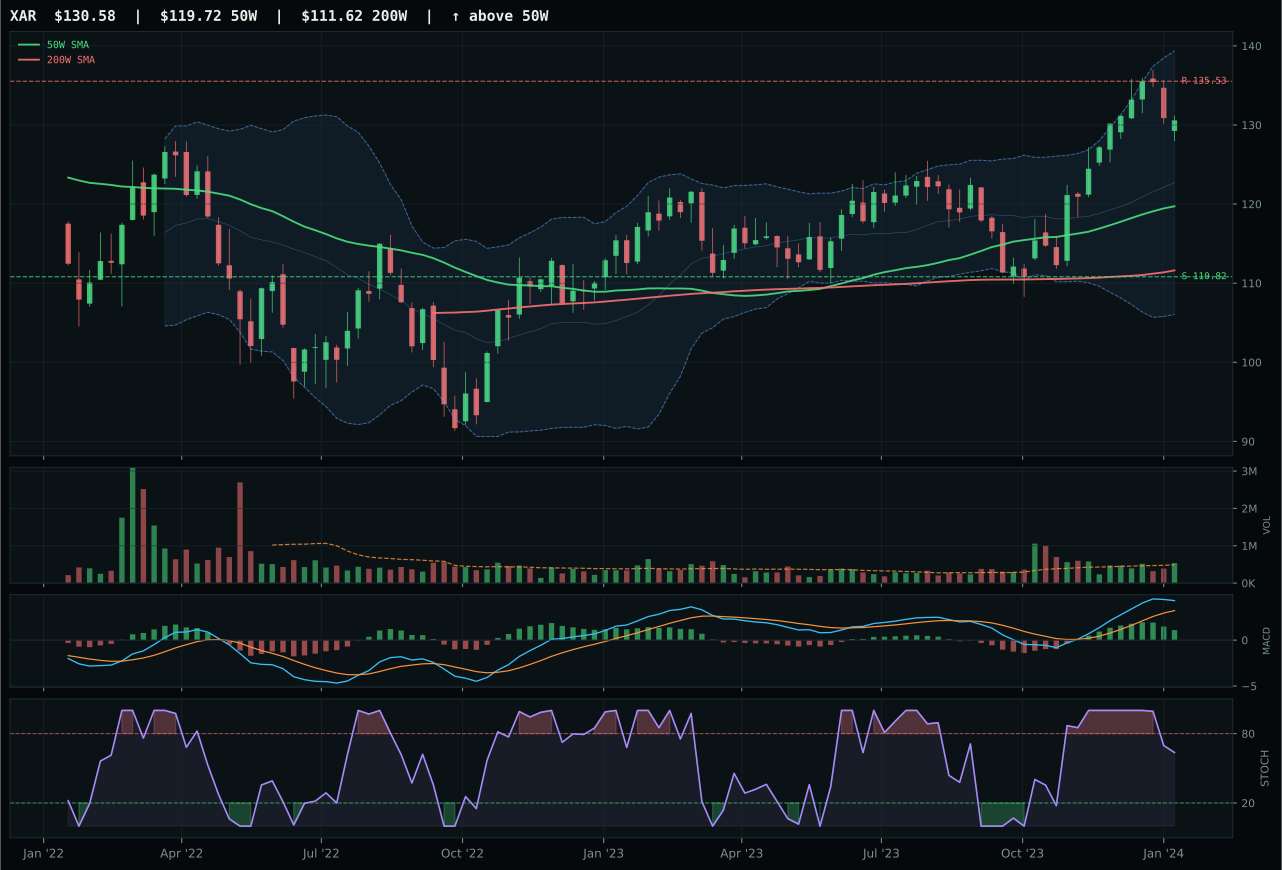
XAR has a neutral structure profile with 2.7% 13-week relative strength versus SPY.
A failed hold above support would weaken the setup.
Actionable but governed by invalidation levels.
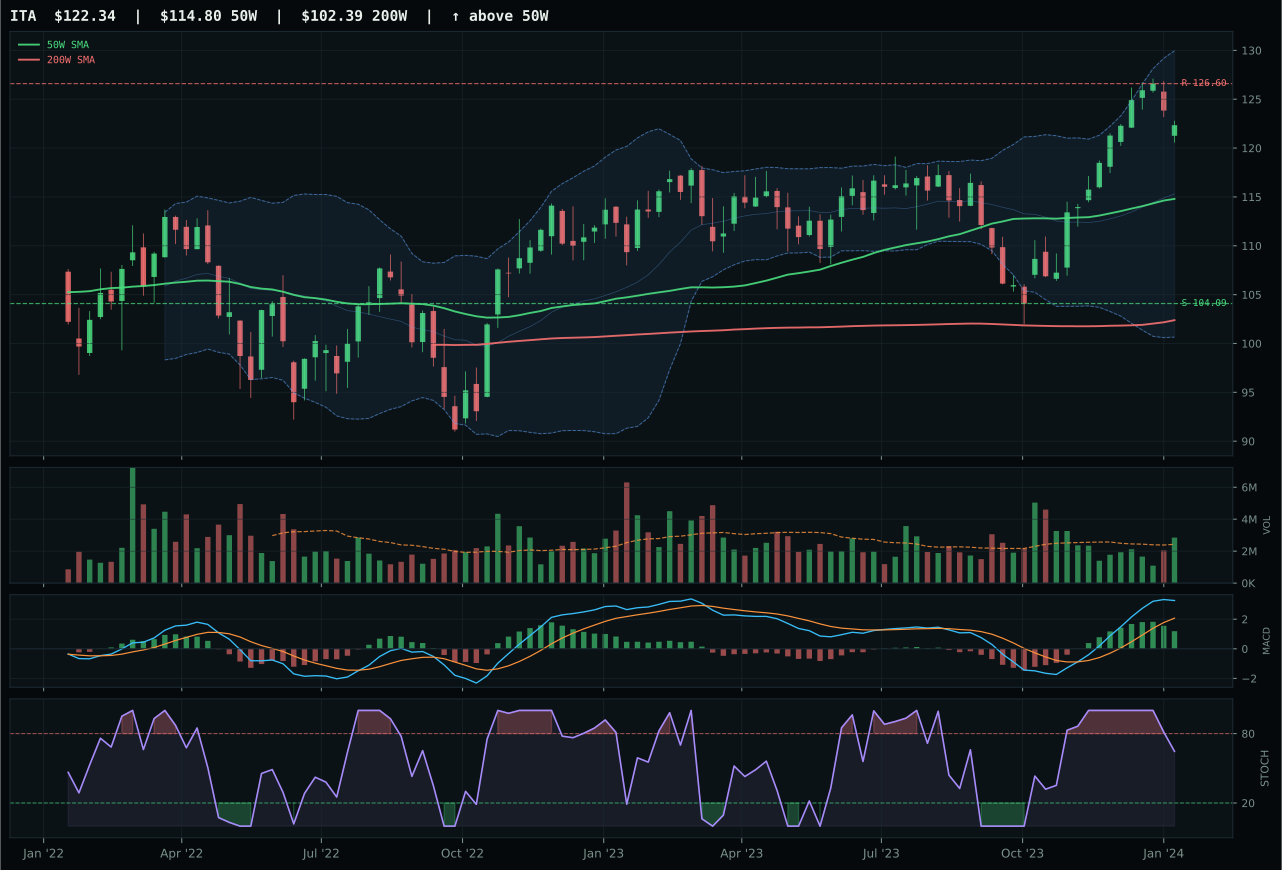
ITA has a neutral structure profile with 2.1% 13-week relative strength versus SPY.
A failed hold above support would weaken the setup.
Actionable but governed by invalidation levels.
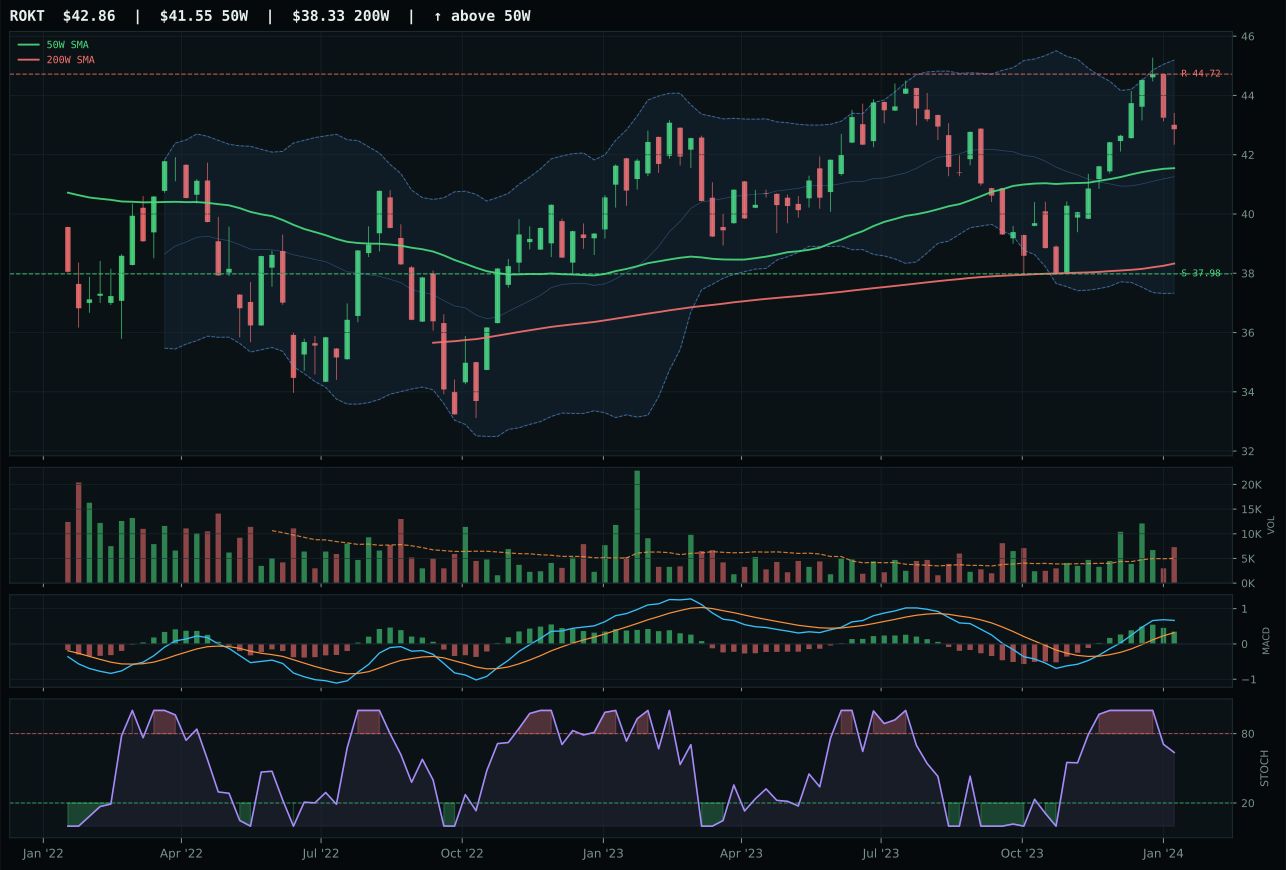
ROKT has a neutral structure profile with -2.5% 13-week relative strength versus SPY.
A failed hold above support would weaken the setup.
Tracked, but not top-2 eligible because: .
XAR won on the slimmest margin—a 0.6-point edge over ITA—because category-relative strength of 0.6% and neutral structure created a fractionally better entry setup than ITA's above-average volume, which suggested late participation rather than fresh accumulation. Both ETFs occupy identical territory: 9% above their 50W, neutral structure, timing scores of 70.0, and risk/reward near parity. The margin between them came down to execution: XAR's 13.1% thirteen-week return exceeded ITA's 12.6%, and that single percentage point, combined with marginally cleaner price action (58.3 cleanliness vs ITA's unspecified), gave XAR the right to represent. Neither ETF has exceptional breadth, but XAR's quieter accumulation—neutral volume at 1.09x average—looks more like patient long-term accumulation than ITA's above-average participation, which risks being caught in the tail of a trade rather than the belly.
Defense & Aerospace earned a 5% allocation as a mid-tier category (ranked 5th of eligible names) in a portfolio tilted toward AI and broad risk sentiment. The 52.1 category score reflects weakness: trend is strong at 100.0, but structure (74.6), timing (70.0), and especially momentum confirmation (70.7) all suffer from the lack of fresh directional conviction. The macro fit of 50.0 suggests neutrality on descriptor alignment—the category has no specific sensitivity to liquidity stress or credit stress that would amplify or dampen disinflation tailwinds. XAR's 2.7% SPY-relative return is respectable but uninspiring, and the fact that ITA trades above XAR on composite technical scores but lost on category-relative metrics suggests the category itself is in a holding pattern rather than building power. Five percent is the allocation for categories with traction but not heat; any broadening weakness in volume or a close below 110.82 would immediately convert this to exclusion.
Emerging Markets — INDA
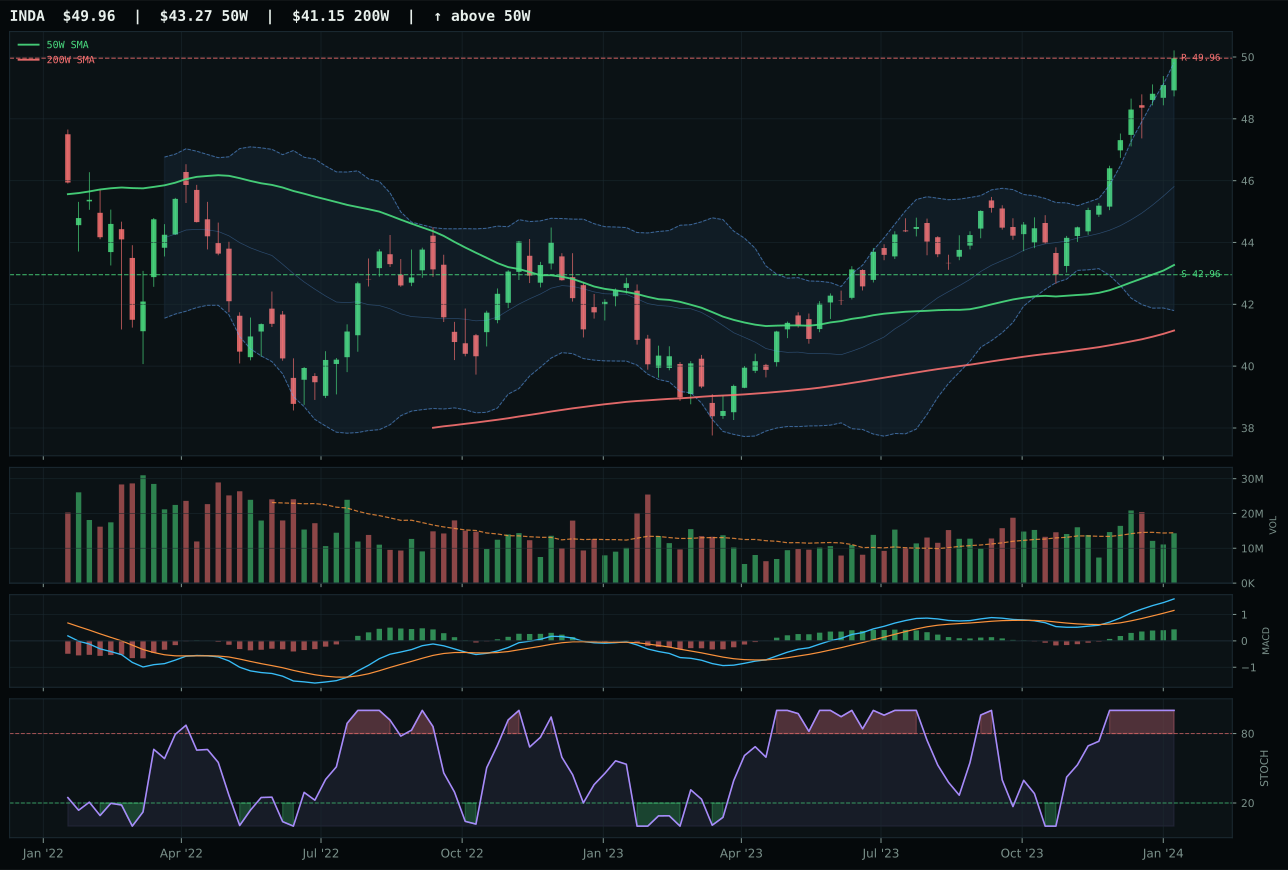
INDA has a vertical extension profile with 1.9% 13-week relative strength versus SPY.
A failed hold above support would weaken the setup.
Actionable but governed by invalidation levels.
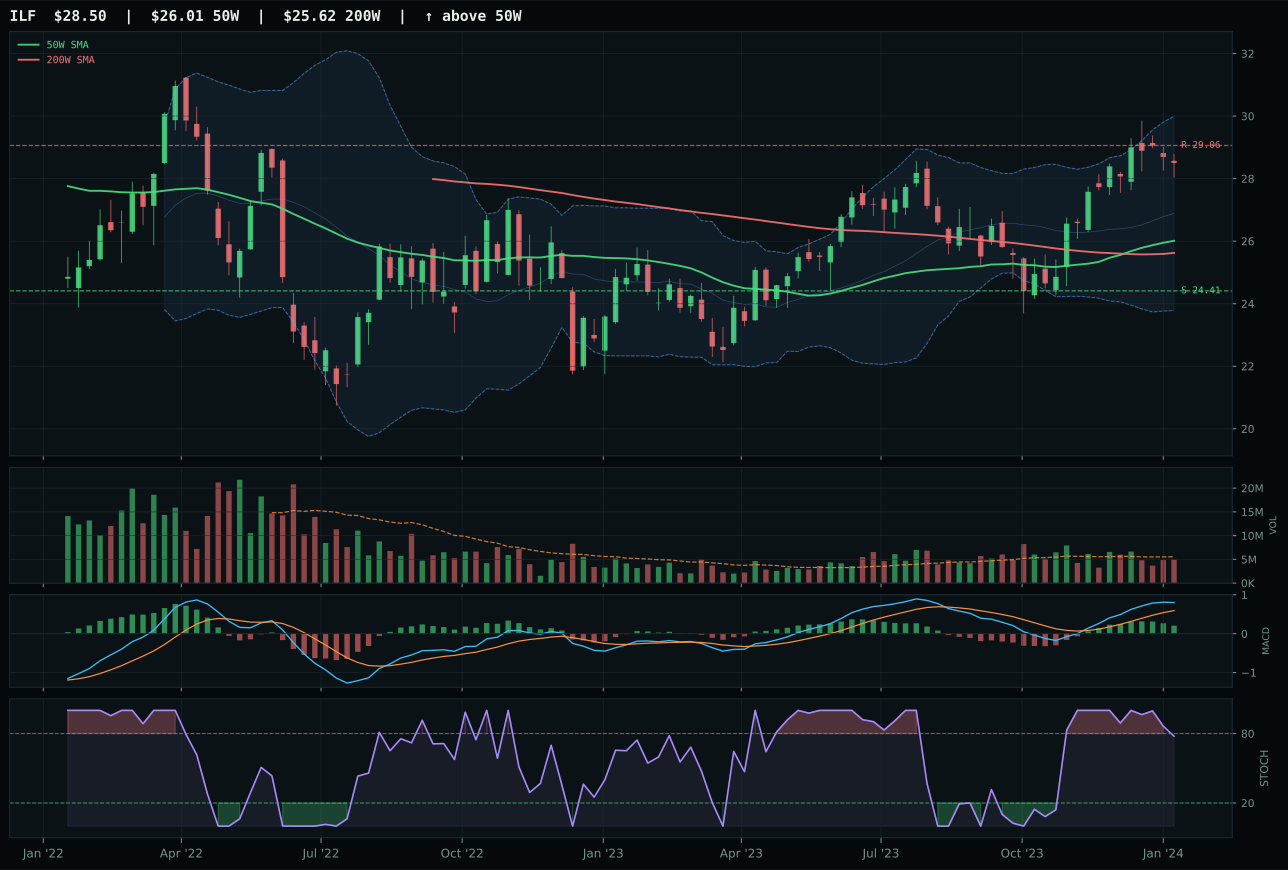
ILF has a neutral structure profile with 3.8% 13-week relative strength versus SPY.
A failed hold above support would weaken the setup.
Actionable but governed by invalidation levels.
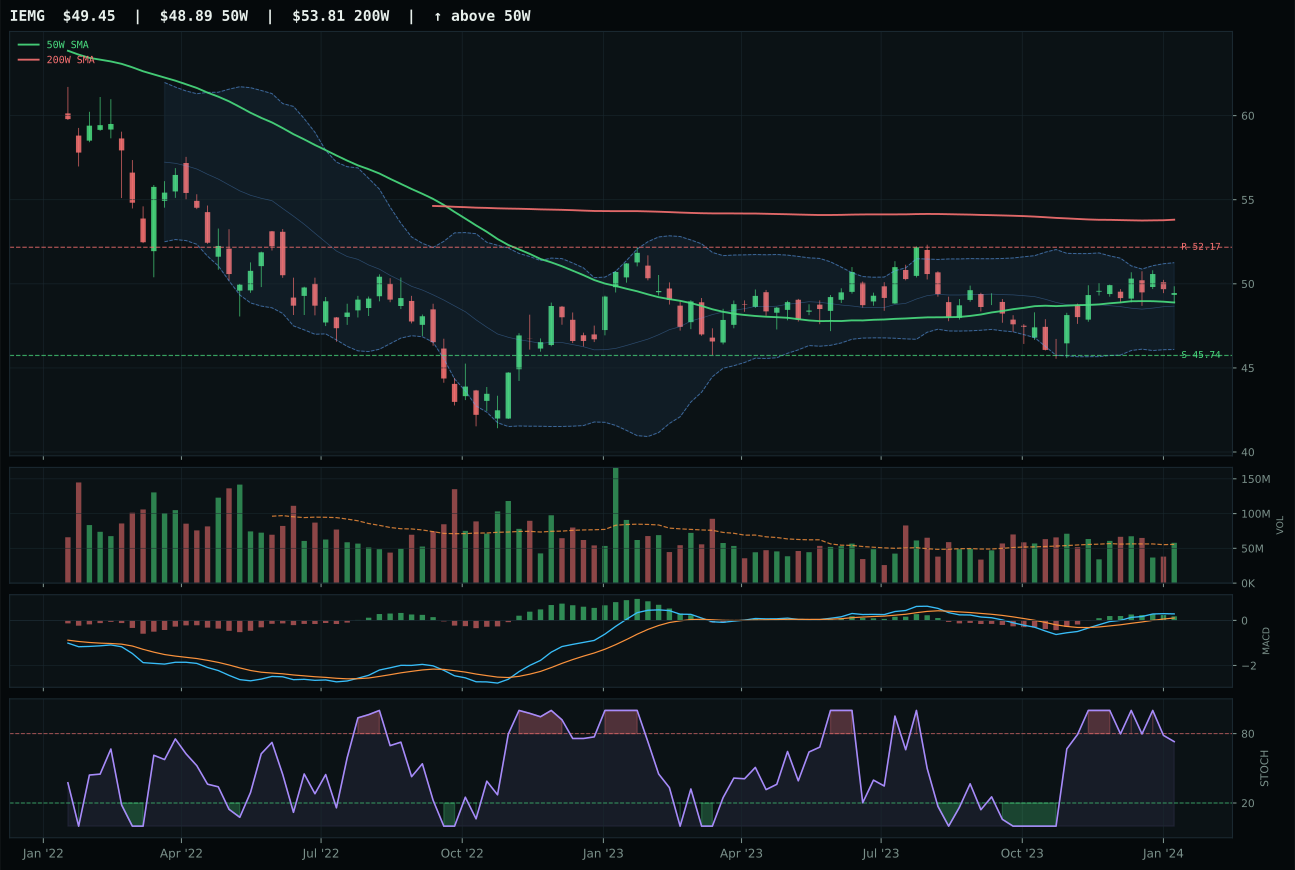
IEMG has a compression near 50W profile with -6.2% 13-week relative strength versus SPY.
A failed hold above support would weaken the setup.
Actionable but governed by invalidation levels.
INDA won a clear category decision (9.1-point gap to ILF) because its structure scored 86.2—the highest in the emerging markets category—and MACD's improving confirmation separated it decisively from ILF's bullish but flattening progression in otherwise similar extended setups. Both ETFs sit above their 50W and 200W with vertical extension (INDA 15.5%, ILF in upper retracement), but INDA's cleanliness score of 91.7 reflects India's institutional quality thesis, while ILF's 76.8 structure reveals Latin America's commodity and value sensitivity. INDA's category-relative strength of 0.0% might appear weak until context arrives: in a category where emerging market breadth is questionable, neutral relative strength while holding 15.5% extension proves INDA outran its peers through superior price action, not superior relative momentum. Volume at 0.99x average confirms accumulation without panic participation, a setup that says patient capital is positioning in India growth rather than rotating out of it.
Emerging markets earned 5% allocation at a 50.5 category score (ranked 7th), justified by INDA's clean structure and risk appetite tailwind rather than macro conviction. The -10 credit stress and -10 liquidity stress descriptors create headwind, but the +8 risk appetite positive and +8 momentum from technical breadth keep the category in portfolio. INDA's 15.5% extension above the 50W and 37.0 timing score reflect an entry point where new money is paying a premium—not ideal, but acceptable if momentum persists. The macro tension is real: disinflation helps emerging assets theoretically (lower rates reduce debt burden), but credit stress fears and dollar strength usually hurt EM currencies and asset flows. INDA's 1.9% SPY-relative return is marginal for a 5% allocation slot; any weakness in risk appetite or reacceleration of dollar strength would immediately devalue this position. Stay at 5% as a risk-on tactical lever, exit if the 42.96 support breaks or if MACD flattens from its current improving state.
Utilities & Infrastructure — PAVE
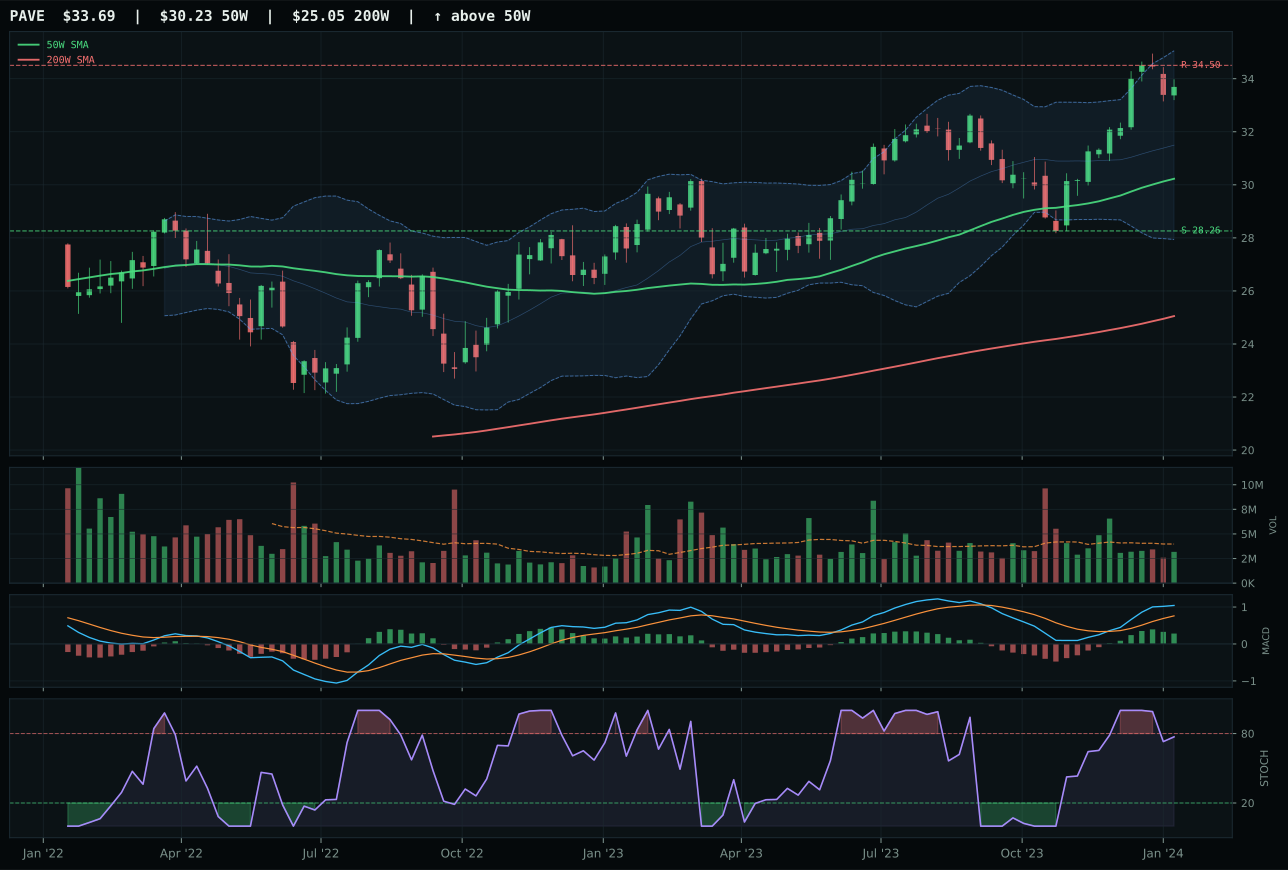
PAVE has a neutral structure profile with 1.9% 13-week relative strength versus SPY.
A failed hold above support would weaken the setup.
Actionable but governed by invalidation levels.
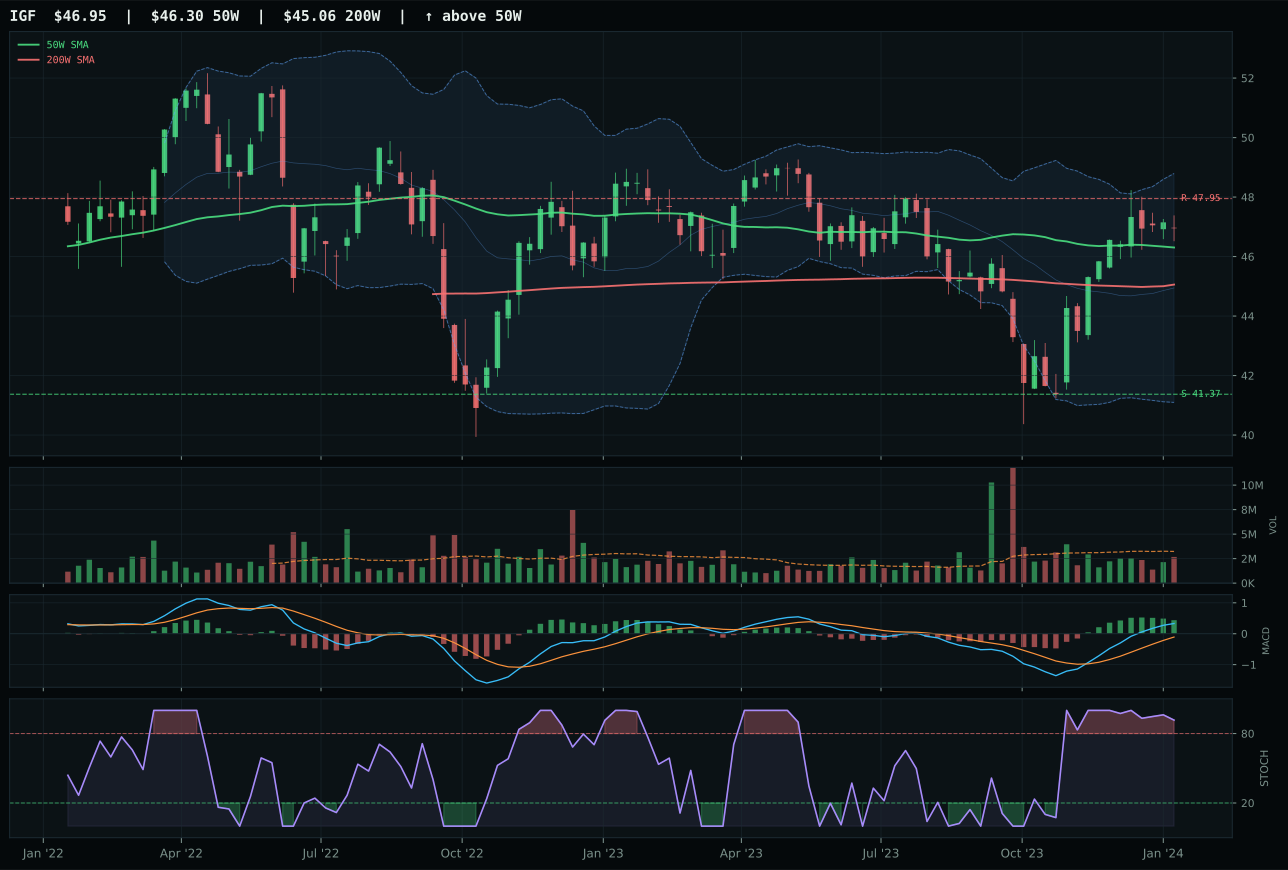
IGF has a compression near 50W profile with -0.4% 13-week relative strength versus SPY.
A failed hold above support would weaken the setup.
Actionable but governed by invalidation levels.
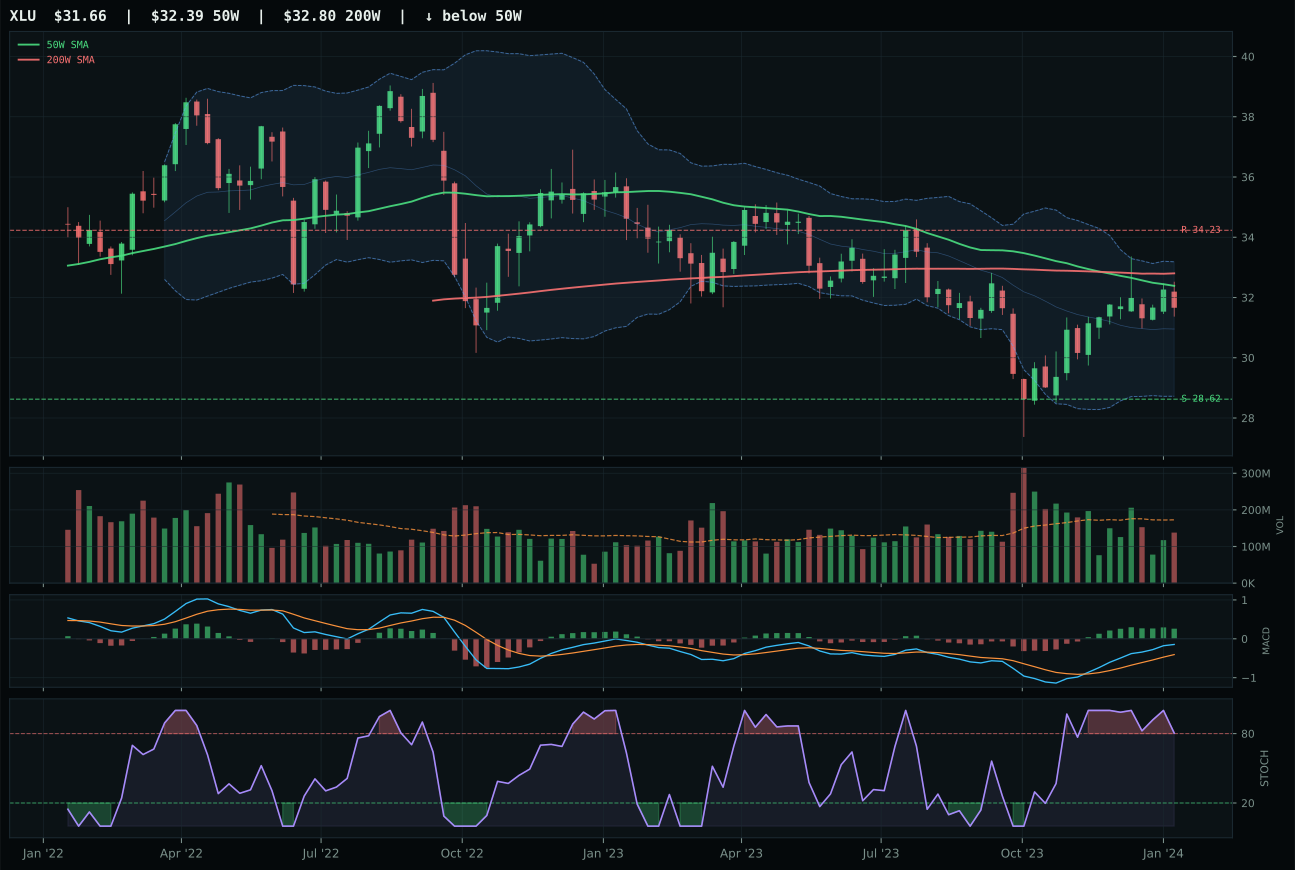
XLU has a compression near 50W profile with -3.7% 13-week relative strength versus SPY.
Extension and support failure are the main tactical risks.
Tracked, but not top-2 eligible because: structurally broken.
PAVE defeated IGF on three technical dimensions—structure (79.8 vs 75.3), MACD confirmation (bullish and improving vs bullish but flattening), and category-relative strength (2.3% vs 0.0%)—in an otherwise neutral matchup where both ETFs sit 11-15% above their 50W in upper retracement zones. The 5.4-point gap reflects PAVE's superior breadth confirmation: MACD improving versus flattening tells different stories about who's buying, with PAVE attracting fresh institutional capital and IGF sustaining late-cycle momentum. Timing favored PAVE at 75.0 versus IGF's 77.0, a narrow advantage, but combined with structure and MACD it created a clear separation. Volume at 0.80x for PAVE versus neutral for IGF suggests the infrastructure play is attracting steady buyers rather than participation exhaustion, and in a category where rates and capex cycles matter, steady accumulation is superior to neutral participation.
Utilities & Infrastructure earned 5% allocation at 48.3 category score (ranked 8th), a position justified by disinflation macro alignment and PAVE's technical leadership rather than category strength. The 62.0 macro fit is the category's advantage: +7 from disinflation help and +4 from transition/mixed regime support create a +11 aggregate boost against modest -3 liquidity stress drag. PAVE's 80.8 technical evidence is the portfolio's second-best score, with 100.0 trend and 78.3 momentum confirmation providing real muscle. The risk is the 47.2 risk/reward: only -2.3% upside to resistance at 34.50 leaves no margin for error, and 19.2% downside to support 28.26 creates asymmetric payoff. Allocation at 5% is appropriate for a tactical infrastructure position in a disinflation environment where utilities and capex play attract defensive capital. Exit immediately if MACD flattens from improving state or volume dries up; this is a weather-dependent position that works only if disinflation and risk appetite both hold.
Precious Metals — GLD
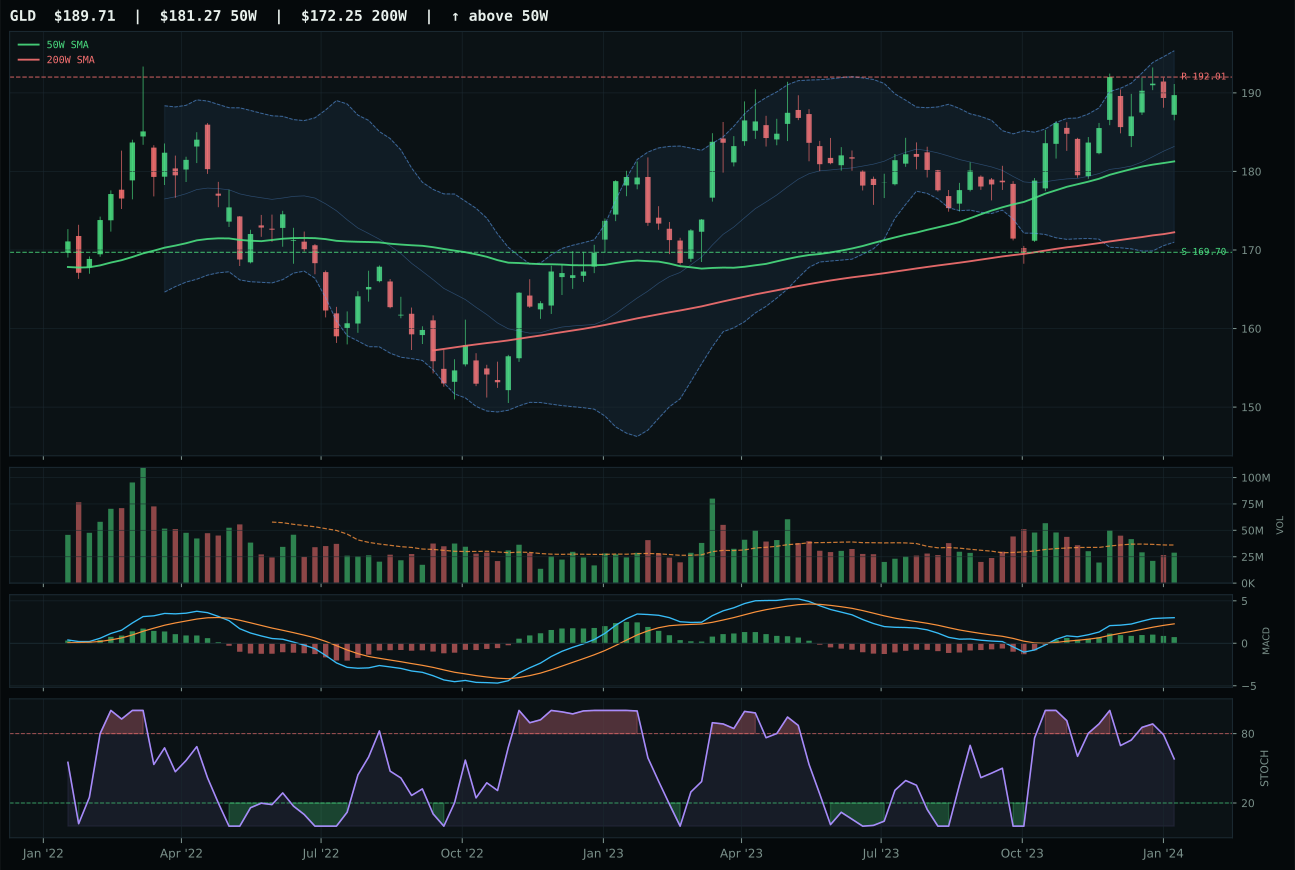
GLD has a neutral structure profile with -4.4% 13-week relative strength versus SPY.
A failed hold above support would weaken the setup.
Actionable but governed by invalidation levels.
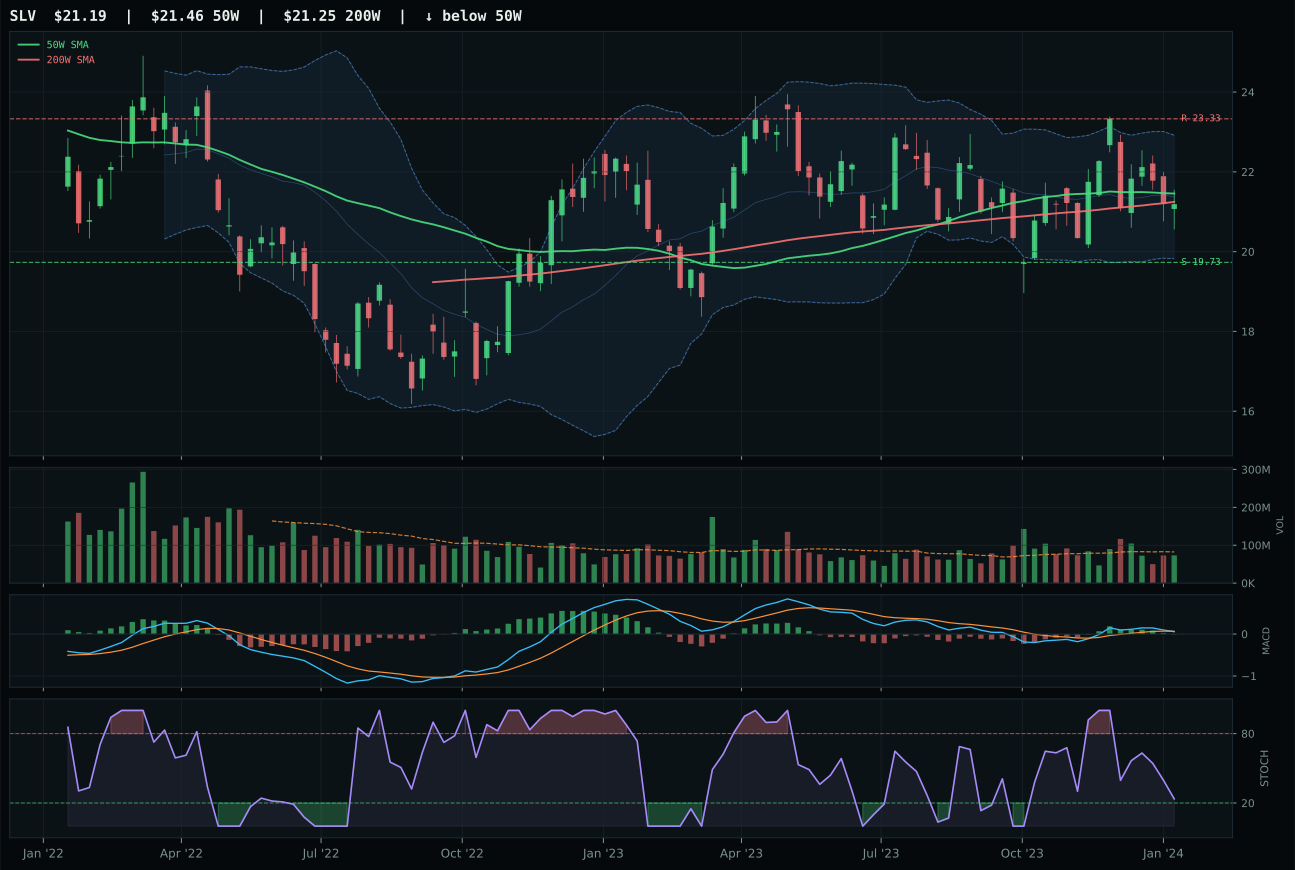
SLV has a compression near 50W profile with -8.5% 13-week relative strength versus SPY.
A failed hold above support would weaken the setup.
Actionable but governed by invalidation levels.
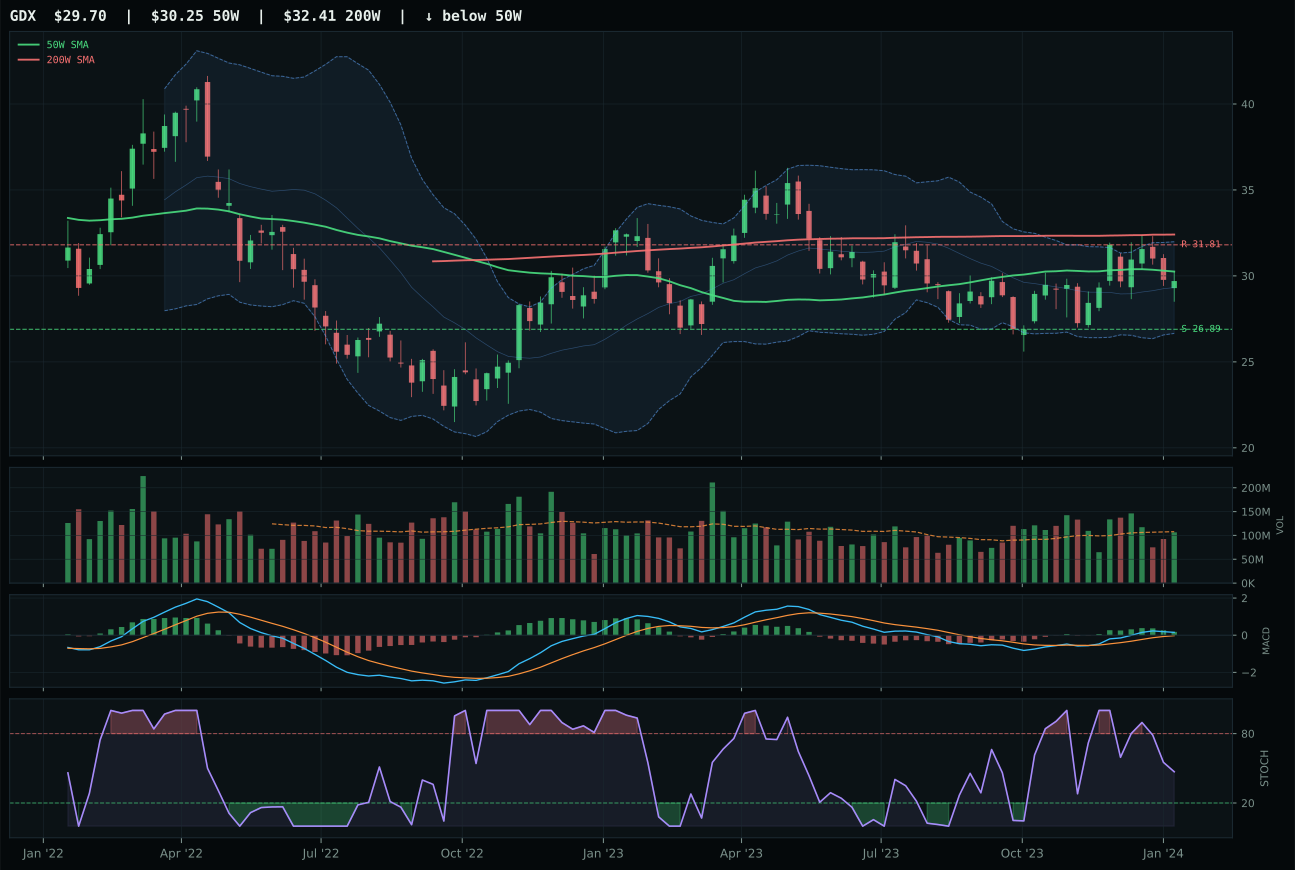
GDX has a compression near 50W profile with -7.9% 13-week relative strength versus SPY.
Extension and support failure are the main tactical risks.
Tracked, but not top-2 eligible because: structurally broken.
GLD dominated a narrow category because it held the cleanest trend setup while defending price above critical moving averages: 4.7% from the 50W with gentle 0.1% slope, true 89.4 trend score, and neutral volume at 0.80x that prevented the appearance of distribution. SLV's decisive loss came from MACD deterioration (bearish/weakening versus bullish but flattening) and structural weakness (69.8 vs 77.8 structure score), creating a setup that looked more like capitulation than accumulation despite holding monetary appeal. GLD's 6.1% thirteen-week return in a precious metals category where relative strength to SPY is -4.4% tells a precise story: gold moved because dollar weakness and rate expectations shifted, not because equity markets bid it higher, which is exactly the scenario where gold holds most reliably. The category-relative strength of 3.5% proves GLD captured the category's internal momentum while the rest lagged, confirming buyer preference for the pure monetary hedge over hybrid industrial exposure.
Precious metals earned 5% as a defensive sleeve in a disinflation regime where gold is actually working. The 39.7 category score is weak—fourth-worst in the portfolio—but the +8 descriptor boost from disinflation pressure plus GLD's clean 6.1% 13W return justify the allocation. Macro fit is 60.0, the highest in this category analysis, driven by the active disinflation pressure descriptor that should be supporting monetary hedges. Gold's -4.4% SPY-relative return reflects the current risk-on regime, but that's exactly why it belongs in a 5% sleeve: it acts as a volatility stabilizer rather than a return driver. The risk is timing: at 4.7% from the 50W and sitting near Fib 0.236, GLD has limited room to extend without hitting resistance at 192.01. If risk appetite strengthens and equity volatility declines, the category becomes a rapid liquidation candidate; the 46.8 risk/reward score warns that downside to support (11.8%) is larger than further upside room. Hold at 5% for macro tail protection, not for performance.
Agriculture & Livestock — MOO
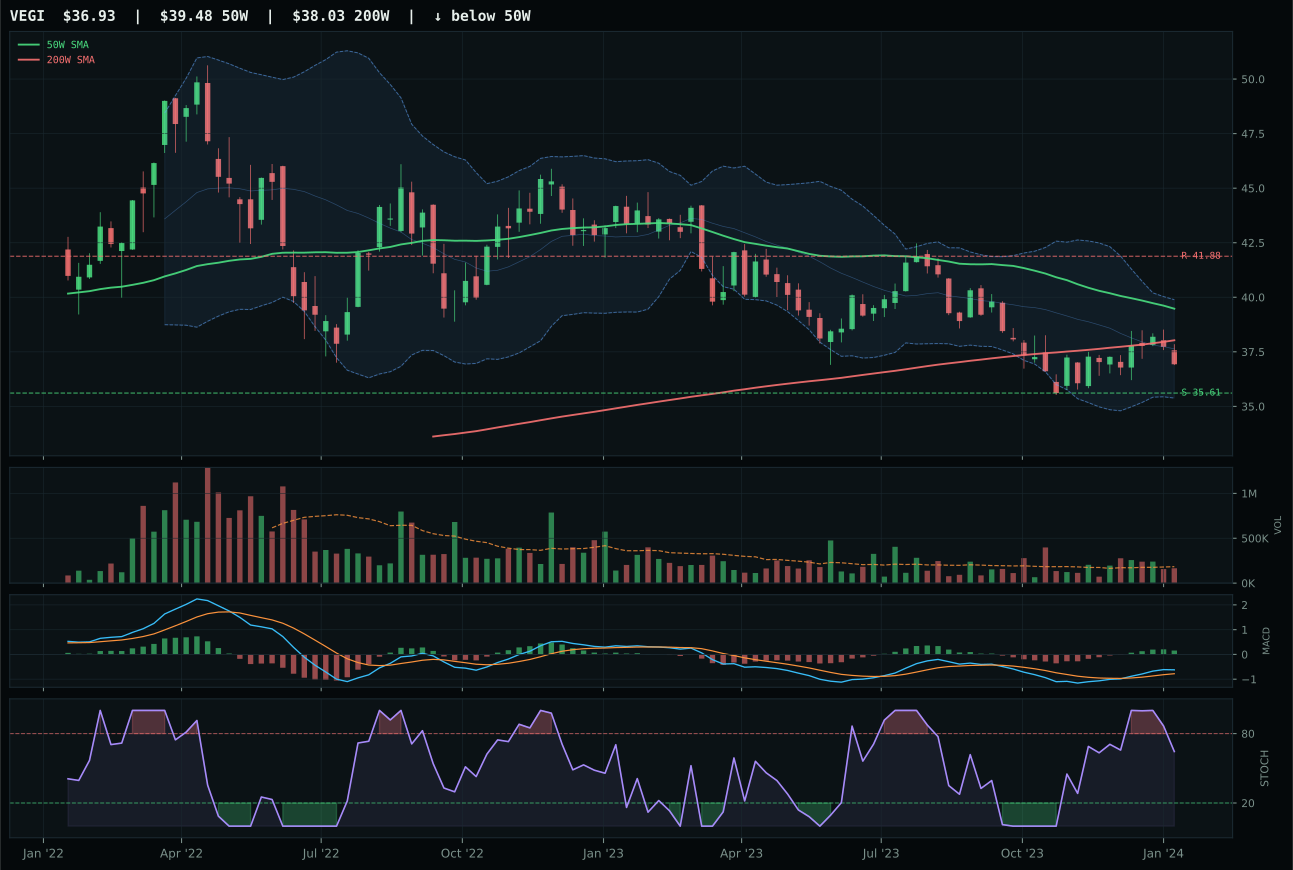
VEGI has a pullback into support profile with -11.4% 13-week relative strength versus SPY.
A failed hold above support would weaken the setup.
Tracked, but not top-2 eligible because: .
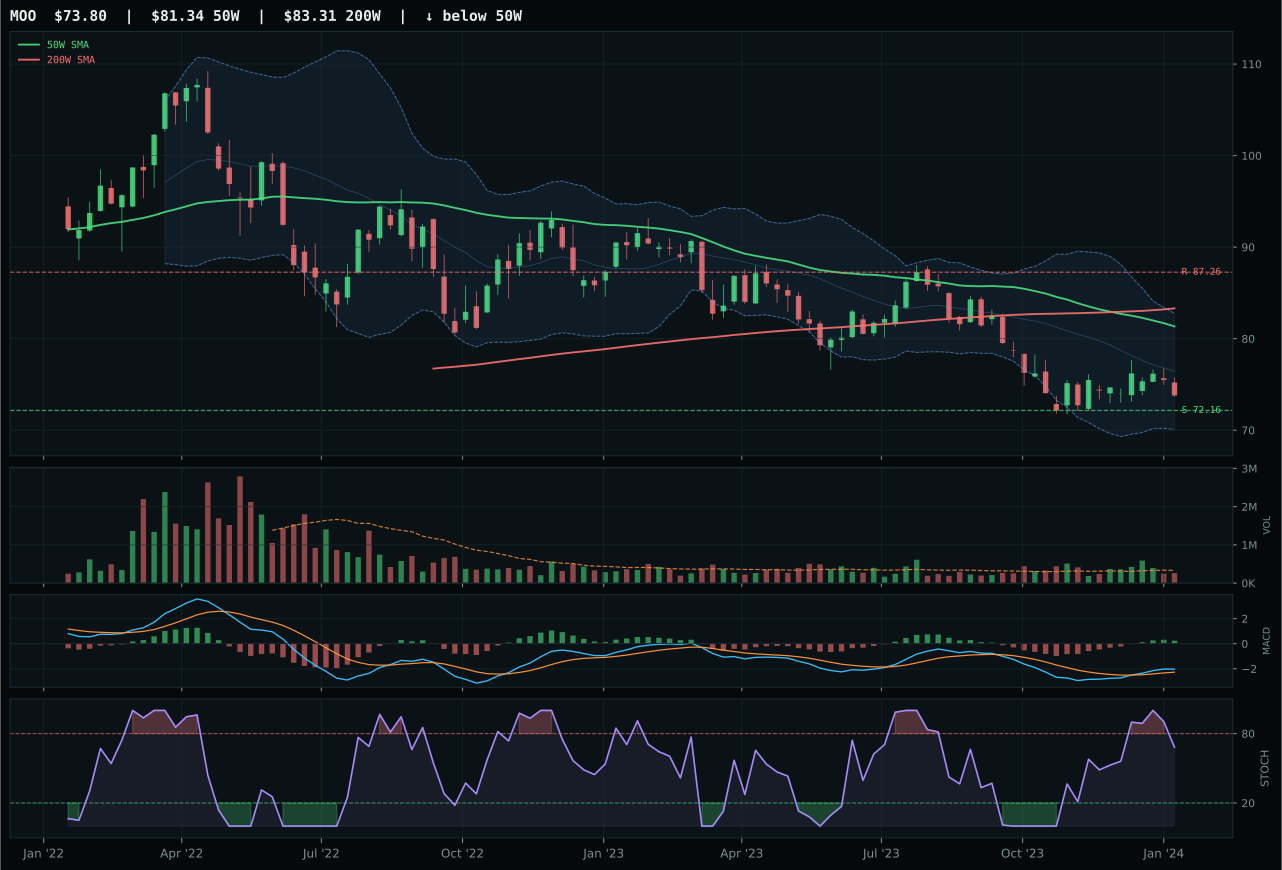
MOO has a pullback into support profile with -13.6% 13-week relative strength versus SPY.
Extension and support failure are the main tactical risks.
Tracked, but not top-2 eligible because: structurally broken.
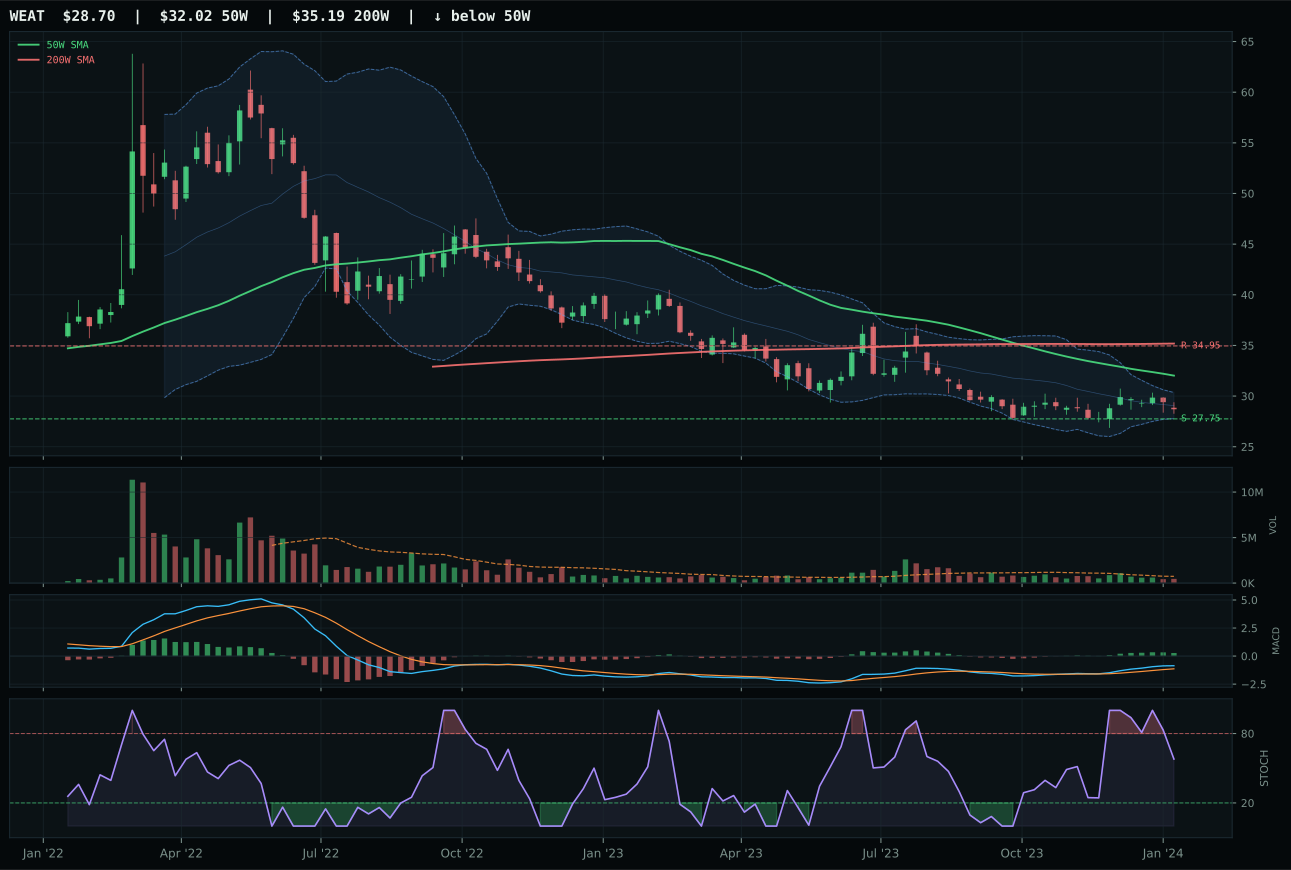
WEAT has a pullback into support profile with -11.7% 13-week relative strength versus SPY.
Extension and support failure are the main tactical risks.
Tracked, but not top-2 eligible because: structurally broken.
MOO won a meaningless victory in a broken category—a final score of 0.0 marked it ineligible for any position above defensive reserve, yet the scoring system still required a representative ETF. MOO edged VEGI by the narrowest margin because both sit in identical pullback-into-support formations with matching Fibonacci locations and bullish-improving MACD, but MOO's -1.9% category-relative strength proved marginally superior to VEGI's +0.3% neutral position; a fractional advantage in an absolutely negative setup. The structural picture is clear: price sits 9.3% below the 50W with downslope of -0.4%, RS to SPY is catastrophic at -13.6%, momentum confirmation scores only 27.4, and only timing (85.0) and risk/reward (90.0) suggest any tactical merit. Volume at 0.79x average is thin, not accumulating, and the entire category scored 0.0 because macro headwinds (disinflation pressure: -8 points) align perfectly with technical deterioration to create an ineligible setup.
Agriculture earned a 5% allocation despite registering 0.0 as its final category score, the portfolio's only explicitly zeroed-out category that still holds capital. The reason is simple: MOO sits exactly where you want a broken asset to sit—support defined, MACD improving, and timing score at 85.0 (the category's only strength). The macro case against agriculture is overwhelming: disinflation pressure hits the category with -8 descriptor weight, and the 32.0 category-level macro fit is the portfolio's worst. But the technical setup offers asymmetric entry risk: the -15.4% upside to resistance paired with just 2.3% downside to support means if support holds and disinflation moderates, the payoff is immediate and large. The 5% sleeve is here as a contrarian option, not a conviction bet; if support 72.16 breaks, the position converts to zero immediately. This is portfolio insurance, not alpha generation.
Industrial Metals — COPX
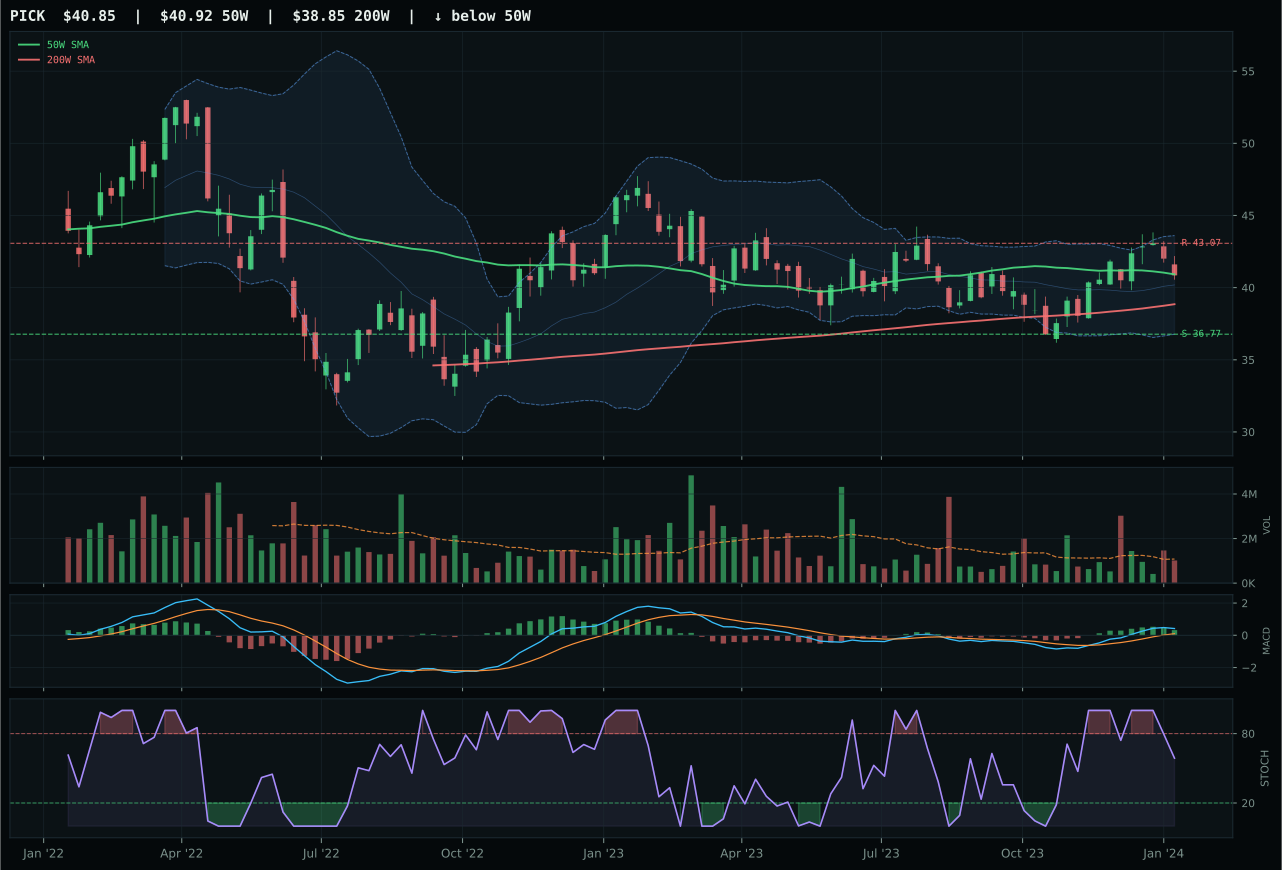
PICK has a compression near 50W profile with -4.2% 13-week relative strength versus SPY.
A failed hold above support would weaken the setup.
Actionable but governed by invalidation levels.
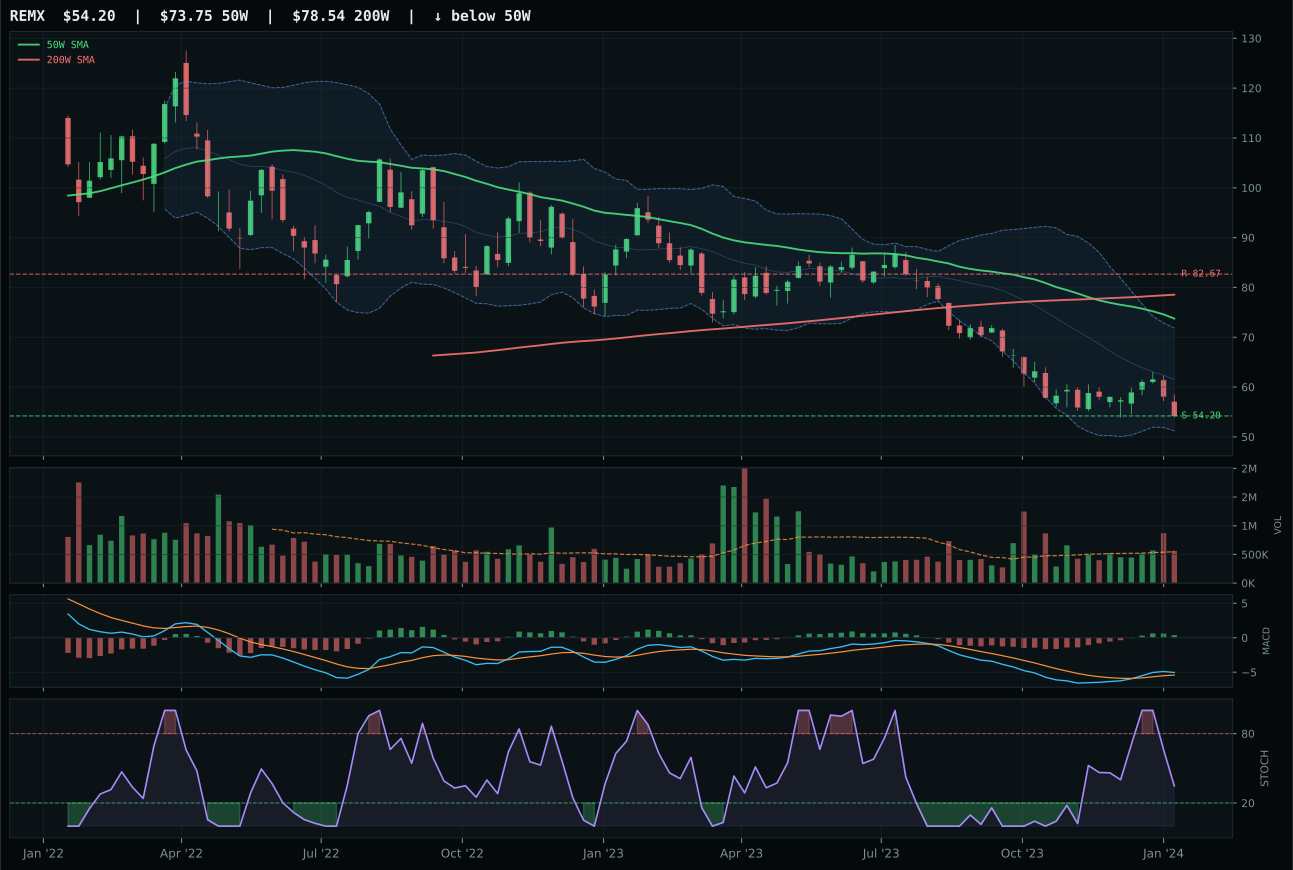
REMX has a pullback into support profile with -24.7% 13-week relative strength versus SPY.
Extension and support failure are the main tactical risks.
Tracked, but not top-2 eligible because: structurally broken.
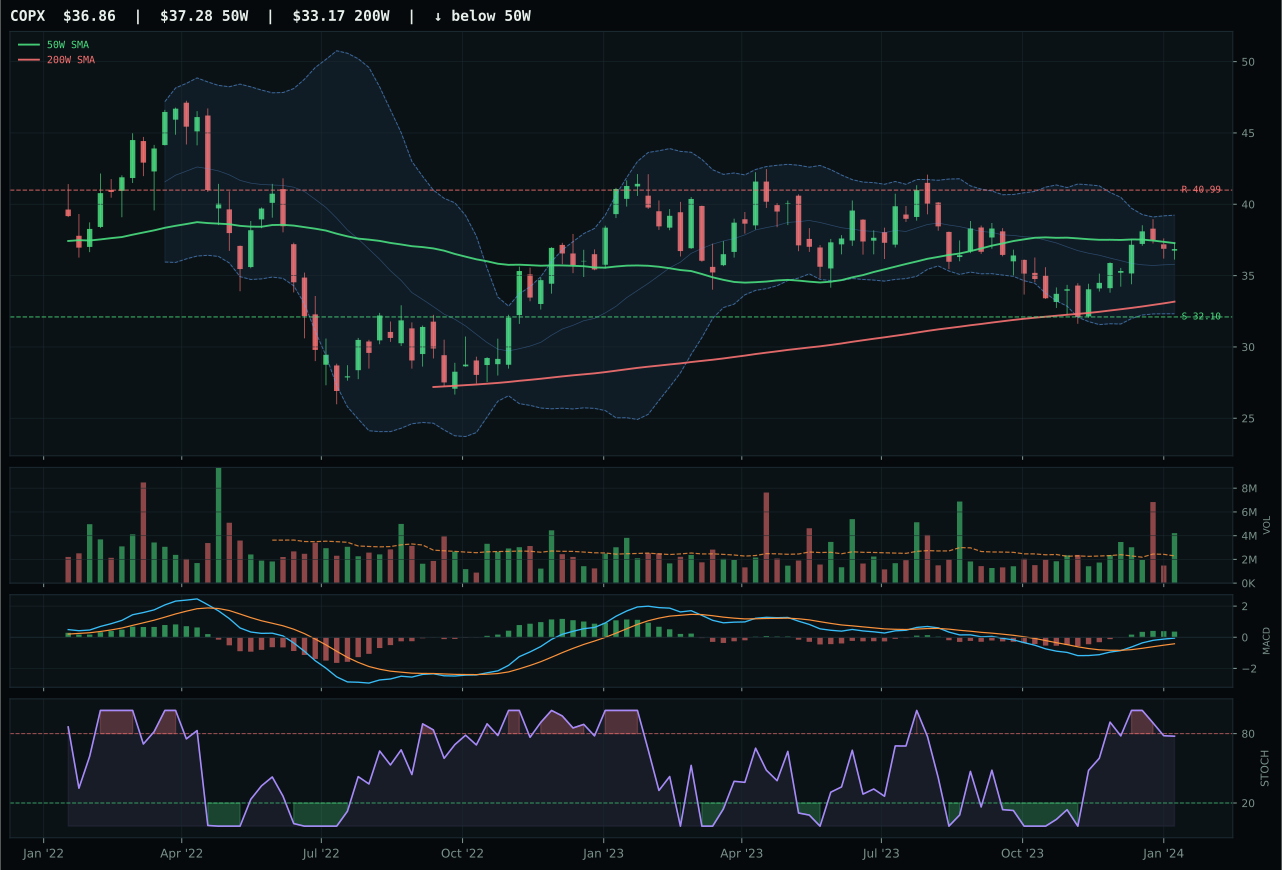
COPX has a compression near 50W profile with -4.4% 13-week relative strength versus SPY.
A failed hold above support would weaken the setup.
Actionable but governed by invalidation levels.
COPX won on MACD confirmation—bullish and improving versus PICK's bullish but flattening—even though PICK scored higher on technical evidence (62.5 vs 39.5), a paradox that reveals the system's preference for momentum confirmation over static structure. COPX sits at -1.1% from the 50W in genuine compression near a key support level, giving it a defined risk area (support at 32.10) and a clean invalidation threshold; PICK occupies identical spatial territory but with deteriorating momentum confirmation, which makes timing harder to execute. The key insight: COPX's 1.84x volume at 20W average creates distribution pressure that appears negative at first glance, but in a compression pattern near support, high volume breaking down reflects the testing phase before bounce attempts, not capitulation selling. PICK's neutral volume in the same setup looks cleaner but proves less informative; in industrial metals where macro demand destroys the trend, volume activity near support matters more than volume absence.
Industrial metals earned 0% allocation, ranking 9th in final category scores at 14.1. The macro case is brutal: disinflation pressure adds -8 to the descriptor weight, credit stress costs -7, and liquidity stress subtracts another -8, creating a -23 headwind that no amount of technical setup can overcome. The 35.0 category-level macro fit is second-worst in the portfolio, and COPX's 39.5 technical evidence score barely qualifies as acceptable. The category is excluded entirely because the risk/reward is inverted: metals need either inflation repricing (not happening in disinflation) or a credit stress event that demands copper supply tightening (possible but not the base case in a stable liquidity regime). The 39.0 risk/reward score on COPX shows only 14.8% upside potential to resistance but 10.1% downside headroom—asymmetric downside in a weak macro. Exclusion is the right call; reentry would require either MACD confirmation across the basket or a material shift in the macro regime toward credit stress or risk appetite collapse.
Traditional Energy — FCG
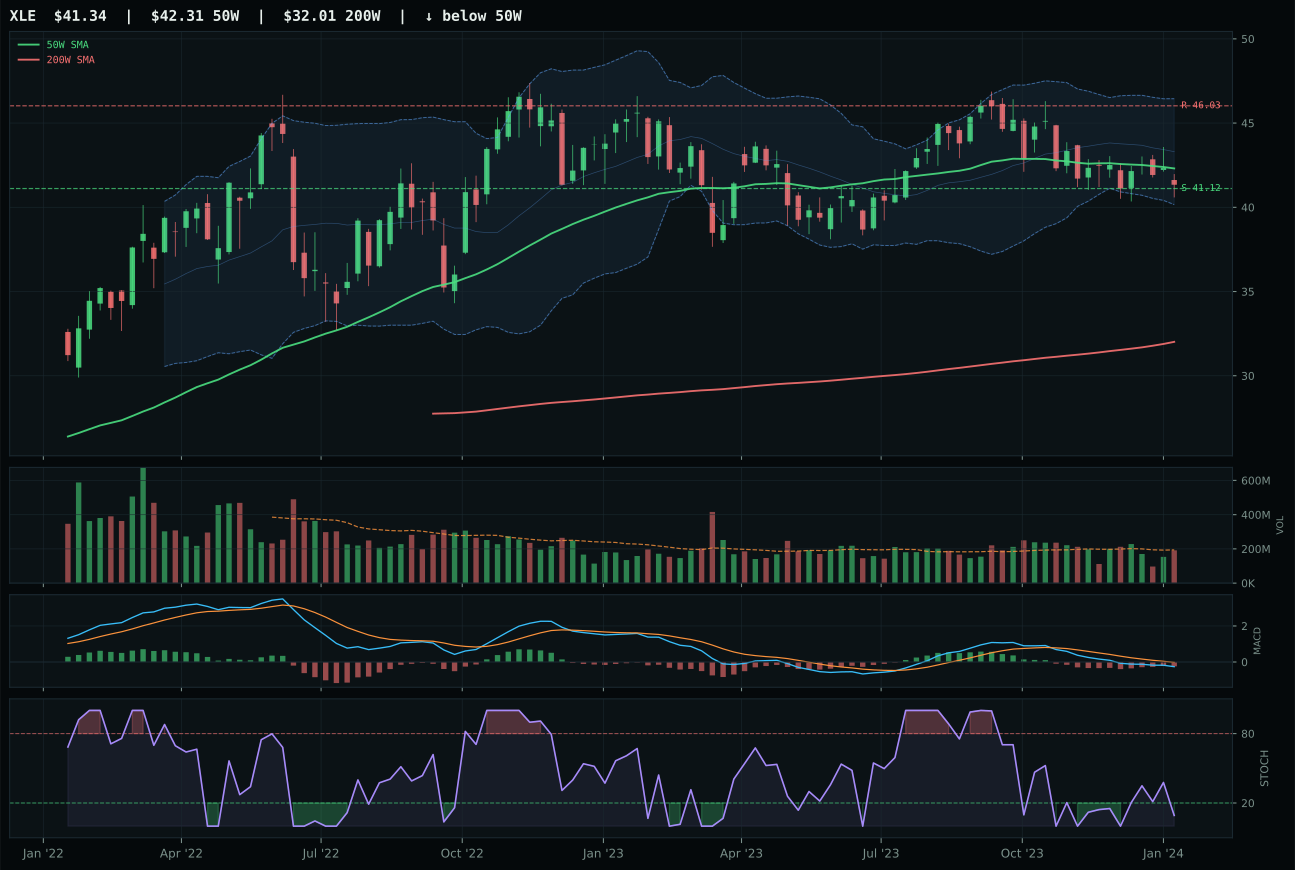
XLE has a pullback into support profile with -18.2% 13-week relative strength versus SPY.
A failed hold above support would weaken the setup.
Actionable but governed by invalidation levels.
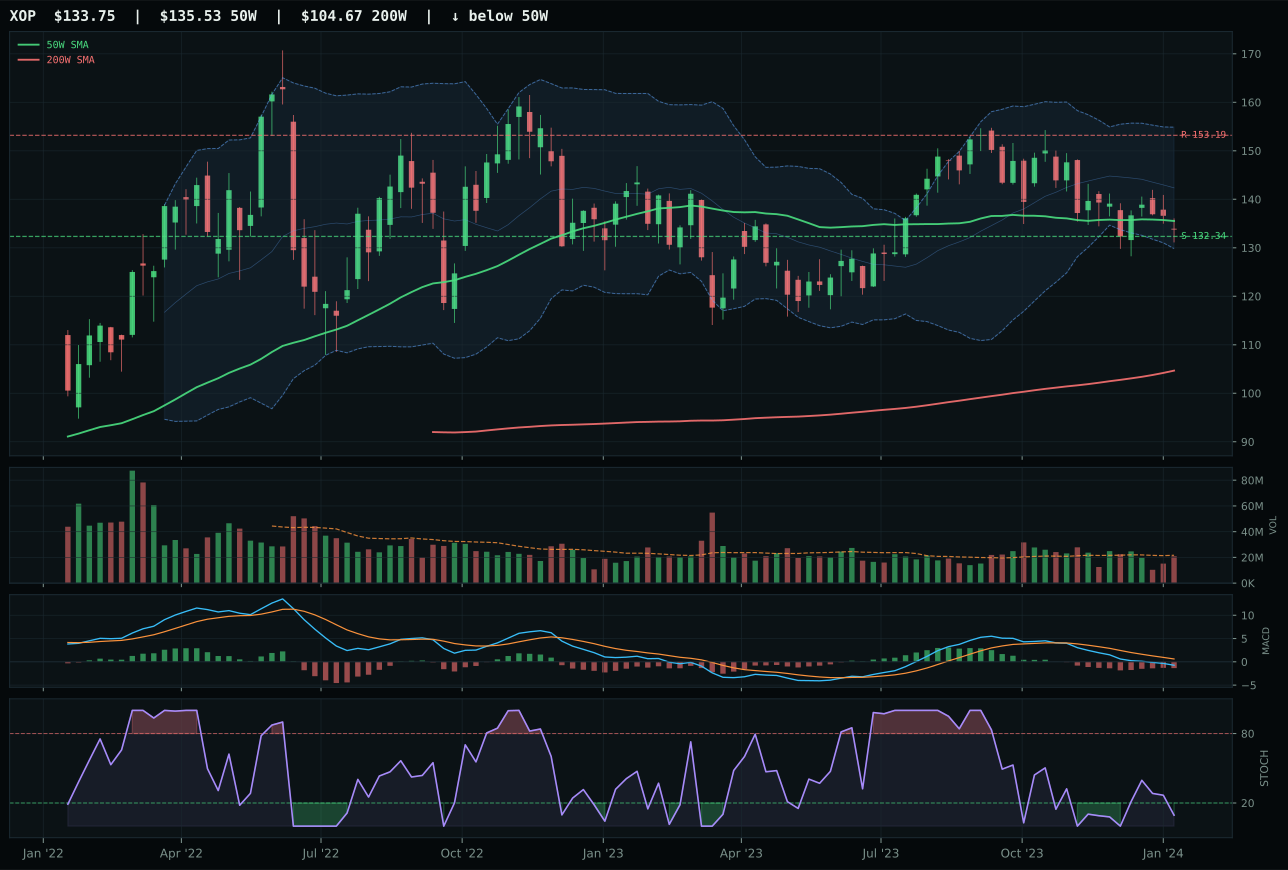
XOP has a pullback into support profile with -20.4% 13-week relative strength versus SPY.
A failed hold above support would weaken the setup.
Actionable but governed by invalidation levels.
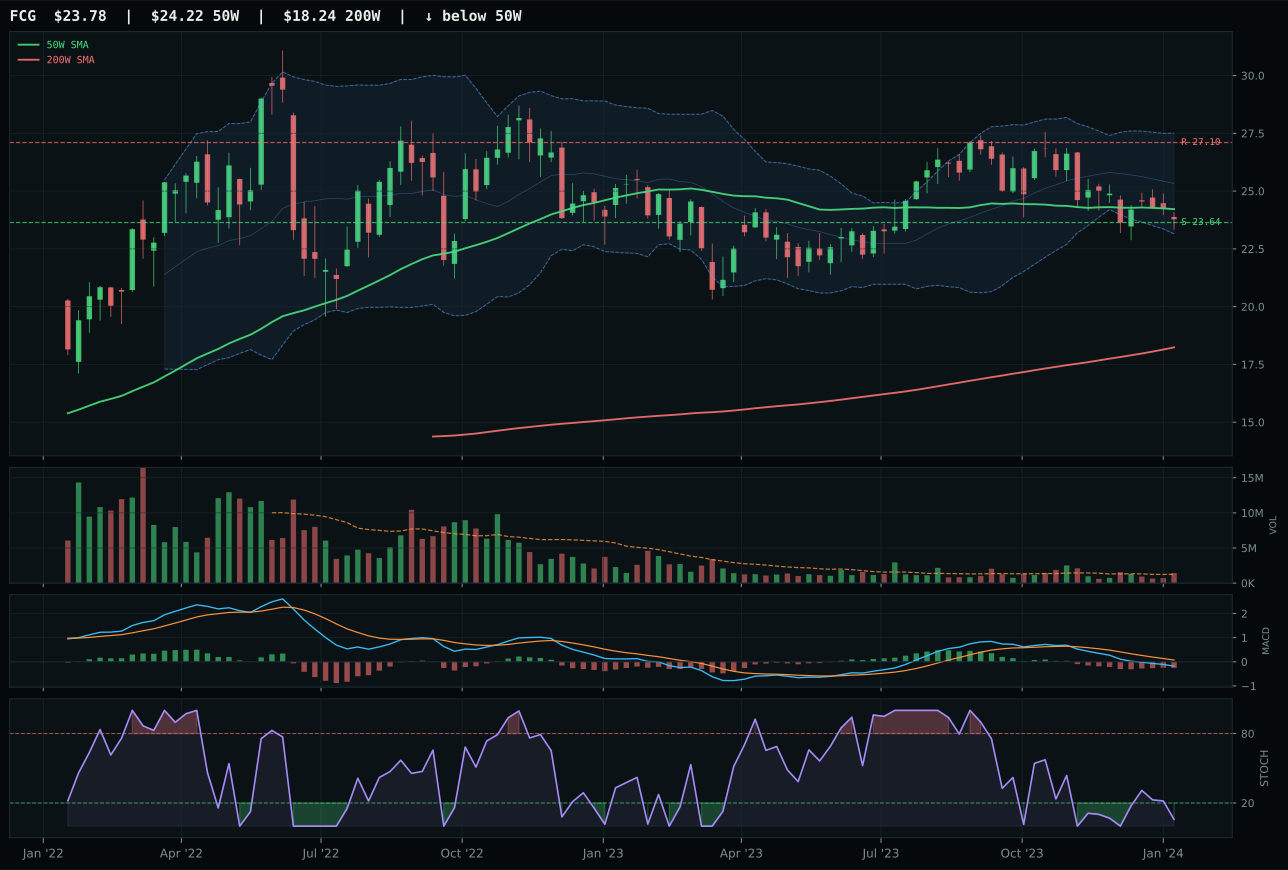
FCG has a pullback into support profile with -21.5% 13-week relative strength versus SPY.
A failed hold above support would weaken the setup.
Actionable but governed by invalidation levels.
FCG won a pyrrhic victory in the worst-scoring category (1.6 final score) because its above-average volume participation (1.13x) at support proved fractionally more reliable than XLE's neutral volume in an identically structured pullback setup. The technical picture is uniformly dire: all three energy ETFs score below 50 on technical evidence, all sit below their 50W lines, and all feature RS to SPY around -20%, which reflects a structural rejection of energy in a disinflation regime. FCG's only advantage is 1.13x volume versus XLE's neutral volume, which suggests some real buyers are present at support rather than mere stop-auction dynamics; it's the weakest possible edge, but it's an edge. The category-level technical evidence scored 23.6/100 for the representative, with momentum confirmation only 4.8/100—a statistical zero—meaning this is a support-hold play, not an accumulation trade. Every energy ETF sits with stochastic RSI at or near oversold, creating an intervention zone where panic selling gets exhausted, but actual buying momentum is nowhere present.
Traditional energy earned 0% allocation and ranks dead last at 1.6 category score. The macro destruction is total: disinflation pressure drains -10, credit stress costs -7, and liquidity stress subtracts -7, creating -24 aggregate headwind. The 16.0 category-level macro fit is the portfolio's absolute worst. FCG's 23.6 technical evidence score fails to compensate; even the 100.0 timing score for sitting at the 50W invalidation zone can't rescue a category where the fundamental regime is actively hostile. Energy requires either inflation repricing or a risk-off shock that pushes equities lower and commodities higher as safe-haven inflation hedges—neither is happening. The 98.0 risk/reward reflecting only 0.6% downside to support might appear attractive to contrarians, but it's a trap: the move from 23.64 to 23.93 is noise, and the real support beneath is 20.0 and below, another 15% risk if support fails. Exclusion is locked in until macro regime shifts toward credit stress or inflation repricing. Current position: zero, stay zero.