
2024-01-05
Informational purposes only. The content in this report, including allocations, analysis, and commentary, is provided solely for informational and educational purposes. It does not constitute financial advice, investment advice, trading advice, or any other type of advice. Past performance does not guarantee future results. Always conduct your own research and consult a qualified financial professional before making investment decisions.
Weekly Allocation
| Ticker | Category | Weight | Role |
|---|---|---|---|
| FBTC | 50% | Overlay | |
| PAVE | Utilities & Infrastructure | 10% | Top-2 (10%) |
| GLD | Precious Metals | 10% | Top-2 (10%) |
| CIBR | Technology | 5% | Tier-2 (5%) |
| ITA | Defense & Aerospace | 5% | Tier-2 (5%) |
| SMH | AI | 5% | Tier-2 (5%) |
| INDA | Emerging Markets | 5% | Tier-2 (5%) |
| MOO | Agriculture & Livestock | 5% | Tier-2 (5%) |
| URNM | Nuclear Energy | 5% | Tier-2 (5%) |
Trade Instructions — Monday Open
Sell the tranche from 2023-12-08 (completing its 4-week hold). Buy the new tranche. Instructions show net portfolio changes — same-asset positions cancel, weight changes show the delta.
| Action | Ticker | Instruction |
|---|---|---|
| SELL | CIBR | Sell 12% of CIBR position (reduce 10.00% → 8.75%) |
| SELL | XAR | Sell 67% of XAR position (reduce 3.75% → 1.25%) |
| SELL | URA | Sell 33% of URA position (reduce 3.75% → 2.50%) |
| SELL | BOTZ | Sell 20% of BOTZ position (reduce 6.25% → 5.00%) |
| SELL | ILF | Sell entire ILF position (1.25% of portfolio) |
| BUY | GLD | Buy GLD — 16.67% of freed cash (adds 1.25% to portfolio) |
| BUY | PAVE | Buy PAVE — 16.67% of freed cash (adds 1.25% to portfolio) |
| BUY | INDA | Buy INDA — 16.67% of freed cash (adds 1.25% to portfolio) |
| BUY | ITA | Buy ITA — 16.67% of freed cash (adds 1.25% to portfolio) |
| BUY | SMH | Buy SMH — 16.67% of freed cash (adds 1.25% to portfolio) |
| BUY | URNM | Buy URNM — 16.67% of freed cash (adds 1.25% to portfolio) |
Current Portfolio After Trade
Combined holdings across all 4 active tranches. Each tranche is 25% of the portfolio.
| Ticker | % of Portfolio | Weight Bar |
|---|---|---|
| FBTC | 50.00% | |
| CIBR | 8.75% | |
| PAVE | 6.25% | |
| BOTZ | 5.00% | |
| GLD | 5.00% | |
| INDA | 5.00% | |
| ITA | 3.75% | |
| COPX | 3.75% | |
| SMH | 3.75% | |
| URA | 2.50% | |
| URNM | 2.50% | |
| XAR | 1.25% | |
| GDX | 1.25% | |
| MOO | 1.25% |
Macro Regime — Disinflation
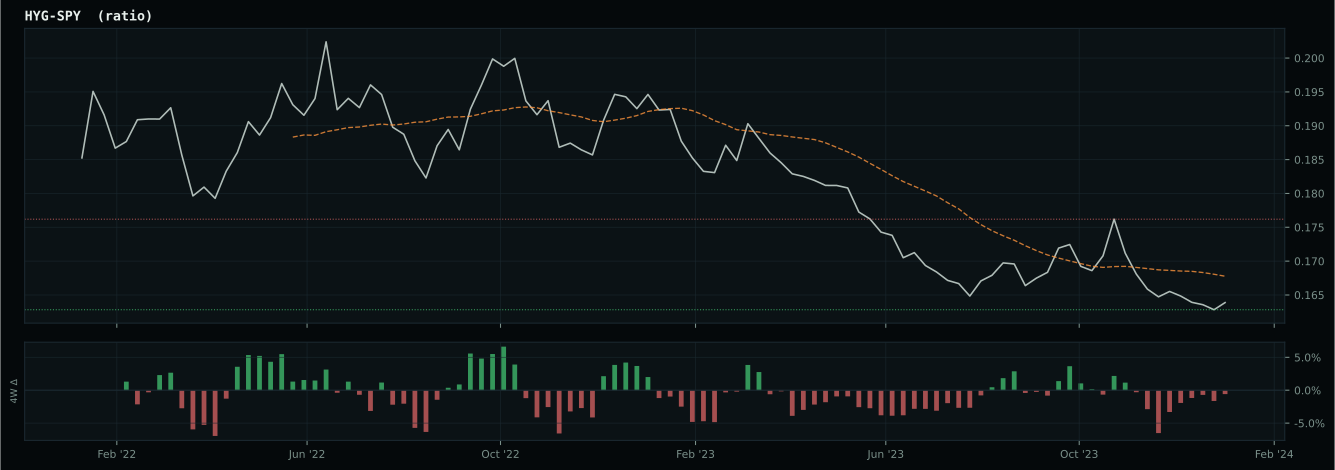
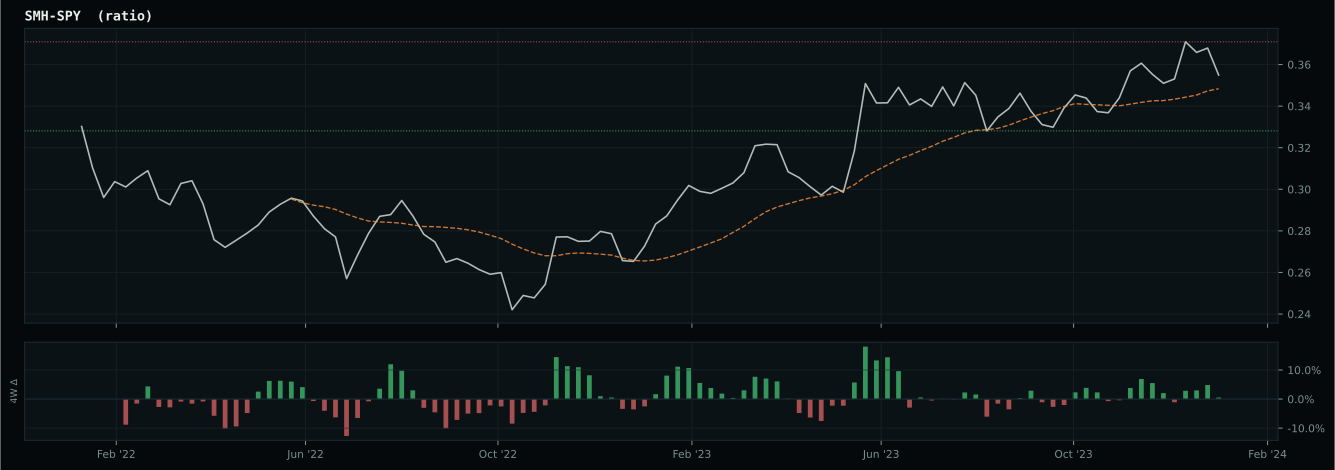
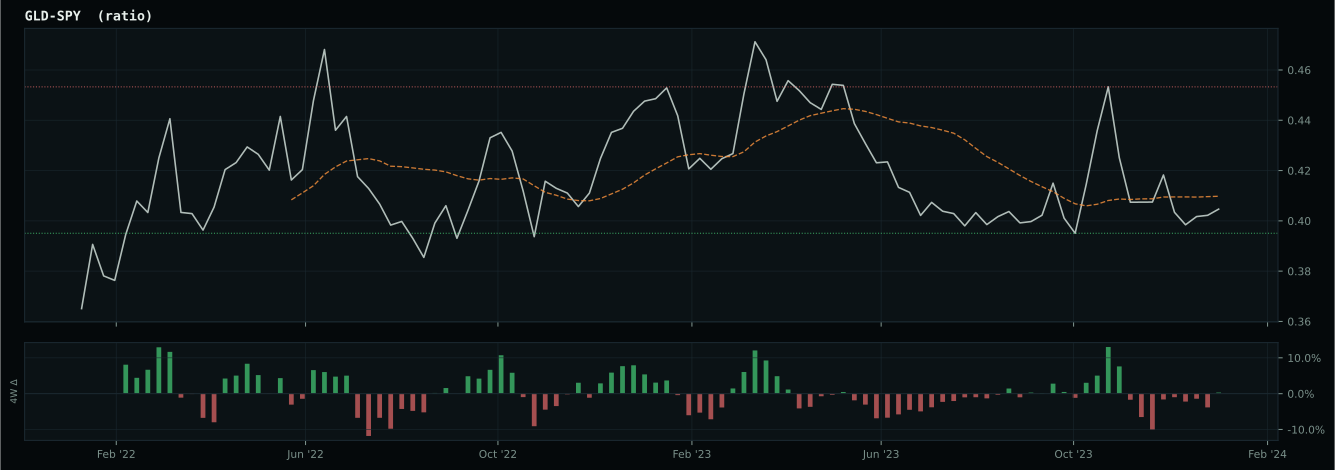
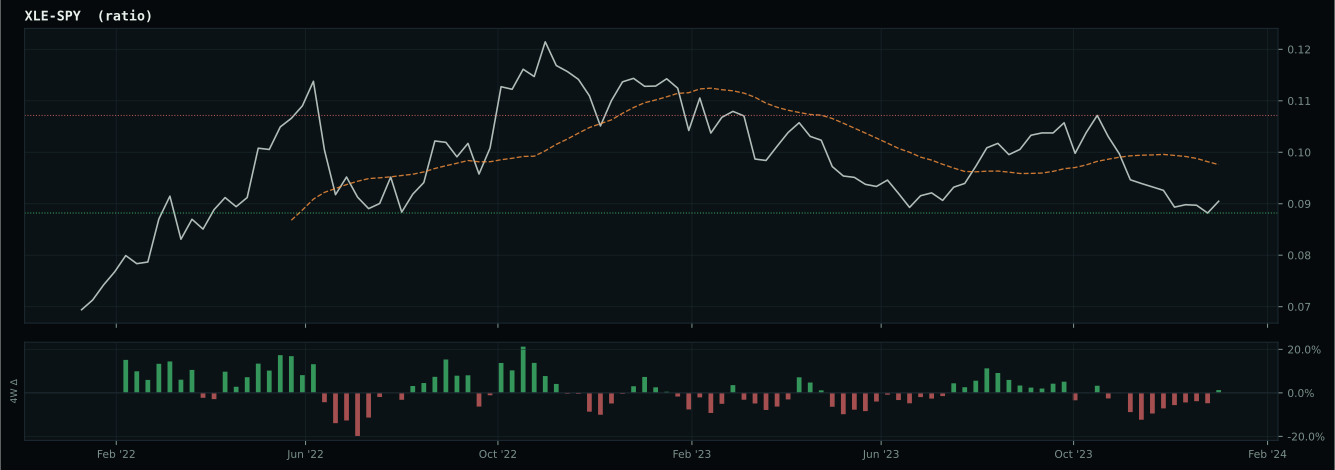
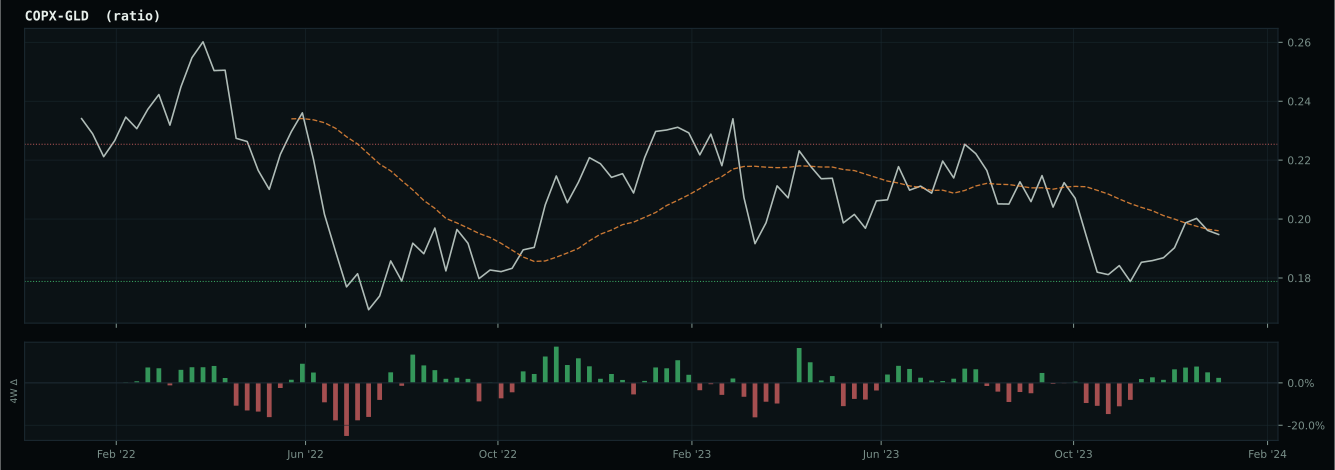
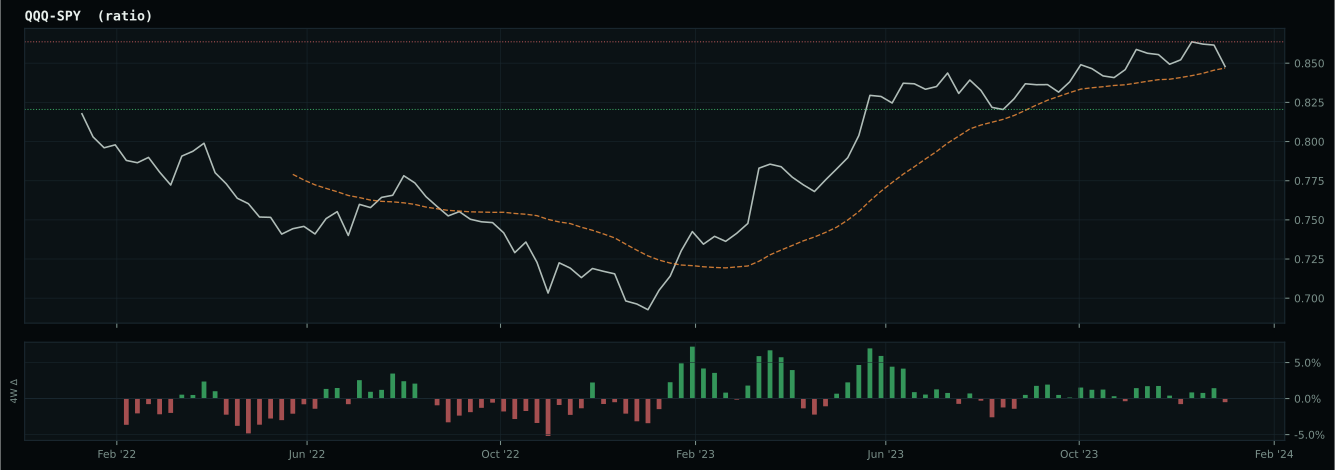
Macro Evidence Charts
Market-implied signals behind the macro regime scores. Each ratio compares two assets; the direction and slope of the ratio is what the macro engine reads.
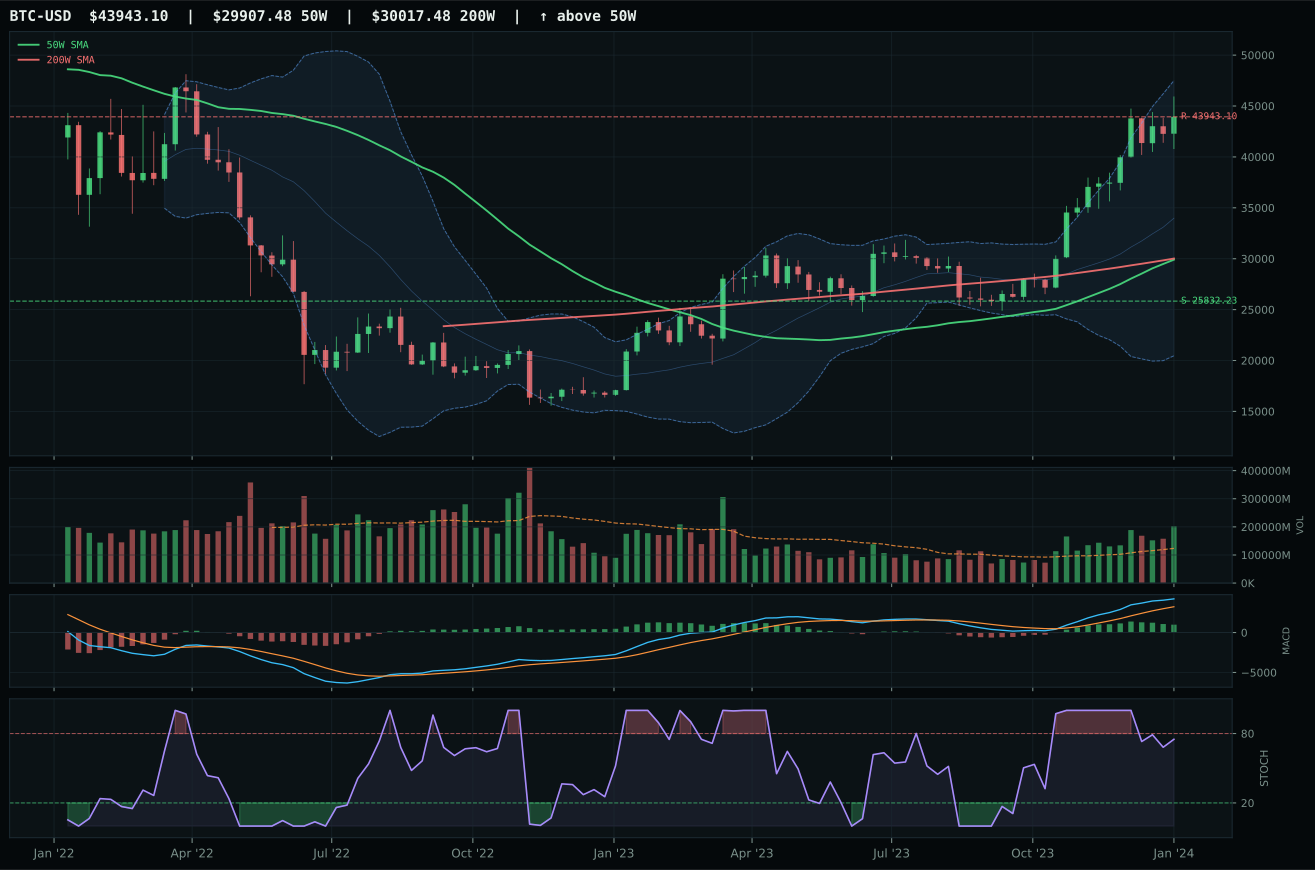
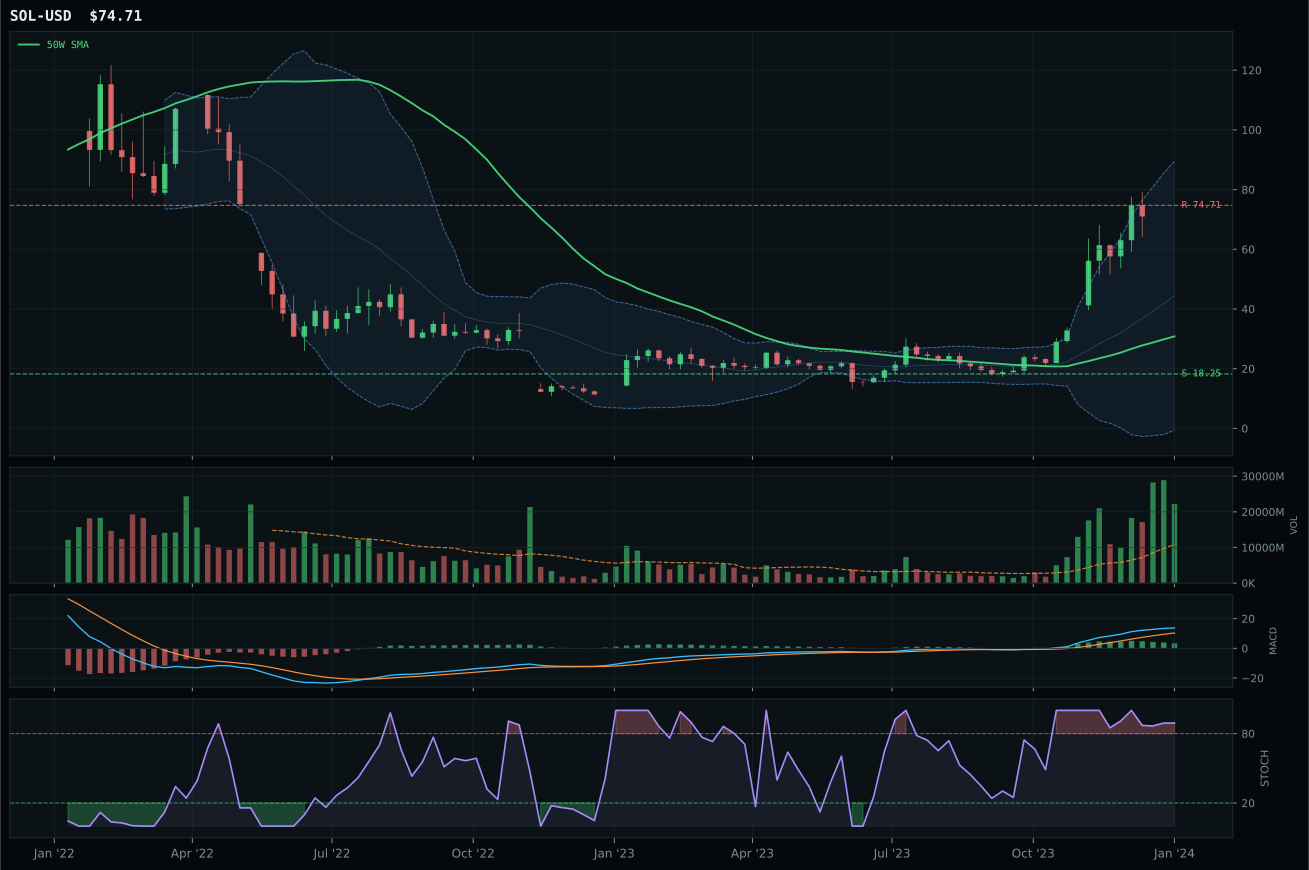
Crypto Regime — TrendBTC
post-touch structure is too wide to count as a range; max/min close ratio is 2.69
TrendBTC confirmed: 2 consecutive closes above rising/flat 50W SMA
one or more available conditions failed
Category Rankings
| Rank | Category | Winner | Score | Alloc | 4W Ret | Peers (4W) |
|---|---|---|---|---|---|---|
| 1 | Utilities & Infrastructure | PAVE | 63.4 | 20% | +5.27% | IGF -3.8% · XLU -5.4% |
| 2 | Precious Metals | GLD | 59.8 | 20% | -0.18% | SLV -3.0% · GDX -6.2% |
| 3 | Technology | CIBR | 58.5 | 10% | +9.27% | IGV +10.4% · XLK +9.7% |
| 4 | Defense & Aerospace | ITA | 58.3 | 10% | +0.89% | XAR -0.2% · ROKT -2.5% |
| 5 | AI | SMH | 55.8 | 10% | +15.62% | AIQ +7.1% · BOTZ +8.6% |
| 6 | Emerging Markets | INDA | 50.9 | 10% | +2.39% | ILF -2.2% · IEMG -1.5% |
| 7 | Nuclear Energy | URNM | 37.2 | 10% | +20.11% | NLR +8.6% · URA +15.7% |
| 8 | Industrial Metals | COPX | 19.2 | 10% | -4.24% | PICK -5.0% · REMX -20.7% |
| 9 | Traditional Energy | FCG | 10.5 | 0% | -4.65% | XLE -0.3% · XOP -3.0% |
| 10 | Agriculture & Livestock | MOO | — | 0% | -4.28% | VEGI -3.0% · WEAT -2.1% |
Utilities & Infrastructure — PAVE
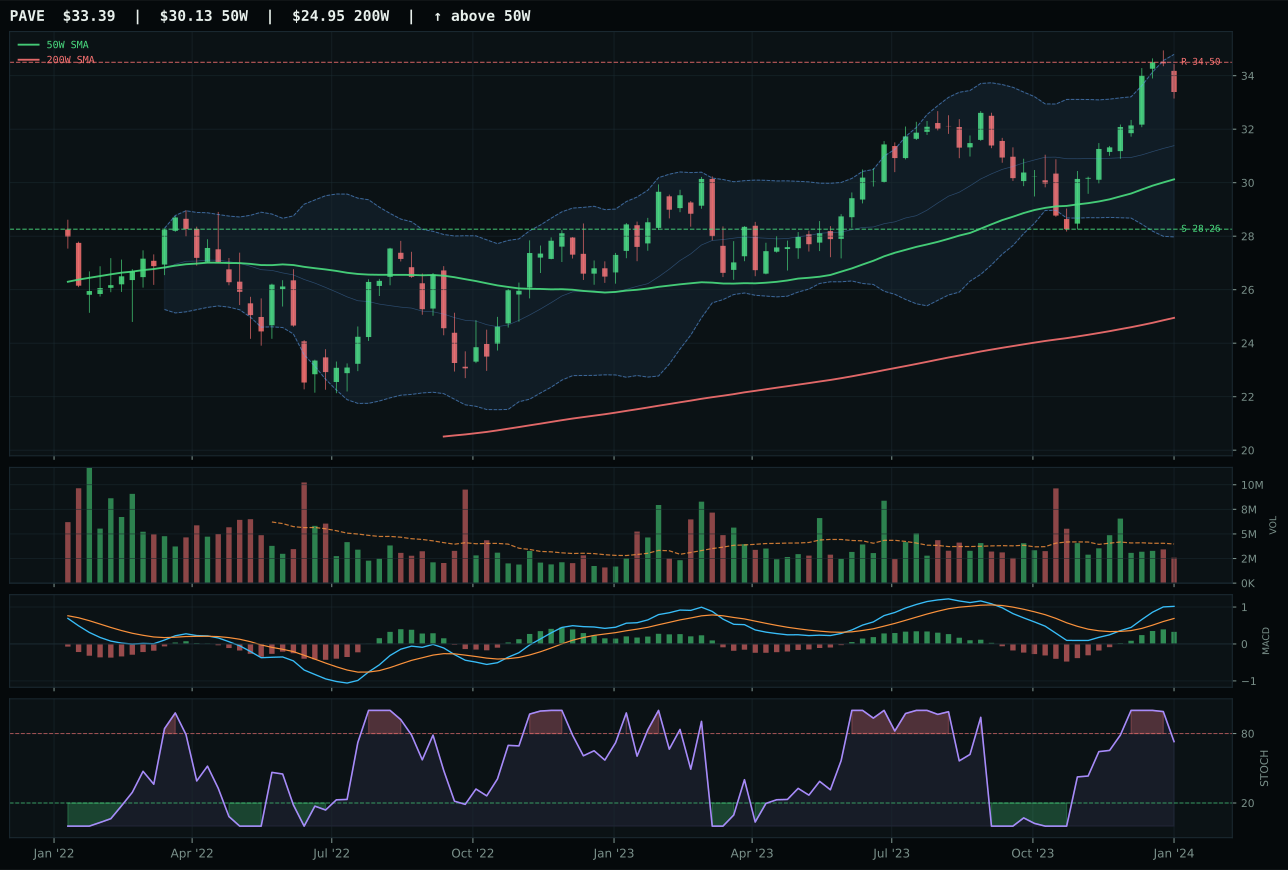
PAVE has a neutral structure profile with 1.4% 13-week relative strength versus SPY.
A failed hold above support would weaken the setup.
Actionable but governed by invalidation levels.
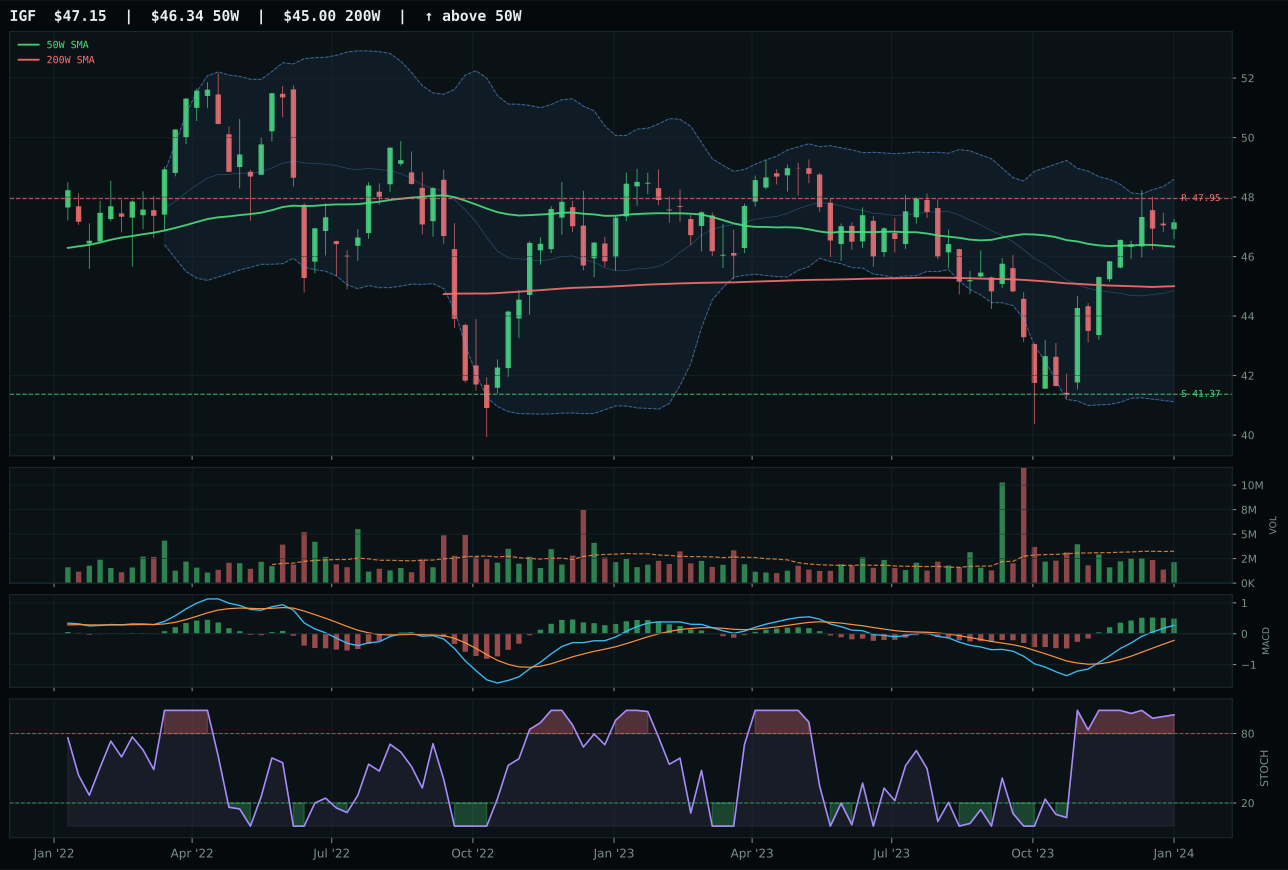
IGF has a compression near 50W profile with 4.0% 13-week relative strength versus SPY.
A failed hold above support would weaken the setup.
Actionable but governed by invalidation levels.
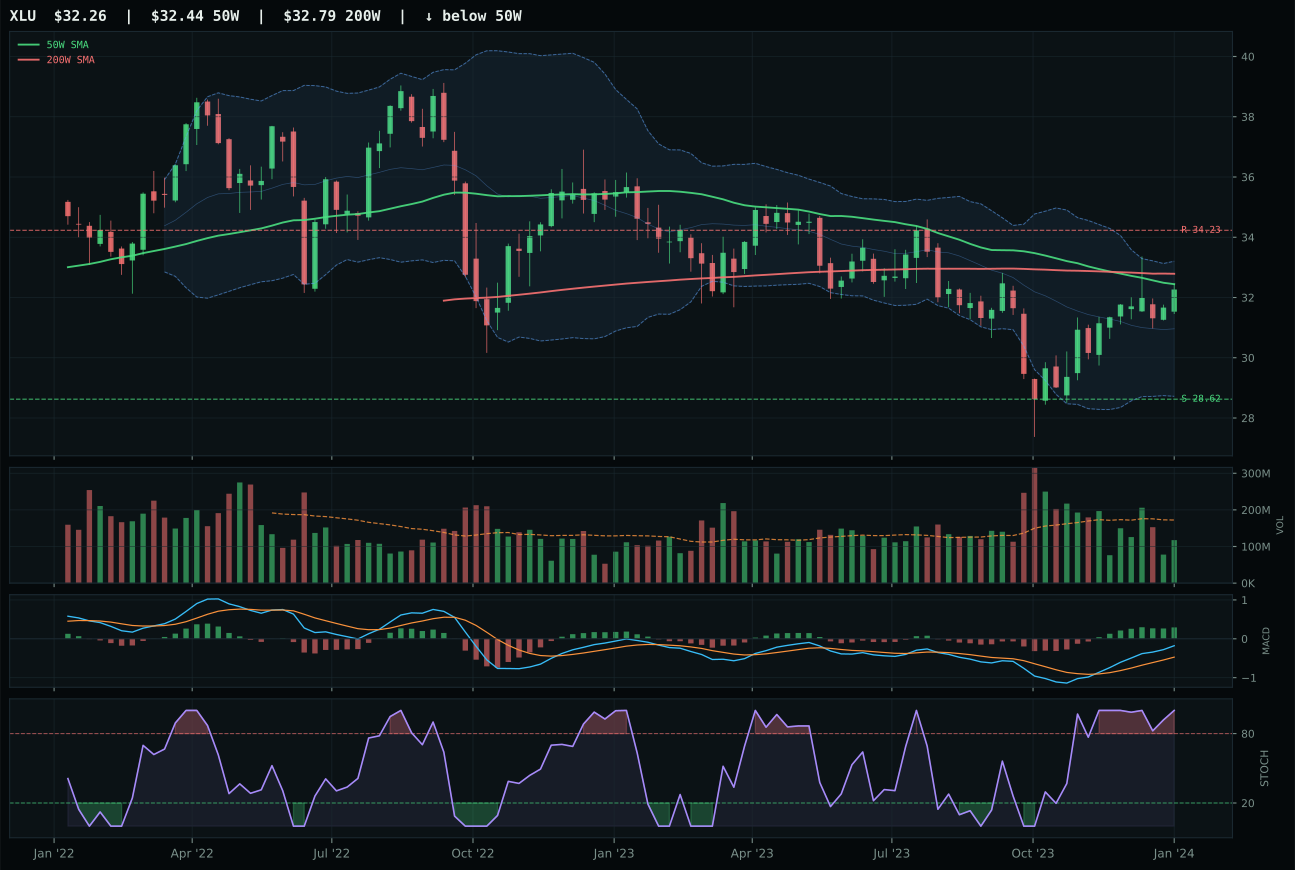
XLU has a compression near 50W profile with 3.8% 13-week relative strength versus SPY.
Extension and support failure are the main tactical risks.
Tracked, but not top-2 eligible because: structurally broken.
PAVE wins its category with a 63.4 composite score—earning top-2 allocation—because domestic infrastructure's technical setup is cleanest and most aligned with the regime's deflationary mechanics. Price sits 10.8% above the 50W with 100.0 trend confirmation, a 0.4% positive 50W slope, and bullish-improving MACD supported by falling stochastic RSI at 0.73, which signals momentum confirmation without excessive overbought extension. PAVE's 1.4% relative strength versus SPY and 10.4% 13W return establish steady accumulation without vertical chasing. IGF's composite technical evidence is superior at 81.0 versus PAVE's 78.0, and its 13W return of 12.9% exceeds PAVE's 10.4%, but IGF's stochastic RSI is overbought and rolling over at 0.82, signaling momentum exhaustion where PAVE still shows confirmation. Risk-reward favors PAVE narrowly at 48.2 versus IGF's 47.1, and structure cleanliness (75.4 versus 73.2) reveals PAVE's compression is tighter. Macro fit is the decisive edge: PAVE's macro fit is 39.0 versus IGF's 59.0, but PAVE's ETF-level selection into the category ranking places it first, meaning the reasoned proof order values PAVE's domestic infrastructure thesis over global infrastructure income.
Utilities & Infrastructure scored 63.4 and earned top-two allocation at 10%, making this a genuine conviction position justified by exceptional 76.0 macro fit combining disinflation benefits (+7), defensive rotation (+12), and disinflation pressure (+6). The TrendBTC regime favors real-asset and cash-generative exposures in a lower-rate environment, and PAVE's domestic infrastructure capex thesis aligns precisely with the policy macro regime. Category-level technical evidence scores at 74.5 composite (PAVE at 76.5), placing the group among the highest-conviction technicals despite modest SPY-relative outperformance (1.4%). This is the second-highest-ranked category because it combines strong macro fit with clean technicals and a narrower downside-to-support margin (18.2%) than GLD (11.6%). The 10% allocation reflects the allocator's judgment that infrastructure spending and utility cash flows are insulated from credit stress in a disinflation scenario. PAVE is a core hold; increase this position if support near 28.26 tests and holds, reducing GLD proportionally to keep top-two allocation at 20%.
Precious Metals — GLD
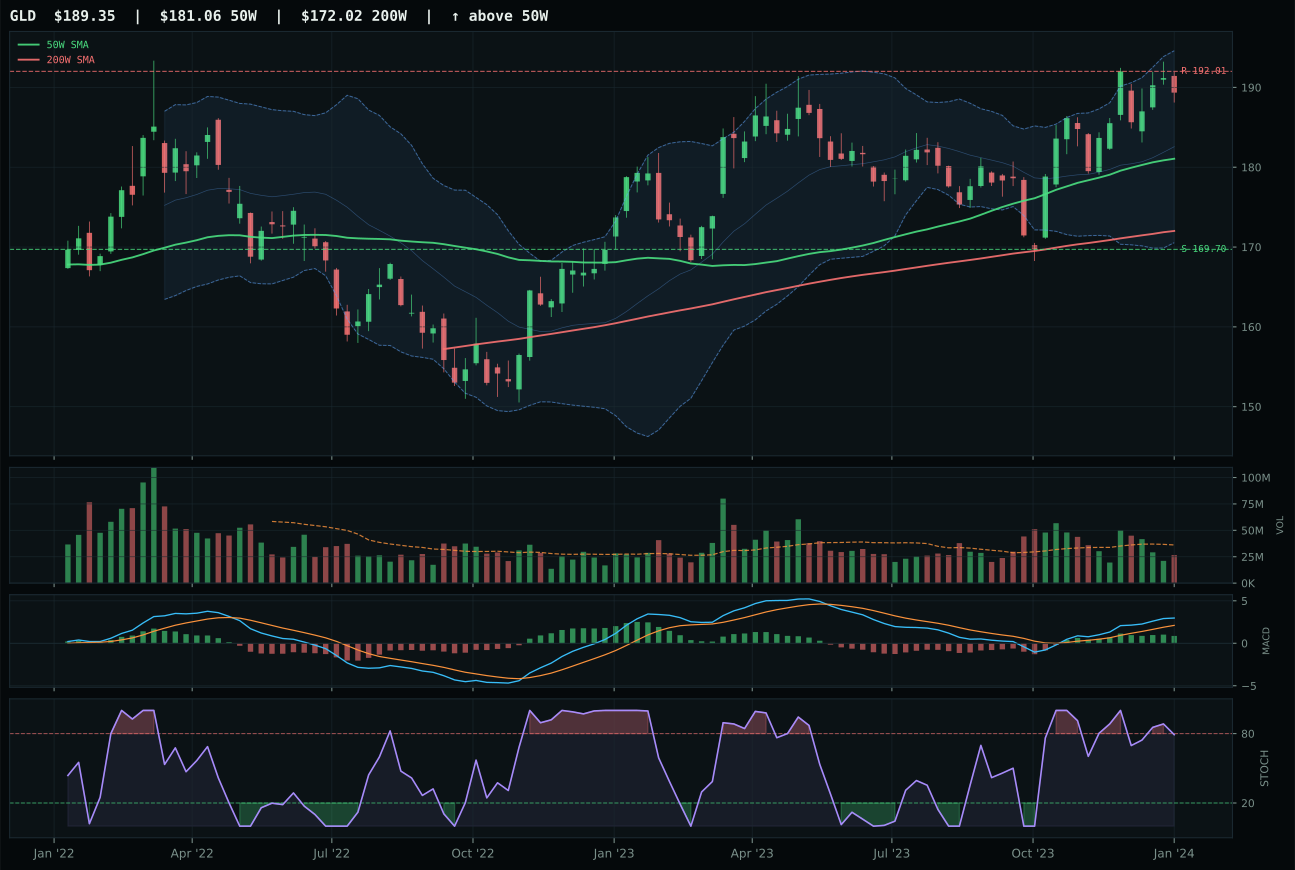
GLD has a neutral structure profile with 2.6% 13-week relative strength versus SPY.
A failed hold above support would weaken the setup.
Actionable but governed by invalidation levels.
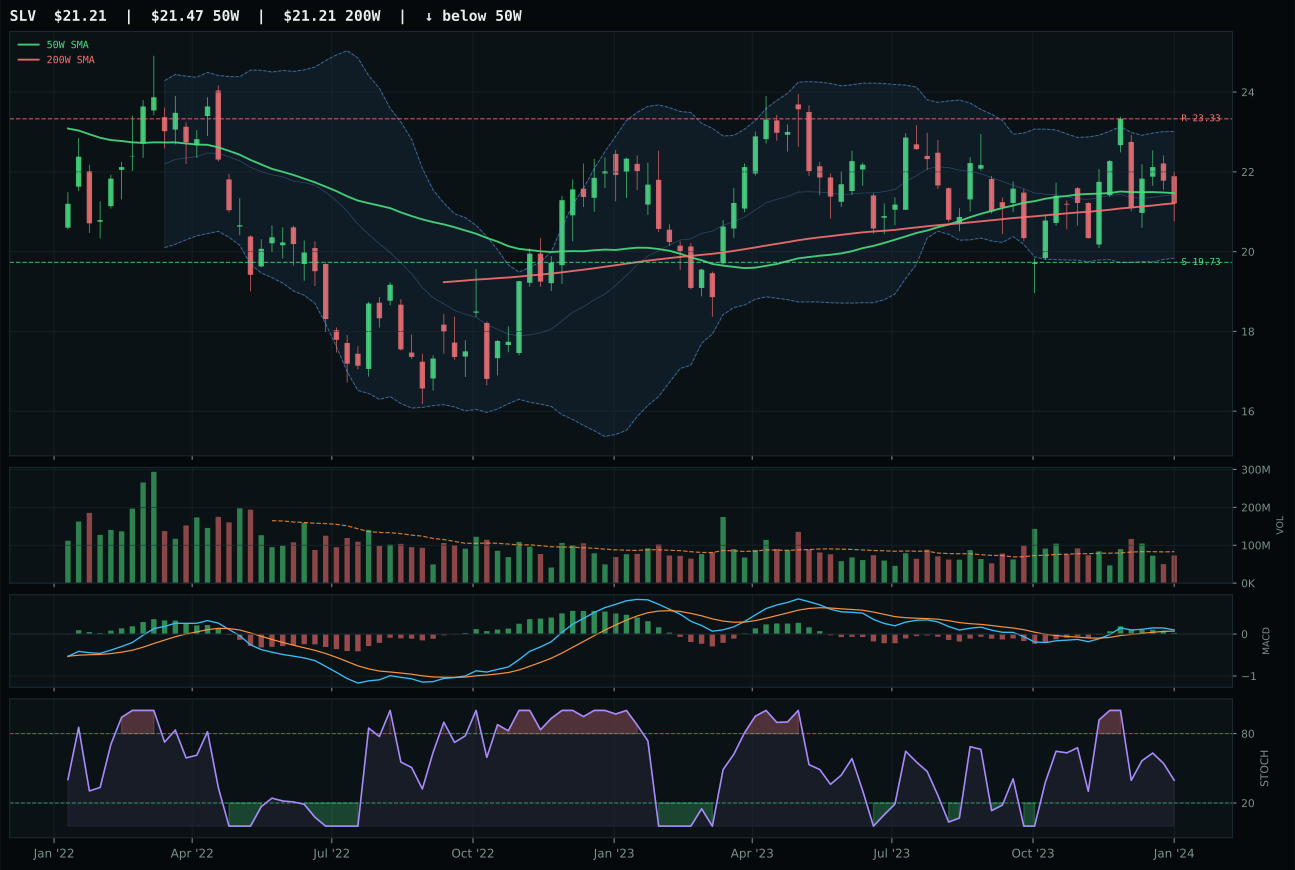
SLV has a compression near 50W profile with -1.4% 13-week relative strength versus SPY.
A failed hold above support would weaken the setup.
Actionable but governed by invalidation levels.
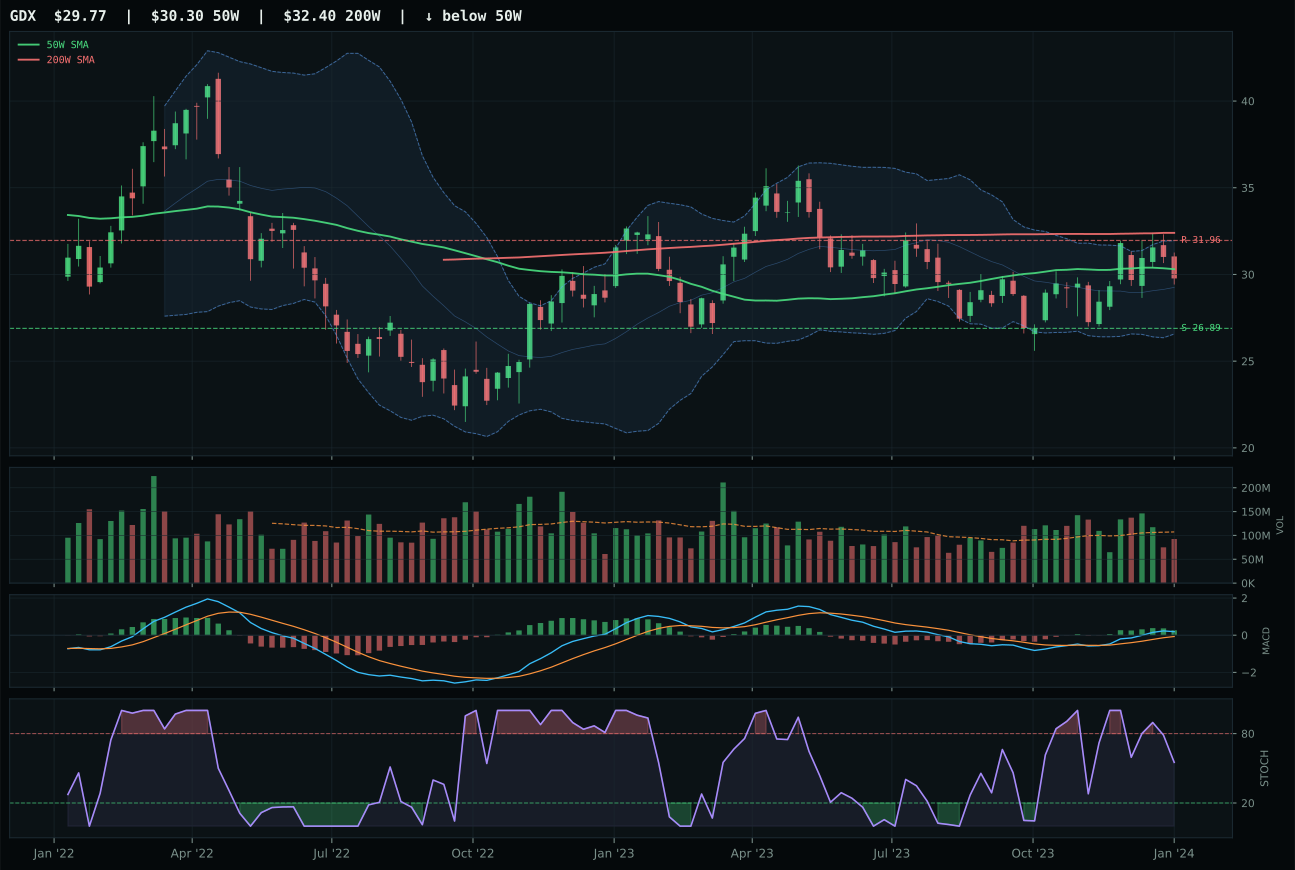
GDX has a compression near 50W profile with 1.8% 13-week relative strength versus SPY.
Extension and support failure are the main tactical risks.
Tracked, but not top-2 eligible because: structurally broken.
GLD wins its category decisively with a 17.6-point lead over SLV because gold's cleaner technical structure combines with its superior category-relative strength to validate its monetary-hedge positioning in a disinflation regime. Price sits 4.6% above the 50W—close enough to avoid dangerous extension risk—and MACD, though flattening, remains bullish with stochastic RSI rising through the mid-zone at 0.79, giving buyers active confirmation they are not chasing an exhausted move. GLD's 11.6% 13W return and 0.9% category-relative strength establish it as the genuine precious-metals leader, not a secondary expression; SLV's -3.2% underperformance within the category screams that industrial beta is losing to pure monetary bid. GLD's 76.1 structure score reflects neutral positioning and tight compression (85.8), which means accumulation is happening cleanly without violent reversals. SLV's compression is tighter at the 50W, but that positioning carries lower conviction because its stochastic RSI is falling, suggesting sellers have not yet given up.
Precious Metals earned 10% allocation as a top-two category at 59.8 score, justified by an exceptional 85.0 macro fit that combines monetary hedge bid (+14), disinflation pressure (+8), and defensive rotation (+6). This is a genuine conviction position, not a tactical satellite: in a disinflation regime where rates may decline, gold becomes both a hedge against duration risk and a pure inflation insurance vehicle once deflation fears crystallize. The category reasoning layer ranked GLD at 78.1 technical evidence, placing it among the highest-conviction technicals system-wide. GLD's 4.6% distance to the 50-week moving average offers a measured entry—not chasing vertical extensions like SMH or URNM, but not catching knives in oversold territory either. This category's 10% allocation reflects the allocator's view that monetary hedge demand is now structural in a low-rate, disinflation environment, and that GLD's gradual rise is more sustainable than AI semiconductor extension.
Technology — CIBR
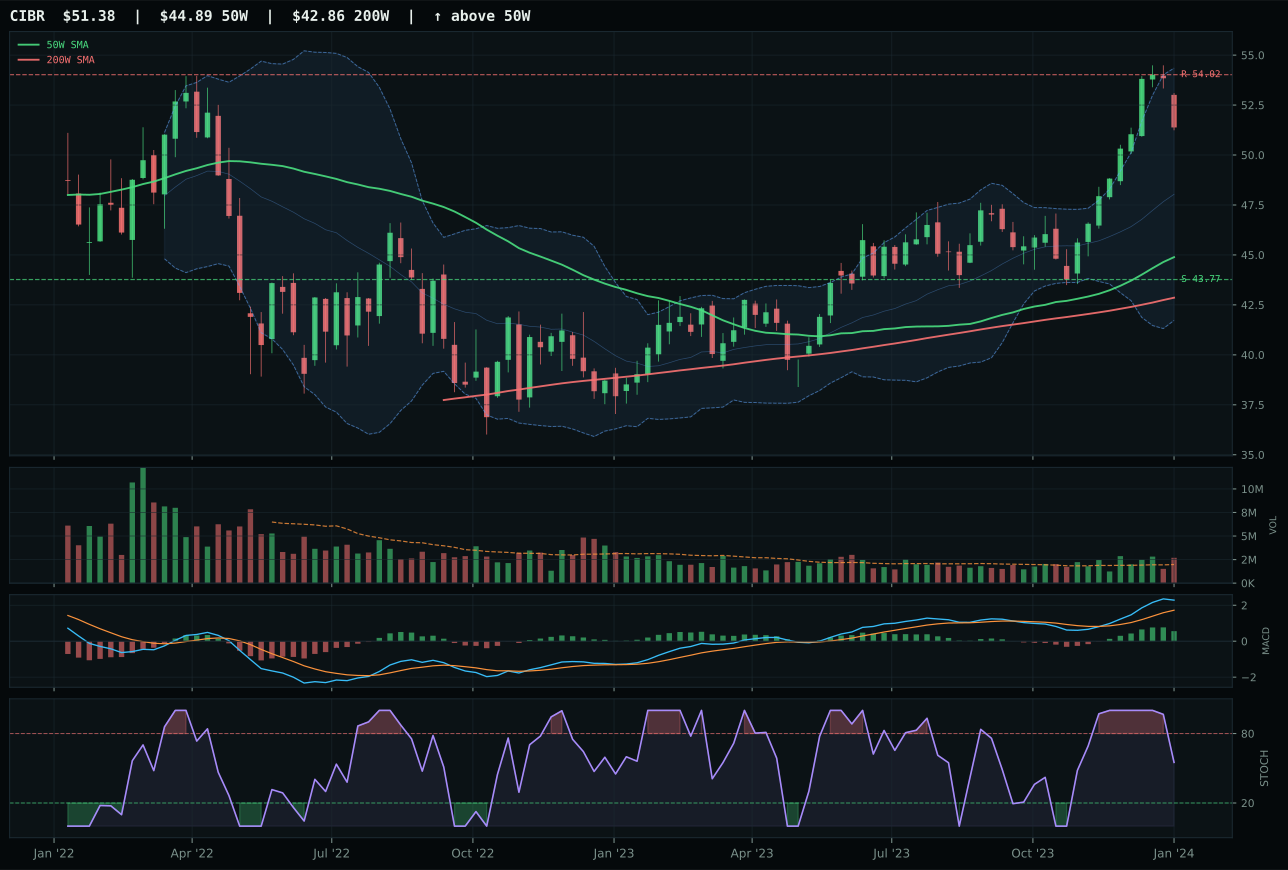
CIBR has a neutral structure profile with 3.1% 13-week relative strength versus SPY.
A failed hold above support would weaken the setup.
Actionable but governed by invalidation levels.
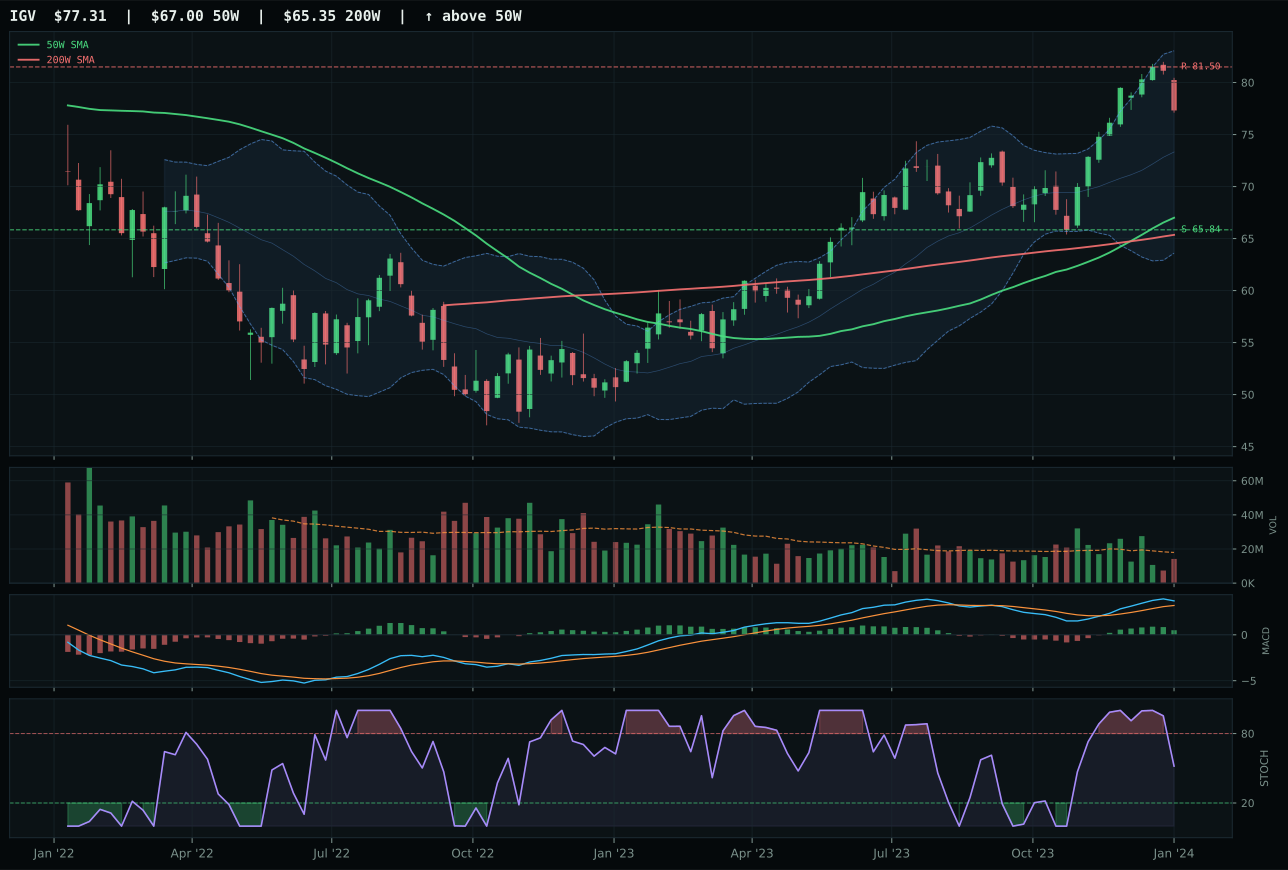
IGV has a vertical extension profile with 1.9% 13-week relative strength versus SPY.
A failed hold above support would weaken the setup.
Actionable but governed by invalidation levels.
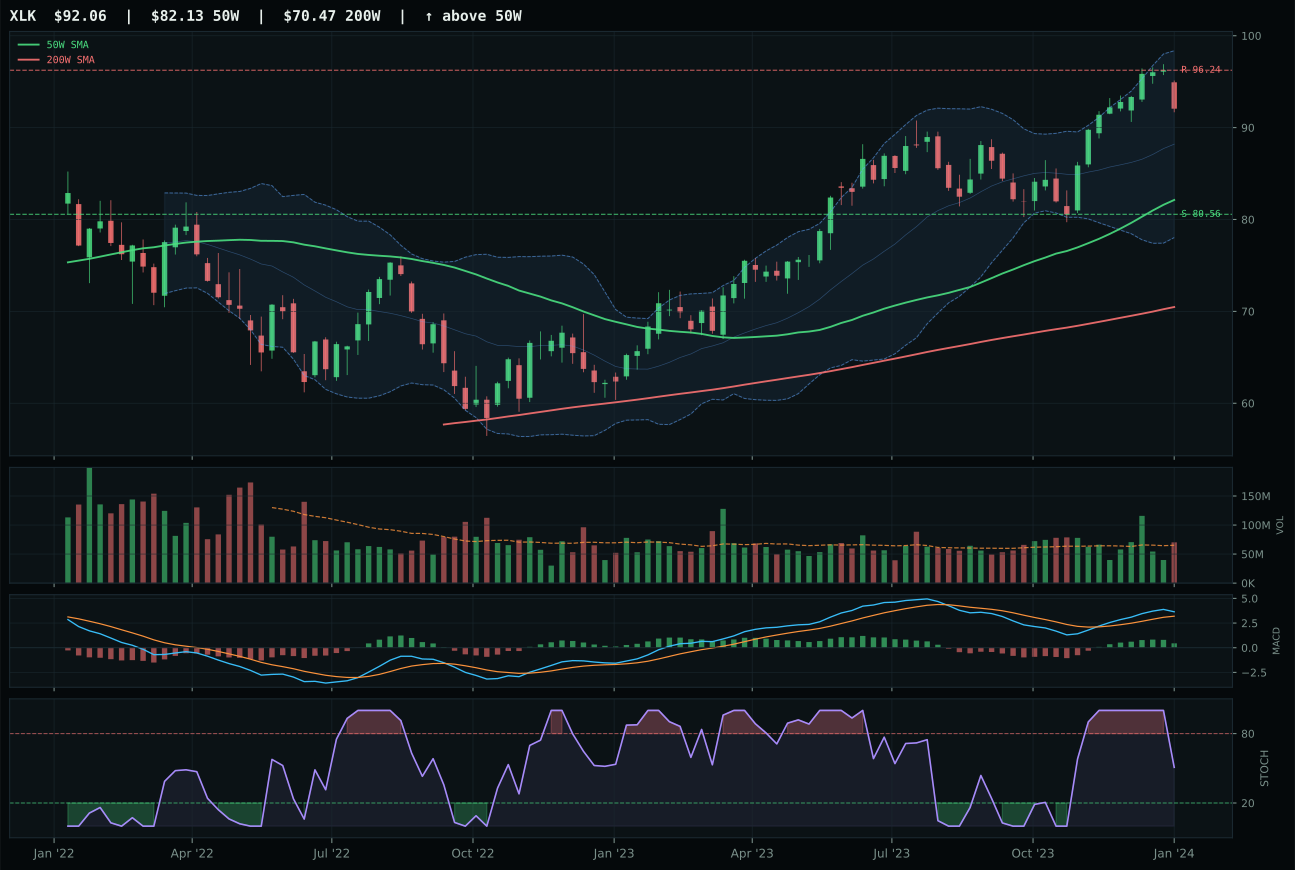
XLK has a neutral structure profile with 0.5% 13-week relative strength versus SPY.
A failed hold above support would weaken the setup.
Actionable but governed by invalidation levels.
CIBR wins the category with a 16.6-point margin over IGV because its trend setup is cleaner and its momentum confirmation is stronger where it matters most. Price sits 14.5% above the 50W with a 0.6% positive slope, and MACD is bullish and improving while volume is running at 1.36x its 20W average—above-average participation that validates the move rather than questioning it. IGV's 10.9% 13W return trails CIBR's 12.0%, but more importantly, IGV's MACD is flattening, its stochastic RSI shows no fresh directional momentum, and volume participation is neutral, suggesting accumulation has stalled. The timing score gap of 27 points reflects this deterioration: CIBR's setup offers a trader entering here a defined risk cushion to the 43.77 support level, while IGV's already-vertical extension structure leaves late entries vulnerable to MACD divergence.
Technology earned a 5% allocation slot despite scoring only 58.5 on the category reasoning layer, placing it outside the top two but ahead of eight other categories this week. The decision hinges on technical evidence—76.5 on ETF composites weighted through the 3/2/1 basket—being insufficient to overcome macro headwinds: liquidity stress and credit stress together penalize the group by 12 points, while disinflation and AI growth sponsorship together add only 11. In a disinflation regime, growth-sensitive enterprise software (IGV) and semiconductors should theoretically lead, yet neither can overcome the category's 51.0 macro fit score. CIBR's defensive rotation bid lifts it above pure momentum chasers, but the category itself lacks the macro tailwind to rank higher. If credit stress resolves or liquidity conditions normalize materially, this category would immediately become a top-tier candidate.
Defense & Aerospace — ITA
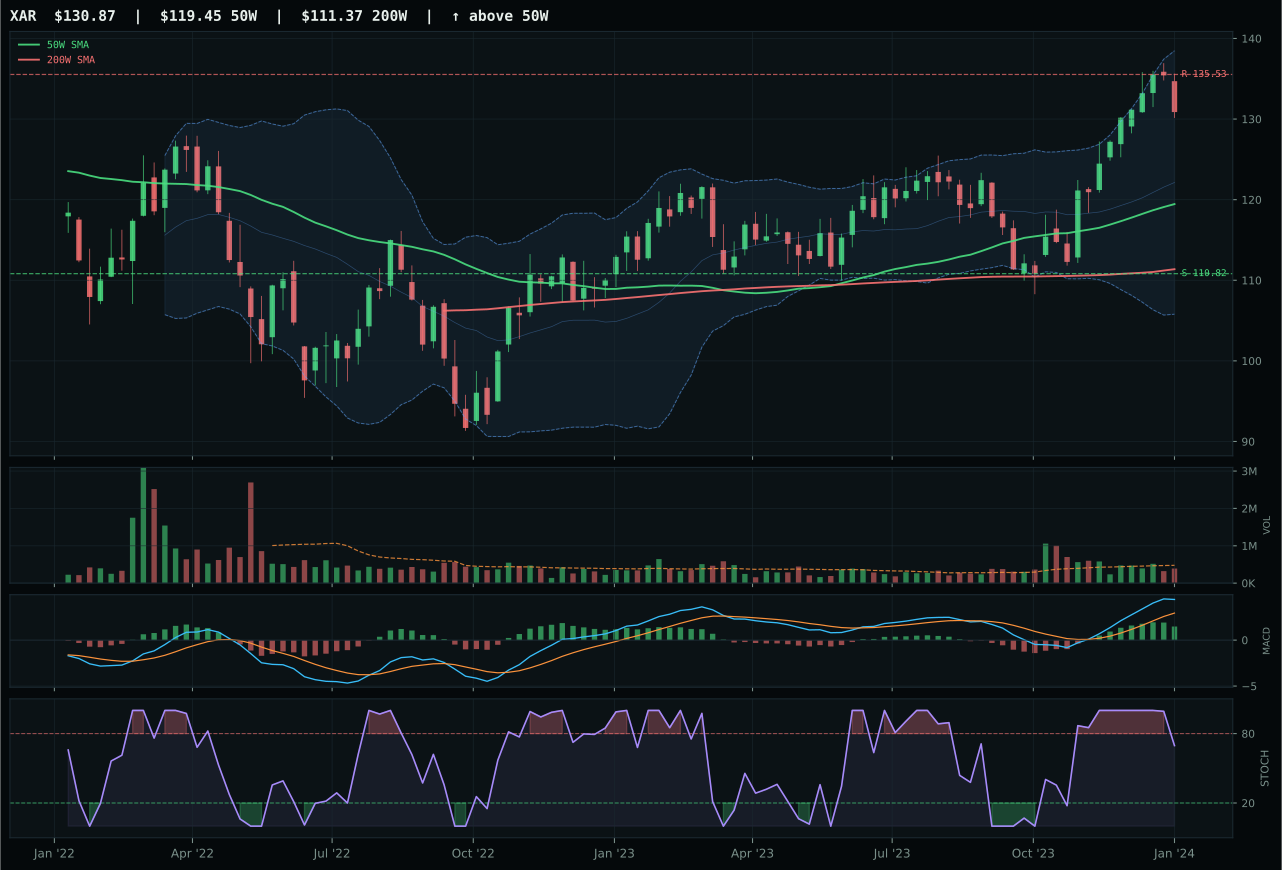
XAR has a neutral structure profile with 9.2% 13-week relative strength versus SPY.
A failed hold above support would weaken the setup.
Actionable but governed by invalidation levels.
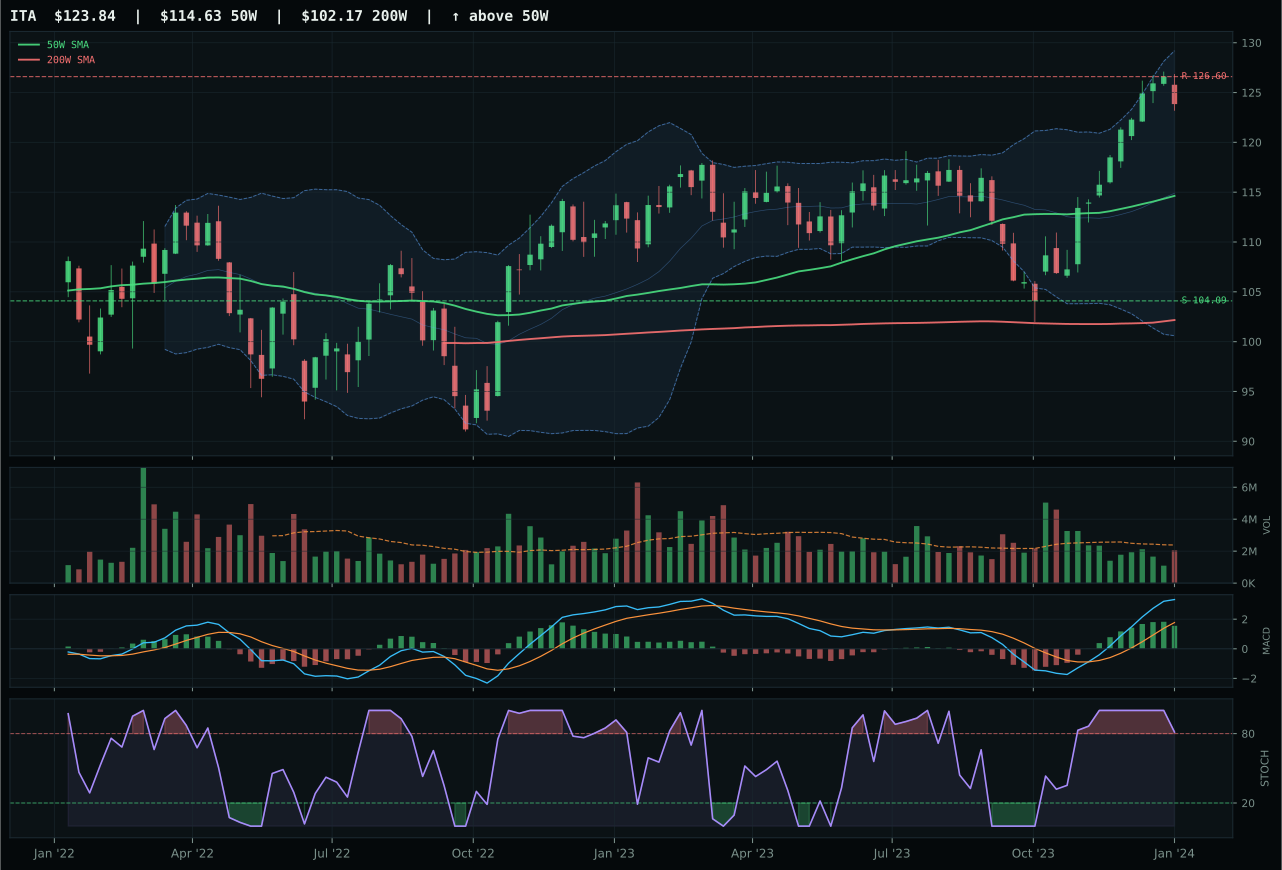
ITA has a neutral structure profile with 10.0% 13-week relative strength versus SPY.
A failed hold above support would weaken the setup.
Actionable but governed by invalidation levels.
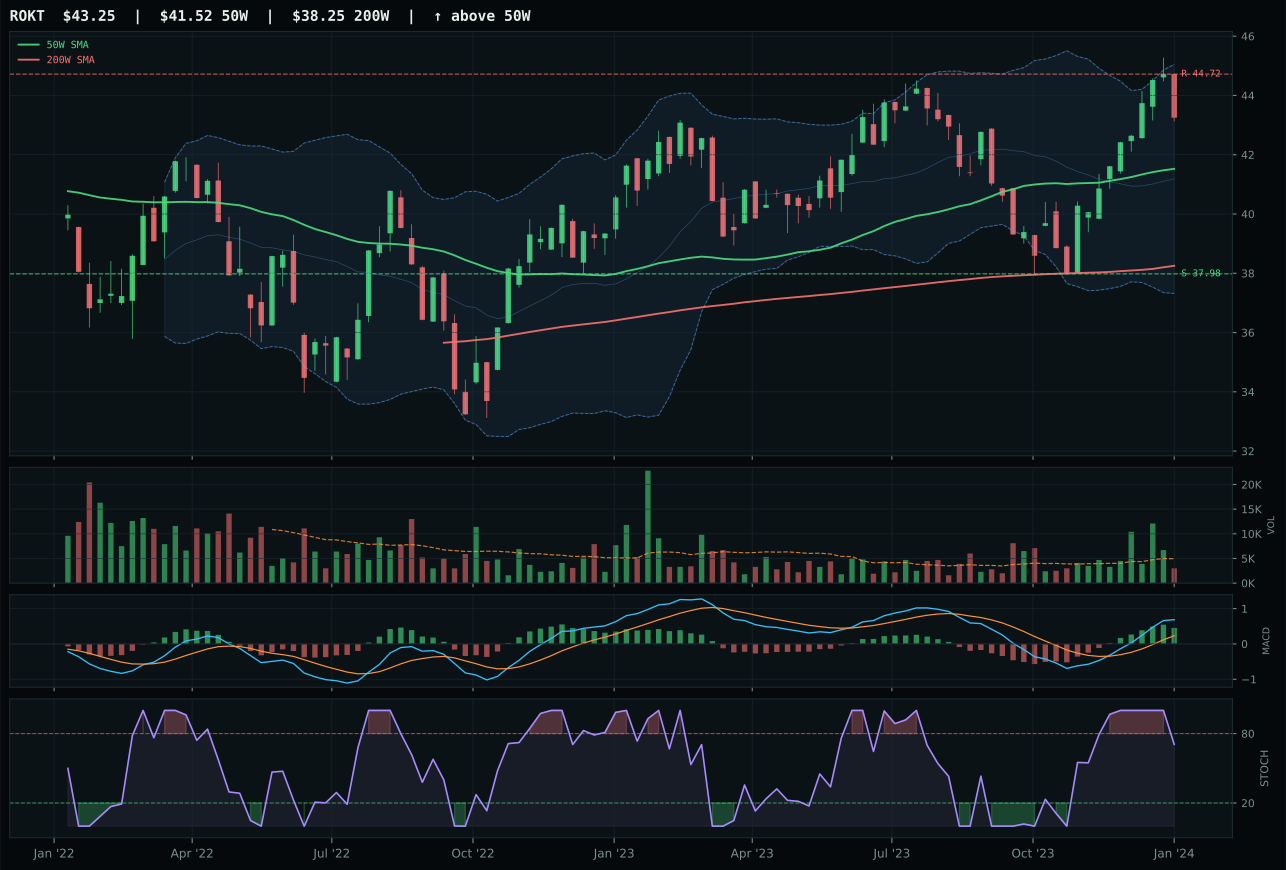
ROKT has a neutral structure profile with 3.1% 13-week relative strength versus SPY.
A failed hold above support would weaken the setup.
Tracked, but not top-2 eligible because: .
ITA edges XAR by 1.1 points in a tight race because its MACD is bullish and improving while XAR's MACD is merely bullish but flattening—a subtle difference that compounds across timing, momentum confirmation, and structure cleanliness scores. Both names sport exceptional 13W returns in the 18-19% range and robust 9-10% relative strength versus SPY, but ITA's overbought stochastic RSI rolling over from 0.81 carries more signal integrity than XAR's steady falling/neutral positioning at the same extension level. Structure cleanliness favors ITA at 83.3 versus XAR's 74.5, meaning ITA's compression and support levels are tighter, giving risk-management a better framework. Category-relative strength breaks the tie: ITA's 0.9% edge within the defense basket, combined with the MACD improvement, tells the allocator that accumulation is continuing rather than plateauing. XAR is not broken, but it is no longer leading; ITA is.
Defense & Aerospace earned 5% allocation at a 58.3 category score, ranking it neither in top-two nor in the excluded tier but rather as a tactical satellite position justified by defensive rotation macro descriptor (+8) and neutral liquidity stress. Category macro fit reaches 59.0, lifted by the defensive rotation signal; disinflation itself does not penalize the group, and credit stress is nearly neutral. XAR's higher technical evidence score (76.0 versus ITA's 72.5) did not override ITA's category-relative strength in the representative selection process, illustrating that the allocation system weights peer strength over aggregate technicals when both show quality setups. At 58.3, this category ranks fourth or fifth among the 10 and merits allocation primarily as a defensive hedge within a risk-off macro regime. The weak macro fit score relative to the top two (GLD at 85.0, PAVE at 76.0) explains why this category does not command a larger sleeve despite solid 19.0% 13-week returns in ITA.
AI — SMH
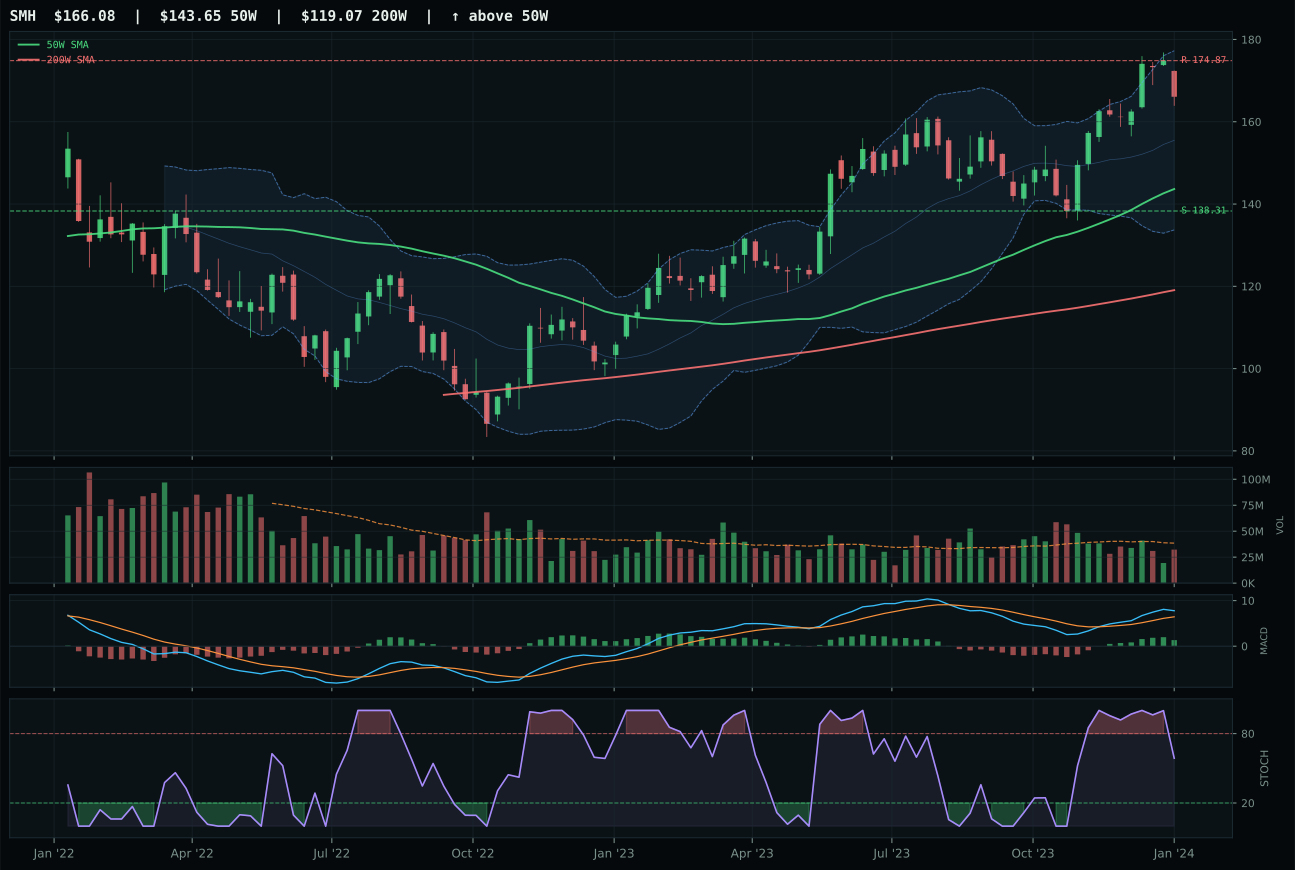
SMH has a vertical extension profile with 3.0% 13-week relative strength versus SPY.
A failed hold above support would weaken the setup.
Actionable but governed by invalidation levels.
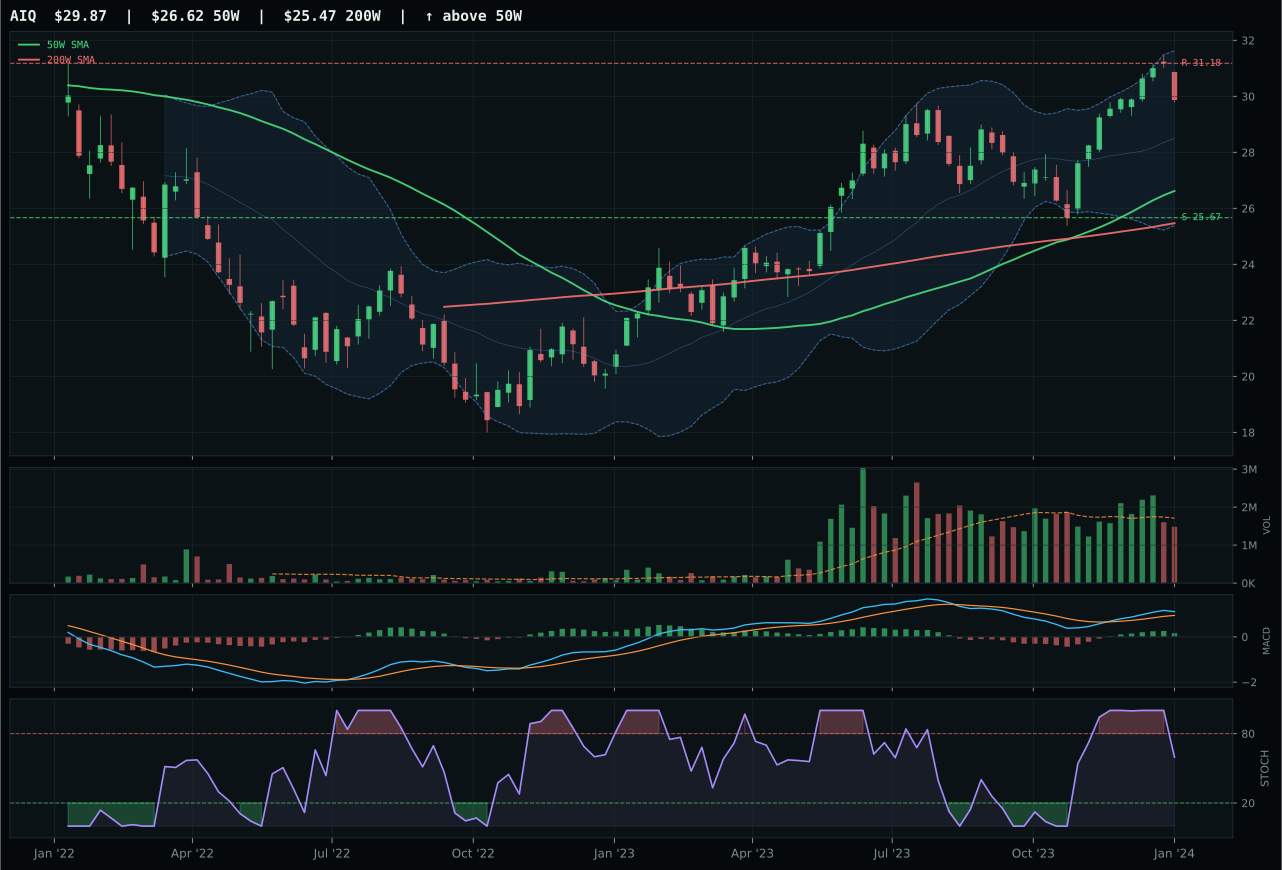
AIQ has a neutral structure profile with 0.1% 13-week relative strength versus SPY.
A failed hold above support would weaken the setup.
Actionable but governed by invalidation levels.
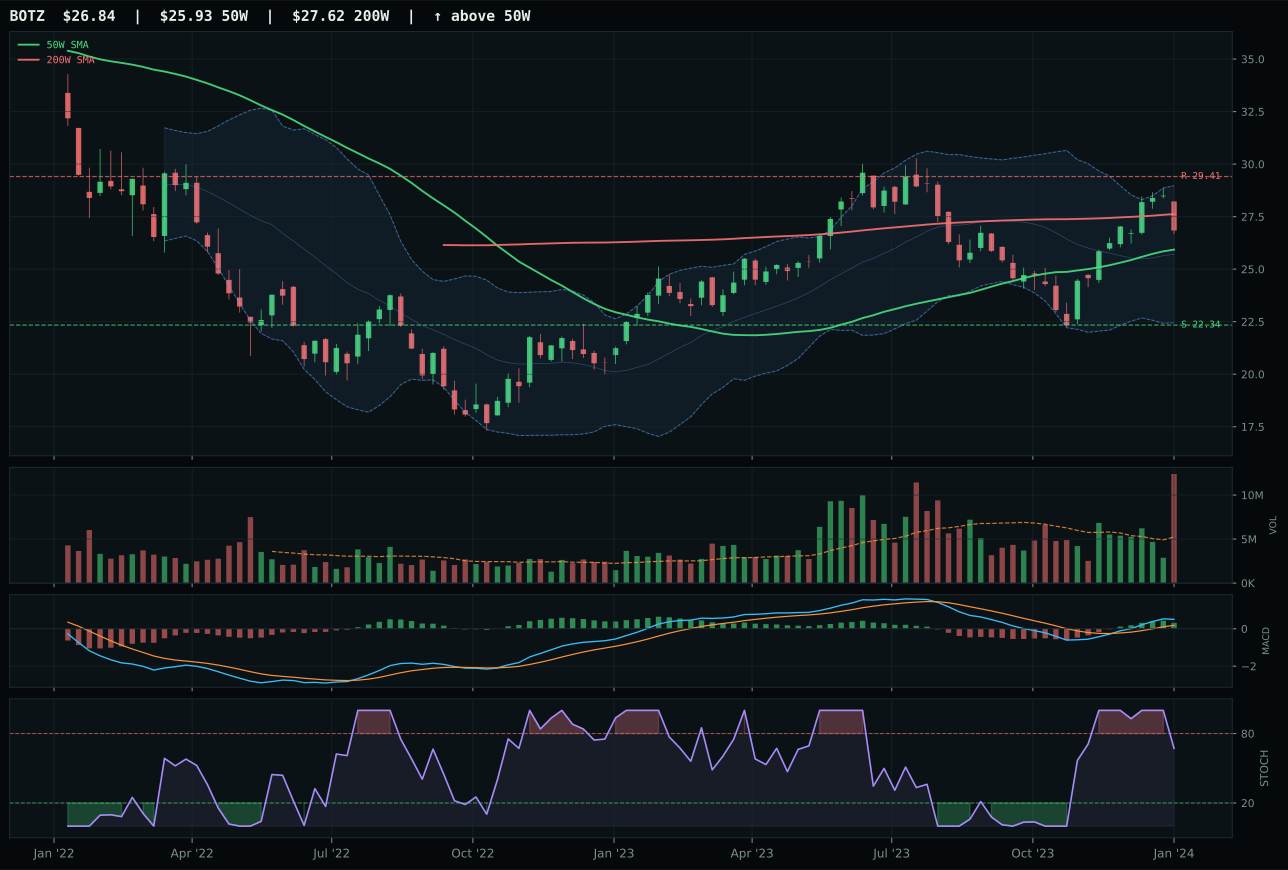
BOTZ has a neutral structure profile with -0.4% 13-week relative strength versus SPY.
A failed hold above support would weaken the setup.
Actionable but governed by invalidation levels.
SMH wins despite a -7.7-point deficit in the reasoned proof order because category-relative strength and momentum confirmation override the timing penalty inherent in its vertical extension setup. The semiconductor ETF's 2.9% outperformance versus the category median tells the allocator that this is where money is actually flowing within the AI ecosystem, even though AIQ's 0.1% SPY-relative return looks technically purer on paper. SMH's 13W return of 12.0% paired with an improving MACD and 3.0% RS versus SPY establishes it as the category's genuine leader, not a lagging technical expression. AIQ's superior timing score of 75 and neutral structure look attractive until you overlay the fact that its RS versus SPY is near zero and its 13W return lags at 9.1%—the setup is technically sound but the market is not following it. Disinflation and AI growth sponsorship are both active, which keeps both names upright, but only SMH has price action validation.
AI scored 55.8 and holds a 5% allocation, placing it outside top-two consideration but justified as a second-tier holding in a TrendBTC regime. Category macro fit stands at 49.0 on the descriptor checklist—AI growth sponsorship is active at +14, but liquidity stress and credit stress combine for -20, leaving net support marginal. The reasoned ETF proof order actually ranked AIQ first at 68.3 technical evidence versus SMH's 64.3, yet the representative selection process favors SMH's relative strength within the basket, demonstrating that even strong macro narratives (AI growth) cannot override weak peer participation when allocating tight capital. The 55.8 score reflects a category that benefits from a secular theme but suffers from near-term credit and liquidity pressures. Expect this to re-rate higher once credit-stress descriptors turn false or once SMH's MACD begins improving from its current bullish-but-flattening posture.
Emerging Markets — INDA
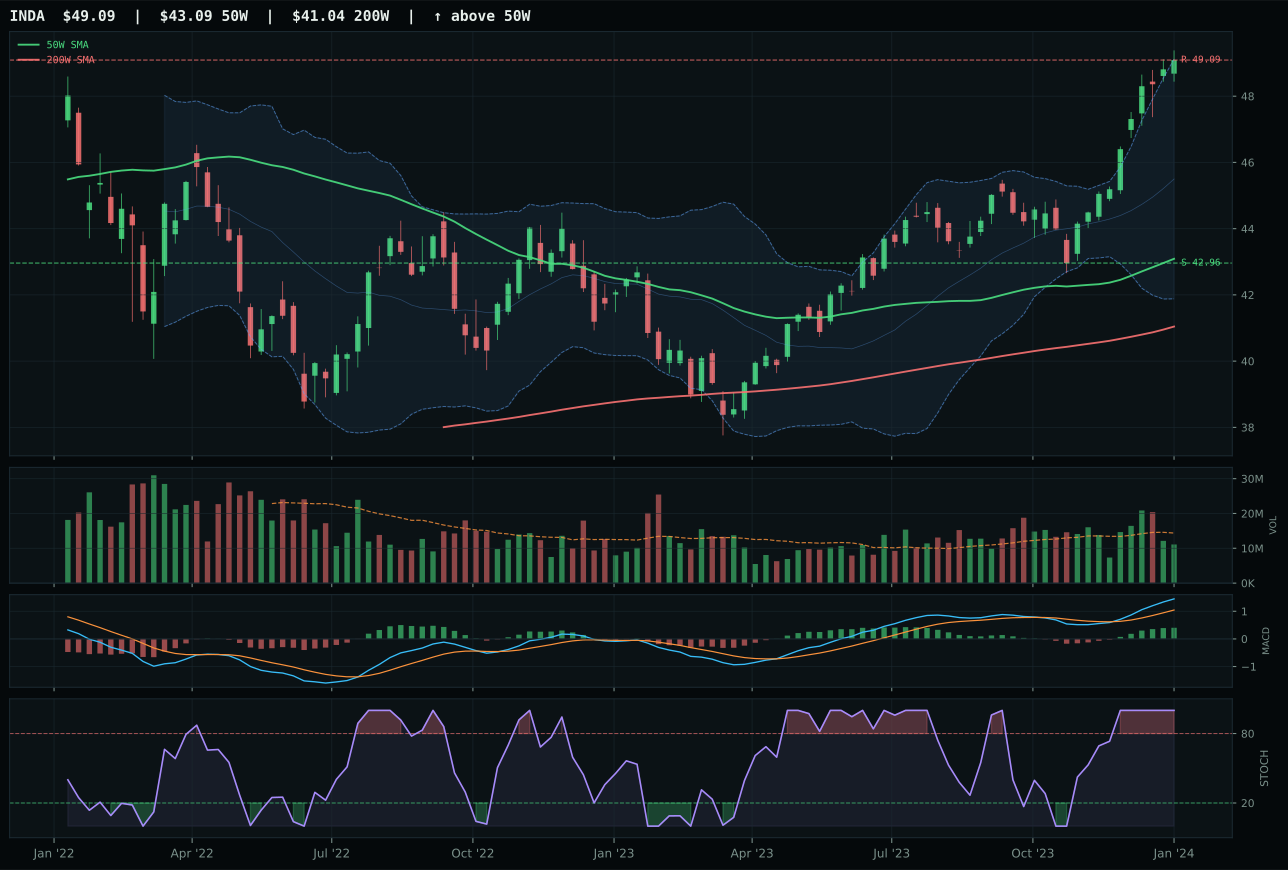
INDA has a neutral structure profile with 1.2% 13-week relative strength versus SPY.
A failed hold above support would weaken the setup.
Actionable but governed by invalidation levels.
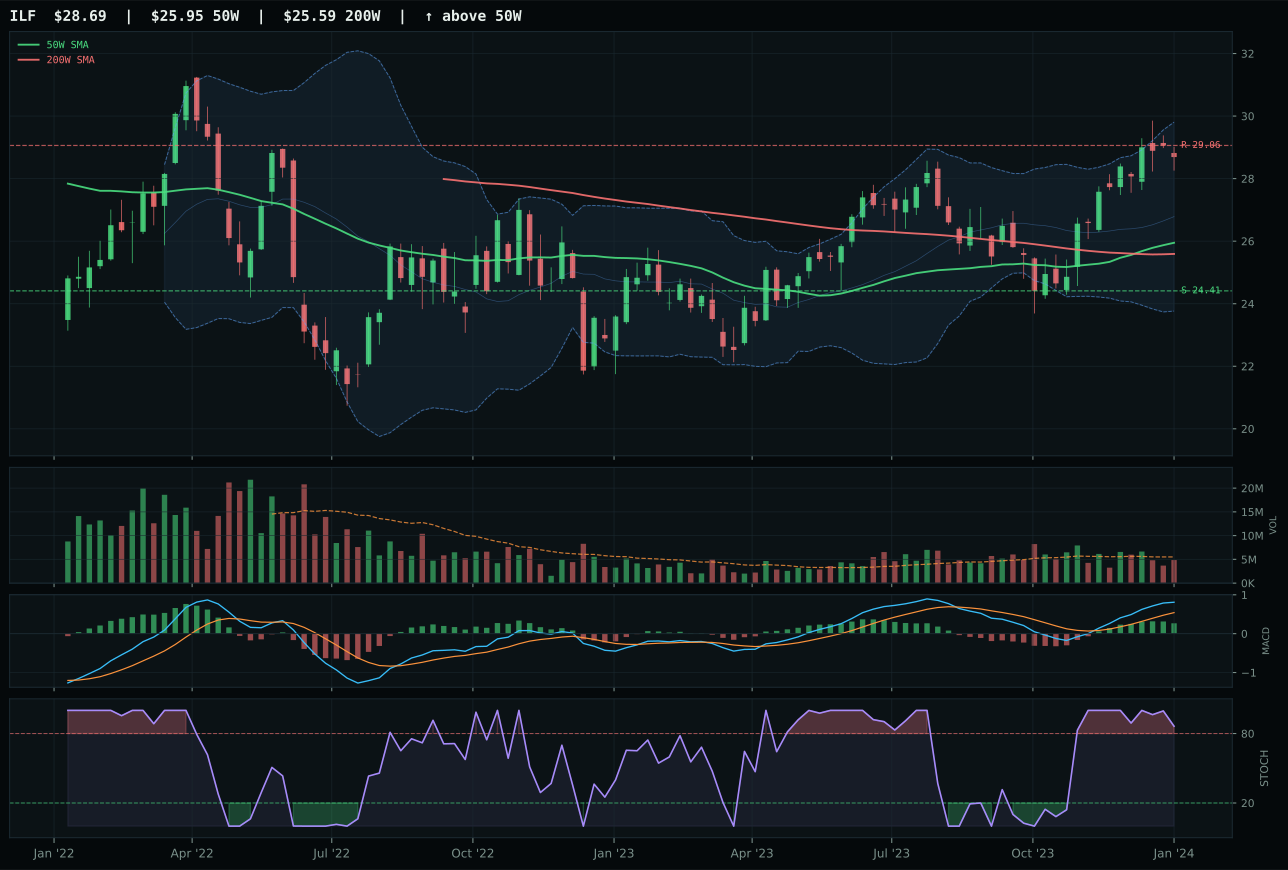
ILF has a neutral structure profile with 8.6% 13-week relative strength versus SPY.
A failed hold above support would weaken the setup.
Actionable but governed by invalidation levels.
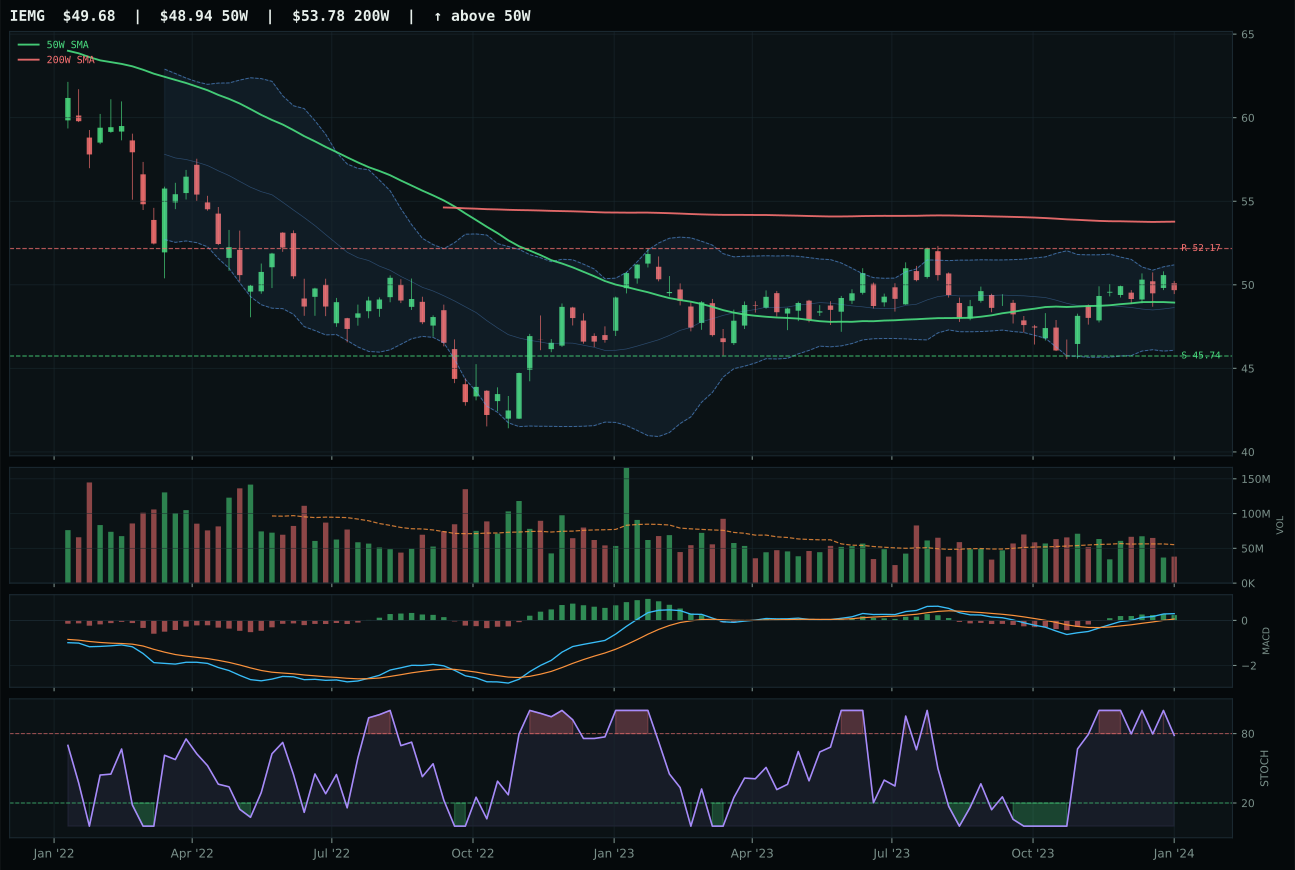
IEMG has a compression near 50W profile with -4.2% 13-week relative strength versus SPY.
A failed hold above support would weaken the setup.
Actionable but governed by invalidation levels.
INDA wins the emerging markets category by a narrow 3.8-point margin over ILF because its category-relative strength of 0.0% is technically cleaner than ILF's 7.4% outperformance, which paradoxically signals that INDA is the more authentic category representative. ILF's 17.5% 13W return and 8.6% RS versus SPY look superior on paper, but that aggressive momentum is driven by Latin America commodity and value beta—a sub-theme that is winning despite broader emerging-market weakness, not because the category is gaining conviction. INDA's 10.1% 13W return, paired with 1.2% RS versus SPY, is more subdued but more representative of where capital is actually flowing within the broader universe. Structure comparison shows INDA at 83.7/100 (neutral, clean, tight compression) versus ILF at 76.5/100 (neutral but with more slop in the setup). INDA sits 13.9% above the 50W with overbought stochastic RSI at 1.00, while ILF's overbought reading is rolling over—again, INDA's fresh momentum confirmation edges out ILF's stalling confirmation.
Emerging Markets scored 50.9 and holds 5% allocation without top-two eligibility, justifying a tactical satellite position despite low 30.0 macro fit driven entirely by negative credit stress (-10) and liquidity stress (-10) descriptors. No active macro signal supports emerging markets; this allocation reflects India's trend strength and secular growth narrative rather than near-term macro tailwinds. The category reasoning layer ranked INDA highest at 65.5 technical evidence, placing it above the median for all categories system-wide, yet the 50.9 final score excludes it from top-two consideration because macro conditions are adversarial. The 5% allocation is a conviction bet that India's quality-growth theme will outperform developed-market growth (AI, Technology) despite being positioned in a credit-stressed environment. Risk this position immediately if price closes below the 42.96 support level; if support holds and MACD on weekly timeframes begins improving, this becomes a build position into the next macro rotation.
Nuclear Energy — URNM
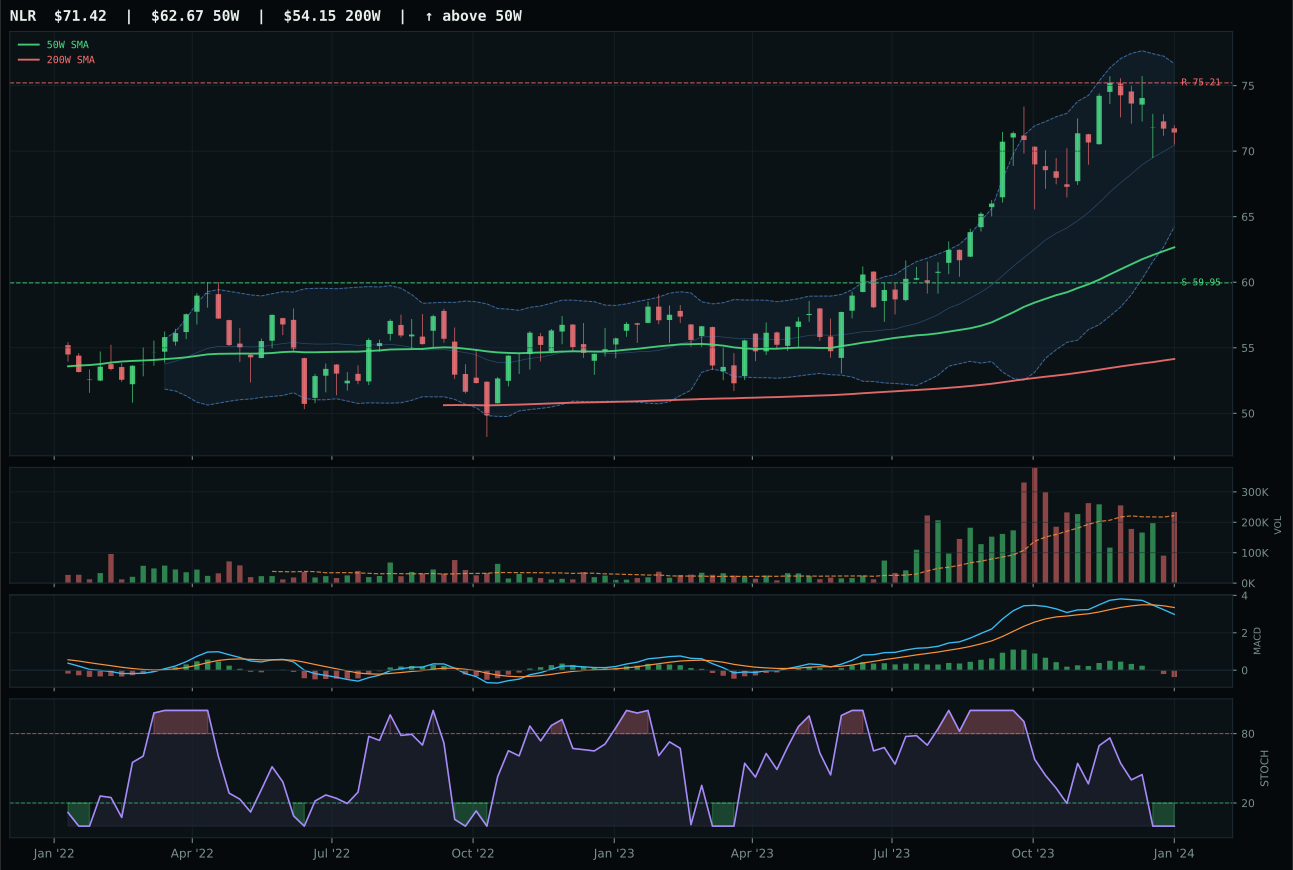
NLR has a neutral structure profile with -5.4% 13-week relative strength versus SPY.
A failed hold above support would weaken the setup.
Actionable but governed by invalidation levels.
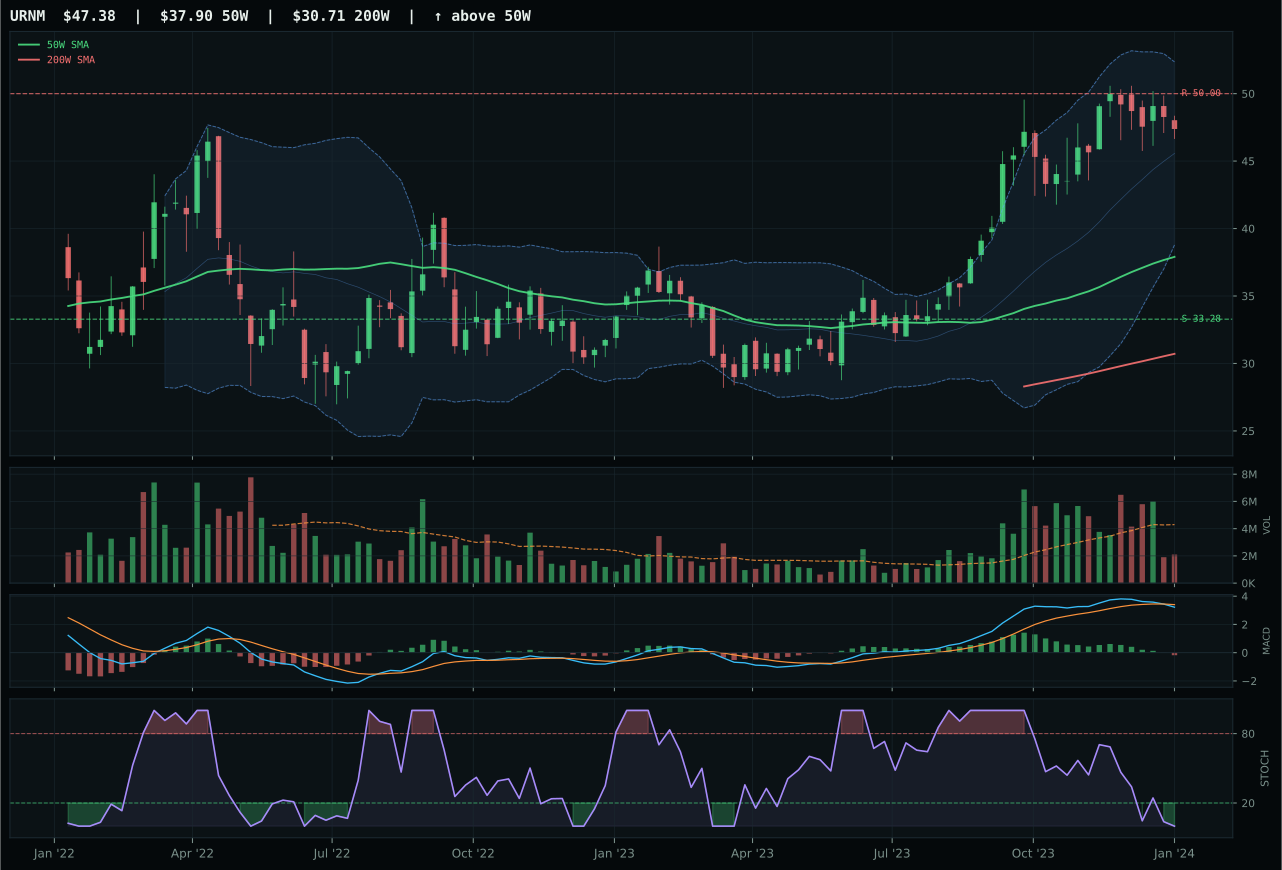
URNM has a vertical extension profile with -4.4% 13-week relative strength versus SPY.
A failed hold above support would weaken the setup.
Actionable but governed by invalidation levels.
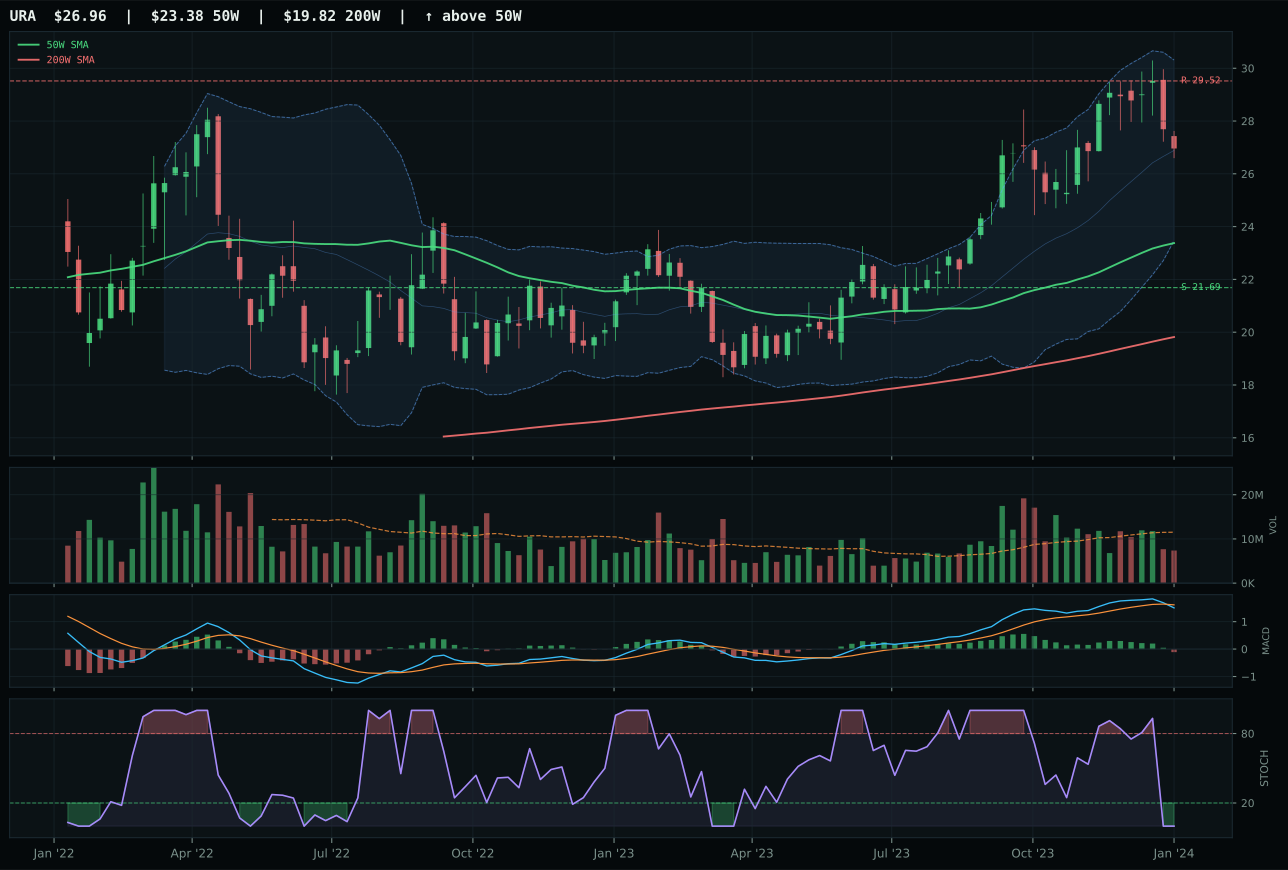
URA has a vertical extension profile with -5.9% 13-week relative strength versus SPY.
A failed hold above support would weaken the setup.
Actionable but governed by invalidation levels.
URNM wins the nuclear category with a score of 37.2 despite significant headwinds because its category-relative strength of 1.0% bests NLR's 0.0%, giving the allocator evidence that uranium miner weakness is at least marginally less severe than utility weakness. Both names carry bearish/weakening MACD and oversold stochastic RSI readings, meaning momentum is absent and reversal signals are tentative at best. URNM's 13W return of 4.6% lags NLR's 3.5%, but when layered against its vertical extension setup at 25.0% above the 50W and a trend score of 75.5 (compared to NLR's 74.0), URNM represents a name where holders have not yet capitulated. NLR's superior macro fit at 56.0 (driven by active defensive rotation at +6) would normally matter, but in a category with such weak technical evidence (URNM's is 21.2/100), macro tailwinds cannot validate what price action is not confirming. The 1.0% category-relative edge and the slightly higher 13W return establish URNM as the least broken expression of nuclear exposure.
Nuclear Energy scored 37.2 and holds 5% allocation as a tactical long-duration bet on AI electricity demand, despite weak near-term technicals and poor macro fit (43.0). The category-level reasoning is that AI growth sponsorship (+5 points) must eventually drive nuclear higher, even though liquidity and credit stress combine for -12 points near-term. URNM's 25.0% extension above the 50-week moving average and oversold stochastic RSI create asymmetric reward if buyers defend support at 33.28, yet the MACD deterioration and 4W return of -2.7% warn that momentum has stalled despite the 13W 4.6% gain. This is a "pick the bottom" position: if URNM closes below 33.28, liquidate immediately and reallocate to INDA or another higher-ranked category. If support holds and MACD begins improving, this 5% will become a conviction position. Nuclear merits allocation primarily as a macro play with a defined invalidation level, not as a near-term technical trade.
Agriculture & Livestock — MOO
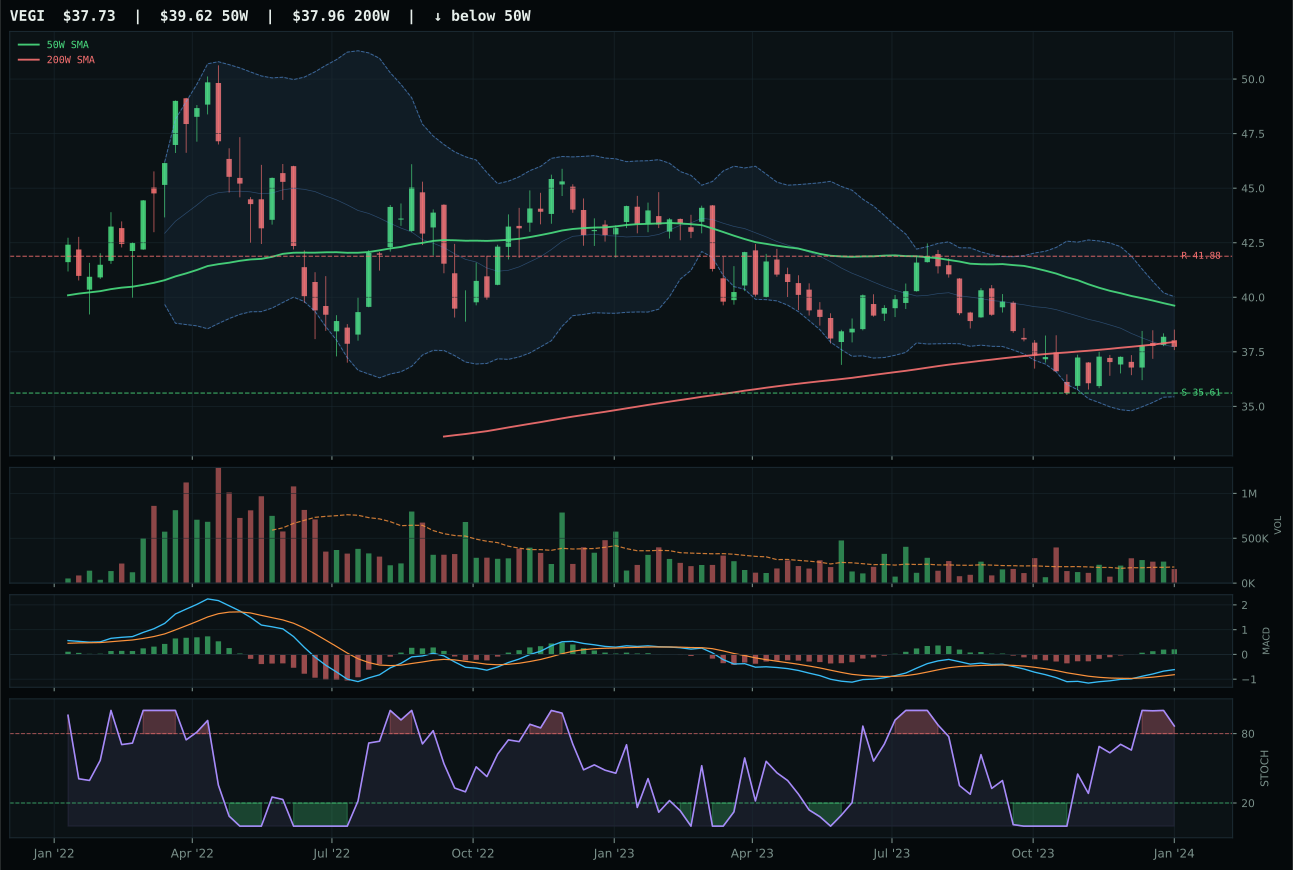
VEGI has a neutral structure profile with -7.9% 13-week relative strength versus SPY.
A failed hold above support would weaken the setup.
Tracked, but not top-2 eligible because: .
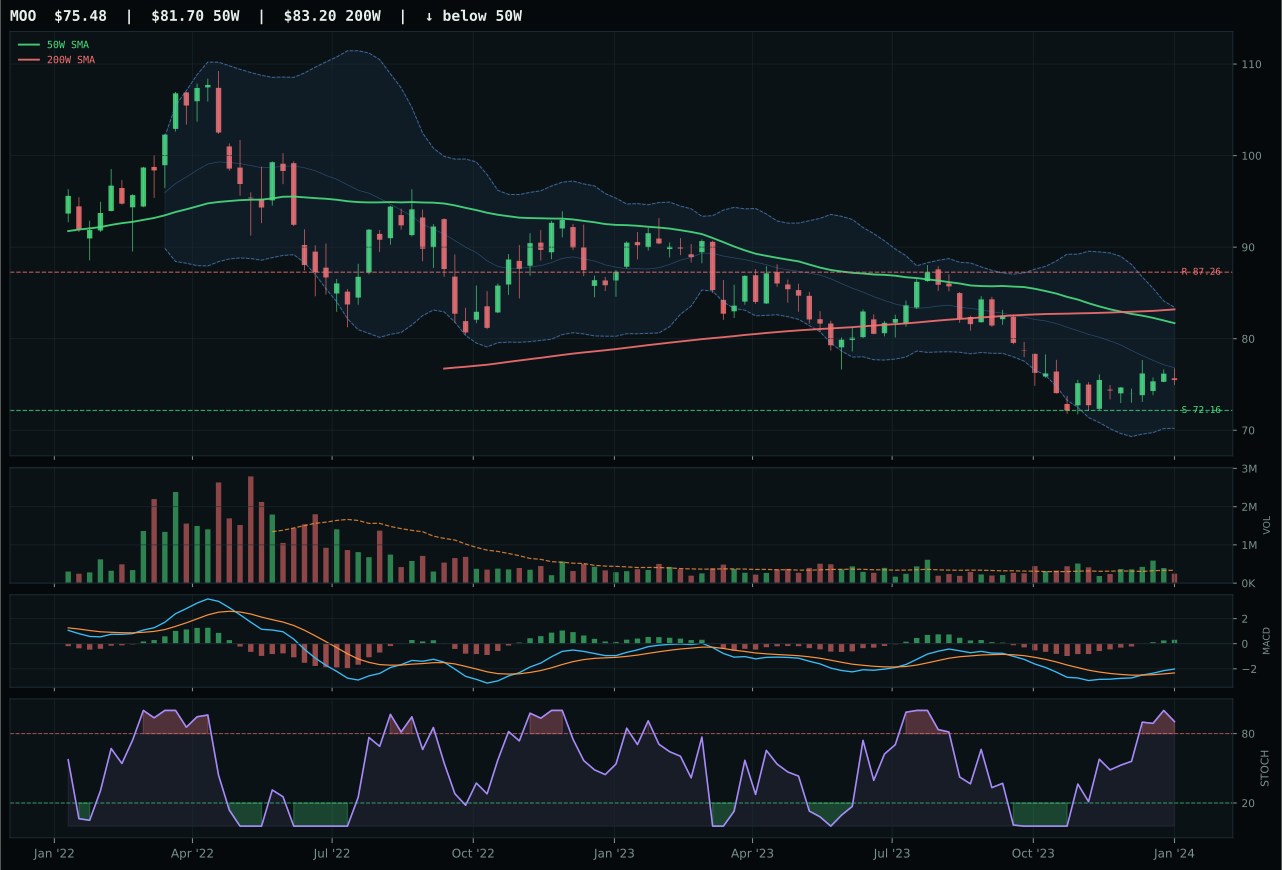
MOO has a pullback into support profile with -10.0% 13-week relative strength versus SPY.
Extension and support failure are the main tactical risks.
Tracked, but not top-2 eligible because: structurally broken.
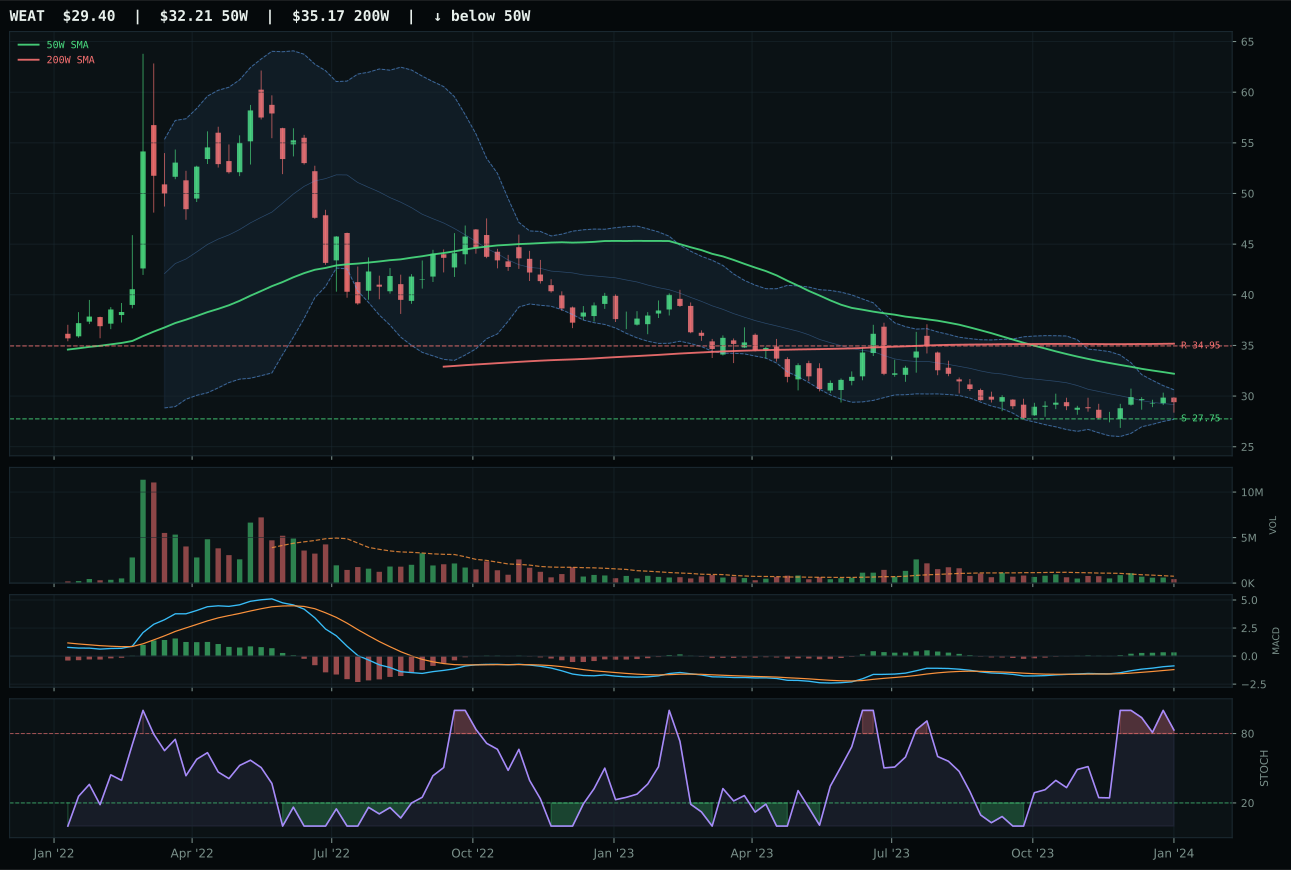
WEAT has a neutral structure profile with -7.4% 13-week relative strength versus SPY.
Extension and support failure are the main tactical risks.
Tracked, but not top-2 eligible because: structurally broken.
MOO is the category winner by default eligibility rather than strength: it wins on risk-reward at 90.0 versus VEGI's 83.0 because its pullback into support near 72.16 creates a tighter stop-loss zone relative to upside resistance, even though its trend metrics are severely compromised at 40.1/100. The 13W return is negative at -1.0%, RS versus SPY is a brutal -10.0%, and MACD is only marginally improving from a bearish stance. What saves MOO from being eliminated entirely is that it is pulling into defined support with favorable geometry: 4.6% downside risk against 13.5% upside, a ratio that approaches +3.0 and suggests the chart has priced in most of the pain. VEGI's superior trend score of 43 and cleaner structure matter less when the momentum confirmation score of 39.7 reveals almost no conviction behind the pullback. The category itself is broken, but MOO represents the least broken expression of agriculture exposure.
Agriculture & Livestock scored 0.0 and receives 5% allocation as an explicit exception—a technical position held despite macro exclusion. The category macro fit bottoms at 32.0, driven by disinflation pressure penalizing commodity-linked exposure by -8 points and liquidity stress by -4 more. No category descriptor favors agriculture; all active signals work against equities with leverage to input costs and export competition. Yet MOO's risk-reward setup at 90.0 and pullback structure into defined support merit a tactical 5% sleeve, treating the position as a reversion vehicle if support holds rather than a conviction macro bet. The 0.0 category score reflects the allocation system's judgment that agriculture ranks 10th among 10 categories on macro/narrative grounds but retains a defined technical edge in the near term. Liquidate this position immediately if MOO closes below 72.16; hold if support contains the test and MACD begins rising into higher timeframes.
Industrial Metals — COPX
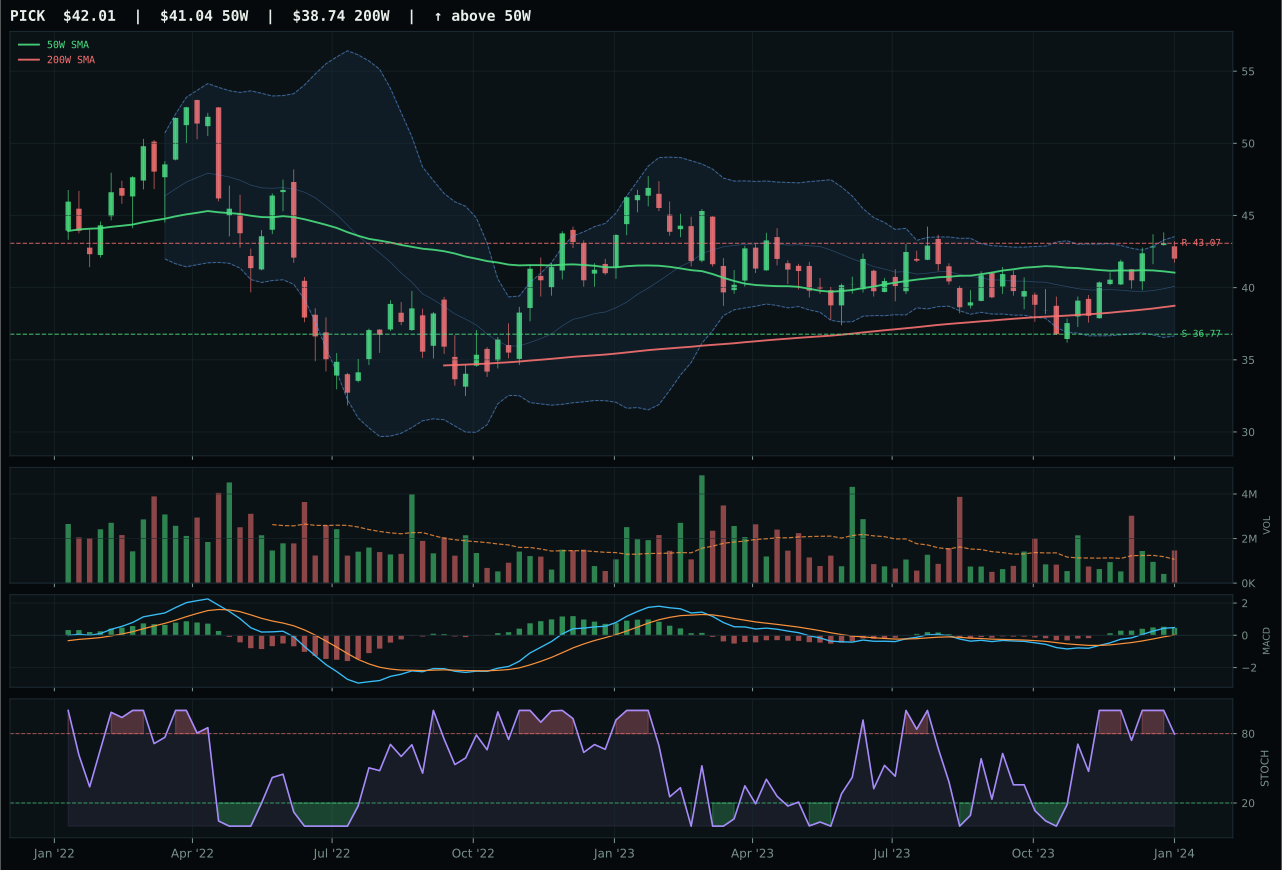
PICK has a compression near 50W profile with -0.7% 13-week relative strength versus SPY.
A failed hold above support would weaken the setup.
Actionable but governed by invalidation levels.
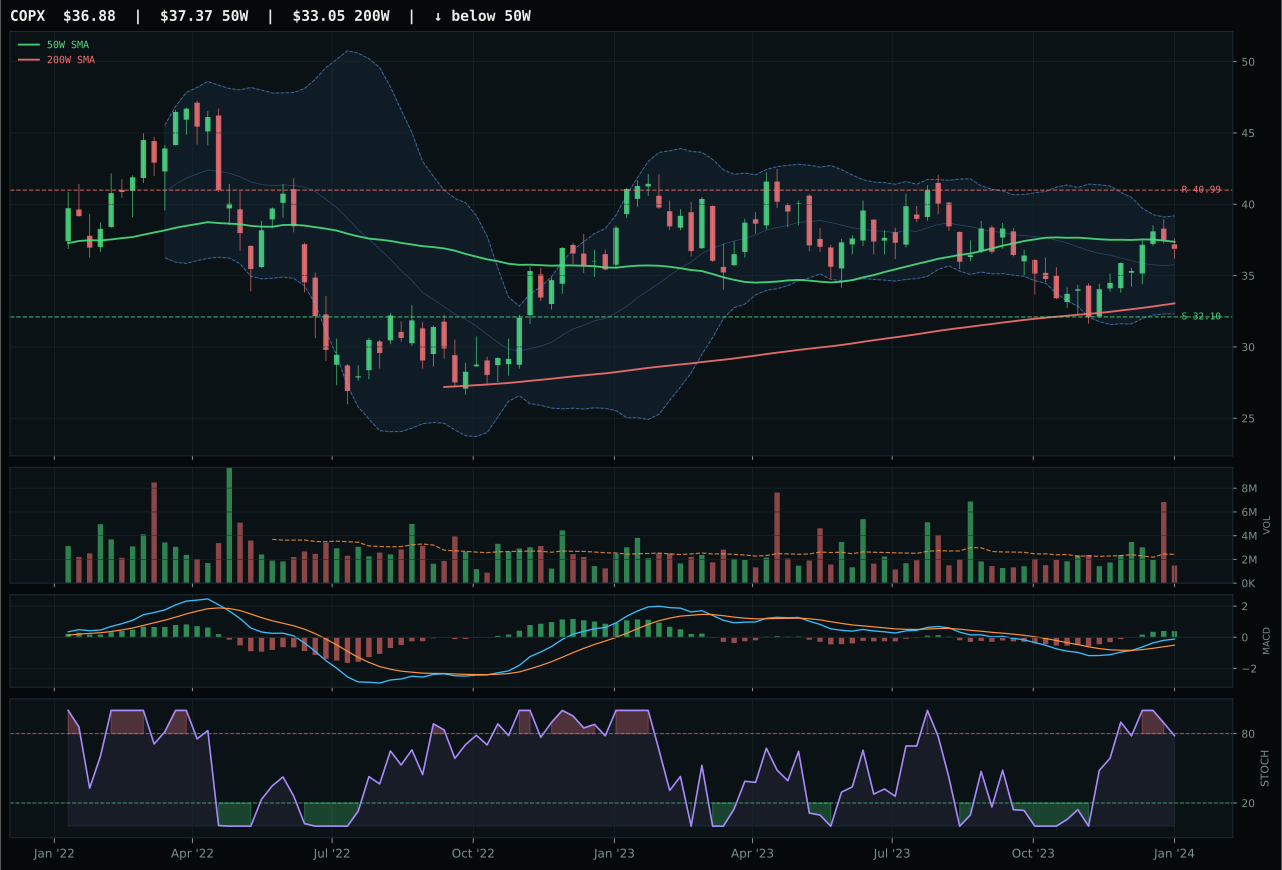
COPX has a compression near 50W profile with -4.0% 13-week relative strength versus SPY.
A failed hold above support would weaken the setup.
Actionable but governed by invalidation levels.
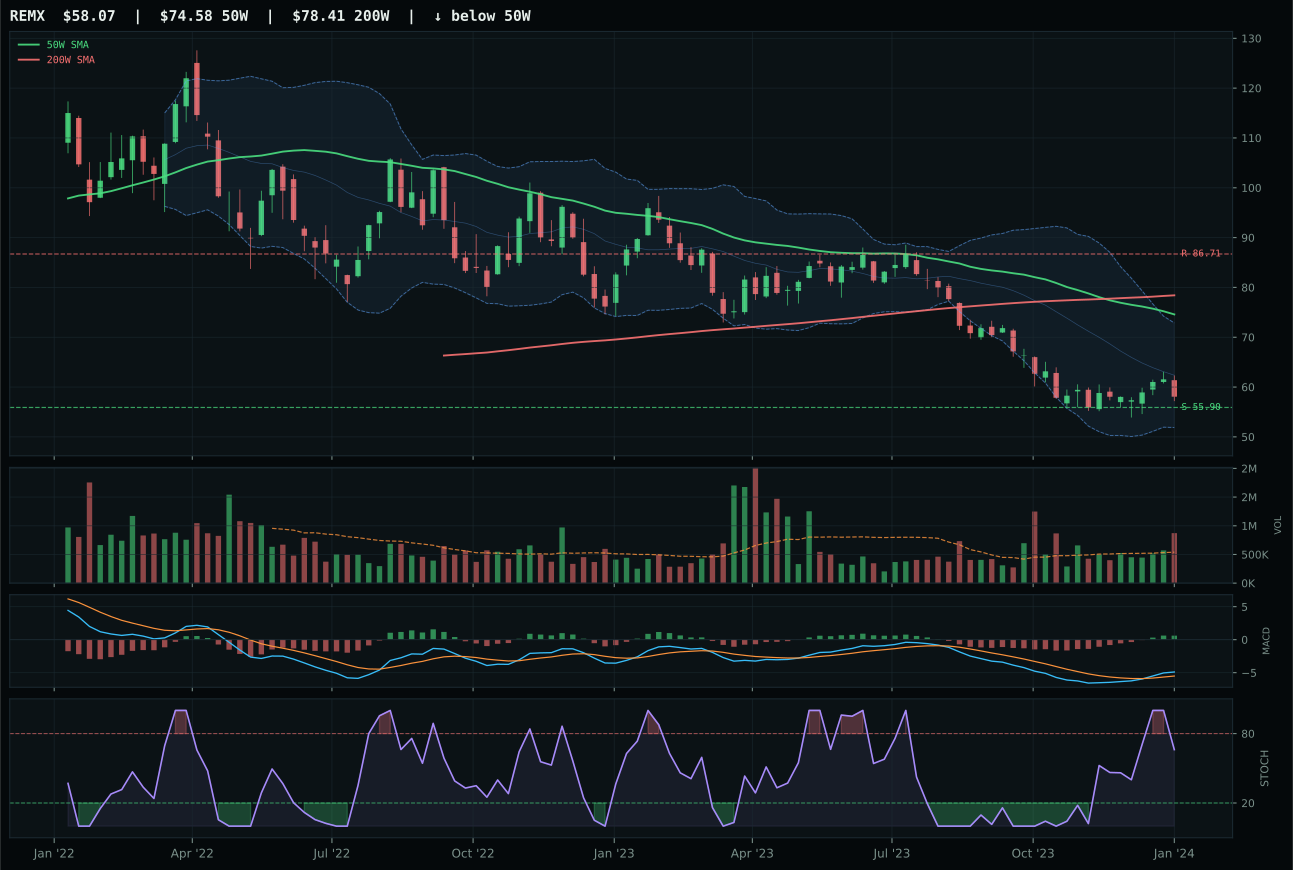
REMX has a pullback into support profile with -16.3% 13-week relative strength versus SPY.
Extension and support failure are the main tactical risks.
Tracked, but not top-2 eligible because: structurally broken.
COPX wins by default over a weaker runner-up, not by strength, because its 100.0 timing score is the category's only clean entry point even though its trend metrics are subdued at 69.0. Price sits at the 50W level (-1.3% distance), which means the technical setup is neither extended nor broken; MACD is improving, stochastic RSI is neutral, and Fibonacci geometry places the action at the 50 level—a perfect decision zone. PICK has superior technical evidence at 91.0/100 and carries above-average volume confirmation at 1.36x, but its risk-reward profile of 56.1 is significantly worse: it offers only 10.0% upside against 14.9% downside, which is a risk-asymmetric setup in the wrong direction. PICK's 13W return is better at 8.2%, but that trailing edge advantage does not compensate for the fact that COPX offers the allocator a tighter, cleaner invalidation framework. In a weak category, the name with the tightest stop matters more than the name with the best past returns.
Industrial Metals scored 19.2 and carries 0% allocation, ranking ninth or 10th among the category cohort and excluded entirely this week. Category macro fit stands at 35.0—a level even lower than Agriculture—with liquidity stress and credit stress combining for -15 points and no offsetting positive descriptors. Disinflation actually hurts industrial metals by reducing industrial production expectations, and the TrendBTC macro regime provides no relief. COPX's timing score of 100 and defined support level near 32.10 suggest the chart is technically ready to work, but without macro sponsorship or peer strength (category-relative strength at zero), this category lacks the allocation framework to justify exposure. If credit stress descriptors flip to false or if disinflation fears ease, COPX would immediately become a candidate for reactivation, but current macro conditions and the portfolio's already-full allocation to precious metals mean industrial metals must remain on the sideline. Revisit this category after the next macro regime shift.
Traditional Energy — FCG
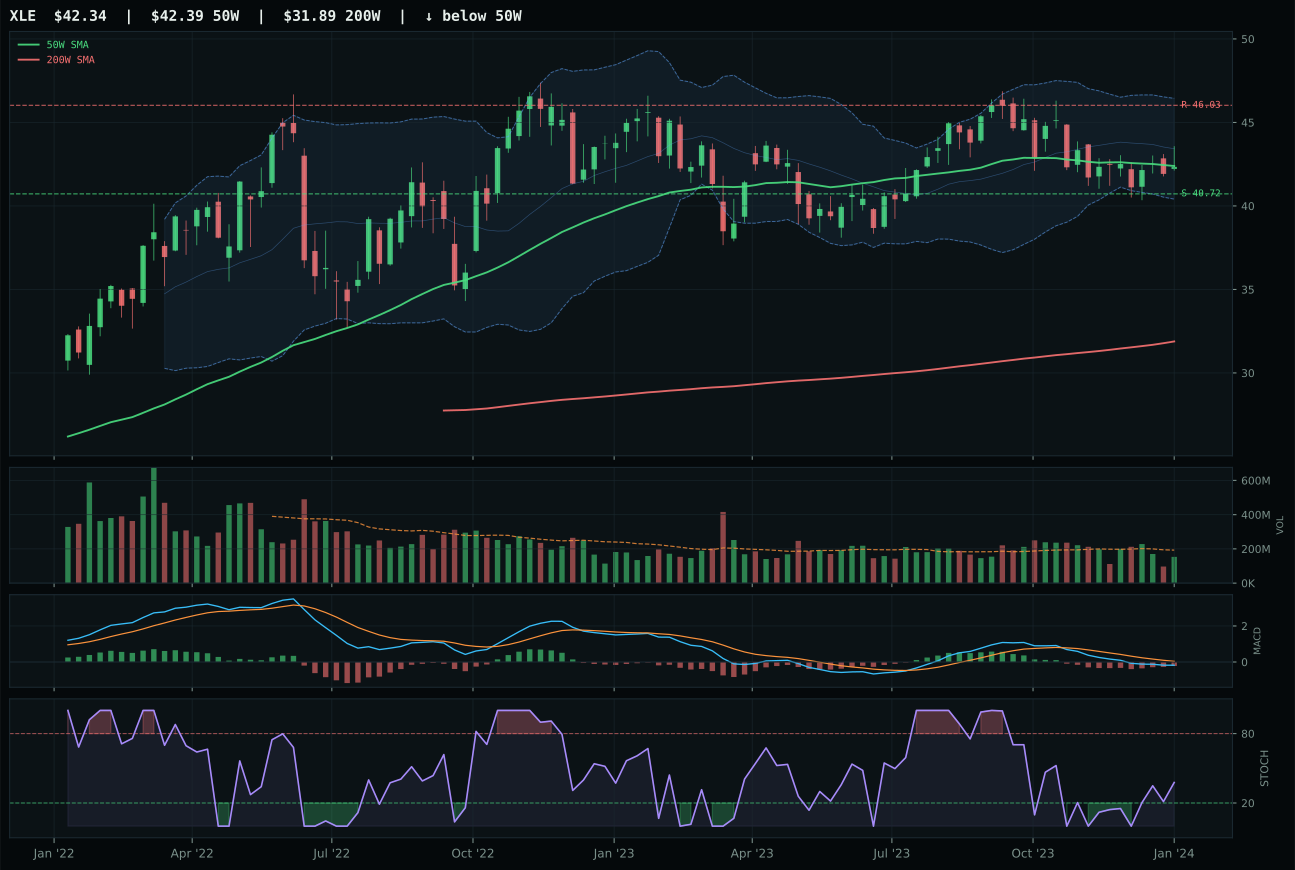
XLE has a pullback into support profile with -10.2% 13-week relative strength versus SPY.
A failed hold above support would weaken the setup.
Actionable but governed by invalidation levels.
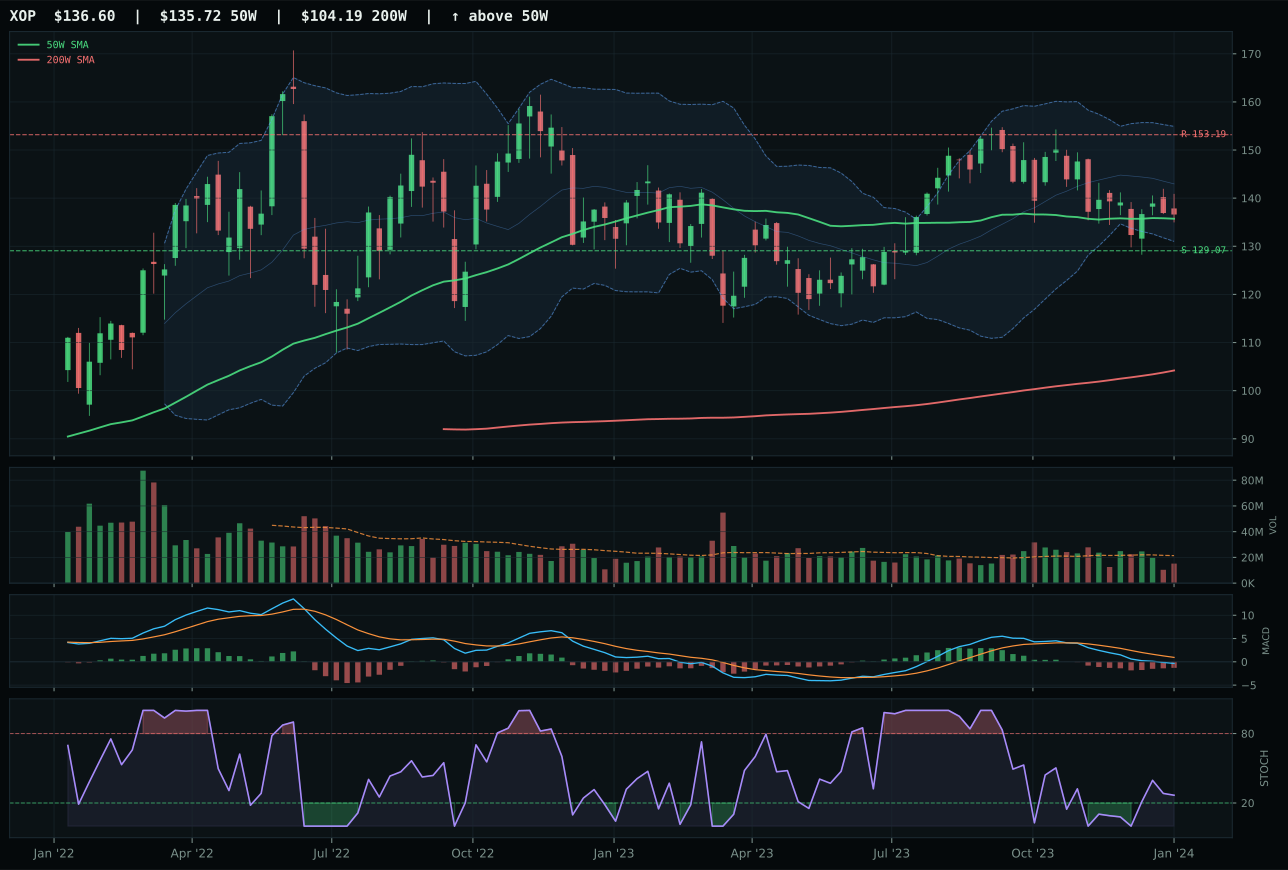
XOP has a compression near 50W profile with -11.0% 13-week relative strength versus SPY.
A failed hold above support would weaken the setup.
Actionable but governed by invalidation levels.
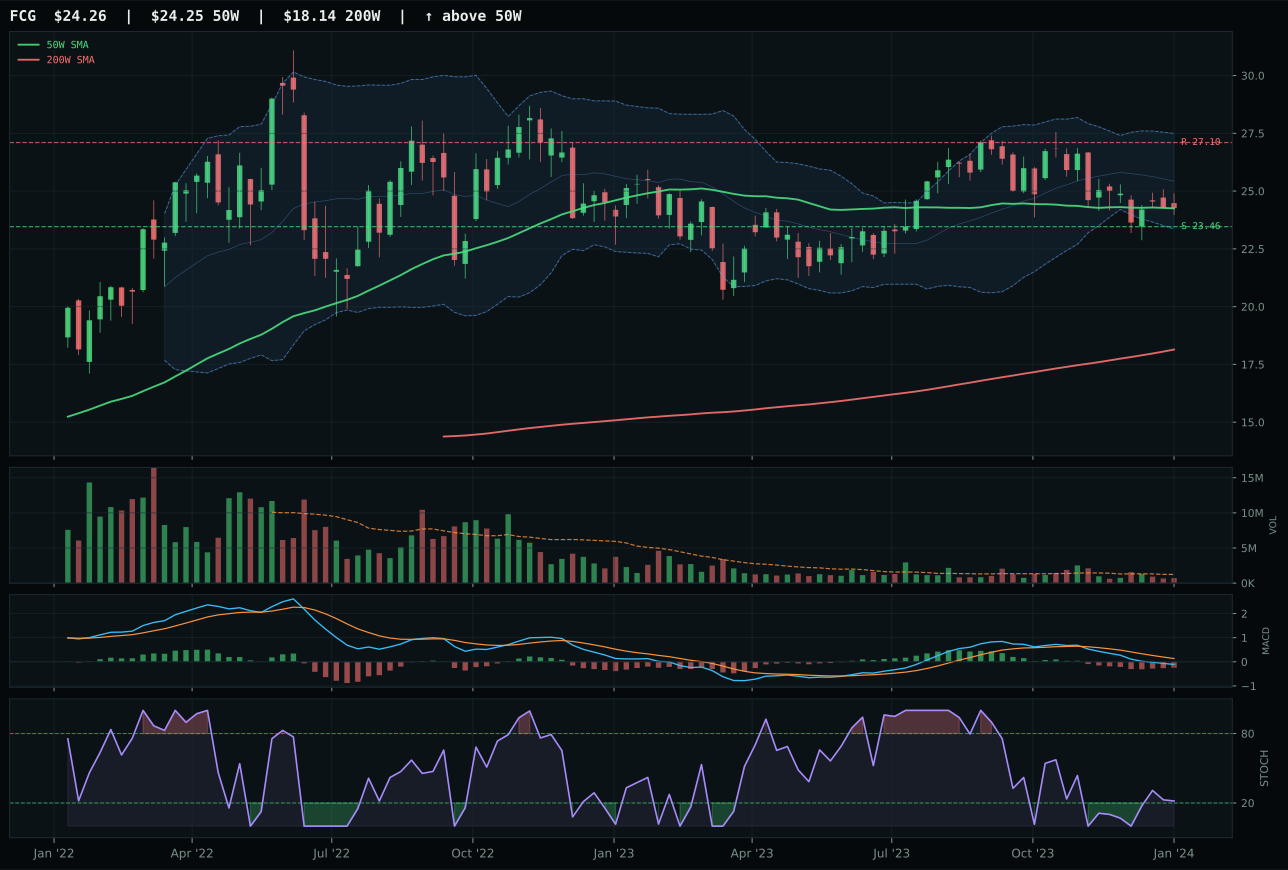
FCG has a pullback into support profile with -11.3% 13-week relative strength versus SPY.
A failed hold above support would weaken the setup.
Actionable but governed by invalidation levels.
FCG wins a category that is fighting disinflation headwinds by posting a perfect 100.0 timing score, which alone justifies its selection over XLE despite XLE's superior risk-reward profile of 89.3 versus 98.0. FCG sits at the 50W level (0.0% distance), MACD is bearish but improving, stochastic RSI is rising through the mid-zone at 0.22, and Fibonacci positioning at the 50 level creates the tightest entry geometry available. That FCG's 13W return is -2.4% and momentum confirmation is weak at 29.7 underlines the category's struggle, but the timing alignment is so clean that it offers the allocator an objective waiting point rather than a forced chase. XLE and XOP both carry better negative-13W returns (-1.2% and -2.0%), but neither offers the crystalline support-level entry that FCG provides. In an energy category getting hammered by disinflation pressure (-10), the name with the tightest invalidation level and the clearest retest geometry wins by technical purity alone.
Traditional Energy scored 10.5 and carries 0% allocation, explicitly excluded from the portfolio despite holding the category-representative position. The 16.0 macro fit score is the lowest or tied-lowest among all 10 categories: disinflation pressure penalizes energy by -10 points, credit stress by -7, and liquidity stress by -7, with zero offsetting positive descriptors. The TrendBTC regime has no energy bid, and the macro reasoning layer correctly judges that even a perfect technical setup in energy would lose to all other categories competing for scarce capital. FCG's 100 timing score (price at the 50W in a decision zone) suggests a technical setup worth monitoring, but that setup exists in a category with severely impaired macro fit. Allocate zero capital to traditional energy until disinflation descriptor flips false or until credit stress resolves. If those conditions materialize in the next 2-3 weeks, energy would rapidly become a top-tier candidate given its extreme valuation discount and technical reset.