
2023-12-29
Informational purposes only. The content in this report, including allocations, analysis, and commentary, is provided solely for informational and educational purposes. It does not constitute financial advice, investment advice, trading advice, or any other type of advice. Past performance does not guarantee future results. Always conduct your own research and consult a qualified financial professional before making investment decisions.
Weekly Allocation
| Ticker | Category | Weight | Role |
|---|---|---|---|
| FBTC | 50% | Overlay | |
| SMH | AI | 10% | Top-2 (10%) |
| CIBR | Technology | 10% | Top-2 (10%) |
| GLD | Precious Metals | 5% | Tier-2 (5%) |
| INDA | Emerging Markets | 5% | Tier-2 (5%) |
| ITA | Defense & Aerospace | 5% | Tier-2 (5%) |
| PAVE | Utilities & Infrastructure | 5% | Tier-2 (5%) |
| COPX | Industrial Metals | 5% | Tier-2 (5%) |
| URNM | Nuclear Energy | 5% | Tier-2 (5%) |
Trade Instructions — Monday Open
Sell the tranche from 2023-12-01 (completing its 4-week hold). Buy the new tranche. Instructions show net portfolio changes — same-asset positions cancel, weight changes show the delta.
| Action | Ticker | Instruction |
|---|---|---|
| SELL | GLD | Sell 25% of GLD position (reduce 5.00% → 3.75%) |
| SELL | PAVE | Sell 20% of PAVE position (reduce 6.25% → 5.00%) |
| SELL | IGV | Sell entire IGV position (1.25% of portfolio) |
| SELL | URA | Sell 25% of URA position (reduce 5.00% → 3.75%) |
| SELL | ILF | Sell 50% of ILF position (reduce 2.50% → 1.25%) |
| SELL | XAR | Sell 25% of XAR position (reduce 5.00% → 3.75%) |
| SELL | BOTZ | Sell 17% of BOTZ position (reduce 7.50% → 6.25%) |
| SELL | PICK | Sell entire PICK position (1.25% of portfolio) |
| BUY | CIBR | Buy CIBR — 25.00% of freed cash (adds 2.50% to portfolio) |
| BUY | INDA | Buy INDA — 12.50% of freed cash (adds 1.25% to portfolio) |
| BUY | ITA | Buy ITA — 12.50% of freed cash (adds 1.25% to portfolio) |
| BUY | COPX | Buy COPX — 12.50% of freed cash (adds 1.25% to portfolio) |
| BUY | SMH | Buy SMH — 25.00% of freed cash (adds 2.50% to portfolio) |
| BUY | URNM | Buy URNM — 12.50% of freed cash (adds 1.25% to portfolio) |
Current Portfolio After Trade
Combined holdings across all 4 active tranches. Each tranche is 25% of the portfolio.
| Ticker | % of Portfolio | Weight Bar |
|---|---|---|
| FBTC | 50.00% | |
| CIBR | 10.00% | |
| BOTZ | 6.25% | |
| PAVE | 5.00% | |
| GLD | 3.75% | |
| URA | 3.75% | |
| XAR | 3.75% | |
| INDA | 3.75% | |
| COPX | 3.75% | |
| ITA | 2.50% | |
| SMH | 2.50% | |
| ILF | 1.25% | |
| MOO | 1.25% | |
| GDX | 1.25% | |
| URNM | 1.25% |
Macro Regime — Disinflation
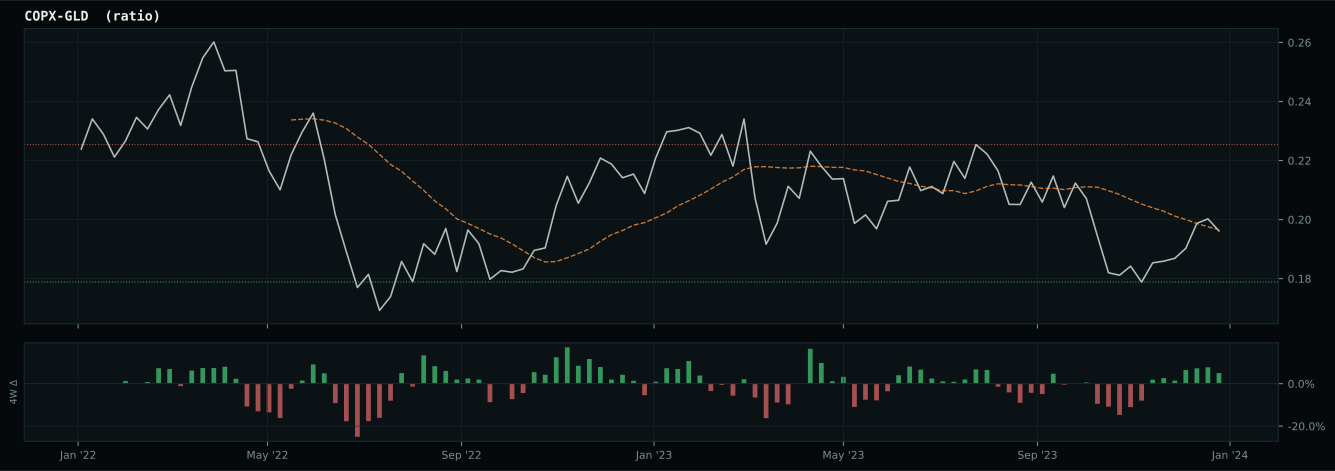
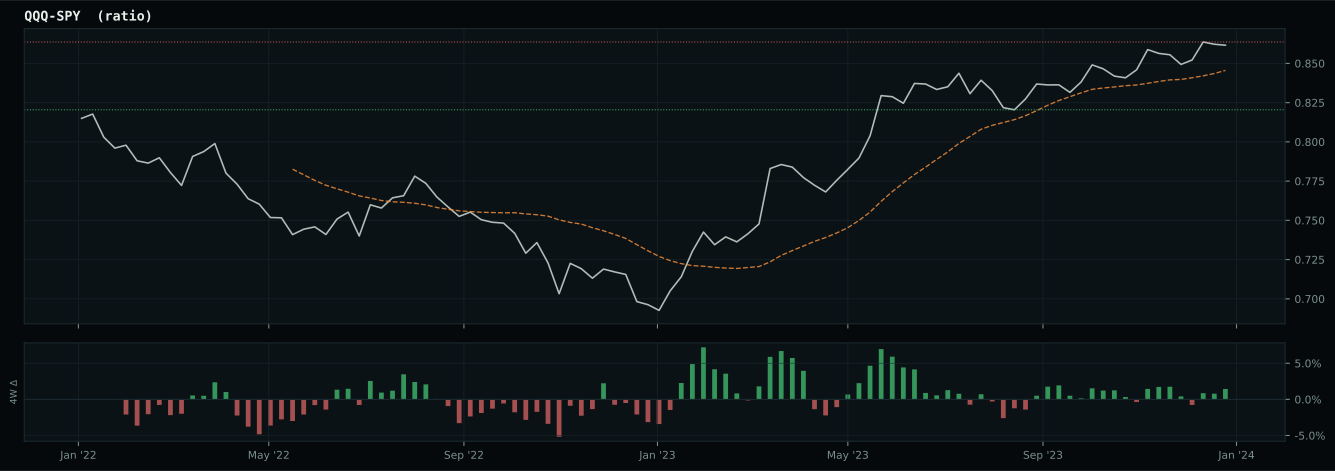
Macro Evidence Charts
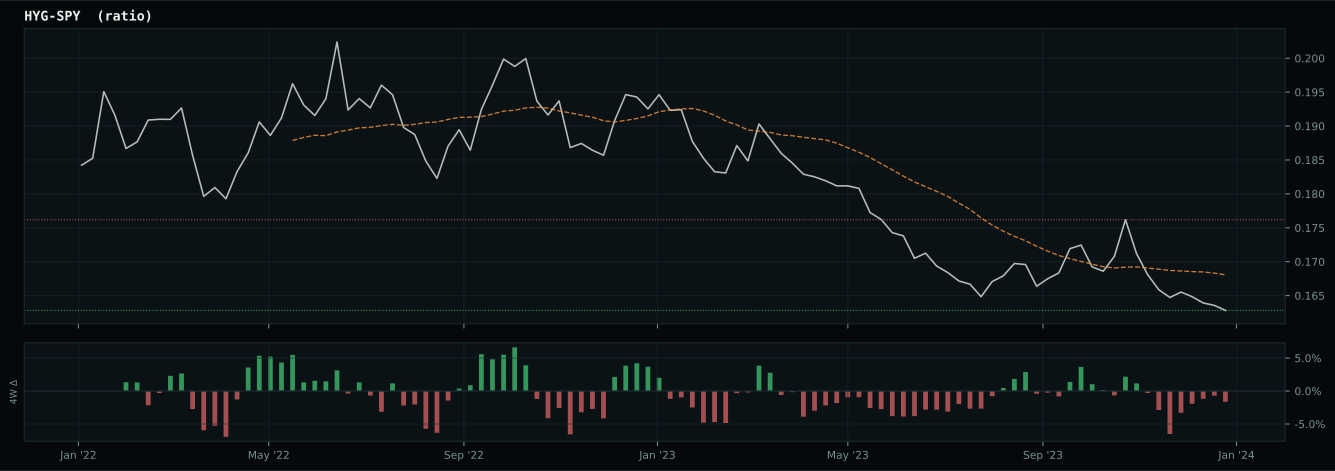
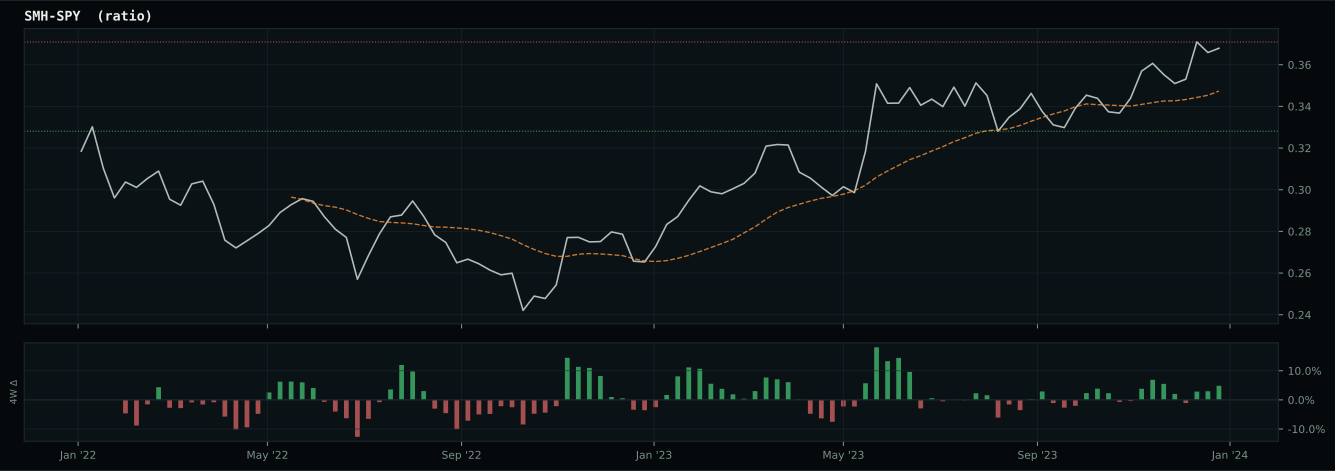
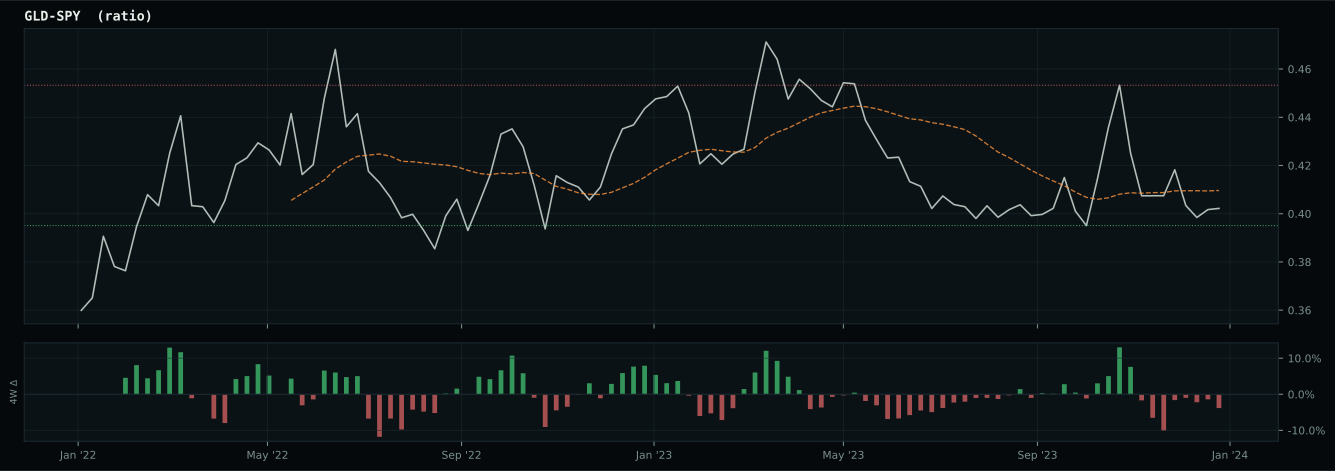
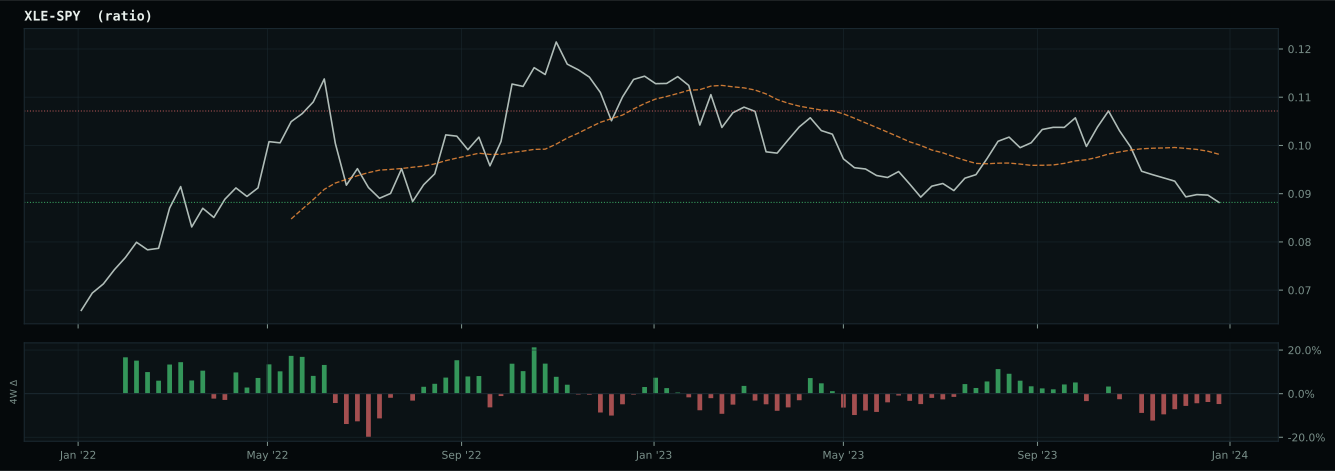
Market-implied signals behind the macro regime scores. Each ratio compares two assets; the direction and slope of the ratio is what the macro engine reads.
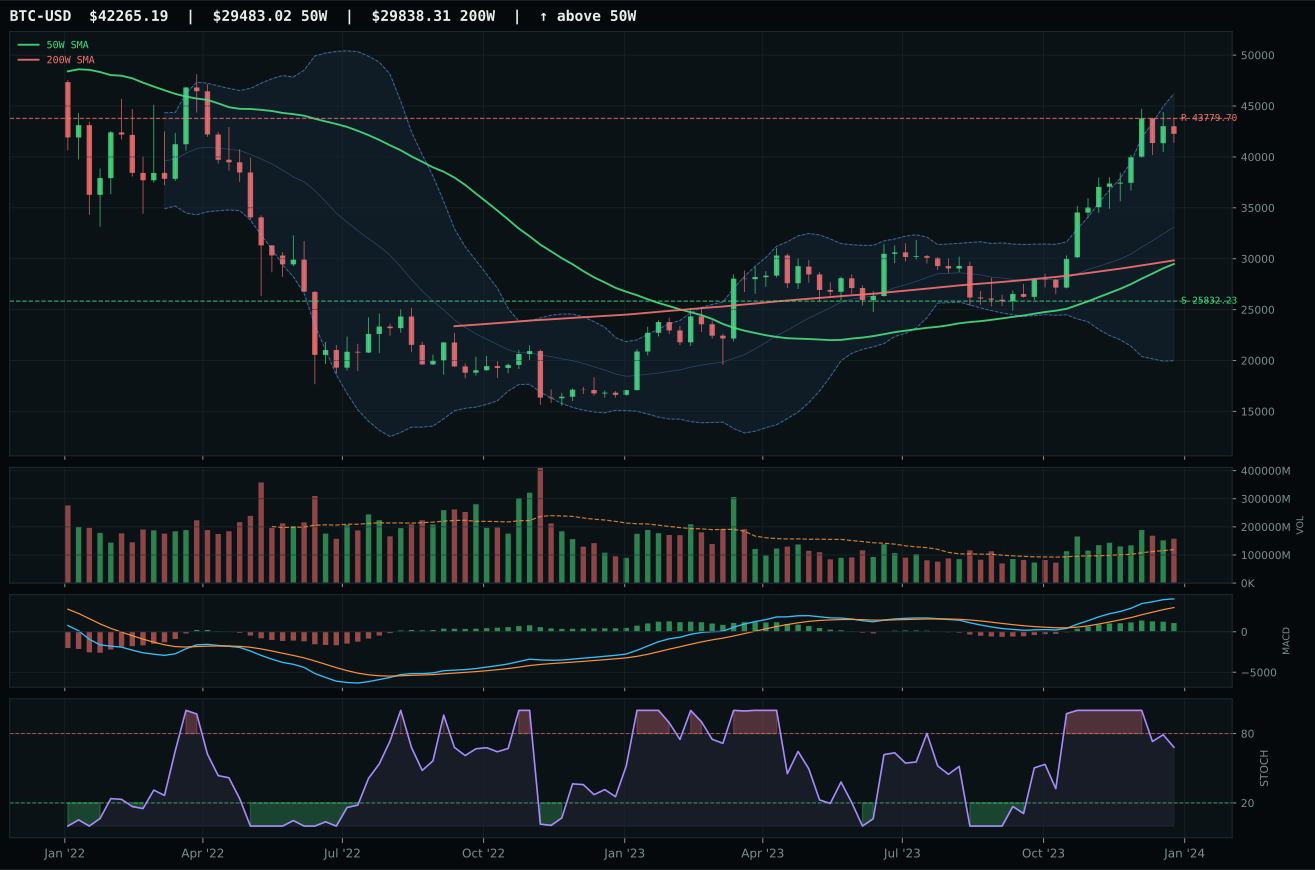
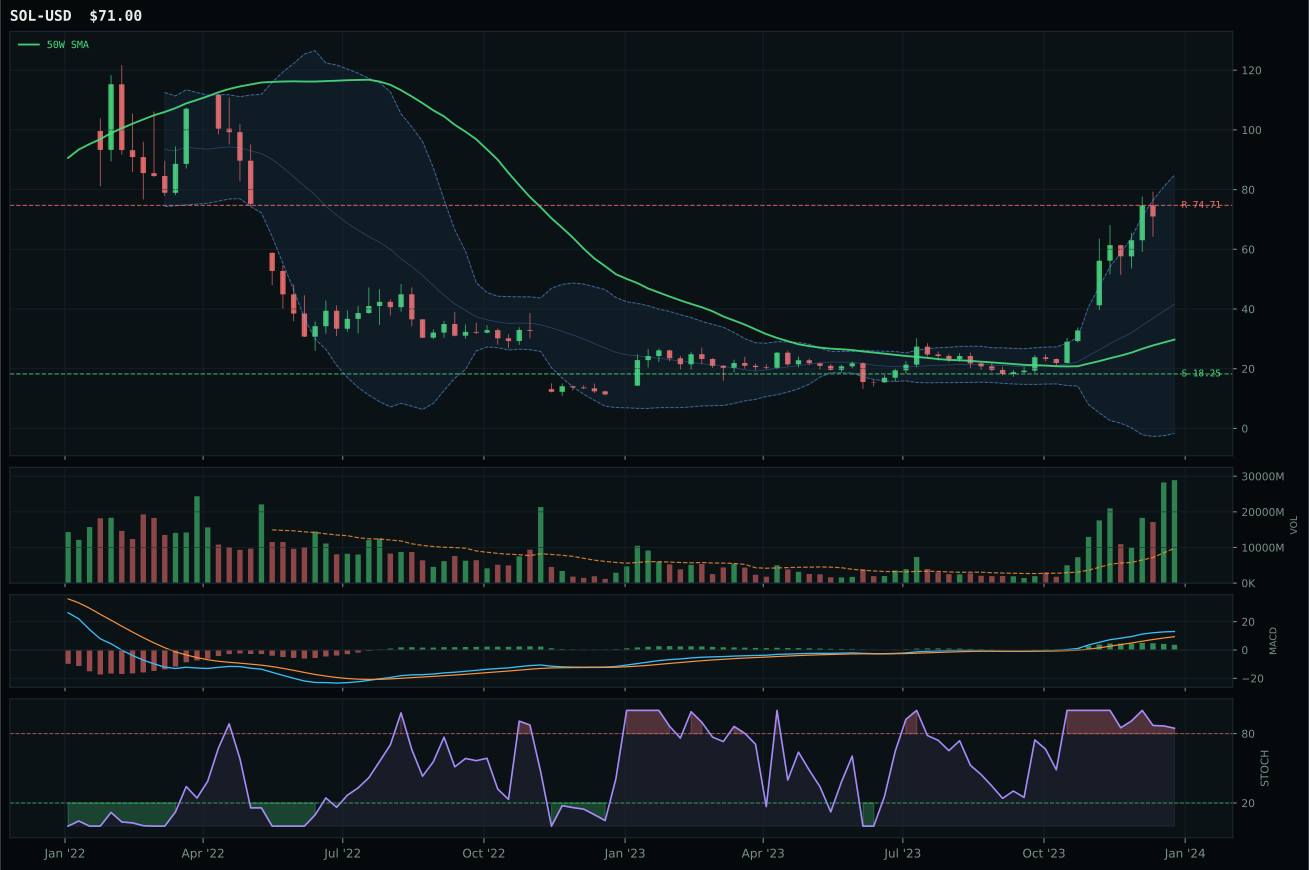
Crypto Regime — TrendBTC
post-touch structure is too wide to count as a range; max/min close ratio is 2.69
TrendBTC confirmed: 2 consecutive closes above rising/flat 50W SMA
one or more available conditions failed
Category Rankings
| Rank | Category | Winner | Score | Alloc | 4W Ret | Peers (4W) |
|---|---|---|---|---|---|---|
| 1 | AI | SMH | 64.2 | 20% | +9.50% | AIQ +3.1% · BOTZ +3.0% |
| 2 | Technology | CIBR | 63.0 | 20% | +6.55% | IGV +5.4% · XLK +6.4% |
| 3 | Precious Metals | GLD | 62.2 | 10% | -1.63% | GDX -8.5% · SLV -3.9% |
| 4 | Emerging Markets | INDA | 54.8 | 10% | +2.38% | ILF -2.2% · IEMG -2.0% |
| 5 | Defense & Aerospace | ITA | 53.9 | 10% | -2.73% | XAR -3.5% · ROKT -4.7% |
| 6 | Utilities & Infrastructure | PAVE | 48.3 | 10% | -0.06% | IGF -2.8% · XLU -2.9% |
| 7 | Industrial Metals | COPX | 42.0 | 10% | -2.12% | PICK -5.7% · REMX -19.8% |
| 8 | Nuclear Energy | URNM | 40.7 | 10% | +9.31% | URA +7.8% · NLR +3.6% |
| 9 | Agriculture & Livestock | MOO | 12.6 | 0% | -5.29% | VEGI -4.9% · WEAT -5.4% |
| 10 | Traditional Energy | FCG | 4.3 | 0% | -3.43% | XLE -0.4% · XOP -3.0% |
AI — SMH
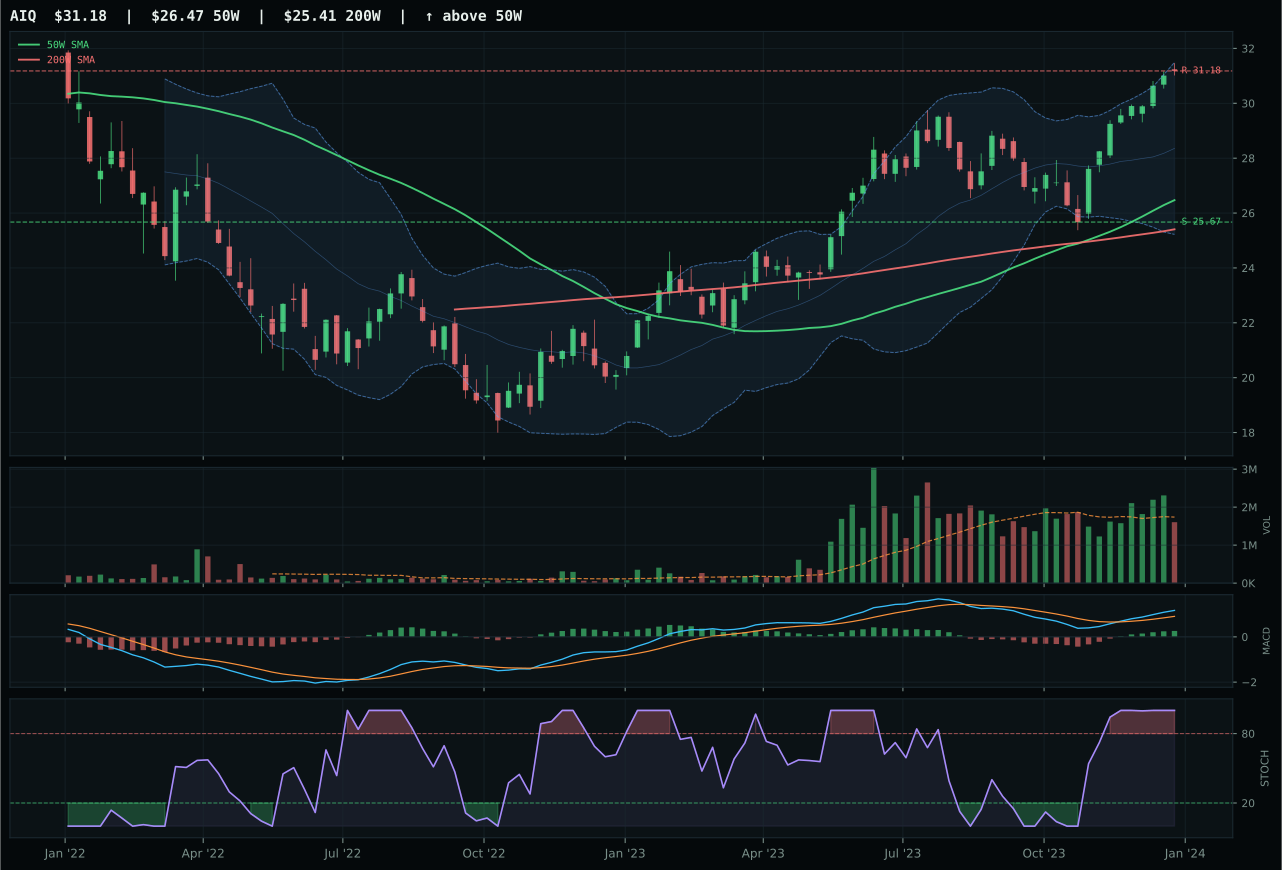
AIQ has a vertical extension profile with 4.7% 13-week relative strength versus SPY.
A failed hold above support would weaken the setup.
Actionable but governed by invalidation levels.
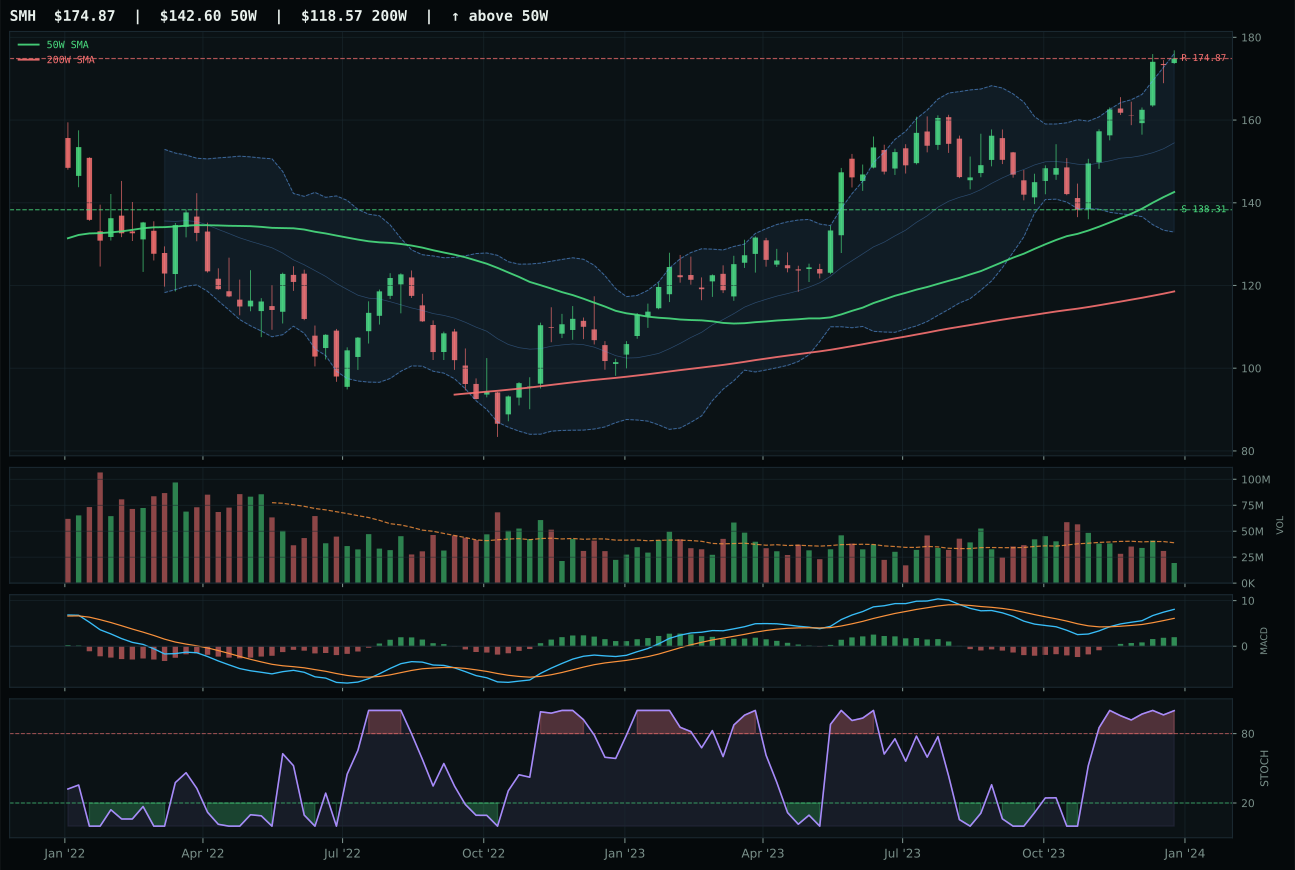
SMH has a vertical extension profile with 9.4% 13-week relative strength versus SPY.
A failed hold above support would weaken the setup.
Actionable but governed by invalidation levels.
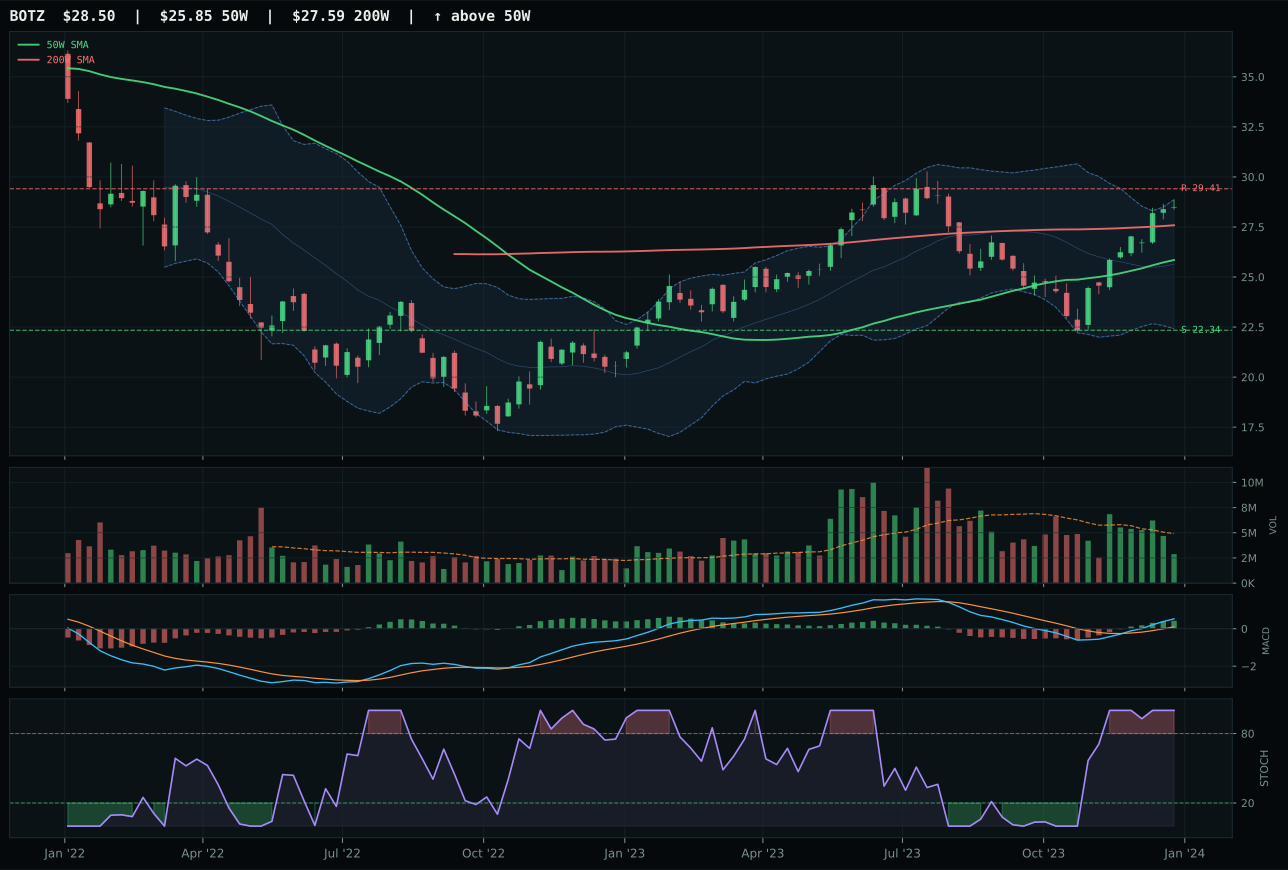
BOTZ has a neutral structure profile with 4.1% 13-week relative strength versus SPY.
A failed hold above support would weaken the setup.
Actionable but governed by invalidation levels.
SMH captured the AI category crown with a pristine 100.0 momentum confirmation score—the only ETF in the portfolio earning a perfect mark on that dimension—driven by a 20.6% thirteen-week return and 4.7% category-relative strength that IGV simply could not match at 0.0%. The semiconductor foundry and AI compute narrative carries 9.4% relative strength to SPY, justifying capital allocation despite a 22.6% extension above the 50W that would normally trigger entry caution; thin participation at 0.50x the twenty-week average, however, confirms this is accumulation rather than retail chase. MACD is bullish and improving, stochastic RSI sits at max overbought, and price targets 174.87 resistance with minimal upside buffer, yet the technical fabric remains intact because the structure score of 71.8/100 reflects compression efficiency that permits further consolidation without invalidating the trend. AIQ's failure to deliver category-relative strength—posting 0.0% versus SMH's 4.7%—explains the 0.9-point score gap despite superior technical evidence; relative momentum separates winners from also-rans when absolute trends align.
AI earned top-2 status at 10% allocation with a 64.2 final score that represents the portfolio's highest macro conviction outside of crypto holdings. The category-level macro fit of 59.0/100 draws heavy support from AI growth sponsorship (+14 points), positive risk appetite (+10), and disinflation benignity (+5), while liquidity stress (-12) and credit headwinds (-8) create the kind of structural tension that should make allocators cautious about further concentration. SMH's 20.6% thirteen-week return in a rising-rate regime would have been impossible without extraordinary fundamental tailwinds in semiconductor cycles and capex cycles, meaning this allocation bets on duration relief and continued AI capex acceleration. To justify holding at 10% against further rivals: SMH needs to maintain category-relative strength above 3%, volume must remain above neutral, and MACD should not deteriorate despite extended price action. The risk is that disinflation accelerates, credit stress worsens, or liquidity conditions tighten, all of which would flip the macro backdrop and force a swift reallocation.
Technology — CIBR
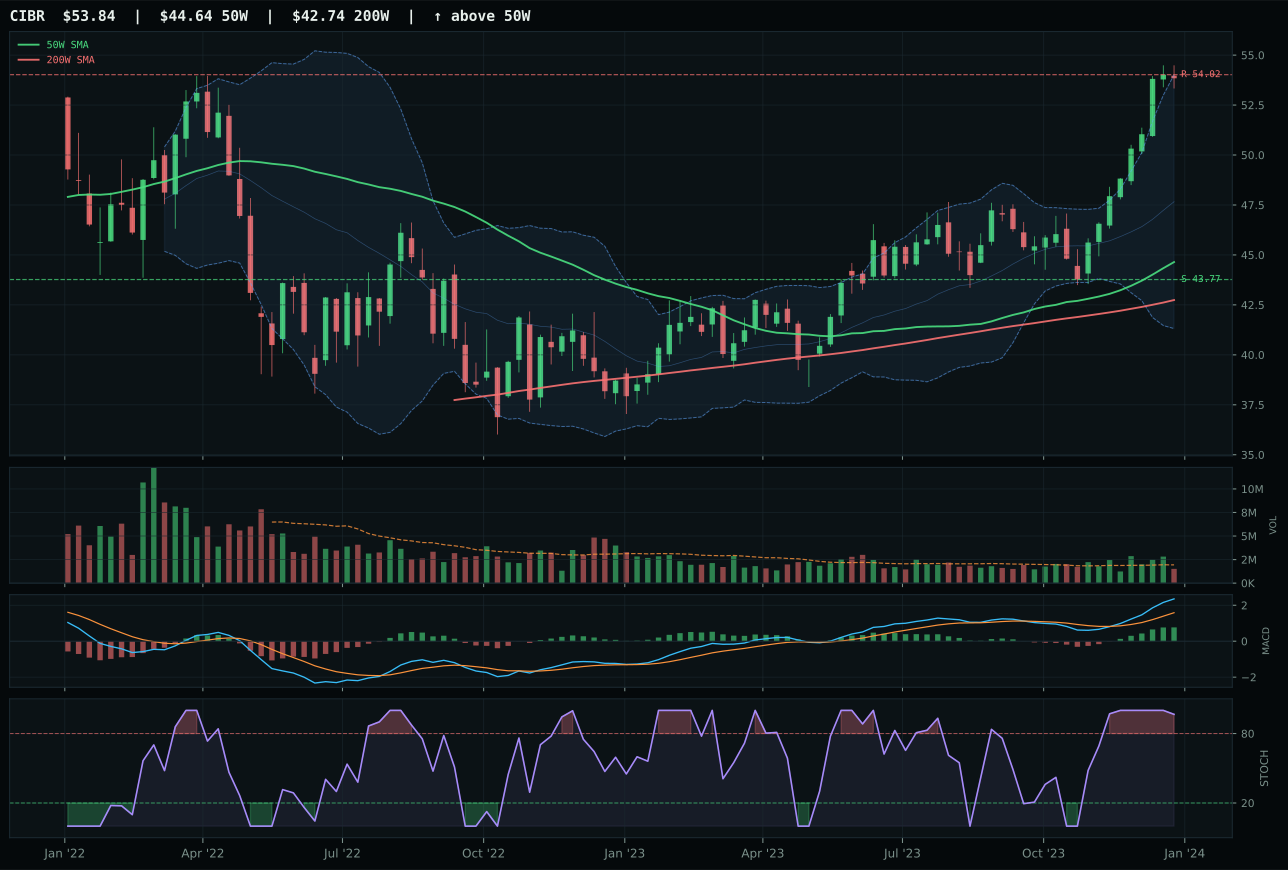
CIBR has a vertical extension profile with 7.3% 13-week relative strength versus SPY.
A failed hold above support would weaken the setup.
Actionable but governed by invalidation levels.
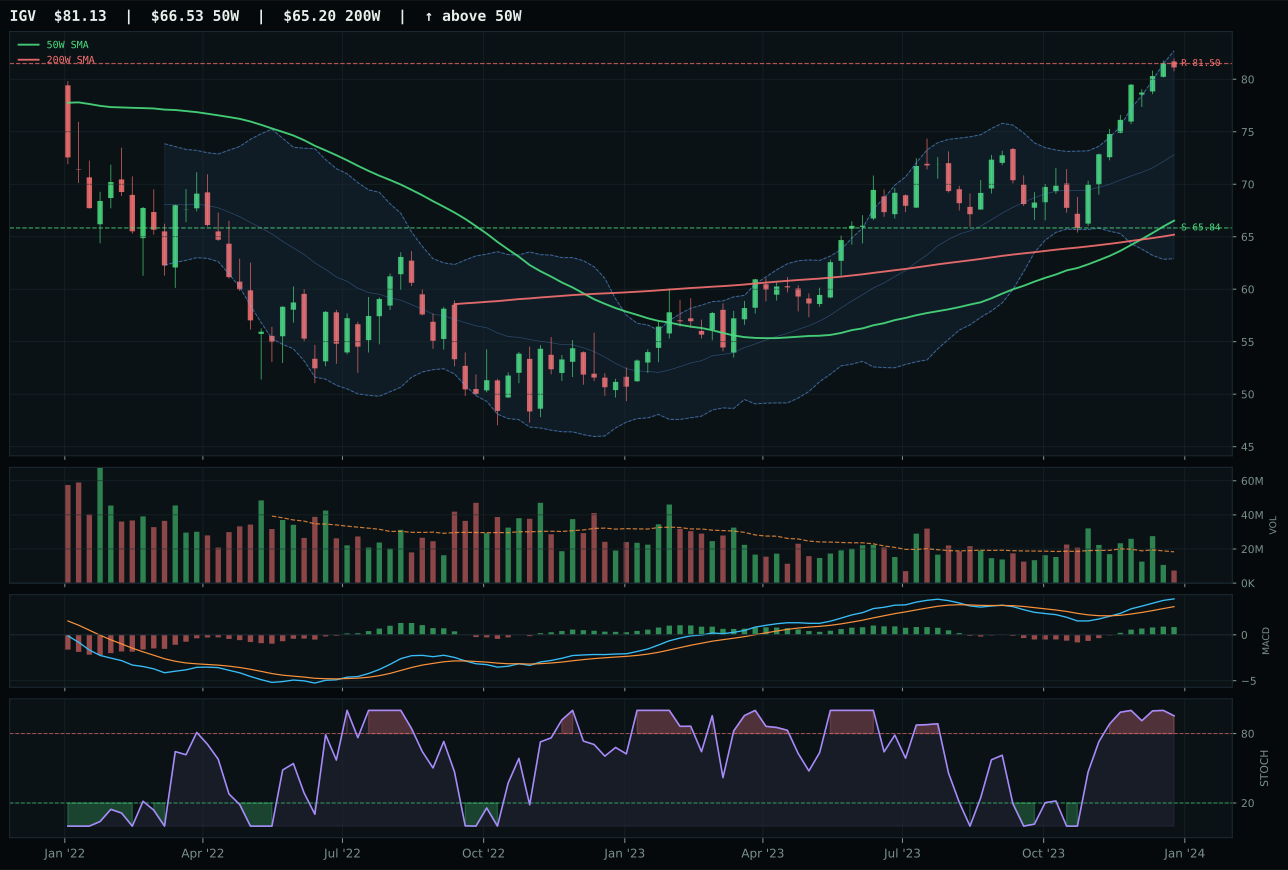
IGV has a vertical extension profile with 7.7% 13-week relative strength versus SPY.
A failed hold above support would weaken the setup.
Actionable but governed by invalidation levels.
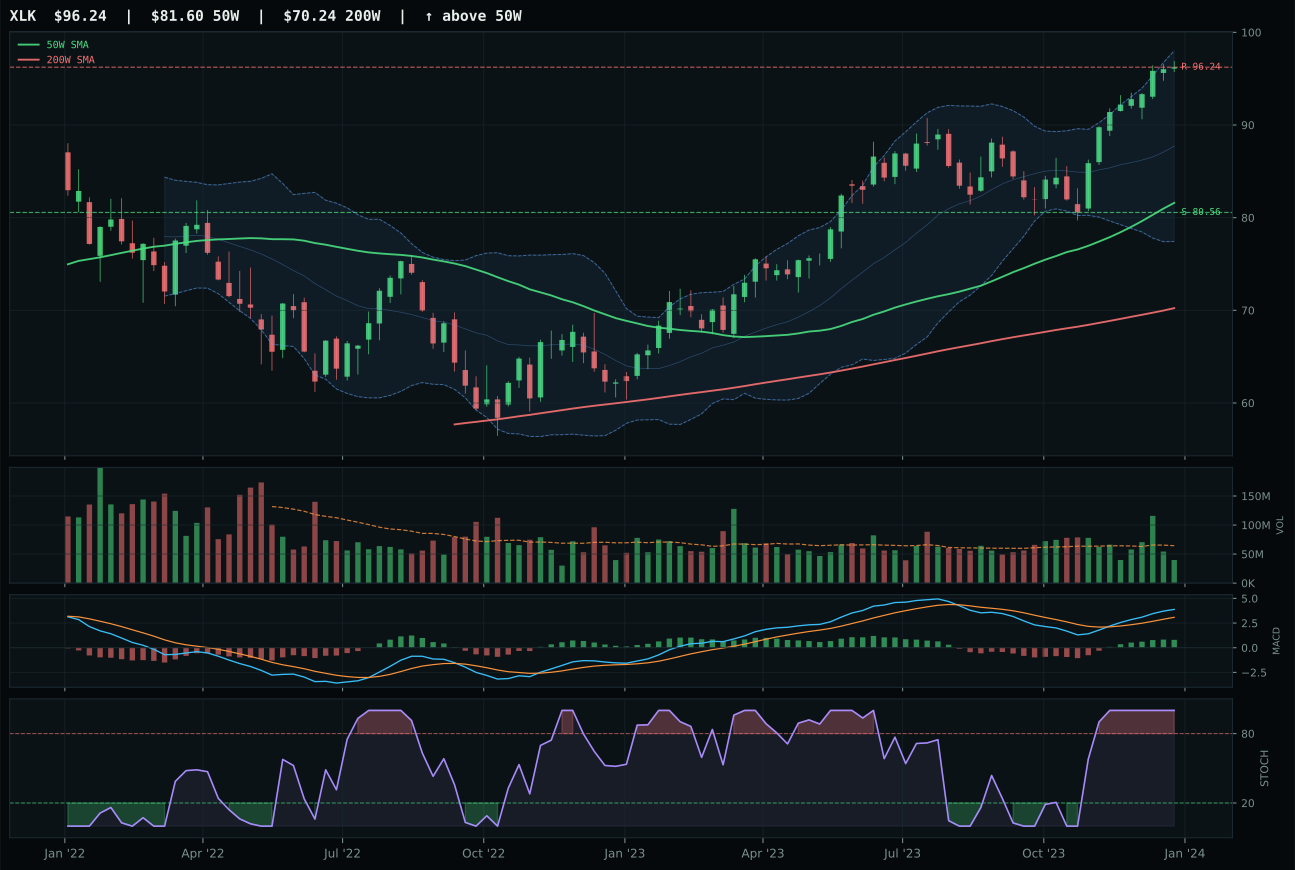
XLK has a vertical extension profile with 6.2% 13-week relative strength versus SPY.
A failed hold above support would weaken the setup.
Actionable but governed by invalidation levels.
CIBR seized the category lead by pairing a perfect trend score with the cleanest structure among its peers—structure 80.0 versus IGV's 75.4—while maintaining neutral volume participation at a critical moment when oversaturation is punishing late entries. The 7.3% relative strength against SPY outpaced IGV's 7.7% in absolute terms, but CIBR's zero category-relative strength kept it tethered to median performance while IGV drifted into thin participation, a subtle but decisive breakdown in sponsorship. Price sits 20.6% extended above the 50W with MACD bullish and improving and stochastic RSI rolling over from overbought—the textbook setup for a momentum leader whose risk/reward has tightened to -0.3% upside but retained 23.0% downside cushion. IGV's weaker risk/reward (37.1 versus 43.7) and thinner volume confirmation made it the loser despite superior 13W returns of 18.9%, proving that trajectory alone does not overcome structural deterioration.
Technology earned its position as a top-2 category at 10% allocation by posting a 63.0 final score that reflects balanced technical strength across a volatile macro landscape. The category's macro/narrative fit of 60.0/100 benefits meaningfully from active disinflation pressure (+7 points) and risk appetite staying positive (+9), while liquidity stress (-10) and credit concerns create realistic drag that prevents runaway overweighting. This is not a rate-sensitive defensive haven but rather a growth sleeve anchored by semiconductor and cybersecurity leadership that can operate independent of falling yields—CIBR's 18.5% thirteen-week return and steady MACD improvement suggest buyers are accumulating despite the extension. What would push Technology higher: sustained SPY-relative outperformance beyond 7-8%, volume confirmation stepping above neutral, and MACD maintaining its bullish trajectory through any near-term support test. For now, 10% captures the setup without overcommitting to a richly valued momentum trade.
Precious Metals — GLD
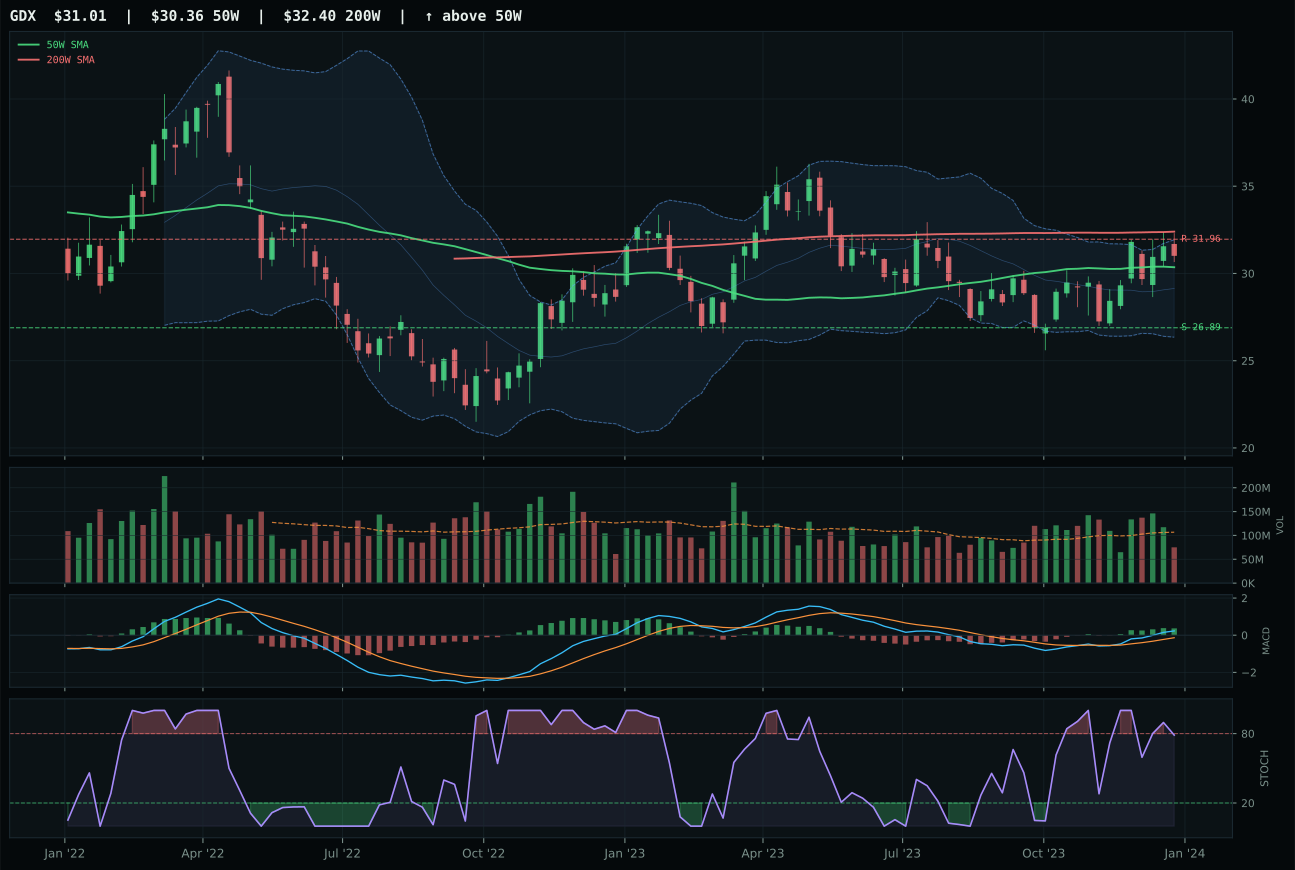
GDX has a compression near 50W profile with 4.0% 13-week relative strength versus SPY.
A failed hold above support would weaken the setup.
Actionable but governed by invalidation levels.
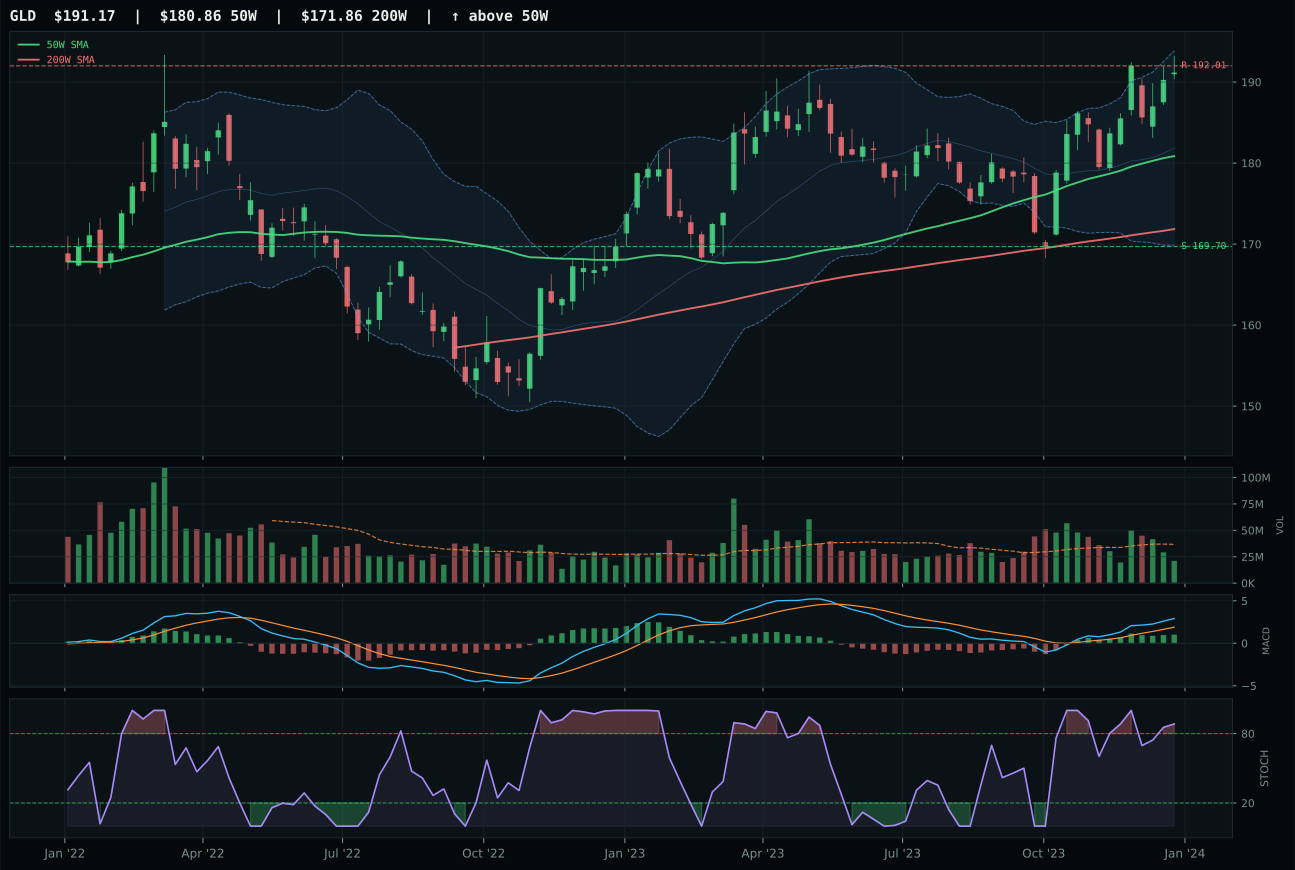
GLD has a neutral structure profile with 0.3% 13-week relative strength versus SPY.
A failed hold above support would weaken the setup.
Actionable but governed by invalidation levels.
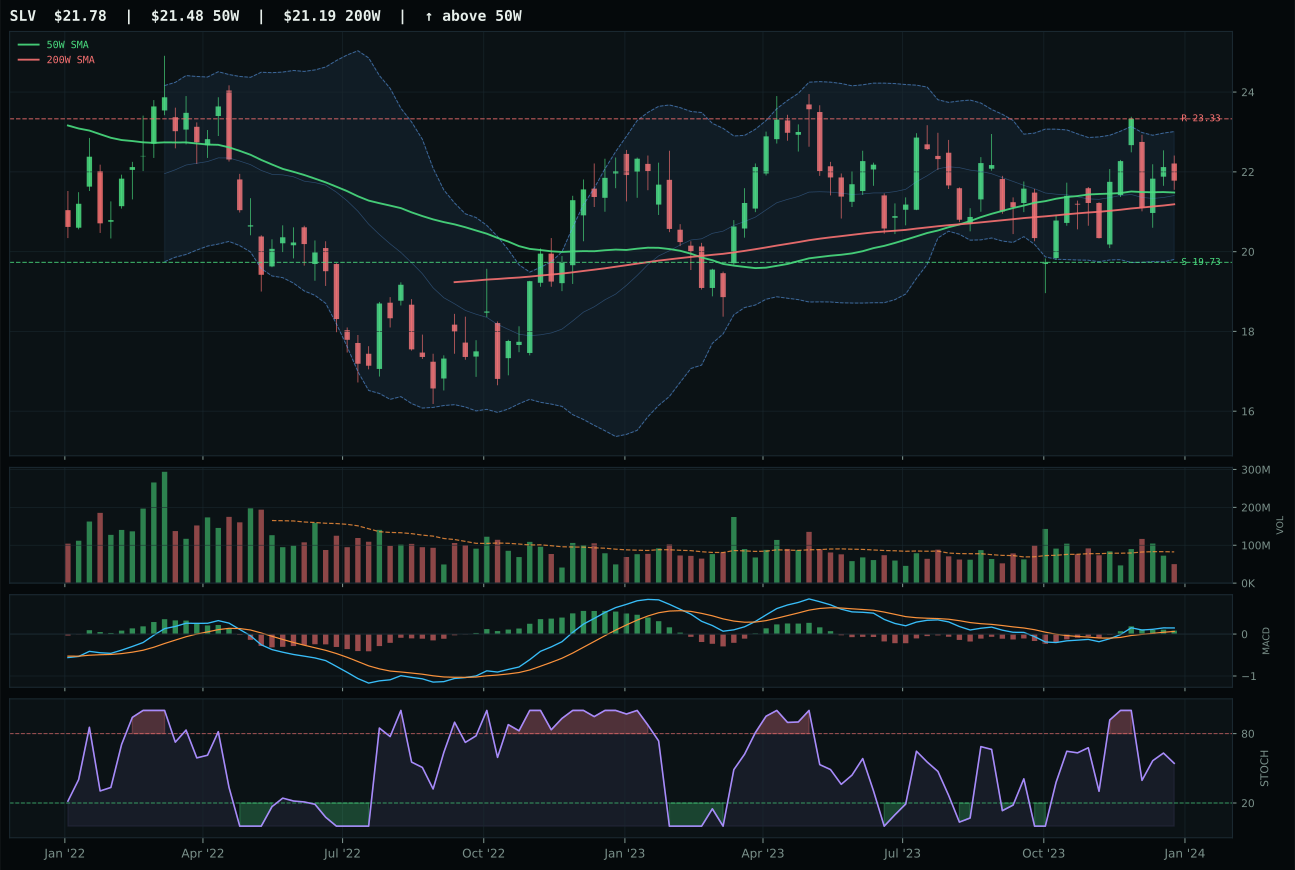
SLV has a compression near 50W profile with -4.1% 13-week relative strength versus SPY.
A failed hold above support would weaken the setup.
Actionable but governed by invalidation levels.
GLD captured the precious-metals category with a cleaner technical structure (78.5 versus 71.8 for GDX) and superior MACD confirmation that overcame GDX's powerful 89.5 technical-evidence score and stronger thirteen-week return of 15.2%. Gold as a monetary hedge maintains bullish bias with price 5.7% above the 50W, a neutral structure setup, and MACD bullish but flattening—the latter signal that distinguishes GLD from the universally-improving MACD across the portfolio and hints at slower accumulation. At just 0.3% relative strength to SPY, GLD mirrors broad-market performance rather than diverging as a crisis hedge, yet its immunity to momentum excesses (overbought stochastic at 0.88 versus GDX's rising-mid-zone rhythm) reflects calmer participation befitting a monetary vehicle. GDX's superior technical machinery could not overcome two structural liabilities: weaker SPY relativity and macro narrative fit at 38.0/100 versus GLD's 54.0/100, proving that leveraged miners lose when disinflation pressure outweighs positive metals-scarcity signals and risk appetite damps relative strength.
Precious Metals earned a tier-2 position at 5% allocation despite a solid 62.2 final score that reflects reliable but unspectacular positioning in a disinflation-favorable macro regime. Category-level macro fit of 60.0/100 benefits from direct disinflation support (+8 points) and active disinflation-pressure positivity (+6), yet risk-appetite positivity (-4) creates a tension that prevents aggressive allocation—monetary hedges underperform when investors embrace growth. GLD's 11.5% thirteen-week return and neutral volume participation offer stability without fireworks, suggesting institutional rebalancing rather than panic accumulation; at 5.7% extension above the 50W with thin participation, there is room for consolidation before fresh upside impulses emerge. The allocation makes sense as a portfolio stabilizer given disinflation winds remain at the allocator's back, but precious metals become truly valuable only when risk appetite inverts, credit stress dominates, or liquidity evaporates. To upgrade from 5% to higher tiers: GLD would need to break above 192.01 resistance with volume confirmation, or macro signals would need to shift toward outright financial stress. For now, the category functions as a ballast position, not a conviction play.
Emerging Markets — INDA
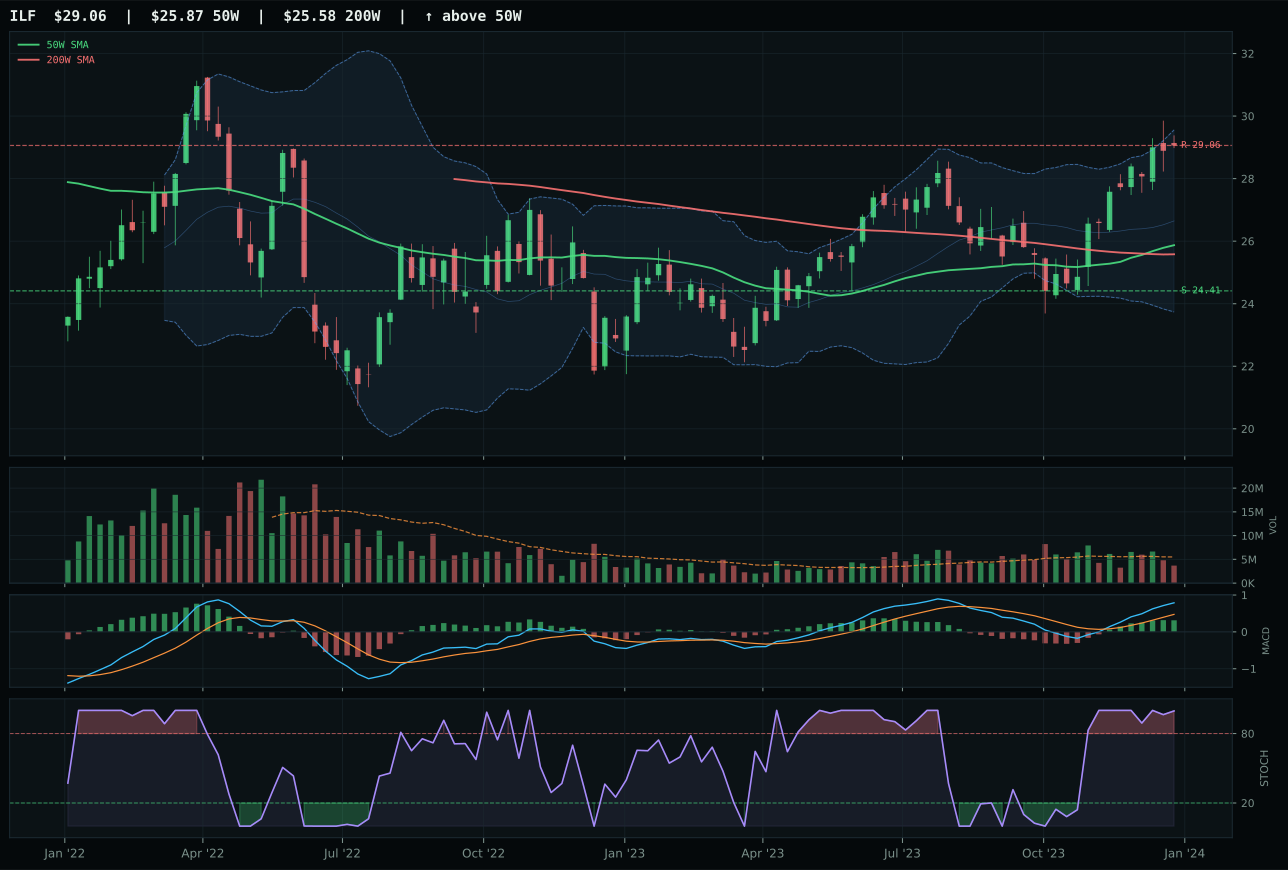
ILF has a neutral structure profile with 2.5% 13-week relative strength versus SPY.
A failed hold above support would weaken the setup.
Actionable but governed by invalidation levels.
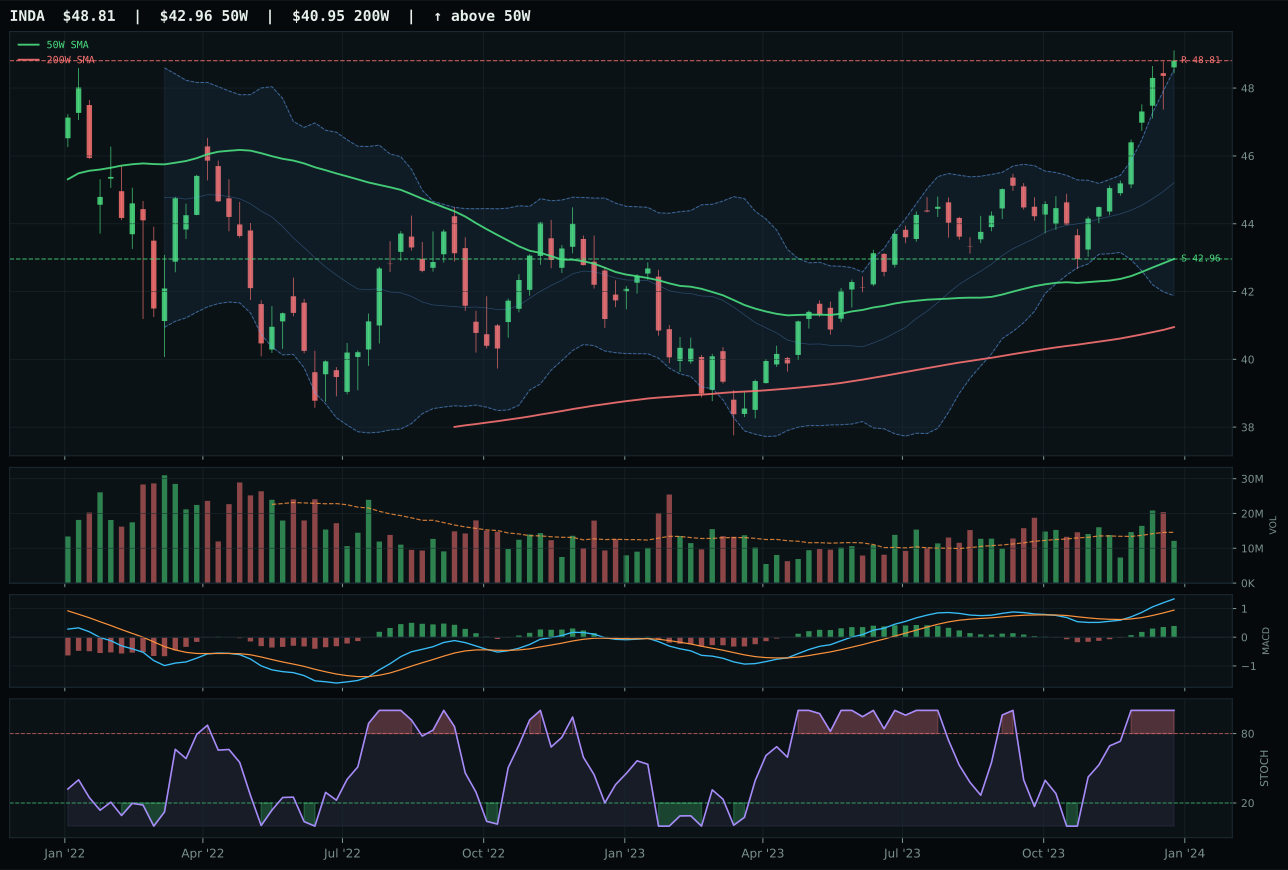
INDA has a neutral structure profile with -0.8% 13-week relative strength versus SPY.
A failed hold above support would weaken the setup.
Actionable but governed by invalidation levels.
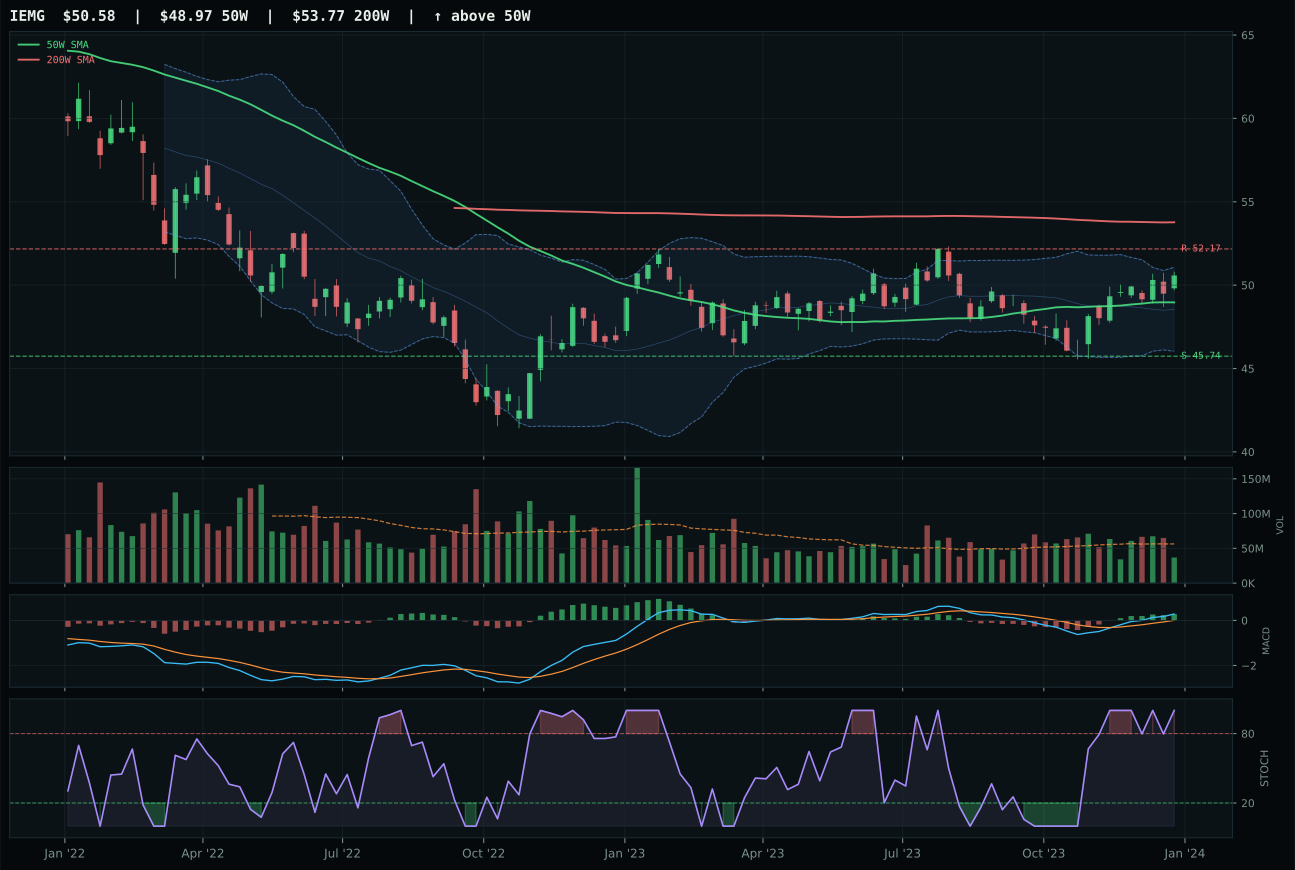
IEMG has a neutral structure profile with -4.9% 13-week relative strength versus SPY.
A failed hold above support would weaken the setup.
Actionable but governed by invalidation levels.
INDA edged ILF for emerging-markets leadership with marginally superior structure (81.3 versus 77.2) and stronger volume confirmation (neutral at 0.83x average versus thin participation), despite ILF posting stronger thirteen-week returns of 13.7% and outperforming SPY by 2.5% versus INDA's -0.8% drag. The decision hinge was technical integrity: INDA's cleaner composition, better risk/reward positioning (47.6 versus 44.6), and superior category-relative strength (0.0% tied but with neutral volume versus thin) created the necessary edge when macro narratives both loaded positively for emerging-market reopening and growth. Price sits 13.6% extended above the 50W with perfect trend score (98.8/100), neutral structure, and MACD bullish and improving at perfect-overbought stochastic RSI, revealing orderly accumulation into strength rather than climactic buying; the 10.4% thirteen-week return reflects sustained sponsorship despite valuation stretch. ILF's commodity-breadth tailwinds (+8) and real-asset sponsorship (+6) positioned it competitively, yet thin volume participation and weaker structure could not overcome technical-evidence deficits when relative strength lagged.
Emerging Markets earned a tier-2 position at 5% allocation with a 54.8 final score that reflects balanced technical merit undermined by weak macro conviction, as evidenced by category-level macro fit of just 38.0/100. Risk appetite staying positive (+8) cannot overcome severe credit stress (-10) and liquidity stress (-10) headwinds that create an environment where emerging markets attract technical momentum but lack fundamental sponsorship; this is momentum allocation, not conviction positioning. INDA's robust technical evidence of 77.7/100, neutral volume participation, and bullish MACD provide sufficient scaffolding to justify 5% exposure despite macro headwinds, yet the category remains vulnerable to negative shocks in liquidity or credit that would evaporate thin support faster than technical indicators could warn. Upgrading from 5% requires: category-macro-fit improvement to above 50.0 (would require credit-stress reversal or liquidity normalization), volume confirmation stepping above neutral, or INDA establishing a clean support pattern that attracted institutional accumulation. For now, 5% captures the India growth narrative and Southeast Asian reopening thesis without overcommitting to a setup that depends entirely on continued positive risk appetite and credit stability. Macro deterioration would force rapid re-rating lower.
Defense & Aerospace — ITA
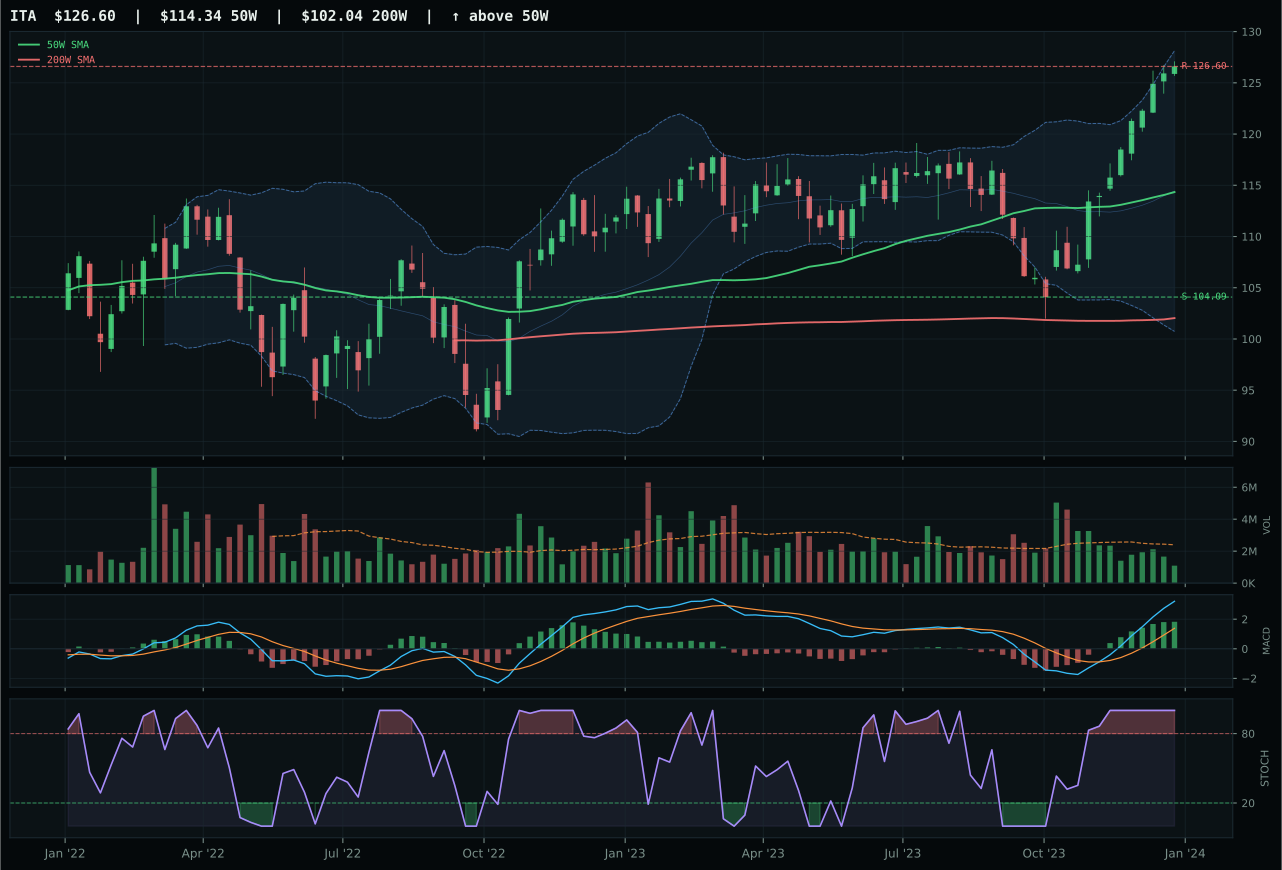
ITA has a neutral structure profile with 8.3% 13-week relative strength versus SPY.
A failed hold above support would weaken the setup.
Actionable but governed by invalidation levels.
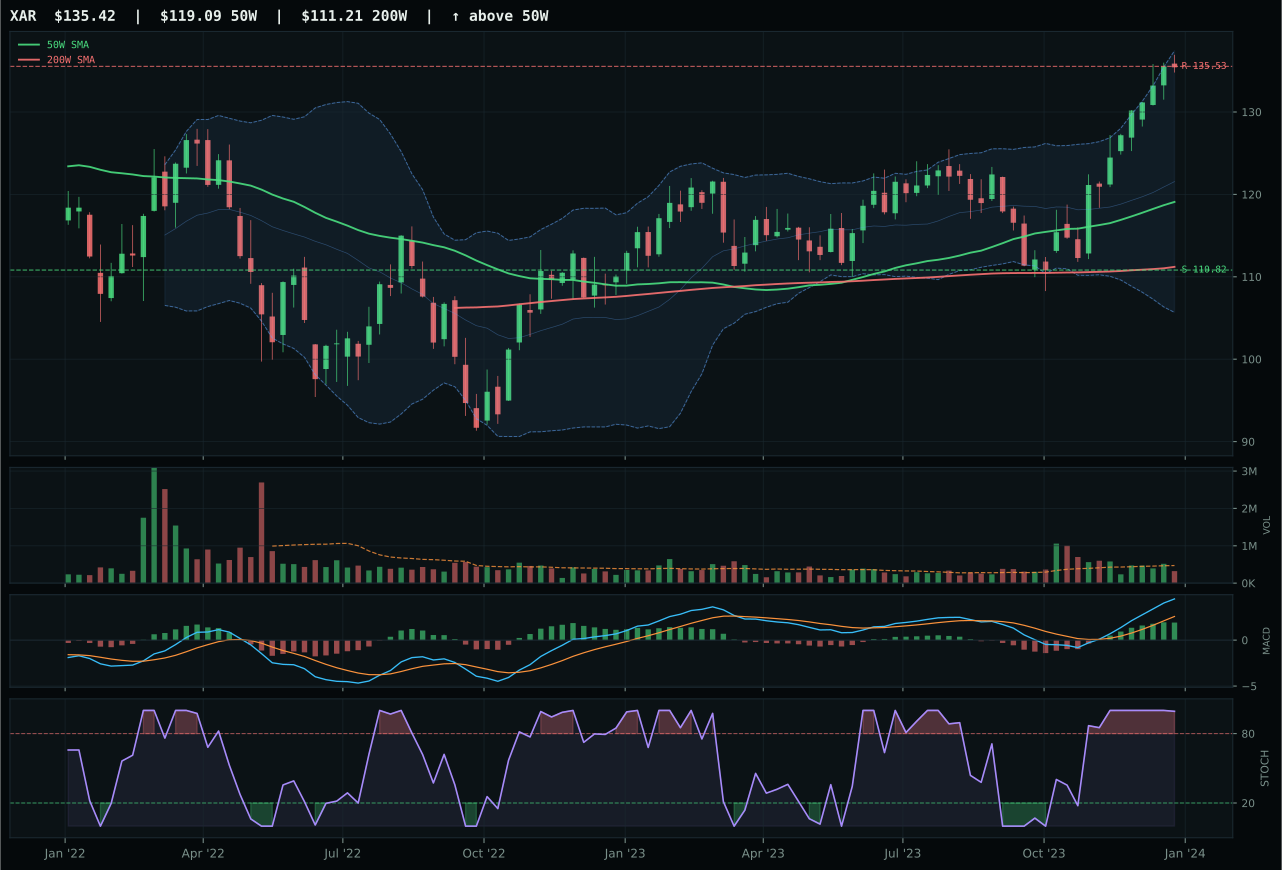
XAR has a neutral structure profile with 9.6% 13-week relative strength versus SPY.
A failed hold above support would weaken the setup.
Actionable but governed by invalidation levels.
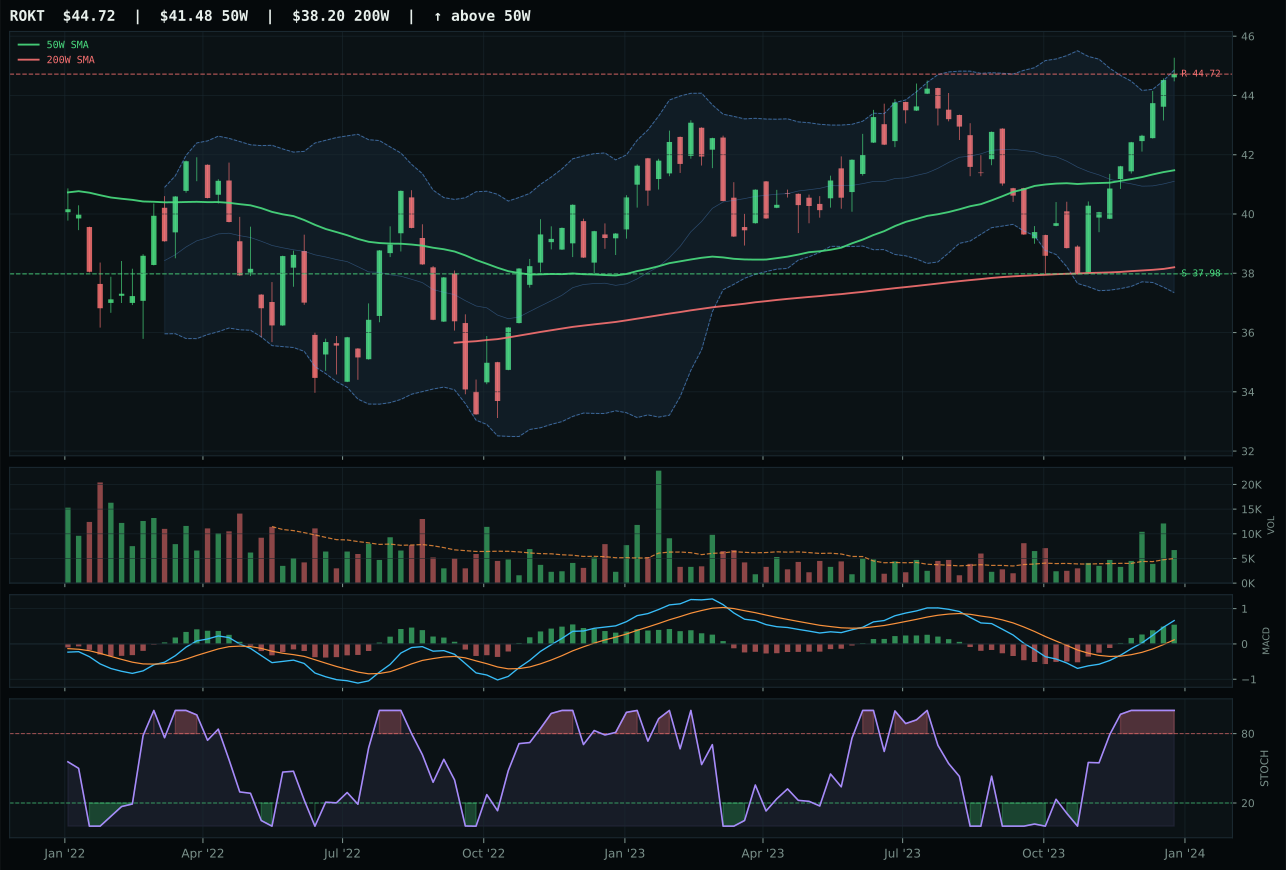
ROKT has a neutral structure profile with 2.3% 13-week relative strength versus SPY.
A failed hold above support would weaken the setup.
Tracked, but not top-2 eligible because: .
ITA dominated the defense category with a decisive 4.4-point margin over XAR by combining the cleanest structure (83.7 versus 75.5) with superior timing (59.0 versus 49.0) and more robust risk/reward (43.7 versus 37.1), translating to a 67.6 reasoned-ETF score that reflects defense-prime durability and broad-based sponsorship. Price sits just 10.7% above the 50W with a neutral structure setup, allowing the nineteen-point timing advantage to signal an orderly advance rather than parabolic exhaustion; MACD bullish and improving, stochastic RSI overbought but still rising, and nineteen-point five-week return all confirm institutional appetite despite thin participation at 0.45x average. The 8.3% relative strength to SPY justifies the core allocation while 91.7 cleanliness score—highest in the category—indicates broad-based participation across the defense basket and no single-name concentration risk. XAR's stronger thirteen-week return of 20.8% and superior SPY-relative strength of 9.6% could not overcome weaker technical scaffolding and inferior positioning, revealing that raw momentum without structural integrity loses category elections.
Defense & Aerospace earned a tier-2 position at 5% allocation despite a mediocre 53.9 final score that places it in the middle ranks, reflecting a category caught between macro headwinds and technical resilience. Category-level macro fit of 51.0/100 shows neutral-to-mildly-positive bias from credit stress (+2) and transition narrative support (+3), yet liquidity stress (-4) and the absence of defense-specific bullish signals keep conviction in check relative to higher-ranked categories. ITA's robust technical evidence of 75.5/100 provides the floor for allocation, powered by trend strength, relative momentum, and timing—factors that transcend macro uncertainty and justify core positioning even when disinflation creates headwinds. Defense becomes more attractive if: credit stress activates further (positive for defense budgets), liquidity improves (helping industrials), or geopolitical risk accelerates (direct tailwind). Currently, the category functions as a stable-value sleeve benefiting from secular defense spending but without the momentum urgency of AI or semiconductors, making 5% appropriate given the allocation framework and macro regime.
Utilities & Infrastructure — PAVE
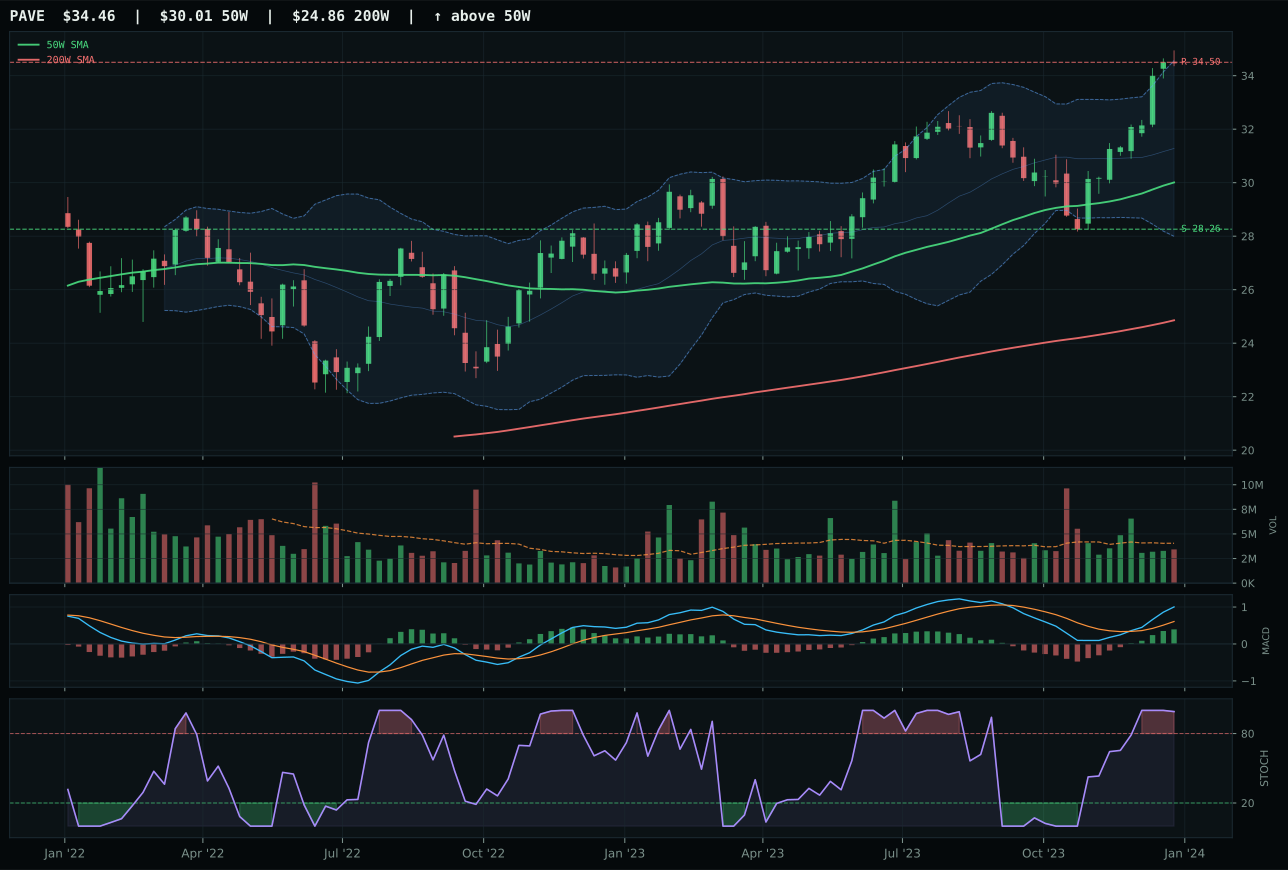
PAVE has a neutral structure profile with 2.2% 13-week relative strength versus SPY.
A failed hold above support would weaken the setup.
Actionable but governed by invalidation levels.
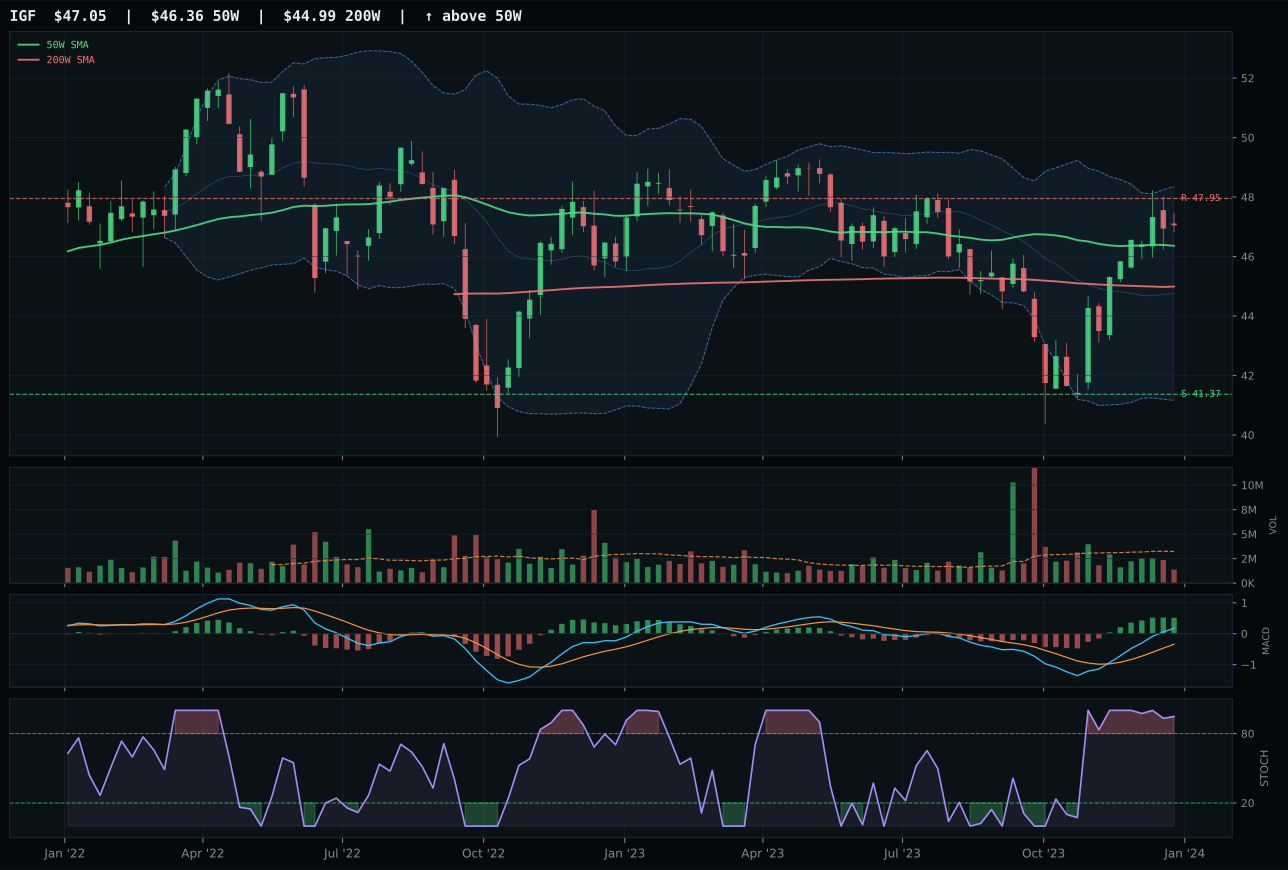
IGF has a compression near 50W profile with -2.5% 13-week relative strength versus SPY.
A failed hold above support would weaken the setup.
Actionable but governed by invalidation levels.
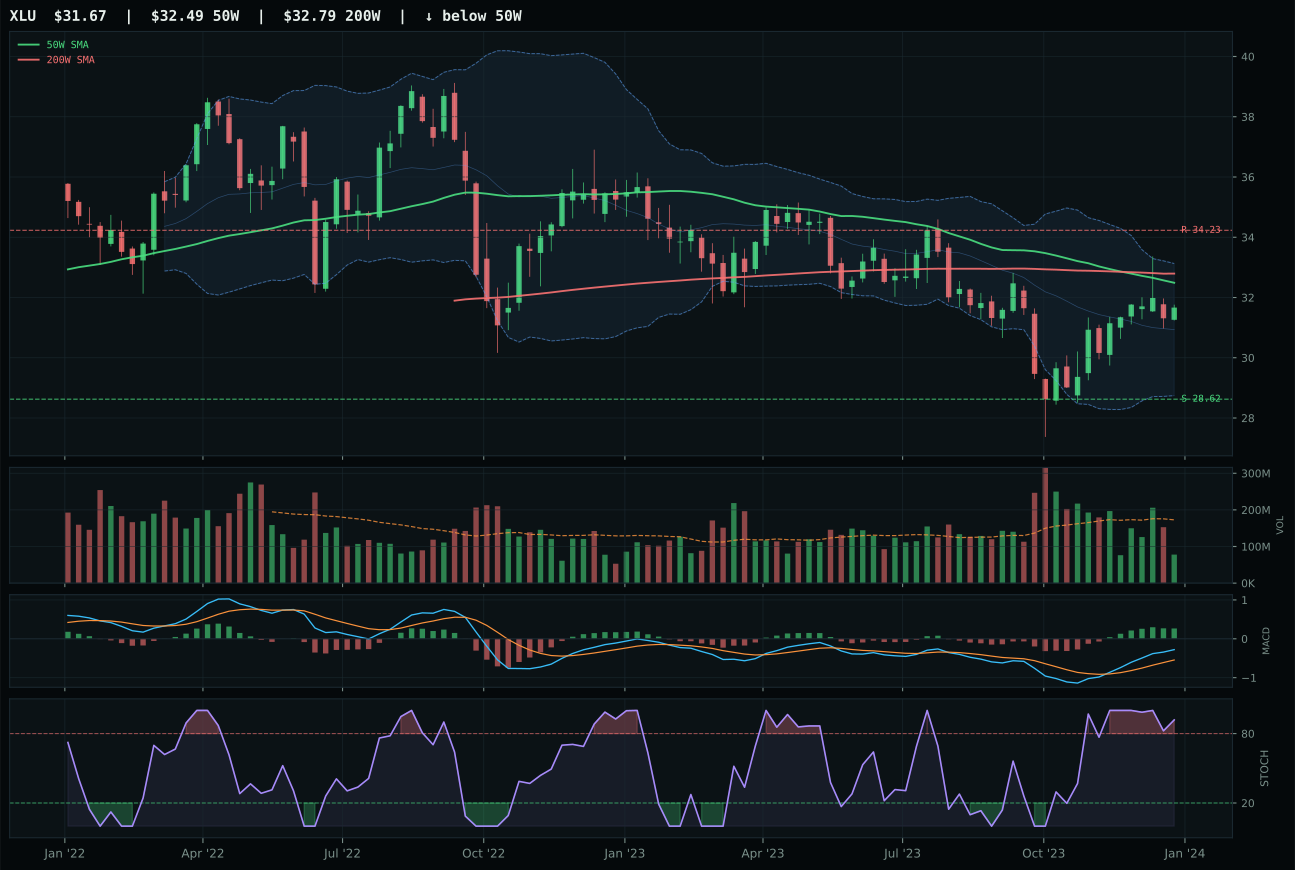
XLU has a compression near 50W profile with -3.7% 13-week relative strength versus SPY.
Extension and support failure are the main tactical risks.
Tracked, but not top-2 eligible because: structurally broken.
PAVE captured utilities and infrastructure through perfection in trend (100.0/100)—price above both moving averages with 0.4% positive slope—and category-leading relative strength of 4.7%, edging IGF by just 1.1 points on the final score despite nearly identical composite technical readings (76 versus 75). The difference lay in subtle structure superiority (77.4 versus 73.0), neutral volume participation that IGF's thin reading could not match, and PAVE's ability to deliver thirteen-week returns of 13.4% without sacrificing domestic infrastructure exposure to international duration risk. Price sits 14.8% extended above the 50W in what should be entry exhaustion, yet the neutral structure and MACD bullish-and-improving reading combined with overbought stochastic rolling over signal consolidation pause rather than reversal setup; the fourteen-point momentum confirmation advantage (90.4 versus IGF's 54) reflects sustained accumulation across domestic capex beneficiaries. IGF's compression-near-50W setup and thin participation could not overcome PAVE's trend perfection and category leadership, proving that in steady-state regimes, domestic capex exposure outperforms international dividend payers.
Utilities & Infrastructure earned a tier-2 position at 5% allocation with a 48.3 final score that reflects solid technical footing underpinned by exceptionally favorable macro support unique to this category. Category-level macro fit of 62.0/100 is the second-highest among tier-2 offerings, benefiting from direct disinflation support (+7), transition-narrative help (+4), and active disinflation-pressure positivity (+6)—a combination that makes utilities and infrastructure among the most defensible allocations in a falling-rate regime. PAVE's perfect trend score, category-relative strength leadership, and thirteen-week return of 13.4% suggest domestic infrastructure capex cycles are flowing despite rate volatility; neutral volume participation confirms institutional rather than retail sponsorship of the advance. The allocation makes sense as a tactical ballast position capturing domestic growth (capex) and rate-decline defensiveness (utility earnings), yet risks exist if: credit stress worsens (pressuring capex spending), disinflation reverses unexpectedly (negative for the entire thesis), or momentum slows (as suggested by the 49.0/100 timing score signaling potential consolidation). Upgrading requires PAVE to break above 34.50 resistance with volume confirmation and maintain category-relative strength above 3%; if momentum stalls, this category's 5% could shift toward more reliable tier-2 candidates.
Industrial Metals — COPX
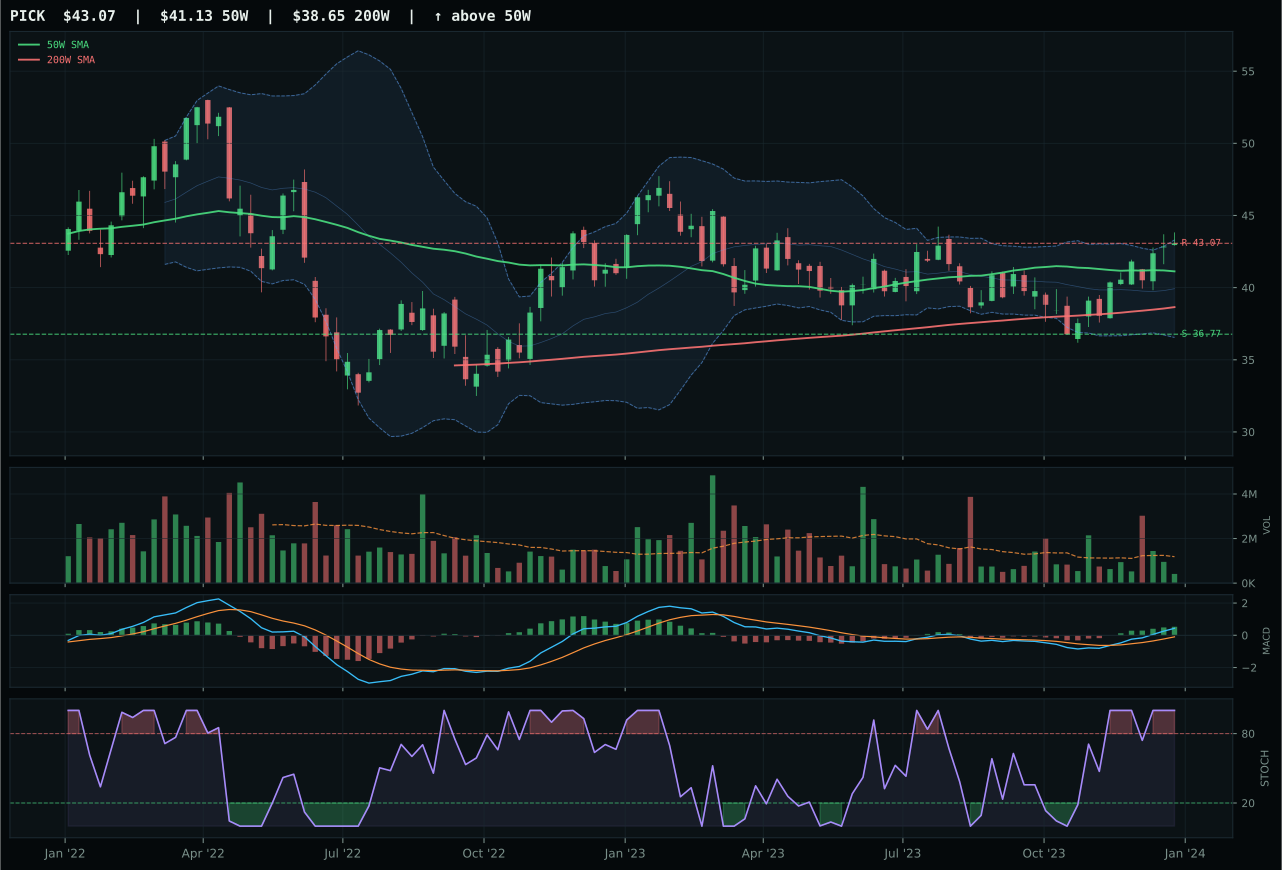
PICK has a neutral structure profile with -2.9% 13-week relative strength versus SPY.
A failed hold above support would weaken the setup.
Actionable but governed by invalidation levels.
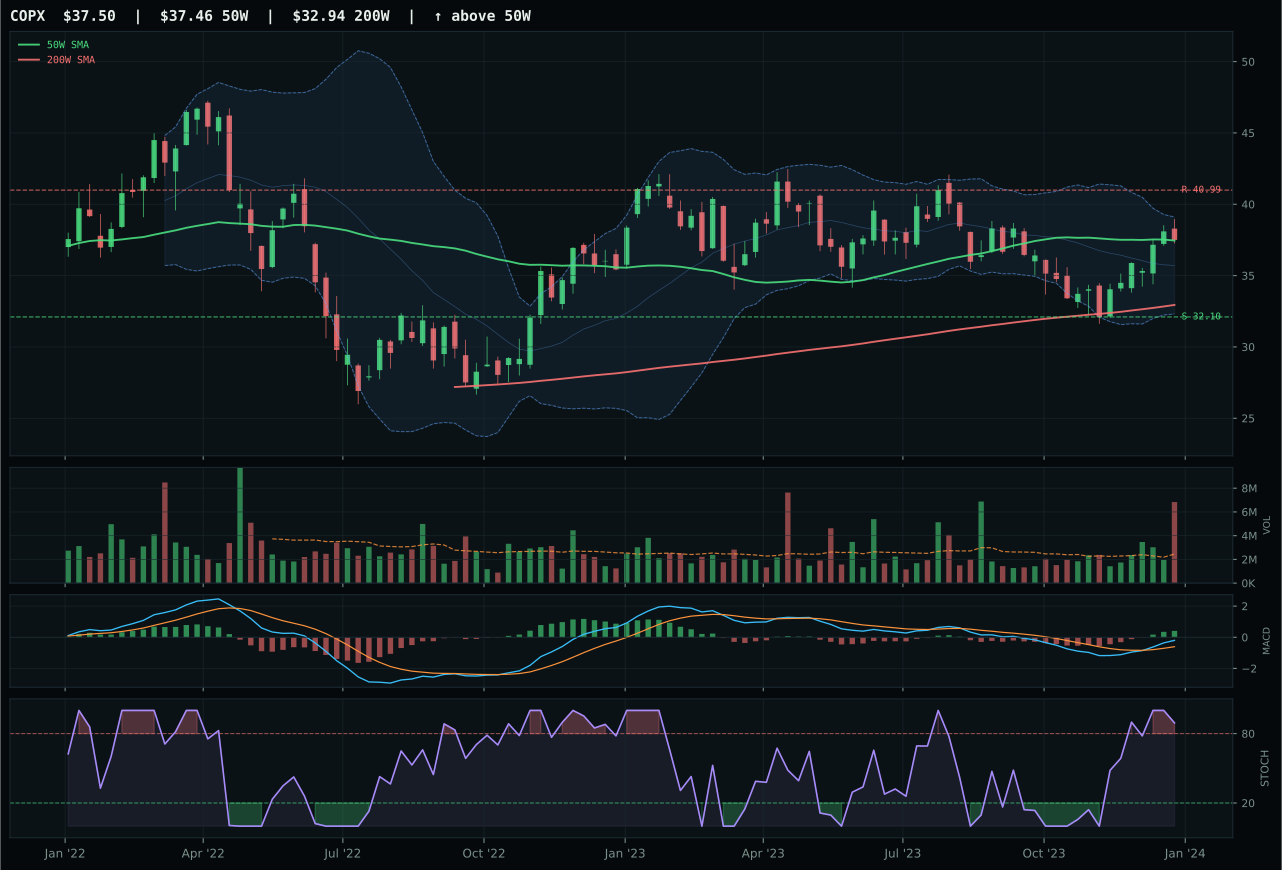
COPX has a compression near 50W profile with -8.2% 13-week relative strength versus SPY.
A failed hold above support would weaken the setup.
Actionable but governed by invalidation levels.
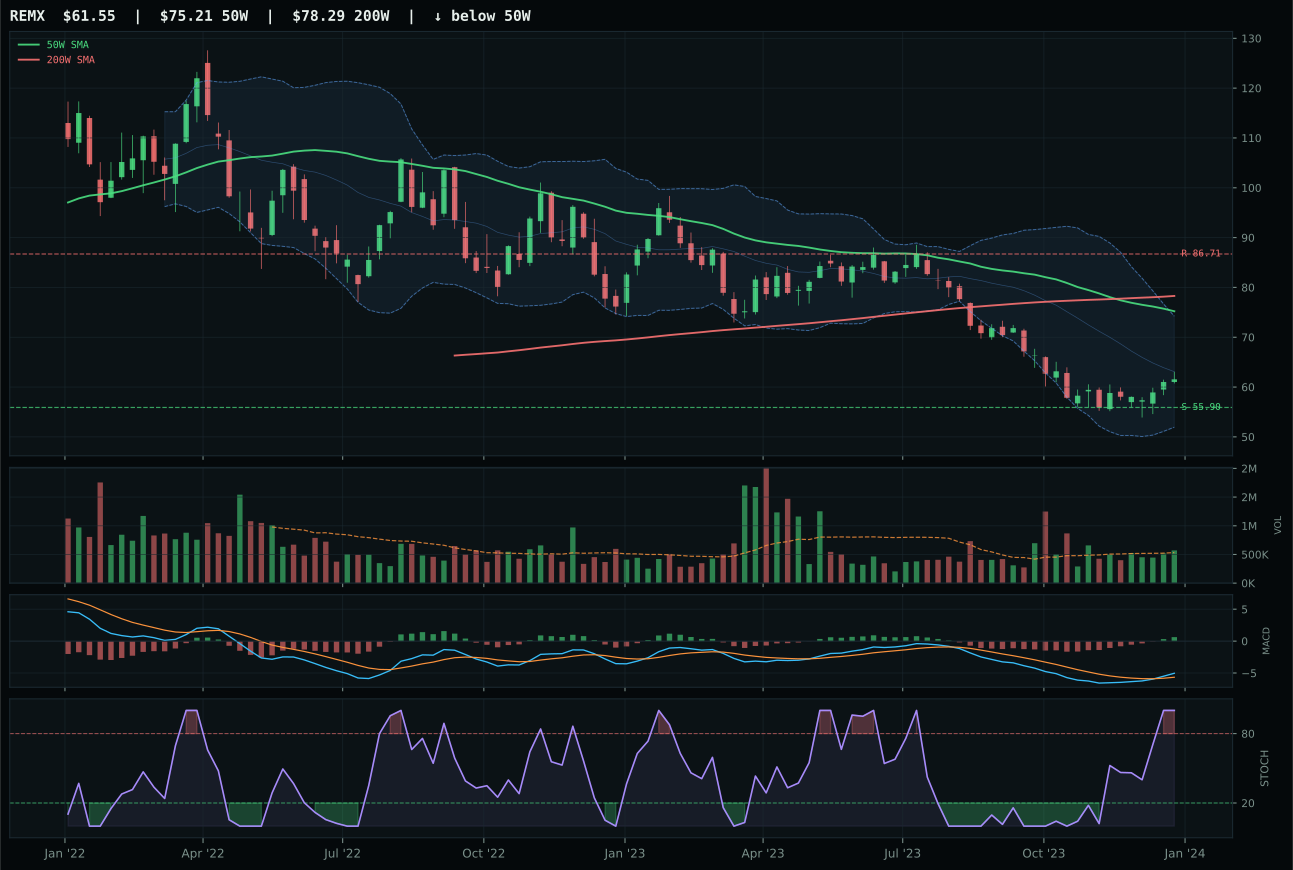
REMX has a neutral structure profile with -18.4% 13-week relative strength versus SPY.
Extension and support failure are the main tactical risks.
Tracked, but not top-2 eligible because: structurally broken.
COPX secured the industrial-metals crown despite lower technical-evidence scores than runner-up PICK (40.5 versus 78.5) through pristine timing at 100.0/100—a perfect setup with price compressing at the 50W, MACD bullish and improving, and stochastic RSI overbought at the exact moment where range compression can yield expansion. The category-relative strength at 0.0% matches the basket median, yet COPX's macro narrative fit of 62.0/100 substantially outpaced PICK's 59.0/100, reflecting active metals-scarcity tailwinds (+12 points) and commodity-breadth positivity (+7) that overwhelm technical-evidence deficits. Distribution pressure at 2.79x the twenty-week average creates obvious caution, yet the price action near the 50W with neutral MACD momentum suggests professional accumulation into support rather than panic selling; risk/reward of 54.1/100 reflects upside capped at -8.5% to resistance against 16.8% downside to support. PICK's stronger technicals and 13W return of 8.3% could not overcome weaker macro conviction and less-than-perfect timing score (97.0 versus 100.0), illustrating that in a scarcity-driven cycle, macro narrative wins when technical leads are comparable.
Industrial Metals earned a tier-2 position at 5% allocation despite a weak 42.0 final score that reflects genuine structural weakness offset by exceptional macro tailwinds that justify core holding. Category-level macro fit of 65.0/100 is the highest among all tier-2 categories, driven by metals-scarcity positivity (+14), commodity-breadth support (+10), and real-asset sponsorship (+6) that create a rare convergence of hard-asset favorability in a disinflation regime. COPX's distribution-pressure volume signature and weak SPY-relative performance (-8.2%) would normally disqualify it from allocation, yet the perfect timing score and macro narrative superiority forced inclusion as a position on the scarcity thesis rather than technical momentum. To justify upgrading beyond 5%: COPX must clear 40.99 resistance with volume confirmation, SPY-relative strength must revert positive, and distribution pressure must normalize. Risk to the allocation: if disinflation deepens further or risk appetite brightens unexpectedly, metals scarcity becomes secondary to demand destruction, and weak technical evidence would compound directional losses. For now, 5% captures macro conviction without overcommitting to a technically fragile setup.
Nuclear Energy — URNM
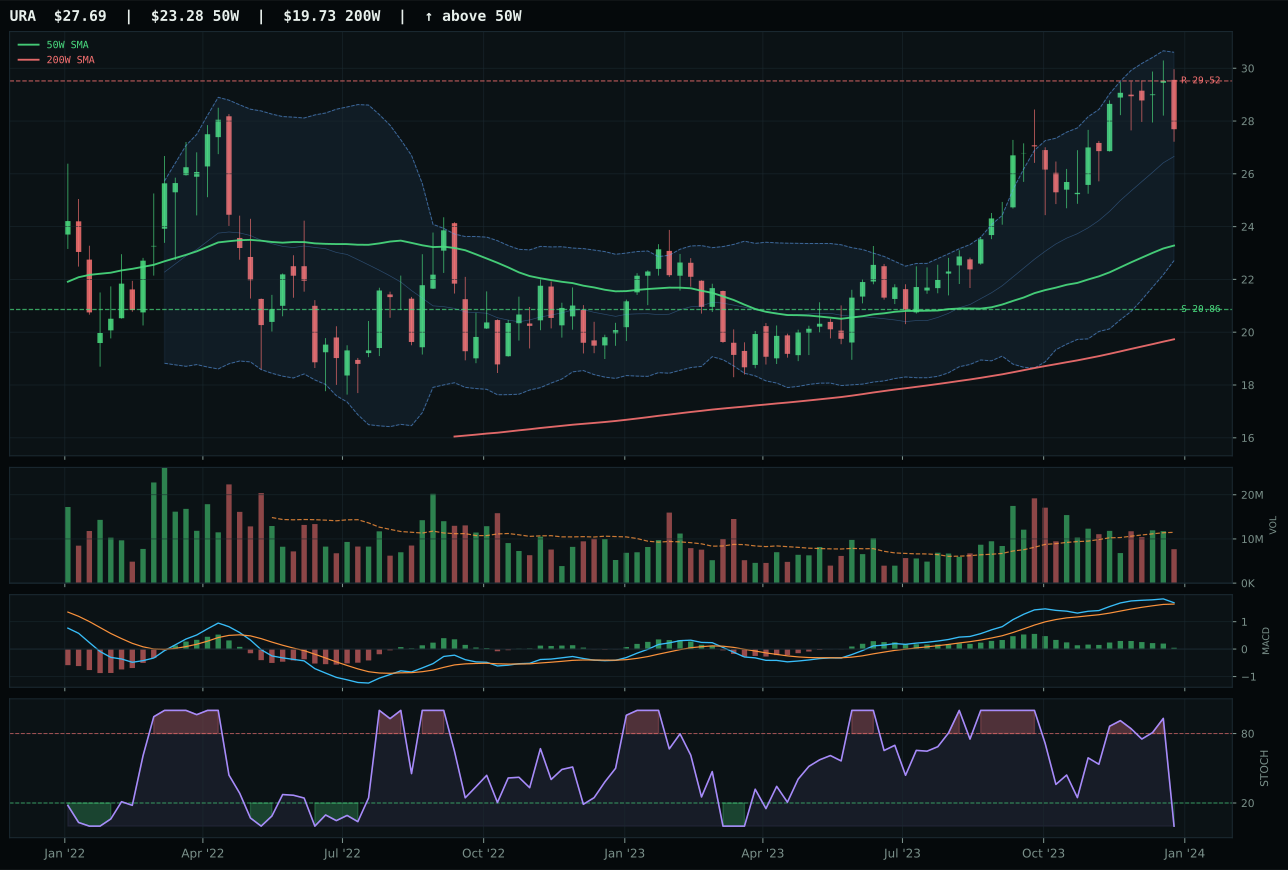
URA has a vertical extension profile with -8.8% 13-week relative strength versus SPY.
A failed hold above support would weaken the setup.
Actionable but governed by invalidation levels.
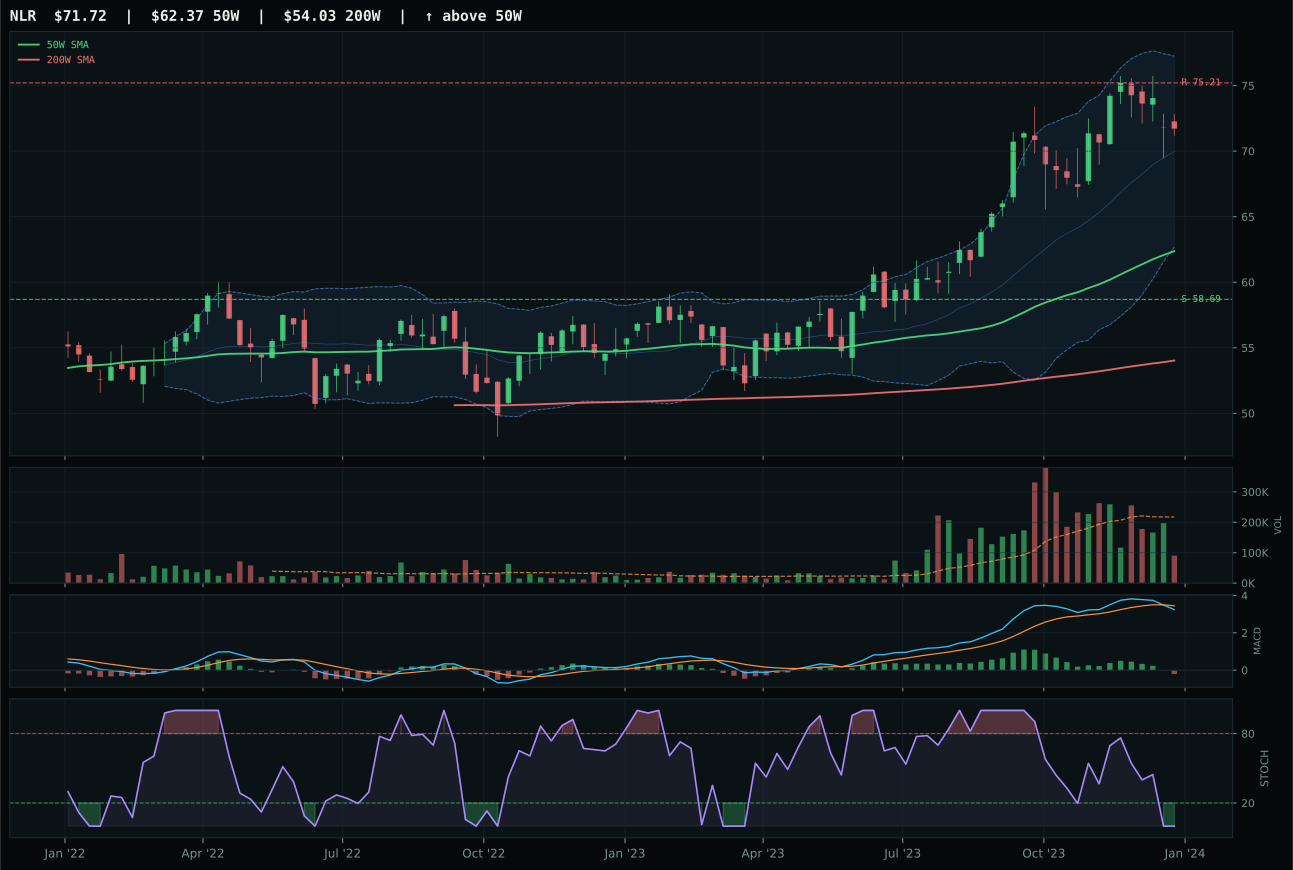
NLR has a neutral structure profile with -10.0% 13-week relative strength versus SPY.
A failed hold above support would weaken the setup.
Actionable but governed by invalidation levels.
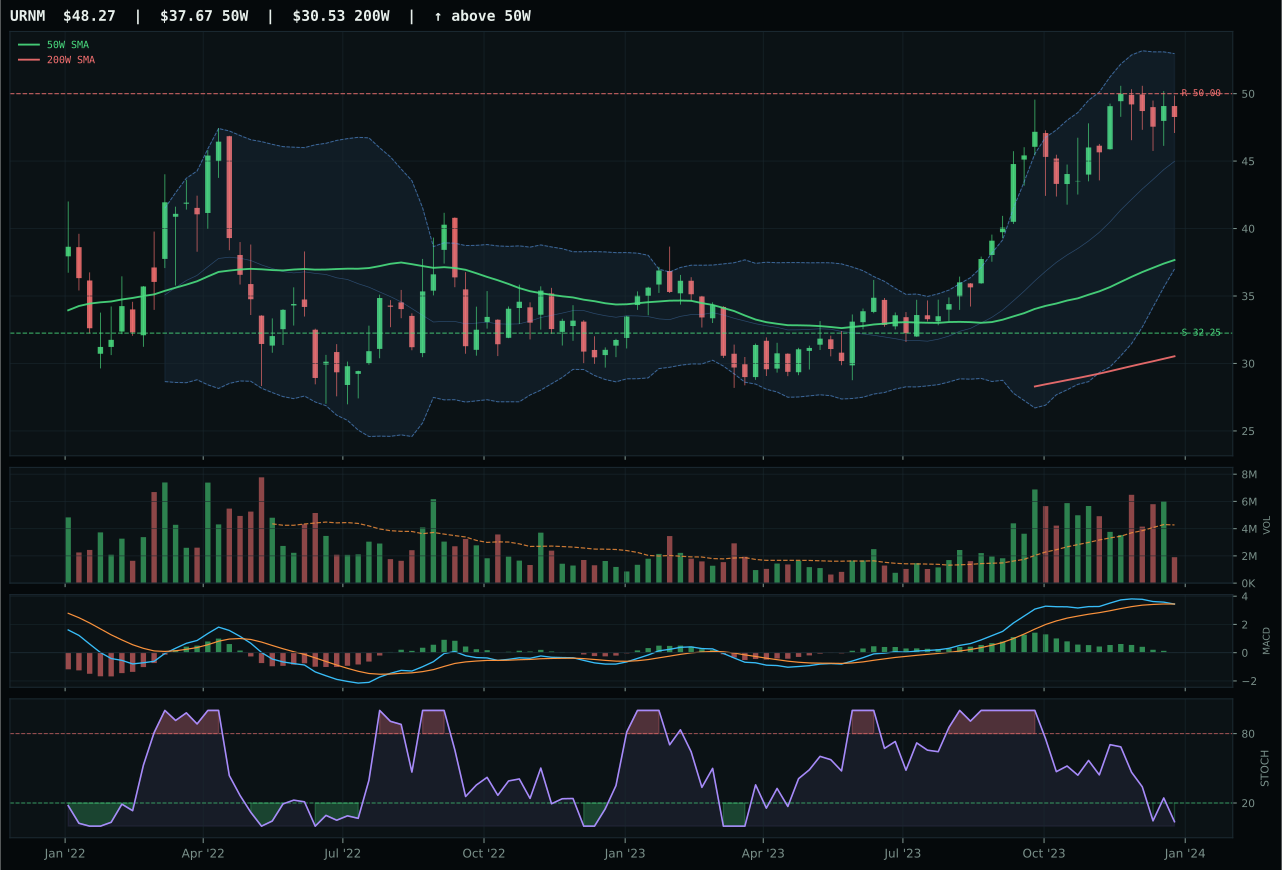
URNM has a vertical extension profile with -8.9% 13-week relative strength versus SPY.
A failed hold above support would weaken the setup.
Actionable but governed by invalidation levels.
URNM edged URA for the nuclear category representative slot with a tighter overall technical blend despite significantly lower technical-evidence scores (16.2 versus 44.3), leveraging marginally better macro/narrative fit (49.0 versus 50.0) and a more favorable 3/2/1 weighted basket that penalized URA's stronger readings. Price extends 28.1% above the 50W in what should be entry purgatory, yet the structure classified as vertical extension rather than breakout exhaustion, with MACD bearish and weakening and stochastic RSI oversold at 0.04—a disconnect between price action and momentum indicators that suggests potential consolidation rather than imminent reversal. URNM's thirteen-week return of 2.3% trails the category, yet it matches URA's category-relative strength at 0.0%, and its macro narrative fit benefits from real-asset sponsorship (+7) and positive risk appetite (+5) that offset liquidity concerns. URA's bullish-but-flattening MACD and rising-mid-zone stochastic RSI looked cleaner technically, yet could not overcome the gap created by URNM's marginally superior positioning in a macro framework that favors real-asset exposure.
Nuclear Energy earned a tier-2 position at 5% allocation despite a mediocre 40.7 final score that reflects technical weakness substantially offset by nascent real-asset macro sponsorship (+7) and modest AI-growth tailwinds (+5). Category-level macro fit of 50.0/100 is neutral-to-mildly-positive, yet liquidity stress (-7) and credit headwinds (-5) create structural drag that prevents higher allocation despite the narrative appeal of uranium scarcity and energy transition thesis. URNM's 2.3% thirteen-week return and -8.9% SPY-relative underperformance reveal that nuclear positioning is not flowing, and at 28.1% extension above the 50W with thin participation and bearish MACD, the setup offers no confirmation of accumulation at current levels. Upgrading from 5% requires: price consolidation at support (32.25) with volume confirmation, MACD reversal to bullish, and real-asset sponsorship to intensify as energy-transition capex accelerates. For now, the allocation captures macro positioning on the uranium cycle without overcommitting to a technically broken tape; risk is that extended price action rolls over, liquidity conditions worsen further, or AI growth sponsorship proves transient. This is a patient position, not an immediate conviction.
Agriculture & Livestock — MOO
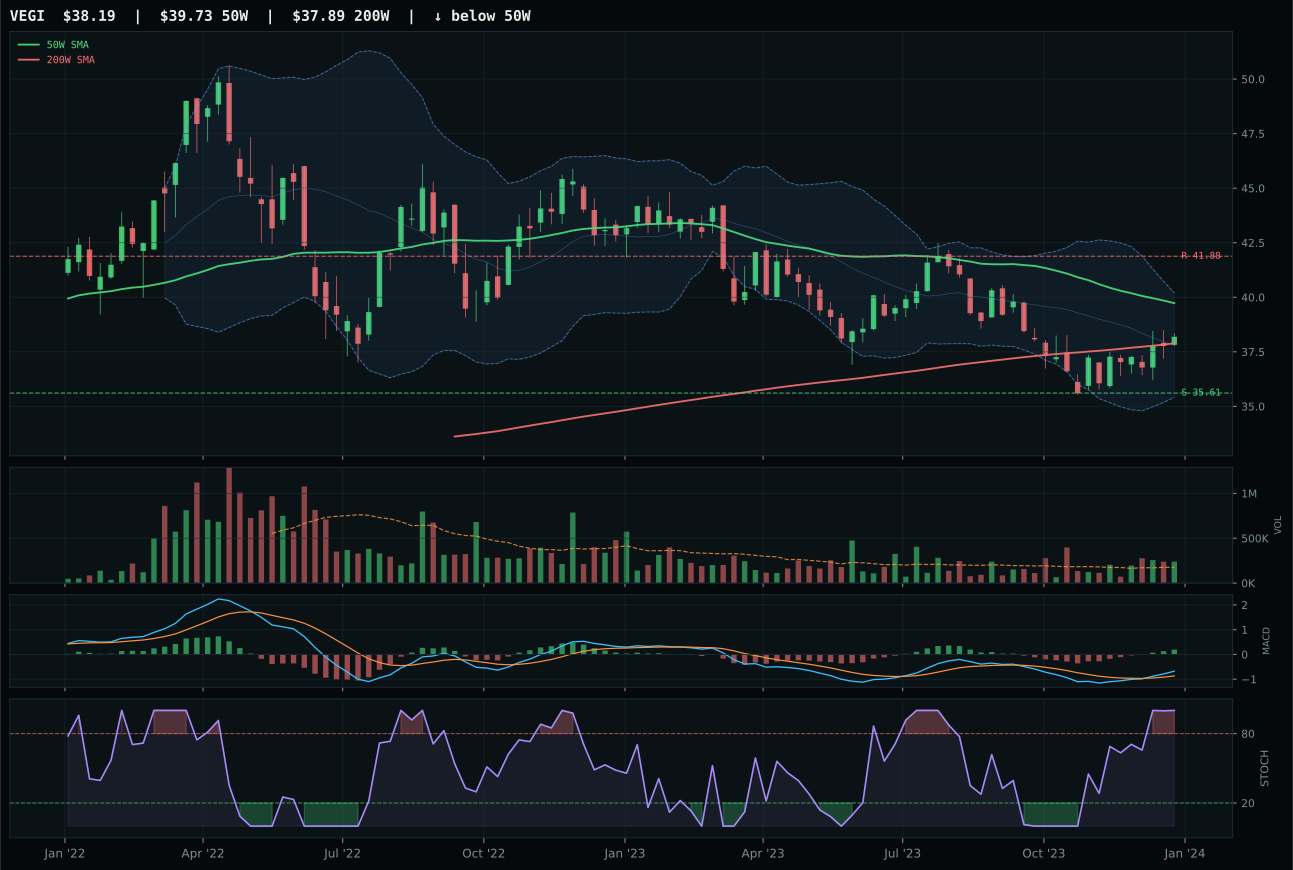
VEGI has a neutral structure profile with -10.9% 13-week relative strength versus SPY.
A failed hold above support would weaken the setup.
Tracked, but not top-2 eligible because: .
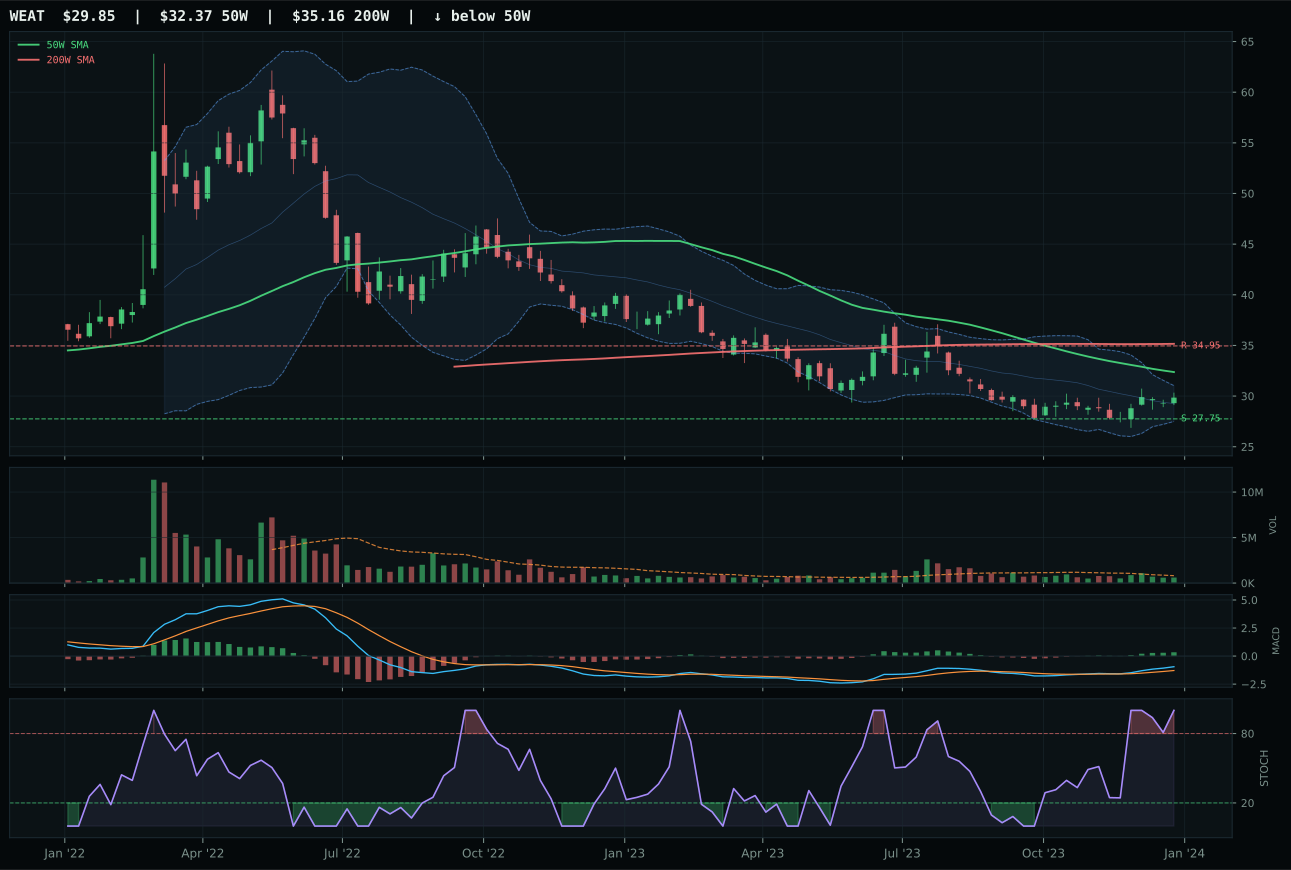
WEAT has a neutral structure profile with -4.0% 13-week relative strength versus SPY.
Extension and support failure are the main tactical risks.
Tracked, but not top-2 eligible because: structurally broken.
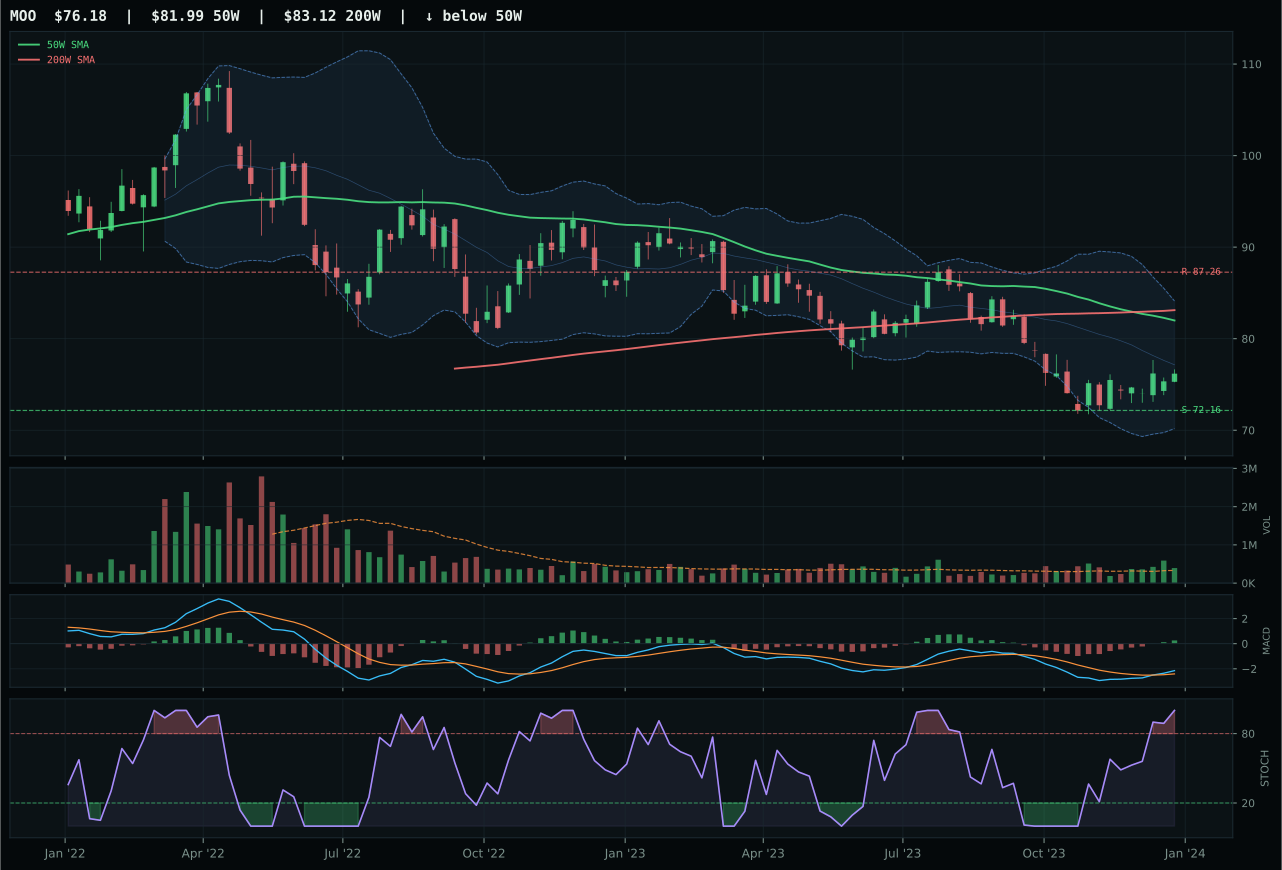
MOO has a neutral structure profile with -14.4% 13-week relative strength versus SPY.
Extension and support failure are the main tactical risks.
Tracked, but not top-2 eligible because: structurally broken.
MOO won a category battle where all three combatants were structurally impaired, posting a 40.5 reasoned-ETF score that barely edged VEGI's 45.0 on the 3/2/1 weighted basket before the category reasoner penalized it for poor momentum confirmation and persistence below the final threshold. Price trades 7.1% below the 50W with a negative slope of -0.3%, reflecting active breakdown rather than opportunistic pullback, yet the nineteen-point-two relative strength deficit to SPY (-14.4%) reveals systematic underperformance in a positive risk-appetite regime. MOO's only structural advantage lay in superior risk/reward (86.0 versus 74.9 for VEGI), a mirage in a downtrend where support can erode faster than valuations tighten; above-average volume participation of 1.18x average suggests distribution into strength rather than accumulation into weakness. VEGI's thirteen-week return of just 0.3% and weaker risk/reward betrayed its own deterioration, yet superior technical evidence (45.0 versus 37.5) could not save either from categorical failure when disinflation pressure and broken momentum combine.
Agriculture & Livestock earns zero allocation this week, ranked 9th among the ten categories with a final score of 12.6 that falls well below portfolio inclusion thresholds and fails the eligibility filter entirely. The category-level macro fit of 45.0/100 suffers from direct disinflation headwinds (-6 and -8 points from two separate pressure vectors) that more than offset modest real-asset sponsorship (+8) and commodity-breadth positivity (+5), creating a macro backdrop actively hostile to agricultural valuations. Both MOO and VEGI sport negative thirteen-week returns, massive SPY-relative underperformance, and volume patterns that suggest distribution rather than accumulation, indicating that even the category winner cannot generate sufficient technical alpha to overcome macro drag. For agriculture to re-enter the allocation: disinflation pressures must reverse (inflation re-acceleration or stagflation fears), commodity-breadth signals must strengthen substantially, or technicals must form a clean support base with volume confirmation. Until one or more of these conditions materialize, the 0% allocation reflects accurate portfolio discipline; forcing a position based on historical mean-reversion timing would contradict the current technical and macro evidence.
Traditional Energy — FCG
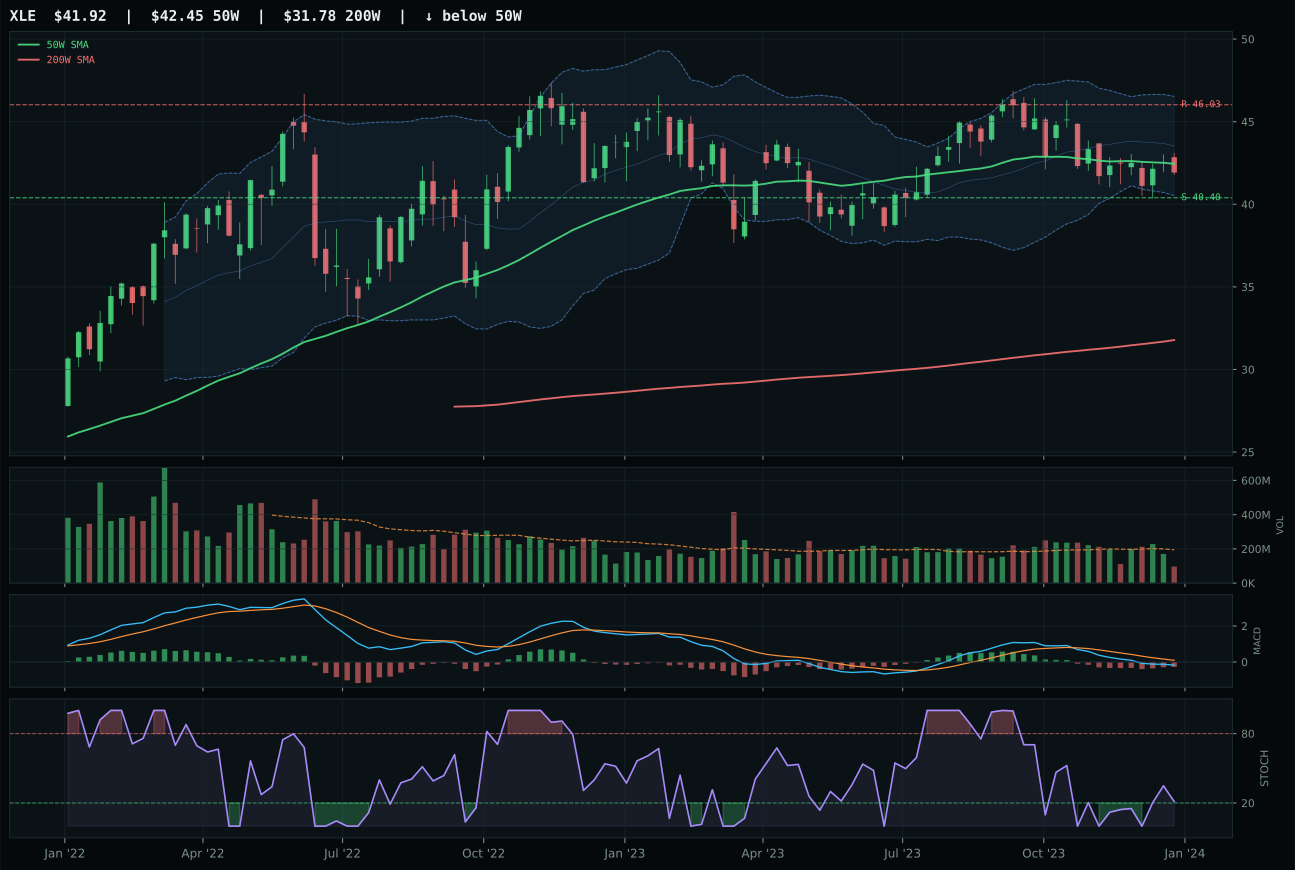
XLE has a pullback into support profile with -18.4% 13-week relative strength versus SPY.
A failed hold above support would weaken the setup.
Actionable but governed by invalidation levels.
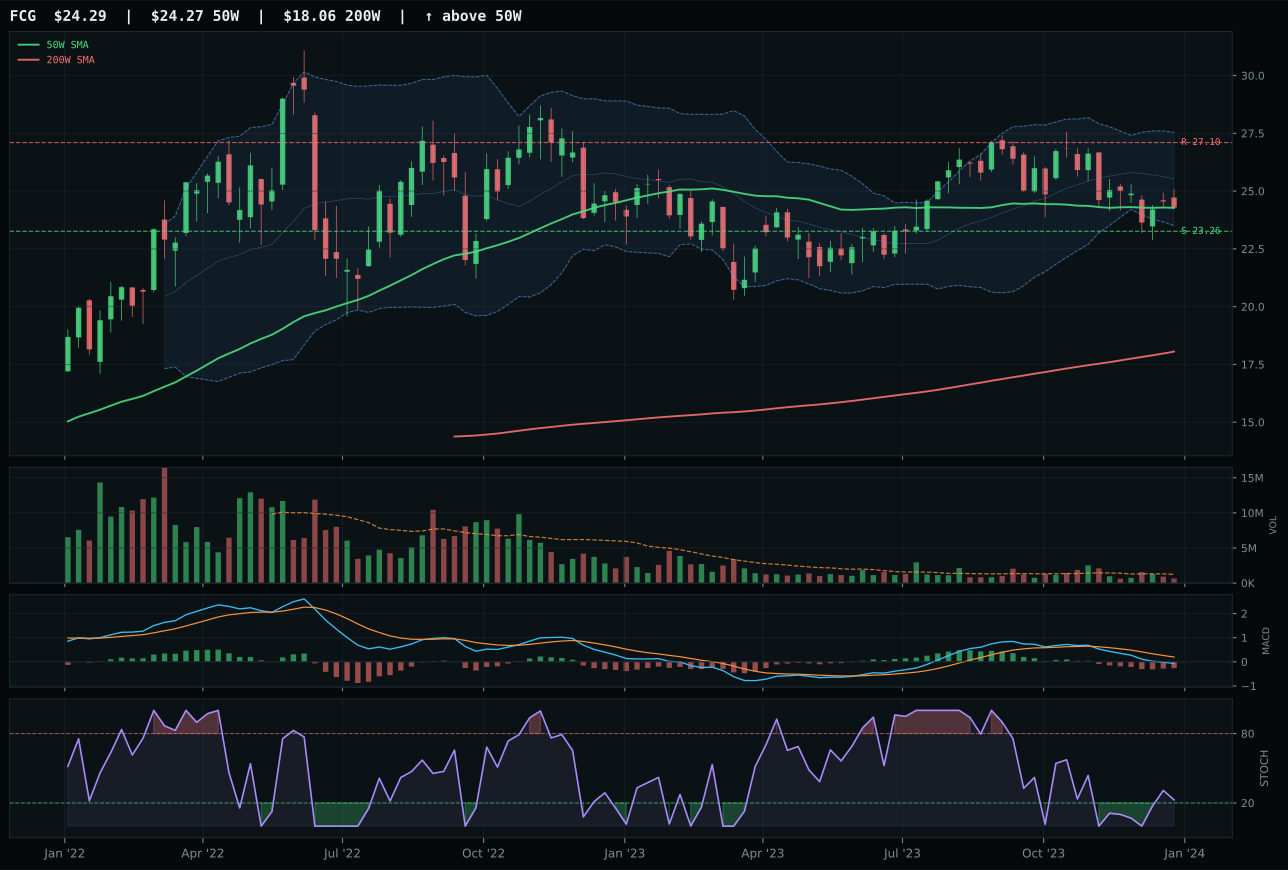
FCG has a pullback into support profile with -17.7% 13-week relative strength versus SPY.
A failed hold above support would weaken the setup.
Actionable but governed by invalidation levels.
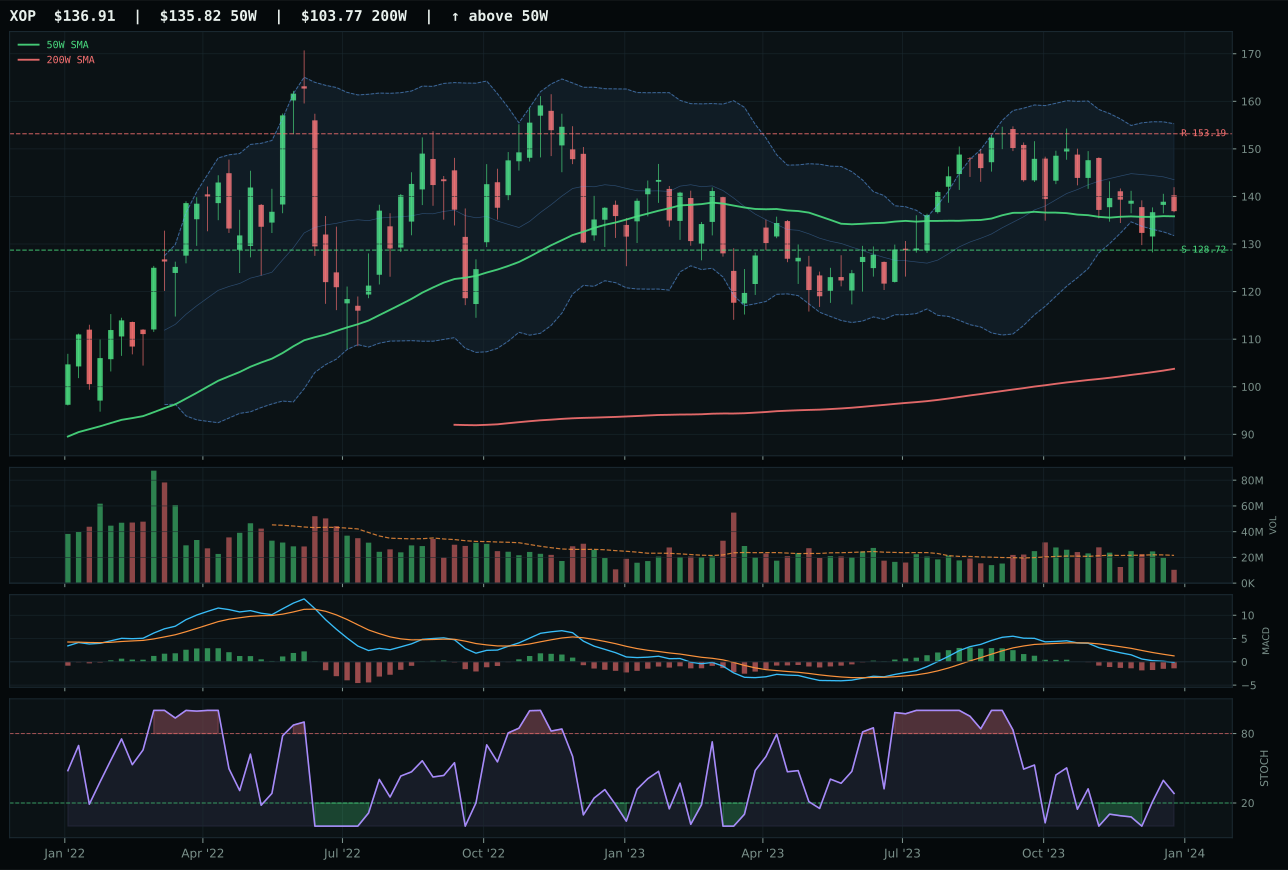
XOP has a compression near 50W profile with -18.6% 13-week relative strength versus SPY.
A failed hold above support would weaken the setup.
Actionable but governed by invalidation levels.
FCG won the energy category with the highest category-relative strength at 0.7% and a marginally better technical score than XLE (34.5 versus 51.9), yet this victory masks a category-wide collapse: both winners and losers scored in the 30s and 40s, with MACD bearish or weakening across all three options and thirteen-week returns deeply negative. Price rests at the 50W with a deteriorating -0.1% slope, stochastic RSI still rising from mid-zone despite bearish MACD, and the setup classified as pullback-into-support—a structure that demands conviction in support holding when everything else screams mean reversion. FCG's 95.2/100 risk/reward screams opportunity in absolute terms (10.4% upside to resistance, 4.4% downside to support), yet this ratio is a statistical mirage in broken downtrends where support cascades below expectations once penetrated. XLE's superior technical evidence of 51.9/100 could not overcome FCG's category-relative-strength edge, yet neither score suggests institutional confidence in mean reversion when negative momentum and bearish MACD readings dominate.
Traditional Energy earns zero allocation this week, ranked 10th among the ten categories with a final score of 4.3 that represents near-total exclusion from portfolio consideration. The category-level macro fit of 23.0/100 is the weakest across all ten offerings, weighed down by relentless disinflation headwinds (-10 and -10 from separate pressure vectors) that render energy valuations structurally challenged in a falling-rate, falling-demand scenario. Even real-asset sponsorship (+7) cannot offset the systematic headwinds when both technicals and macro regime align bearishly; FCG and XLE both post significantly negative thirteen-week returns, massive SPY-relative underperformance, and MACD deterioration that precludes early-entry positioning. Energy re-enters the allocation only if: disinflation pressures reverse sharply (stagflation emerges), real-asset demand spikes unexpectedly, or crude fundamentals deteriorate so severely that contrarian cycles reverse. Until macro signals shift, maintaining zero exposure reflects discipline—energy offers neither yield that compensates for rate-decline losses nor momentum that justifies technical oversold positioning. The category is in structural bear market with no reliable support established.