
2023-12-22
Informational purposes only. The content in this report, including allocations, analysis, and commentary, is provided solely for informational and educational purposes. It does not constitute financial advice, investment advice, trading advice, or any other type of advice. Past performance does not guarantee future results. Always conduct your own research and consult a qualified financial professional before making investment decisions.
Weekly Allocation
| Ticker | Category | Weight | Role |
|---|---|---|---|
| FBTC | 50% | Overlay | |
| BOTZ | AI | 10% | Top-2 (10%) |
| CIBR | Technology | 10% | Top-2 (10%) |
| GDX | Precious Metals | 5% | Tier-2 (5%) |
| XAR | Defense & Aerospace | 5% | Tier-2 (5%) |
| COPX | Industrial Metals | 5% | Tier-2 (5%) |
| INDA | Emerging Markets | 5% | Tier-2 (5%) |
| URA | Nuclear Energy | 5% | Tier-2 (5%) |
| PAVE | Utilities & Infrastructure | 5% | Tier-2 (5%) |
Trade Instructions — Monday Open
Sell the tranche from 2023-11-24 (completing its 4-week hold). Buy the new tranche. Instructions show net portfolio changes — same-asset positions cancel, weight changes show the delta.
| Action | Ticker | Instruction |
|---|---|---|
| SELL | IGV | Sell 67% of IGV position (reduce 3.75% → 1.25%) |
| SELL | URNM | Sell entire URNM position (1.25% of portfolio) |
| SELL | GLD | Sell 20% of GLD position (reduce 6.25% → 5.00%) |
| SELL | ILF | Sell 33% of ILF position (reduce 3.75% → 2.50%) |
| SELL | PICK | Sell 50% of PICK position (reduce 2.50% → 1.25%) |
| BUY | URA | Buy URA — 16.67% of freed cash (adds 1.25% to portfolio) |
| BUY | CIBR | Buy CIBR — 33.33% of freed cash (adds 2.50% to portfolio) |
| BUY | INDA | Buy INDA — 16.67% of freed cash (adds 1.25% to portfolio) |
| BUY | COPX | Buy COPX — 16.67% of freed cash (adds 1.25% to portfolio) |
| BUY | GDX | Buy GDX — 16.67% of freed cash (adds 1.25% to portfolio) |
Current Portfolio After Trade
Combined holdings across all 4 active tranches. Each tranche is 25% of the portfolio.
| Ticker | % of Portfolio | Weight Bar |
|---|---|---|
| FBTC | 50.00% | |
| BOTZ | 7.50% | |
| CIBR | 7.50% | |
| PAVE | 6.25% | |
| GLD | 5.00% | |
| XAR | 5.00% | |
| URA | 5.00% | |
| ILF | 2.50% | |
| INDA | 2.50% | |
| COPX | 2.50% | |
| IGV | 1.25% | |
| PICK | 1.25% | |
| MOO | 1.25% | |
| ITA | 1.25% | |
| GDX | 1.25% |
Macro Regime — Disinflation
Macro Evidence Charts
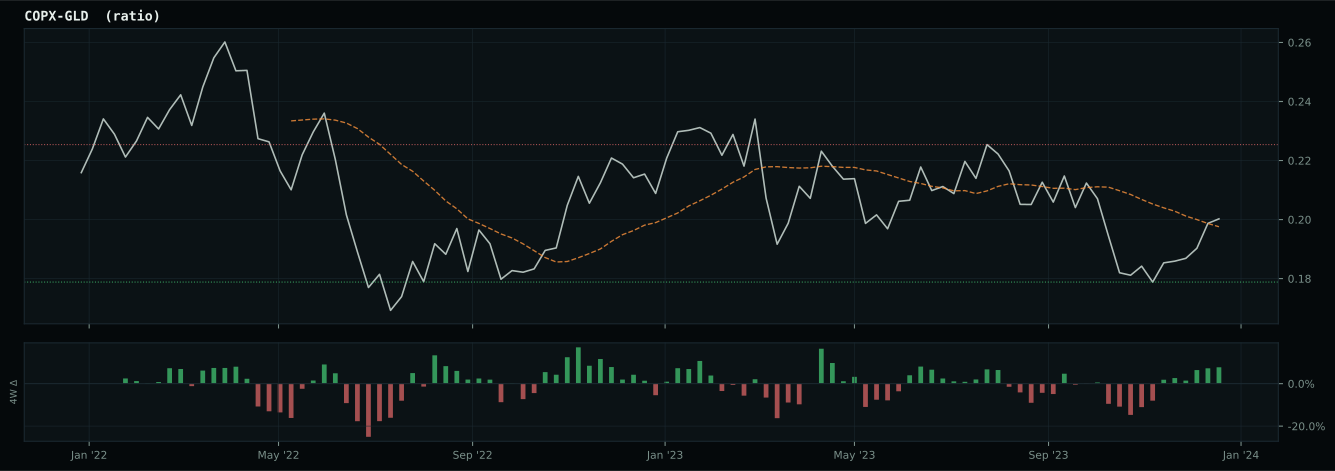
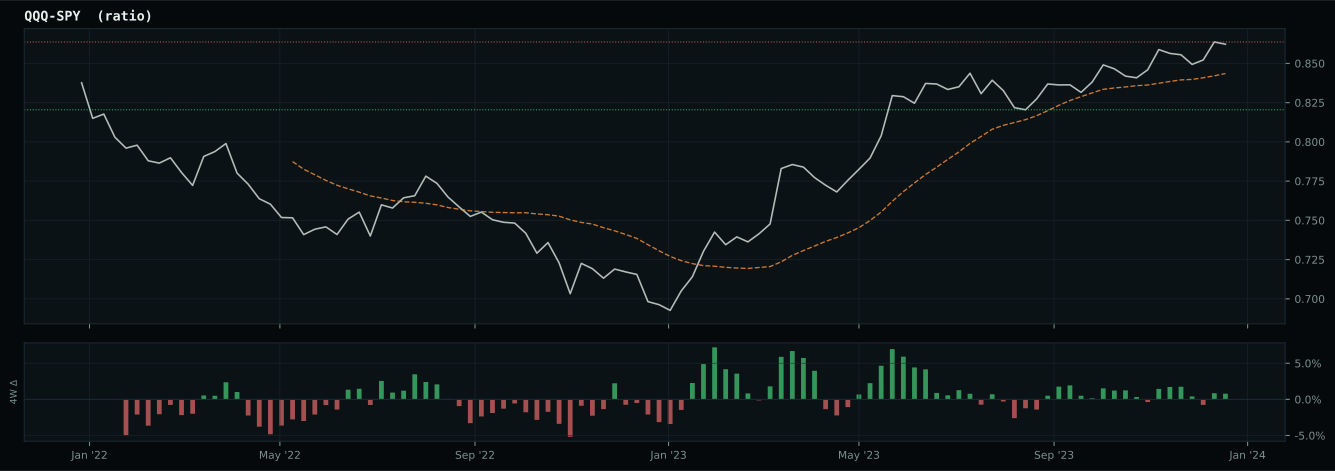
Market-implied signals behind the macro regime scores. Each ratio compares two assets; the direction and slope of the ratio is what the macro engine reads.
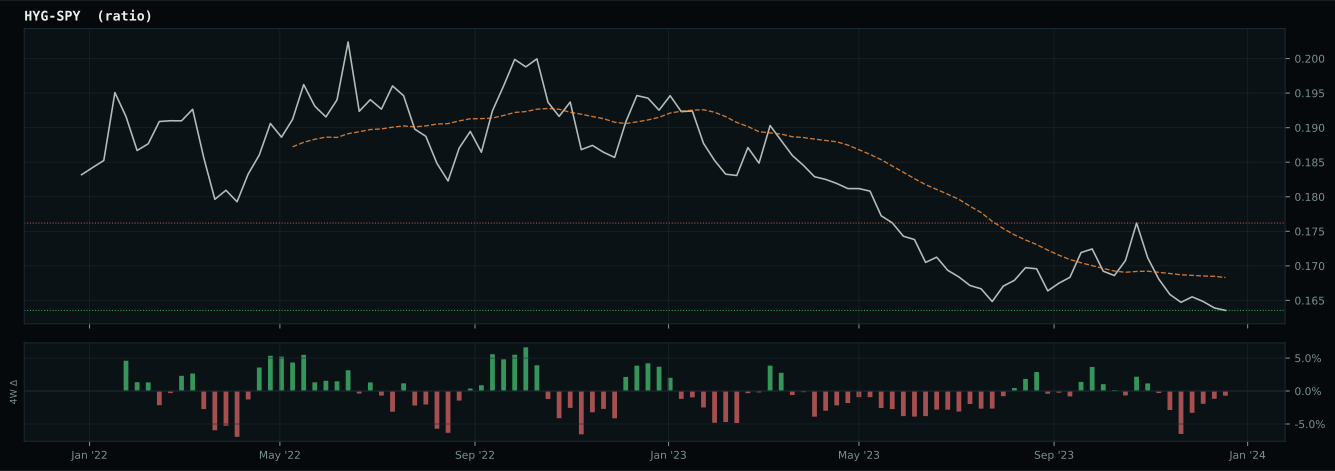
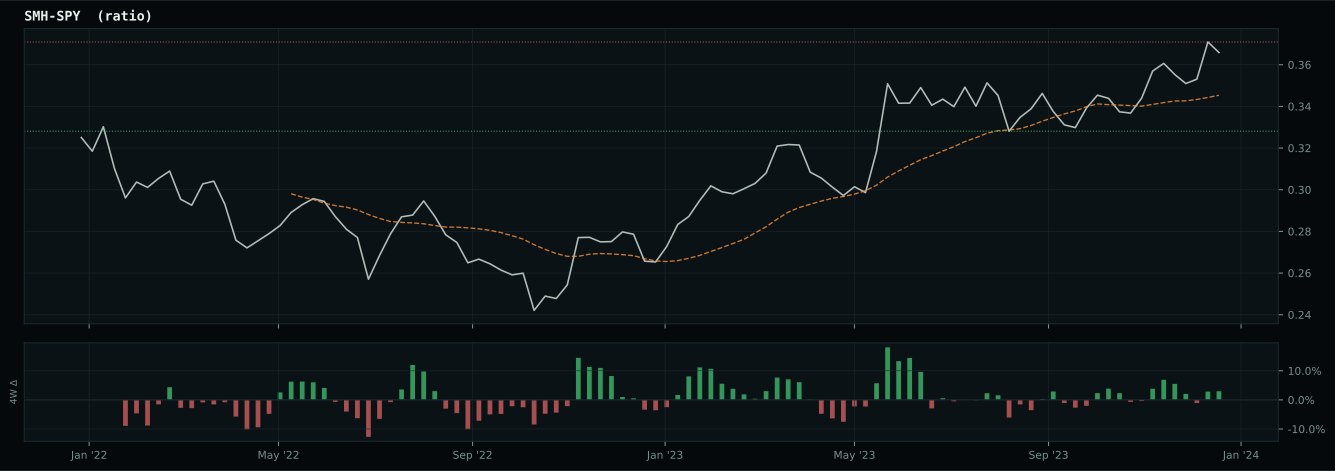
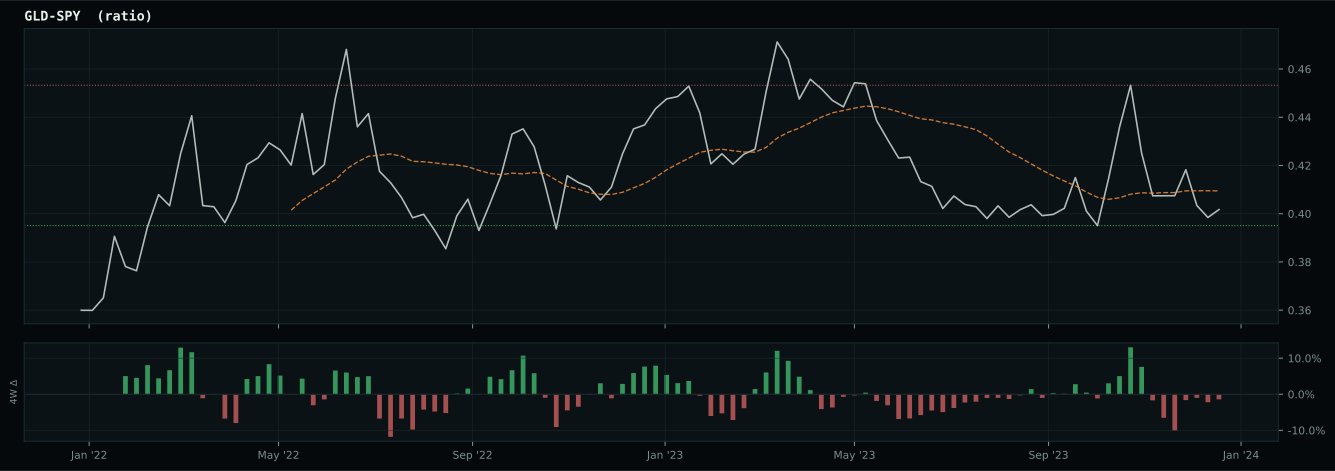
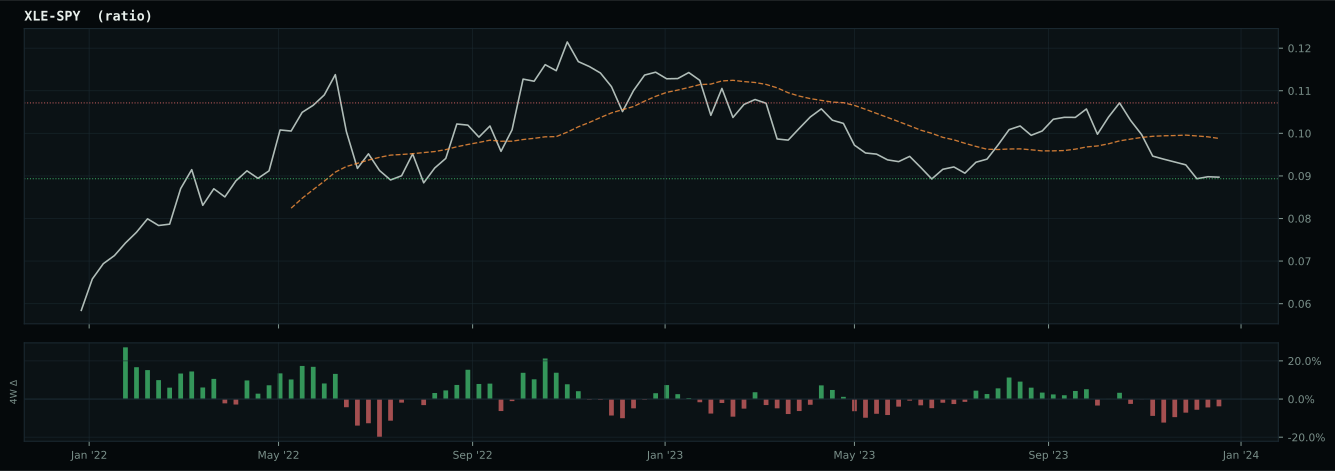
Crypto Regime — TrendBTC
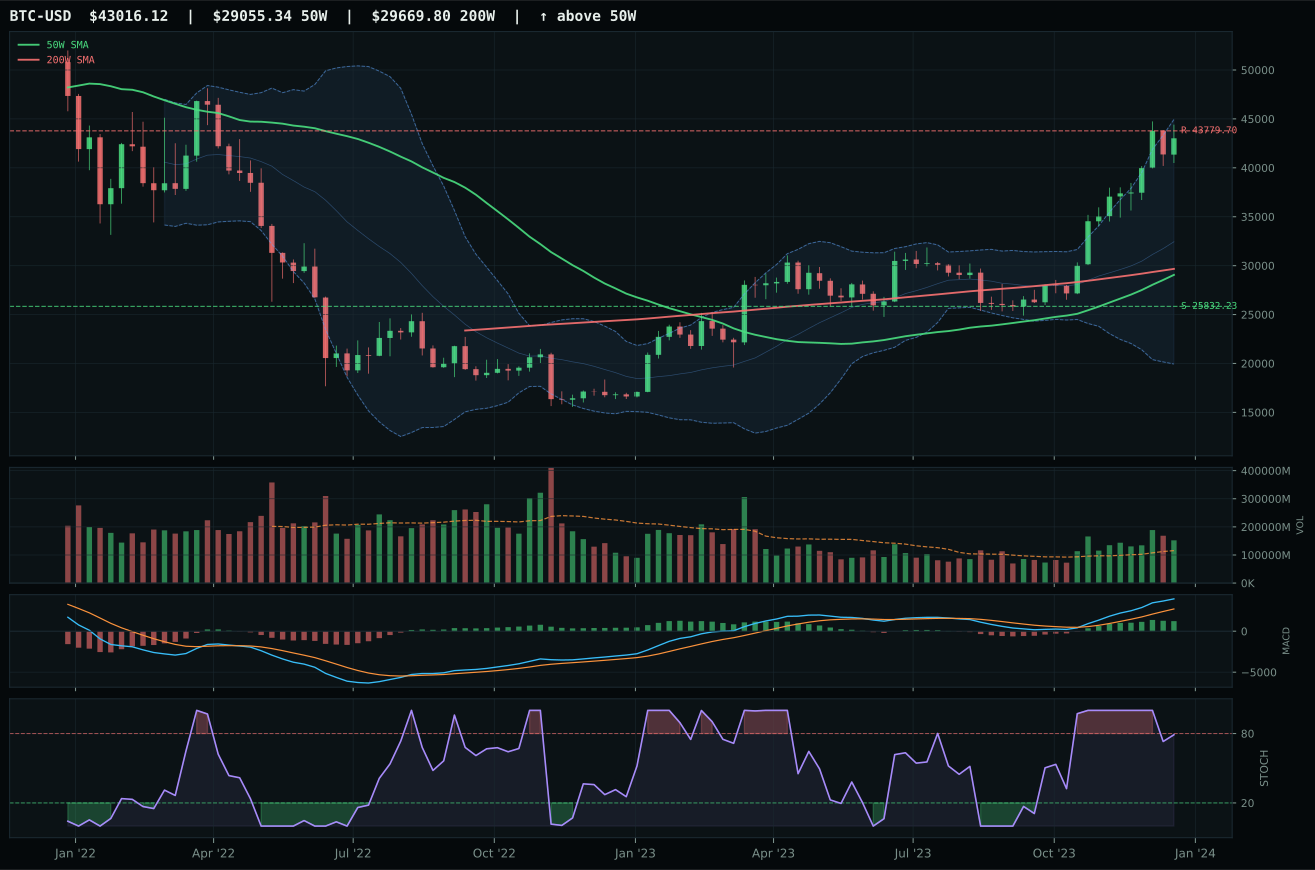
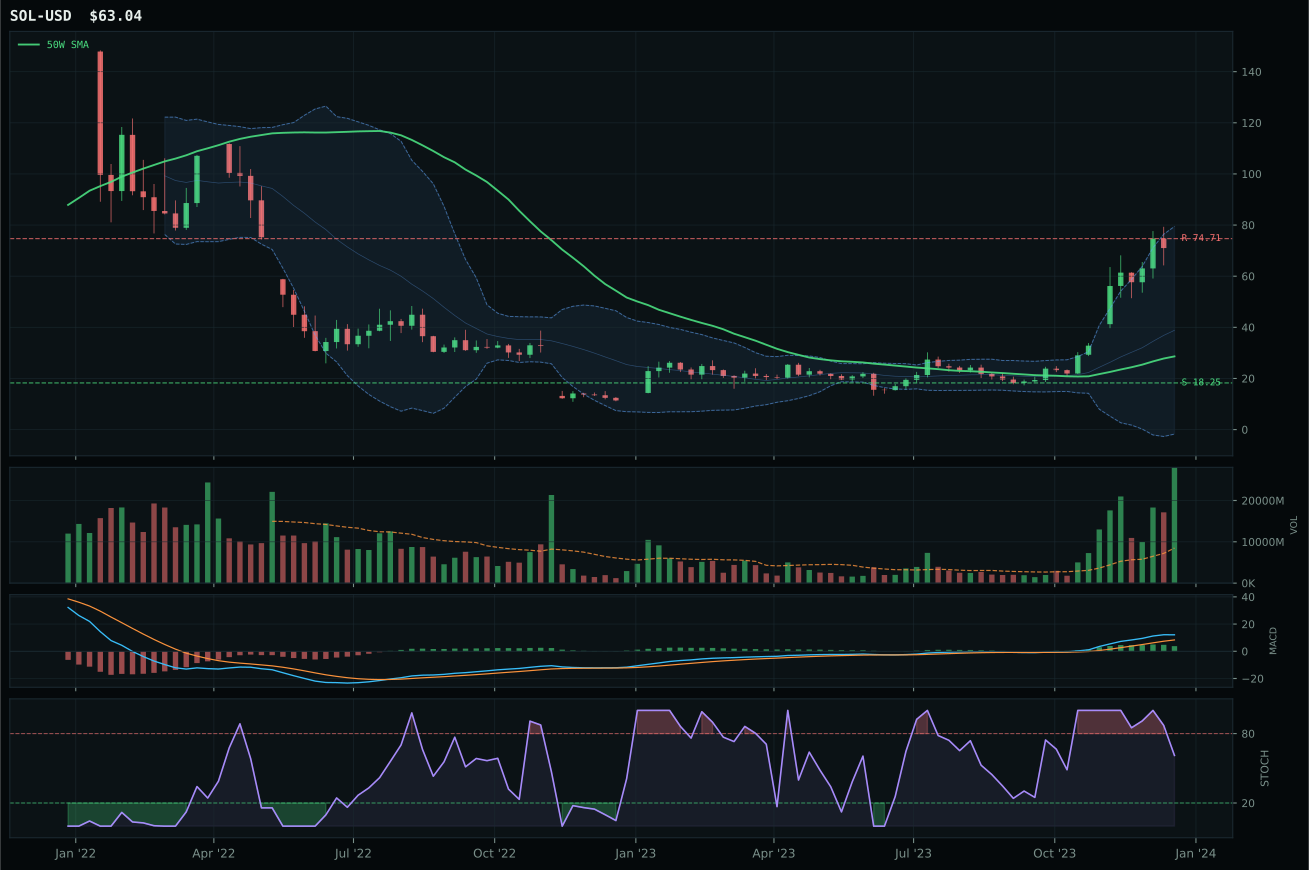
post-touch structure is too wide to count as a range; max/min close ratio is 2.69
TrendBTC confirmed: 2 consecutive closes above rising/flat 50W SMA
one or more available conditions failed
Category Rankings
| Rank | Category | Winner | Score | Alloc | 4W Ret | Peers (4W) |
|---|---|---|---|---|---|---|
| 1 | AI | BOTZ | 71.7 | 20% | +1.72% | AIQ +0.7% · SMH +8.6% |
| 2 | Technology | CIBR | 69.0 | 20% | +4.32% | XLK +4.7% · IGV +3.2% |
| 3 | Precious Metals | GDX | 63.5 | 10% | -13.76% | SLV -9.4% · GLD -2.0% |
| 4 | Defense & Aerospace | XAR | 57.8 | 10% | -4.15% | ITA -3.1% · ROKT -4.8% |
| 5 | Industrial Metals | COPX | 55.4 | 10% | -9.17% | PICK -9.0% · REMX -20.8% |
| 6 | Emerging Markets | INDA | 52.0 | 10% | +2.32% | ILF -5.3% · IEMG -3.9% |
| 7 | Nuclear Energy | URA | 46.1 | 10% | +2.40% | NLR +3.9% · URNM +10.9% |
| 8 | Utilities & Infrastructure | PAVE | 45.6 | 10% | -1.42% | IGF -3.7% · XLU -2.5% |
| 9 | Agriculture & Livestock | WEAT | 7.3 | 0% | -3.92% | VEGI -4.9% · MOO -5.3% |
| 10 | Traditional Energy | FCG | 5.9 | 0% | -8.13% | XLE -6.7% · XOP -8.7% |
AI — BOTZ
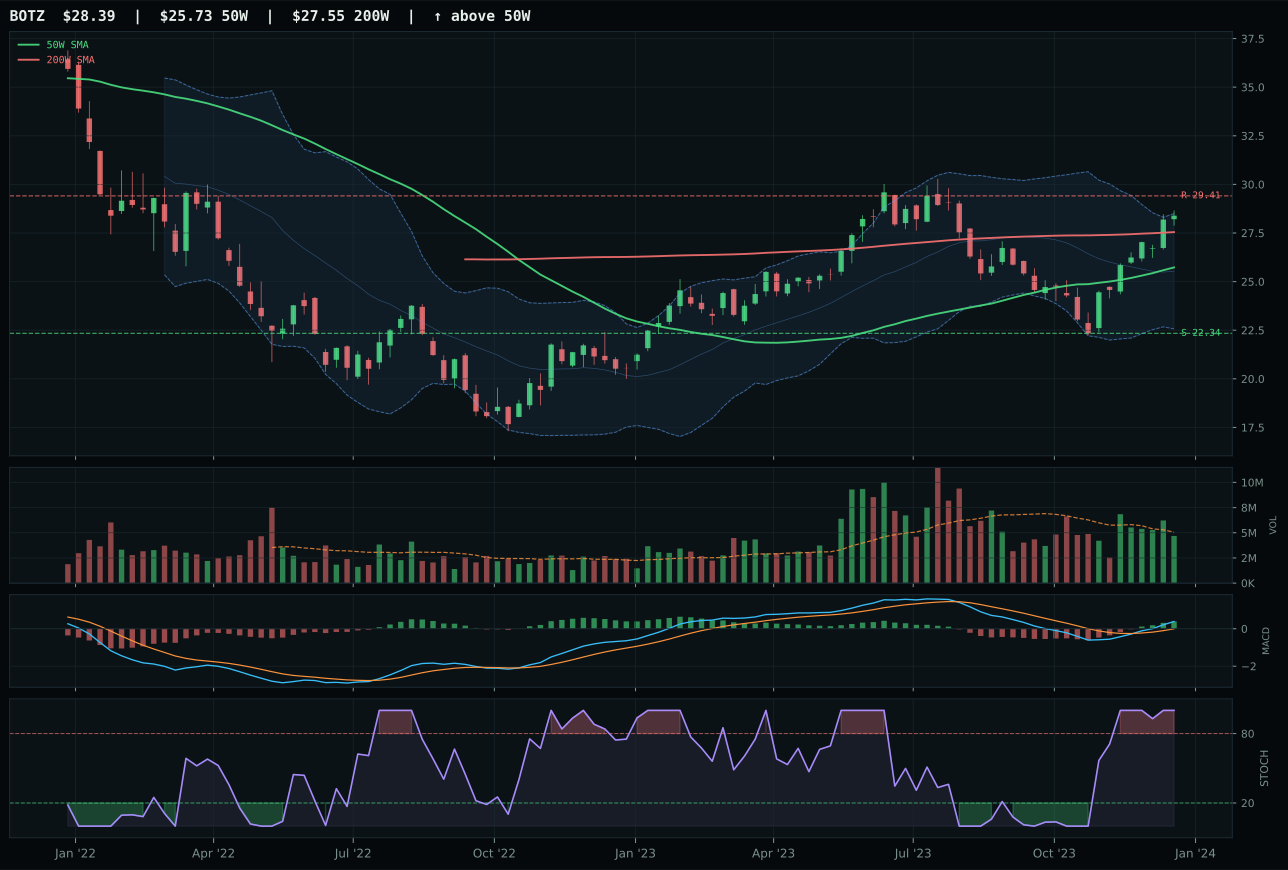
BOTZ has a neutral structure profile with 5.5% 13-week relative strength versus SPY.
A failed hold above support would weaken the setup.
Actionable but governed by invalidation levels.
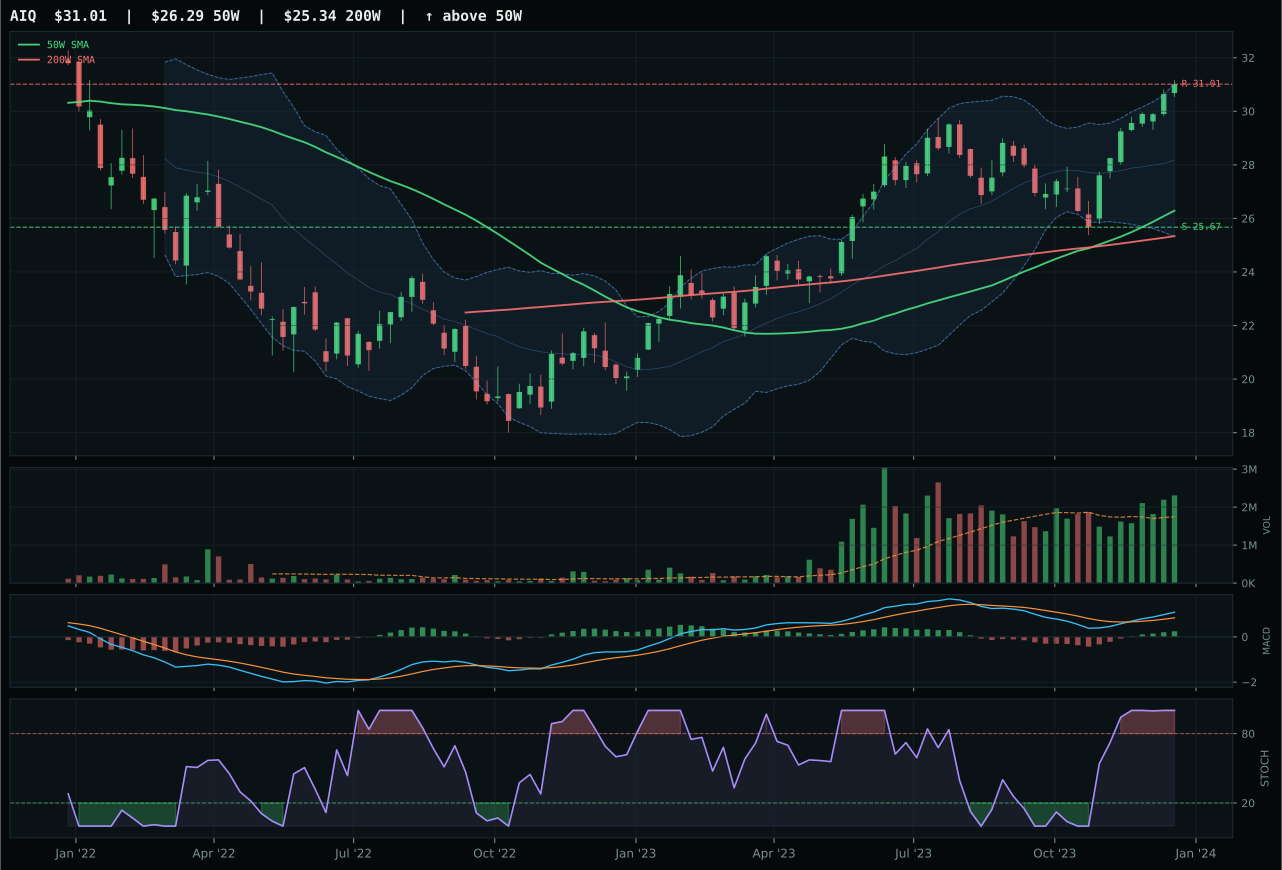
AIQ has a vertical extension profile with 5.0% 13-week relative strength versus SPY.
A failed hold above support would weaken the setup.
Actionable but governed by invalidation levels.
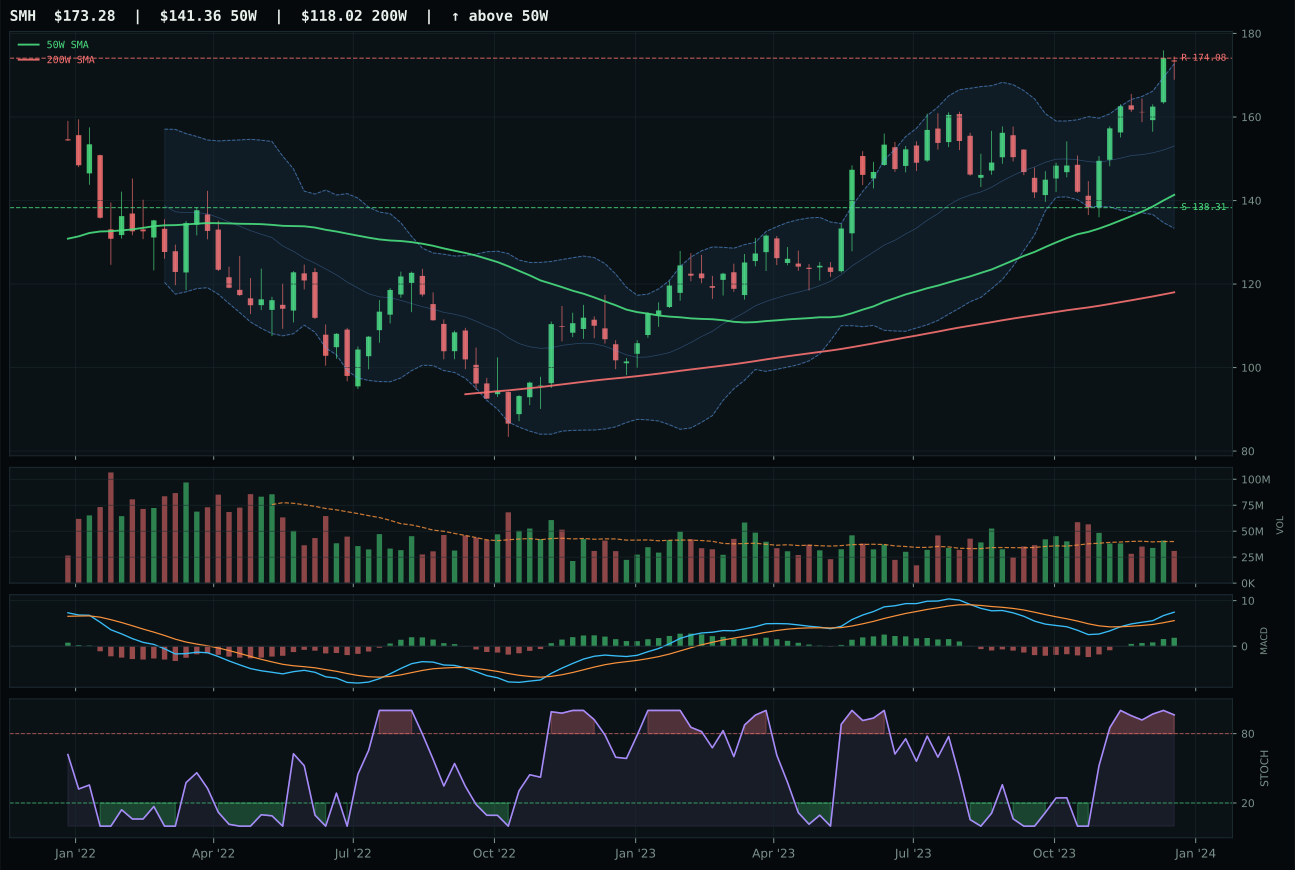
SMH has a vertical extension profile with 12.0% 13-week relative strength versus SPY.
A failed hold above support would weaken the setup.
Actionable but governed by invalidation levels.
BOTZ wins the AI slot decisively over AIQ with a 12.2-point score gap, driven by superior timing and better risk/reward geometry. Its 10.3% distance from the 50-week moving average sits in the upper-retracement sweet spot, whereas AIQ stretched 18.0% away from its anchor, creating an asymmetric risk profile that hurts even though AIQ's macro narrative is stronger. BOTZ's neutral structure with 67.0 timing score beats AIQ's vertical extension and 37.0 timing by a wide margin; the robotics and physical AI cyclicality theme allows buyers to accumulate without fighting vertical extension resistance. Both carry bullish MACD and overbought stochastic RSI, but BOTZ's neutral volume at 0.93x the 20-week average provides less distribution risk than AIQ's above-average participation. The thirteen-week return spread of only 40 basis points (15.5% vs 15.1%) is immaterial, but the entry architecture matters deeply when macro uncertainty dominates.
AI secured the second top-2 overweight slot at 10% on the strength of a 71.7 final category score, making it the second-highest eligible category this week. BOTZ's 83.7 technical evidence score is exceptional, and that muscular reading overpowers the category's macro tailwind, which AI growth sponsorship at plus-14 and risk appetite at plus-10 nearly offset by liquidity stress at minus-12. The macro fit of 59.0/100 is above-average for the current regime, but the real decision rests on technical leadership and persistence. Robotics as a theme offers steadier volume confirmation and less hype-driven distribution than pure AI software, which matters when the allocator has only two top slots and must choose between extended setups (both at overbought extremes). The 62/38 technical-to-macro weighting means the category can hold allocation despite tighter entry risk if the technical case remains compelling, and BOTZ's neutral structure provides that floor.
Technology — CIBR
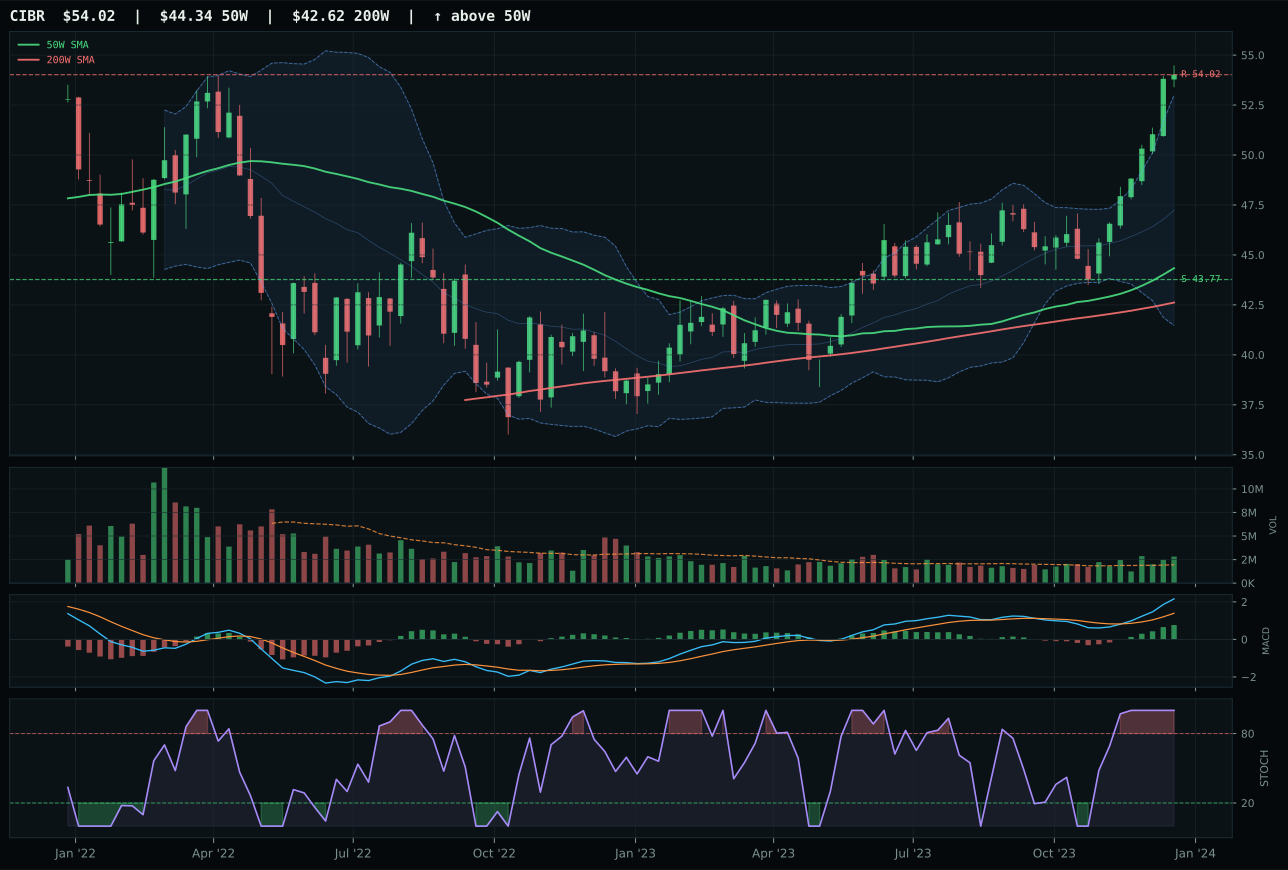
CIBR has a vertical extension profile with 9.0% 13-week relative strength versus SPY.
A failed hold above support would weaken the setup.
Actionable but governed by invalidation levels.
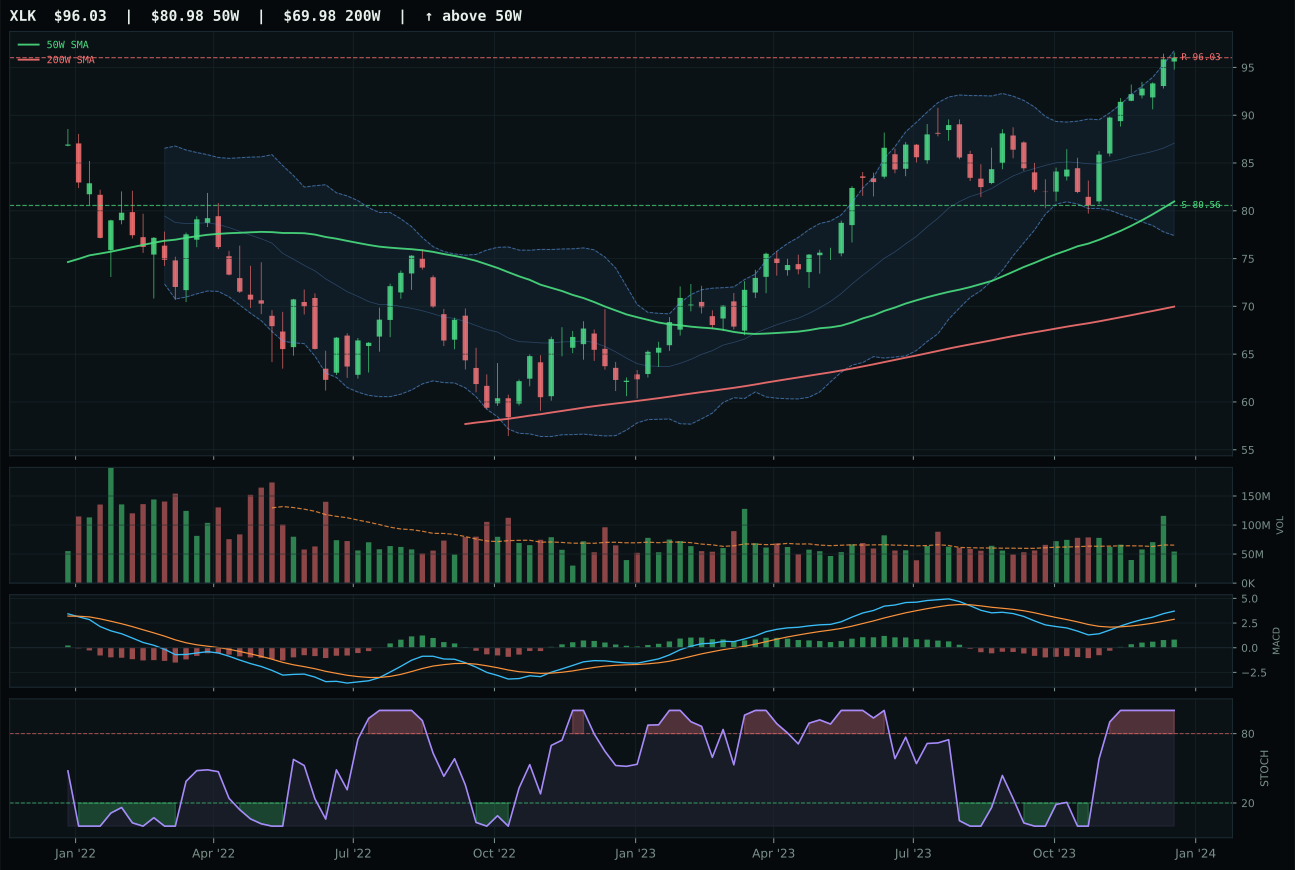
XLK has a vertical extension profile with 6.8% 13-week relative strength versus SPY.
A failed hold above support would weaken the setup.
Actionable but governed by invalidation levels.
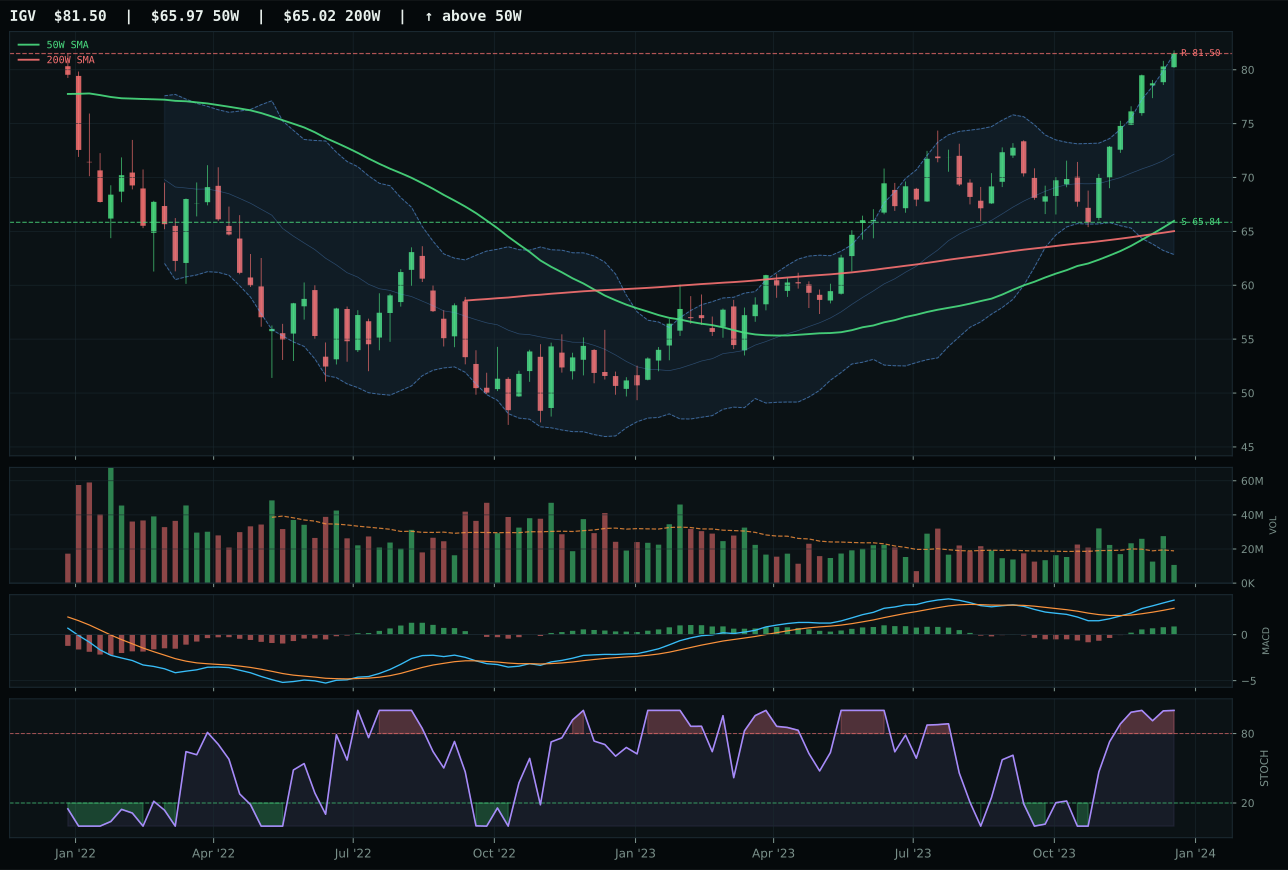
IGV has a vertical extension profile with 9.6% 13-week relative strength versus SPY.
A failed hold above support would weaken the setup.
Actionable but governed by invalidation levels.
CIBR captures the Technology slot by combining near-perfect trend confirmation with the cleanest structural setup among its peers. Price sits 21.8% above the 50-week moving average with above-average volume participation at 1.45x the 20-week average, meaning institutional buyers are actively defending this extended level rather than distributing into strength. XLK, the runner-up, delivered only neutral volume confirmation and lagged 2.2% in category-relative strength, a meaningful gap when entry risk is this visible. The setup is vertical extension into Fibonacci 0.236 territory near the 52-week high, with MACD bullish and improving and stochastic RSI at overbought extremes—this is not a quiet accumulation but rather a late-stage chase that only works if volume keeps flowing. CIBR's 19.0% thirteen-week return and 9.0% advantage versus SPY justify the allocation despite the timing penalty, because cybersecurity as a subtheme has tighter insider participation and less distributed selling pressure than the broader profitable technology leadership that XLK represents.
Technology earned the top-2 overweight at 10% because its 69.0 category score ranked among the two highest eligible final scores, and CIBR's technical evidence of 85.5/100 overpowered a neutral macro environment. Disinflation pressure helps the category modestly at plus-7, but that strength is partially offset by active liquidity stress at minus-10, leaving the macro fit at 60.0/100—respectable but not the driver. The real thesis is technical: cybersecurity benefits from credit stress acceleration and risk-appetite swings, both currently active. The allocator is leaning on trend and volume-price sponsorship rather than waiting for macro tailwinds to confirm, because the setup is clean enough and the category's 62% technical weighting versus 38% macro means momentum can override a flat narrative. The decision reflects confidence that extended setups with confirmed institutional participation hold better in disinflation than mean-reversion traps do.
Precious Metals — GDX
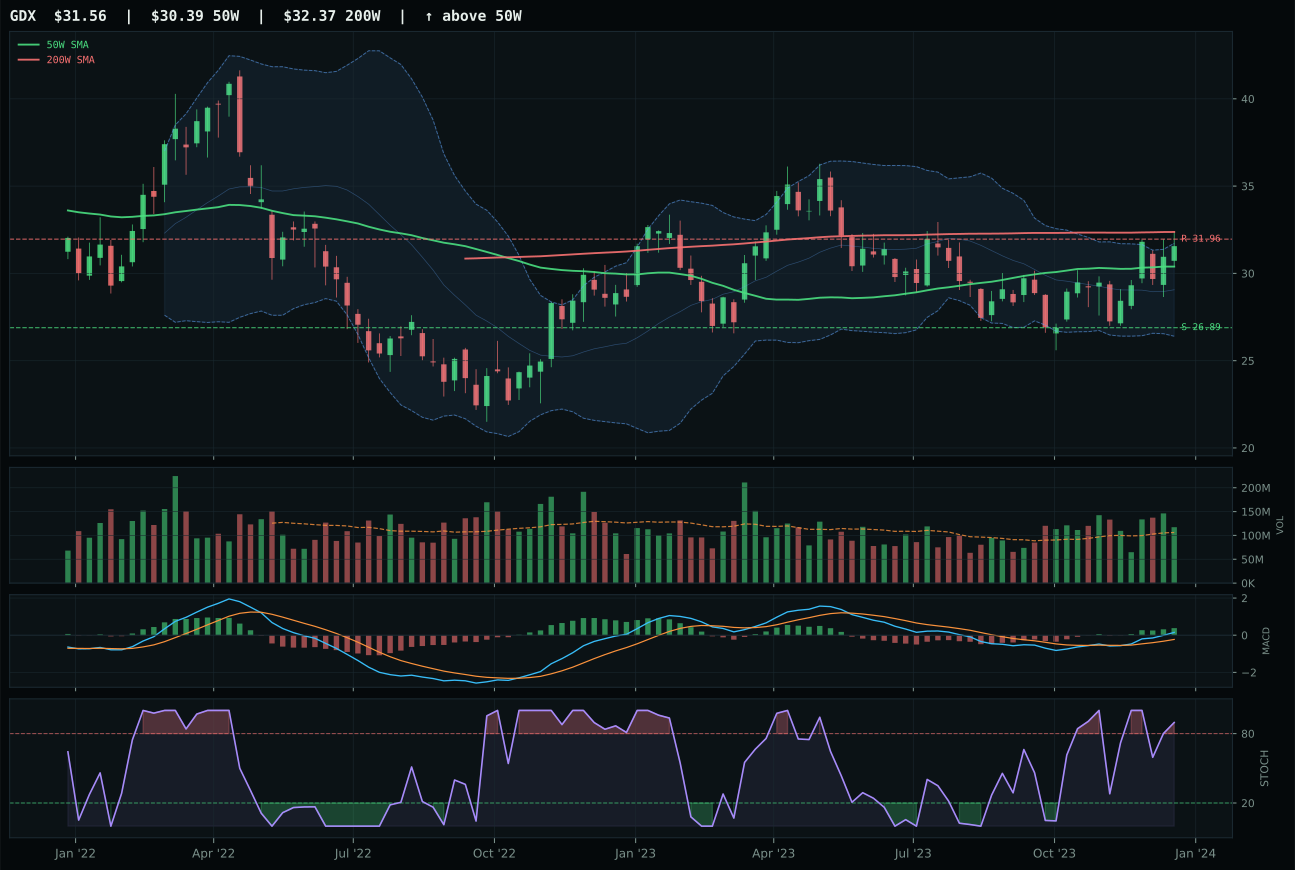
GDX has a neutral structure profile with -0.7% 13-week relative strength versus SPY.
A failed hold above support would weaken the setup.
Actionable but governed by invalidation levels.
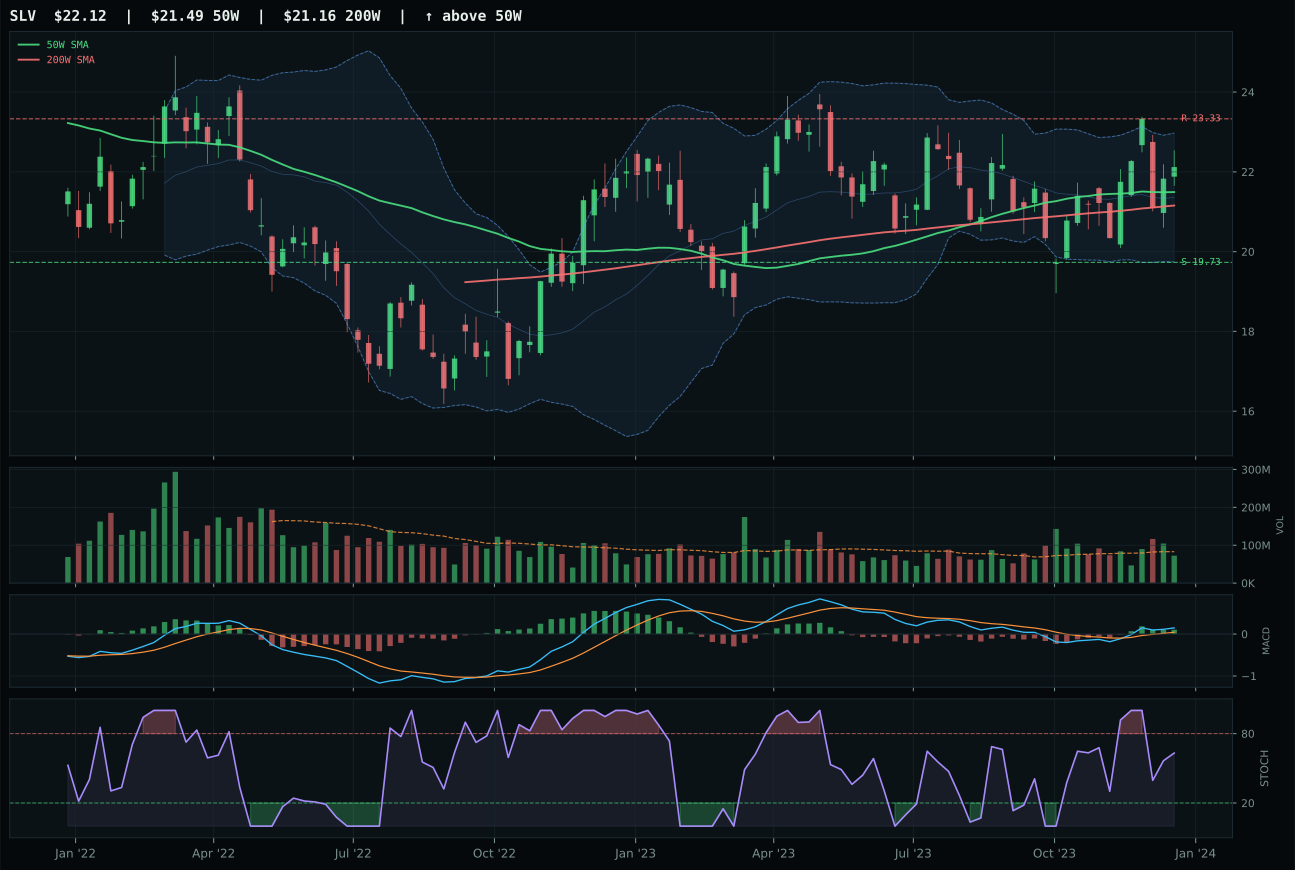
SLV has a compression near 50W profile with -7.5% 13-week relative strength versus SPY.
A failed hold above support would weaken the setup.
Actionable but governed by invalidation levels.
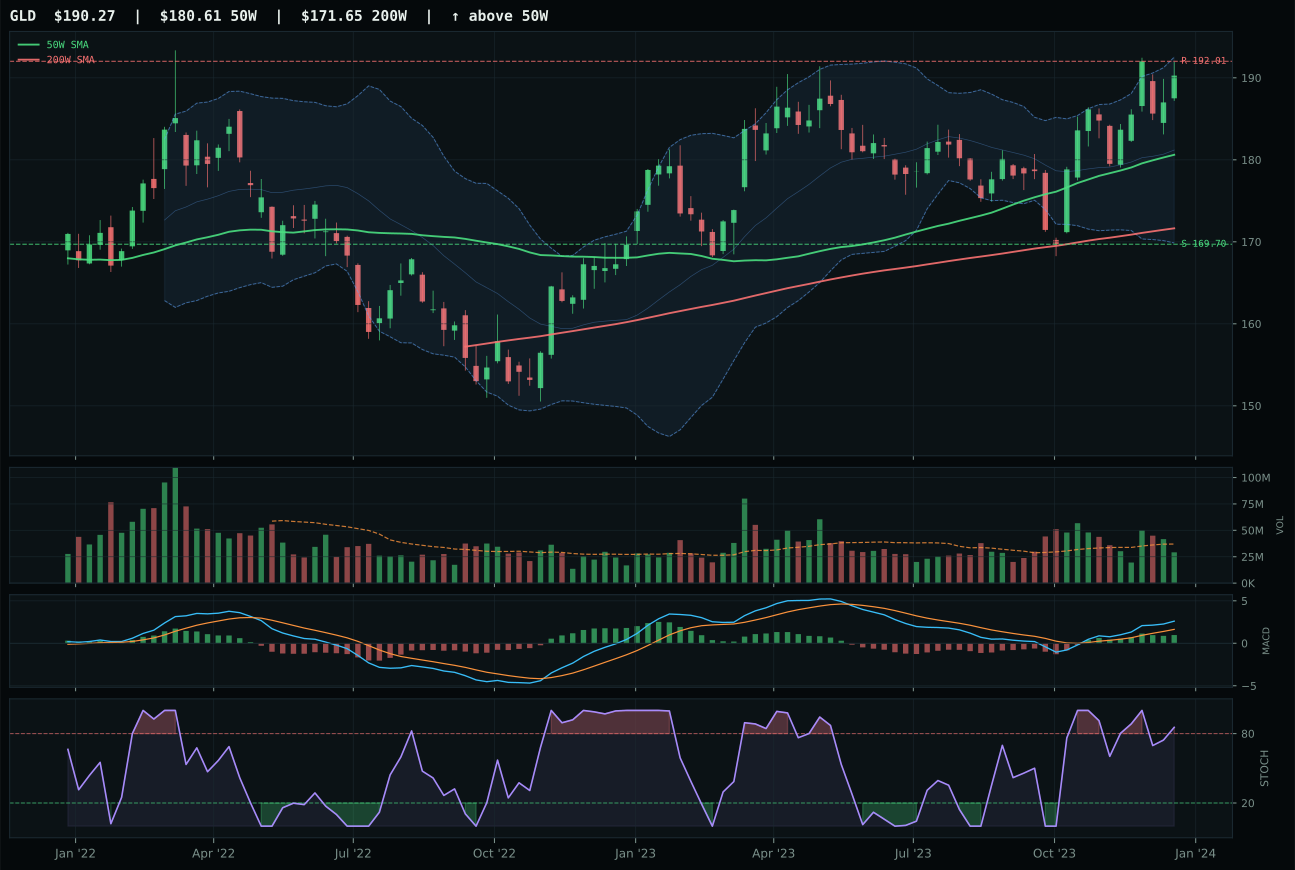
GLD has a neutral structure profile with -3.5% 13-week relative strength versus SPY.
A failed hold above support would weaken the setup.
Actionable but governed by invalidation levels.
GDX captures Precious Metals despite the unusual situation of a runner-up (SLV) with a higher reasoned individual score of 64.9 versus 63.7, a reversal explained by GDX's stronger volume confirmation and superior category-relative strength. Price sits only 3.8% from the 50-week anchor in the decision zone near Fibonacci 0.382, with above-average participation at 1.10x the 20-week average, while SLV trades neutral on volume with falling stochastic RSI. Both show bullish MACD, but GDX's overbought reading rolls over while confirming; SLV's falls through neutral, signaling potential distribution. The thirteen-week return gap widens to 690 basis points in GDX's favor (9.3% vs 2.5%), and the 2.8% category-relative strength versus SLV's minus-4.0% establishes clear momentum dominance. Gold miners as leveraged monetary exposure benefit from liquidity stress and credit concerns in ways pure silver's hybrid industrial/monetary beta cannot match in this environment.
Precious Metals earned 5% in the tier-2 sleeve because it ranked seventh overall, below both top-2 categories and several stronger tier-2 competitors. The 63.5 final score reflects GDX's solid 69.6 technical evidence paired with weak macro fit at 38.0/100—no meaningful category tailwinds in disinflation, despite active metals scarcity support. Risk appetite positive is currently active at plus-4, but liquidity stress at minus-9 and credit stress at minus-7 create headwinds that prevent upside momentum. The category holds allocation because GDX's volume confirmation and momentum profile remain above-average relative to other tier-2 options, and the technical setup is clean enough to warrant exposure. However, the tier-2 placement reflects reality: precious metals lack the macro traction and technical extension of top categories. This is a position held for diversification and tail-risk positioning rather than for growth, and the allocator would rotate to higher-conviction slots if either Technology or AI showed further deterioration.
Defense & Aerospace — XAR
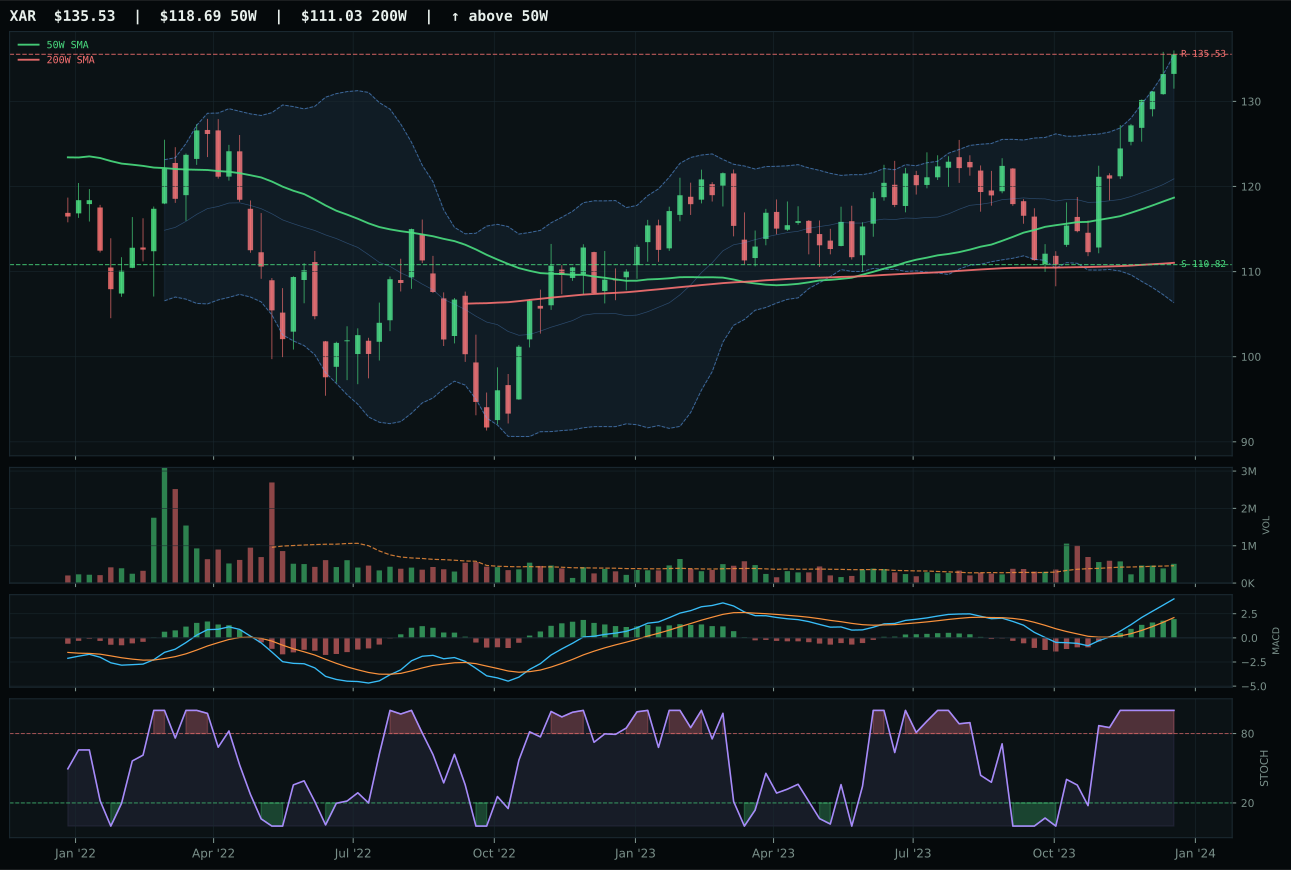
XAR has a neutral structure profile with 11.7% 13-week relative strength versus SPY.
A failed hold above support would weaken the setup.
Actionable but governed by invalidation levels.
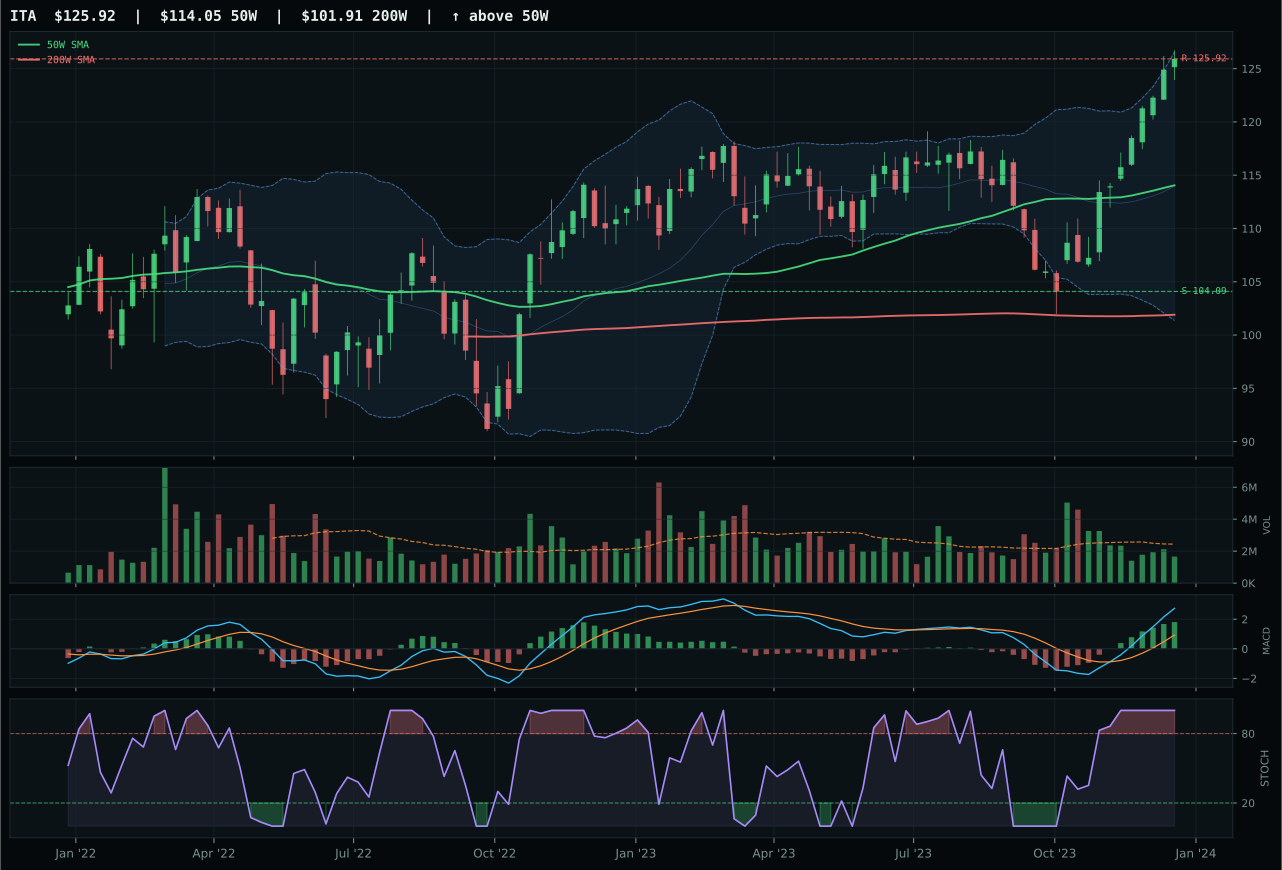
ITA has a neutral structure profile with 8.6% 13-week relative strength versus SPY.
A failed hold above support would weaken the setup.
Actionable but governed by invalidation levels.
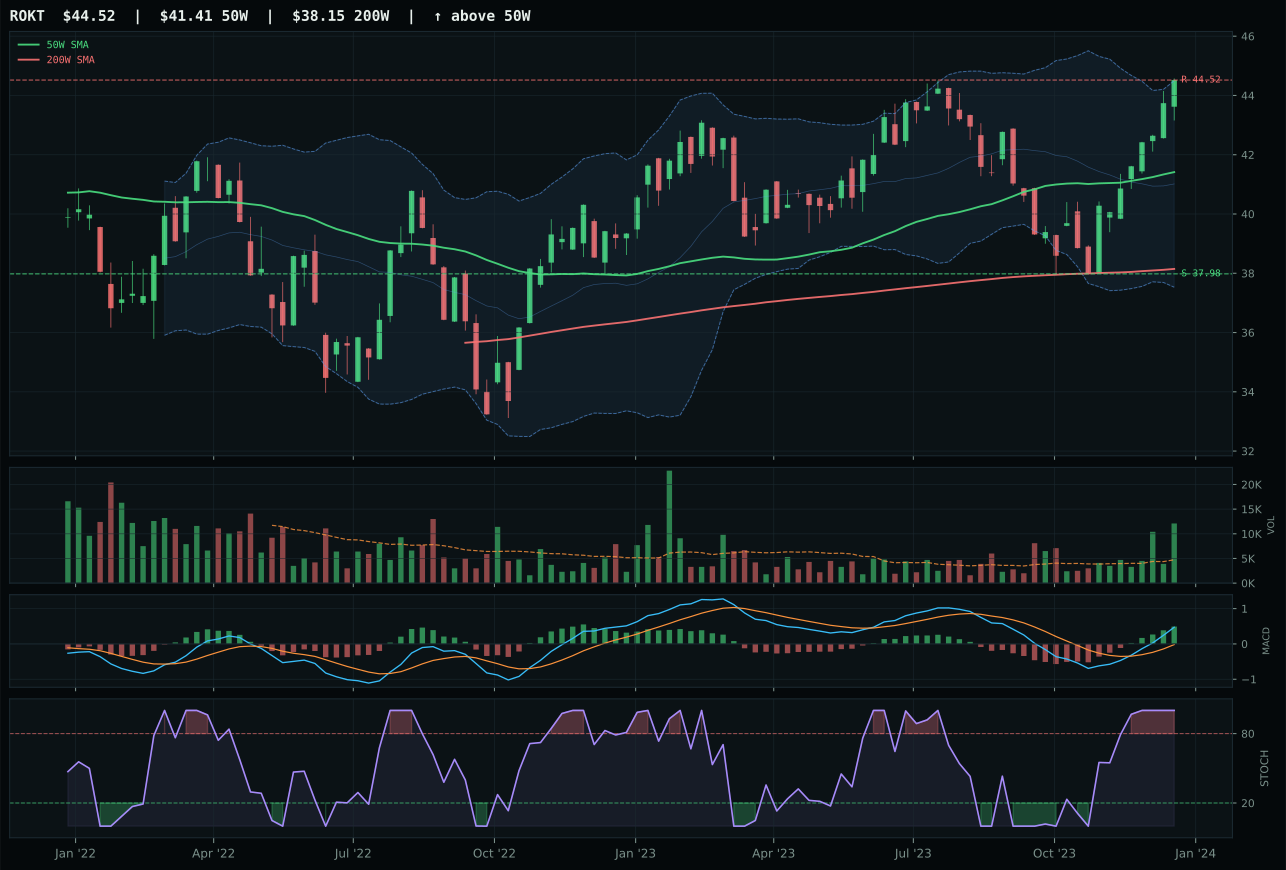
ROKT has a neutral structure profile with 3.2% 13-week relative strength versus SPY.
A failed hold above support would weaken the setup.
Tracked, but not top-2 eligible because: .
XAR wins Defense & Aerospace with a negligible 0.2-point margin over ITA, a result that underscores how close this category decision truly is. XAR's advantage rests entirely on superior volume confirmation (above-average participation at 1.11x the 20-week average versus ITA's thin participation) and a 3.1% category-relative strength edge that ITA cannot match. Both show identical trend scores of 100.0 and timing at 59.0, with neutral structures and bullish MACD, but the sponsorship matters: XAR is being accumulated with conviction, ITA is being left behind. The twenty-one-point thirteen-week return leads (21.7% vs 18.6%) and the 11.7% SPY-relative strength tell you XAR has better institutional bid, even though the fundamental thesis—defense-prime cyclicality—applies equally to both. This is a tier-two category win, not a compelling overweight, precisely because ITA's setup is equally sound and the margin is within noise.
Defense & Aerospace allocated to 5% because it ranked sixth overall among ten categories, landing in the tier-2 band that receives 5% in standard allocation. The 57.8 final score reflects mixed technical evidence (91.6/100 for XAR specifically) paired with neutral macro fit at 51.0/100—no tailwind and no headwind. Disinflation and credit stress both support defense spending, but liquidity stress at minus-4 and the absence of category-specific descriptor profiles create drag. The allocator holds this exposure because XAR's volume confirmation and momentum remain respectable and the category hasn't deteriorated enough to drop to zero, but there is no case for top-2 status when Technology at 69.0 and AI at 71.7 offer cleaner entries. This is a hold position: sufficient conviction to stay invested, insufficient conviction to overweight ahead of categories with better timing and macro alignment.
Industrial Metals — COPX
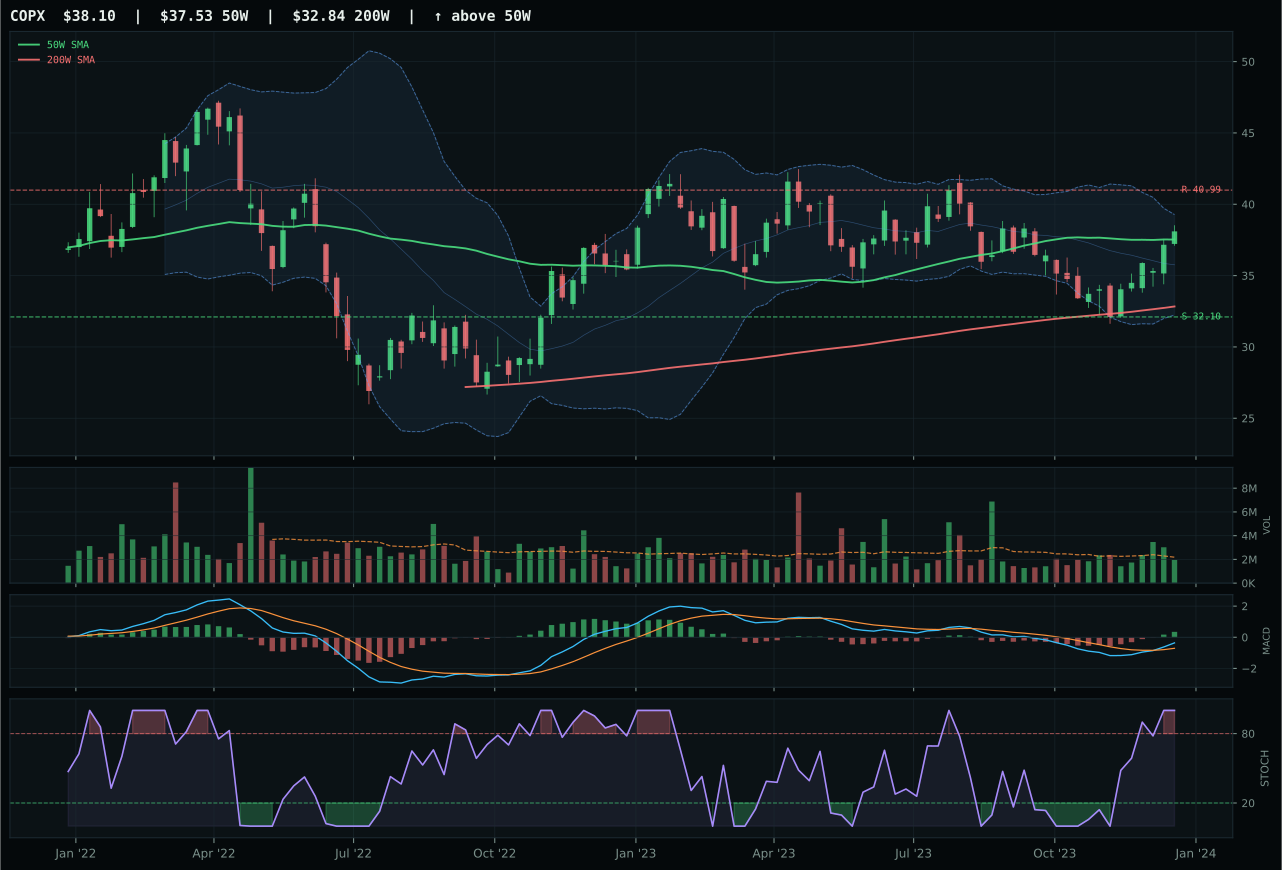
COPX has a compression near 50W profile with -5.5% 13-week relative strength versus SPY.
A failed hold above support would weaken the setup.
Actionable but governed by invalidation levels.
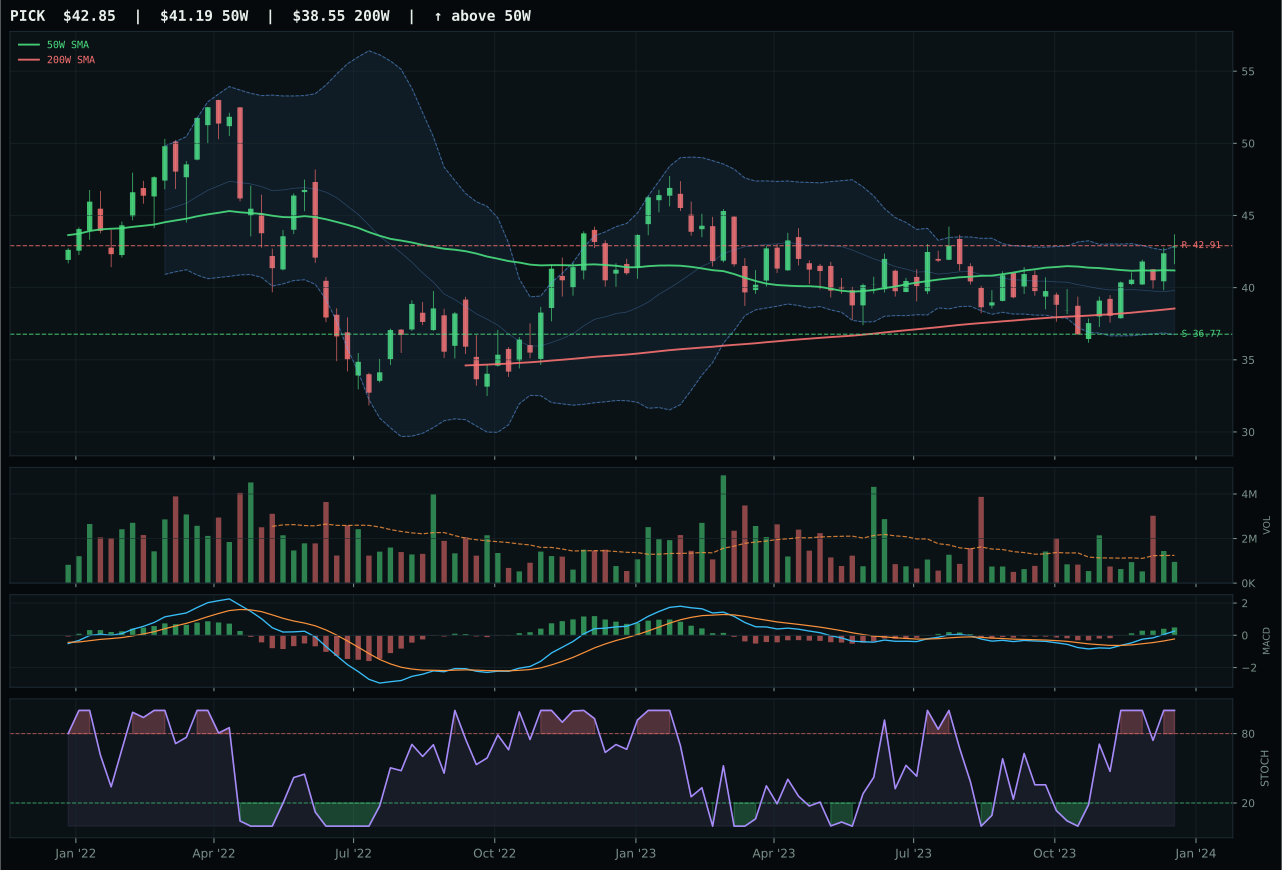
PICK has a neutral structure profile with -2.3% 13-week relative strength versus SPY.
A failed hold above support would weaken the setup.
Actionable but governed by invalidation levels.
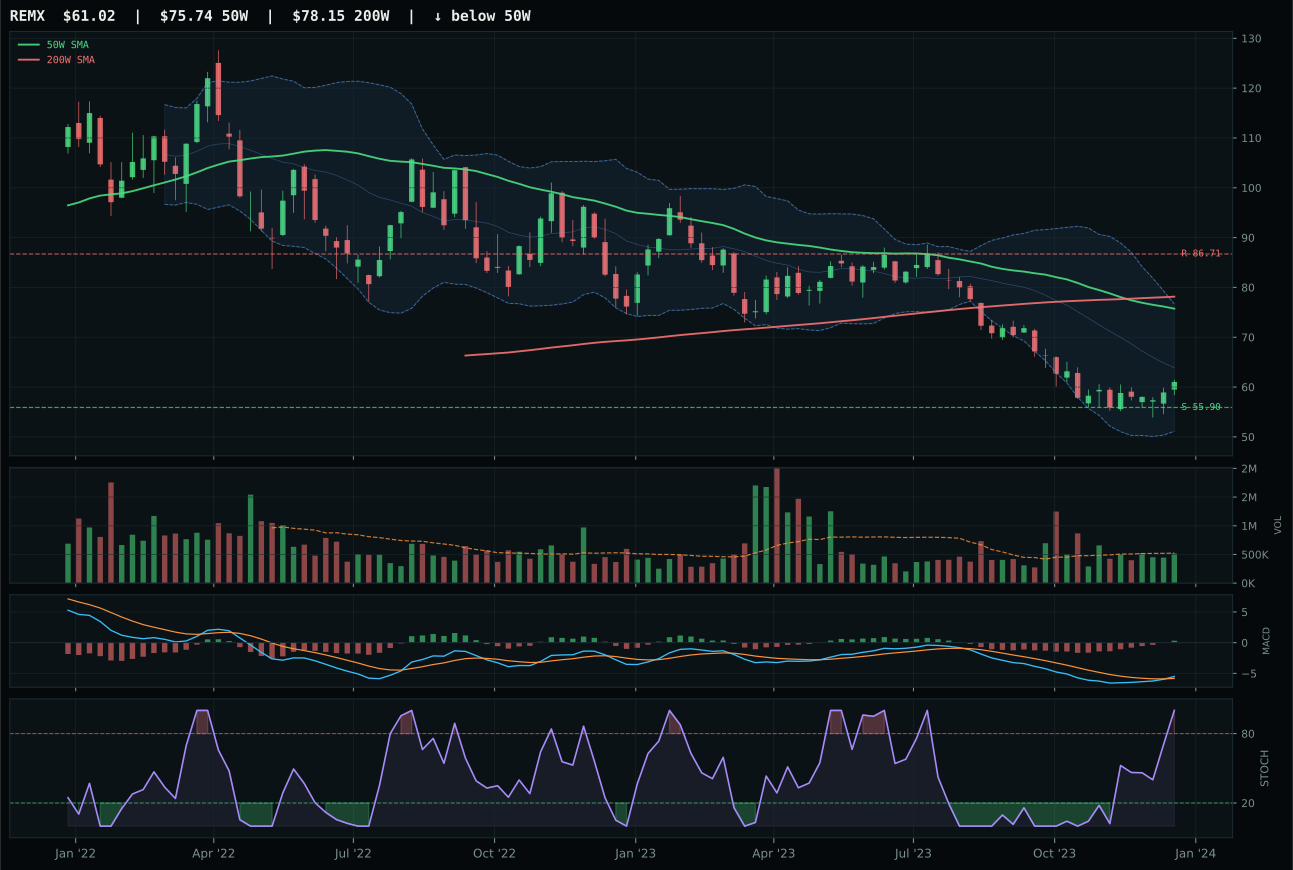
REMX has a neutral structure profile with -19.2% 13-week relative strength versus SPY.
Extension and support failure are the main tactical risks.
Tracked, but not top-2 eligible because: structurally broken.
COPX wins Industrial Metals with a clear 4.1-point margin over PICK, primarily due to superior timing at 100.0 versus 97.0—price sits precisely 1.5% from the 50-week moving average in the decision zone, creating optimal expansion potential. Both show bullish MACD and overbought stochastic RSI, but COPX's compression near the 50-week anchor provides asymmetric upside leverage if buyers defend, whereas PICK's neutral structure lacks that coiled setup. The risk/reward advantage (59.8% vs 53.1%) favors COPX because the compression creates a lower-risk entry for additive positions. While PICK's thirteen-week return of 7.8% trails COPX's 4.5%, the opposite relative strength (PICK at minus-2.3% vs COPX at minus-5.5% to SPY) would normally favor PICK, but timing dominance and macro fit (62.0% for COPX vs 59.0% for PICK) shift the decision to the tighter setup. Copper's scarcity sponsorship and industrial demand theme benefits from higher macro score than diversified mining breadth.
Industrial Metals allocated to 5% in tier-2 because it scored 55.4, ranking eighth overall and qualifying for the standard 5% sleeve in a normal week. The category's macro fit of 65.0/100 is the strongest among tier-2 positions, driven by active metals scarcity at plus-14 and commodity breadth positive at plus-10—real asset sponsorship at plus-6 provides additional support. Liquidity stress at minus-8 and credit stress at minus-7 moderate the macro tailwind but do not overwhelm it. COPX's technical evidence of 75.1/100 provides a solid floor, though not exceptional. The allocator maintains this position because the macro support is genuine and the technical setup is improving: compression near the 50-week moving average with bullish MACD suggests accumulation rather than distribution. Industrial metals lag top-2 categories in both macro fit and technical clarity, but they offer genuine diversification and real-world demand leverage that justifies tier-2 weighting.
Emerging Markets — INDA
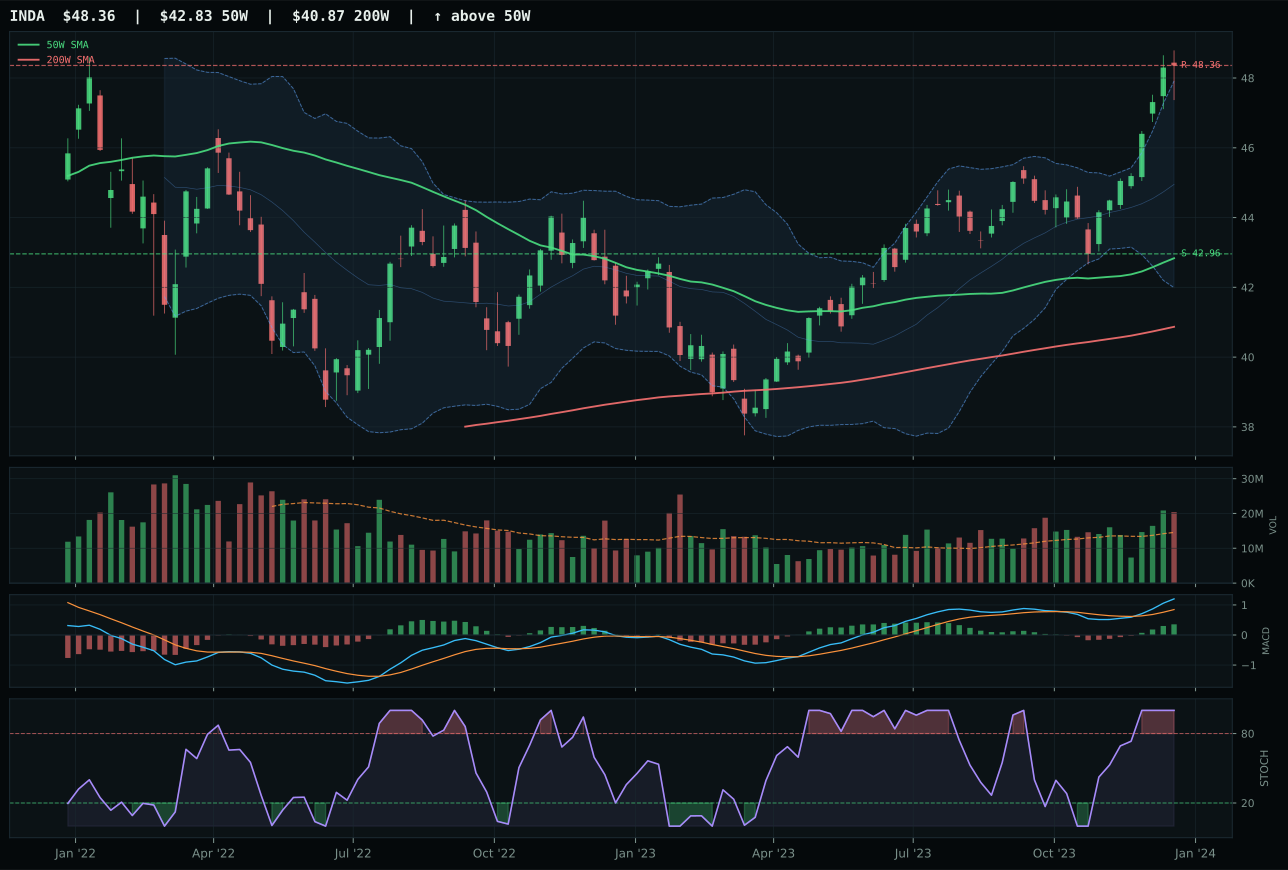
INDA has a neutral structure profile with -1.3% 13-week relative strength versus SPY.
A failed hold above support would weaken the setup.
Actionable but governed by invalidation levels.
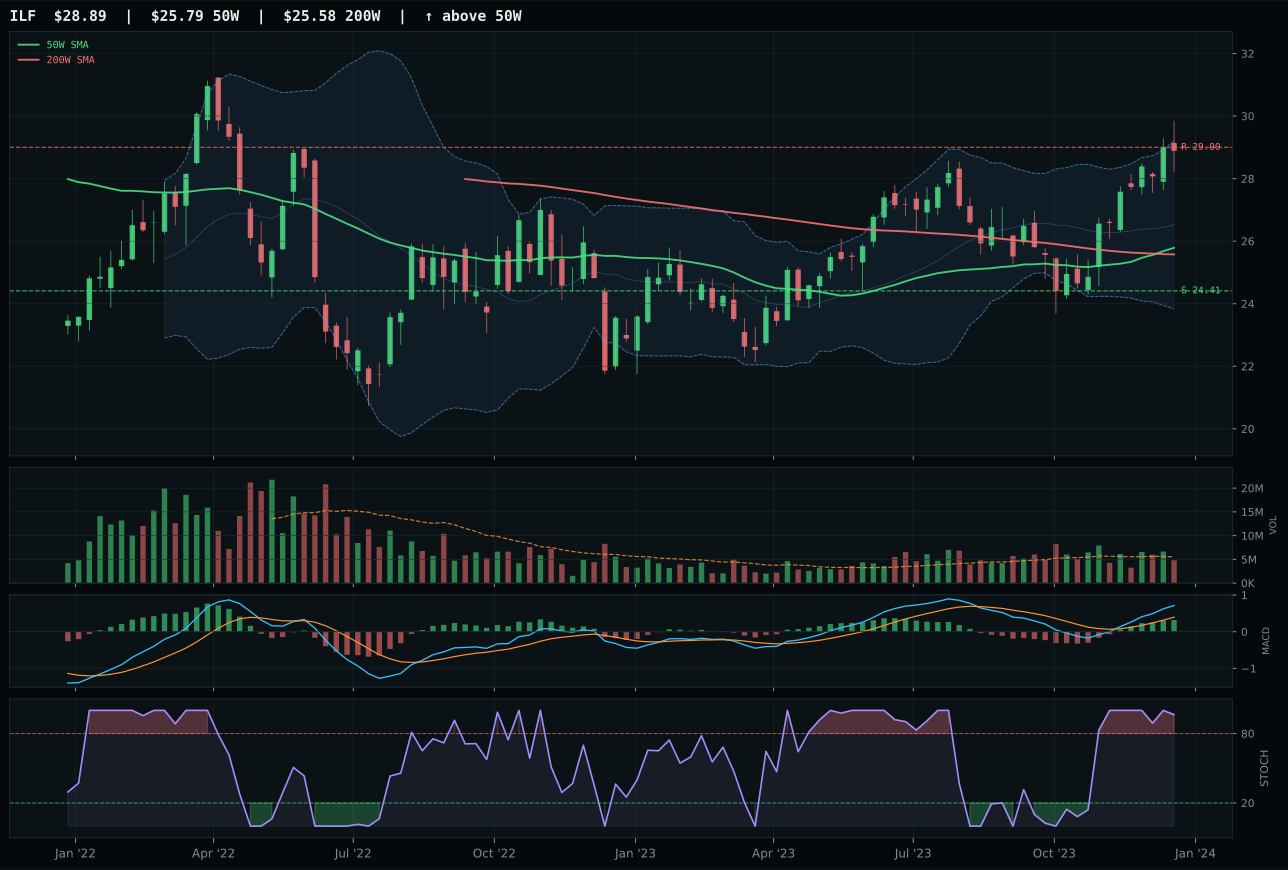
ILF has a neutral structure profile with 1.9% 13-week relative strength versus SPY.
A failed hold above support would weaken the setup.
Actionable but governed by invalidation levels.
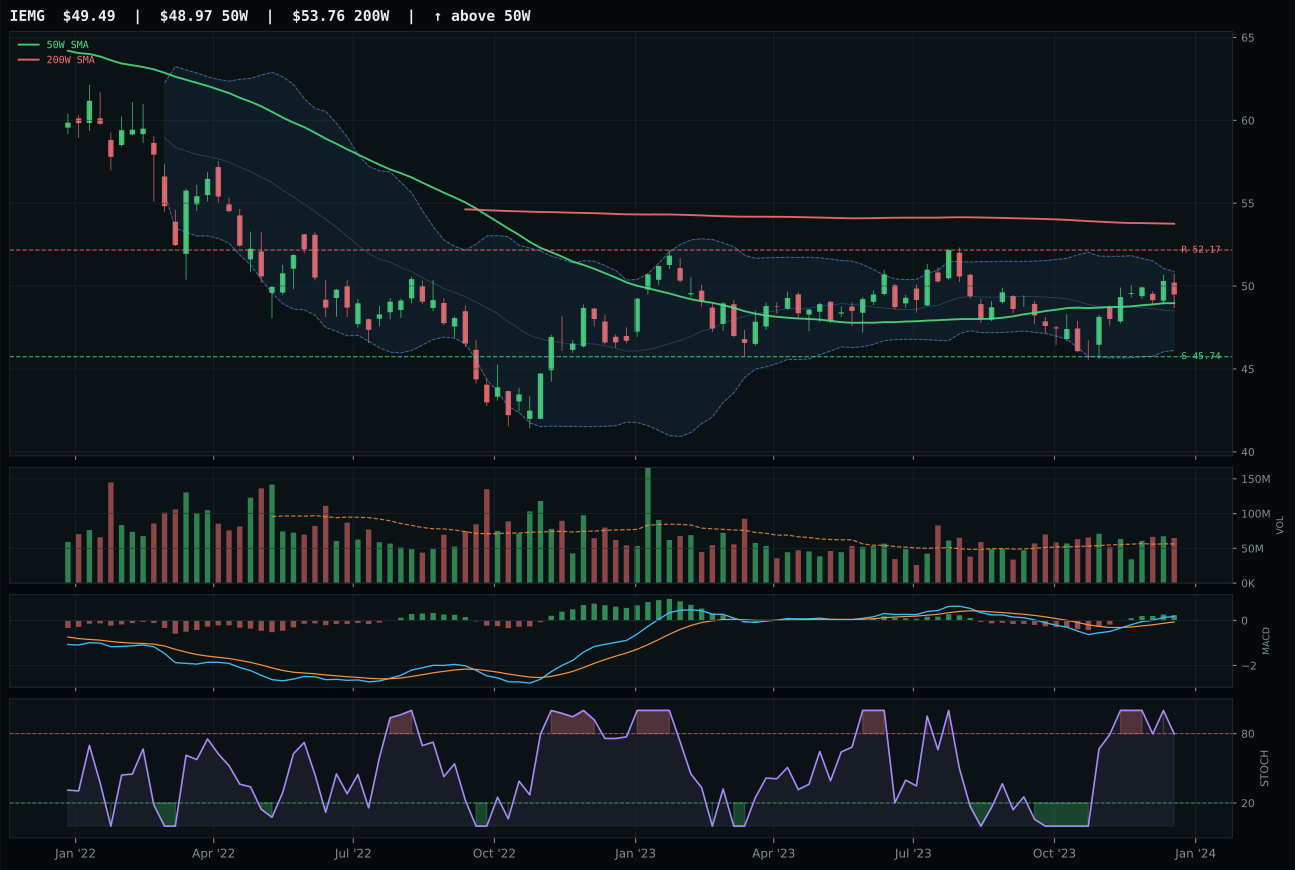
IEMG has a compression near 50W profile with -7.4% 13-week relative strength versus SPY.
A failed hold above support would weaken the setup.
Actionable but governed by invalidation levels.
INDA captures Emerging Markets with a 4.4-point margin over ILF, driven by superior timing and cleaner structure despite equivalent trend strength. Price rises 12.9% above the 50-week moving average in the upper-retracement zone near Fibonacci 0.236, with above-average volume participation at 1.40x the 20-week average—institutional buying is active. ILF's timing of 57.0 versus INDA's 59.0 appears narrow, but the volume story widens it: INDA's above-average participation confirms conviction, while ILF trades on neutral volume, suggesting retail interest without institutional follow-through. Structure cleanliness favors INDA at 83.9 versus 76.3, and stochastic RSI divergence matters—INDA's overbought reading holds at 1.00, while ILF's rolls over toward falling neutral. India quality-growth exposure outperforms Latin America commodity-and-value beta when both are extended, because growth sponsors hold through pullbacks while value beta distribution intensifies. The thirteen-week return edge (8.7% vs 11.9%) favors ILF on raw momentum, but category-relative strength at 0.0% versus 3.2% reveals INDA is being accumulated relative to peers.
Emerging Markets allocated to 5% in tier-2 because it scored 52.0, ranking seventh overall. The macro fit of 38.0/100 is weak—risk appetite positive at plus-8 provides the only meaningful support, offset by credit stress at minus-10 and liquidity stress at minus-10. INDA's technical evidence of 83.2/100 is strong and carries the category, but macro headwinds are real and prevent top-2 consideration. The allocator holds this position because INDA's above-average volume participation and bullish momentum confirm that select emerging-market themes (India growth quality) can outperform within a risk-off regime. This is a high-conviction emerging-markets play—the 71.0 reasoned ETF score for INDA is solid—but the category overall lacks macro tailwinds. The tier-2 weighting reflects the split: solid technical execution in a thematically weaker environment. Rotation to higher-conviction slots would occur if either the macro backdrop shifts toward broader emerging-market support or INDA's volume participation deteriorates.
Nuclear Energy — URA
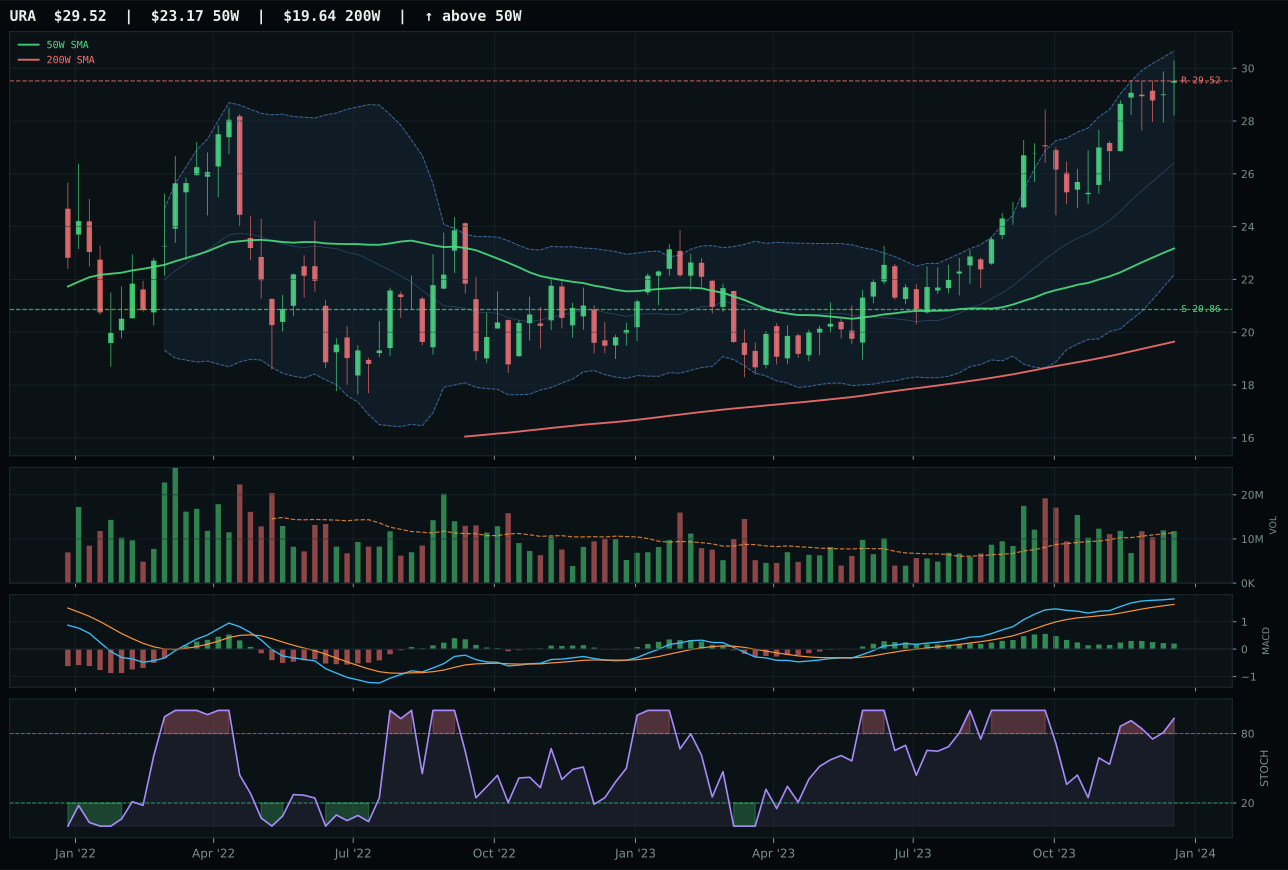
URA has a vertical extension profile with 0.1% 13-week relative strength versus SPY.
A failed hold above support would weaken the setup.
Actionable but governed by invalidation levels.
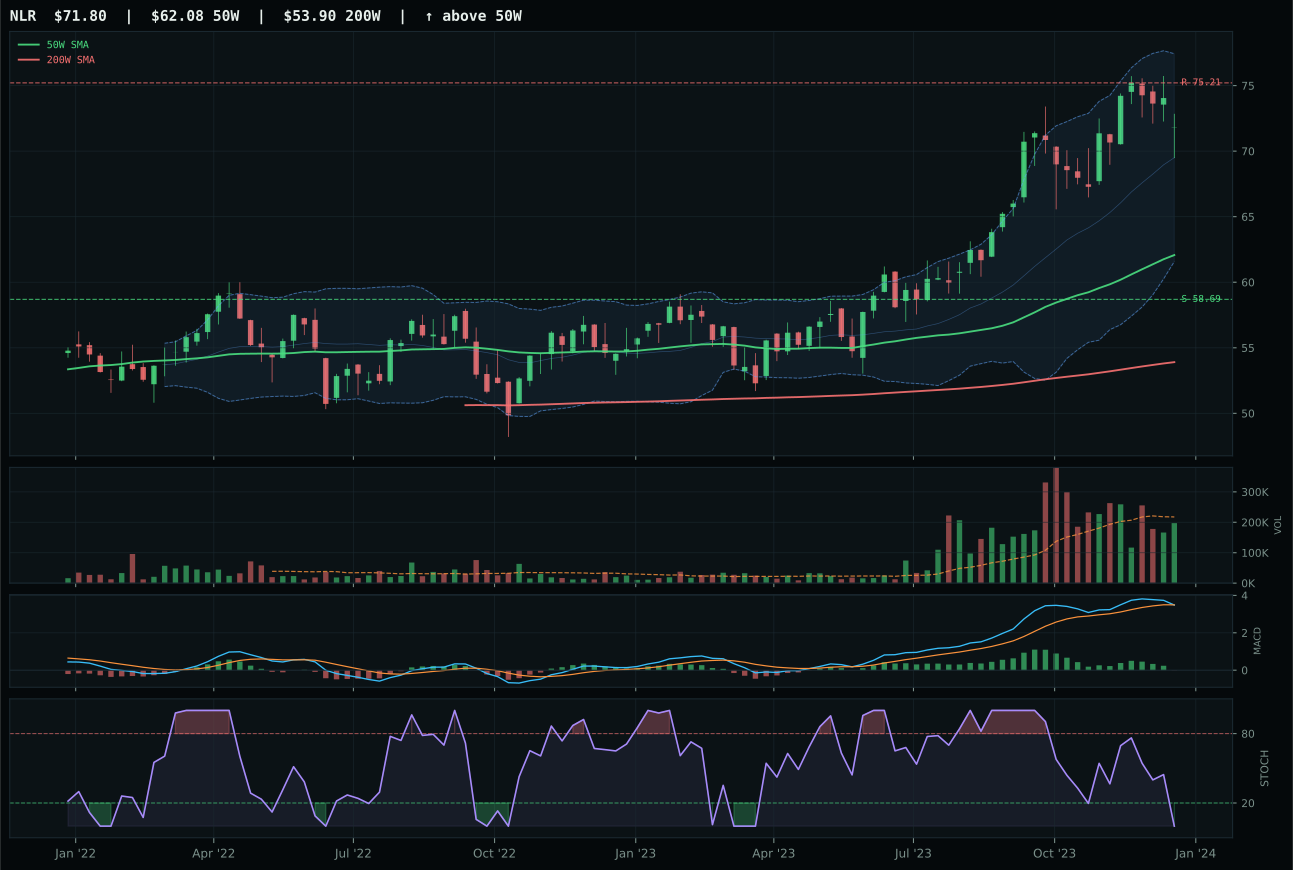
NLR has a vertical extension profile with -9.4% 13-week relative strength versus SPY.
A failed hold above support would weaken the setup.
Actionable but governed by invalidation levels.
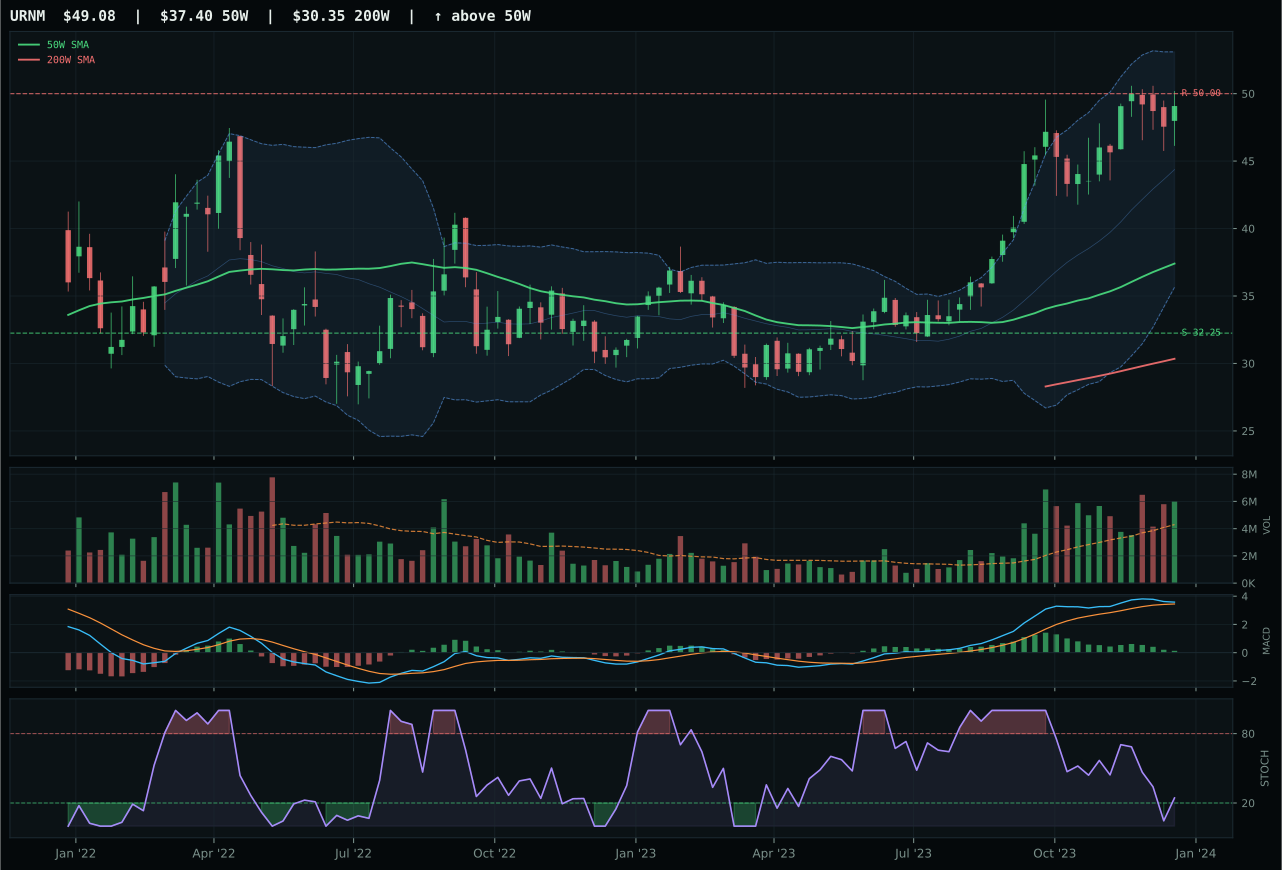
URNM has a vertical extension profile with -2.0% 13-week relative strength versus SPY.
A failed hold above support would weaken the setup.
Actionable but governed by invalidation levels.
URA wins Nuclear Energy with a decisive 9.8-point edge over NLR, capturing the category on trend and momentum momentum despite being extended. Price rises 27.4% above the 50-week moving average, normally a disqualifying stretch, but URA's 96.2 trend score—driven by price above both the 50-week and 200-week moving averages with a non-deteriorating slope—overpowers the entry risk. NLR's trend collapsed to 68.0 because price fell through both moving averages, and worse, MACD deteriorated to bearish/weakening with stochastic RSI rolling over to oversold. The thirteen-week return gap of 960 basis points (10.2% vs 0.6%) and category-relative strength of 2.1% versus minus-7.5% establish URA as the momentum leader. Timing penalty (32.0 vs 48.0 for NLR) reflects the extension risk, but momentum confirmation at 72.4/100 and persistence at 66.0/100 prove the move is real and being bought, not rejected. Nuclear utilities offer steadier income; nuclear cyclicals offer growth—the allocator is choosing growth over income because trend superiority dominates.
Nuclear Energy allocated to 5% in tier-2 because it scored 46.1, ranking fifth overall among tier-2 eligible categories. The macro fit of 50.0/100 is neutral—no category-specific descriptors were available—but real asset sponsorship at plus-7 and AI growth sponsorship at plus-5 provide modest structural support. Liquidity stress at minus-7 and credit stress at minus-5 create headwinds, leaving the macro case uncompelling. URA's technical evidence of 50.6/100 is middling; the category wins allocation primarily because the tier-2 sleeve must be populated and nuclear's technical trend (96.2) outranks several weaker competitors. The allocator is essentially using this position as ballast: URA's extension and momentum flattening trend suggest the move may be late-cycle, but the portfolio structure requires allocation to energy themes, and nuclear offers more upside from disinflation than fossil fuels. This is a hold, not a conviction position—the tier-2 weighting accurately reflects the technical evidence.
Utilities & Infrastructure — PAVE
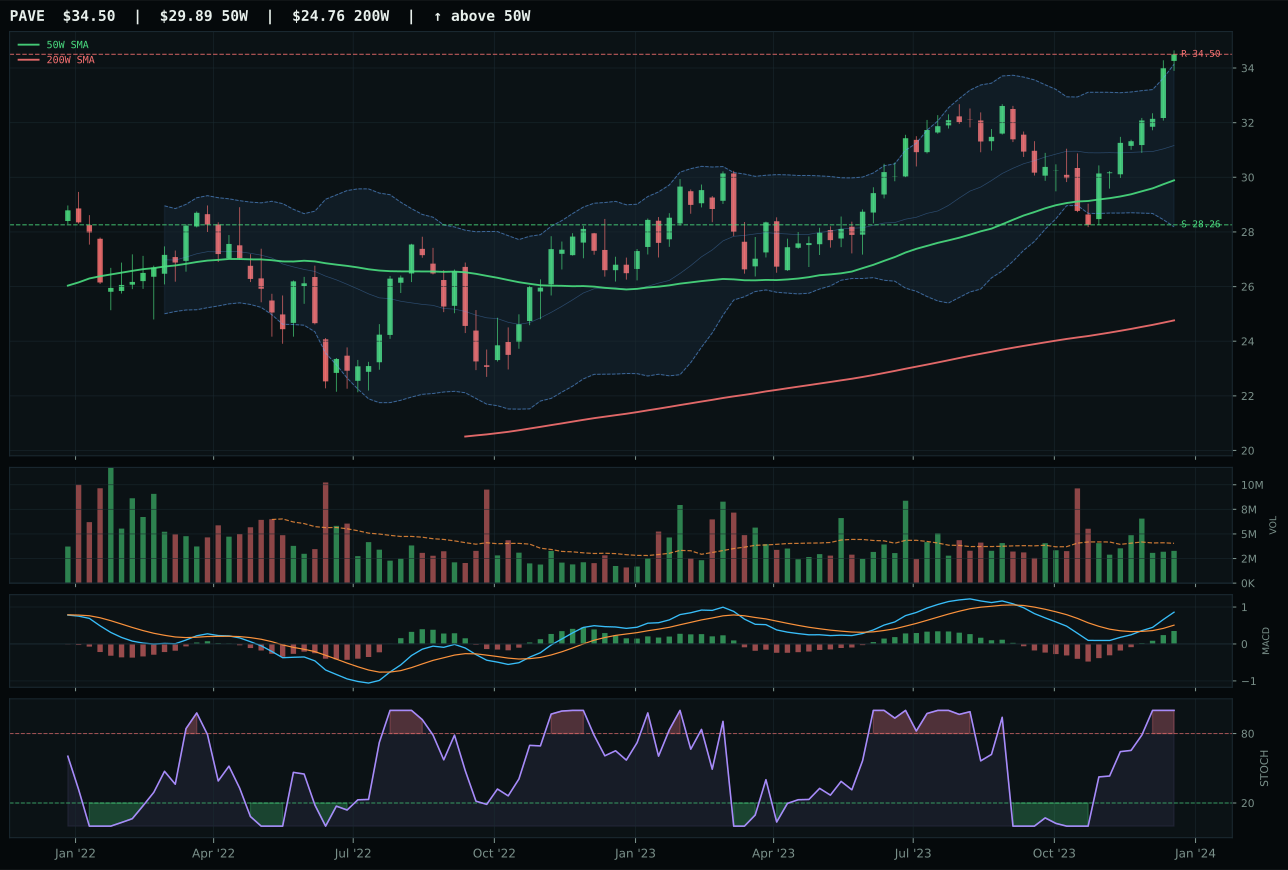
PAVE has a vertical extension profile with 4.3% 13-week relative strength versus SPY.
A failed hold above support would weaken the setup.
Actionable but governed by invalidation levels.
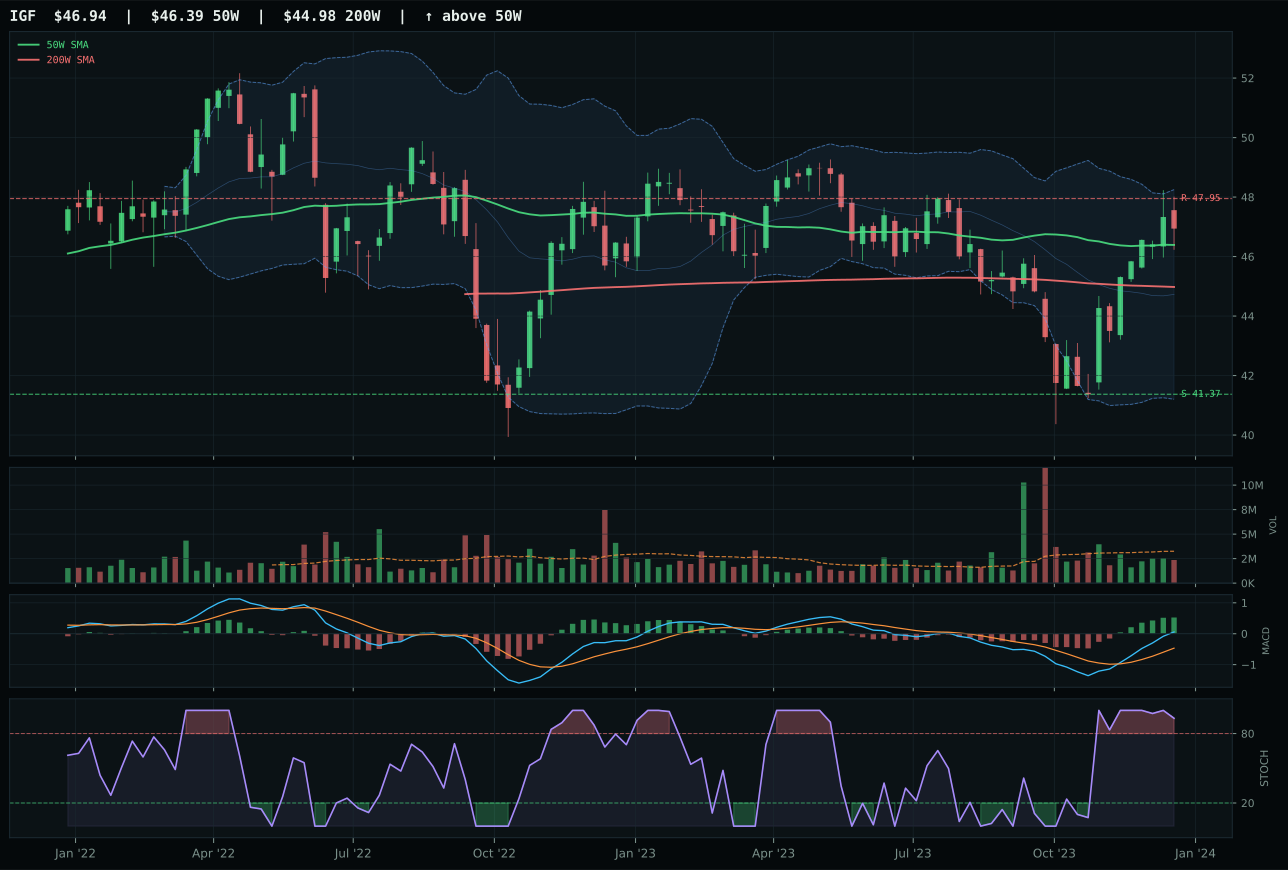
IGF has a compression near 50W profile with -5.3% 13-week relative strength versus SPY.
A failed hold above support would weaken the setup.
Actionable but governed by invalidation levels.
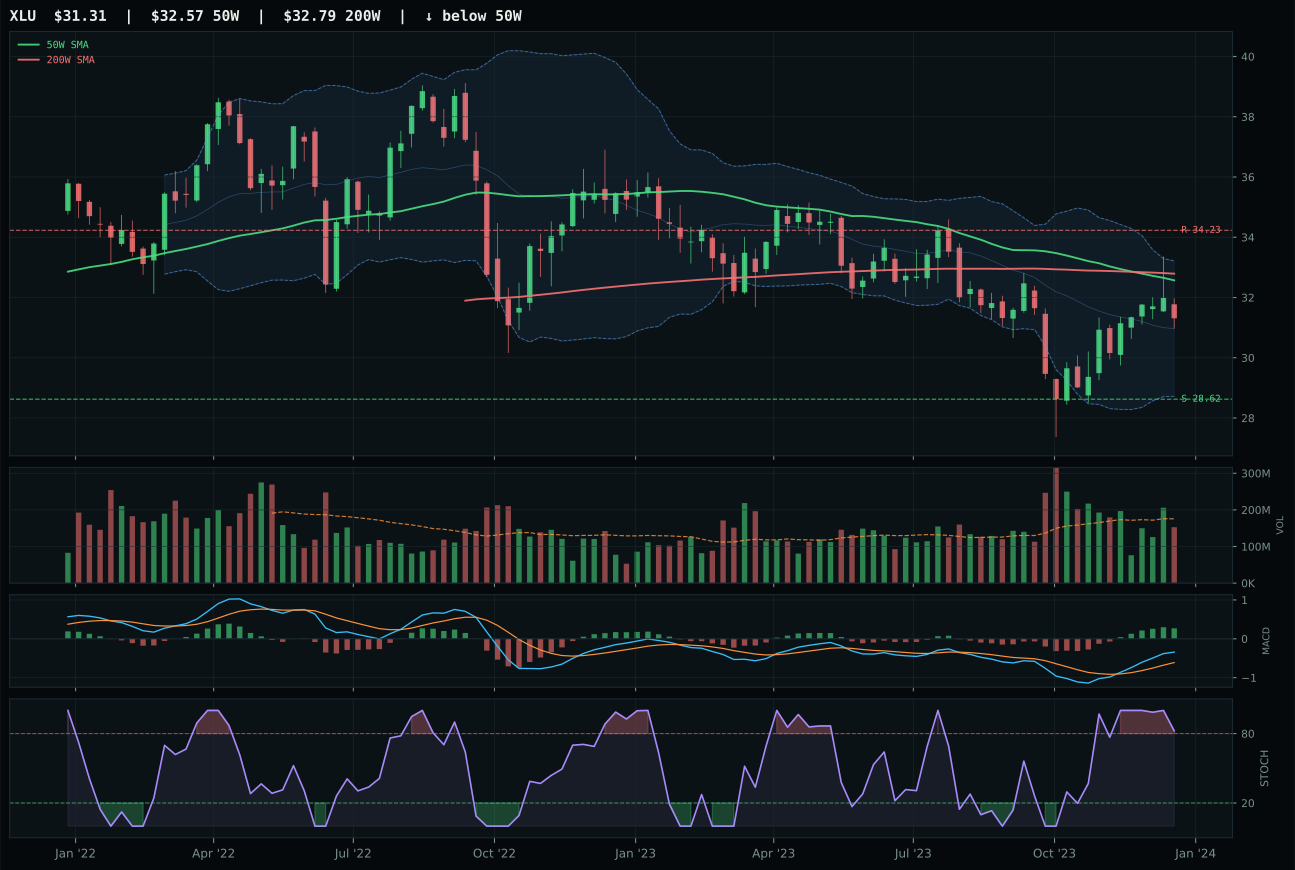
XLU has a neutral structure profile with -11.1% 13-week relative strength versus SPY.
Extension and support failure are the main tactical risks.
Tracked, but not top-2 eligible because: structurally broken.
PAVE wins Utilities & Infrastructure with a narrow 1.6-point margin over IGF, a result driven by superior structure quality and momentum confirmation despite equivalent trend strength. Price rises 15.4% above the 50-week moving average, extended but sustained by bullish MACD and overbought stochastic RSI held at 1.00 with volume neutral at 0.81x the 20-week average. IGF's compression setup near the 50-week with falling stochastic RSI into neutral creates distribution risk that PAVE's vertical extension avoids. Category-relative strength of 9.6% versus 0.0% tells the allocator that domestic infrastructure is being accumulated while global infrastructure is being distributed. The thirteen-week return gap widens to 970 basis points (14.4% vs 4.7%), confirming PAVE's momentum superiority. Both show bullish MACD, but PAVE's persistence and volume-price confirmation scores exceed IGF's on the backing of institutional accumulation. Domestic infrastructure capex beta outperforms global income when risk appetite is mixed and macro supports reallocation toward domestic resilience.
Utilities & Infrastructure allocated to 5% in tier-2 because it scored 45.6, ranking ninth overall but maintaining eligibility. The macro fit of 62.0/100 is above-average for tier-2, driven by disinflation support at plus-7 and disinflation pressure as a structural tailwind. Transition/mixed regime support adds plus-4, providing genuine category-level backing. Liquidity stress at minus-3 and risk appetite negative at minus-2 moderate upside modestly. PAVE's technical evidence of 76.0/100 is solid; the category maintains allocation because the macro regime and technical momentum align favorably. However, tier-2 status reflects the gap: at 45.6, Utilities & Infrastructure scores below every top-2 and most other tier-2 categories, earning allocation primarily due to macro support and the requirement to populate the tier-2 sleeve. The allocator holds this position for diversification into rate-sensitive assets and domestic capex themes within disinflation, but would rotate to higher-conviction opportunities if PAVE's extended setup deteriorates or category momentum reverses.
Agriculture & Livestock — WEAT
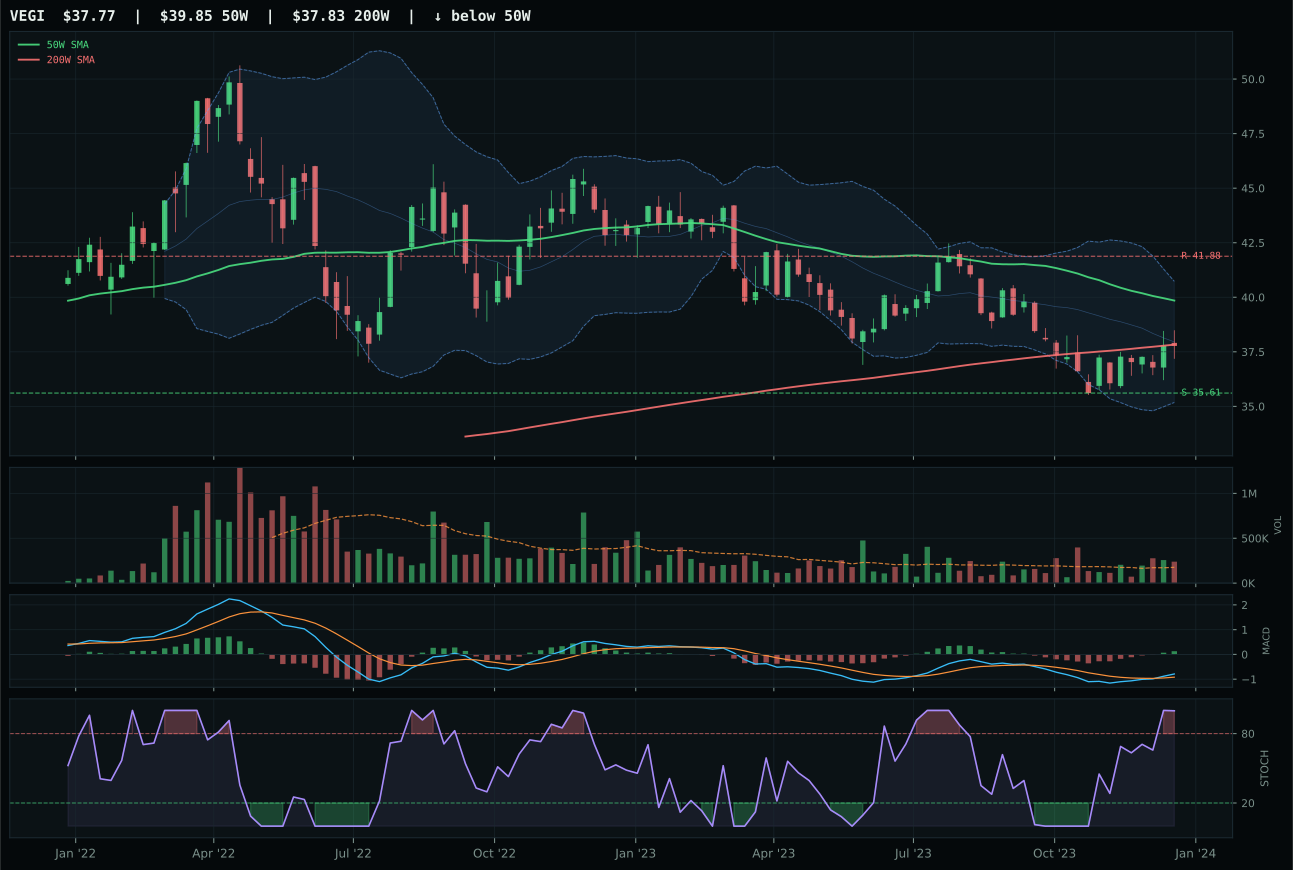
VEGI has a neutral structure profile with -11.8% 13-week relative strength versus SPY.
A failed hold above support would weaken the setup.
Tracked, but not top-2 eligible because: .
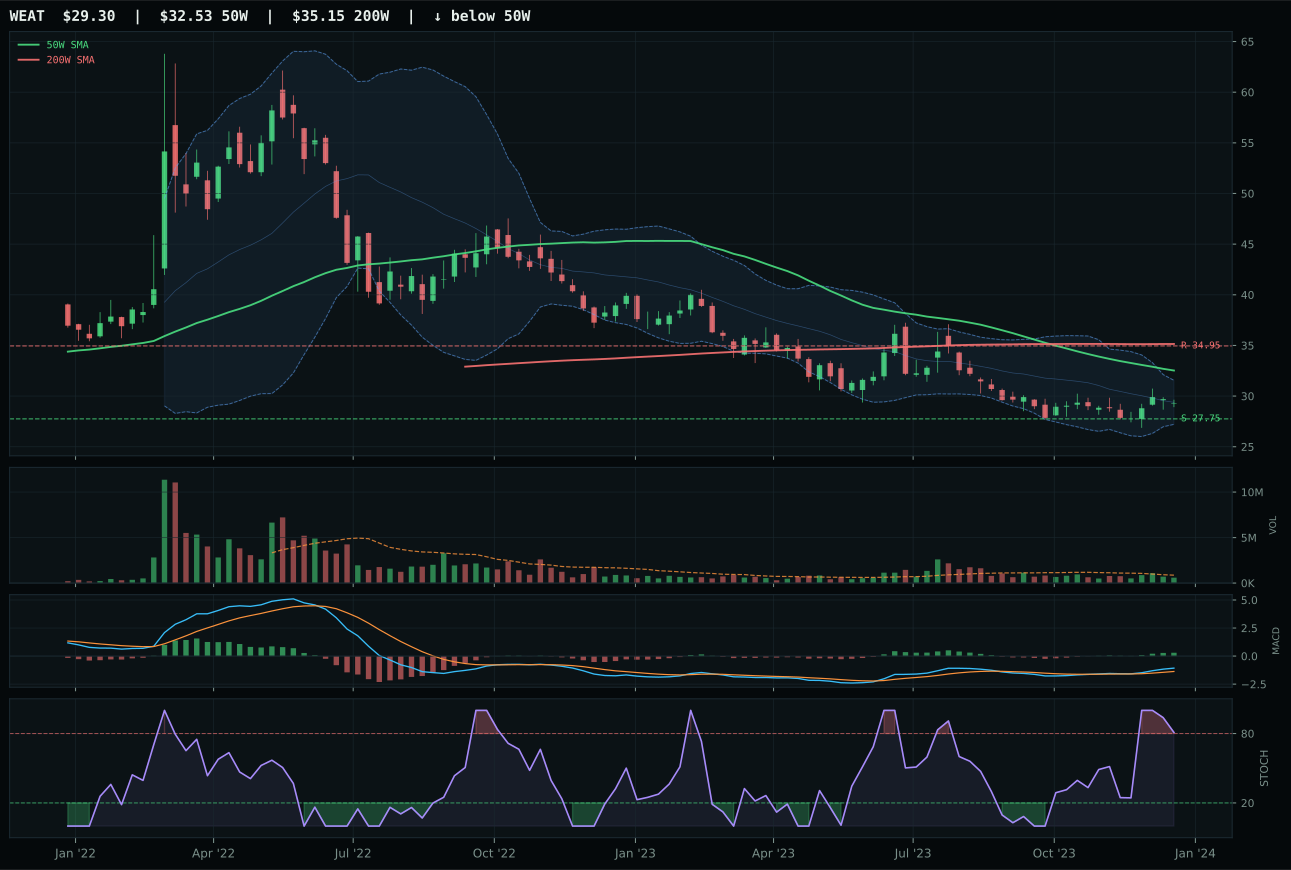
WEAT has a neutral structure profile with -9.0% 13-week relative strength versus SPY.
Extension and support failure are the main tactical risks.
Tracked, but not top-2 eligible because: structurally broken.
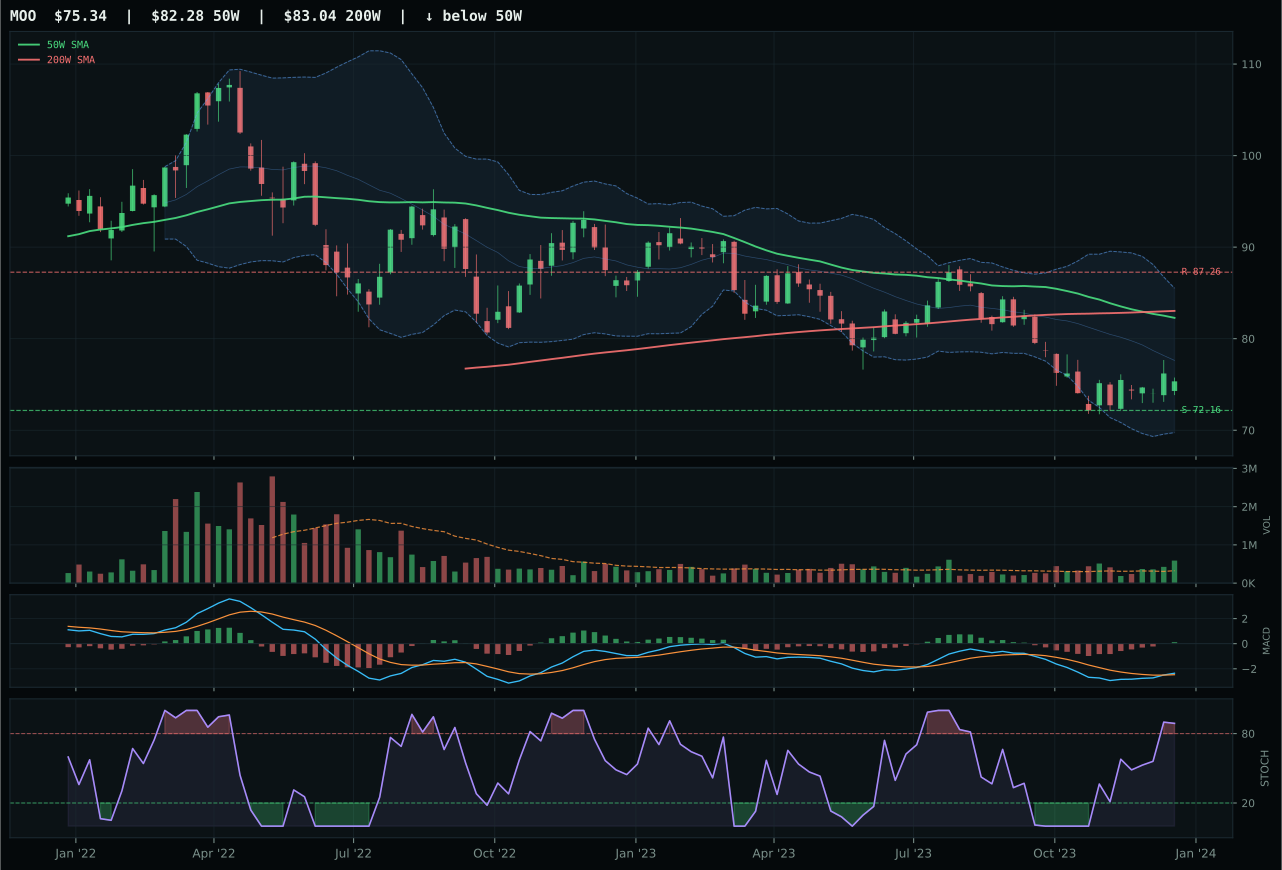
MOO has a pullback into support profile with -15.3% 13-week relative strength versus SPY.
Extension and support failure are the main tactical risks.
Tracked, but not top-2 eligible because: structurally broken.
WEAT wins a heavily damaged category by the narrow margin of a superior risk/reward score (90.0 vs 82.1 against VEGI), but this victory carries no weight because the entire category failed eligibility. Price sits 9.9% below the 50-week moving average with a negative slope, MACD is bullish in name only, and stochastic RSI is rolling over from overbought—the technical setup is repair-zone accumulation with execution risk on the downside. Thirteen-week returns of just 1.0% and negative 18.9% over twenty-six weeks confirm that momentum has been killed. WEAT wins the comparison only because it shows 2.8% category-relative strength while VEGI sits at zero, a trivial distinction in a broken market. Volume is thin participation across the board, and the combination of below-trend price, deteriorating momentum, and weak thirteen-week returns creates a setup where even the winner is unsafe.
Agriculture & Livestock received 0% allocation because it ranked either ninth or tenth in eligible categories and failed the formal eligibility test, placing it outside the portfolio entirely. The 7.2 final score tells the full story: disinflation hurts commodities by minus-6, and liquidity stress removes another minus-4. While real asset sponsorship provided plus-8 and commodity breadth is technically active, the technical floor collapsed. WEAT's 37.4 technical evidence score is barely above half strength, and the trend dropped to 41.5/100 as price broke below both the 50-week and 200-week moving averages. For this category to re-enter the allocation, WEAT or VEGI would need to demonstrate a confirmed recovery above the 50-week moving average with volume participation expanding and a positive thirteen-week return trajectory. Until technical structure rebuilds, the macro tailwinds are academic—an ineligible setup cannot be rescued by narrative alone in a system weighted 62% toward technical evidence.
Traditional Energy — FCG
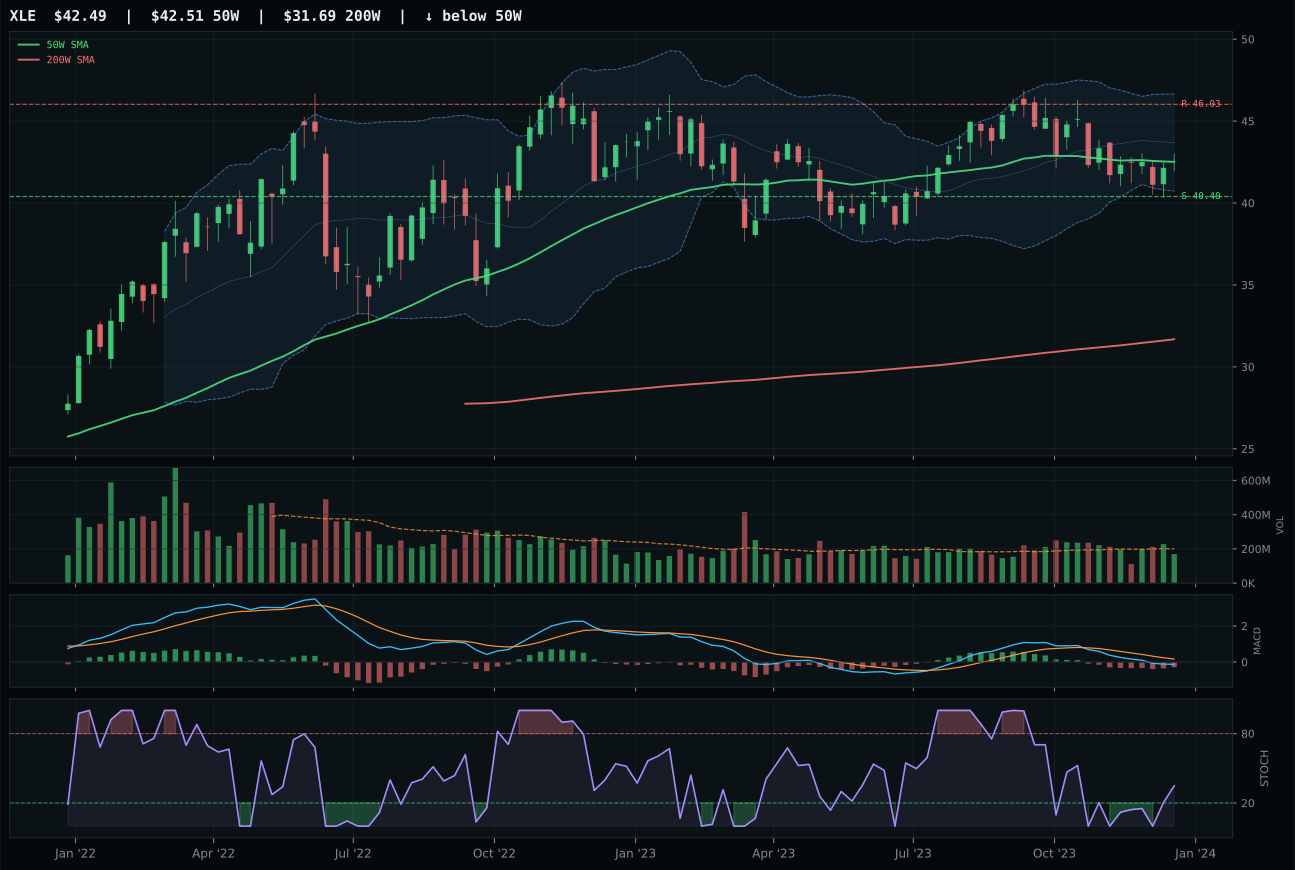
XLE has a compression near 50W profile with -14.9% 13-week relative strength versus SPY.
A failed hold above support would weaken the setup.
Actionable but governed by invalidation levels.
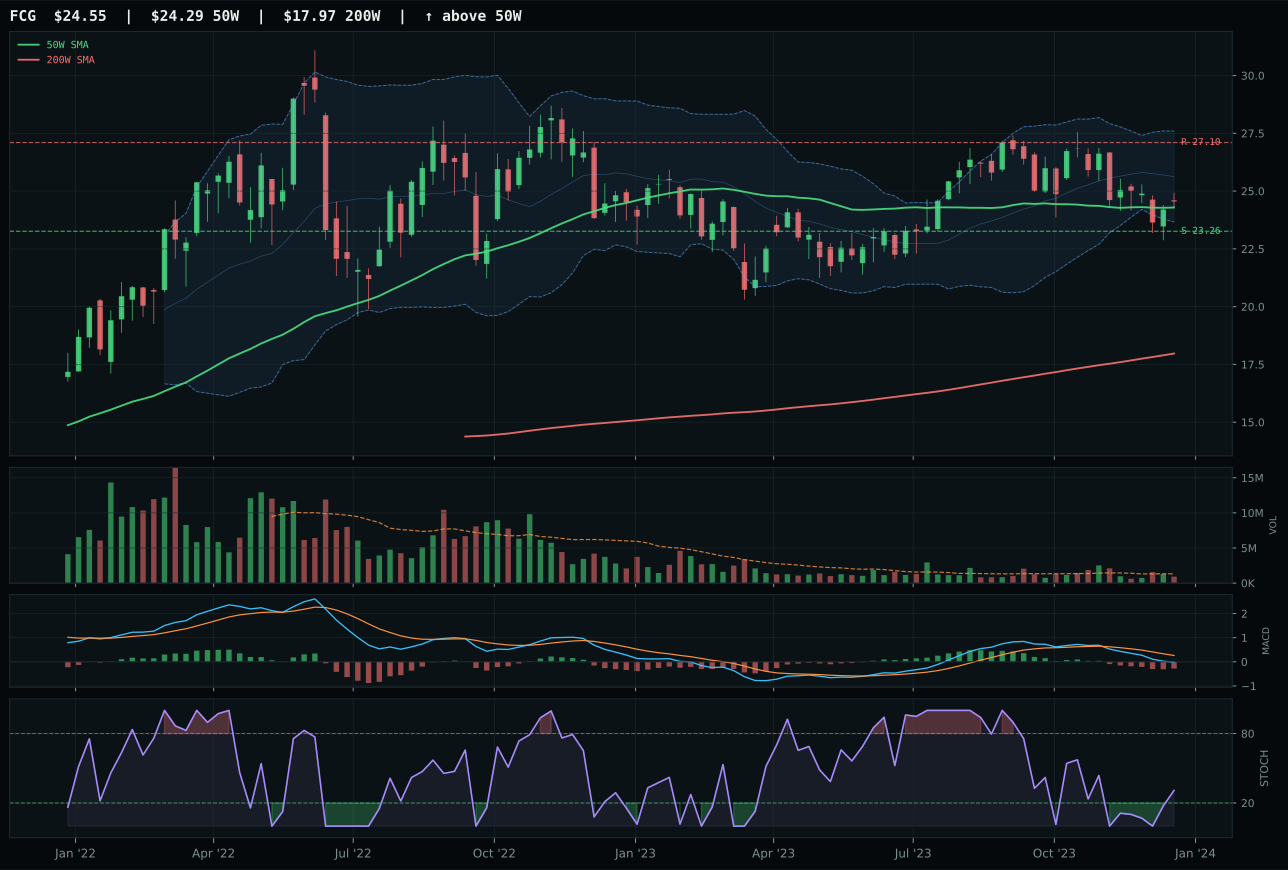
FCG has a compression near 50W profile with -11.9% 13-week relative strength versus SPY.
A failed hold above support would weaken the setup.
Actionable but governed by invalidation levels.
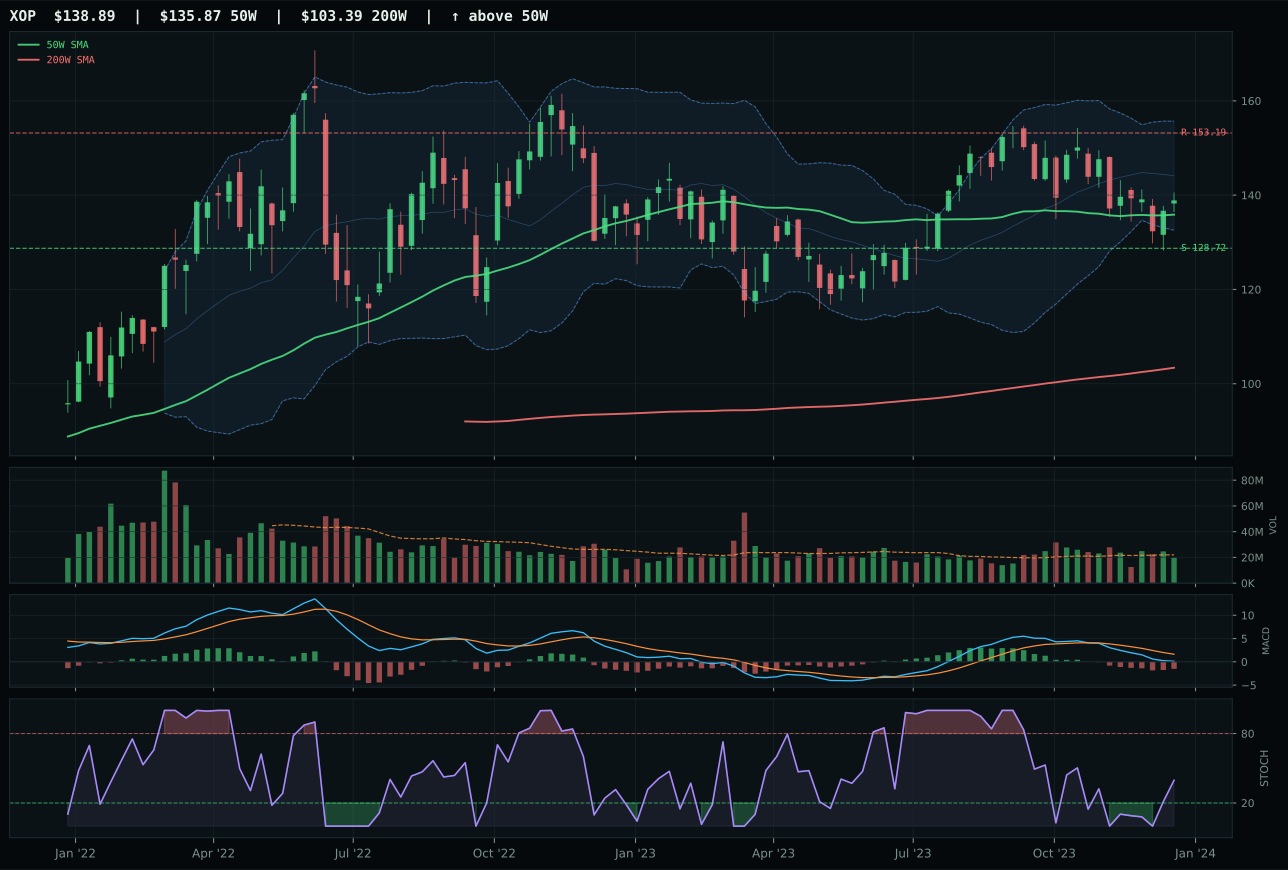
XOP has a compression near 50W profile with -13.2% 13-week relative strength versus SPY.
A failed hold above support would weaken the setup.
Actionable but governed by invalidation levels.
FCG wins Traditional Energy but inherits a toxic category; the victory is meaningless because the entire sector failed eligibility. Price anchors 1.1% from the 50-week moving average—appearing tight—but MACD is bearish and weakening, stochastic RSI is rising mid-zone rather than confirming strength, and the thirteen-week return of minus-1.8% confirms no momentum exists. FCG beats XLE by 11.0 points primarily on category-relative strength of 1.3% versus minus-1.7%, a trivial margin in an environment where the setup offers no directional conviction. Risk/reward appears attractive at 83.5/100 because downside is small and upside measured, but that asymmetry exists only if price doesn't break support—volume is thin participation, meaning any capitulation will accelerate losses. The compression near the 50-week moving average creates an illusion of setup quality; the weakening MACD reveals the true structure: a bounce into resistance with no sponsorship.
Traditional Energy received 0% allocation because it ranked tenth (the lowest category) with a 5.9 final score that failed eligibility testing entirely. The macro environment is openly hostile: disinflation hurts energy by minus-10, and disinflation pressure itself at minus-10 removes all tail-risk hedging. Real asset sponsorship at plus-7 and credit stress at plus-2 provide minimal offset against the regime headwind. FCG's technical evidence of 46.4/100 reflects the severity: bearish MACD, thin participation, and negative momentum lack conviction. For this category to re-enter the portfolio, energy would need to break above resistance on volume with MACD pivoting bullish and the thirteen-week return trajectory turning positive—currently, it is a fading setup with macro headwinds. Until disinflation reverses or credit stress escalates enough to drive real-asset flight-to-safety, energy remains excluded. This is not a risk-management hedge position; it is simply unfavorable on both technical and macro grounds.