
2023-12-15
Informational purposes only. The content in this report, including allocations, analysis, and commentary, is provided solely for informational and educational purposes. It does not constitute financial advice, investment advice, trading advice, or any other type of advice. Past performance does not guarantee future results. Always conduct your own research and consult a qualified financial professional before making investment decisions.
Weekly Allocation
| Ticker | Category | Weight | Role |
|---|---|---|---|
| FBTC | 50% | Overlay | |
| CIBR | Technology | 10% | Top-2 (10%) |
| BOTZ | AI | 10% | Top-2 (10%) |
| GLD | Precious Metals | 5% | Tier-2 (5%) |
| PAVE | Utilities & Infrastructure | 5% | Tier-2 (5%) |
| INDA | Emerging Markets | 5% | Tier-2 (5%) |
| ITA | Defense & Aerospace | 5% | Tier-2 (5%) |
| URA | Nuclear Energy | 5% | Tier-2 (5%) |
| COPX | Industrial Metals | 5% | Tier-2 (5%) |
Trade Instructions — Monday Open
Sell the tranche from 2023-11-17 (completing its 4-week hold). Buy the new tranche. Instructions show net portfolio changes — same-asset positions cancel, weight changes show the delta.
| Action | Ticker | Instruction |
|---|---|---|
| SELL | XLK | Sell entire XLK position (2.50% of portfolio) |
| SELL | SMH | Sell entire SMH position (2.50% of portfolio) |
| SELL | IGF | Sell entire IGF position (1.25% of portfolio) |
| SELL | ILF | Sell 25% of ILF position (reduce 5.00% → 3.75%) |
| SELL | XAR | Sell 20% of XAR position (reduce 6.25% → 5.00%) |
| SELL | PICK | Sell 33% of PICK position (reduce 3.75% → 2.50%) |
| BUY | BOTZ | Buy BOTZ — 25.00% of freed cash (adds 2.50% to portfolio) |
| BUY | PAVE | Buy PAVE — 12.50% of freed cash (adds 1.25% to portfolio) |
| BUY | CIBR | Buy CIBR — 25.00% of freed cash (adds 2.50% to portfolio) |
| BUY | INDA | Buy INDA — 12.50% of freed cash (adds 1.25% to portfolio) |
| BUY | ITA | Buy ITA — 12.50% of freed cash (adds 1.25% to portfolio) |
| BUY | COPX | Buy COPX — 12.50% of freed cash (adds 1.25% to portfolio) |
Current Portfolio After Trade
Combined holdings across all 4 active tranches. Each tranche is 25% of the portfolio.
| Ticker | % of Portfolio | Weight Bar |
|---|---|---|
| FBTC | 50.00% | |
| BOTZ | 7.50% | |
| GLD | 6.25% | |
| PAVE | 6.25% | |
| XAR | 5.00% | |
| CIBR | 5.00% | |
| URA | 3.75% | |
| ILF | 3.75% | |
| IGV | 3.75% | |
| PICK | 2.50% | |
| URNM | 1.25% | |
| MOO | 1.25% | |
| INDA | 1.25% | |
| ITA | 1.25% | |
| COPX | 1.25% |
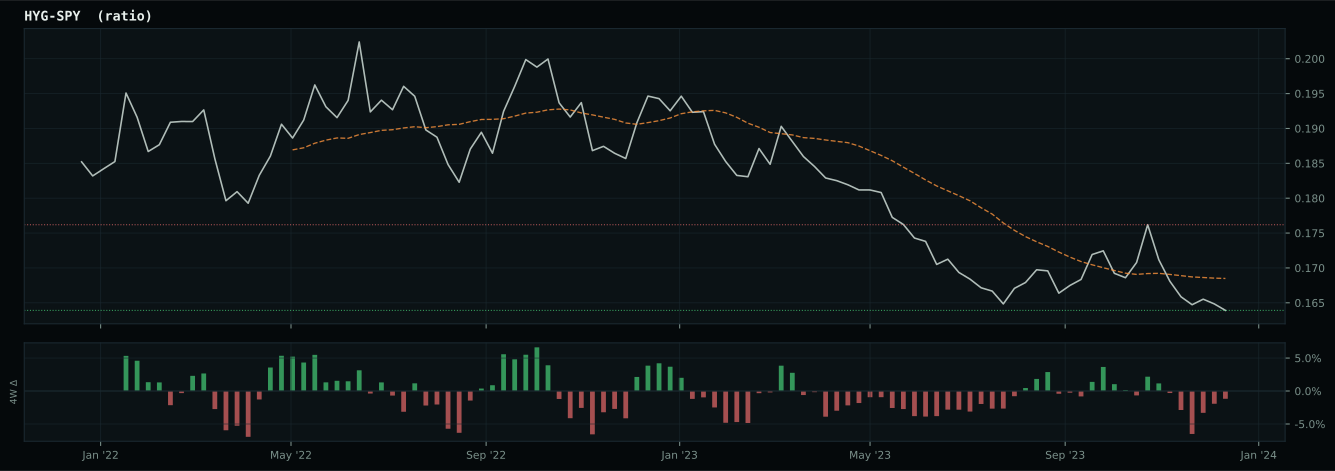
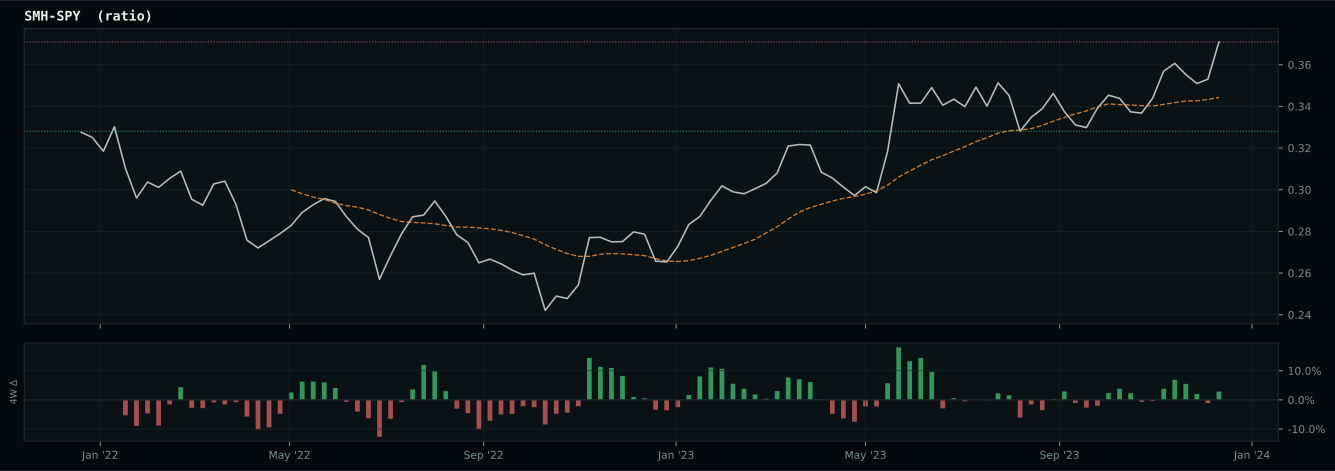
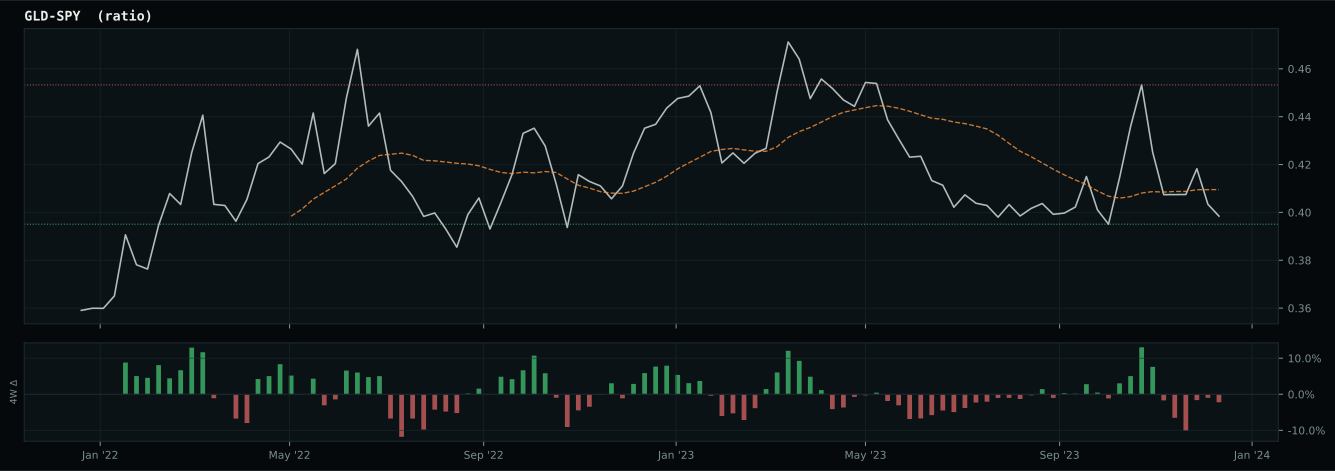
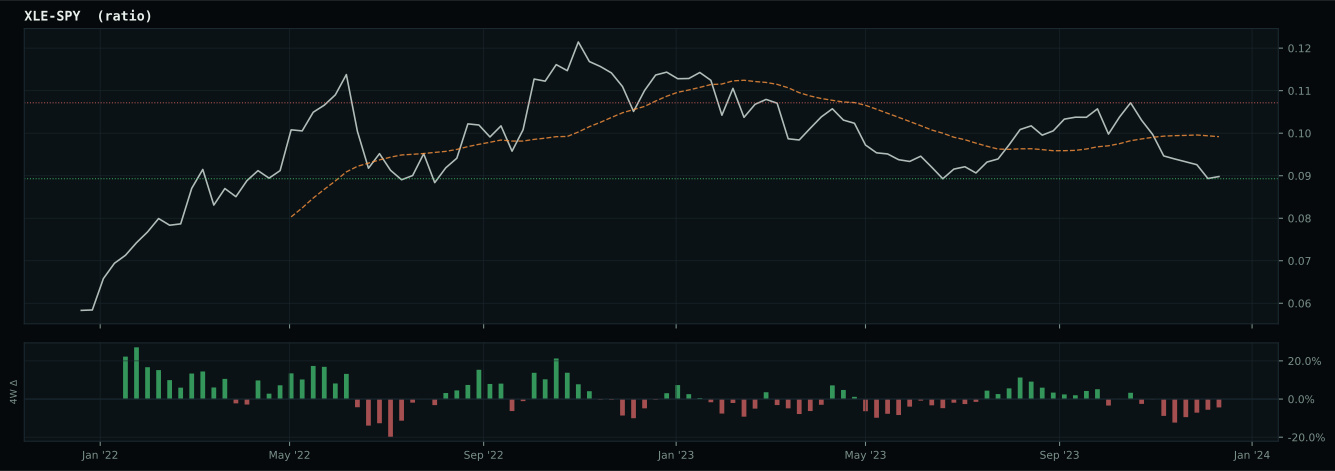
Macro Regime — Disinflation
Macro Evidence Charts
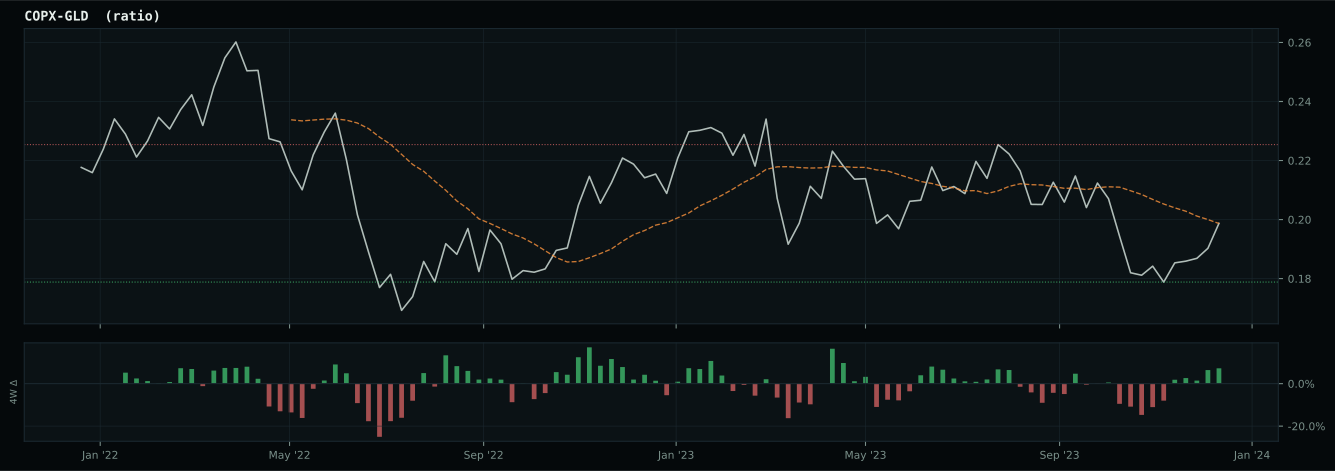
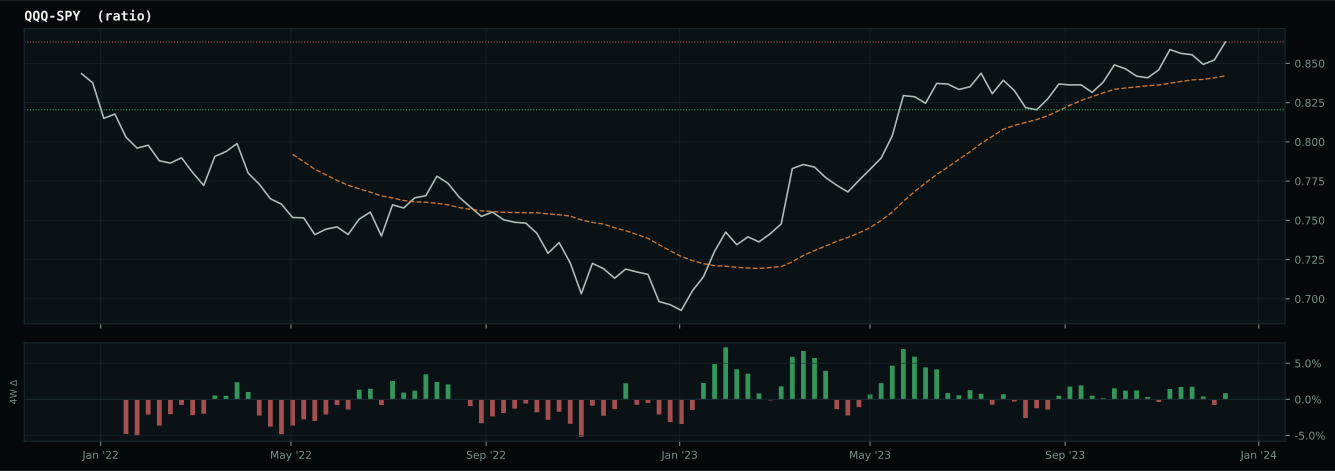
Market-implied signals behind the macro regime scores. Each ratio compares two assets; the direction and slope of the ratio is what the macro engine reads.
Crypto Regime — TrendBTC
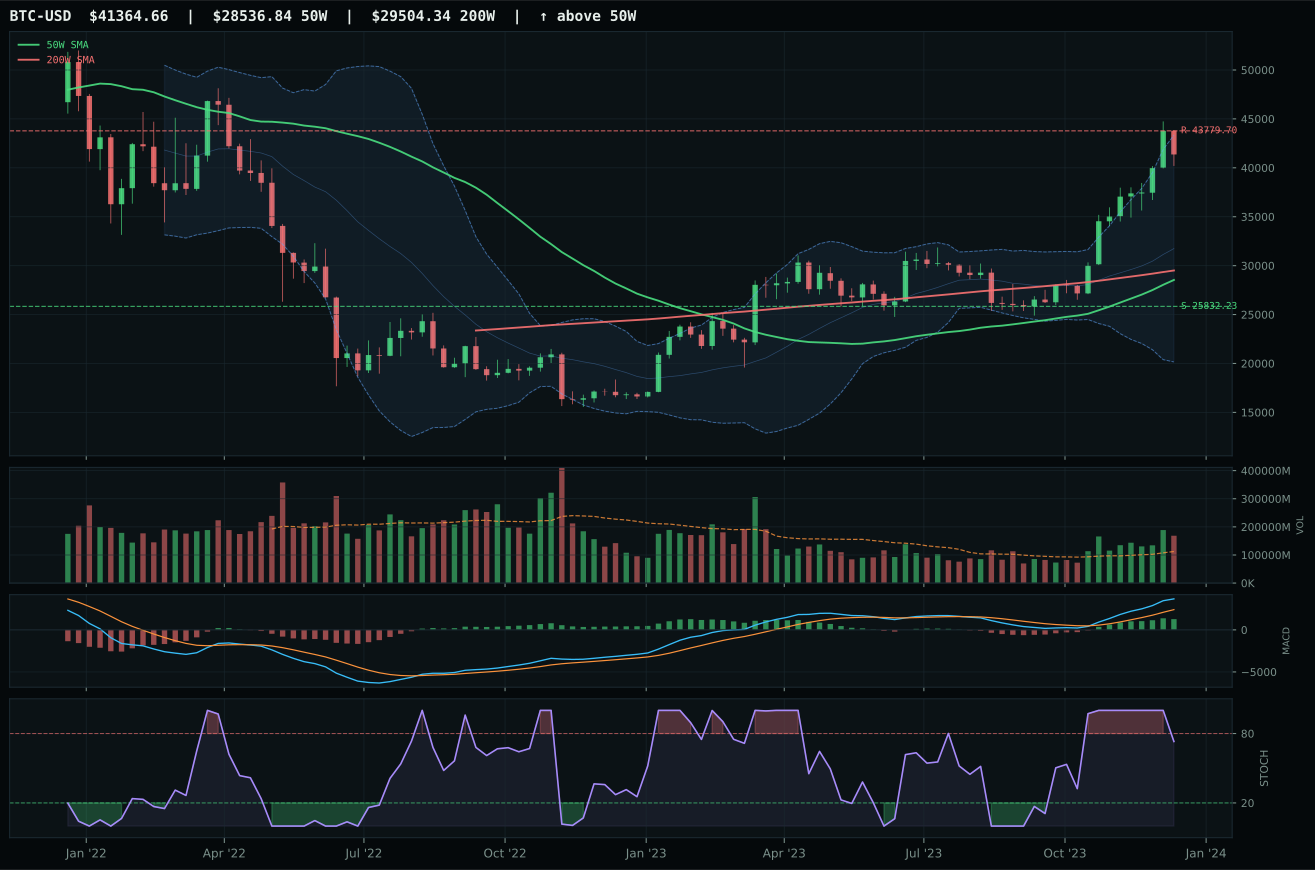
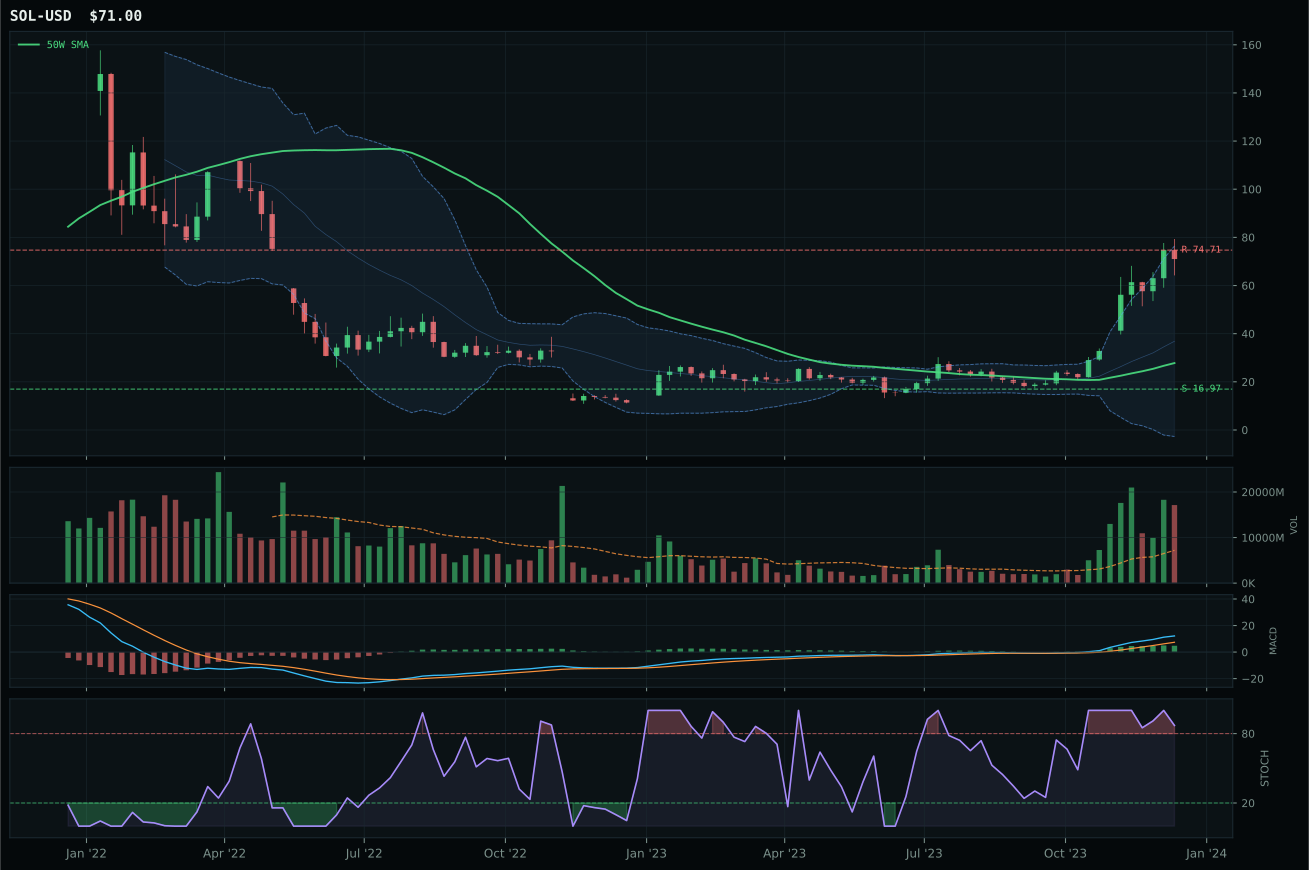
post-touch structure is too wide to count as a range; max/min close ratio is 2.69
TrendBTC confirmed: 2 consecutive closes above rising/flat 50W SMA
one or more available conditions failed
Category Rankings
| Rank | Category | Winner | Score | Alloc | 4W Ret | Peers (4W) |
|---|---|---|---|---|---|---|
| 1 | Technology | CIBR | 74.6 | 20% | +2.05% | XLK +0.4% · IGV +1.6% |
| 2 | AI | BOTZ | 71.6 | 20% | +1.60% | SMH -0.2% · AIQ -0.0% |
| 3 | Precious Metals | GLD | 67.2 | 10% | +0.88% | GDX -4.9% · SLV -3.4% |
| 4 | Utilities & Infrastructure | PAVE | 60.8 | 10% | -2.04% | IGF -2.4% · XLU -0.8% |
| 5 | Emerging Markets | INDA | 58.1 | 10% | +2.97% | ILF -3.3% · IEMG -3.1% |
| 6 | Defense & Aerospace | ITA | 57.2 | 10% | -3.07% | XAR -2.4% · ROKT -2.2% |
| 7 | Nuclear Energy | URA | 50.0 | 10% | +8.12% | NLR +8.9% · URNM +20.4% |
| 8 | Industrial Metals | COPX | 50.0 | 10% | -2.15% | PICK -5.9% · REMX -9.9% |
| 9 | Agriculture & Livestock | WEAT | 12.1 | 0% | -1.71% | VEGI -3.5% · MOO -1.6% |
| 10 | Traditional Energy | XOP | 2.9 | 0% | -3.83% | FCG -4.1% · XLE -2.9% |
Technology — CIBR
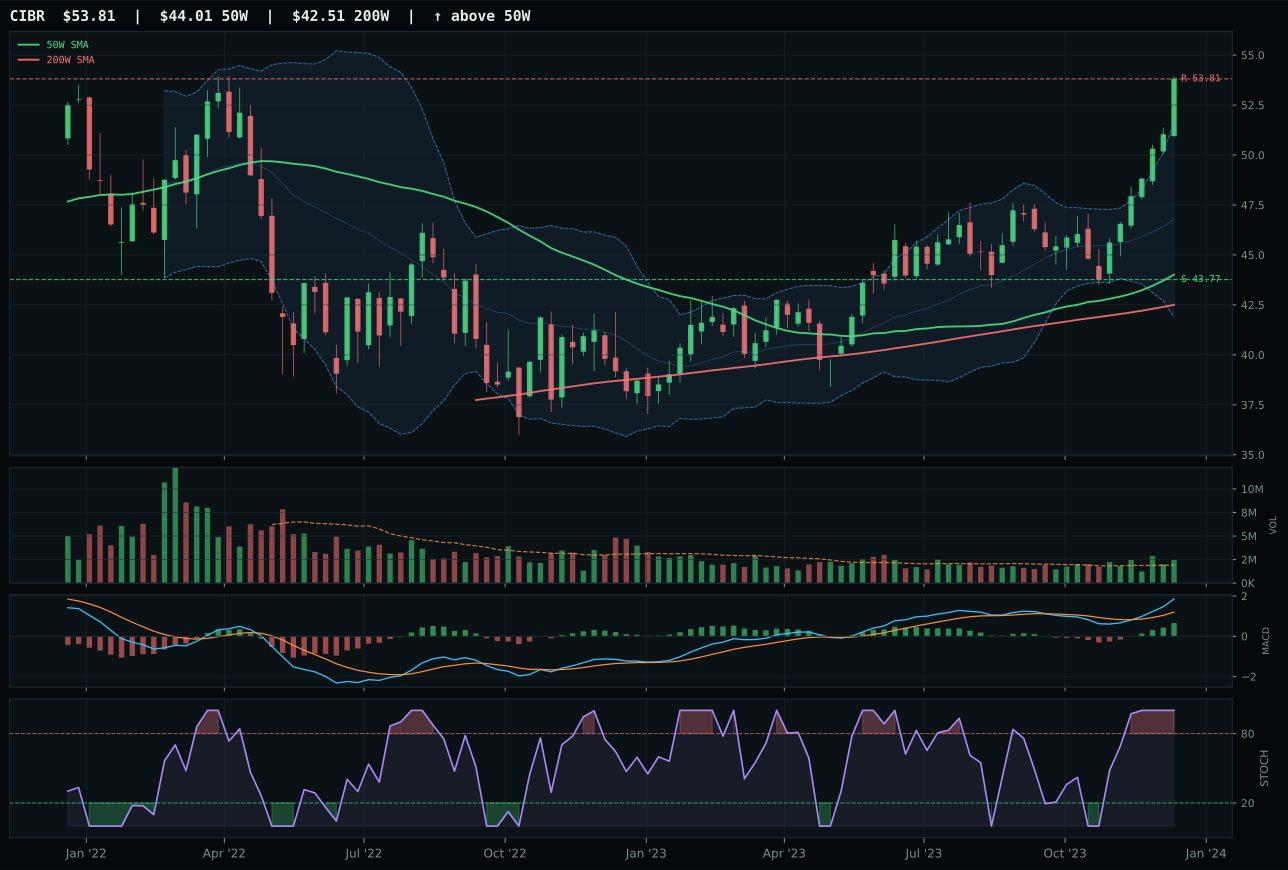
CIBR has a vertical extension profile with 10.4% 13-week relative strength versus SPY.
A failed hold above support would weaken the setup.
Actionable but governed by invalidation levels.
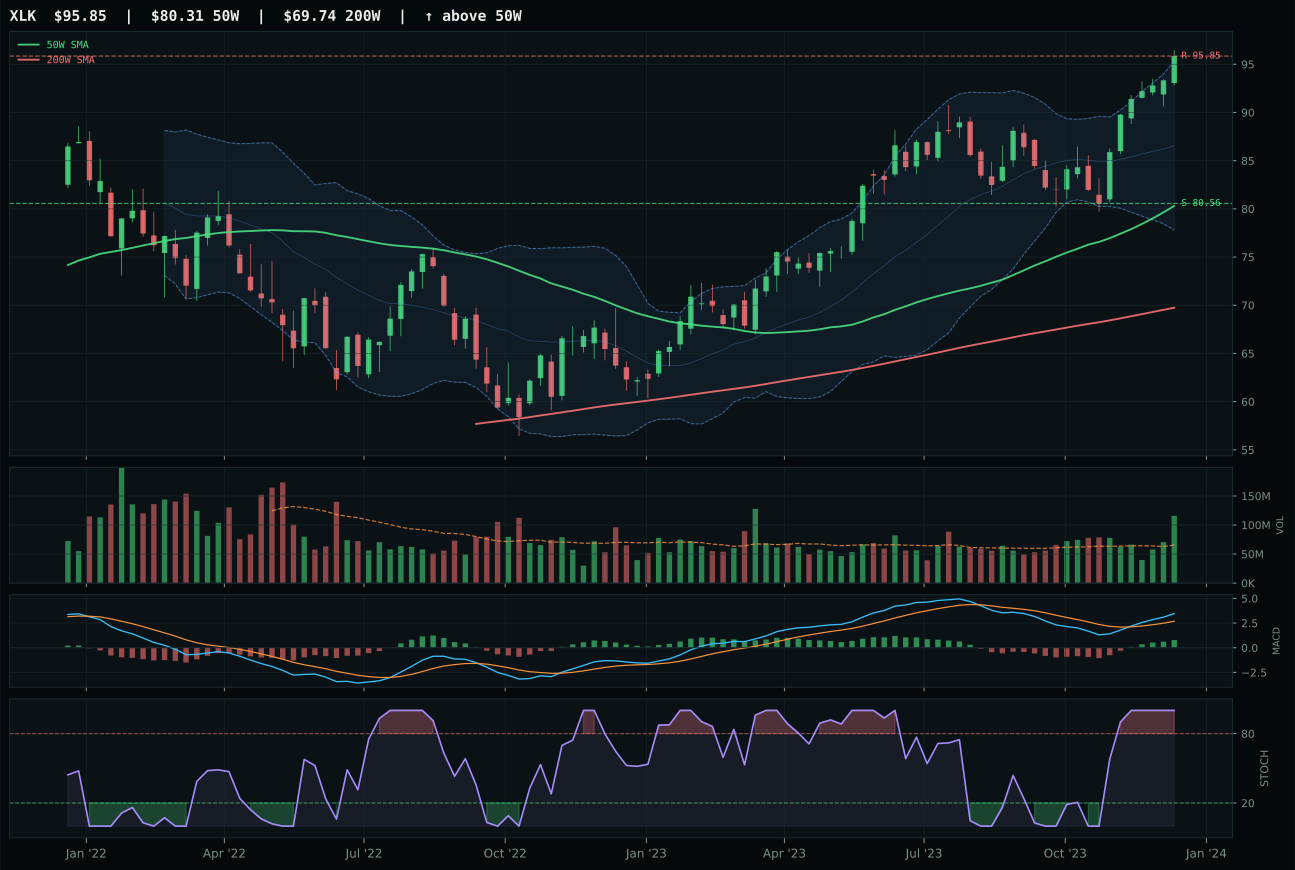
XLK has a vertical extension profile with 7.6% 13-week relative strength versus SPY.
A failed hold above support would weaken the setup.
Actionable but governed by invalidation levels.
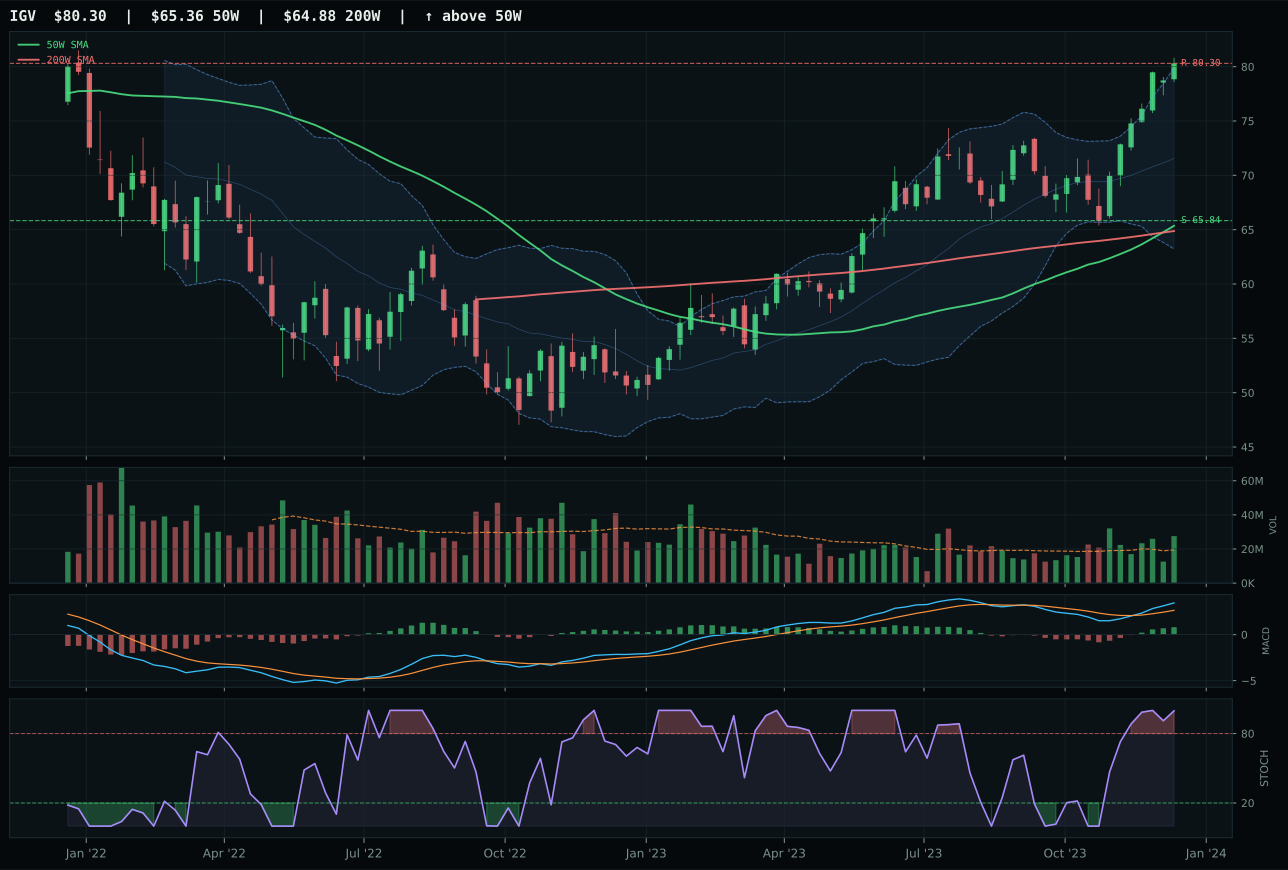
IGV has a vertical extension profile with 8.2% 13-week relative strength versus SPY.
A failed hold above support would weaken the setup.
Actionable but governed by invalidation levels.
CIBR wins the category on the strength of a 2.2% relative advantage over peers within the three-ETF basket, paired with a clean vertical extension setup that has compressed entry risk into near-term support. The 16.2% thirteen-week return and 10.4% relative strength versus SPY confirm that buyers are actively accumulating cybersecurity exposure rather than chasing a dead bounce. XLK's 7.6% relative strength to SPY trails by 2.8 percentage points, and its category-relative laggard status at minus 0.6% reflects the market favoring the niche tactical thesis over broad tech profitability. CIBR's 22.3% extension from the 50-week moving average penalizes timing—entry feels late—but volume participation at 1.29x the 20-week average and a bullish, improving MACD anchor the move as genuine accumulation, not capitulation or distribution into strength.
Technology earns a 10% allocation slot as a top-2 overweight category at a 74.6 composite score, driven by a 62% weighting on technical evidence and a benign macro backdrop where disinflation pressure adds seven basis points of support and risk appetite remains active at plus nine. The category scores well on trend (100.0 for price above both key moving averages) and volume-price confirmation (75.7), but timing drags it lower due to the 22.3% extension from the 50-week level; new entries face asymmetric risk even as the intermediate momentum remains constructive. In a disinflation regime, technology can rotate defensively toward the safest compounders and tactically into niches like cybersecurity where threat spending is inelastic. The tight 1.1-point margin to XLK signals that this category's leadership is fragile and dependent on near-term risk-on sentiment holding; any liquidity stress event or credit widening would likely flip the hierarchy toward the broader, more liquid tech index.
AI — BOTZ
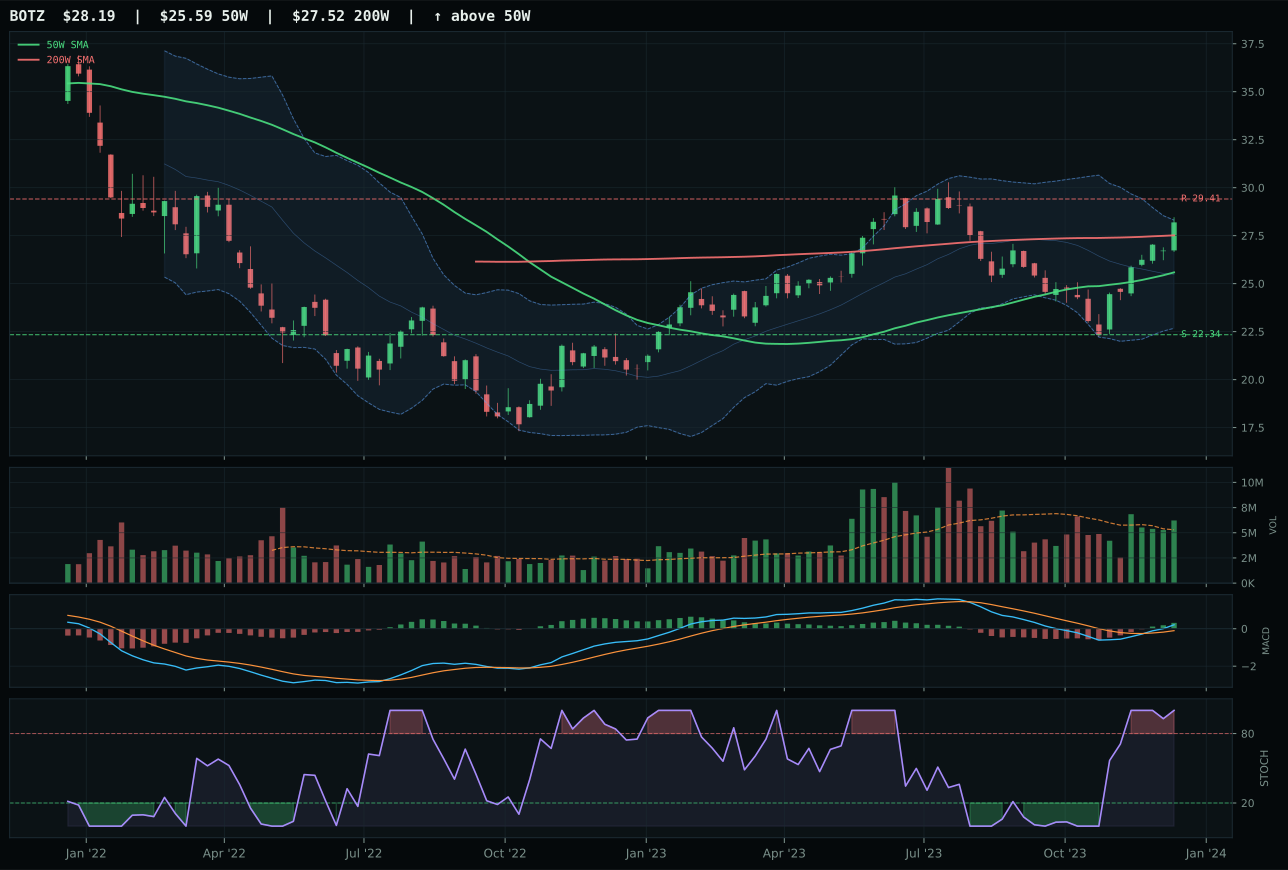
BOTZ has a neutral structure profile with 5.0% 13-week relative strength versus SPY.
A failed hold above support would weaken the setup.
Actionable but governed by invalidation levels.
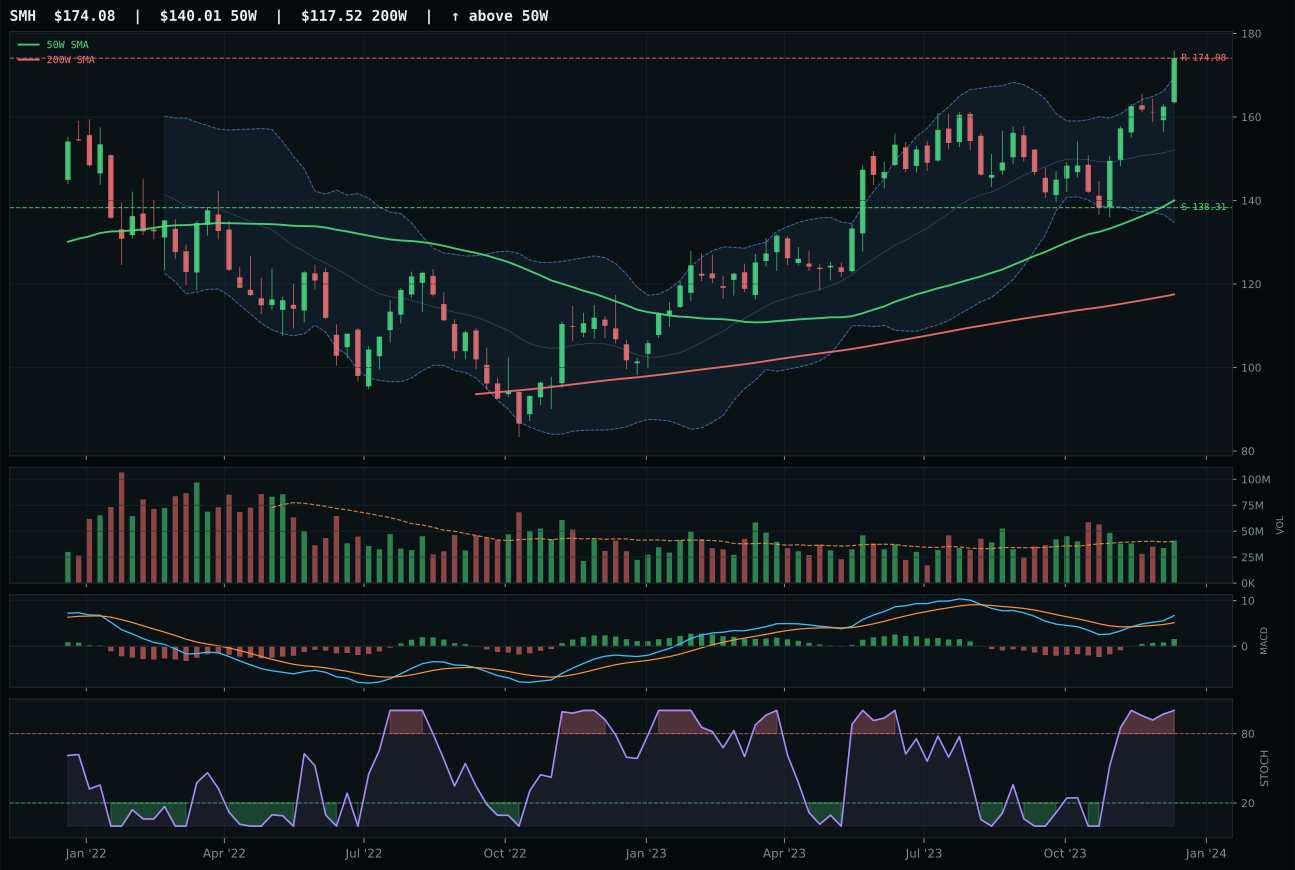
SMH has a vertical extension profile with 12.7% 13-week relative strength versus SPY.
A failed hold above support would weaken the setup.
Actionable but governed by invalidation levels.
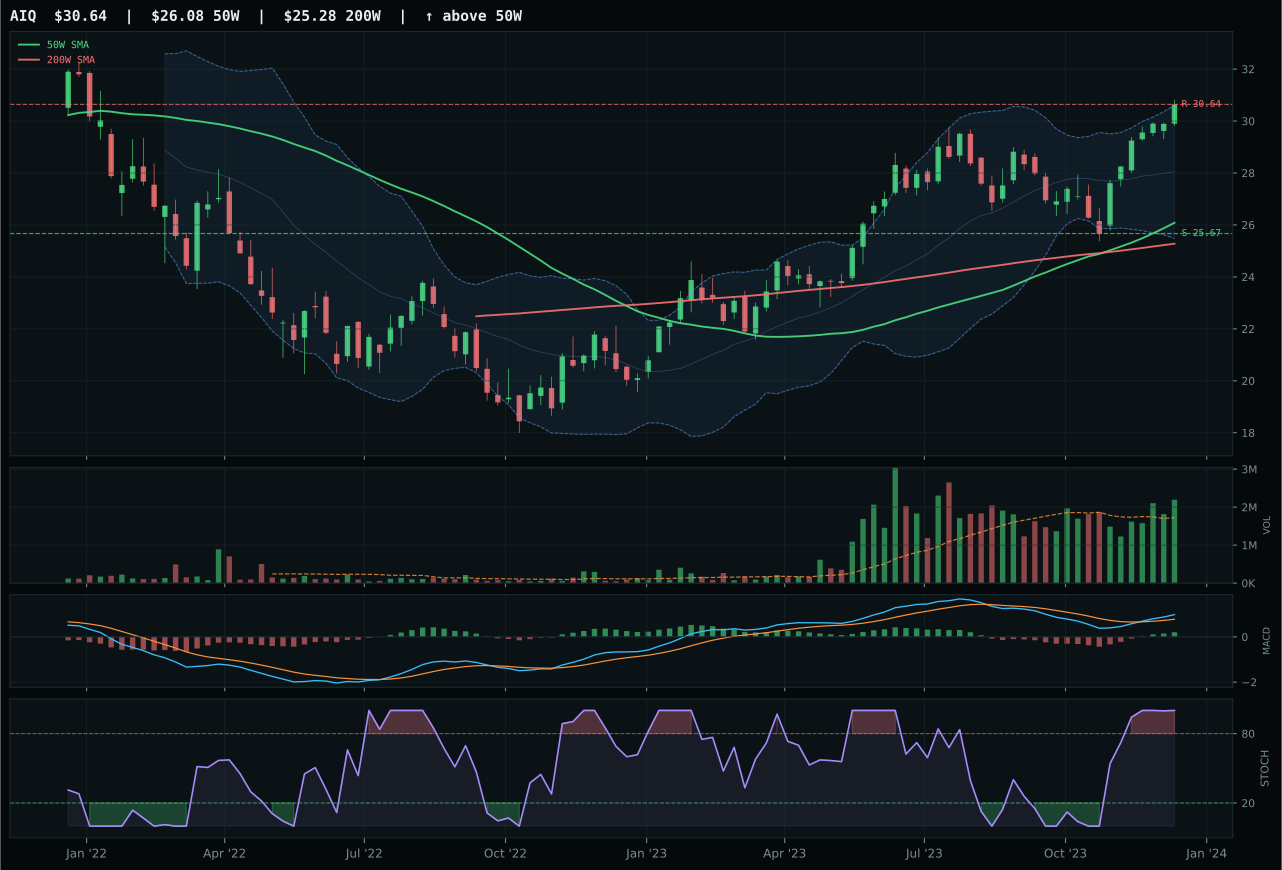
AIQ has a vertical extension profile with 3.7% 13-week relative strength versus SPY.
A failed hold above support would weaken the setup.
Actionable but governed by invalidation levels.
BOTZ defeats SMH and AIQ by posting a superior timing score (67.0 versus SMH's 37.0) despite lower absolute momentum, a distinction that matters more in this market phase than raw thirteen-week returns. The 10.2% distance from the 50-week moving average sits in the optimal entry zone—close enough to suggest conviction, far enough to avoid the overleveraged extensions that plague SMH's 24.3% gap. Neutral structure (79.3) and above-average volume participation (1.17x the 20-week average) indicate that robotics and physical AI are being accumulated methodically rather than squeezed higher. SMH's 12.7% relative strength to SPY looks compelling until you notice it compresses to just 7.7% category-relative advantage, a sign that semiconductor gains are being driven by broader risk appetite rather than unique AI-supply catalysts; BOTZ's 0.0% category-relative strength masks the fact that it is leading on a cleaner, less extended technical setup.
AI captures the second top-2 overweight slot at 10% with a 71.6 score anchored on strong technical evidence (88.0) but tempered by modest macro fit (47.0) in a disinflation environment where AI growth sponsorship carries just a plus-fourteen descriptor while liquidity stress subtracts twelve. The category benefits from risk appetite remaining active (+10) and real asset sponsorship embedded in compute hardware demand, but credit stress and liquidity headwinds create a timing tension: the setup is clean and well-positioned, yet macro conditions could shift quickly if financial conditions tighten. BOTZ's 67.0 timing score and 100.0 momentum confirmation provide a technical buffer against that macro shift, making it the preferred expression of AI exposure in a portfolio that is already tilted toward growth. This allocation size reflects a view that AI adoption remains durable but that entry timing and positioning matter more than conviction about the structural thesis.
Precious Metals — GLD
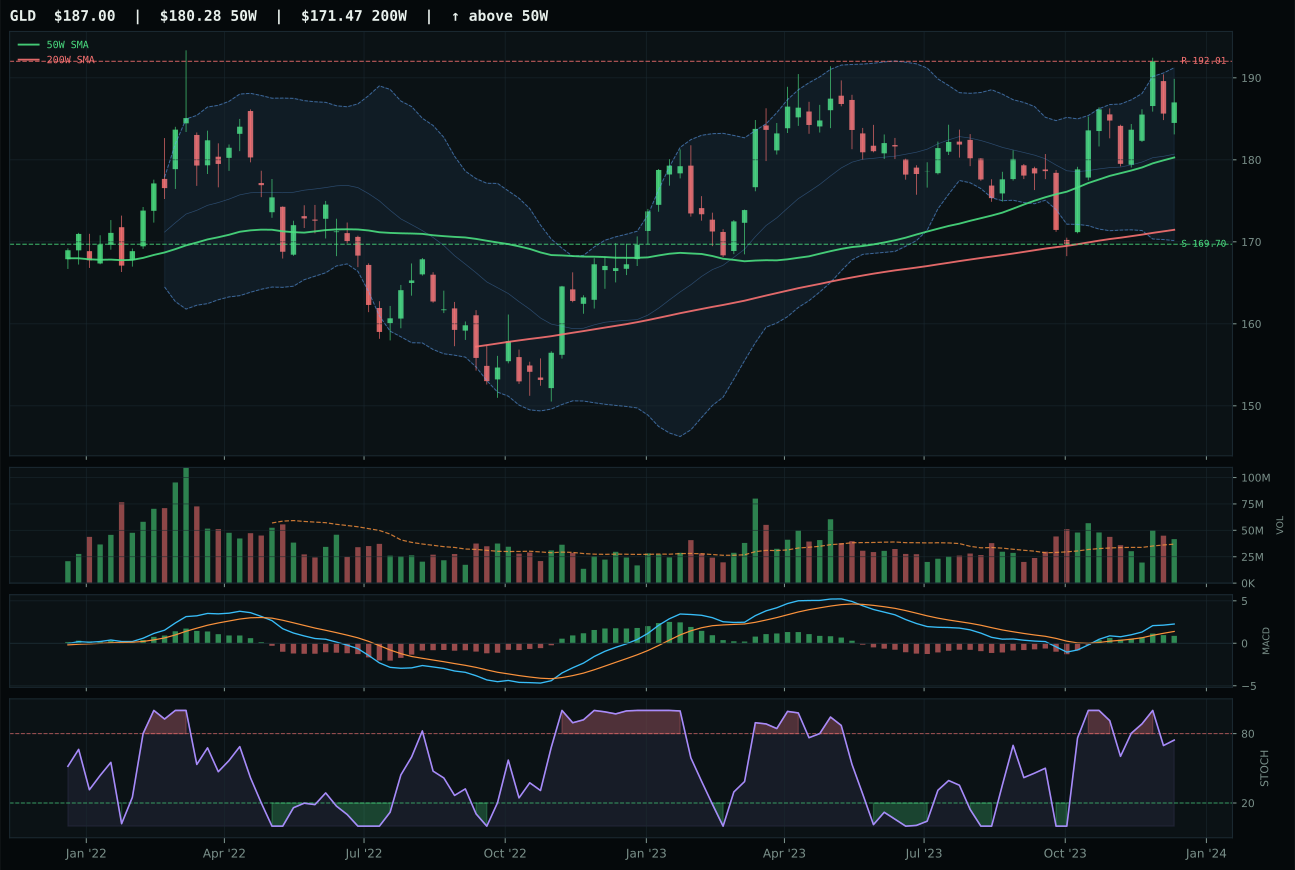
GLD has a neutral structure profile with -1.0% 13-week relative strength versus SPY.
A failed hold above support would weaken the setup.
Actionable but governed by invalidation levels.
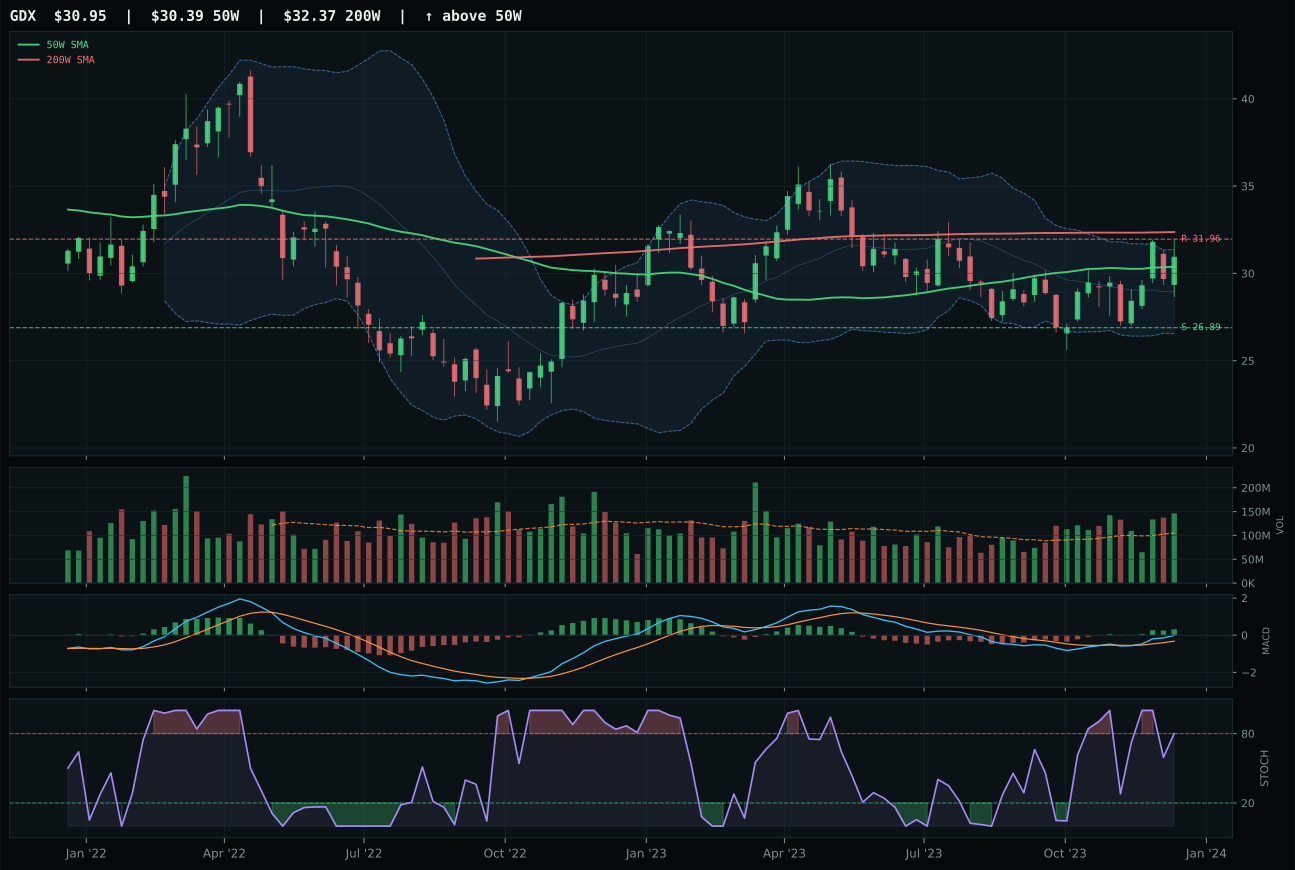
GDX has a compression near 50W profile with -1.7% 13-week relative strength versus SPY.
A failed hold above support would weaken the setup.
Actionable but governed by invalidation levels.
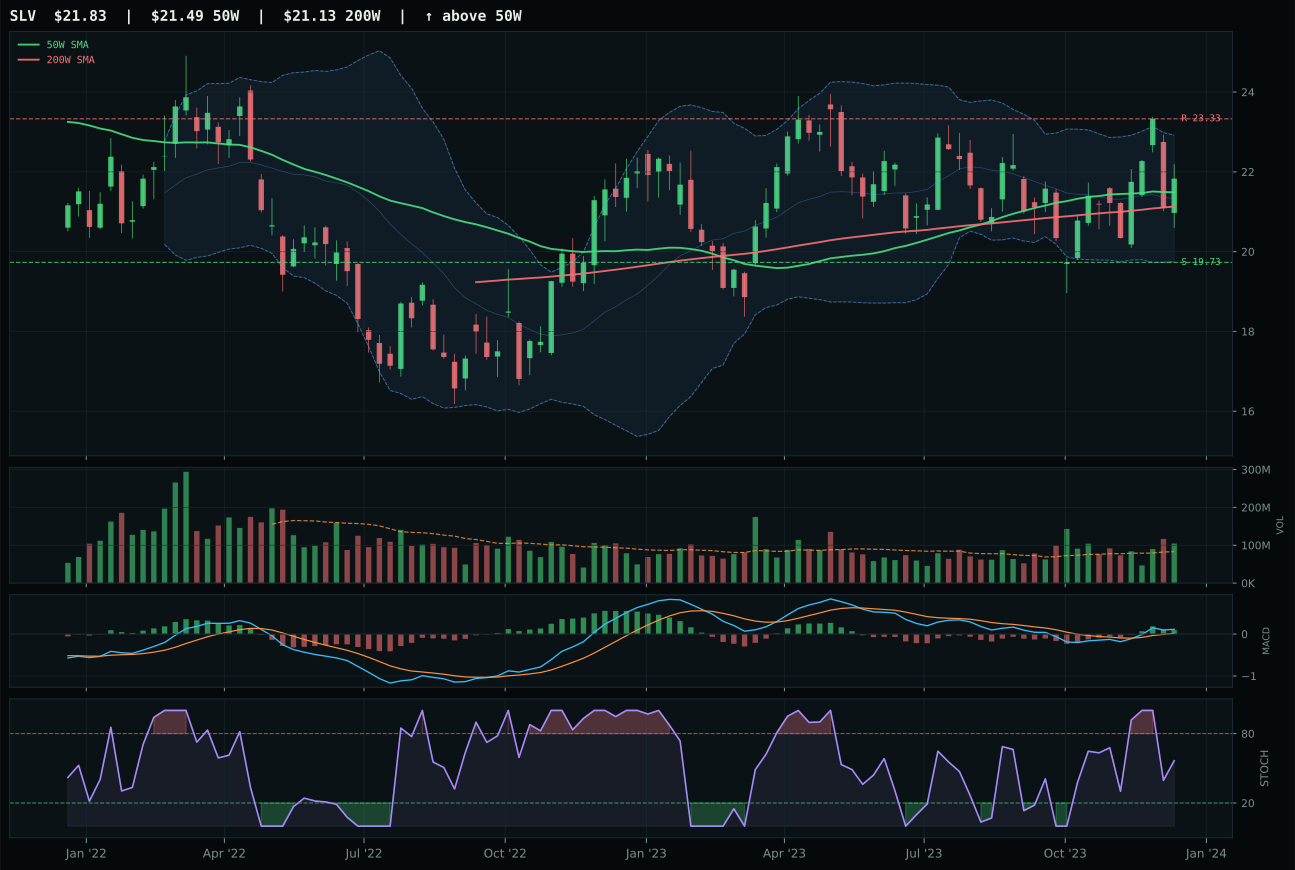
SLV has a compression near 50W profile with -2.4% 13-week relative strength versus SPY.
A failed hold above support would weaken the setup.
Actionable but governed by invalidation levels.
GLD takes the category on a 0.7% category-relative strength edge over GDX despite an equally tight overall score margin of just 0.1 points, a split-hair decision rooted in cleaner chart structure (78.0 versus 74.0) and superior timing (90.0 versus 82.0). The 3.7% distance from the 50-week moving average positions gold in the optimal accumulation window, far enough from the fast-moving average to signal institutional demand yet close enough to avoid the overbought extremes that plague extended rallies. Volume at 1.13x the 20-week average and above-average participation confirm active buying, while stochastic RSI is falling and neutral—a sign that momentum is moderating in a healthy consolidation rather than rolling over. GDX's overbought momentum (stochastic RSI rolling over from 1.00) and weaker category-relative strength at 0.0% suggest that miners have run ahead of the precious metals complex. The minus 1.0% relative strength to SPY appears weak until you note that both GLD and GDX are negative to SPY, a regime where absolute trend quality matters more than category leadership.
Precious Metals earns a 5% allocation as a tier-2 category with a 67.2 score that reflects robust technical evidence (79.2 for GLD) paired with supportive macro fit (54.0) where disinflation pressure contributes plus eight basis points and risk appetite active status subtracts minus four. This is the clearest case of macro-technical alignment in the tier-2 sleeve: disinflation regimes historically favor monetary hedges like gold, and the category's 98.5 trend score (price above both 50W and 200W with a stable 0.2% slope) confirms that the structural setup is constructive. The primary constraint is timing and extension overhead: gold sits near 52-week highs with very limited upside room (resistance at 192.01 versus current price of 186.17) and 10.2% downside to support, an unfavorable asymmetry even in a beneficial macro environment. GLD's 90.0 timing score softens this concern by showing that the near-term chart is well-positioned for quiet accumulation near key support levels. In disinflation, gold deserves a holding position; at current valuations, it does not warrant an overweight.
Utilities & Infrastructure — PAVE
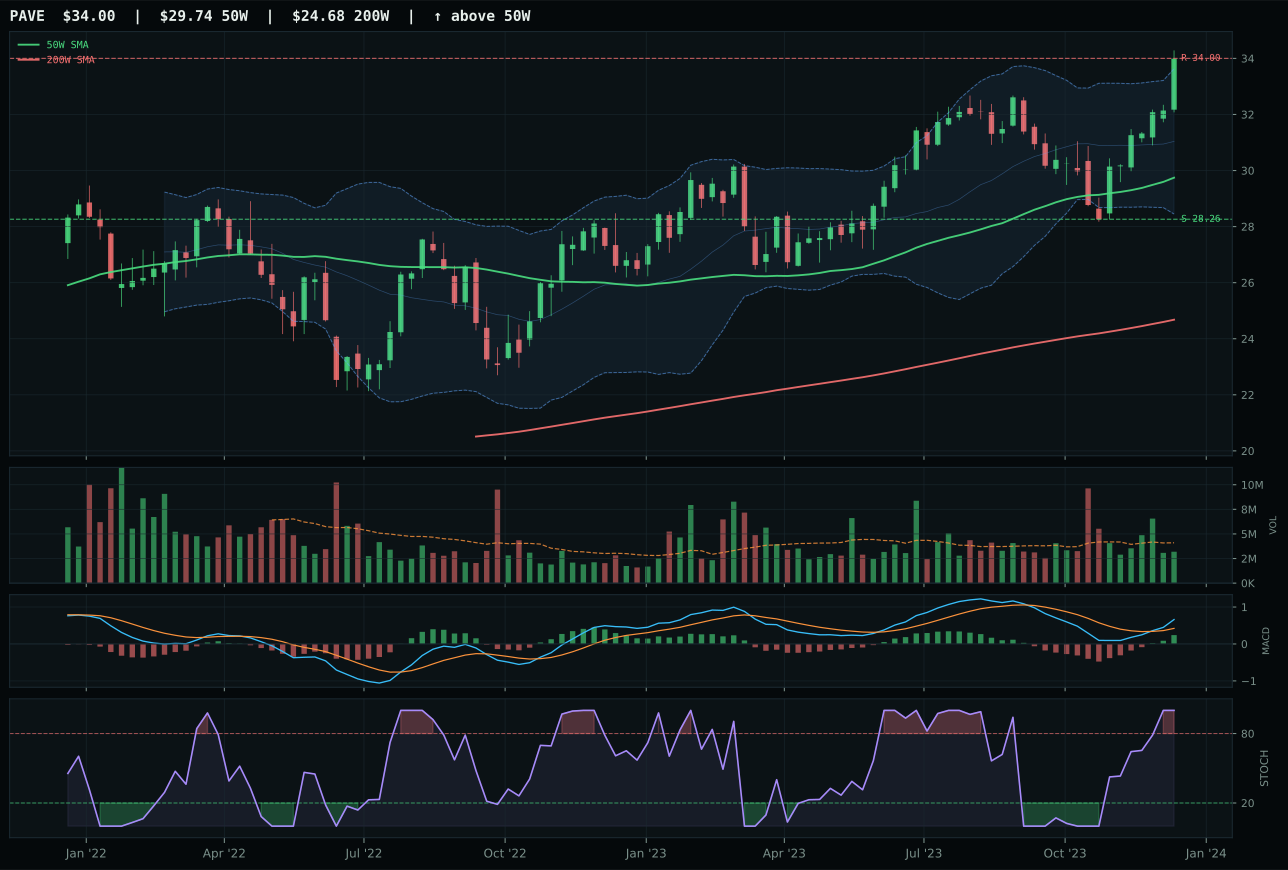
PAVE has a neutral structure profile with 4.0% 13-week relative strength versus SPY.
A failed hold above support would weaken the setup.
Actionable but governed by invalidation levels.
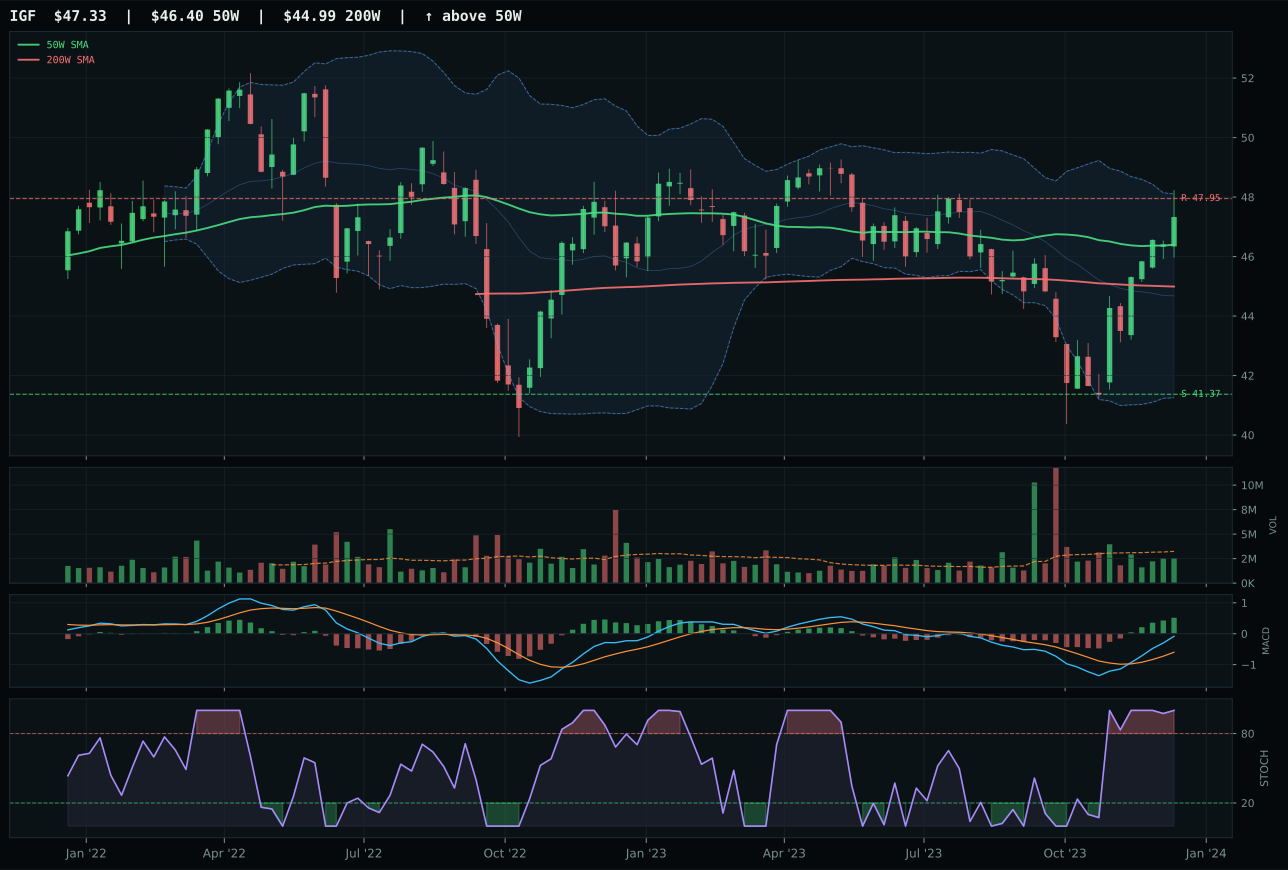
IGF has a compression near 50W profile with -2.4% 13-week relative strength versus SPY.
A failed hold above support would weaken the setup.
Actionable but governed by invalidation levels.
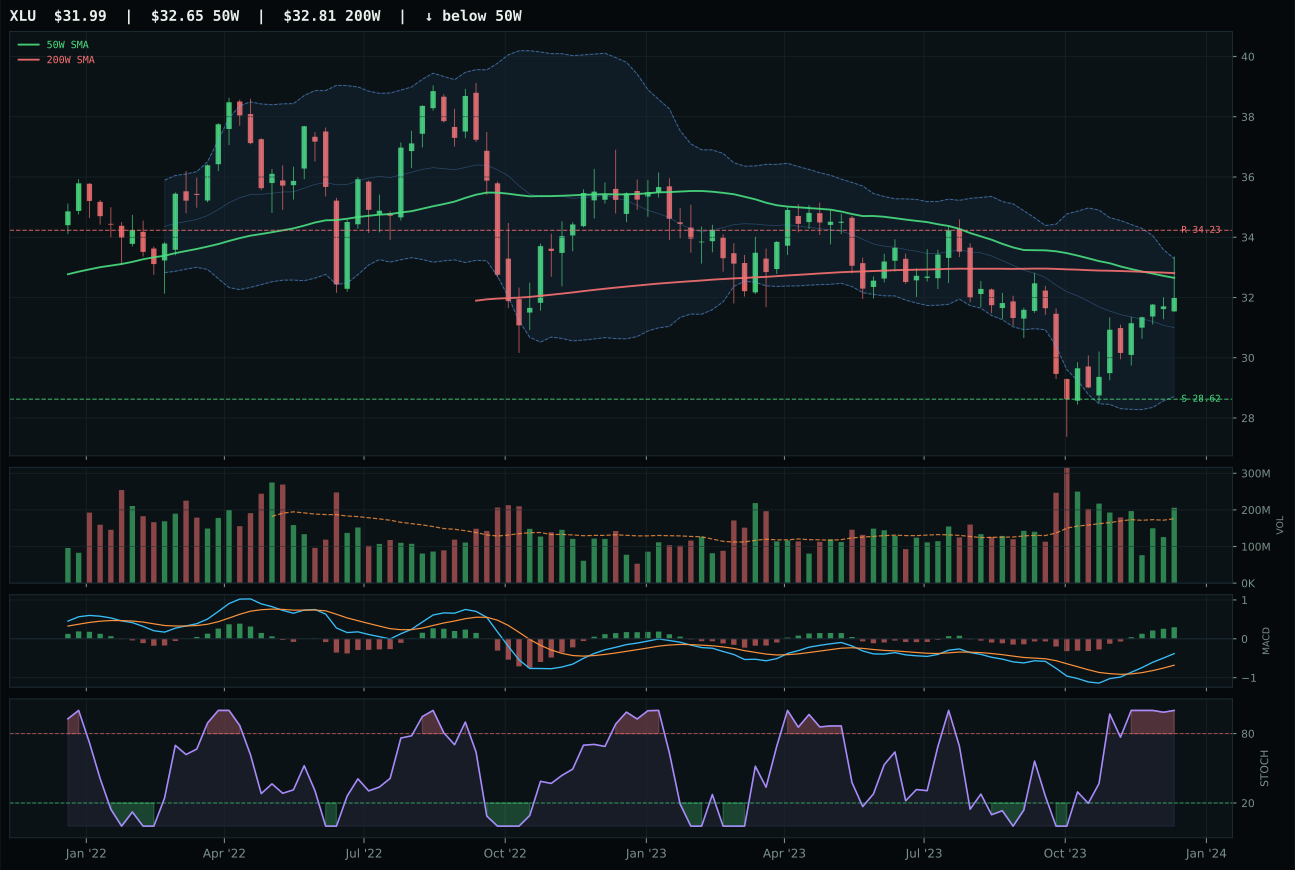
XLU has a compression near 50W profile with -7.3% 13-week relative strength versus SPY.
Extension and support failure are the main tactical risks.
Tracked, but not top-2 eligible because: structurally broken.
PAVE wins over IGF by a 1.3-point margin, the narrowest margin among all category decisions, reflecting category-relative strength of 6.5% that more than compensates for IGF's technically superior compression near the 50-week moving average. PAVE's 14.3% extension from the 50-week moving average is moderate, sitting in the sweet spot where accumulation can continue without entering the danger zone, and the 9.9% thirteen-week return combined with 4.0% relative strength to SPY demonstrates that domestic infrastructure is being systematically accumulated. Volume at 0.78x the 20-week average is neutral, a slight weakness compared to IGF's equal neutral participation, yet PAVE's 100.0 momentum confirmation score (driven by 8.8% four-week return and 6.5% category-relative leadership) suggests that buying momentum is accelerating even without the typical volume signature of institutional participation. IGF's compression near the 50-week moving average and superior timing score (100.0 versus PAVE's 59.0) make it the technical safe haven, but PAVE's domestic capex sponsorship and category-relative leadership matter more in this risk-on environment.
Utilities & Infrastructure earns a 5% allocation as tier-2 with a 60.8 score that benefits from solid technical evidence (85.2 for PAVE) and supportive macro fit (62.0 where disinflation helps the category at plus seven basis points). This is the clearest case of macro-technical alignment in tier-2: infrastructure benefits from lower long-term rates in a disinflation regime, and PAVE's positioning in domestic capex and construction cycles offers genuine leveraged exposure to the Biden-era infrastructure spending narrative. The 6.5% category-relative strength within the PAVE/IGF/XLU basket indicates that investors are explicitly choosing the domestic capex play over global income (IGF) or pure utility defensive positioning (XLU). Constraints include neutral volume (no institutional accumulation signature) and the fact that 14.3% extension from the 50-week moving average leaves little room for further near-term advance. Disinflation and modest risk appetite provide tailwinds, but this allocation should be thought of as a structural long-term positioning play rather than a near-term tactical opportunity. Ideal re-entry on weakness would come near the 50-week moving average (support at 28.26) with volume confirmation.
Emerging Markets — INDA
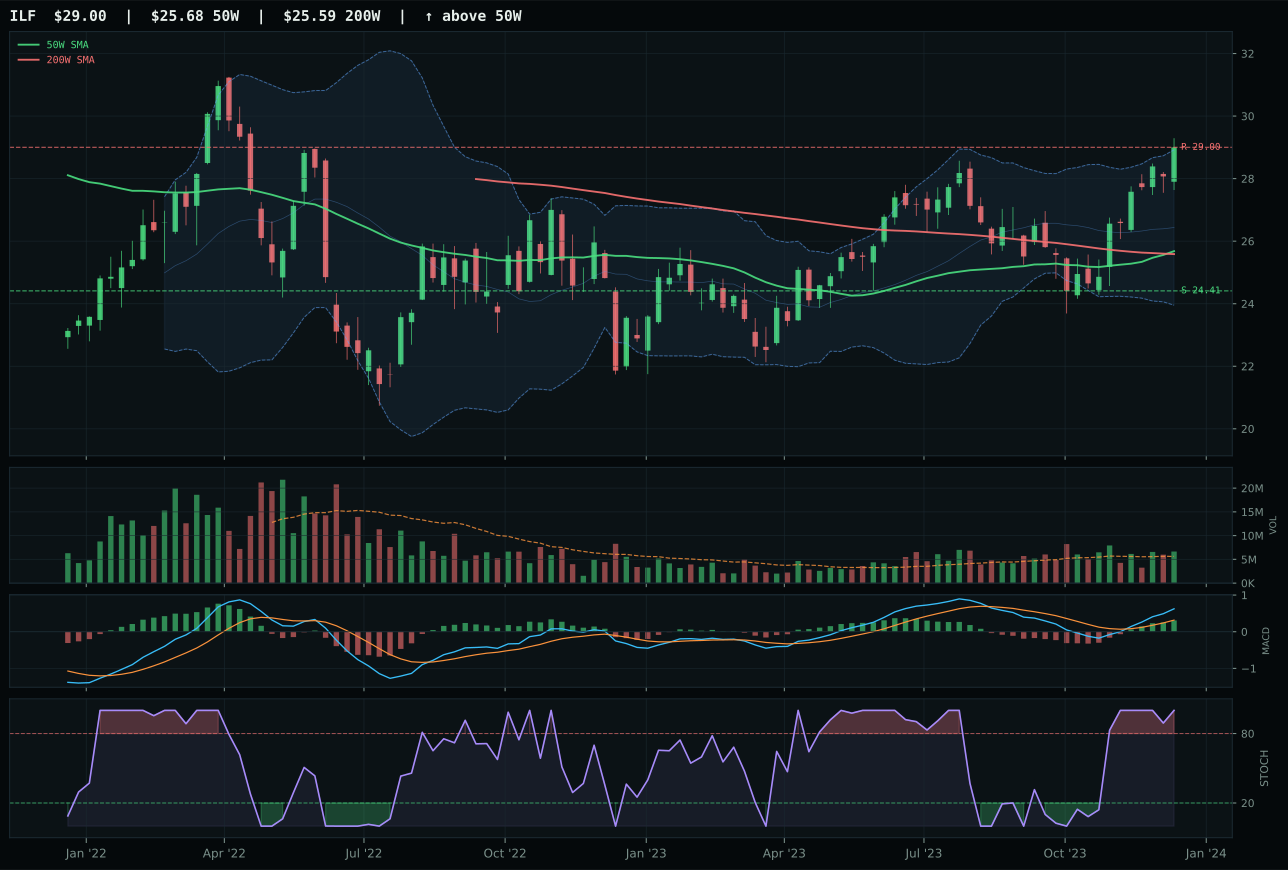
ILF has a neutral structure profile with 3.6% 13-week relative strength versus SPY.
A failed hold above support would weaken the setup.
Actionable but governed by invalidation levels.
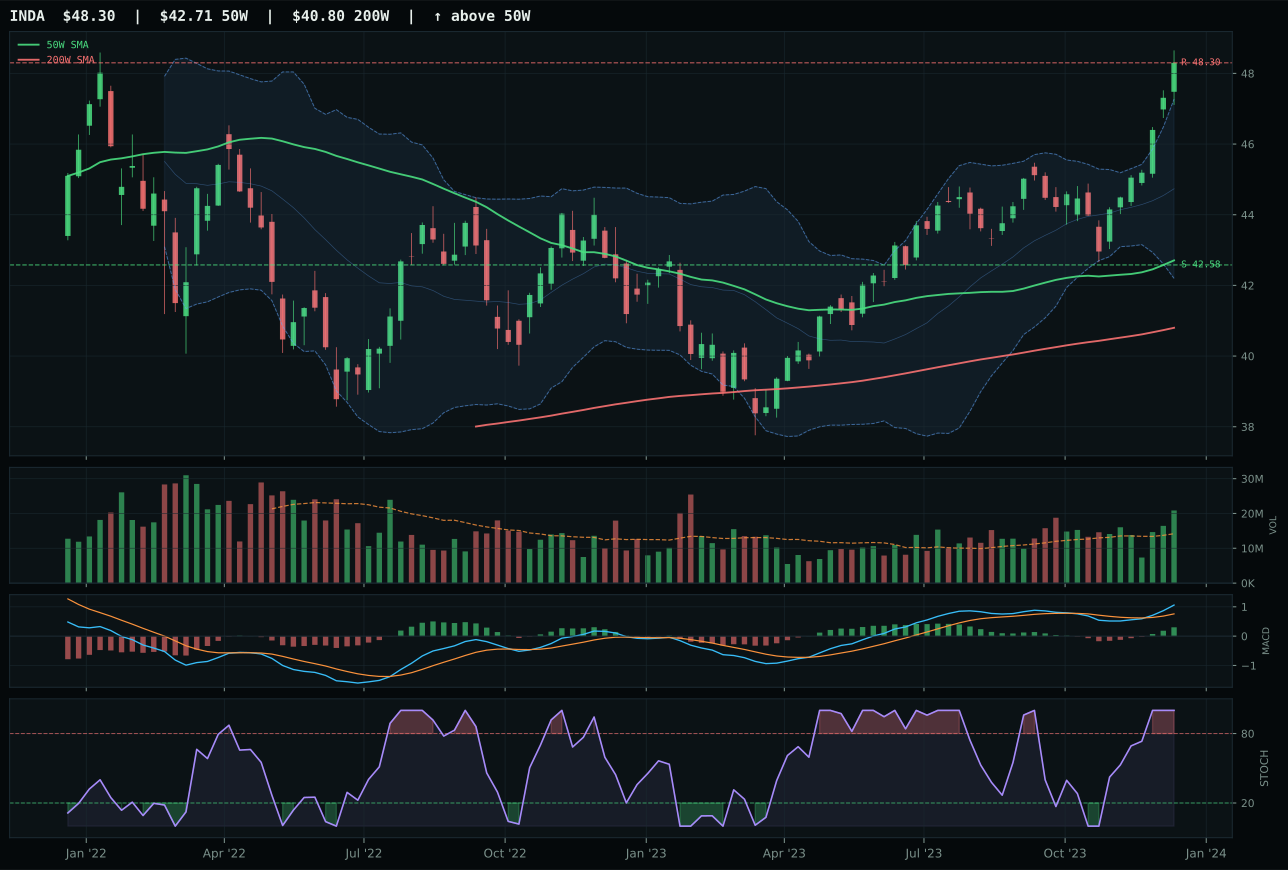
INDA has a neutral structure profile with 1.2% 13-week relative strength versus SPY.
A failed hold above support would weaken the setup.
Actionable but governed by invalidation levels.
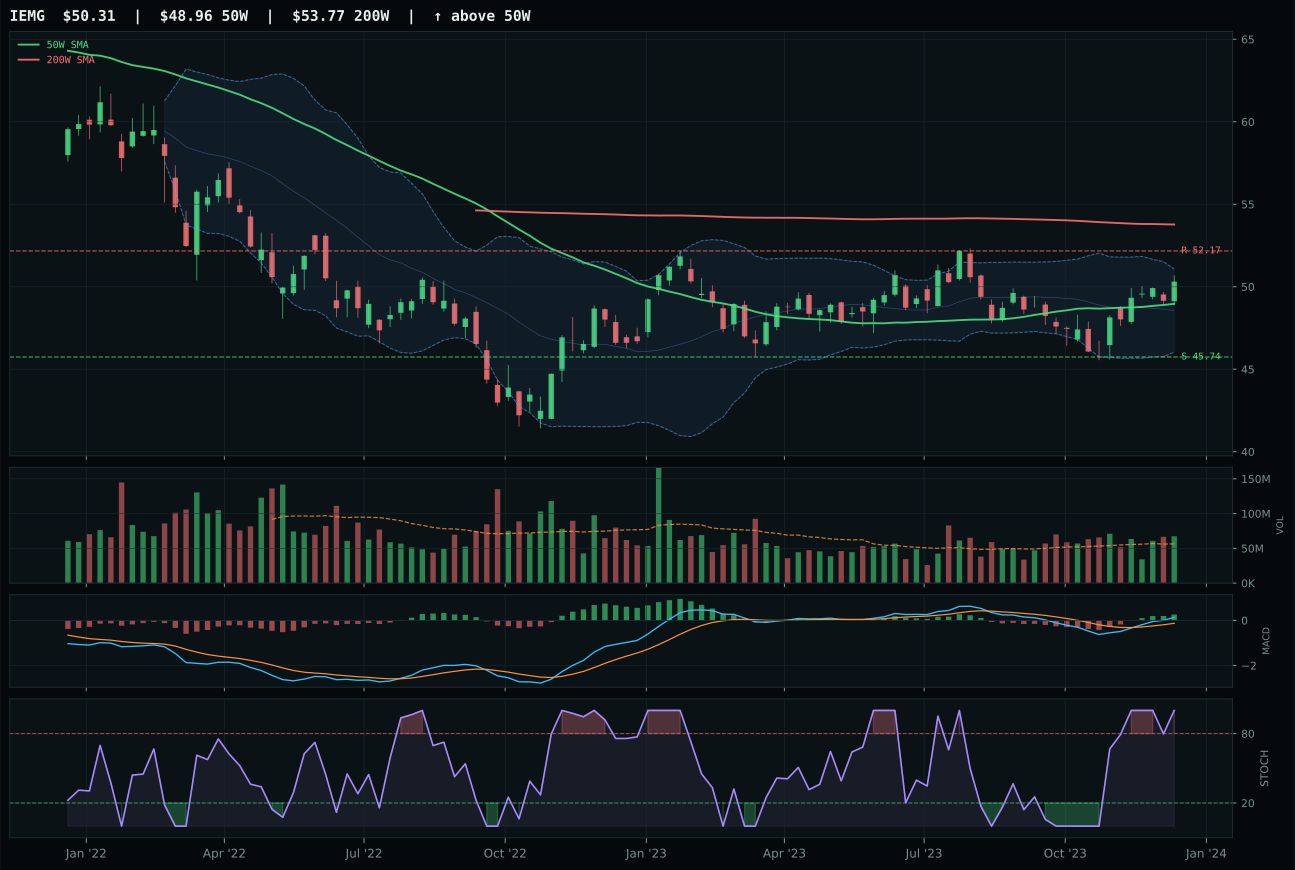
IEMG has a compression near 50W profile with -3.4% 13-week relative strength versus SPY.
A failed hold above support would weaken the setup.
Actionable but governed by invalidation levels.
INDA prevails over ILF and IEMG by posting category-relative strength at 0.0% and cleaner structure (81.6 versus ILF's 79.1), a marginal edge that reflects the quality of the consolidation near key support levels rather than any fundamental economic advantage. The 7.0% thirteen-week return and 1.2% relative strength to SPY are constructive but not commanding, signaling that India-specific exposure is being accumulated rather than aggressively accumulated. Volume at 1.47x the 20-week average is the strongest signal of institutional participation, and above-average buying confirms that buyers are stepping in above the 50-week moving average (13.1% extension) rather than scaling into dips. ILF's 3.6% SPY-relative strength and 9.5% thirteen-week return appear superior until you note the 2.4% category-relative advantage that reflects Latin America's commodity and value beta exposure—a regime that works only if commodity prices accelerate or if risk appetite tilts decisively toward cyclical reopening. INDA's more modest but steady accumulation pattern suits the current disinflation environment better than ILF's commodity-dependent profile.
Emerging Markets ranks tier-2 at 5% allocation with a 58.1 score that reflects strong technical evidence (84.4 for INDA) undermined by weak macro fit (48.0) in a regime where risk appetite is active (+8) but credit stress and liquidity stress both subtract minus five basis points each. The category's technical setup is clean and well-positioned—price above both moving averages, volume confirmation, bullish MACD—but emerging markets are structurally vulnerable to dollar strength, credit tightening, and capital flight in risk-off scenarios. INDA's 13.1% extension from the 50-week moving average is the least severe in the Emerging Markets basket, offering better intermediate positioning than ILF's more extended setup, but the category overall lacks the macro tailwinds that would justify top-2 status. India-specific growth narratives (outsourcing, AI infrastructure, energy transition) provide a supportive backdrop, but portfolio allocation in a disinflation regime should favor commodities, precious metals, and defensive infrastructure over discretionary emerging market exposure. Hold INDA as a modest conviction bet on India's structural growth while acknowledging that any credit stress event would likely trigger sharp selloffs.
Defense & Aerospace — ITA
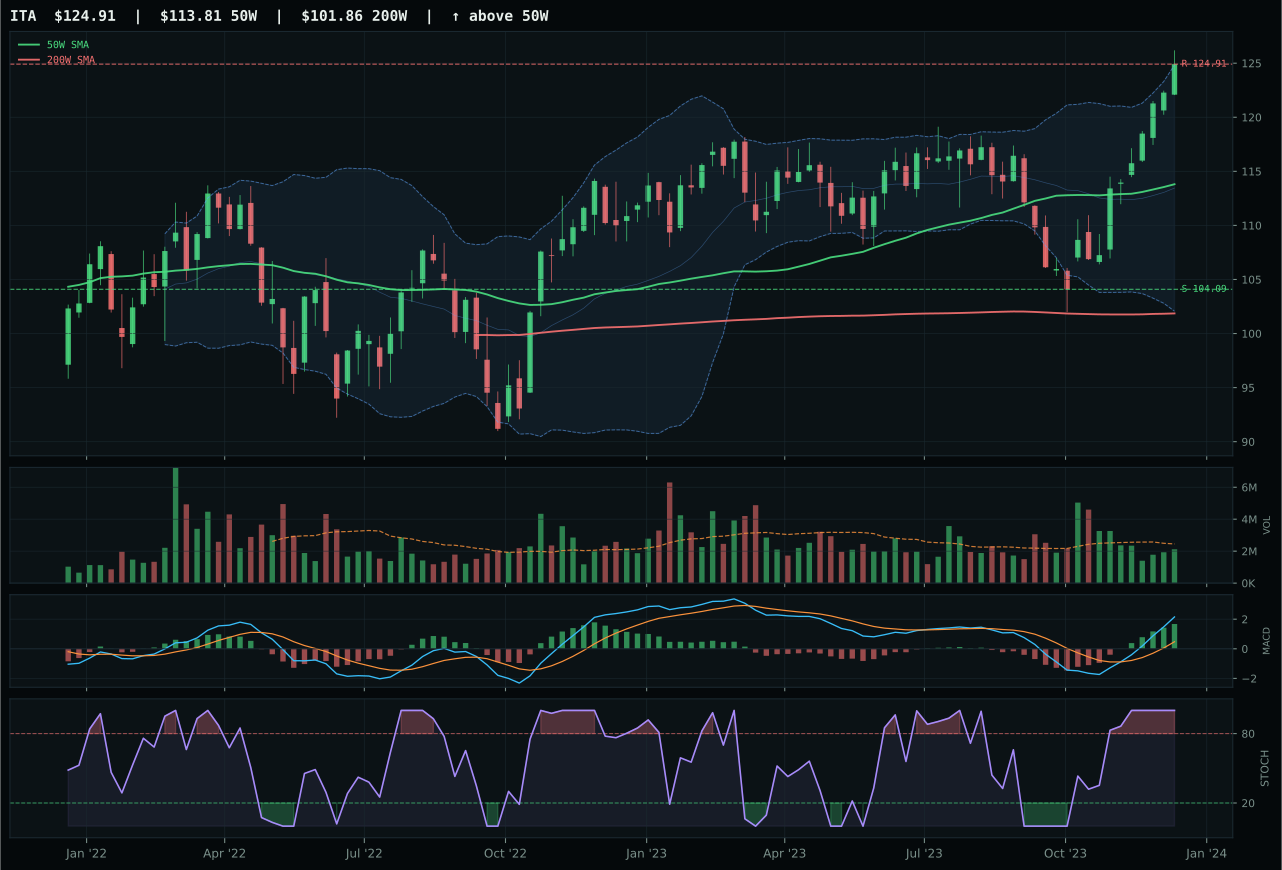
ITA has a neutral structure profile with 7.9% 13-week relative strength versus SPY.
A failed hold above support would weaken the setup.
Actionable but governed by invalidation levels.
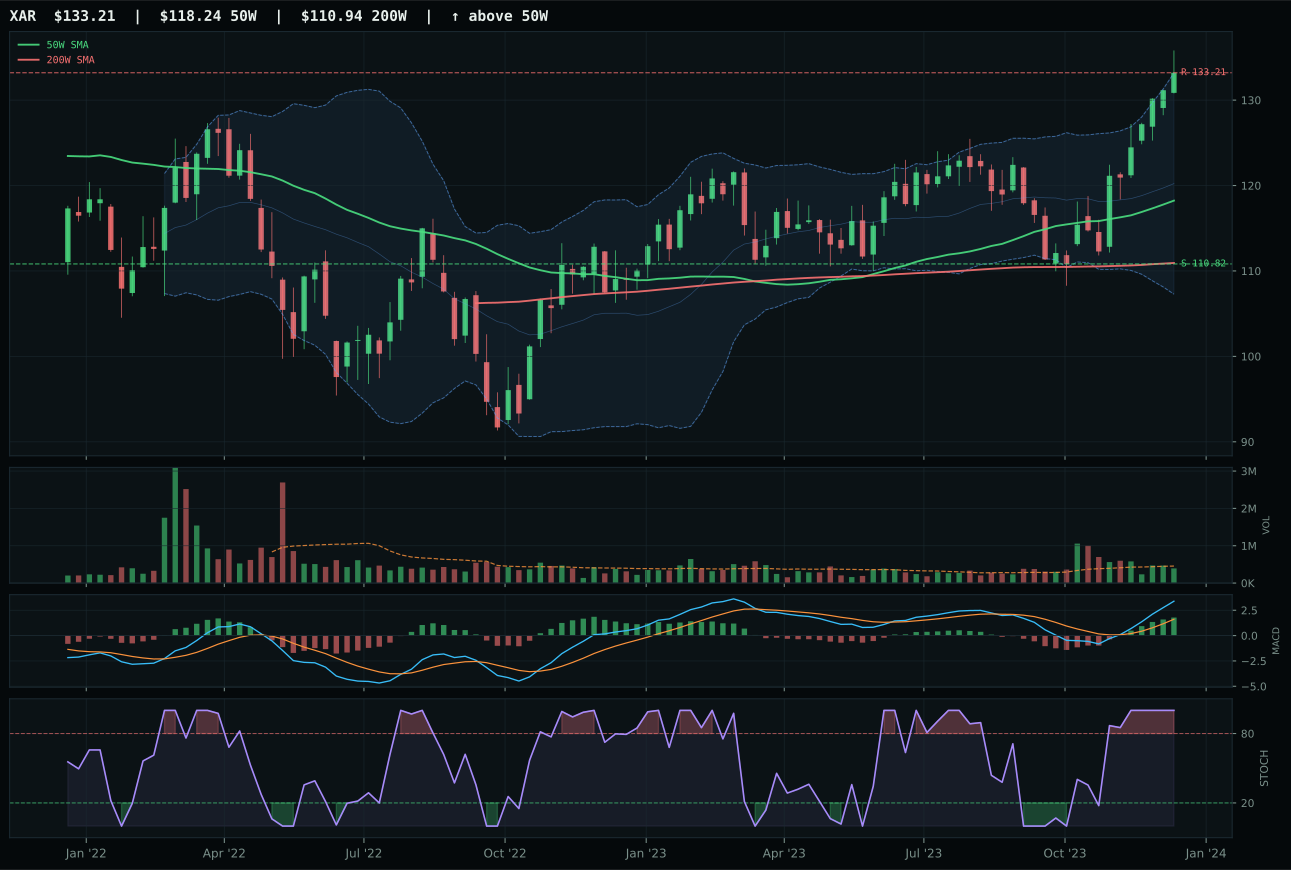
XAR has a neutral structure profile with 8.4% 13-week relative strength versus SPY.
A failed hold above support would weaken the setup.
Actionable but governed by invalidation levels.
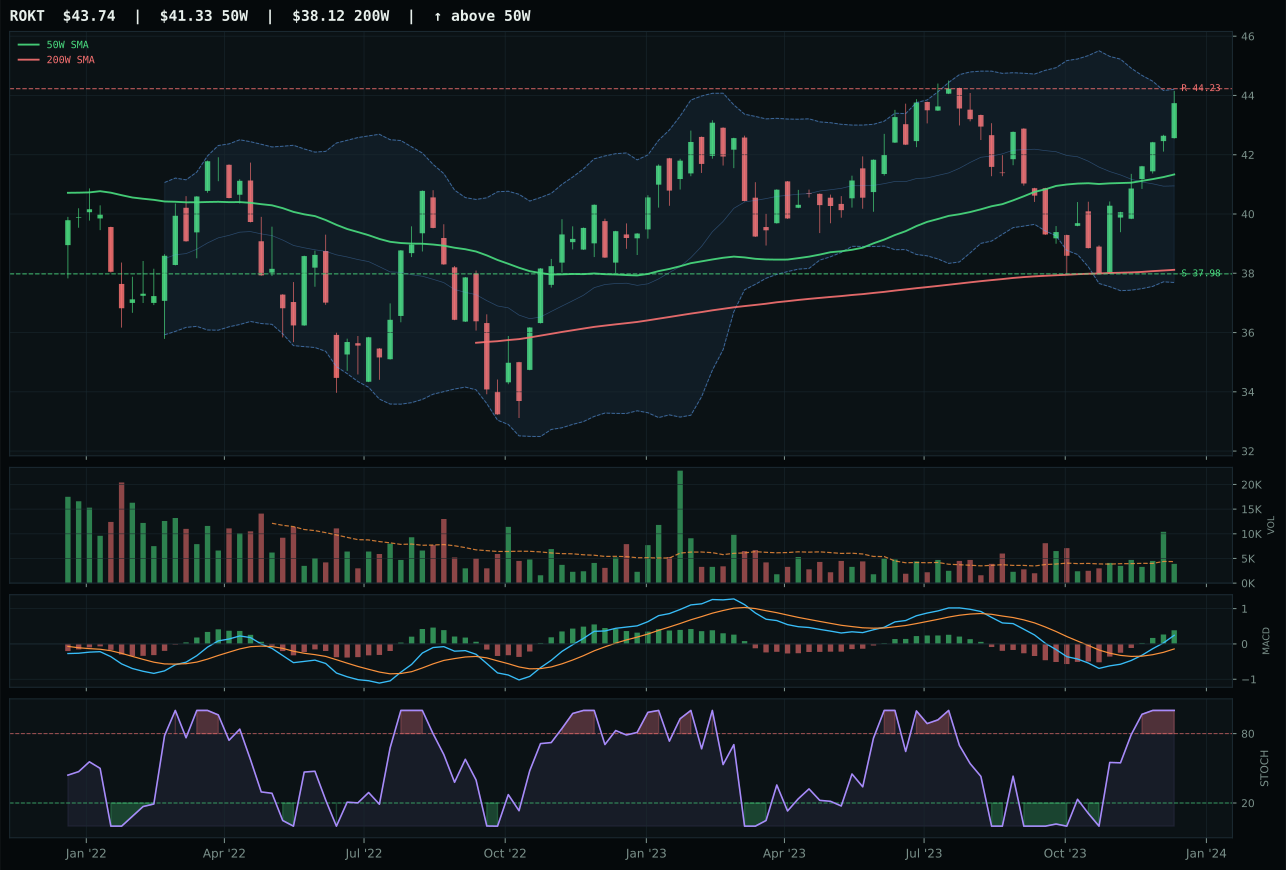
ROKT has a neutral structure profile with 1.8% 13-week relative strength versus SPY.
A failed hold above support would weaken the setup.
Tracked, but not top-2 eligible because: .
ITA edges XAR by 3.0 points on a superior timing score (75.0 versus 59.0) and equal-footing category-relative strength at 0.0%, confirming that defense-prime durability has not yet rolled over despite the 9.8% gap from the 50-week moving average. Volume sits neutral at 0.86x the 20-week average—a signal that the move lacks the sponsorship of genuine accumulation, yet the 13.7% thirteen-week return and bullish, improving MACD tell a story of steady institutional buying. XAR's near-identical 8.4% relative strength to SPY and tighter 14.3% thirteen-week return suggest the category expression is slightly cheaper, but ITA's cleaner structure (80.2 versus 77.1) and superior timing score indicate that chart setup and momentum quality trump valuation in this scanning regime. Both are near or at 52-week highs with extension overhead, a fact that limits upside target room and keeps this category as a holding rather than an aggressive accumulation opportunity.
Defense & Aerospace ranks as a tier-2 category at 5% allocation after posting a 57.2 composite score that reflects solid technical evidence (85.0 for ITA) offset by weak macro fit (47.0) in a disinflation environment where the category receives no active macro descriptor support. Credit stress is marginally positive (+2) and liquidity stress marginally negative (-4), leaving the category exposed to any shift toward risk-off conditions or multiple compression on discretionary military spending. The category is eligible but not competitive against Technology and AI on either technical or macro grounds; it would require either a credit spike (supporting safe-haven defense spending narratives) or a liquidity event to earn promotion to top-2 status. For now, the 5% sleeve acknowledges that ITA's trend remains constructive and relative strength versus SPY is positive, but the risk-reward at current extensions and the macro environment's indifference argue for underweight positioning.
Nuclear Energy — URA
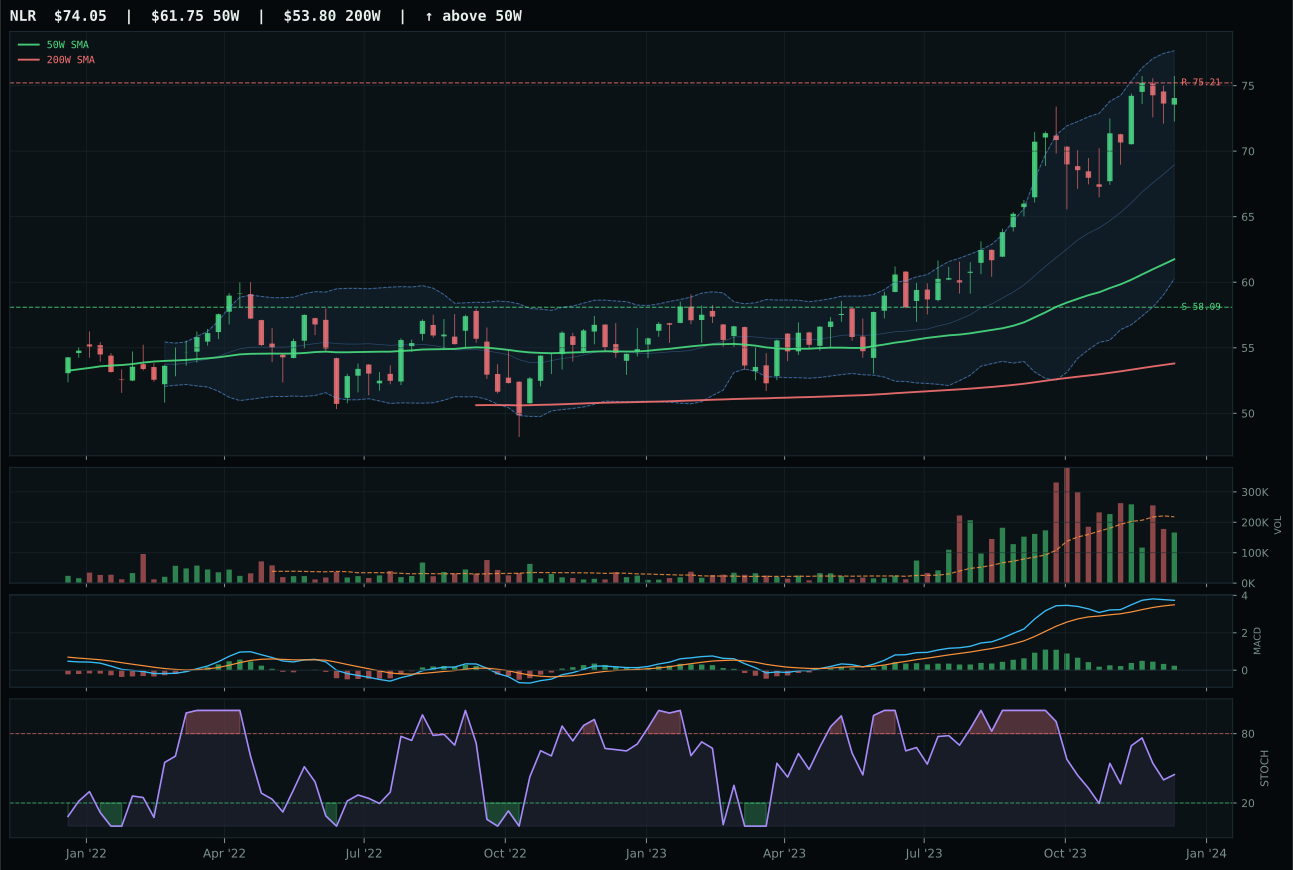
NLR has a vertical extension profile with -1.1% 13-week relative strength versus SPY.
A failed hold above support would weaken the setup.
Actionable but governed by invalidation levels.
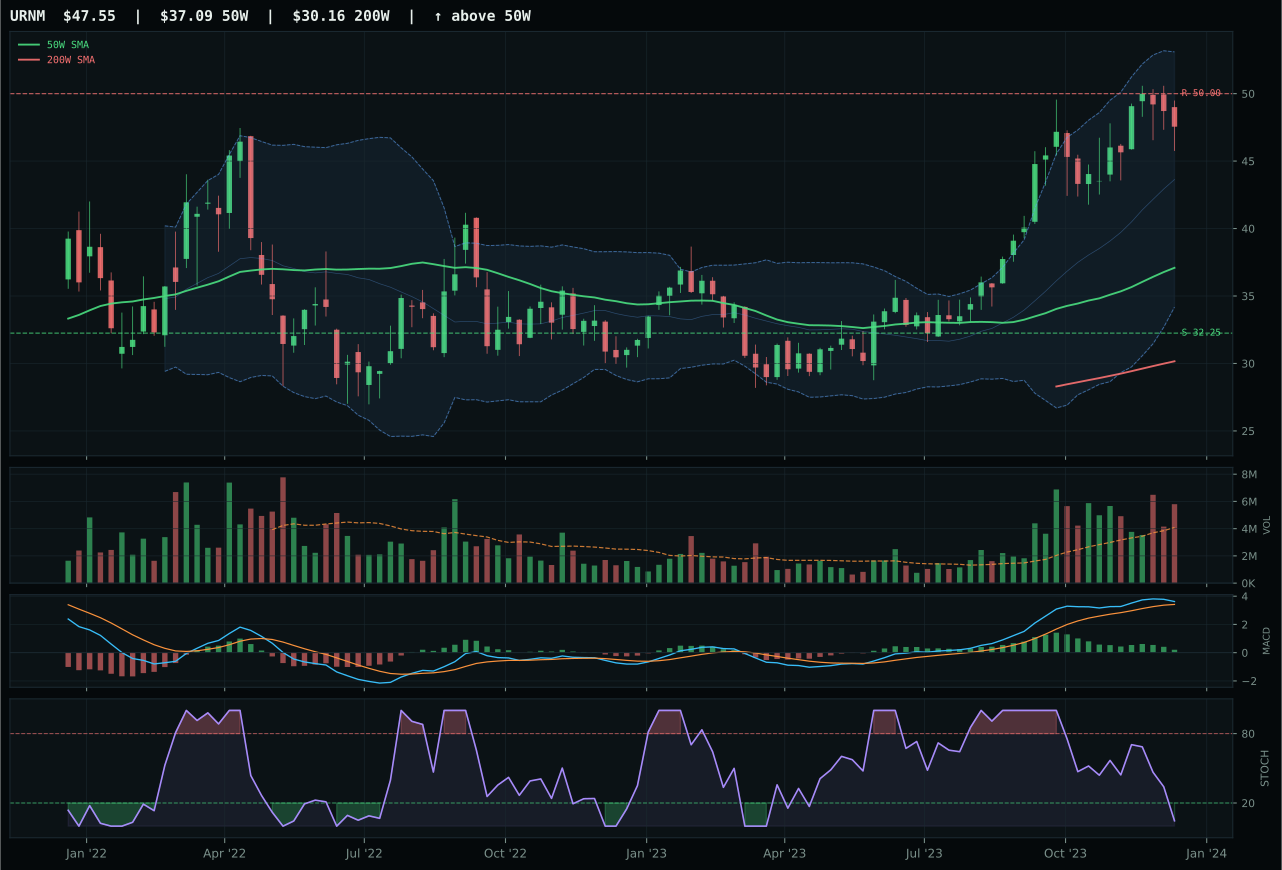
URNM has a vertical extension profile with 0.3% 13-week relative strength versus SPY.
A failed hold above support would weaken the setup.
Actionable but governed by invalidation levels.
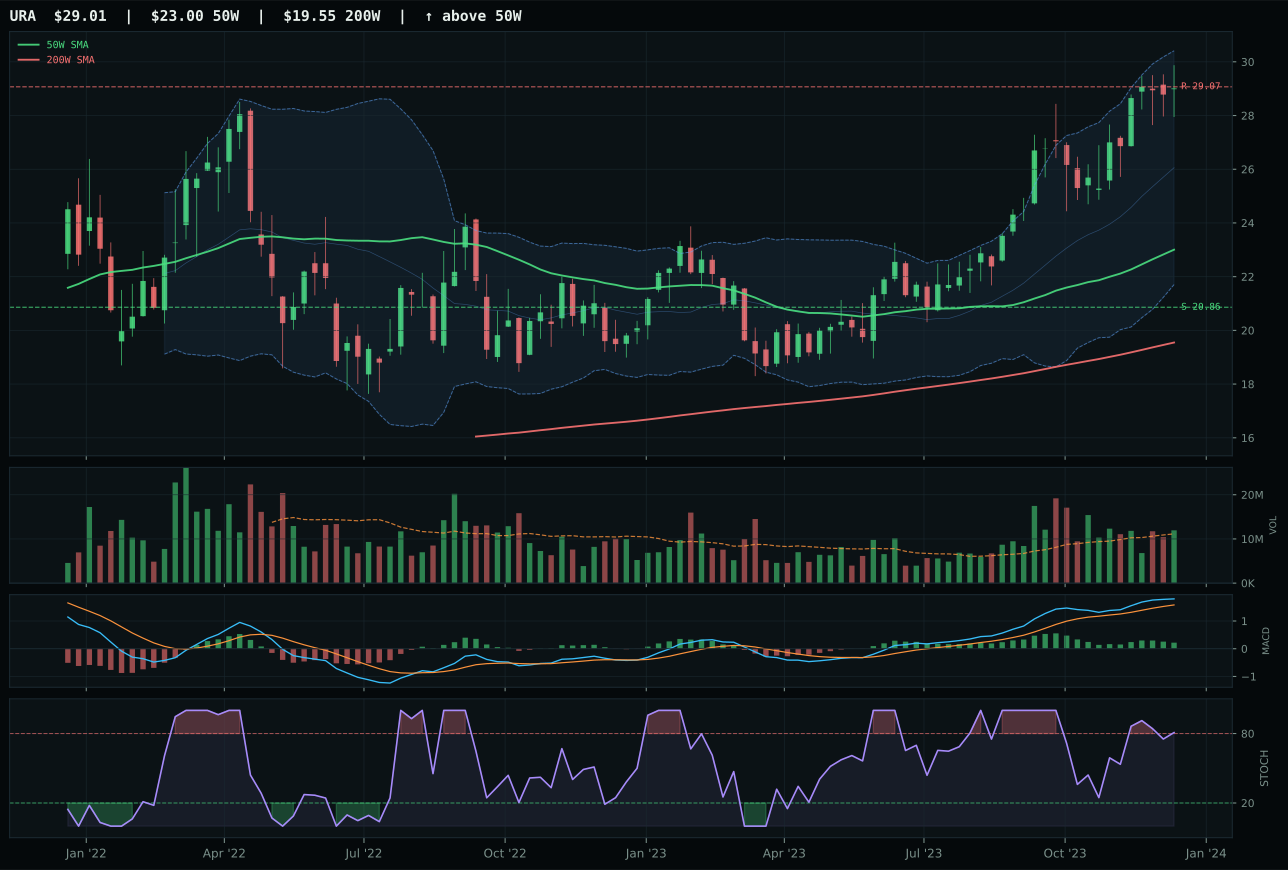
URA has a vertical extension profile with 2.8% 13-week relative strength versus SPY.
A failed hold above support would weaken the setup.
Actionable but governed by invalidation levels.
URA wins the nuclear category on the strength of a 2.5% category-relative advantage and a 100.0 trend score (price above both 50W and 200W) that is unmatched in the trio, despite being the most extended on a 26.1% gap from the 50-week moving average. This extension is the primary reason timing scores just 22.0, a sharp penalty that reflects the reality that every new buyer is chasing the move rather than accumulating at discount. NLR and URNM both show superior positioning near technical support and more moderate extensions, but URA's stronger category-relative strength and cleanest trend structure (100.0 for price above both averages with a 0.8% positive 50W slope) override their timing advantages. MACD is bullish but flattening—a yellow light for momentum—and stochastic RSI at 0.81 is overbought rolling over, suggesting that the run may be near-term exhaustion. The 67.5 momentum confirmation score reflects the tension between solid thirteen-week performance (8.7%) and a 4-week return of just 1.3%, a divergence that warns of short-term consolidation or pullback risk.
Nuclear Energy holds a 5% allocation despite a 50.0 composite score that reflects balanced but uninspiring technicals paired with neutral macro conditions. Real asset sponsorship at plus seven basis points and AI growth sponsorship at plus five provide modest category support in a disinflation environment, but no category-specific macro descriptors apply, leaving nuclear in the macro gray zone. The 38.3 technical evidence score for URA reflects the collision between a perfect trend (100.0) and terrible timing (22.0) and risk-reward (37.1 upside capacity, 39.1% downside risk); the category is extended but not broken, constructive but not compelling. URA's 26.1% extension from the 50-week moving average and stochastic RSI overbought roll-over suggest that a consolidation or pullback toward the 20-week average is likely within the next 2-4 weeks. Hold this position as a long-term real asset and energy transition hedge, but avoid adding into the extension; ideal re-entry would come on a 10-12% pullback with volume accumulation near the 20-week moving average. Nuclear's allocation is justified on the structural energy transition thesis, not on near-term momentum.
Industrial Metals — COPX
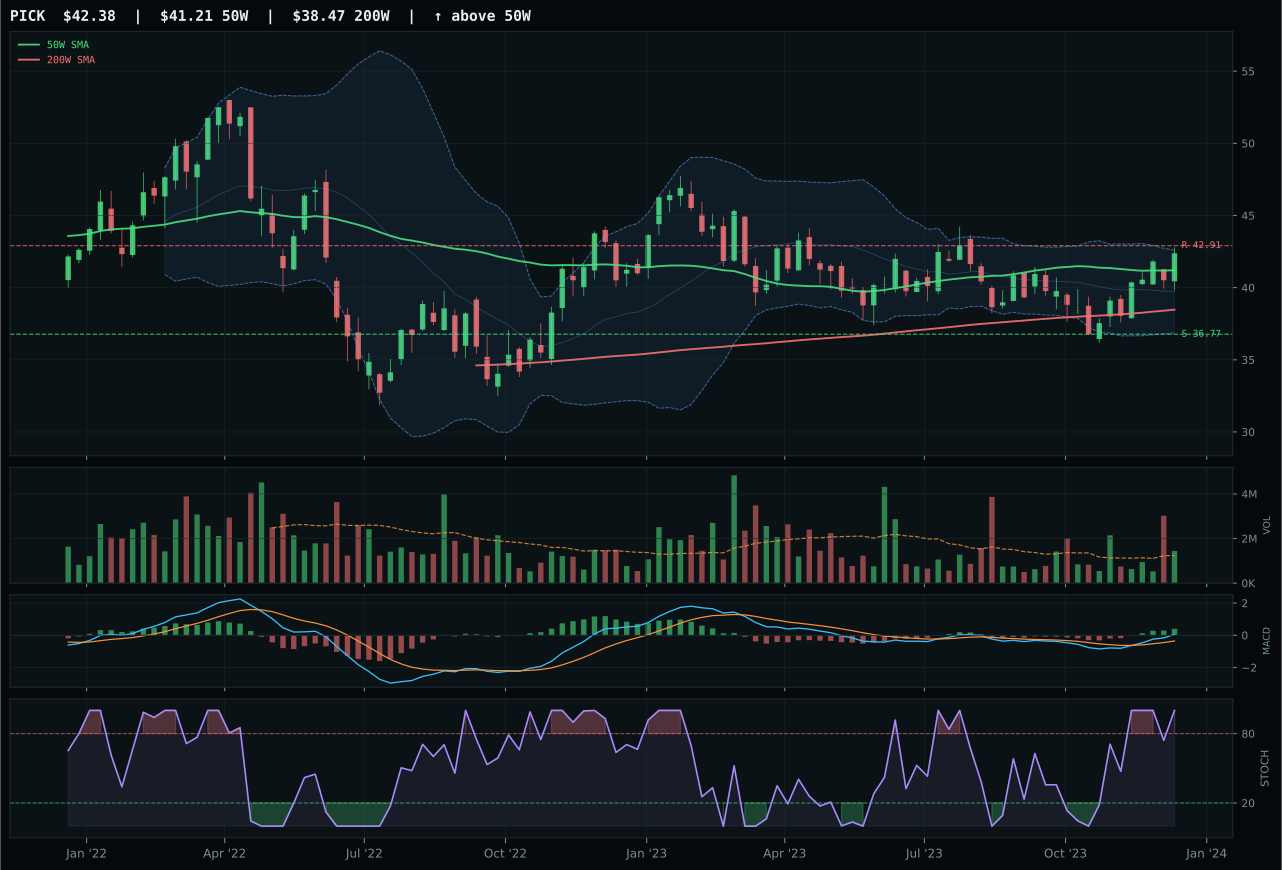
PICK has a compression near 50W profile with -2.3% 13-week relative strength versus SPY.
A failed hold above support would weaken the setup.
Actionable but governed by invalidation levels.
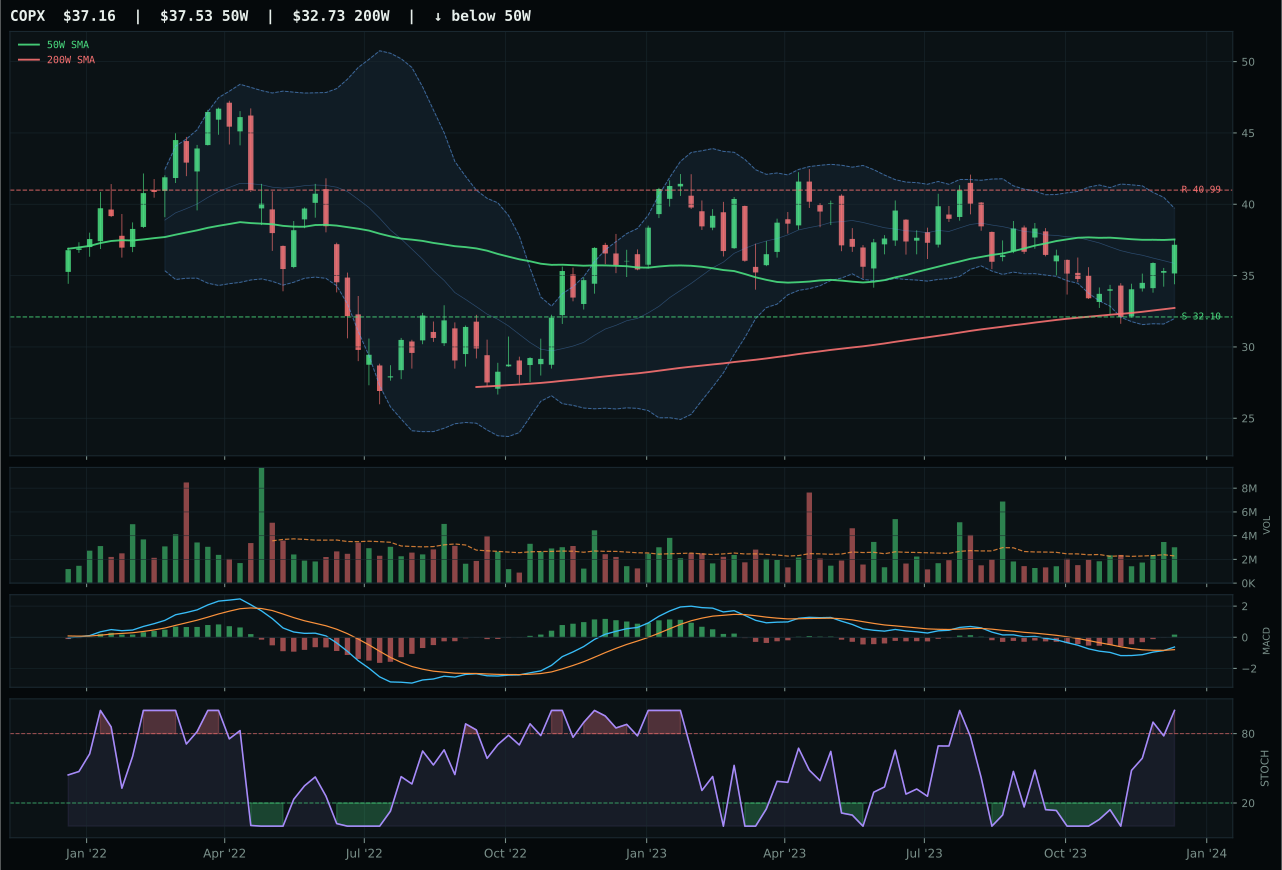
COPX has a compression near 50W profile with -8.8% 13-week relative strength versus SPY.
A failed hold above support would weaken the setup.
Actionable but governed by invalidation levels.
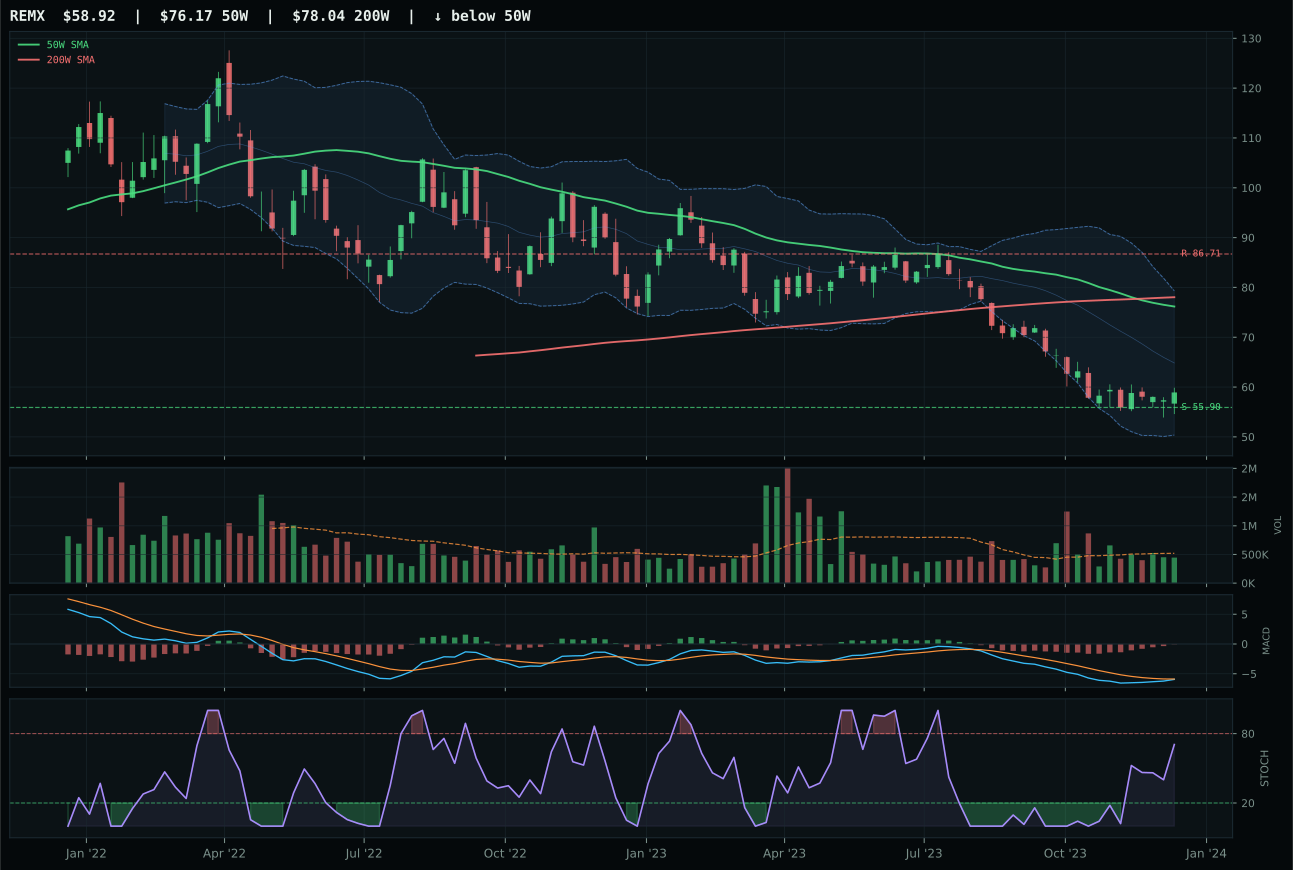
REMX has a neutral structure profile with -23.8% 13-week relative strength versus SPY.
Extension and support failure are the main tactical risks.
Tracked, but not top-2 eligible because: structurally broken.
COPX wins despite being minus 3.0% on the thirteen-week return and minus 8.8% relative to SPY, a counterintuitive victory that hinges on category-relative parity at 0.0% and a spectacular 100.0 timing score that reflects compression at the 50-week moving average (minus 1.0% distance) in the decision zone. This setup is the textbook definition of a coil: price has pulled back to key support but volume at 1.32x the 20-week average signals accumulation rather than capitulation. MACD is bullish and improving, stochastic RSI is overbought at 1.00, and the Fibonacci placement in the middle retracement zone (50.0% pullback from the recent advance) is precisely where disciplined buyers enter. PICK scores higher on technical evidence (92.9) and posts a positive 3.5% thirteen-week return, making it the technically superior setup, but its risk-reward of 54.5 versus COPX's 63.7 reflects the fact that COPX has compressed into a tighter entry window with better downside cushion and upside leverage. In reset phases, tight compression with above-average volume and bullish MACD often outperform early runners.
Industrial Metals ranks tier-2 at 5% allocation despite a 50.0 composite score that masks considerable internal tension between strong macro support and weak technical execution. Metals scarcity is active at plus fourteen basis points, commodity breadth positive at plus ten, and real asset sponsorship at plus six, creating a 65.0 category macro fit that is the strongest in the portfolio. Copper demand tied to energy transition and EV cycles remains genuine, and the category's positioning near major support levels suggests that institutional liquidation has subsided. However, all three basket constituents (PICK, COPX, REMX) show negative thirteen-week returns or deeply underwater relative strength, and COPX's minus 8.8% SPY-relative loss indicates that the sector is underperforming broad equities by a meaningful margin. The allocation is justified as a hedge to energy and as a real asset play in the disinflation narrative, but entry timing is poor and the technical setup requires patient accumulation near support before any meaningful move can develop. Watch for COPX or PICK to break above resistance with volume confirmation; until then, this is a position to hold, not to add.
Agriculture & Livestock — WEAT
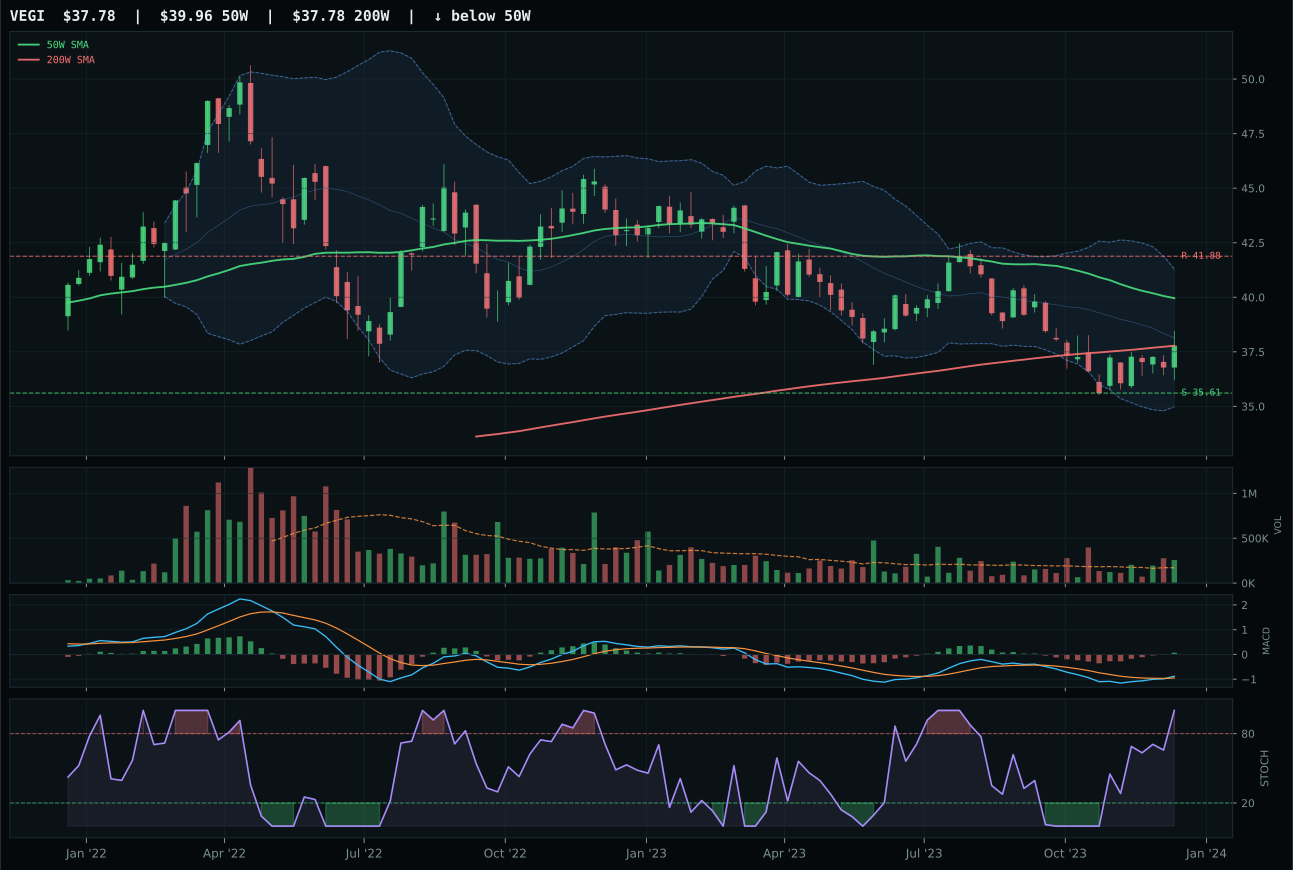
VEGI has a neutral structure profile with -10.9% 13-week relative strength versus SPY.
A failed hold above support would weaken the setup.
Tracked, but not top-2 eligible because: .
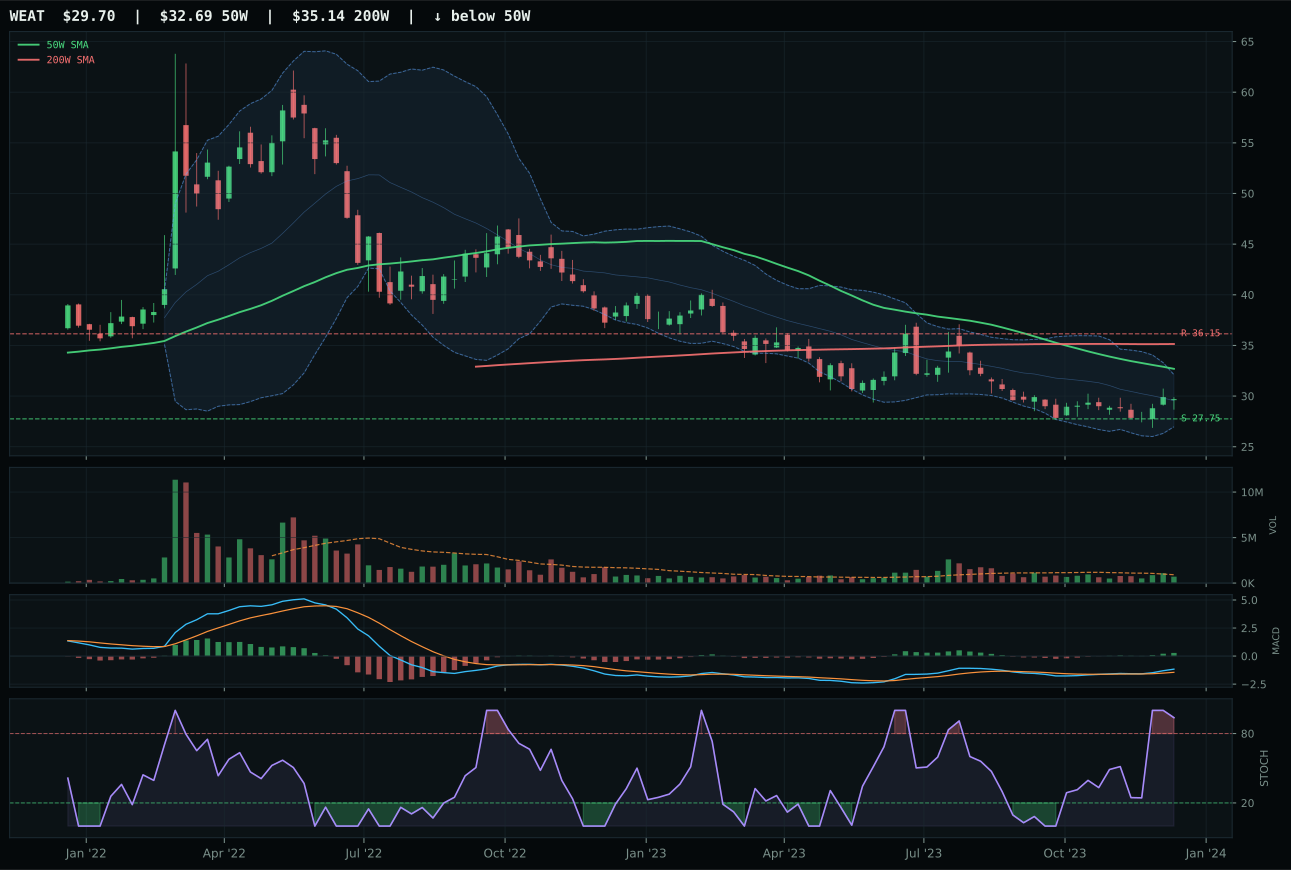
WEAT has a neutral structure profile with -6.5% 13-week relative strength versus SPY.
Extension and support failure are the main tactical risks.
Tracked, but not top-2 eligible because: structurally broken.
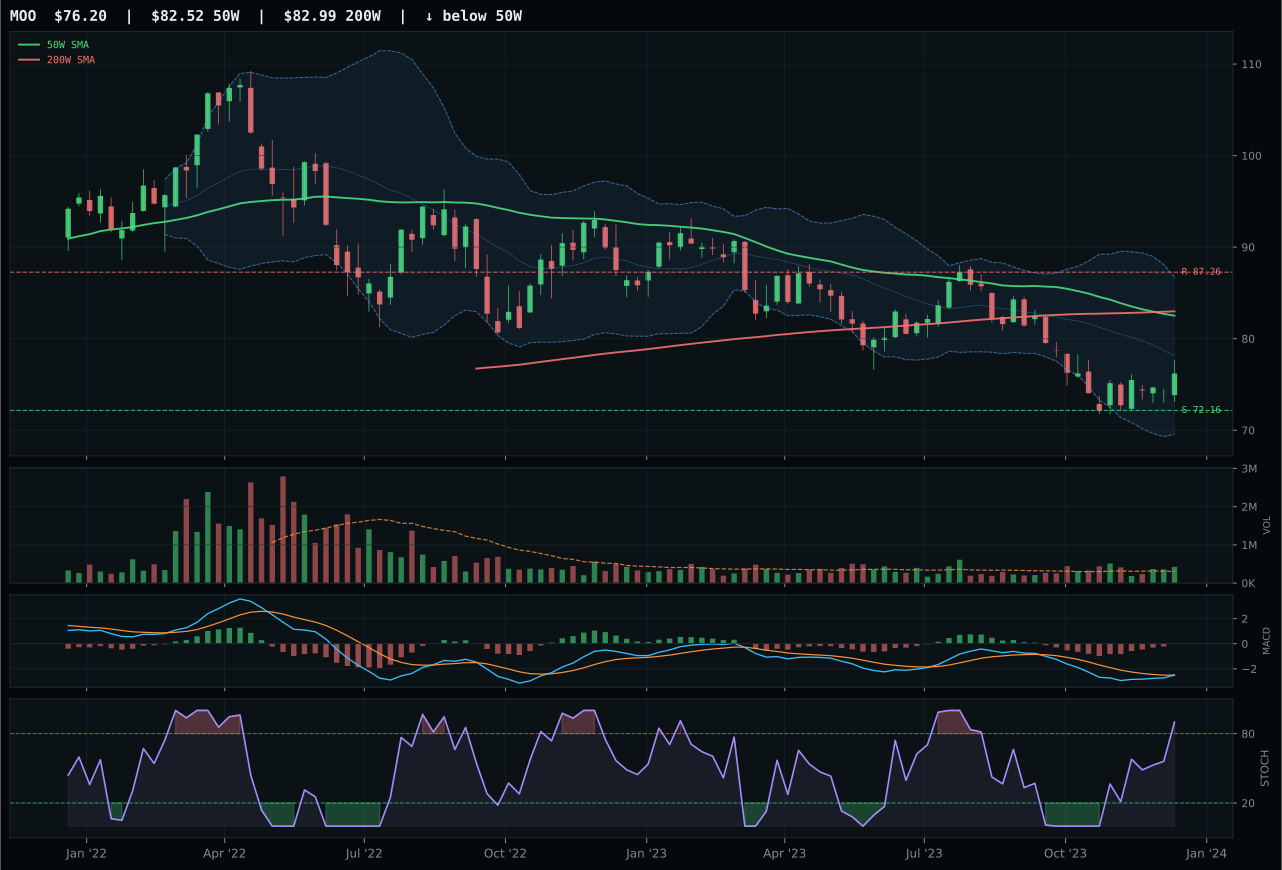
MOO has a neutral structure profile with -13.5% 13-week relative strength versus SPY.
Extension and support failure are the main tactical risks.
Tracked, but not top-2 eligible because: structurally broken.
WEAT wins a sector that has broken down structurally, posting a minus 0.7% thirteen-week return and minus 6.5% relative strength to SPY—metrics that would typically warrant exclusion from any growth-leaning portfolio. The category victory goes to WEAT only because it holds category-relative strength at plus 4.4% versus peers, a marginal claim to leadership in a category with zero tailwinds. Price sits 9.1% below the 50-week moving average in the near 52-week low repair zone, a setup that usually signals either capitulation or value accumulation. The 90.0 risk-reward score is a mirror image of the problem: downside to support is only 7.0%, but upside to resistance is negative 17.8%, meaning the asymmetry is entirely defensive. MACD is bullish and improving, a glimmer of technical hope, but stochastic RSI at 0.94 shows that momentum is rolling over from overbought extremes rather than gathering strength. Volume at 0.77x the 20-week average confirms a lack of institutional interest.
Agriculture & Livestock receives 0% allocation this week and is ineligible for portfolio consideration; the category ranks outside the 10-category window due to a 12.1 composite score that reflects both technical deterioration (42.0 technical evidence for WEAT) and macro hostility in a disinflation regime. Disinflation pressure subtracts eight basis points from the category macro fit (45.0), directly opposing any agricultural commodity narrative. Commodity breadth is positive at plus five, and real asset sponsorship is active at plus eight, but these cannot offset the structural damage: all three ETFs in the basket (VEGI, WEAT, MOO) show negative thirteen-week returns, underwater relative strength to SPY, and price action that is consolidating near or below the 50-week moving average. The category would need to break above multi-month resistance and recover relative strength to SPY by at least 5-7 percentage points over a 4-6 week window to become discussable. Current disinflation and credit stress dynamics argue that such recovery is unlikely near-term.
Traditional Energy — XOP
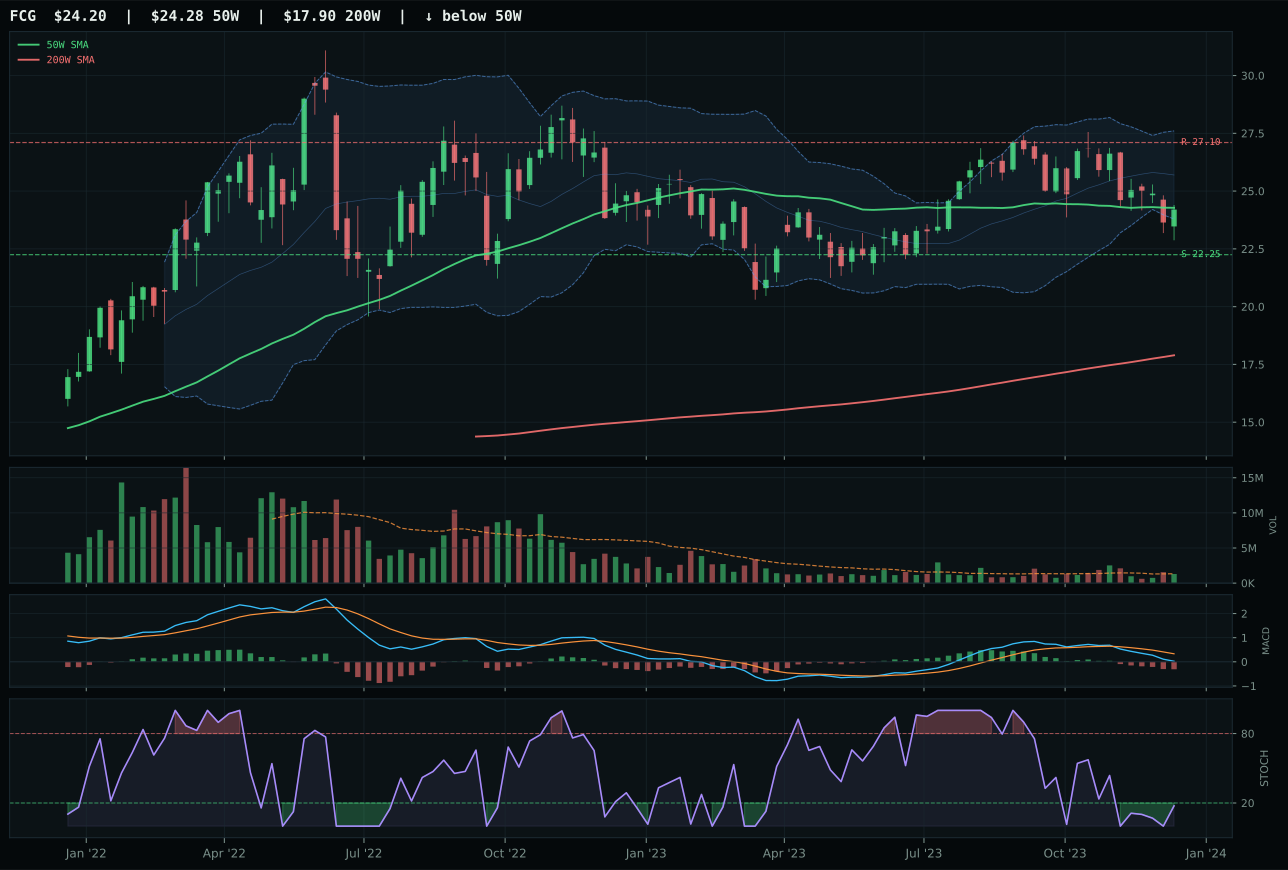
FCG has a compression near 50W profile with -14.2% 13-week relative strength versus SPY.
A failed hold above support would weaken the setup.
Actionable but governed by invalidation levels.
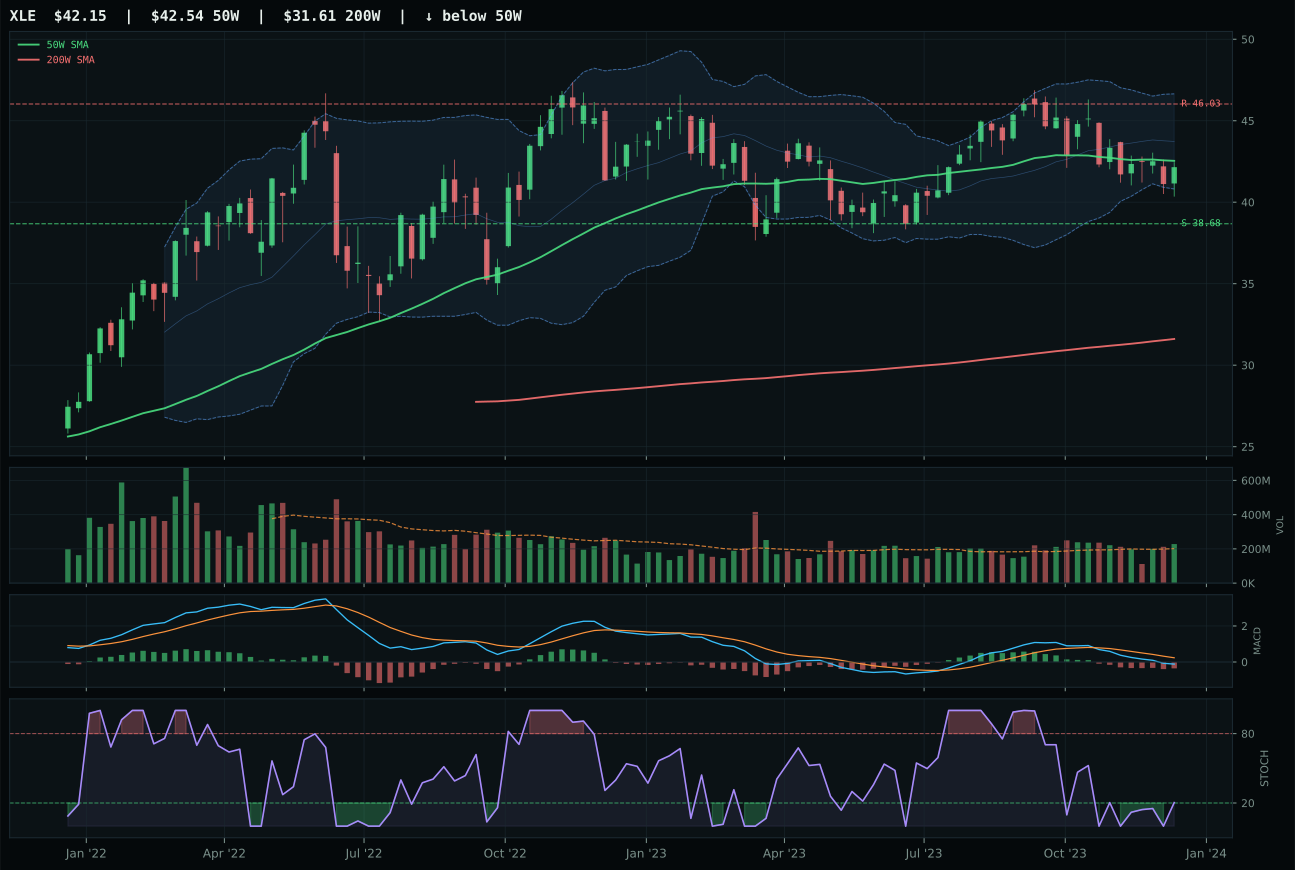
XLE has a compression near 50W profile with -14.2% 13-week relative strength versus SPY.
A failed hold above support would weaken the setup.
Actionable but governed by invalidation levels.
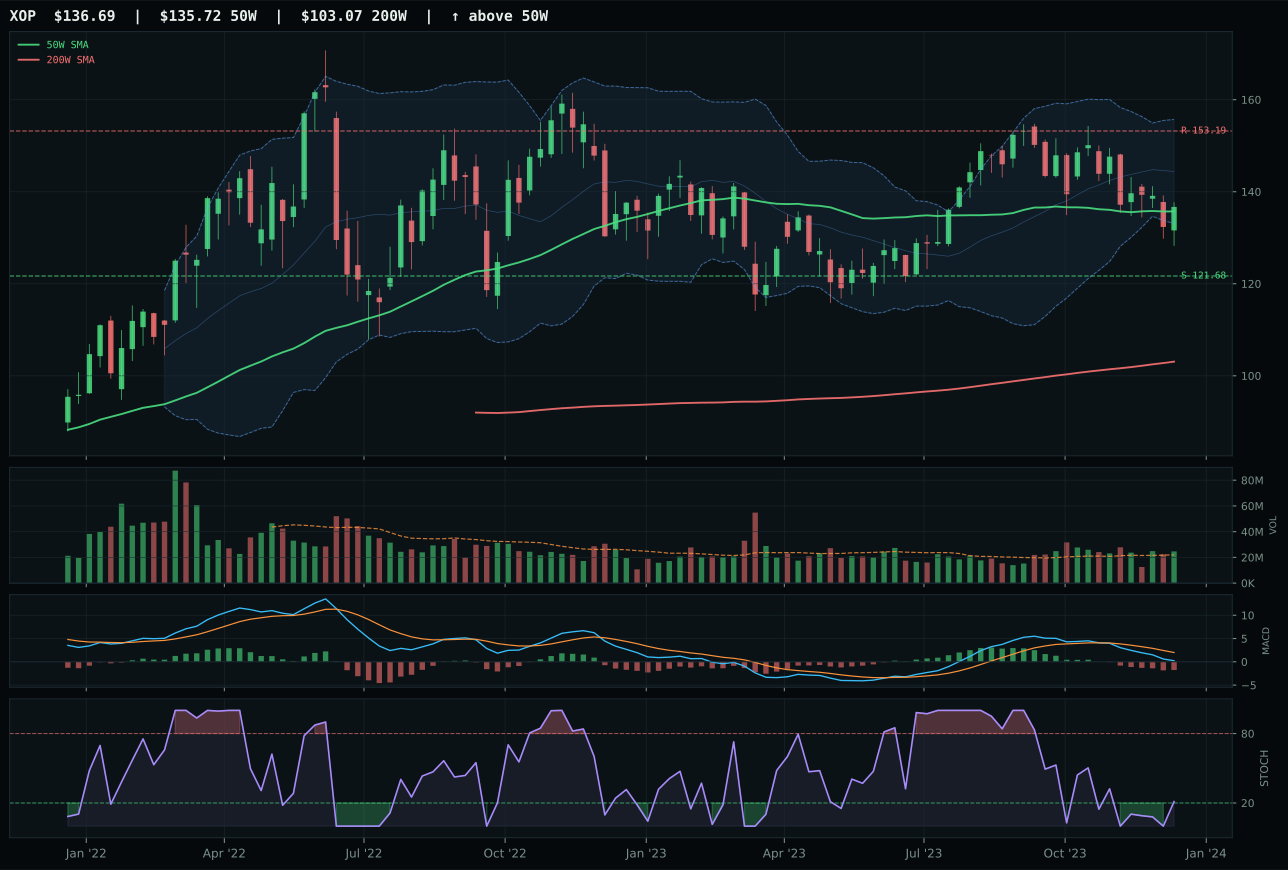
XOP has a compression near 50W profile with -14.8% 13-week relative strength versus SPY.
A failed hold above support would weaken the setup.
Actionable but governed by invalidation levels.
XOP wins a category where all three constituents are deeply broken, posting a 2.9 composite score that reflects the categorical rejection of traditional energy by the market. XOP's 67.0 trend score (price above both moving averages with a 0.0% 50-week slope) is the strongest relative claim to structure, yet the minus 14.8% relative strength to SPY is devastating and the minus 9.0% thirteen-week return confirms that even energy bulls are exiting. Volume at 1.12x the 20-week average provides the only credible signal of participation, but MACD is bearish and weakening while stochastic RSI sits in the rising mid-zone, a setup that typically precedes additional weakness before any bottoming. The 100.0 timing score reflects compression near the 50-week moving average (0.7% distance), which offers a theoretical entry point, but the 68.7 risk-reward (downside to support at 12.3% versus upside at minus 10.8%) shows that the chart is offering no edge. FCG's oversold stochastic RSI turn-up and XLE's neutral volume confirm that this sector lacks any sponsorship whatsoever.
Traditional Energy receives 0% allocation and is ineligible for portfolio consideration; the category ranks 9th or 10th with a 2.9 composite score that reflects catastrophic macro hostility and technical deterioration. Disinflation pressure subtracts minus ten basis points from an already-weak category macro fit of 23.0, and credit stress at minus seven, liquidity stress at minus seven, and the absence of any positive macro descriptor support confirm that the regime is actively hostile to hydrocarbon exposure. The 33.1 technical evidence score for XOP (the best of the three) shows that even the strongest chart in the category fails to clear a 35.0 hurdle. All three ETFs show negative thirteen-week returns, minus fourteen percent SPY-relative weakness, and MACD patterns that are either bearish or offer no conviction. Energy would require a structural shift toward inflation acceleration, credit stress as a risk-off catalyst, or geopolitical disruption to earn allocation; under the current disinflation regime, it remains a zero-weight strategic drag. The 5% slot that remains unallocated in the base portfolio is reserved for dynamic reallocation if macro regime shifts warrant a rapid pivot.