
2023-12-08
Informational purposes only. The content in this report, including allocations, analysis, and commentary, is provided solely for informational and educational purposes. It does not constitute financial advice, investment advice, trading advice, or any other type of advice. Past performance does not guarantee future results. Always conduct your own research and consult a qualified financial professional before making investment decisions.
Weekly Allocation
| Ticker | Category | Weight | Role |
|---|---|---|---|
| FBTC | 50% | Overlay | |
| CIBR | Technology | 10% | Top-2 (10%) |
| XAR | Defense & Aerospace | 10% | Top-2 (10%) |
| URA | Nuclear Energy | 5% | Tier-2 (5%) |
| BOTZ | AI | 5% | Tier-2 (5%) |
| GLD | Precious Metals | 5% | Tier-2 (5%) |
| ILF | Emerging Markets | 5% | Tier-2 (5%) |
| PAVE | Utilities & Infrastructure | 5% | Tier-2 (5%) |
| MOO | Agriculture & Livestock | 5% | Tier-2 (5%) |
Trade Instructions — Monday Open
Sell the tranche from 2023-11-10 (completing its 4-week hold). Buy the new tranche. Instructions show net portfolio changes — same-asset positions cancel, weight changes show the delta.
| Action | Ticker | Instruction |
|---|---|---|
| SELL | ITA | Sell entire ITA position (2.50% of portfolio) |
| SELL | URA | Sell 25% of URA position (reduce 5.00% → 3.75%) |
| SELL | XLK | Sell 33% of XLK position (reduce 3.75% → 2.50%) |
| SELL | IGF | Sell 50% of IGF position (reduce 2.50% → 1.25%) |
| SELL | SMH | Sell 33% of SMH position (reduce 3.75% → 2.50%) |
| BUY | XAR | Buy XAR — 33.33% of freed cash (adds 2.50% to portfolio) |
| BUY | BOTZ | Buy BOTZ — 16.67% of freed cash (adds 1.25% to portfolio) |
| BUY | PAVE | Buy PAVE — 16.67% of freed cash (adds 1.25% to portfolio) |
| BUY | CIBR | Buy CIBR — 33.33% of freed cash (adds 2.50% to portfolio) |
Current Portfolio After Trade
Combined holdings across all 4 active tranches. Each tranche is 25% of the portfolio.
| Ticker | % of Portfolio | Weight Bar |
|---|---|---|
| FBTC | 50.00% | |
| GLD | 6.25% | |
| XAR | 6.25% | |
| ILF | 5.00% | |
| BOTZ | 5.00% | |
| PAVE | 5.00% | |
| URA | 3.75% | |
| PICK | 3.75% | |
| IGV | 3.75% | |
| XLK | 2.50% | |
| SMH | 2.50% | |
| CIBR | 2.50% | |
| IGF | 1.25% | |
| URNM | 1.25% | |
| MOO | 1.25% |
Macro Regime — Disinflation
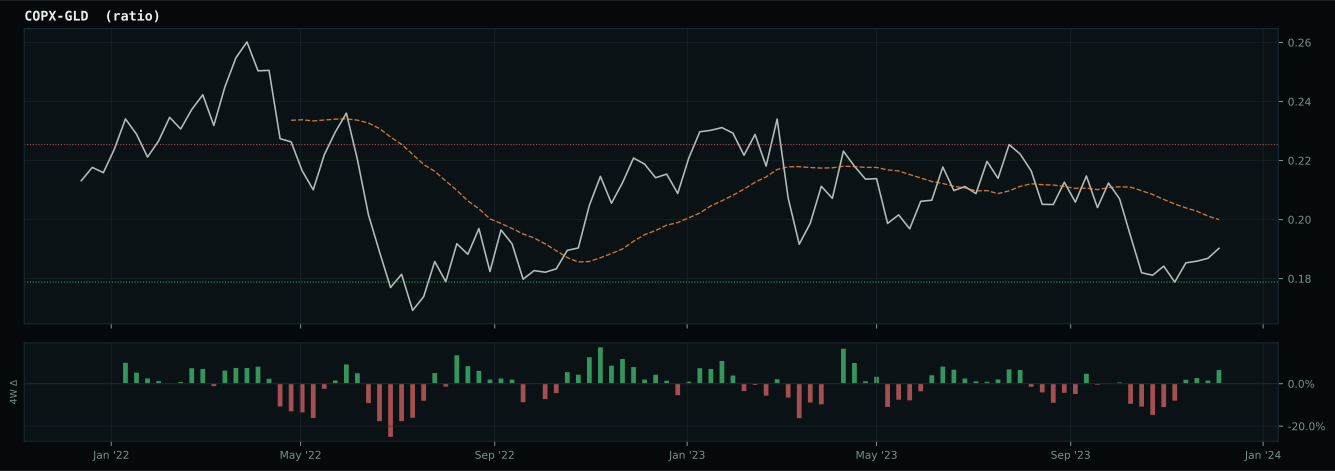
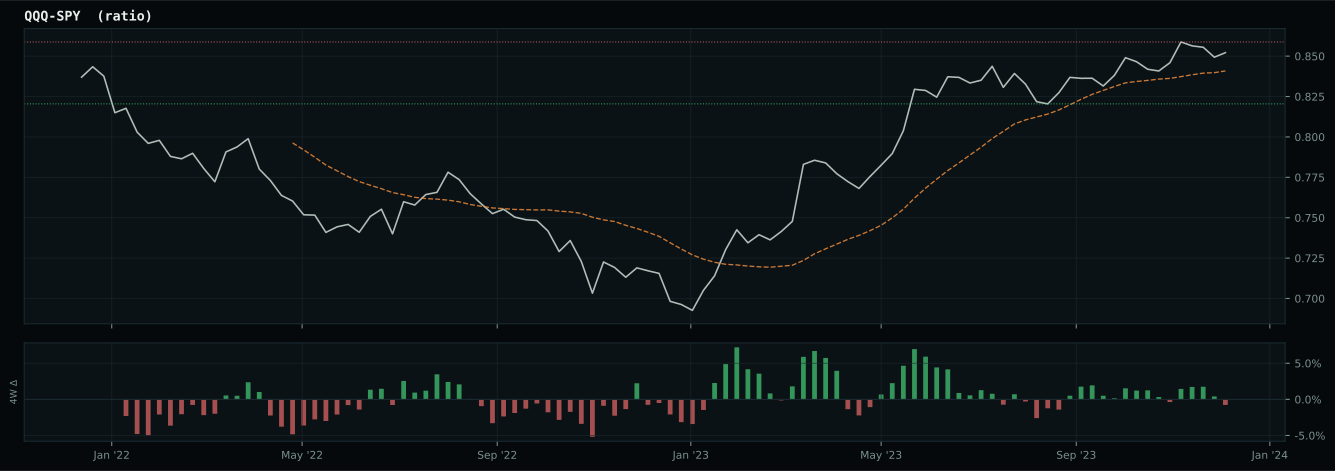
Macro Evidence Charts
Market-implied signals behind the macro regime scores. Each ratio compares two assets; the direction and slope of the ratio is what the macro engine reads.
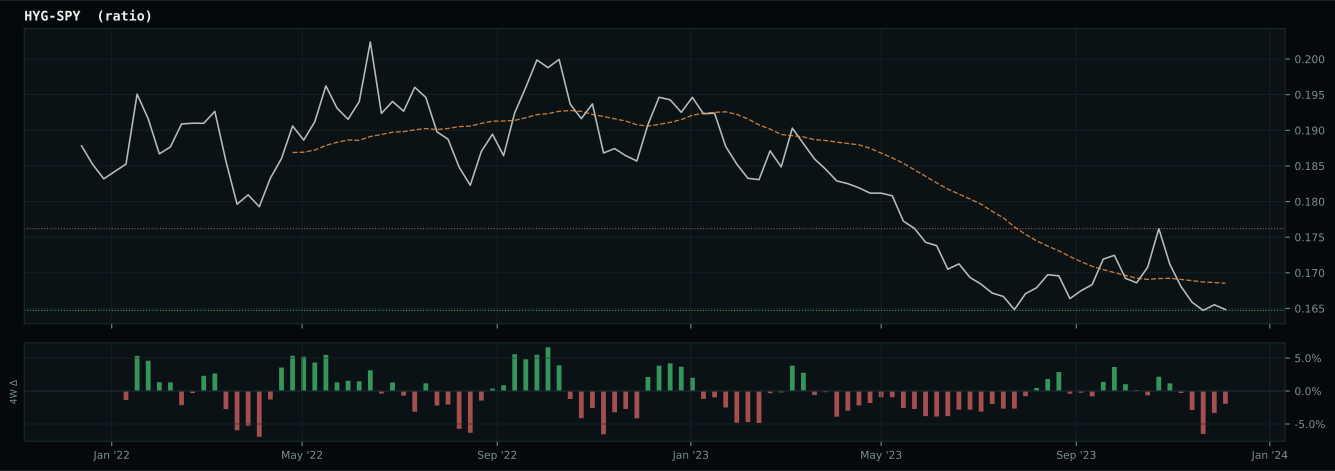
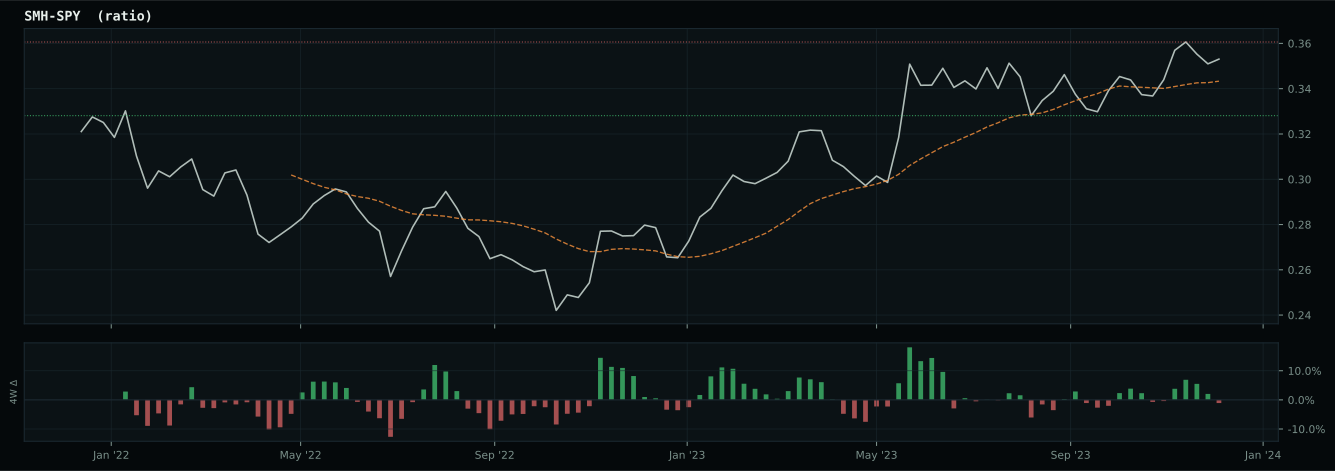
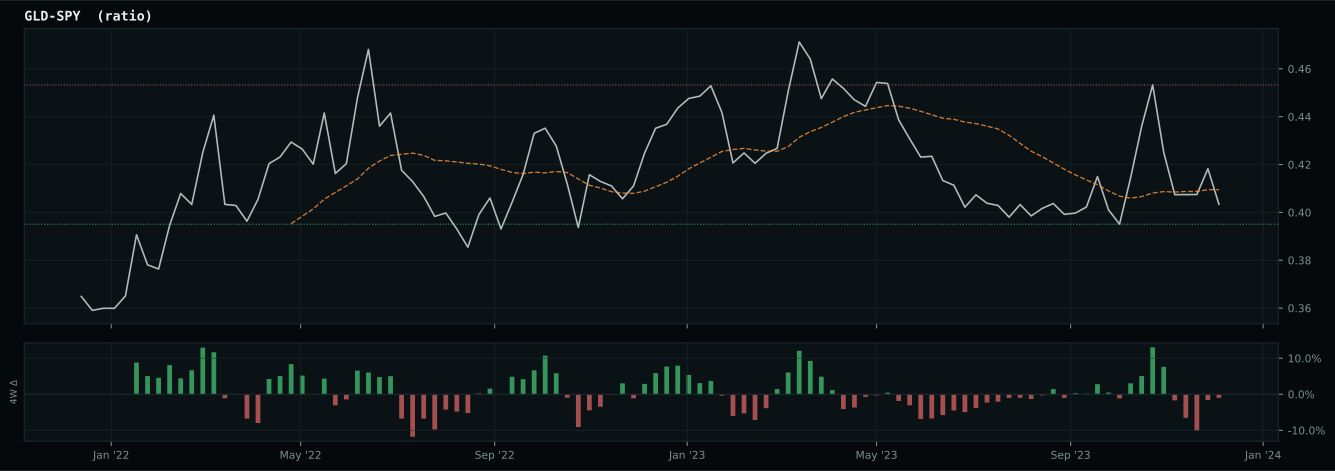
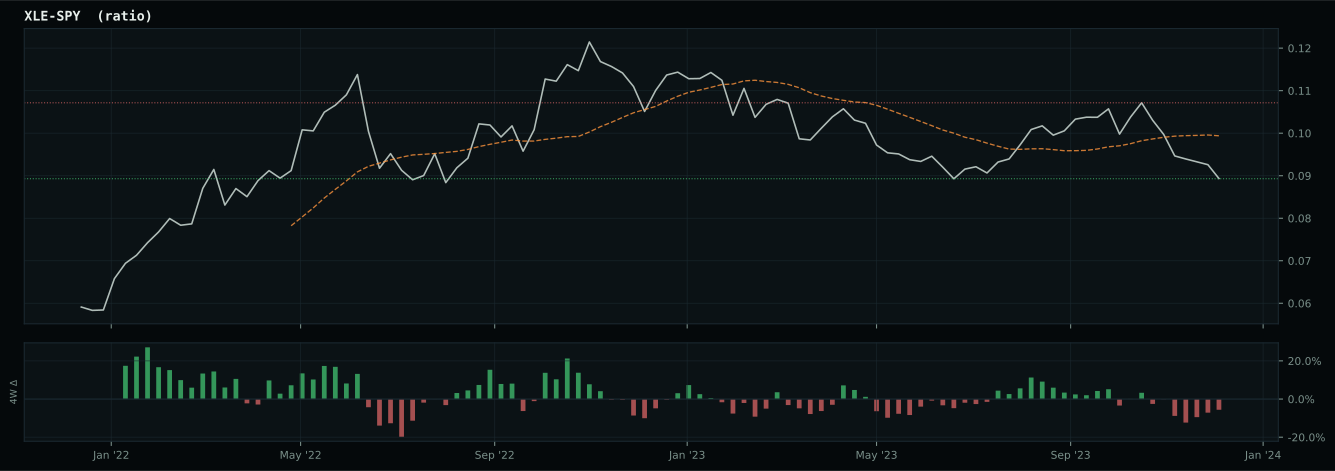
Crypto Regime — TrendBTC
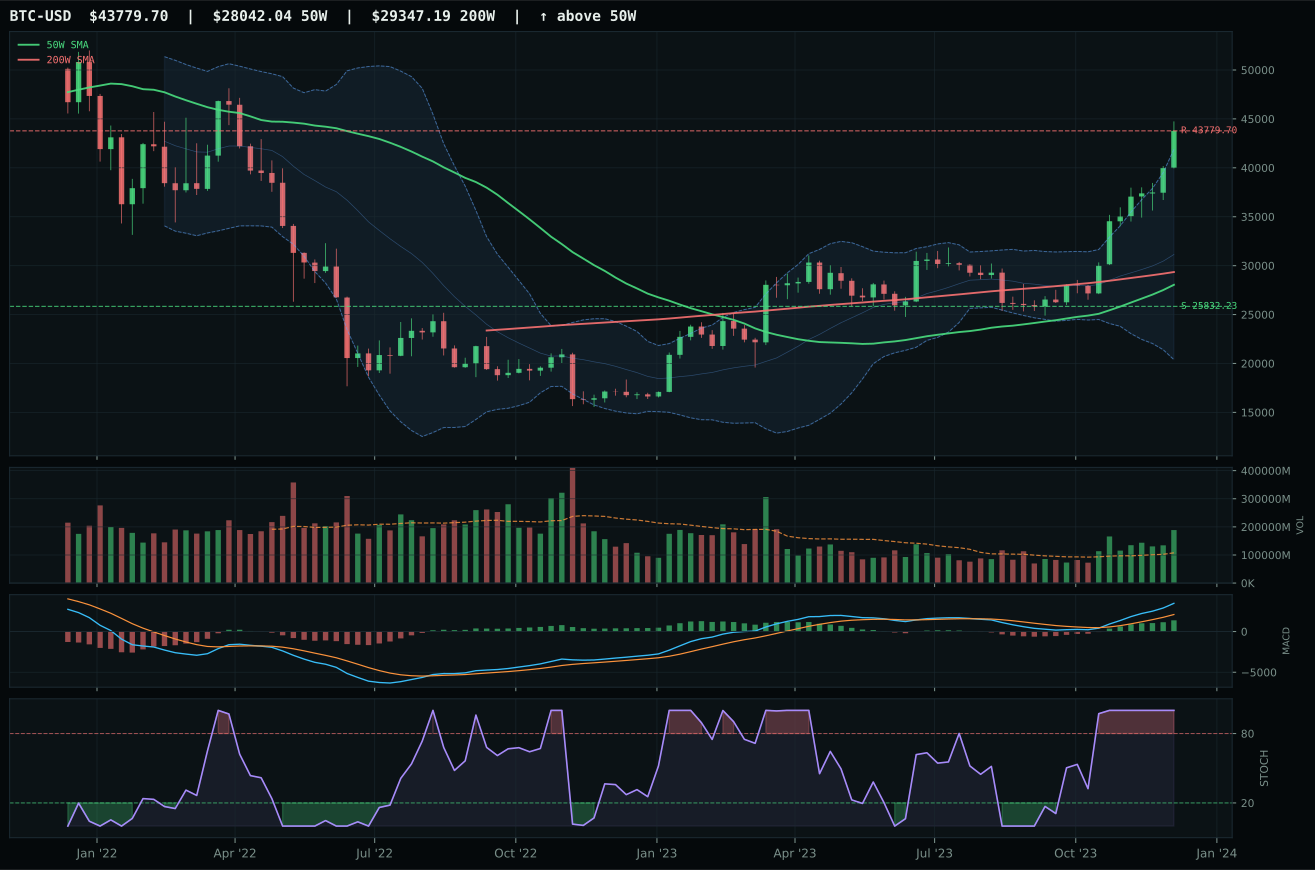
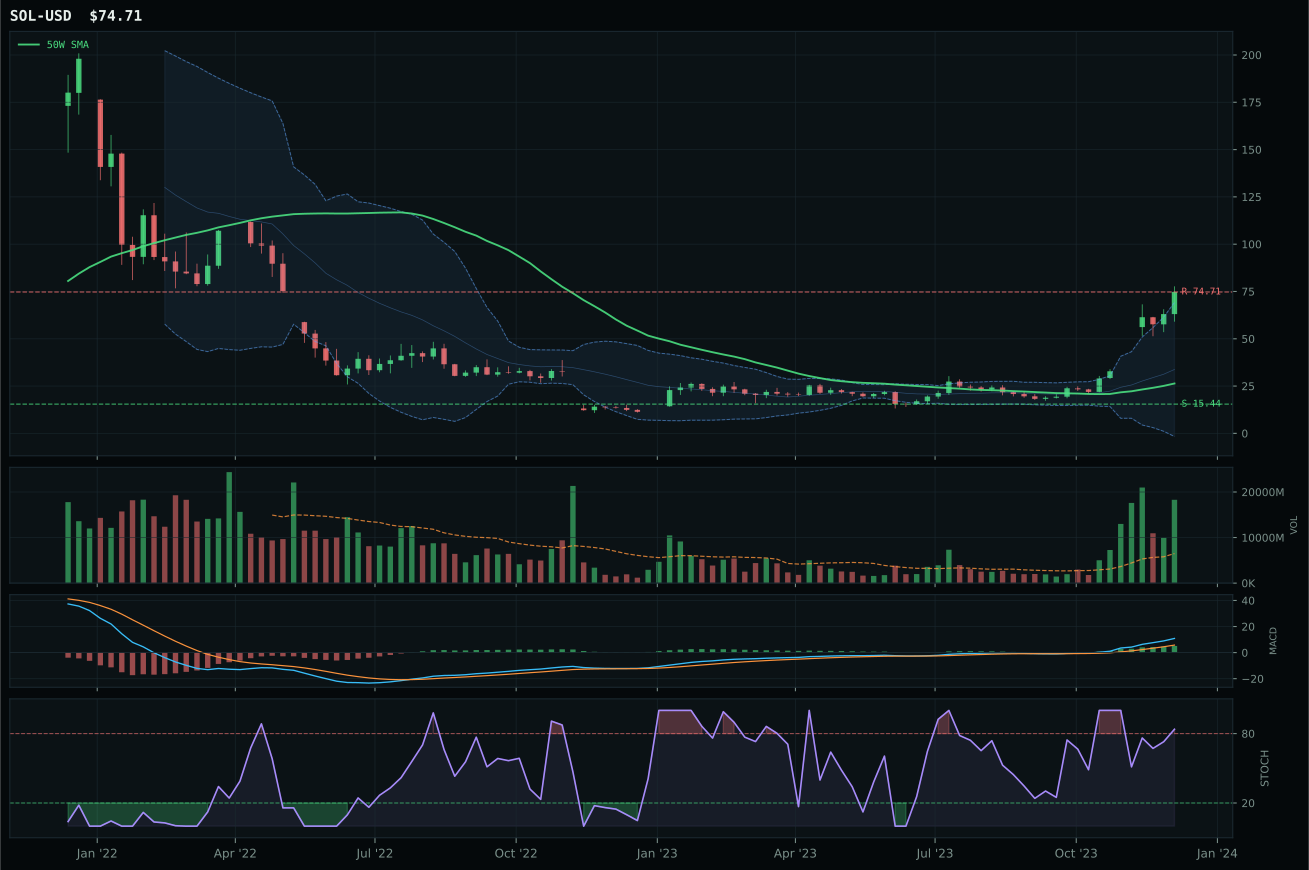
post-touch structure is too wide to count as a range; max/min close ratio is 2.45
TrendBTC confirmed: 2 consecutive closes above rising/flat 50W SMA
one or more available conditions failed
Category Rankings
| Rank | Category | Winner | Score | Alloc | 4W Ret | Peers (4W) |
|---|---|---|---|---|---|---|
| 1 | Technology | CIBR | 59.7 | 20% | +1.00% | XLK -0.6% · IGV -1.3% |
| 2 | Defense & Aerospace | XAR | 57.2 | 20% | -1.22% | ITA -0.7% · ROKT +1.1% |
| 3 | Nuclear Energy | URA | 56.7 | 10% | -5.90% | NLR -2.7% · URNM -2.7% |
| 4 | AI | BOTZ | 54.1 | 10% | +0.97% | AIQ +0.2% · SMH +2.4% |
| 5 | Precious Metals | GLD | 53.5 | 10% | +1.47% | SLV +0.5% · GDX -0.2% |
| 6 | Emerging Markets | ILF | 52.2 | 10% | +2.40% | INDA +3.0% · IEMG +0.4% |
| 7 | Utilities & Infrastructure | PAVE | 50.2 | 10% | +3.73% | IGF +1.4% · XLU +2.1% |
| 8 | Industrial Metals | COPX | 16.3 | 10% | +4.55% | REMX +0.7% · PICK +2.9% |
| 9 | Agriculture & Livestock | MOO | — | 0% | +1.88% | WEAT -2.5% · VEGI +2.1% |
| 10 | Traditional Energy | XLE | — | 0% | +1.14% | FCG +1.7% · XOP +1.8% |
Technology — CIBR
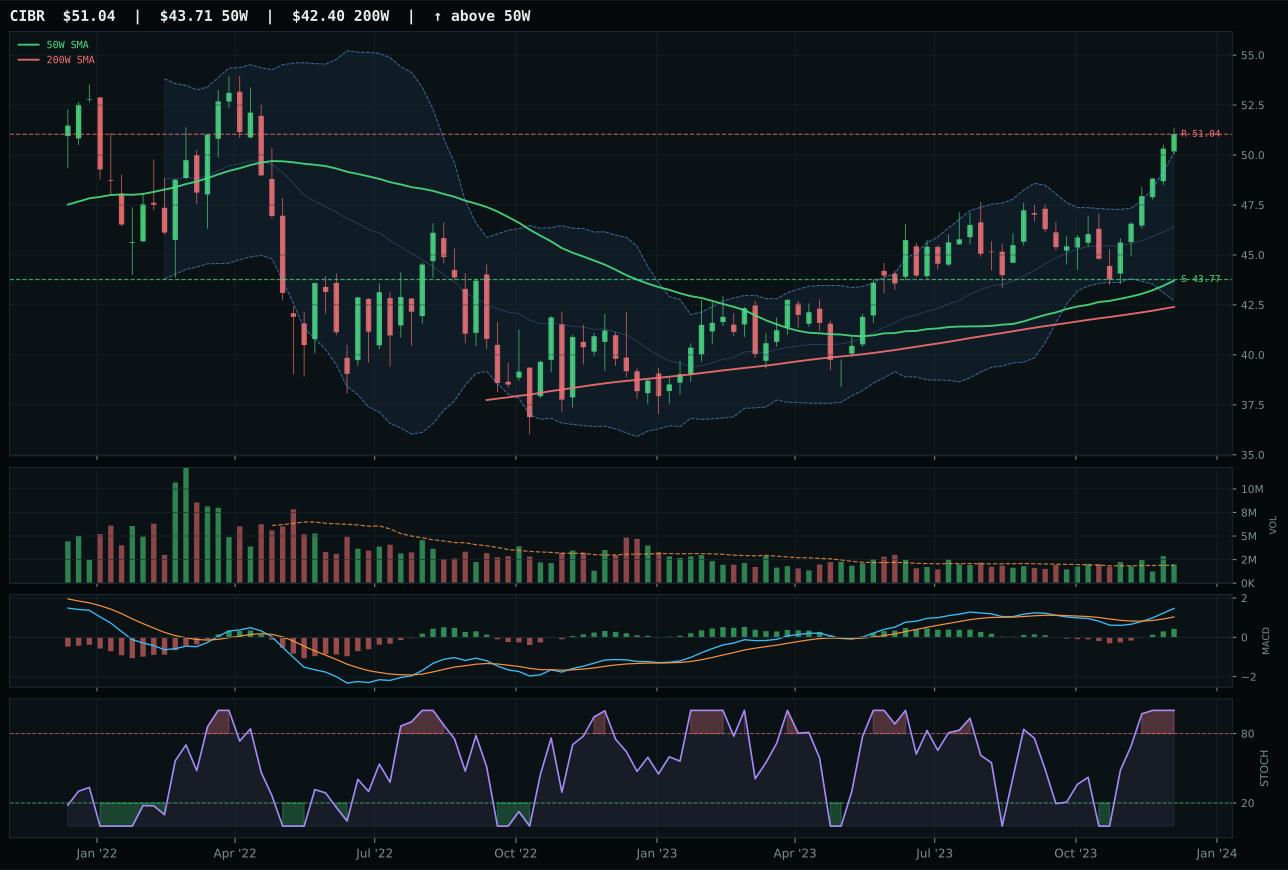
CIBR has a vertical extension profile with 5.3% 13-week relative strength versus SPY.
A failed hold above support would weaken the setup.
Actionable but governed by invalidation levels.
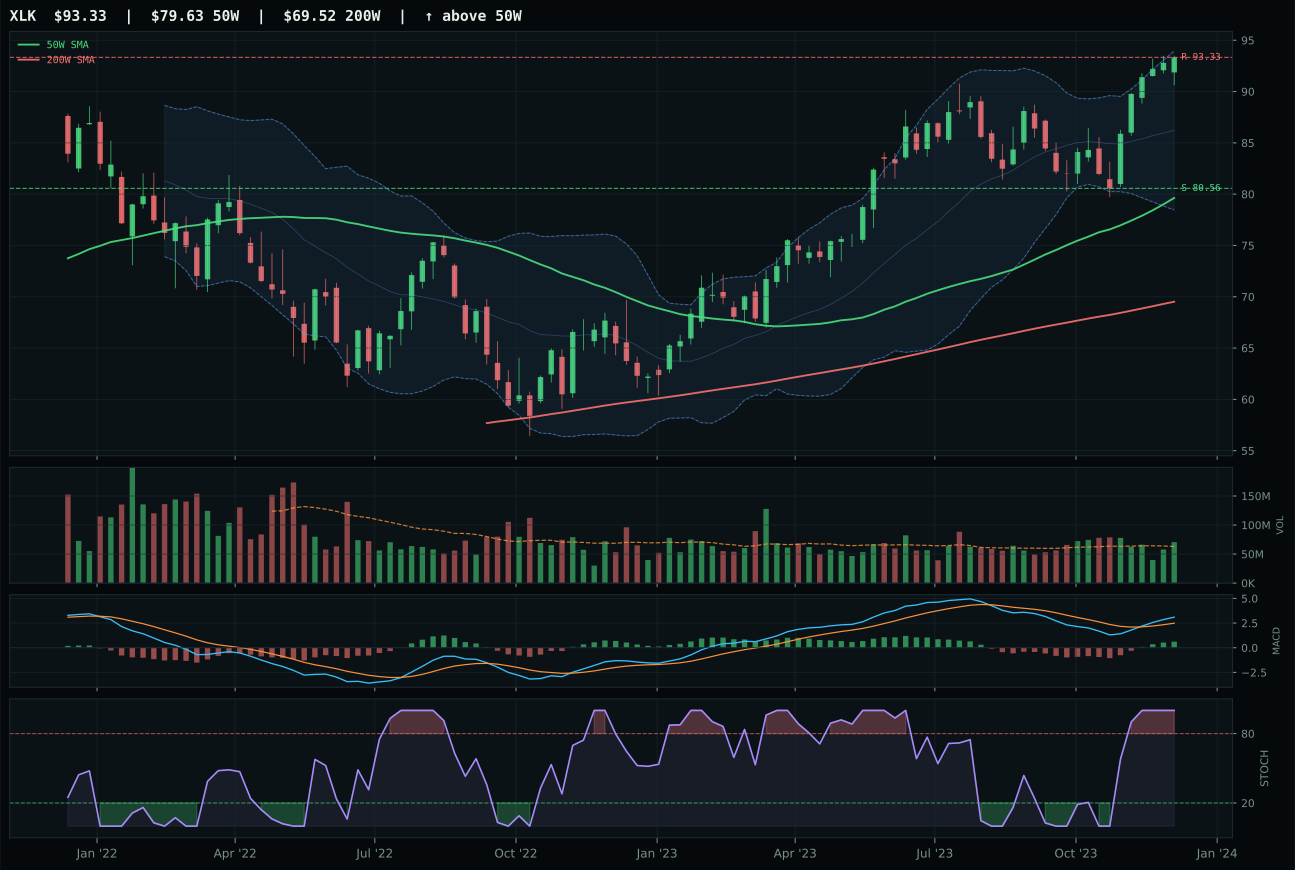
XLK has a vertical extension profile with 4.7% 13-week relative strength versus SPY.
A failed hold above support would weaken the setup.
Actionable but governed by invalidation levels.
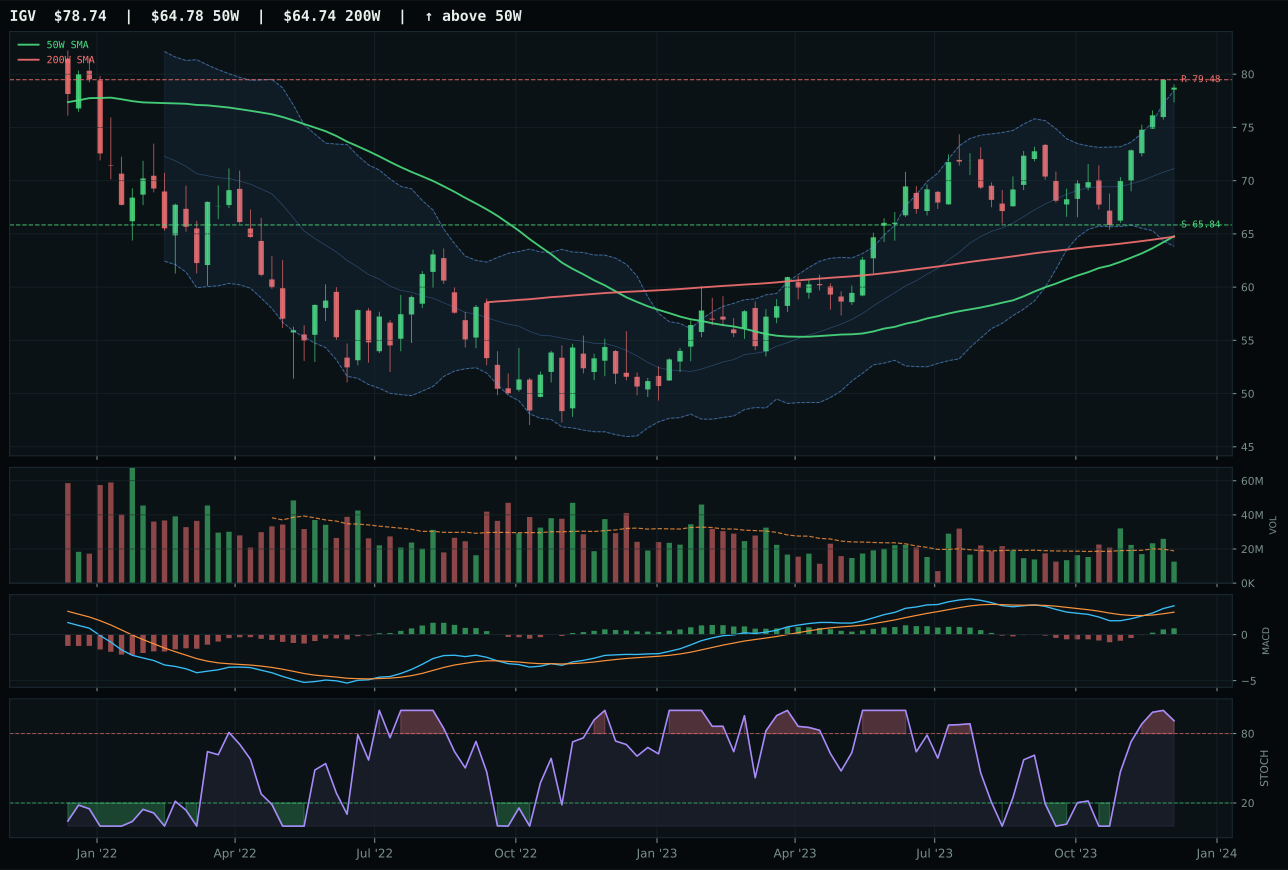
IGV has a vertical extension profile with 4.9% 13-week relative strength versus SPY.
A failed hold above support would weaken the setup.
Actionable but governed by invalidation levels.
CIBR edges XLK by the narrowest margin—a 1.5-point gap that hinges on category-relative strength (0.3% versus -0.2%) and marginally cleaner structure (80.1 versus 80.0). Both sit in vertical extension above their 50-week averages with identical trend scores of 100, identical timing at 37, and nearly identical momentum and volume signatures: MACD bullish and improving, stochastic RSI overbought. The separation comes from CIBR's neutral volume participation (1.06x the 20-week average) versus XLK's above-average sponsorship, combined with CIBR's positive relative strength inside its own three-ETF basket. This is a situation where the winner won through peer breadth, not through superior absolute price action—both setups are extended and late, but CIBR is being accumulated by a slightly wider buyer base within the technology cohort.
Technology earned its 10% allocation slot as the third-best ranked category at 59.7, securing one of the two top-2 positions despite timing headwinds that would normally disqualify extended setups. In a disinflation regime, the combination of AI growth sponsorship active at plus-6 and disinflation itself supporting valuations at plus-7 overcame liquidity stress penalties that hit the category at minus-10. The macro checklist actively favors technology's cost-efficiency narrative during margin compression, which backstops the technical momentum even though new buyers are chasing at nosebleed valuations. What would push this category higher would be a volume confirmation breakout from XLK—the basket's second-ranked ETF—to signal broadening participation; currently momentum is concentrated in CIBR's narrow cybersecurity thesis rather than distributed across the full tech stack. For now, the allocator is comfortable with tactical exposure here, but price extension beyond Fib 0.236 at 47.98 would force a rotation.
Defense & Aerospace — XAR
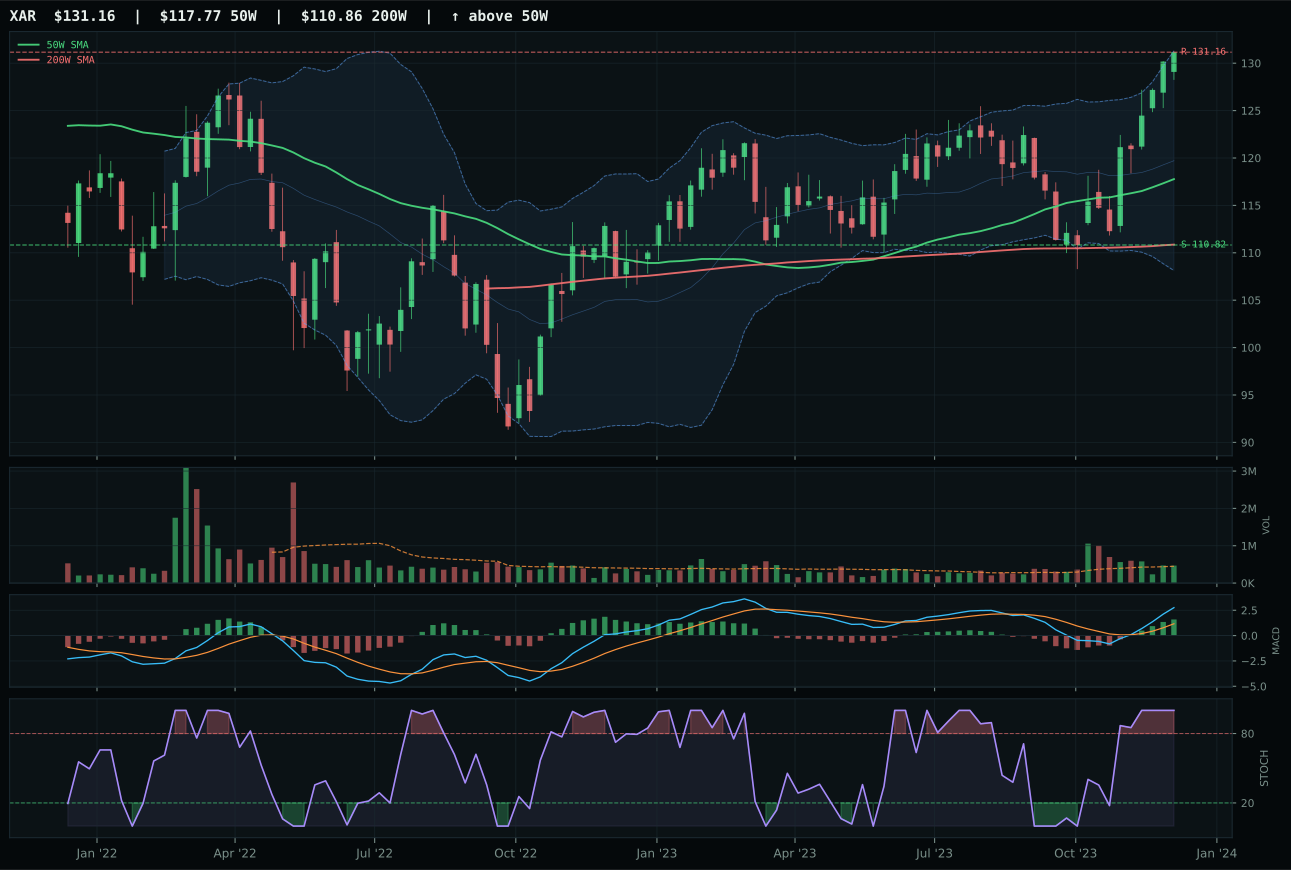
XAR has a neutral structure profile with 7.9% 13-week relative strength versus SPY.
A failed hold above support would weaken the setup.
Actionable but governed by invalidation levels.
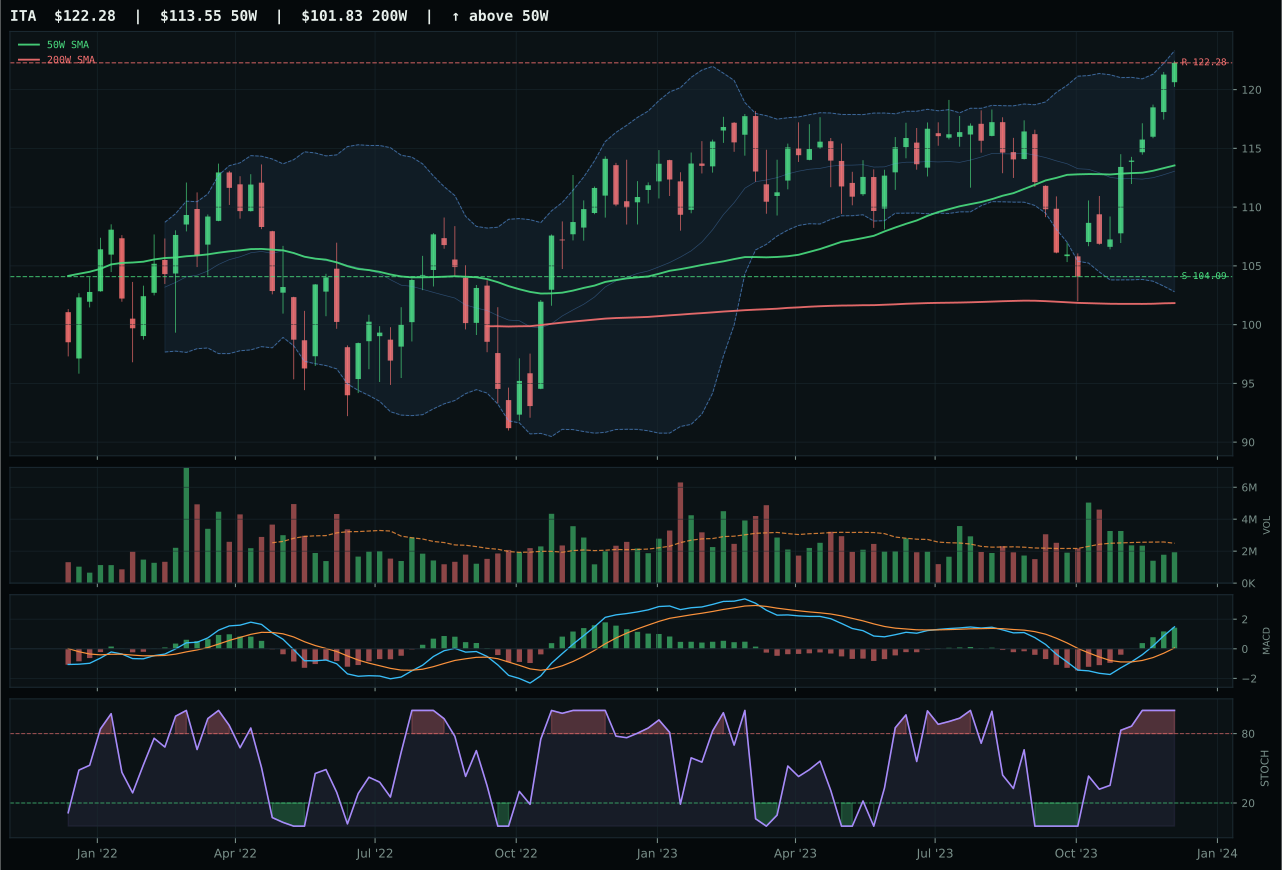
ITA has a neutral structure profile with 5.8% 13-week relative strength versus SPY.
A failed hold above support would weaken the setup.
Actionable but governed by invalidation levels.
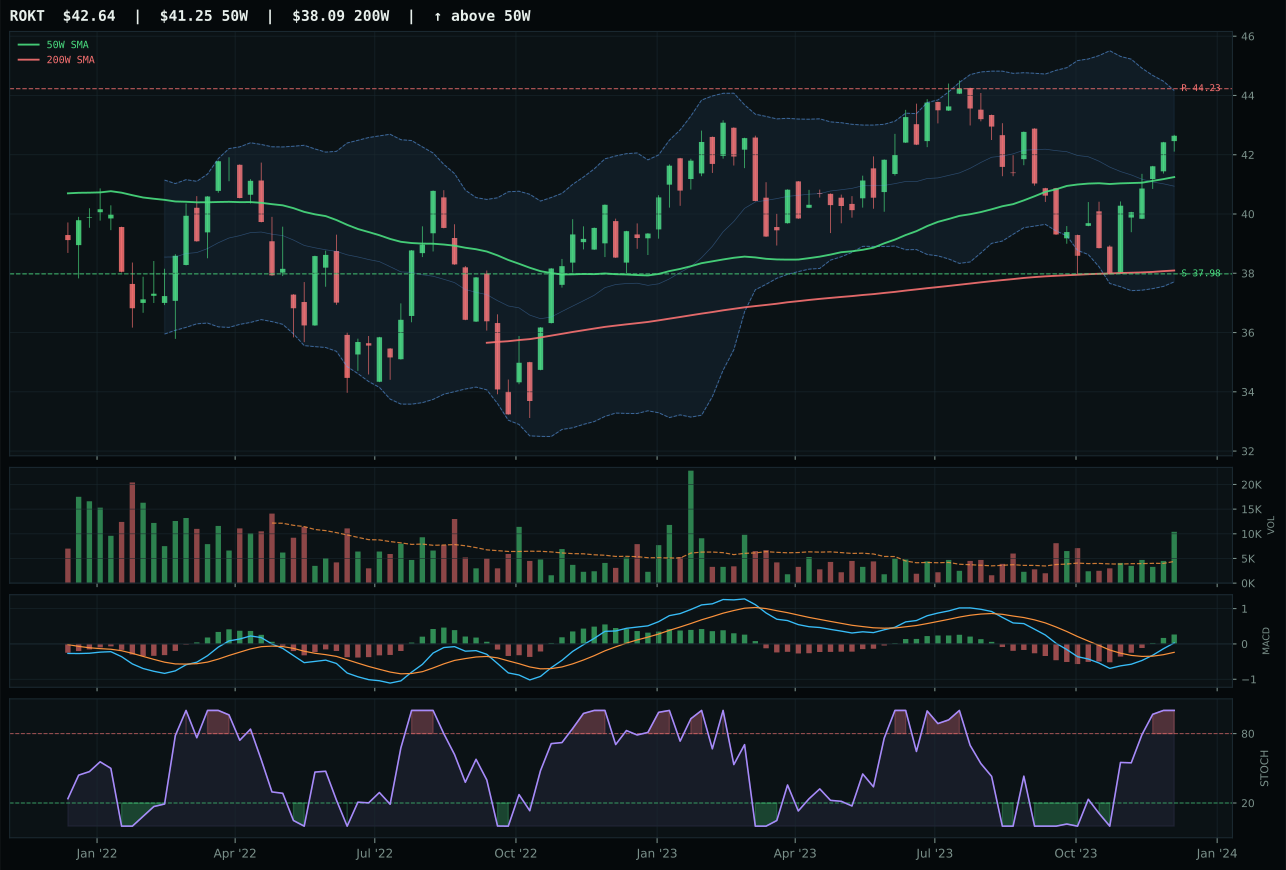
ROKT has a neutral structure profile with 0.6% 13-week relative strength versus SPY.
A failed hold above support would weaken the setup.
Tracked, but not top-2 eligible because: .
XAR wins by outperforming ITA on category-relative strength (+2.2% versus 0.0%), a measure of peer sponsorship inside the defense basket that translates directly into relative momentum and accumulation breadth. Both score identically on trend (100), sit neutral on structure, and show bullish-improving MACD with overbought stochastic RSI. XAR's 7.9% relative strength versus SPY exceeds ITA's 5.8%, and its 13-week return of 11.2% edges ITA's 9.1%, meaning the market is rewarding XAR's specific expression—aerospace and defense cyclicals—over ITA's prime contractor durability. Volume-price confirmation favors XAR at 80.0 versus ITA's 76.0, suggesting accumulation is stronger. The -1.5-point score gap (XAR leading despite ITA having composite 83 versus XAR's 82) underscores how critical peer leadership and relative strength are: ITA has higher technical scores in isolation, but the portfolio is voting for XAR's broader market appeal.
Defense & Aerospace earned its coveted 10% top-2 allocation at 57.2 because it ranked as the second-highest eligible final category score alongside Technology, combining a 84.2 technical evidence score with enough macro fit—50.0 on the descriptor checklist—to justify strategic weighting in a disinflation regime. Credit stress is active at plus-2 and liquidity stress at minus-4, a mixed signal that resolves in defense's favor because duration and earnings visibility command premium valuations when real rates are falling; this is the regime that rewards cash-generative secular stories like defense. Volume-price confirmation at 80.0 across the category basket proves that accumulation is real and not merely momentum chasing into air. To lose this allocation slot, the category would need momentum to roll over—a fresh lower low below the 110.82 support would start that conversation—or a material shift in the macro regime away from disinflation toward demand destruction that would pressure discretionary defense spending. For now, XAR stays at full weight.
Nuclear Energy — URA
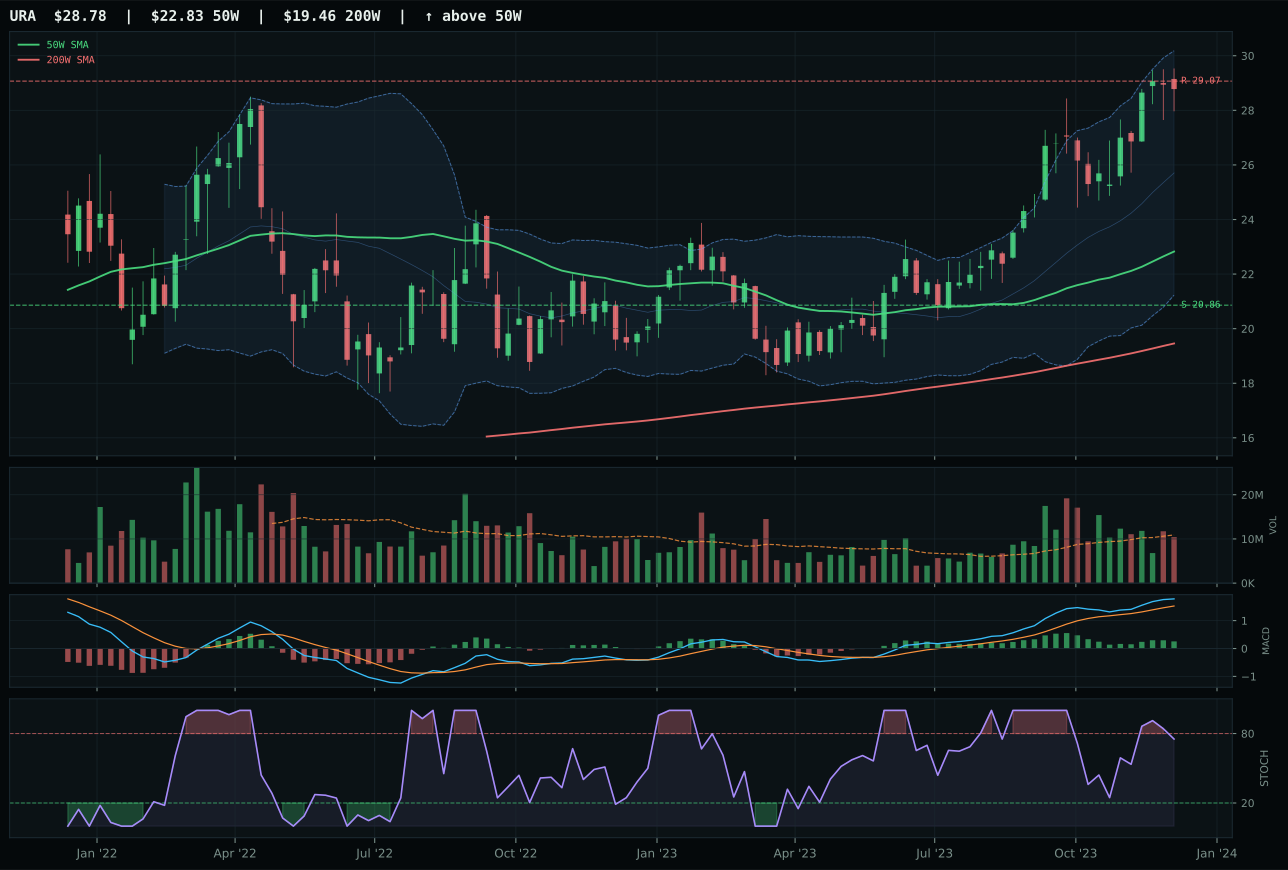
URA has a vertical extension profile with 14.2% 13-week relative strength versus SPY.
A failed hold above support would weaken the setup.
Actionable but governed by invalidation levels.
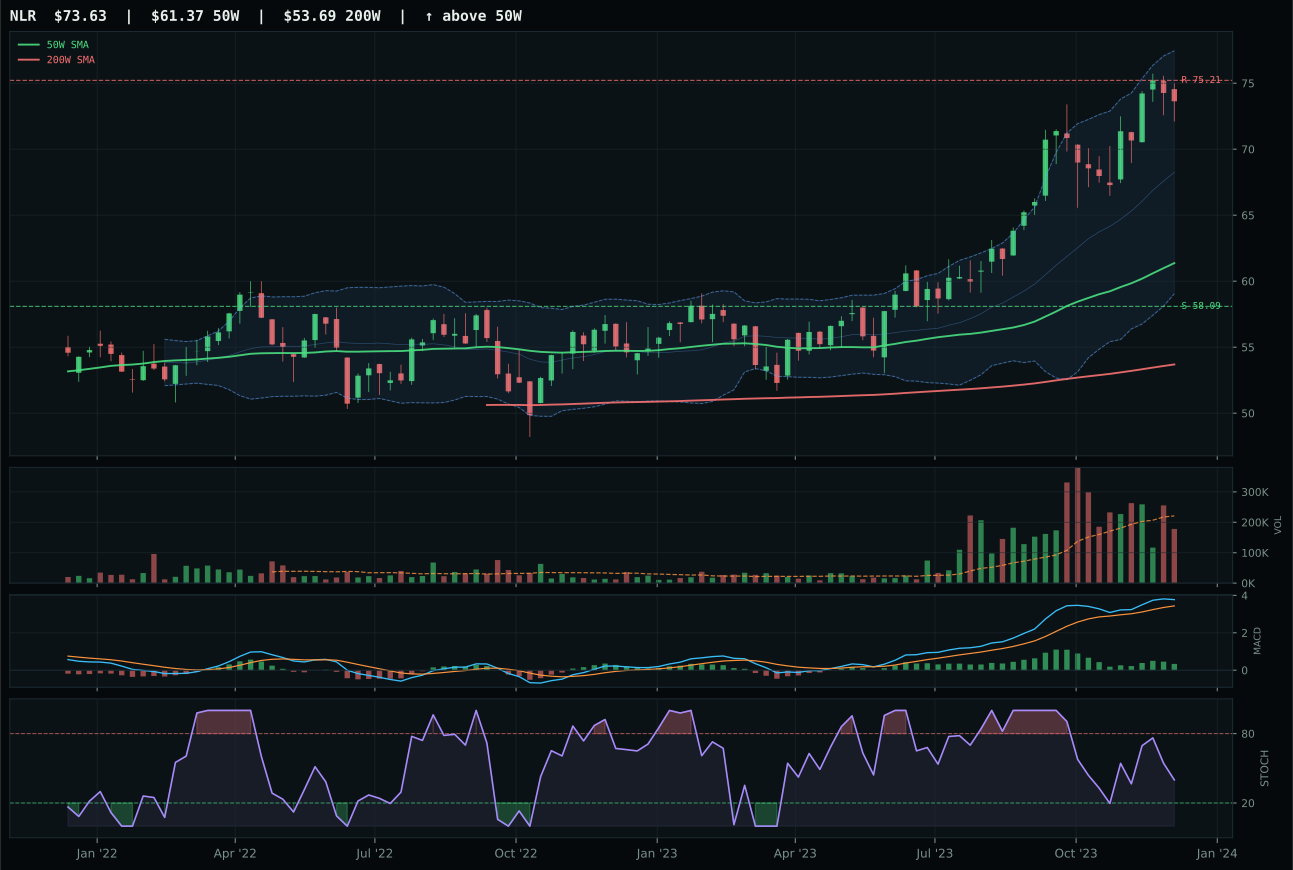
NLR has a vertical extension profile with 8.3% 13-week relative strength versus SPY.
A failed hold above support would weaken the setup.
Actionable but governed by invalidation levels.
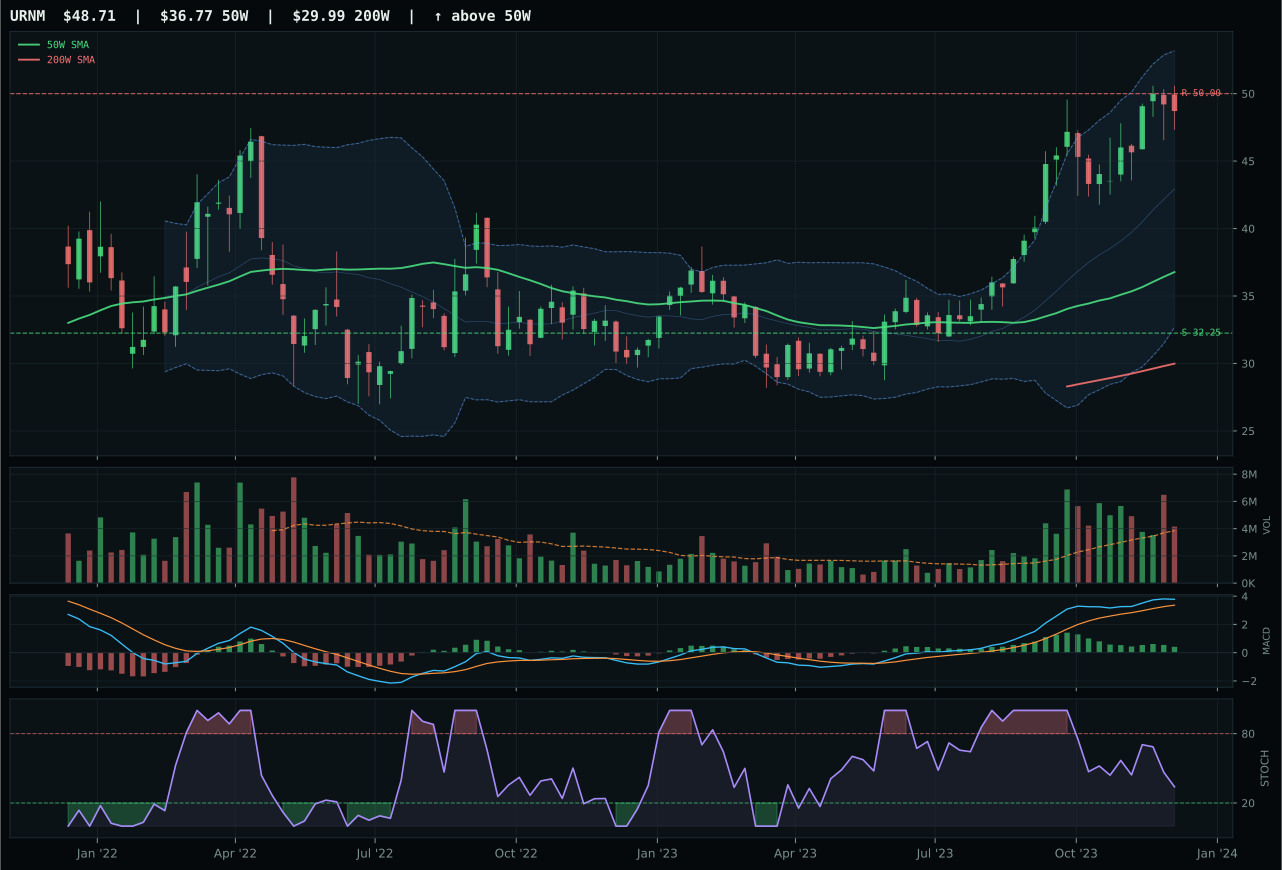
URNM has a vertical extension profile with 18.3% 13-week relative strength versus SPY.
A failed hold above support would weaken the setup.
Actionable but governed by invalidation levels.
URA beats NLR despite lower composite scores (64 versus 68) because trend dominance (100 for both) is superseded by momentum confirmation (100 versus 85) and category-relative strength (0.0% versus -5.9%). URA's 17.5% 13-week return vastly outpaces NLR's 11.6%, and 14.2% relative strength versus SPY versus NLR's 8.3% confirms URA is the market-preferred expression of the nuclear thesis. Both sit in vertical extension near the 52-week high, but URA's cleanliness of 50.0 versus NLR's 66.1 reflects that URA is a purer play on physical uranium scarcity, while NLR blends utility income—a divergence the market is pricing with a 5.9-point relative strength gap. Volume is neutral for both, MACD bullish and improving for both, but stochastic RSI is identical (falling/neutral 0.75), so the decision hinges entirely on peer breadth and the magnitude of momentum confirmation. URA's momentum score of 100 versus NLR's 85 is the separating factor: newer money is choosing URA over the steadier utility expression.
Nuclear Energy earned 5% allocation despite ranking below Technology and Defense & Aerospace in final category score (56.7 vs 59.7 and 57.2) because it serves a specific portfolio role as an alternative energy expression in a disinflation regime. Category-level macro fit is only 43.0, but AI growth sponsorship is active at +5 (data center power demand), and while liquidity stress (-7) and credit stress (-5) apply pressure, the technical merit of URA's momentum is strong enough at 66.9 to justify a small position. The allocation is defensive and thematic rather than aggressive: you hold it for the AI-driven power narrative and the clean energy transition story, not for near-term alpha. URA is extended, so new entry is poor, but existing holders benefit from momentum. To increase allocation, URA would need to consolidate at current levels (near 28 support/resistance), MACD would need to hold bullish improvement, and stochastic RSI would need to fully reset to falling-neutral without breaking down—giving you a cleaner entry on strength.
AI — BOTZ
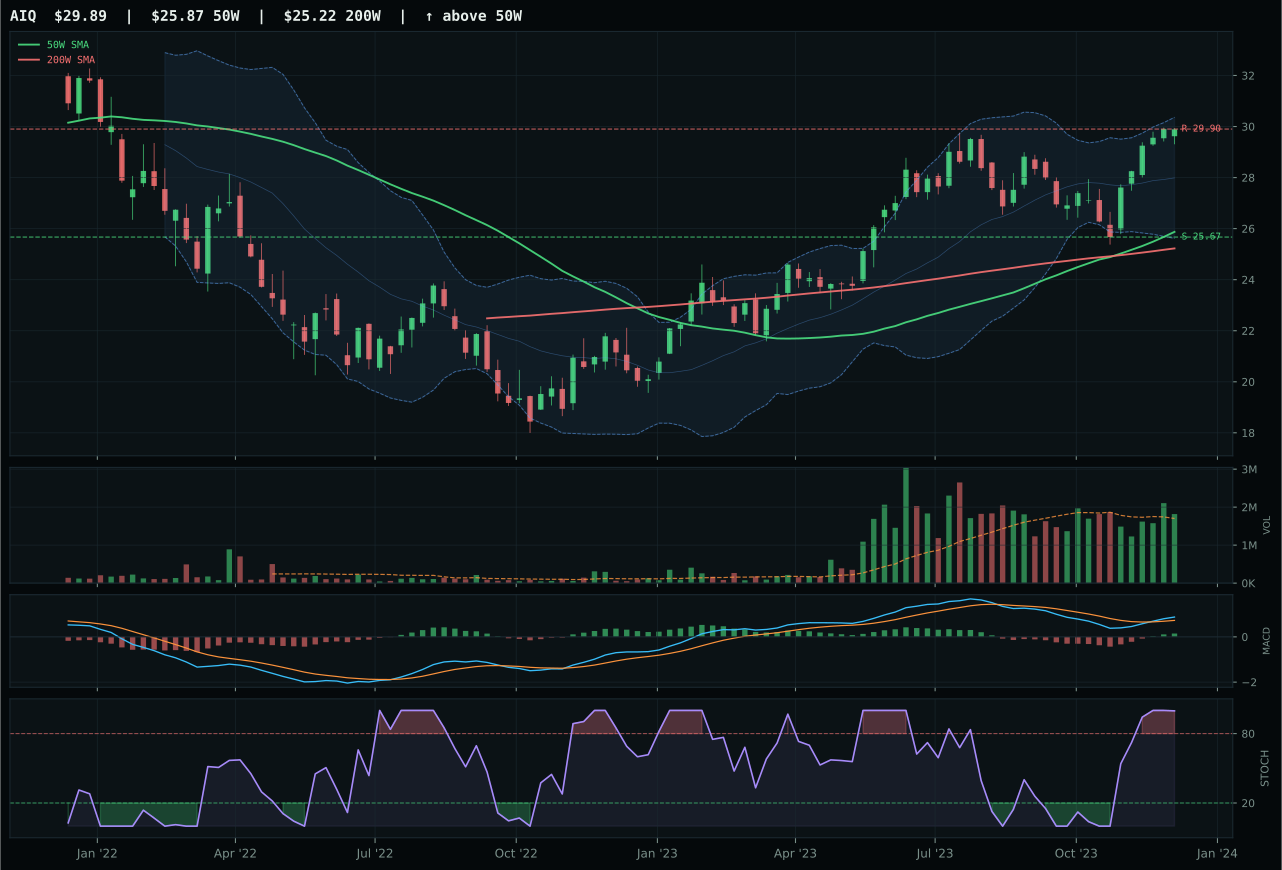
AIQ has a vertical extension profile with 2.2% 13-week relative strength versus SPY.
A failed hold above support would weaken the setup.
Actionable but governed by invalidation levels.
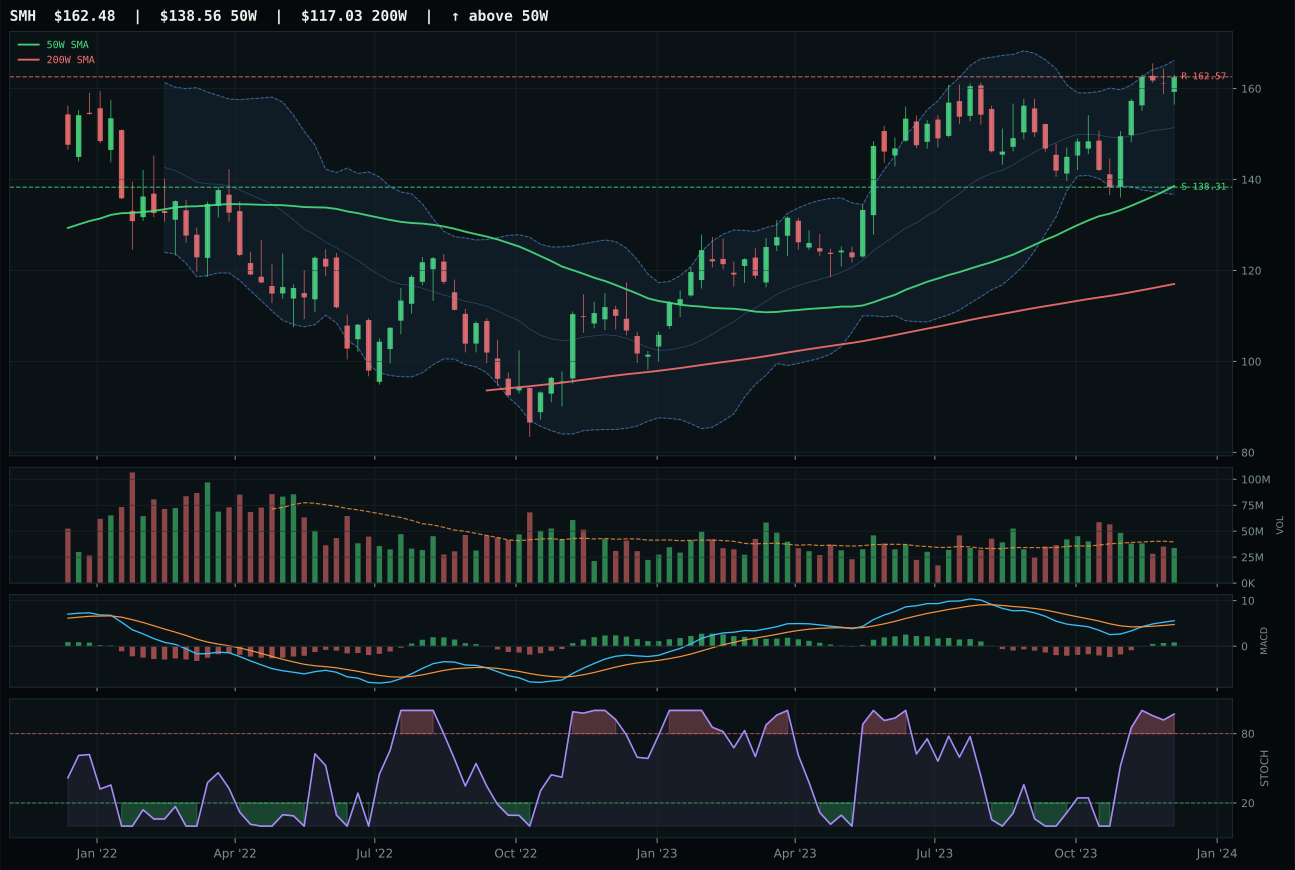
SMH has a vertical extension profile with 4.8% 13-week relative strength versus SPY.
A failed hold above support would weaken the setup.
Actionable but governed by invalidation levels.
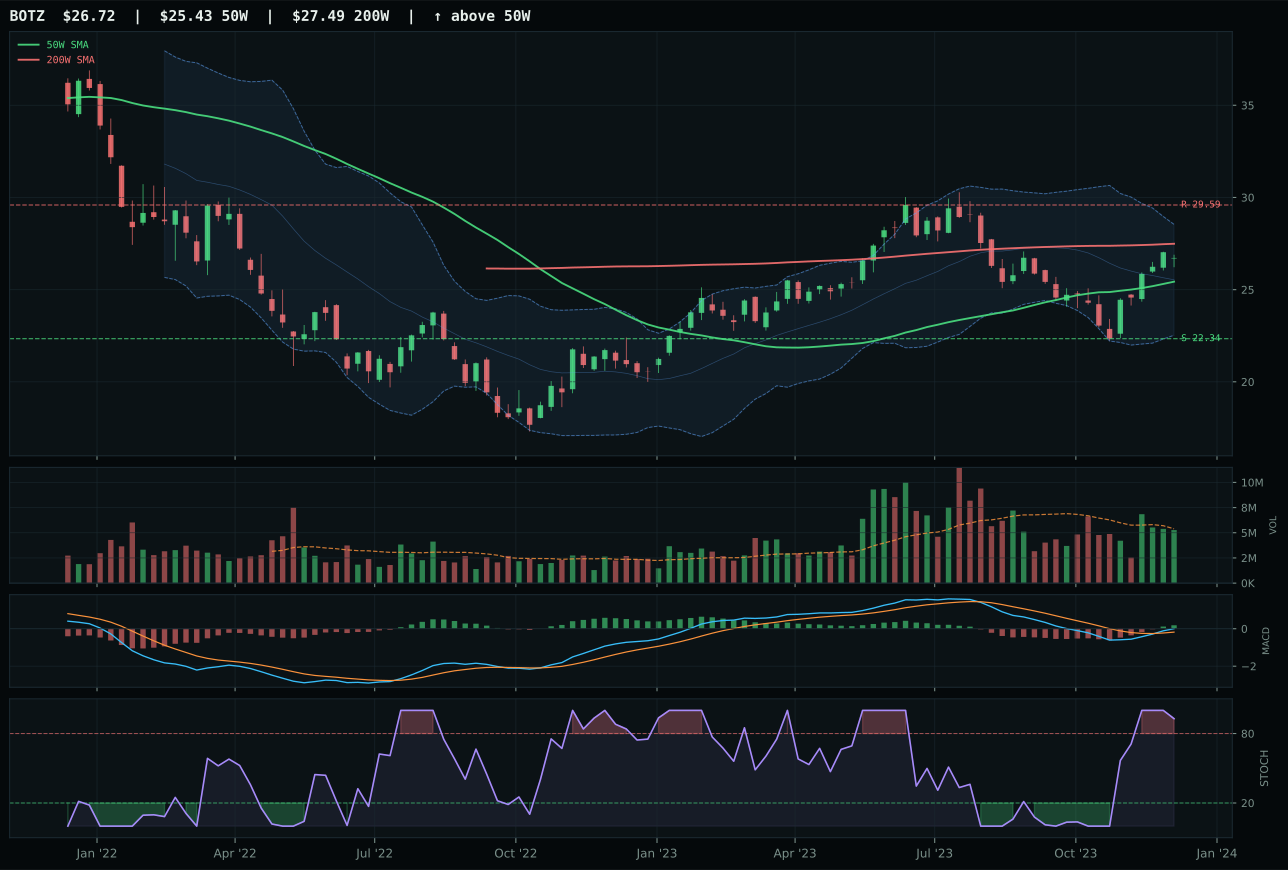
BOTZ has a neutral structure profile with -0.0% 13-week relative strength versus SPY.
A failed hold above support would weaken the setup.
Actionable but governed by invalidation levels.
BOTZ wins a weak category matchup by surviving where others fail—its 57.0 timing score crushes AIQ's 37.0, a 20-point gap driven by neutral proximity to the 50-week average (5.1% versus 15.5%) and a stochastic RSI that is rolling over rather than stuck at overbought extremes. AIQ sits extended with worse risk/reward (37.0 versus 53.9 for BOTZ), meaning new longs are paying peak prices with limited upside cushion. Both carry -0.0% to 2.2% relative strength versus SPY, but BOTZ's setup as neutral structure with stochastic RSI transitioning lower gives it a technical advantage in a macro environment where liquidity stress and credit stress are both active (-8 and -6 for BOTZ). AIQ's vertical extension near the 52-week high means the category-level macro sponsorship for AI growth (+14) must do all the heavy lifting, leaving no margin for execution risk.
AI's 5% allocation reflects its ranking as the third-best eligible category, though the 54.1 score masks a structural problem: the category-level macro fit is only 49.0, dragged down by liquidity stress (-12) and credit stress (-8) that outweigh the AI growth sponsorship tailwind (+14). BOTZ itself shows the tension clearly—it has pristine momentum confirmation at 69.4 and acceptable technical evidence at 60.4, but macro/narrative fit of only 41.0 reveals this is a cyclical AI trade into macro uncertainty. The 5% sizing is appropriate for a category that lacks top-2 conviction: it maintains exposure to the AI narrative without overcommitting when setup quality (neutral structure, mediocre timing) and macro conditions (liquidity stress active) argue for caution. To earn a larger allocation, this category would need either a cleaner breakout through resistance with volume confirmation or a shift in the macro regime away from liquidity tightness.
Precious Metals — GLD
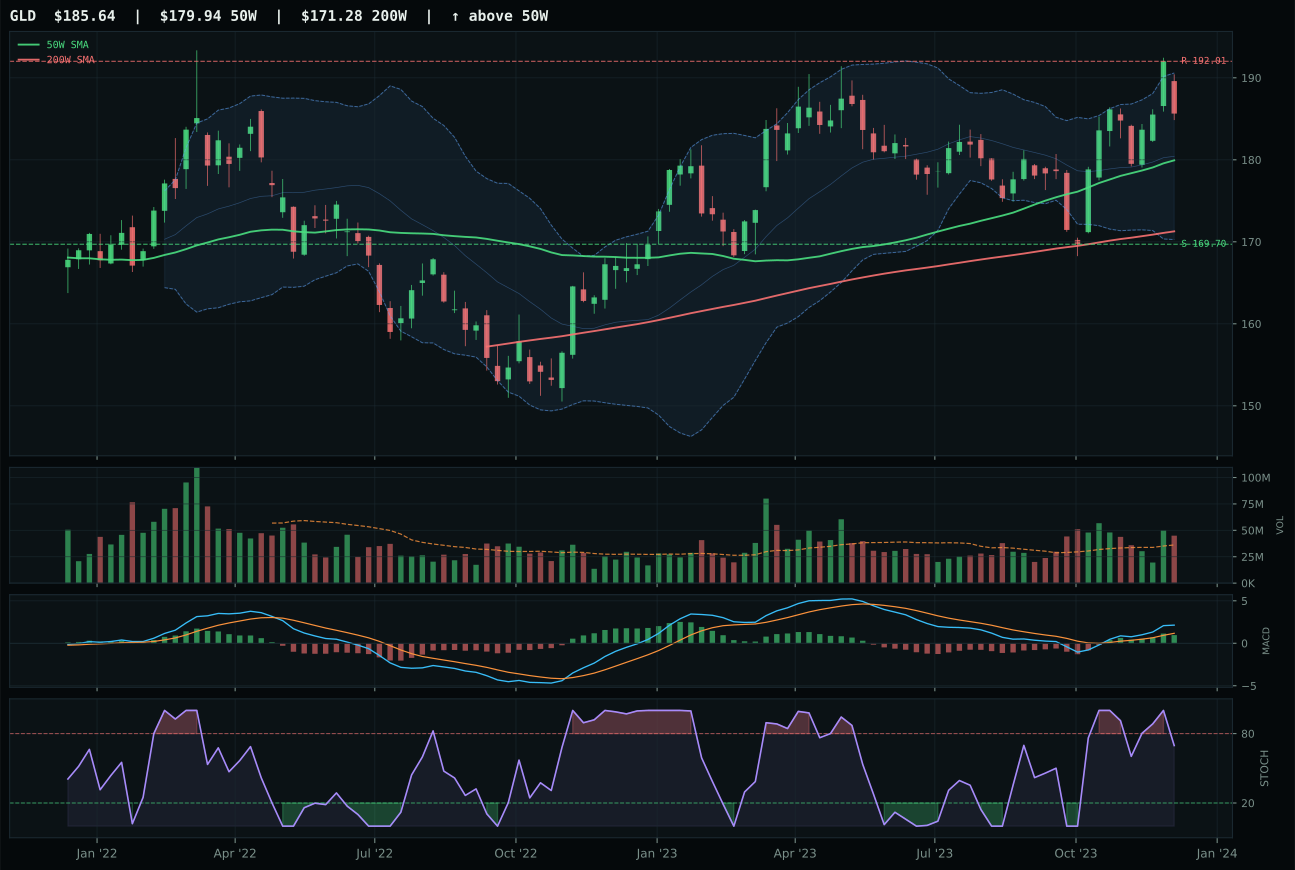
GLD has a neutral structure profile with 1.0% 13-week relative strength versus SPY.
A failed hold above support would weaken the setup.
Actionable but governed by invalidation levels.
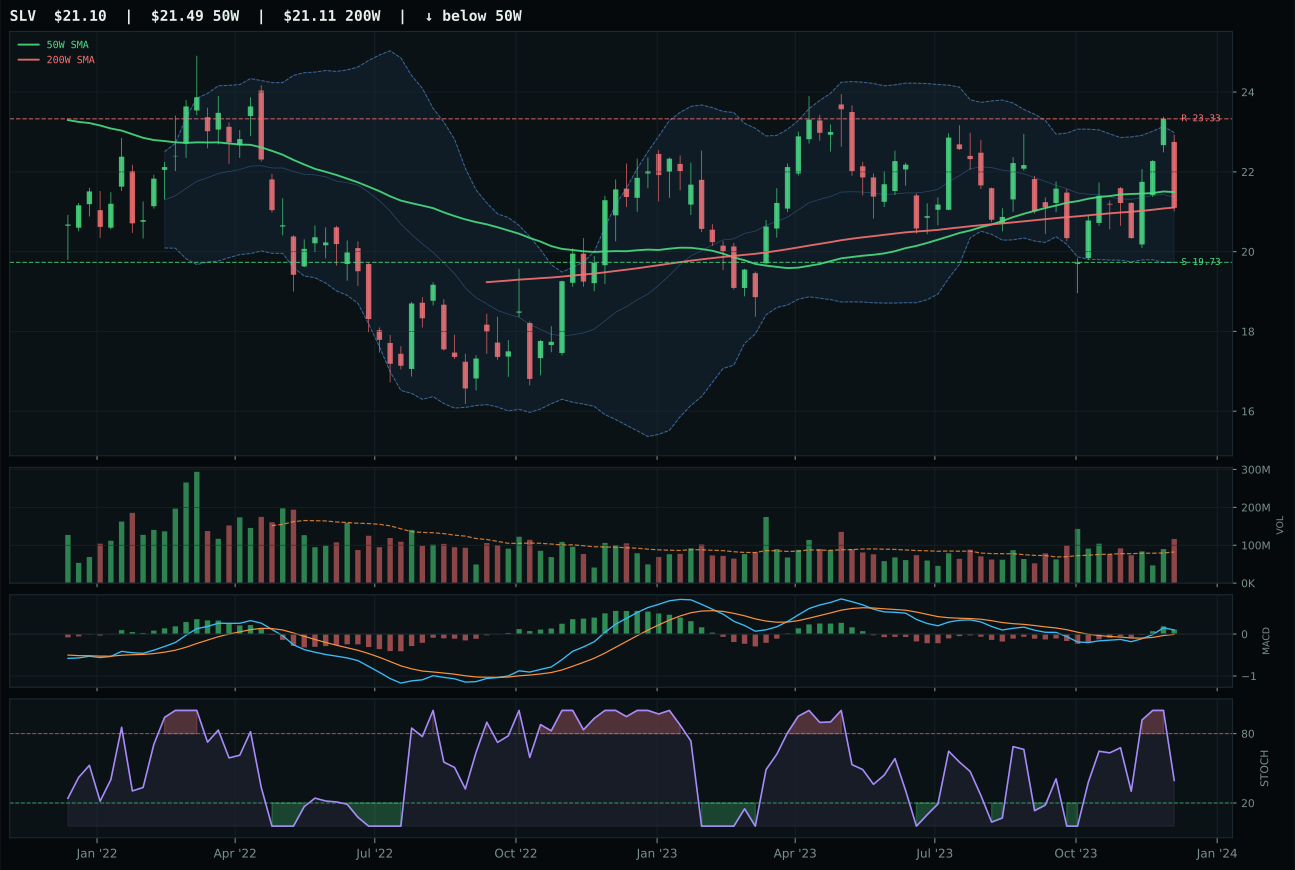
SLV has a compression near 50W profile with -2.9% 13-week relative strength versus SPY.
A failed hold above support would weaken the setup.
Actionable but governed by invalidation levels.
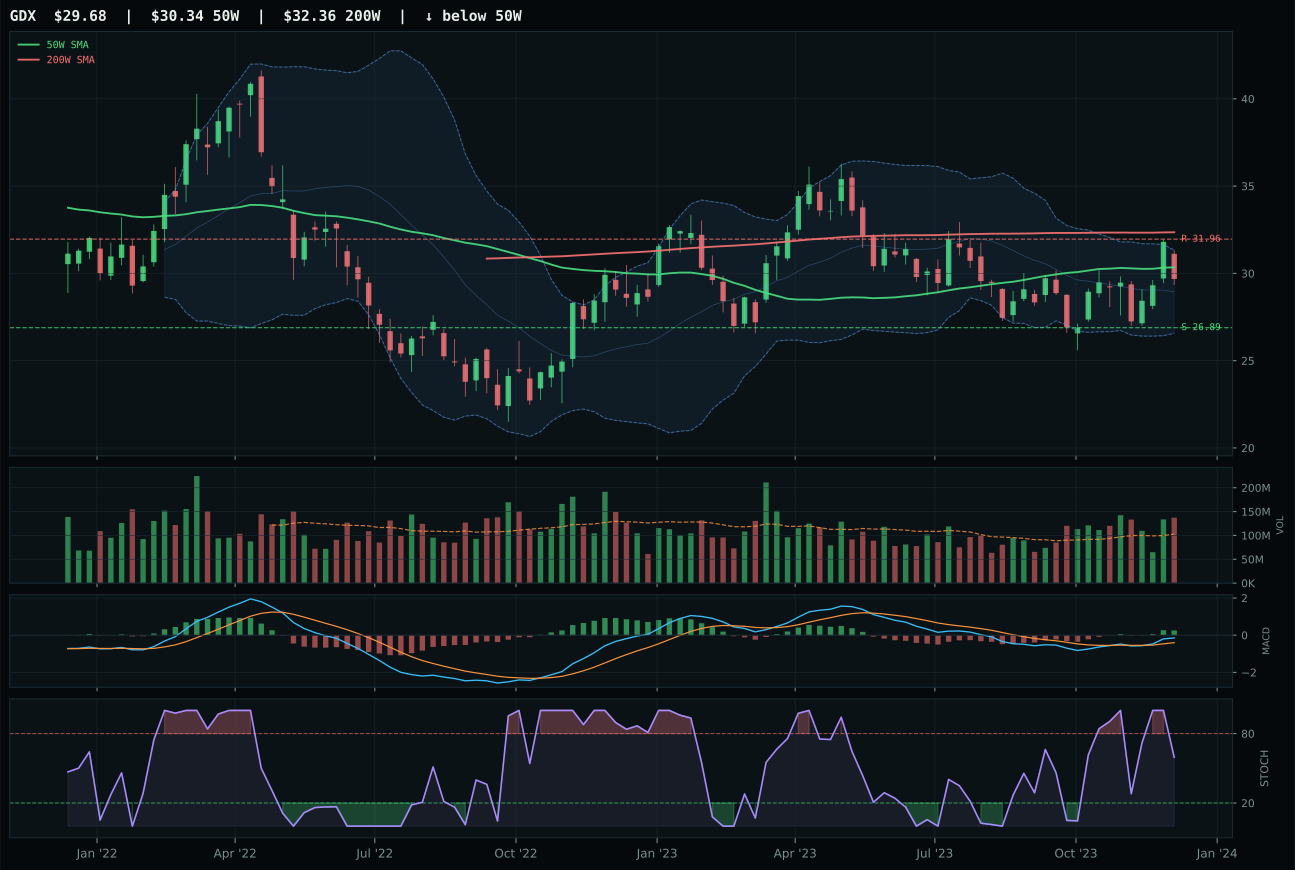
GDX has a compression near 50W profile with 1.4% 13-week relative strength versus SPY.
Extension and support failure are the main tactical risks.
Tracked, but not top-2 eligible because: structurally broken.
GLD dominates SLV by 16.4 points, a decisive margin built on structure cleanliness (78.1 versus 75.0), superior category-relative strength (0.0% versus -3.8%), and timing precision (90.0 versus 100.0 for SLV, but SLV's compression near the 50-week marks a more defensive position). Both sit bullish-improving MACD, but GLD's stochastic RSI is falling/neutral at 0.70 while SLV is also neutral, giving GLD the cleaner exit ramp if momentum fails. Volume participation favors GLD at 1.24x the 20-week average (above-average, signaling institutional accumulation) versus SLV's neutral reading. GLD's 4.2% 13-week return and 1.0% relative strength versus SPY represent genuine outperformance, while SLV's 0.4% and -2.9% suggest the precious metals bid is concentrated in the monetary hedge story (gold) rather than the hybrid industrial-monetary exposure (silver). Distance to the 50-week favors GLD at 3.2% (very close) versus SLV at compression, meaning GLD offers better risk-reward geometry.
Precious Metals earned 5% in the portfolio at 53.5 category score because disinflation actively supports the exposure at plus-8 on macro fit, making this a category-level 64.0 macro match—the highest macro fit in the entire allocation. Timing is the weakest link: GLD's price sits at Fib 0.236 extension and upper retracement momentum zone, meaning the setup is efficient but late; risk/reward at 51.4 offers only 3.3% upside to resistance and 9.4% downside cushion, a ratio that wouldn't excite in isolation. Volume-price confirmation at 72.7 and persistence at 65.2 provide some structural sponsorship that justifies holding rather than selling, and the category ranking at 53.5 places it clearly ahead of several lower-volatility alternatives. Disinflation pressure active at plus-6 is the allocator's conviction thesis here: falling real rates lift gold's purchasing power narrative, and even extended timing can be tolerated when macro winds are this favorable. SLV would need to confirm that silver's industrial beta is recovering to earn an upgrade; until then, the pure monetary expression in GLD holds the slot.
Emerging Markets — ILF
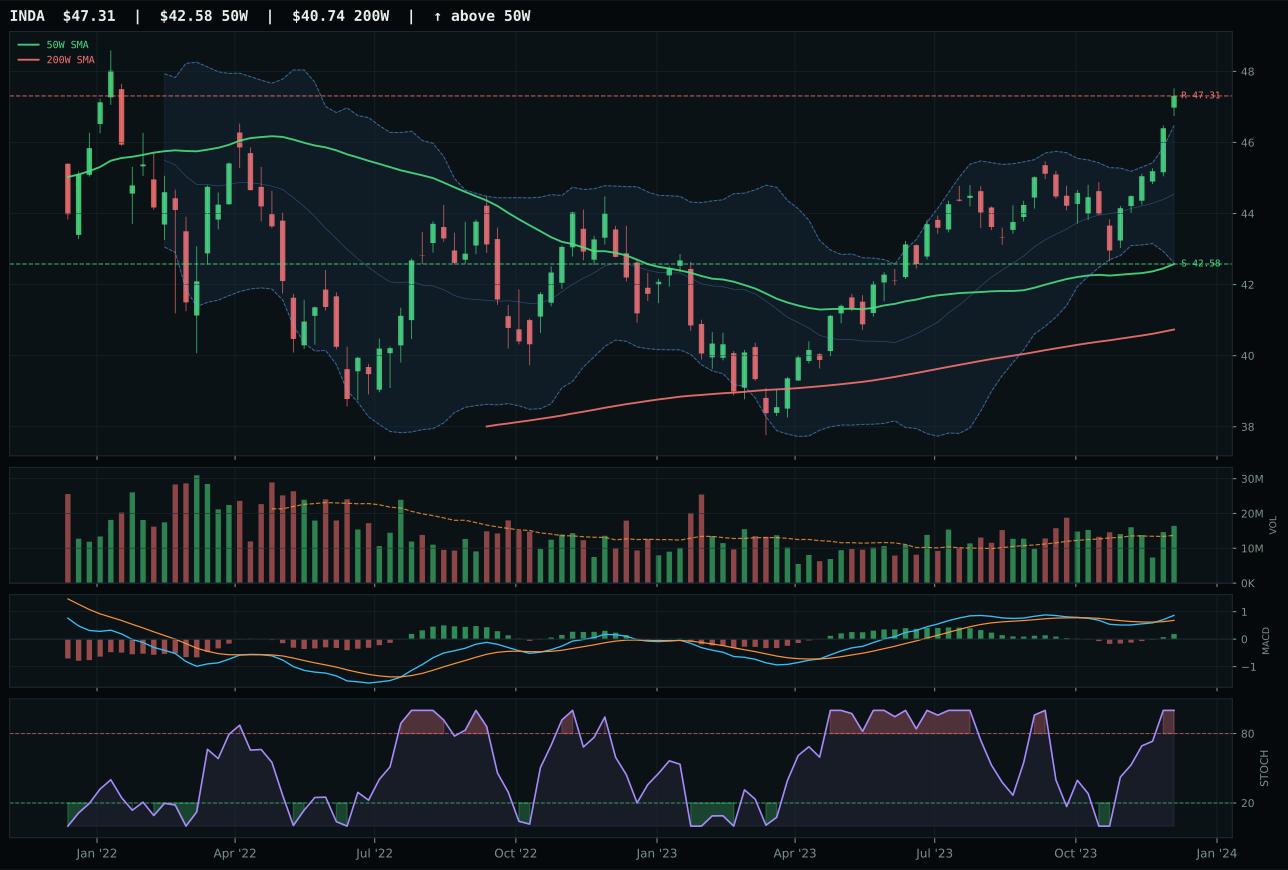
INDA has a neutral structure profile with 1.8% 13-week relative strength versus SPY.
A failed hold above support would weaken the setup.
Actionable but governed by invalidation levels.
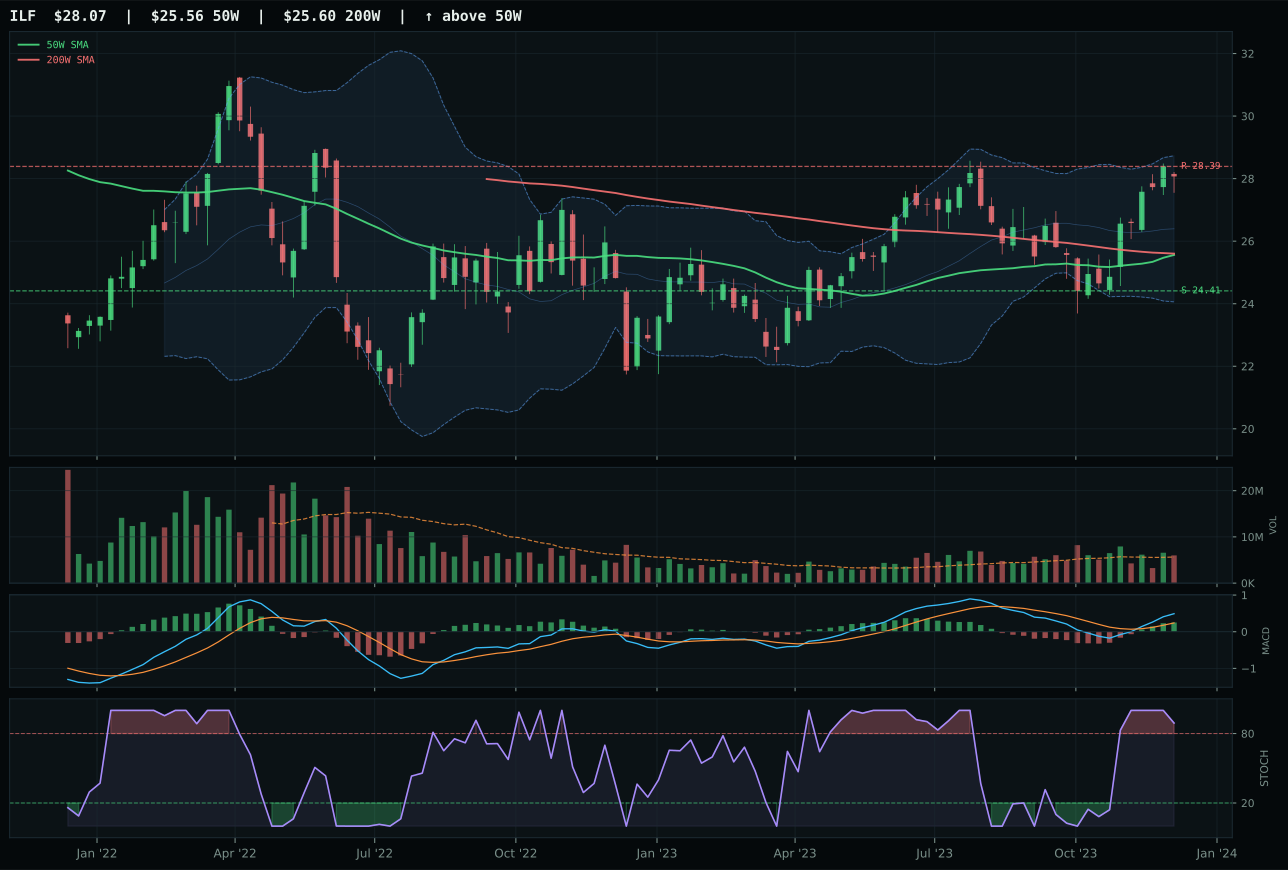
ILF has a neutral structure profile with 6.7% 13-week relative strength versus SPY.
A failed hold above support would weaken the setup.
Actionable but governed by invalidation levels.
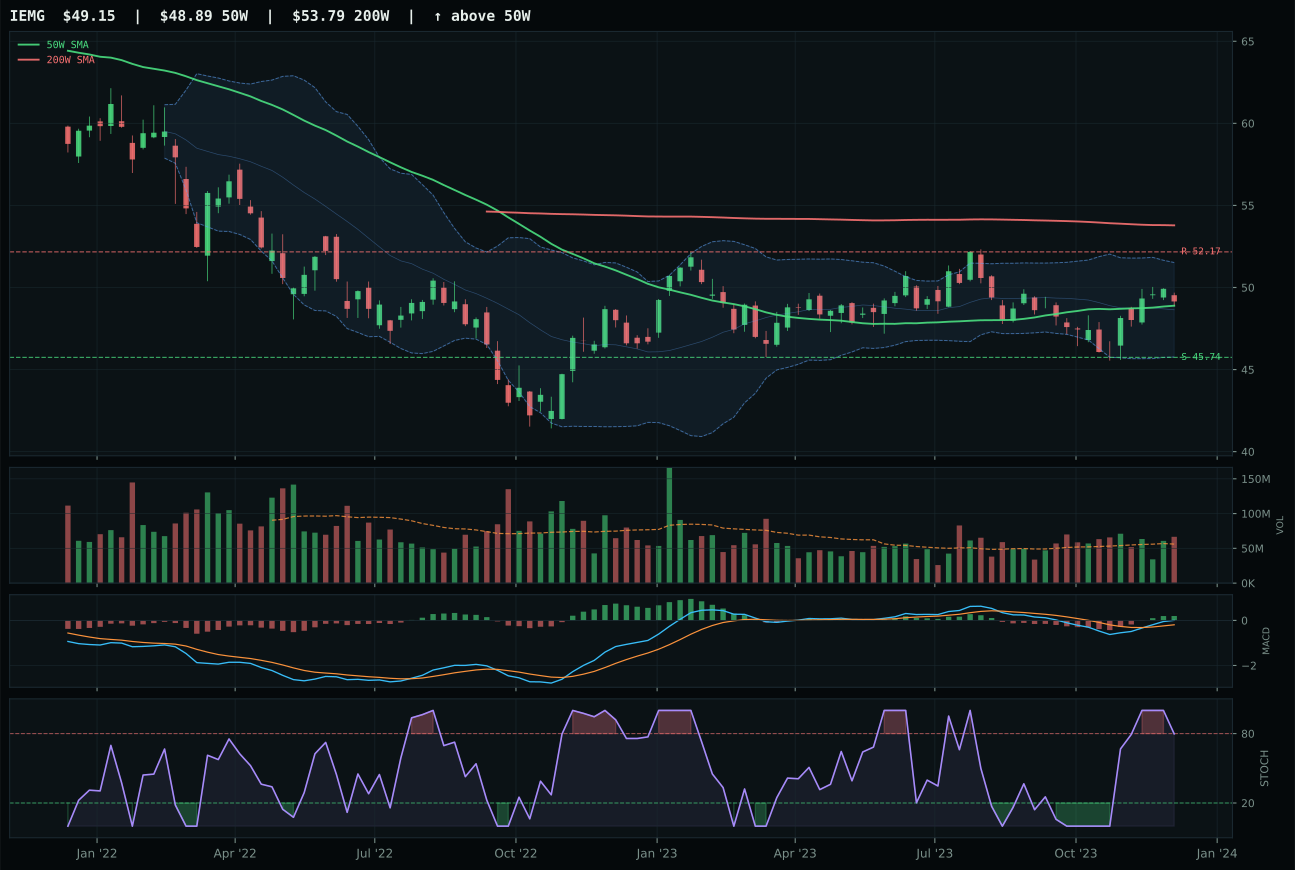
IEMG has a compression near 50W profile with -2.2% 13-week relative strength versus SPY.
A failed hold above support would weaken the setup.
Actionable but governed by invalidation levels.
ILF wins by a 2.8-point margin over INDA based entirely on category-relative strength (4.9% versus 0.0%) and marginally cleaner structure (73.9 versus the runner-up's implicit lower score). Both score 100 on trend, both sit in vertical extension, both have bullish-improving MACD. INDA's technical composite is actually higher (79 versus 76), with superior volume participation (above-average versus ILF's neutral), but INDA carries zero category-relative strength, meaning it's underperforming its direct peers. ILF's Latin America exposure (commodity and value beta) is outperforming India's quality-growth story inside the emerging markets basket, and the portfolio algorithm prioritizes peer breadth over absolute technical purity. Both carry negative relative strength versus SPY (INDA at 1.8%, ILF at 6.7%), but ILF's outperformance of category median is decisive. This is a category-internal selection that would flip if INDA began to outbid ILF on relative strength—a reversal that could happen if the India premium reasserts.
Emerging Markets earned 5% allocation despite a weak 52.2 category score and poor 30.0 macro fit, placing it in the second tier of supported categories behind the top performers. Credit stress (-10) and liquidity stress (-10) create a -20 macro headwind that significantly outweighs any disinflation benefit, explaining why this category does not rank in the top tier. ILF's technical evidence of 70.8 is respectable, and the 10.0% 13-week return with 4.9% category-relative strength shows the position is working, but the allocation reflects a tactical hedge on EM currency strength and commodity price stability rather than a growth bet. The 5% sizing is appropriate for a category that is technically sound but macro-headwind, offering diversification benefit without conviction. To push this into a larger allocation, the category would need either a shift in the macro regime away from credit stress (requiring central bank pivot signals) or a clean breakout from ILF above 28.39 resistance with sustained volume confirmation—neither is imminent.
Utilities & Infrastructure — PAVE
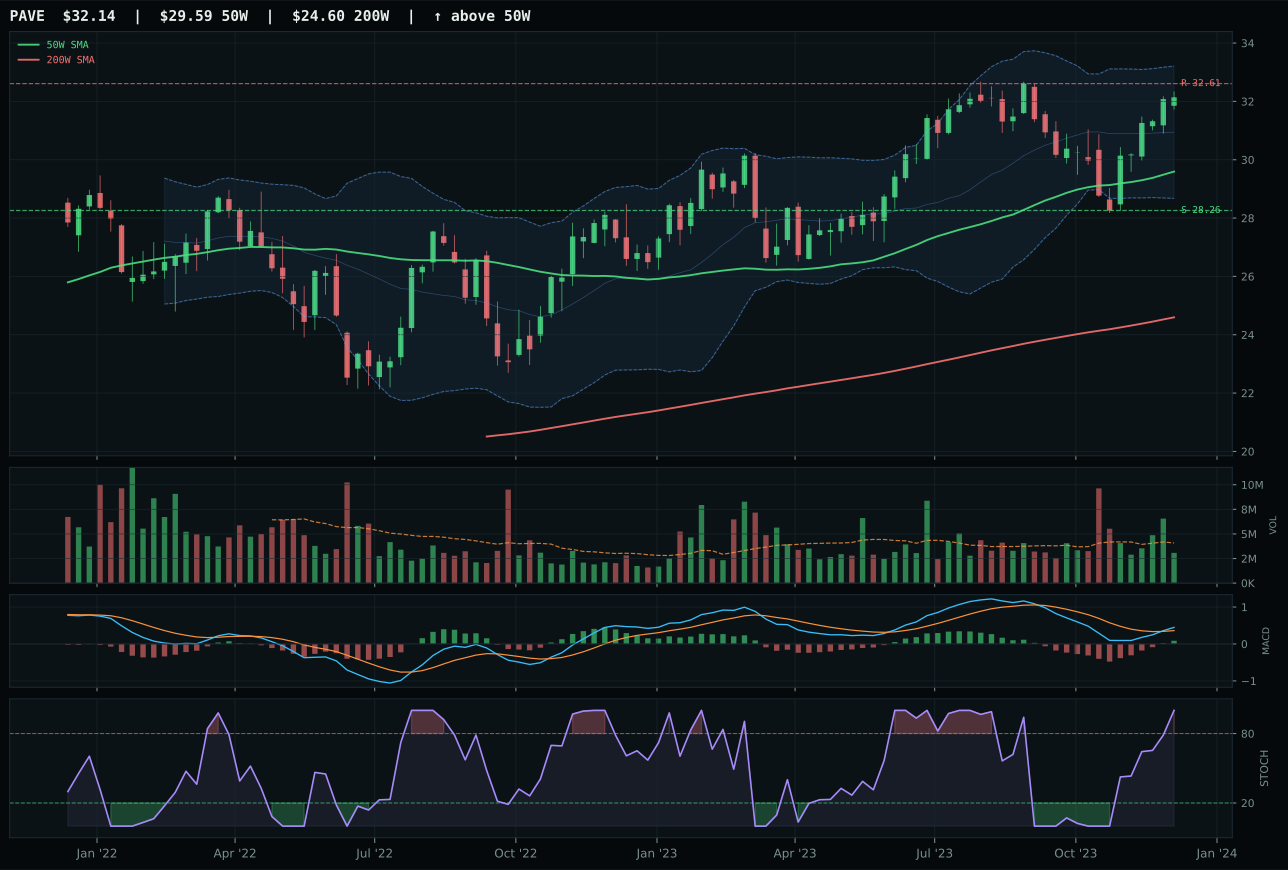
PAVE has a neutral structure profile with -0.9% 13-week relative strength versus SPY.
A failed hold above support would weaken the setup.
Actionable but governed by invalidation levels.
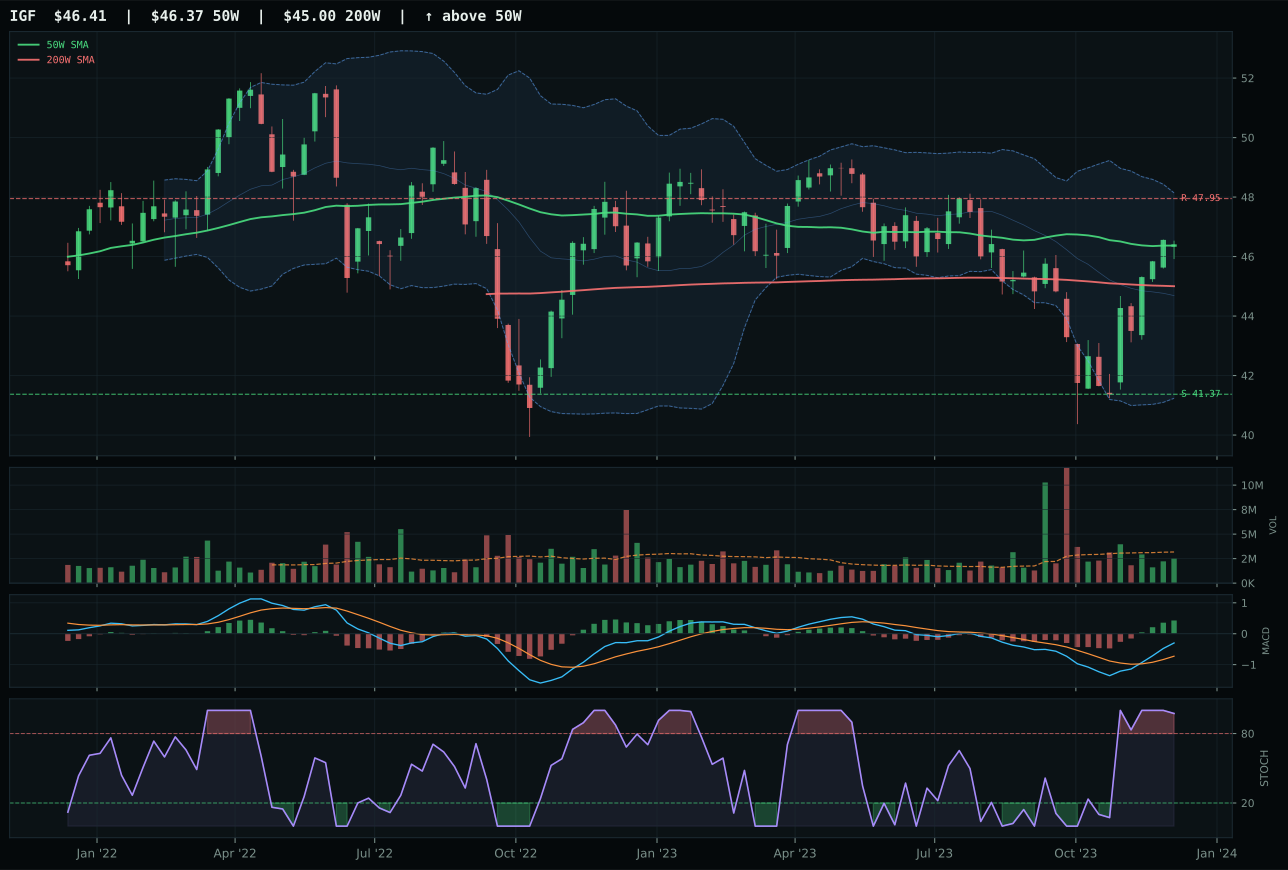
IGF has a compression near 50W profile with 0.2% 13-week relative strength versus SPY.
A failed hold above support would weaken the setup.
Actionable but governed by invalidation levels.
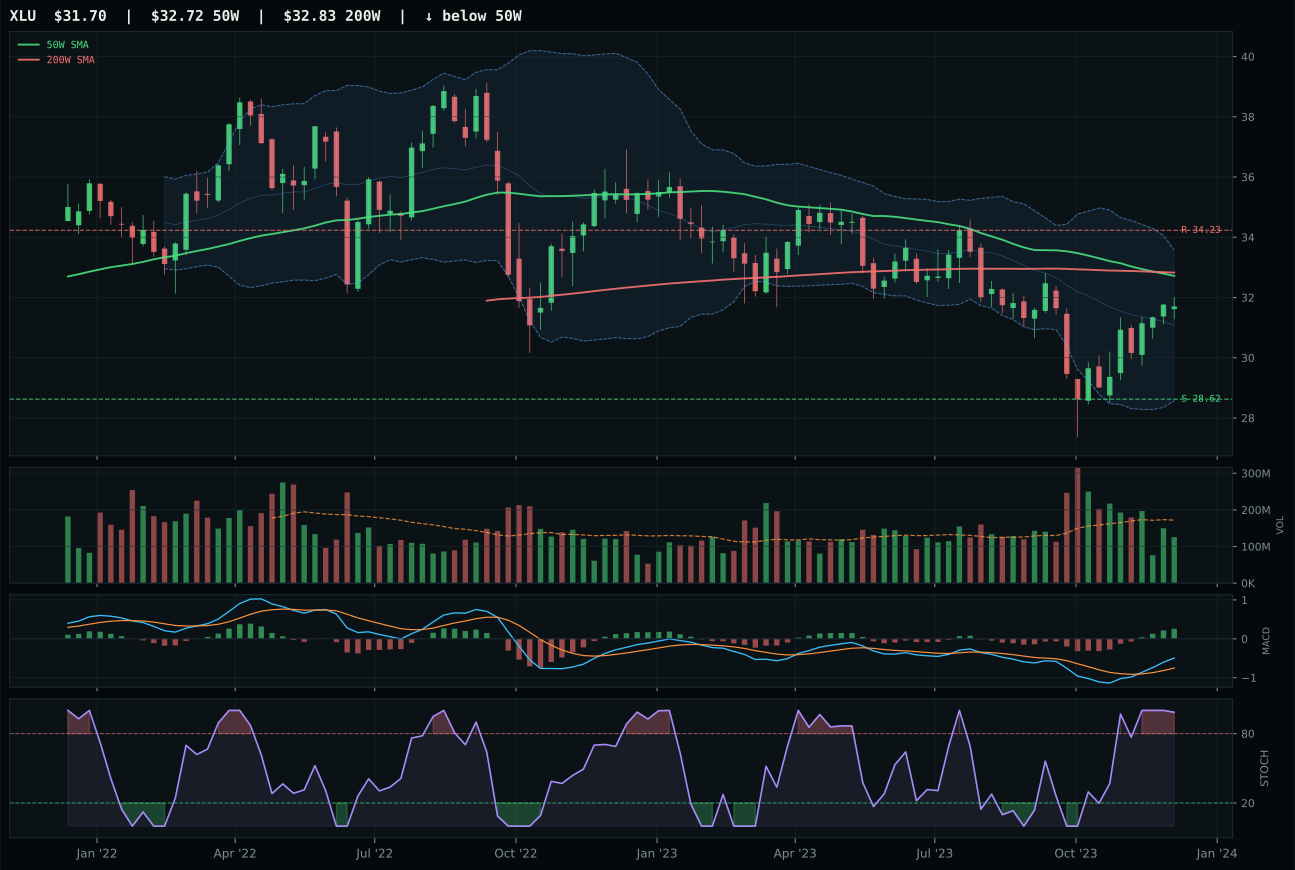
XLU has a neutral structure profile with -2.9% 13-week relative strength versus SPY.
Extension and support failure are the main tactical risks.
Tracked, but not top-2 eligible because: structurally broken.
PAVE edges IGF by 3.7 points on structure cleanliness (74.6 versus 70.0) and identical category-relative strength (0.0% for PAVE, 1.1% for IGF implies PAVE is the median). Both score near-identically on trend (PAVE 98.6, IGF 70), sit near 52-week highs in their respective setups, and show bullish-improving MACD. PAVE's timing of 75.0 beats IGF's 82.0 (IGF is more compressive, hence less timely entry), and PAVE's volume at 0.75x the 20-week average (thin but neutral) is offset by superior structure. PAVE's 2.4% 13-week return versus IGF's 3.5% shows IGF has better momentum, but PAVE's infrastructure and capex beta story is more directly aligned with the domestic thesis in a disinflation regime. The -0.9% relative strength versus SPY for PAVE versus 0.2% for IGF is statistically negligible, but combined with structure, it tips the decision to the domestic infrastructure play.
Utilities & Infrastructure earned 5% allocation despite scoring 50.2—tied with Emerging Markets for the lowest rank among allocated categories—because the portfolio needs a defensive infrastructure play in a disinflation regime where capex spending is favored. Category-level macro fit is actually strong at 64.0, with disinflation pressure active at +6 and a 'Transition / Mixed' regime tailwind at +4, making this one of the better-positioned categories from a macro perspective. PAVE's technical evidence of 76.0 is solid, and the setup (near 52-week high, neutral volume, bullish MACD) is clean enough to justify a small allocation to a sector that benefits from government infrastructure spending in low-rate environments. The 5% is not a growth allocation—PAVE's 2.4% 13-week return is mediocre—but rather a stability/diversification play on the disinflation narrative. To increase allocation, PAVE would need to accelerate momentum (currently only 74.3) and show category-relative dominance, which would require breaking above 32.61 resistance with sustained volume confirmation.
Agriculture & Livestock — MOO
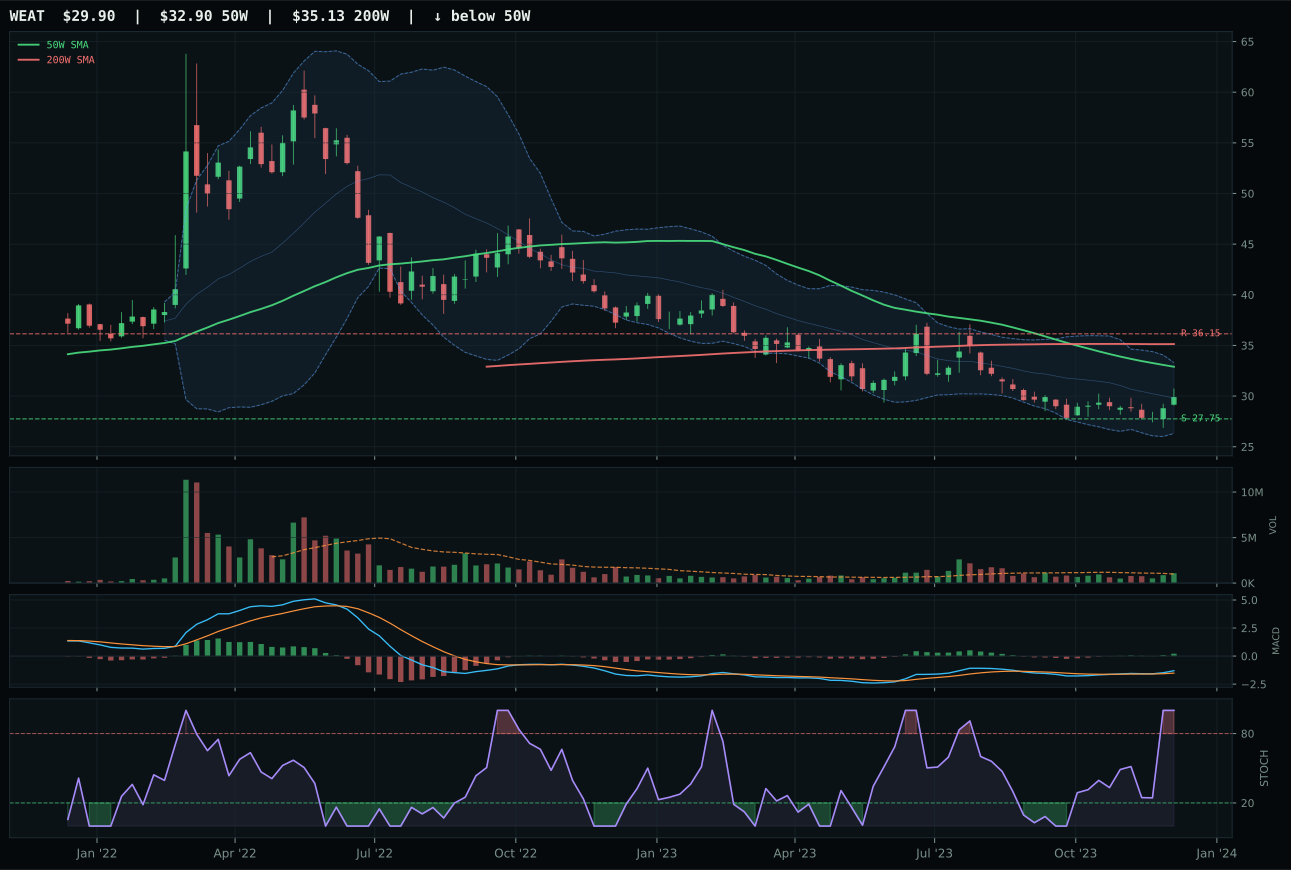
WEAT has a neutral structure profile with -2.5% 13-week relative strength versus SPY.
Extension and support failure are the main tactical risks.
Tracked, but not top-2 eligible because: structurally broken.
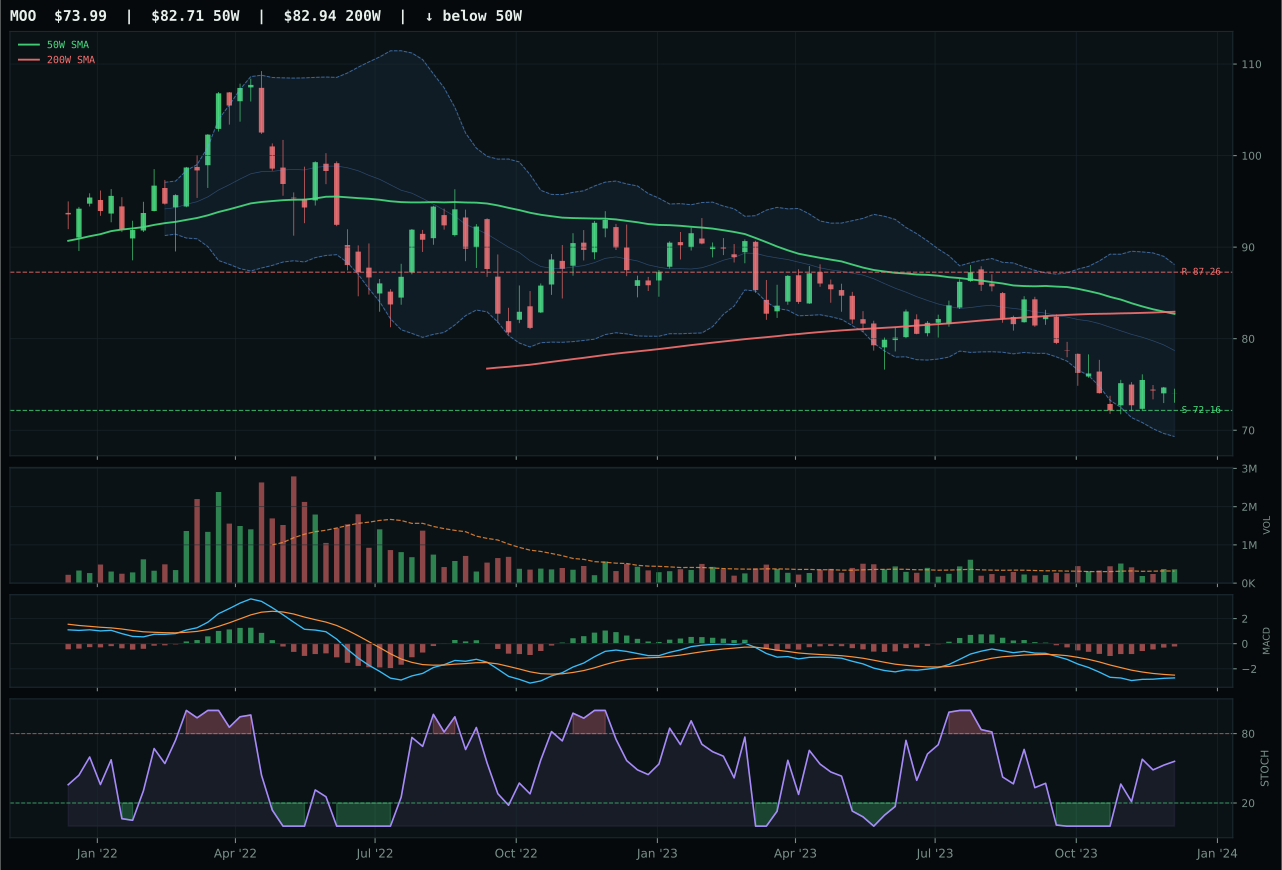
MOO has a pullback into support profile with -12.4% 13-week relative strength versus SPY.
Extension and support failure are the main tactical risks.
Tracked, but not top-2 eligible because: structurally broken.
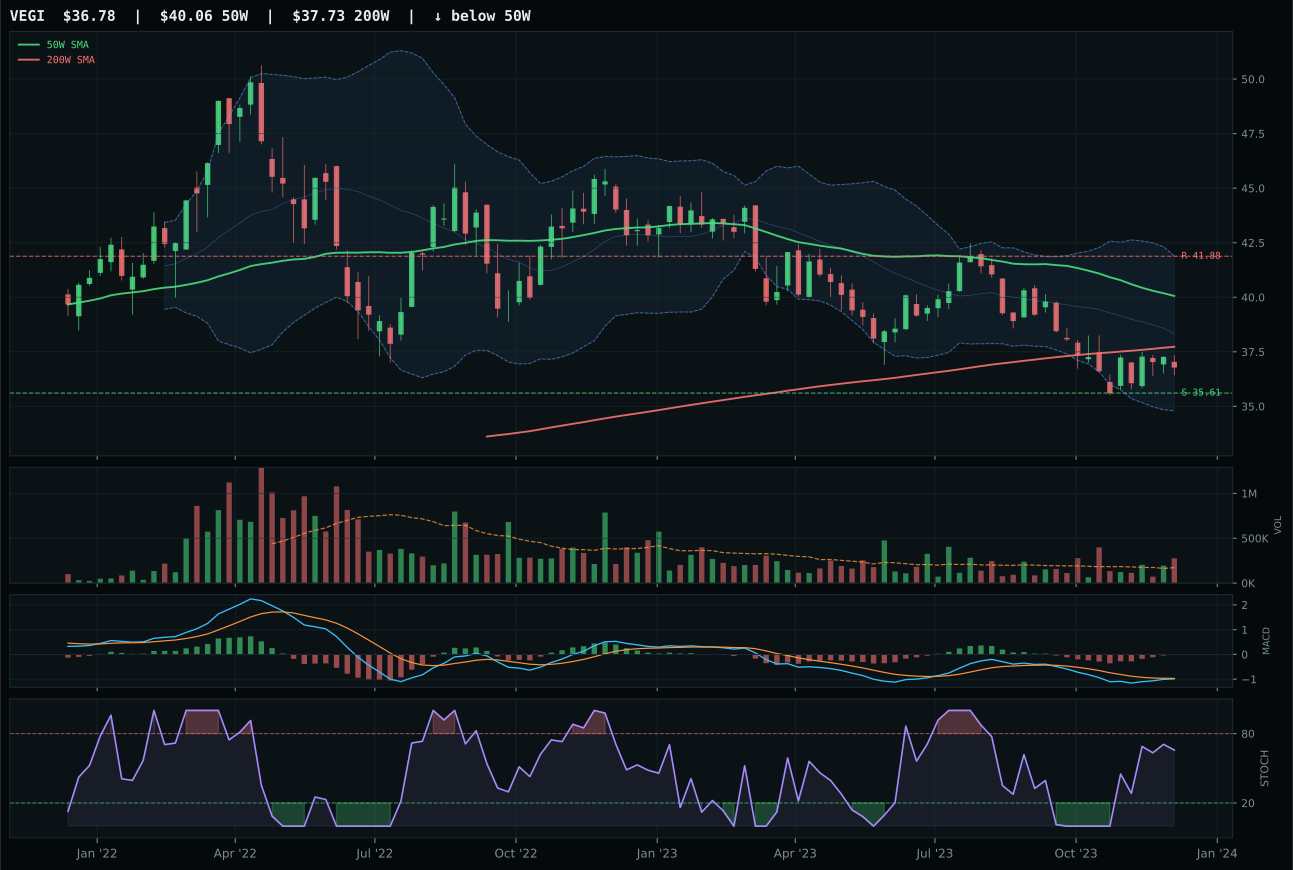
VEGI has a pullback into support profile with -9.5% 13-week relative strength versus SPY.
A failed hold above support would weaken the setup.
Tracked, but not top-2 eligible because: .
MOO wins a structurally broken category on the margin—its 90.0 risk/reward score (upside -15.2%, downside -2.5%) gives it the widest margin between ruin and recovery, and above-average volume participation at 1.15x the 20-week average shows some institutional interest in the repair zone. WEAT was disqualified by hard filters (structurally broken), leaving MOO as the least-damaged option. MOO's MACD is bearish but improving and stochastic RSI is falling/neutral at 0.56, meaning technical conditions are resetting rather than rolling over further. The category itself is worthless—Agriculture scored 0.0 on final ranking because disinflation pressure (-8) and macro fit of only 32.0 crushed all three ETFs. MOO's 13-week return of -9.1% and -12.4% relative strength versus SPY leave no doubt: this is a category where no position should be taken, yet the portfolio holds MOO at 5% because cash allocation demands diversification and MOO at least offers defined support and volume confirmation of a potential reversal.
Agriculture & Livestock earned a 5% allocation despite scoring 0.0 as a category because FBTC already dominates the portfolio at 50% and the allocation system still needs category representation across the non-crypto sleeves. The score of 0.0 reflects eligibility failure: disinflation pressure is active at -8, the category-level macro fit is only 32.0, and the technical ETF evidence base of 21.4 (MOO) is near-disqualifying. This category ranks 9th or 10th among the ten eligible sleeves, making the 5% more of a placeholder than a conviction bet. The position will move to 0% the moment another category becomes available or MOO's support breaks, at which point the capital rotates into defensive strength elsewhere. What would change this: MOO must hold support at 72.16 without volume capitulation, MACD must fully reverse to bullish, and the macro descriptor profile around commodity demand would need to shift from deflationary to inflationary—a regime change that is not currently active.
Industrial Metals — COPX
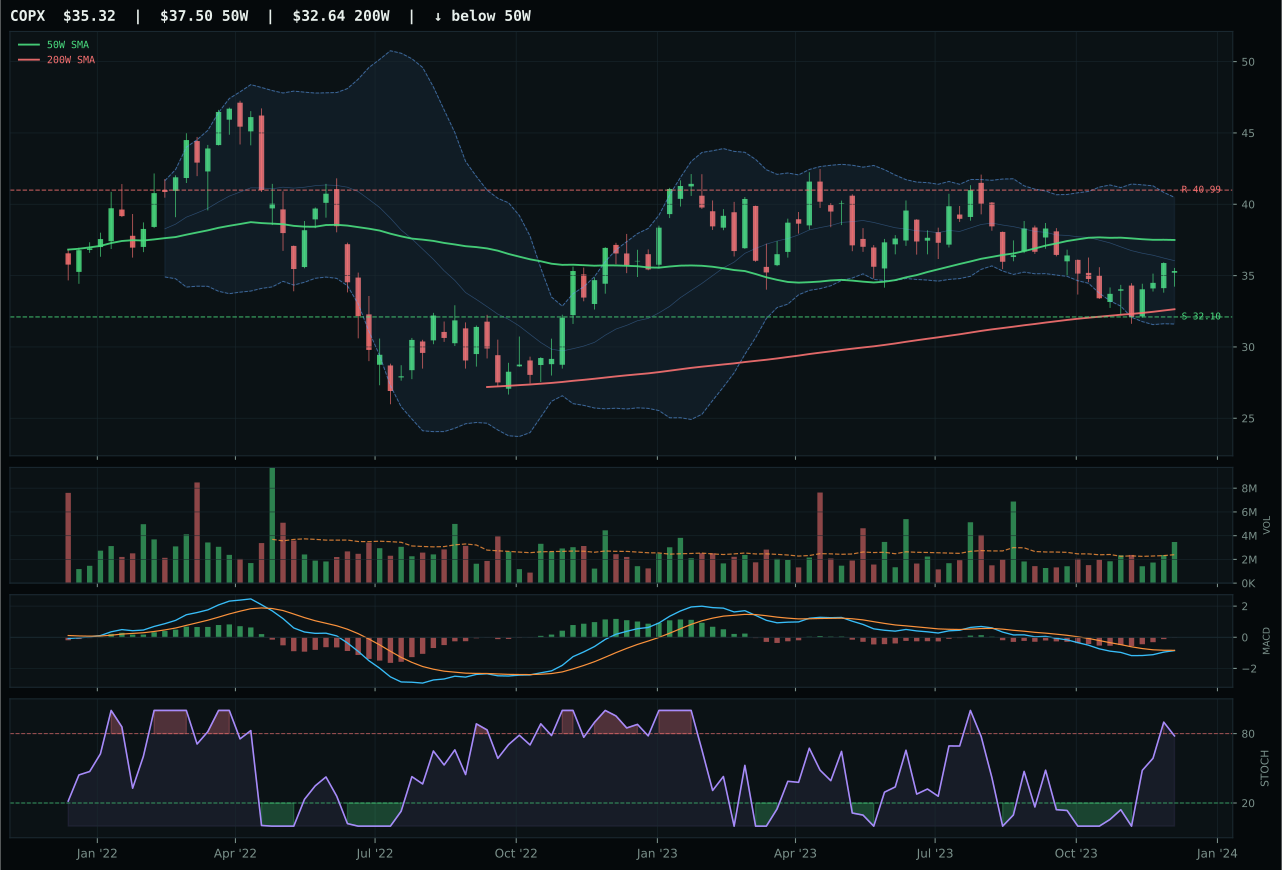
COPX has a neutral structure profile with -7.0% 13-week relative strength versus SPY.
A failed hold above support would weaken the setup.
Actionable but governed by invalidation levels.
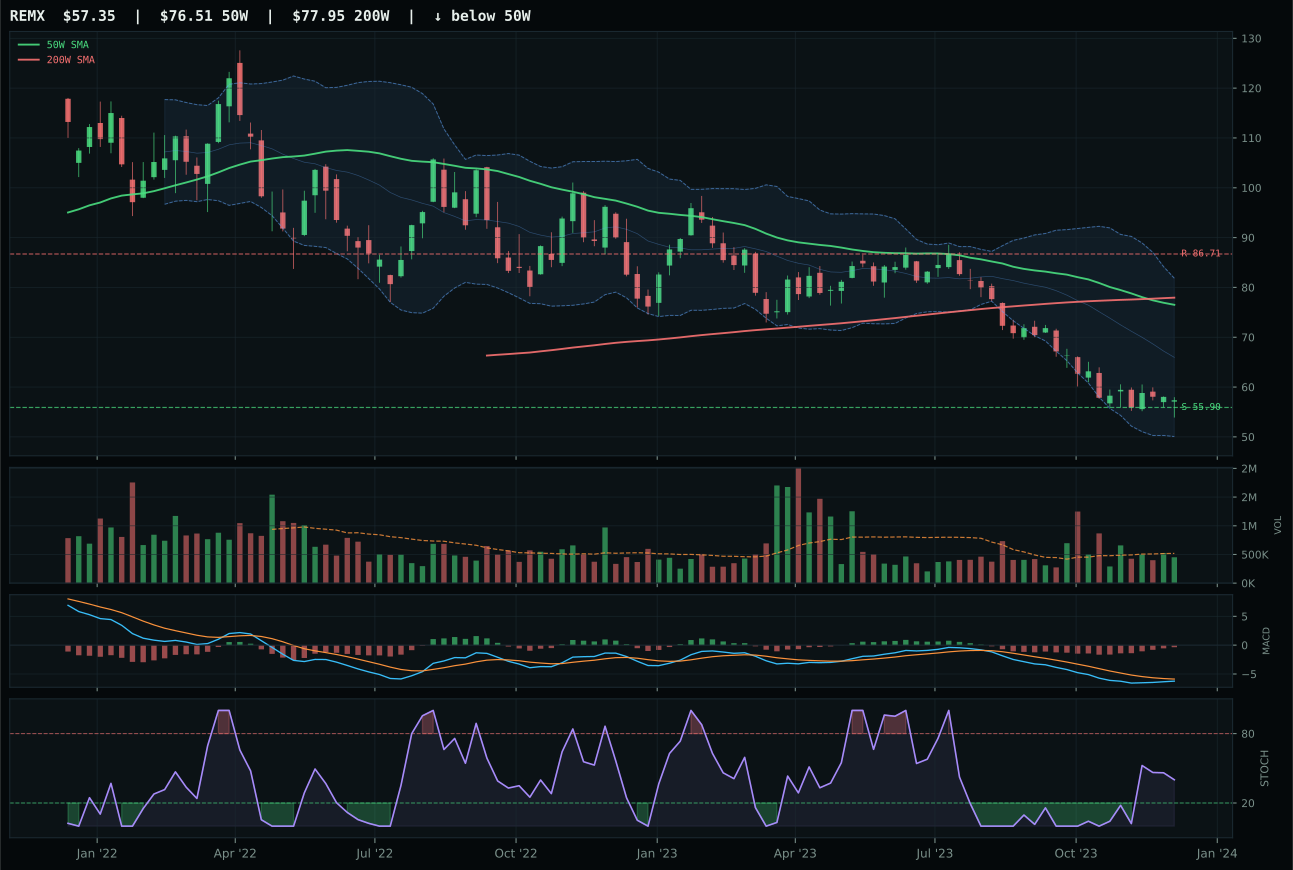
REMX has a pullback into support profile with -21.9% 13-week relative strength versus SPY.
Extension and support failure are the main tactical risks.
Tracked, but not top-2 eligible because: structurally broken.
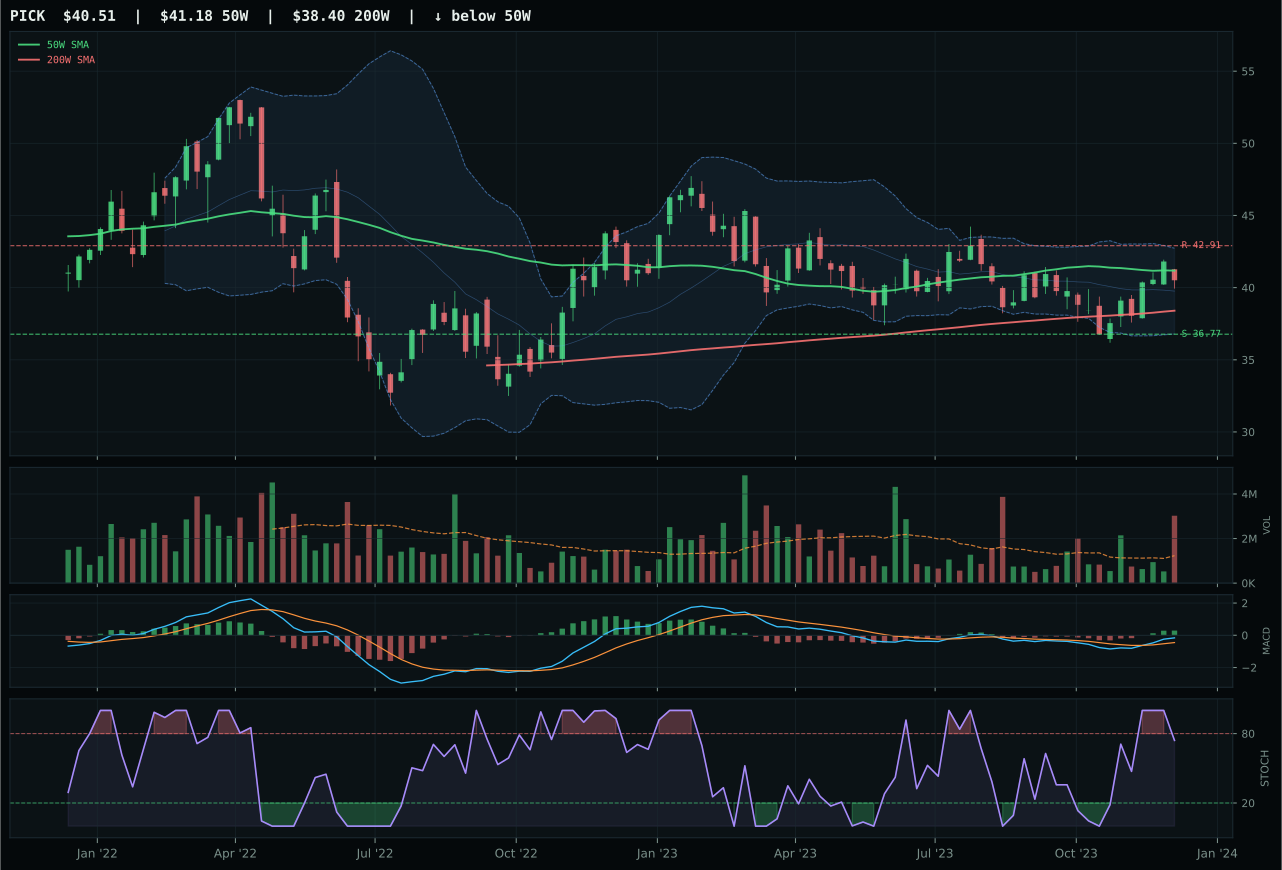
PICK has a compression near 50W profile with -0.3% 13-week relative strength versus SPY.
A failed hold above support would weaken the setup.
Actionable but governed by invalidation levels.
COPX survives a 53-point rout of REMX by offering timing and structure that REMX completely lacks—its 90.0 timing score versus REMX's 65.0 reflects COPX's proximity to the 50-week average (5.8% below) and stochastic RSI at rising mid-zone (0.78) versus REMX in freefall at oversold levels. COPX's neutral structure (70.1) beats REMX's pullback into support (33.2), and above-average volume at 1.45x the 20-week average shows institutional participation in the copper recovery story. Both carry negative relative strength versus SPY (-7.0% and -21.9% respectively), but COPX's MACD is bearish but improving while REMX is trapped in deterioration. COPX's -3.7% 13-week return is far better than REMX's -18.6%, and critically, COPX sits in the deep retracement/value zone near Fib 0.618 with defined upside to resistance, while REMX is a broken structure with no institutional bid.
Industrial Metals scored 16.3 and earned 0% allocation, ranking 9th or 10th in portfolio priority because the category is outright toxic: category-level macro fit is 35.0, liquidity stress is active at -8, credit stress is active at -7, and the macro regime of disinflation actively hurts industrial metals demand. COPX's technical evidence of 64.8 is respectable in isolation but becomes irrelevant when macro/narrative fit is only 43.0 and the broader category fails eligibility tests. This is a category to avoid until either the macro regime shifts away from disinflation or COPX breaks above resistance at 40.99 with sustained volume confirmation—neither condition is met. The 0% allocation is absolute: there is no reason to hold this category when Precious Metals offer better macro tailwinds, Defense & Aerospace has superior technical setup, and Agriculture at least provides commodity diversification that might benefit from inflation eventually. To earn a position, COPX would need to trade back above 40.99 with volume climbing above 1.5x average and MACD fully reversing to bullish improvement—a setup that is not on the horizon in the current disinflation regime.
Traditional Energy — XLE
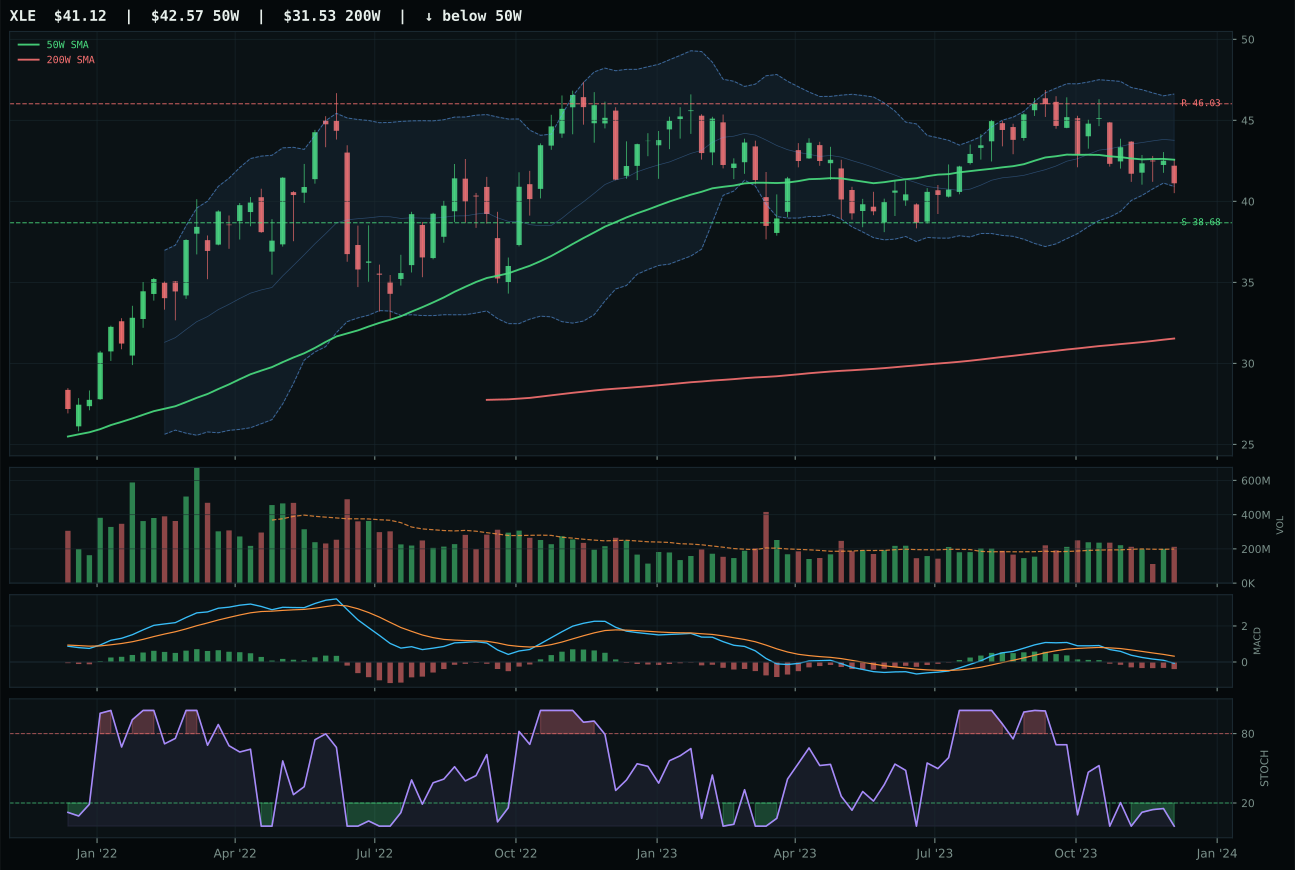
XLE has a neutral structure profile with -14.0% 13-week relative strength versus SPY.
A failed hold above support would weaken the setup.
Actionable but governed by invalidation levels.
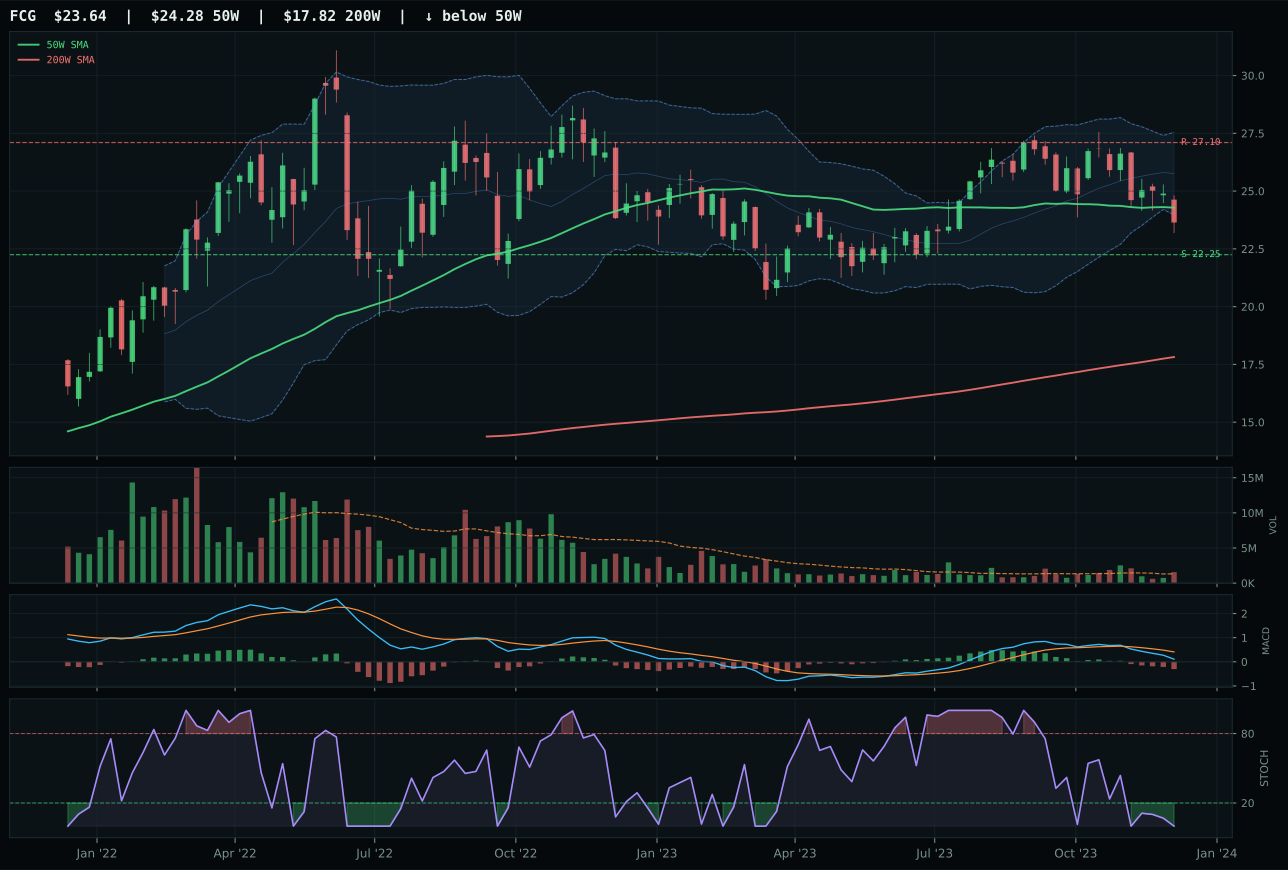
FCG has a compression near 50W profile with -15.1% 13-week relative strength versus SPY.
A failed hold above support would weaken the setup.
Actionable but governed by invalidation levels.
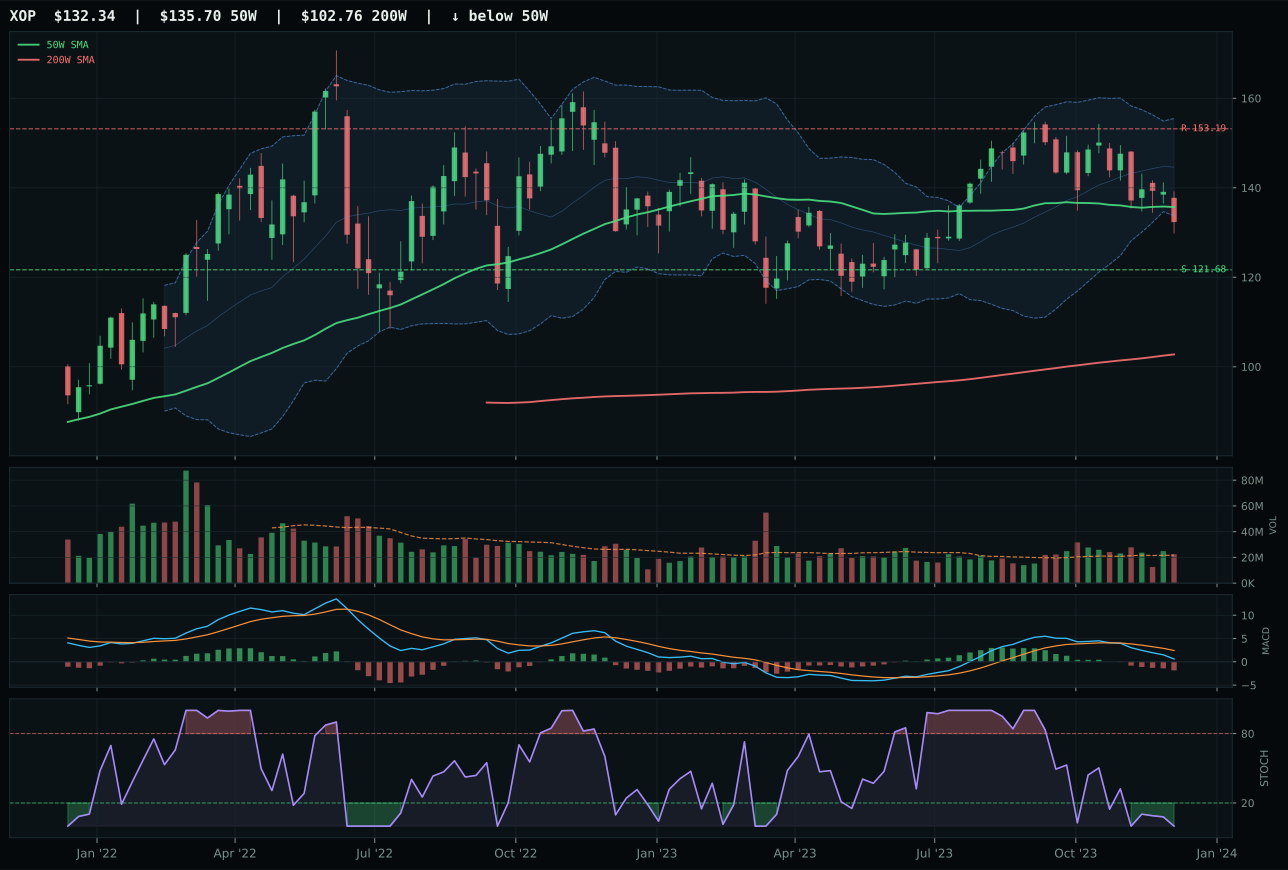
XOP has a compression near 50W profile with -16.9% 13-week relative strength versus SPY.
A failed hold above support would weaken the setup.
Actionable but governed by invalidation levels.
XLE wins a worthless category against FCG and XOP, each trapped in a disinflation death spiral. XLE's 42.0 trend score (price 3.4% below the 50-week average) beats FCG's 32.0, and its structure cleanliness (73.3 versus 69.5) gives it marginally better support definition. Both MACD signals are bearish/weakening, both stochastic RSI are oversold at 0.00, and both show catastrophic momentum confirmation: XLE's 13-week return is -10.7%, FCG's is -11.8%. Relative strength versus SPY is -14.0% and -15.1% respectively, confirming that energy is being actively sold by every buyer. Volume participation is neutral at 1.07x for XLE, meaning there's no institutional accumulation bid—just passive selling and index holding. XLE's risk/reward of 83.5 reflects the geometry of the oversold setup (downside 6.3% to support, upside -10.7% to resistance), but without any technical confirmation or momentum, this is purely a mean-reversion setup dependent on macro change, not price action.
Traditional Energy scored 0.0 and earned 0% allocation, representing outright exclusion from the portfolio because the category is in direct conflict with the active macro regime. Disinflation is actively negative for energy (-10), disinflation pressure adds another -10, credit stress applies -7, and liquidity stress applies -7, totaling a -34 macro headwind that no amount of technical oversold conditions can overcome. XLE's technical evidence of 29.6 is abysmal, and its momentum confirmation of 1.9 reflects 4-week returns of -1.4% and 13-week returns of -10.7%, confirming this is a sector in structural decline, not just a pullback. This category will remain excluded until either the macro regime shifts fundamentally away from disinflation or XLE posts a clean daily close above 46.03 resistance with volume exceeding 1.5x average participation—neither is likely in the near term. Energy is the portfolio's explicit short bias: capital stays deployed in sectors that benefit from disinflation (precious metals, technology, defense) rather than trapped in a sector that is actively harmed by it.