
2023-12-01
Informational purposes only. The content in this report, including allocations, analysis, and commentary, is provided solely for informational and educational purposes. It does not constitute financial advice, investment advice, trading advice, or any other type of advice. Past performance does not guarantee future results. Always conduct your own research and consult a qualified financial professional before making investment decisions.
Weekly Allocation
| Ticker | Category | Weight | Role |
|---|---|---|---|
| FBTC | 50% | Overlay | |
| GLD | Precious Metals | 10% | Top-2 (10%) |
| PAVE | Utilities & Infrastructure | 10% | Top-2 (10%) |
| IGV | Technology | 5% | Tier-2 (5%) |
| URA | Nuclear Energy | 5% | Tier-2 (5%) |
| ILF | Emerging Markets | 5% | Tier-2 (5%) |
| XAR | Defense & Aerospace | 5% | Tier-2 (5%) |
| BOTZ | AI | 5% | Tier-2 (5%) |
| PICK | Industrial Metals | 5% | Tier-2 (5%) |
Trade Instructions — Monday Open
Sell the tranche from 2023-11-03 (completing its 4-week hold). Buy the new tranche. Instructions show net portfolio changes — same-asset positions cancel, weight changes show the delta.
| Action | Ticker | Instruction |
|---|---|---|
| SELL | NLR | Sell entire NLR position (2.50% of portfolio) |
| SELL | XLK | Sell 25% of XLK position (reduce 5.00% → 3.75%) |
| SELL | XLU | Sell entire XLU position (1.25% of portfolio) |
| SELL | MOO | Sell 50% of MOO position (reduce 2.50% → 1.25%) |
| SELL | XLE | Sell entire XLE position (1.25% of portfolio) |
| SELL | SMH | Sell 25% of SMH position (reduce 5.00% → 3.75%) |
| BUY | URA | Buy URA — 14.29% of freed cash (adds 1.25% to portfolio) |
| BUY | ILF | Buy ILF — 14.29% of freed cash (adds 1.25% to portfolio) |
| BUY | PICK | Buy PICK — 14.29% of freed cash (adds 1.25% to portfolio) |
| BUY | IGV | Buy IGV — 14.29% of freed cash (adds 1.25% to portfolio) |
| BUY | BOTZ | Buy BOTZ — 14.29% of freed cash (adds 1.25% to portfolio) |
| BUY | PAVE | Buy PAVE — 28.57% of freed cash (adds 2.50% to portfolio) |
Current Portfolio After Trade
Combined holdings across all 4 active tranches. Each tranche is 25% of the portfolio.
| Ticker | % of Portfolio | Weight Bar |
|---|---|---|
| FBTC | 50.00% | |
| GLD | 6.25% | |
| URA | 5.00% | |
| ILF | 5.00% | |
| XLK | 3.75% | |
| XAR | 3.75% | |
| SMH | 3.75% | |
| PICK | 3.75% | |
| IGV | 3.75% | |
| BOTZ | 3.75% | |
| PAVE | 3.75% | |
| ITA | 2.50% | |
| IGF | 2.50% | |
| MOO | 1.25% | |
| URNM | 1.25% |
Macro Regime — Disinflation
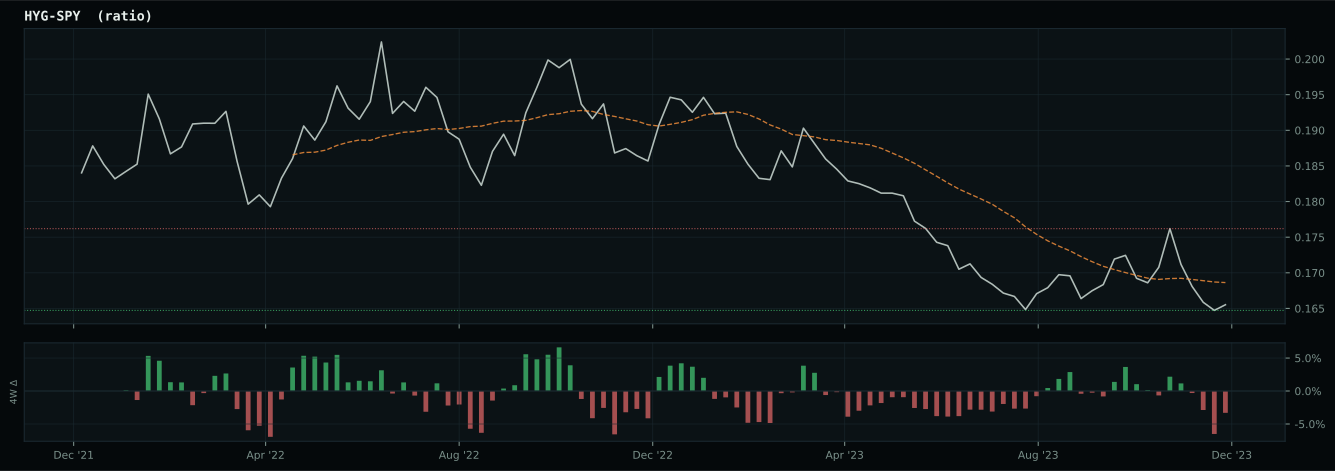
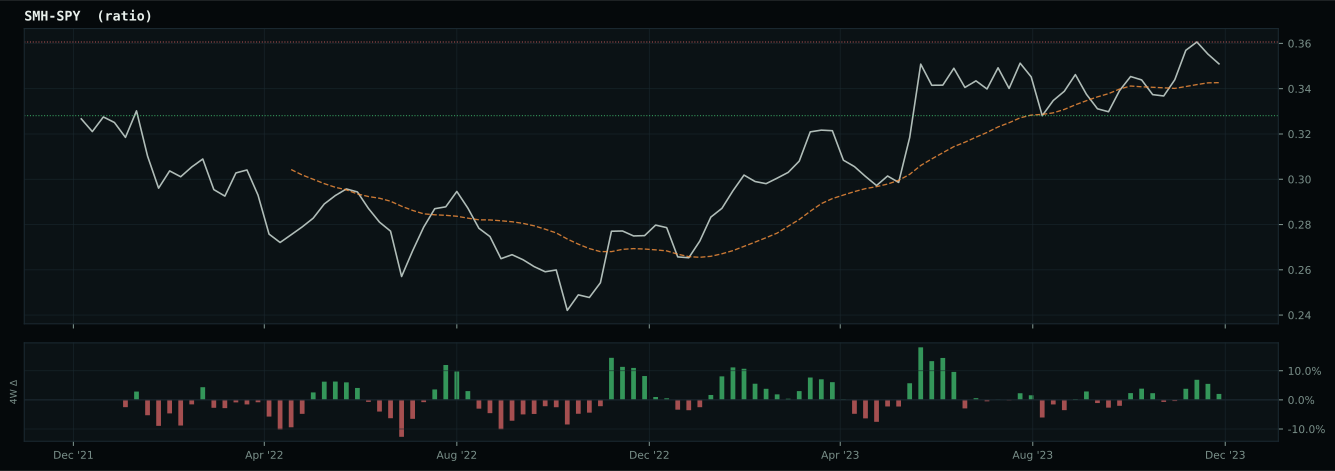
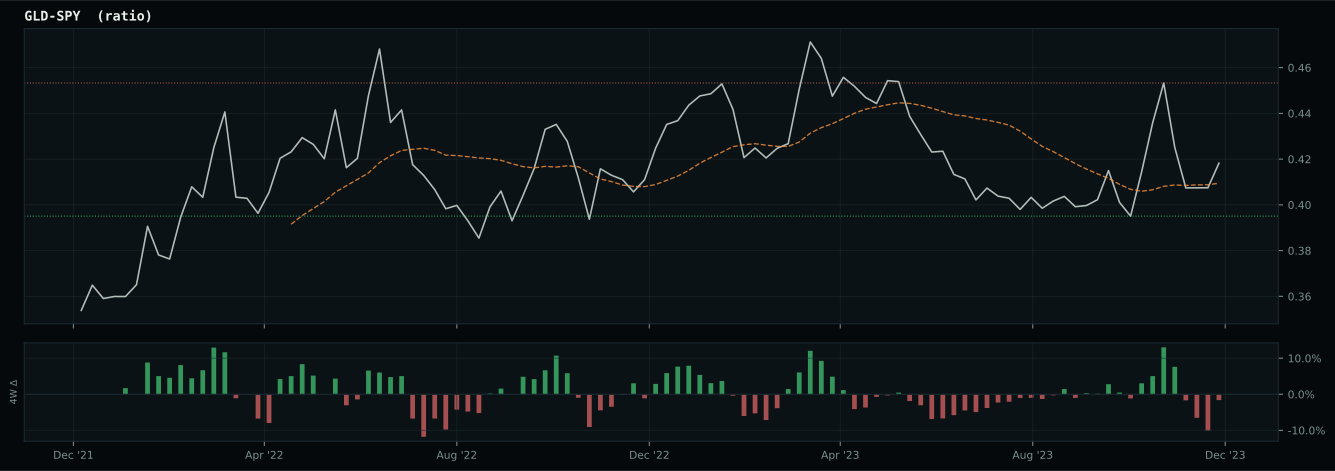
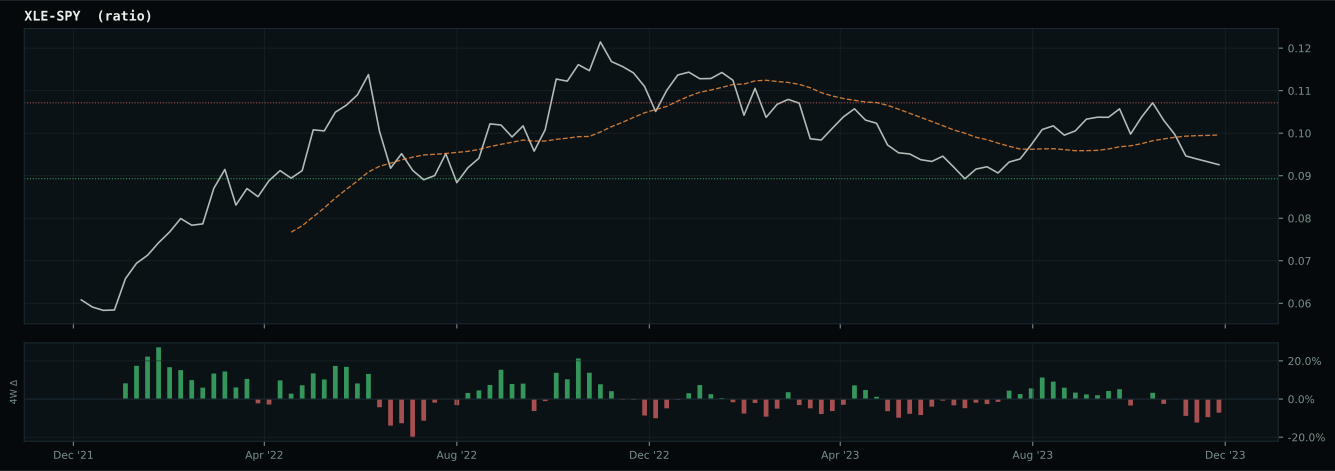
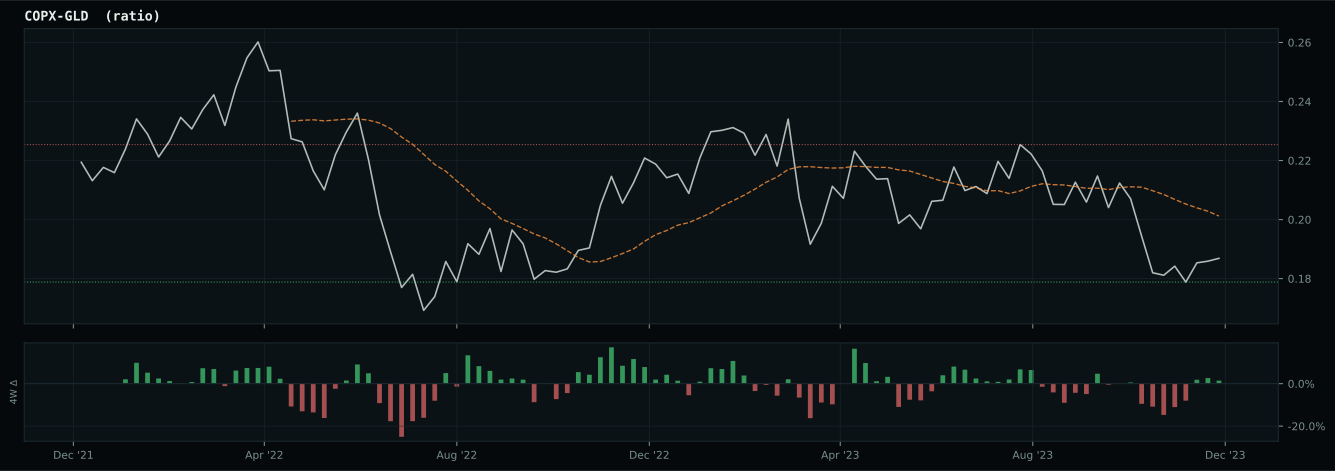
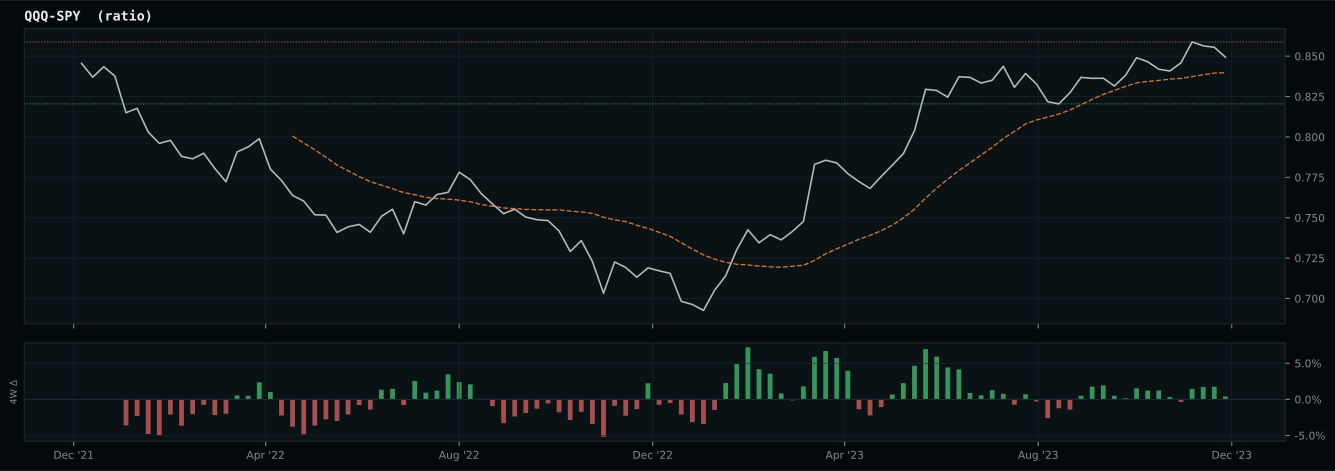
Macro Evidence Charts
Market-implied signals behind the macro regime scores. Each ratio compares two assets; the direction and slope of the ratio is what the macro engine reads.
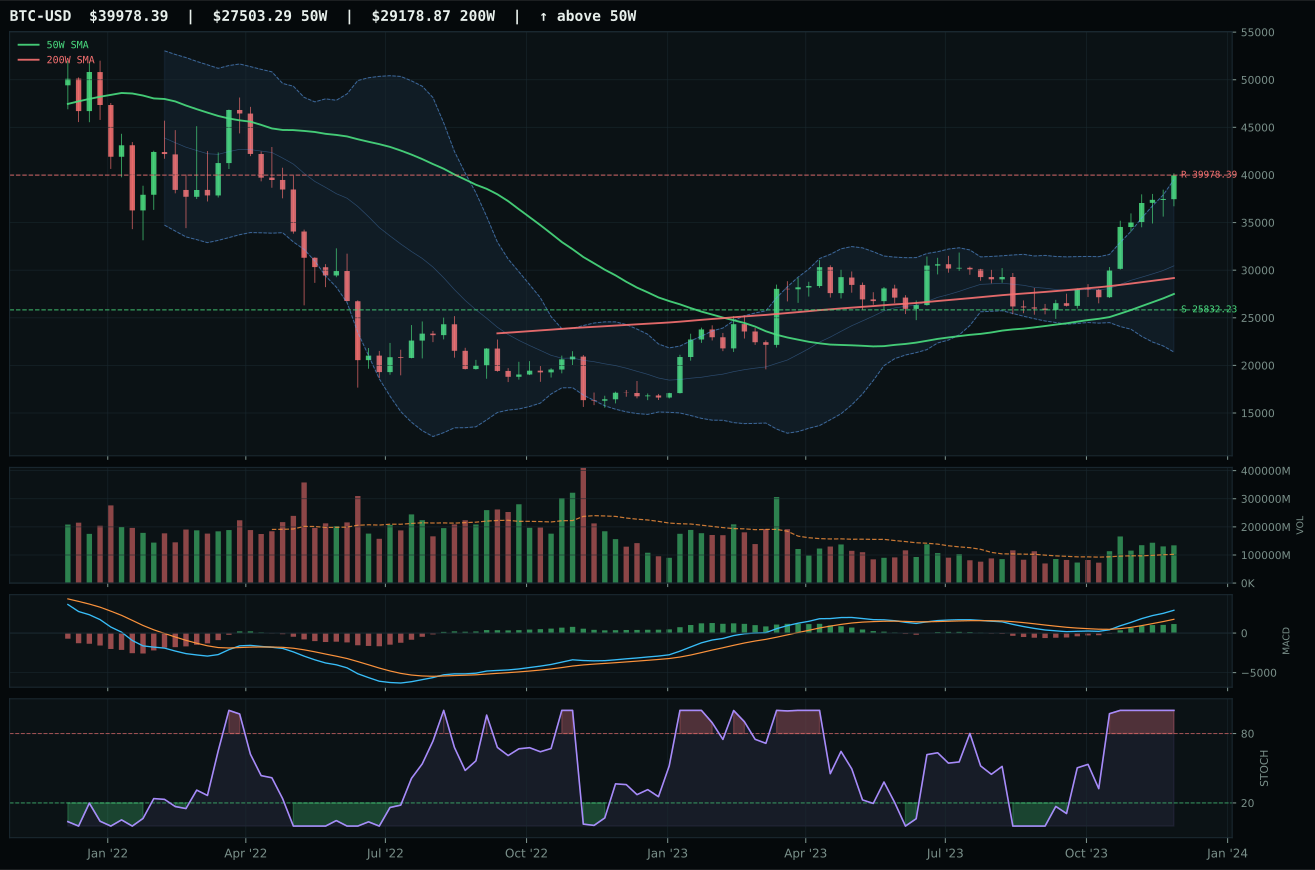
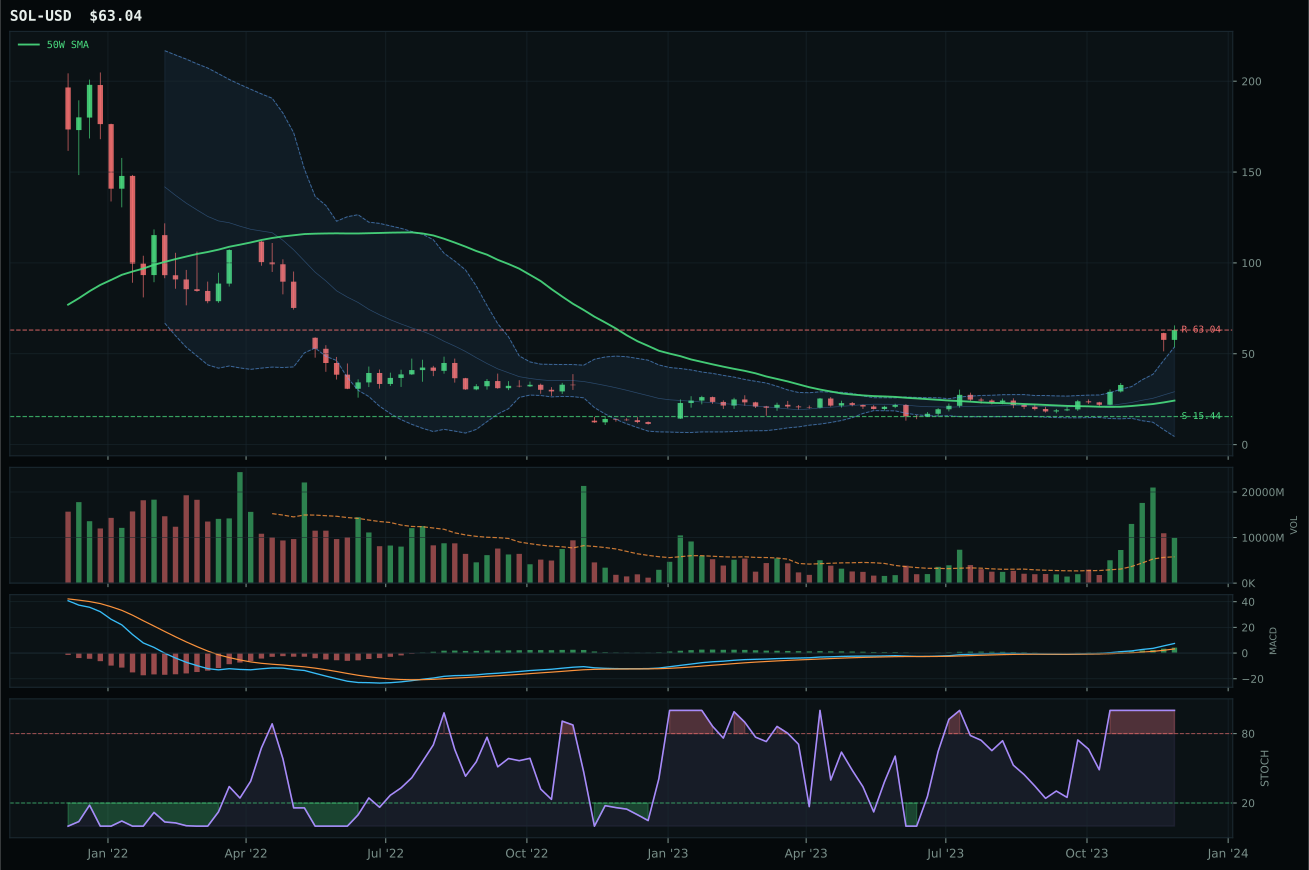
Crypto Regime — TrendBTC
post-touch structure is too wide to count as a range; max/min close ratio is 2.30
TrendBTC confirmed: 2 consecutive closes above rising/flat 50W SMA
one or more available conditions failed
Category Rankings
| Rank | Category | Winner | Score | Alloc | 4W Ret | Peers (4W) |
|---|---|---|---|---|---|---|
| 1 | Precious Metals | GLD | 82.3 | 20% | +0.97% | GDX -0.3% · SLV -3.8% |
| 2 | Utilities & Infrastructure | PAVE | 61.9 | 20% | +7.32% | IGF +1.3% · XLU -0.3% |
| 3 | Technology | IGV | 61.8 | 10% | +2.16% | CIBR +5.6% · XLK +3.3% |
| 4 | Nuclear Energy | URA | 60.2 | 10% | -5.90% | NLR -3.8% · URNM -3.8% |
| 5 | Emerging Markets | ILF | 53.6 | 10% | +2.38% | INDA +3.6% · IEMG +1.1% |
| 6 | Defense & Aerospace | XAR | 53.5 | 10% | +4.35% | ITA +4.3% · ROKT +5.3% |
| 7 | AI | BOTZ | 53.0 | 10% | +5.73% | AIQ +4.2% · SMH +8.2% |
| 8 | Industrial Metals | PICK | 45.9 | 10% | +3.85% | COPX +5.7% · REMX +7.5% |
| 9 | Agriculture & Livestock | MOO | 14.7 | 0% | +2.30% | VEGI +2.7% · WEAT +2.4% |
| 10 | Traditional Energy | XOP | 4.4 | 0% | +0.07% | XLE +0.0% · FCG -0.6% |
Precious Metals — GLD
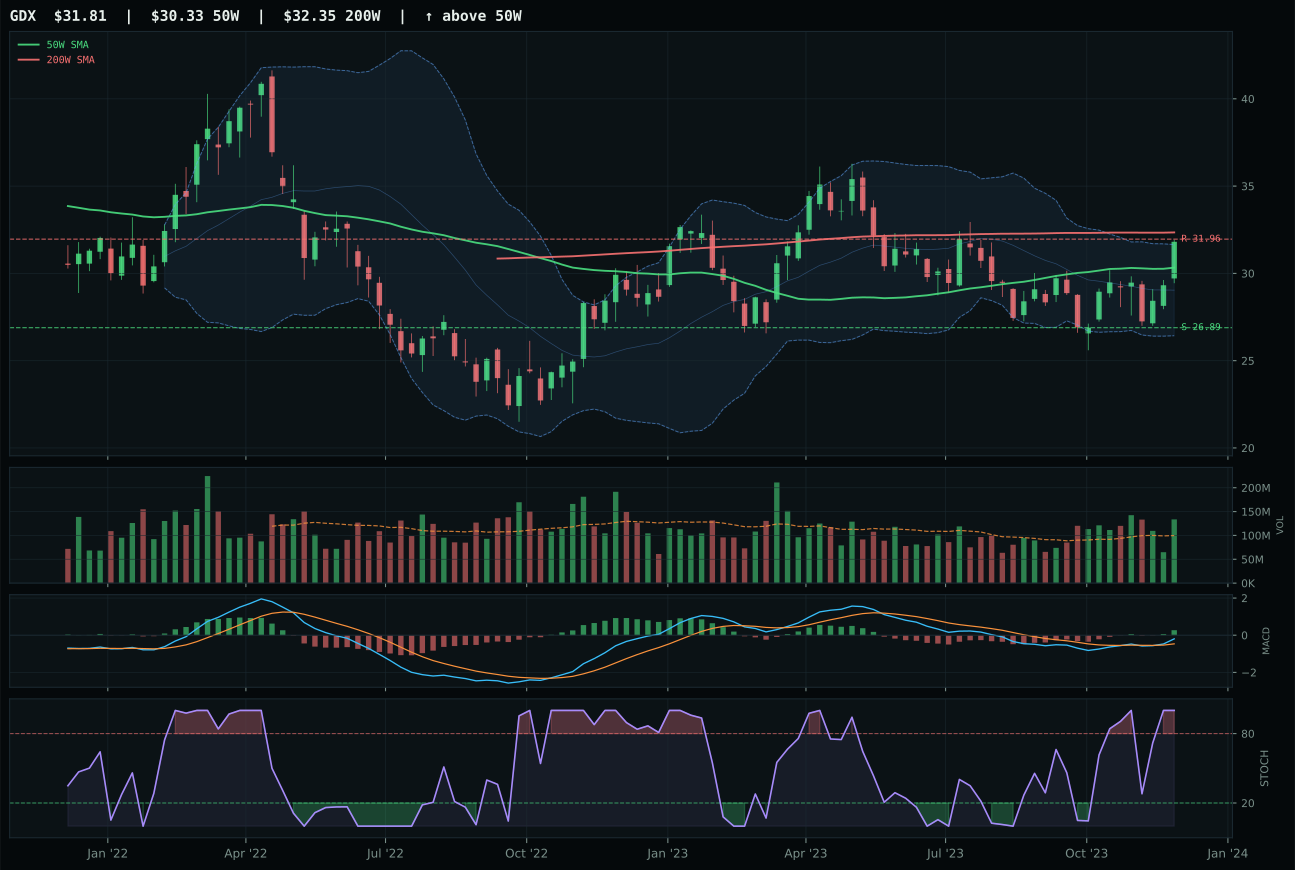
GDX has a neutral structure profile with 7.6% 13-week relative strength versus SPY.
A failed hold above support would weaken the setup.
Actionable but governed by invalidation levels.
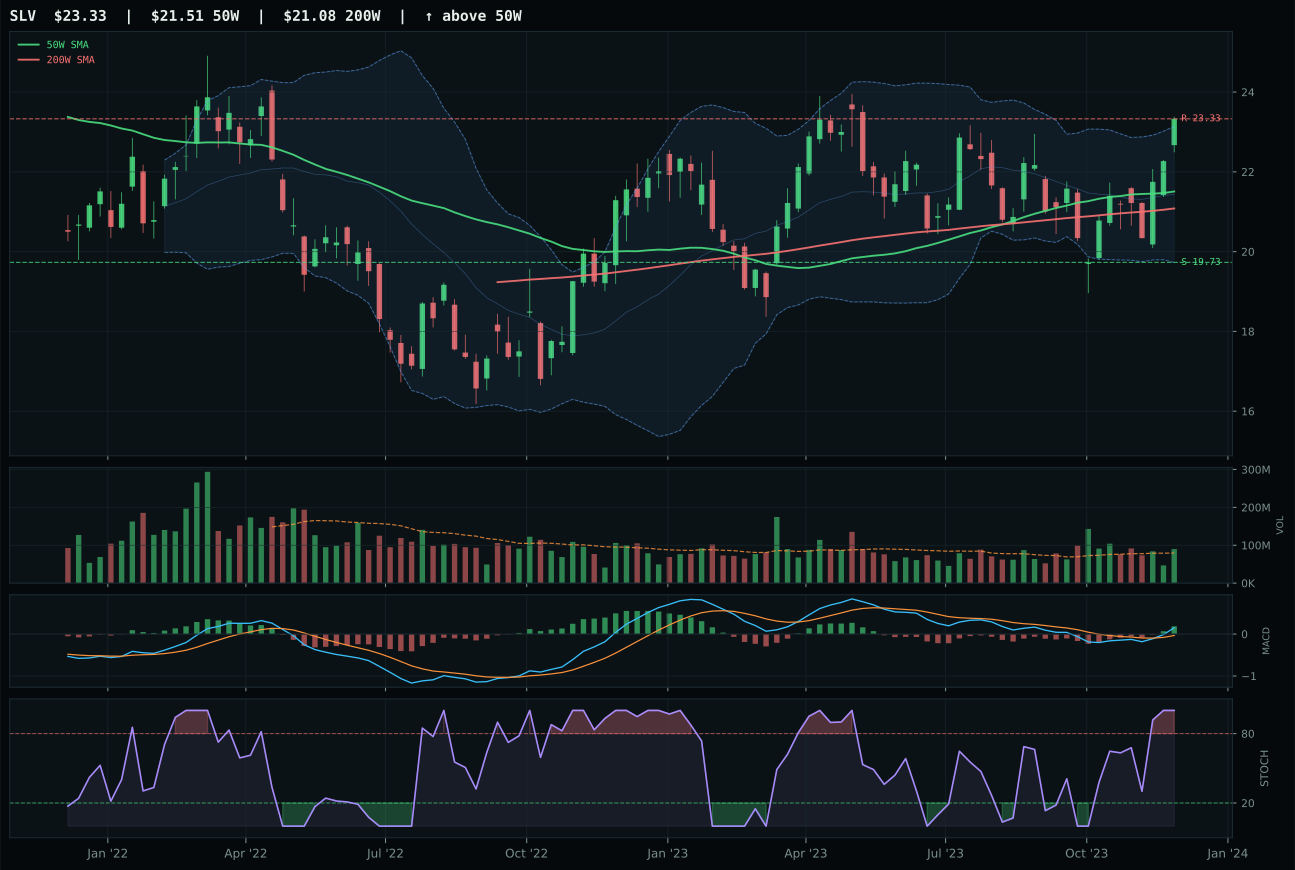
SLV has a neutral structure profile with 3.5% 13-week relative strength versus SPY.
A failed hold above support would weaken the setup.
Actionable but governed by invalidation levels.
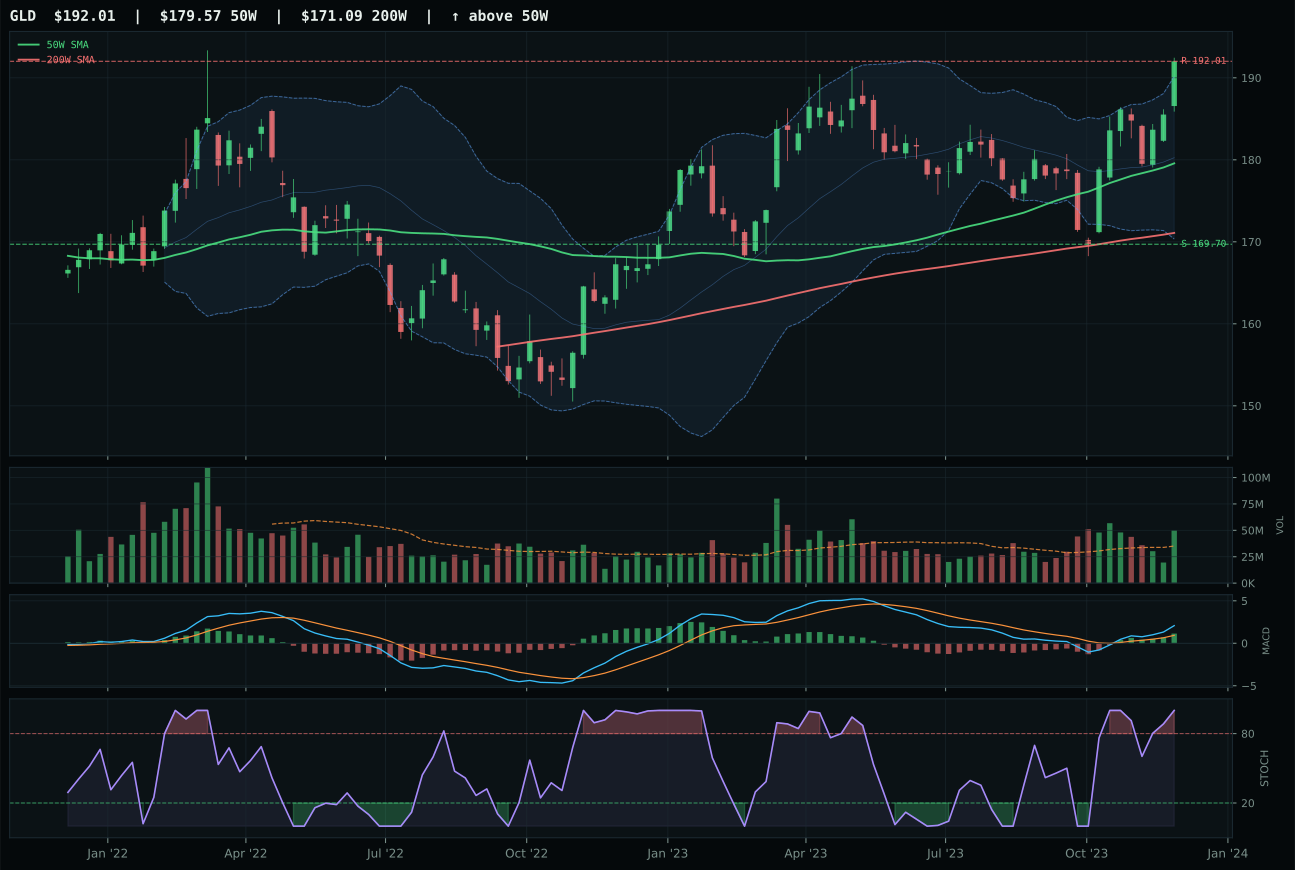
GLD has a neutral structure profile with 4.9% 13-week relative strength versus SPY.
A failed hold above support would weaken the setup.
Actionable but governed by invalidation levels.
GLD wins the category with the cleanest structure and strongest macro alignment, posting an 82.3 category score that secures a top-2 overweight. It sits just 6.9% above the 50W—near enough to support for further accumulation, far enough above to avoid the bounce risk that haunts extended names—and its 80.9/100 structure score reflects neutral compression rather than vertical extension chaos. Volume at 1.42x the 20W average confirms active accumulation, and the 4.9% SPY-relative strength paired with 6.6% 13-week returns demonstrates consistent buying without parabolic excess. GDX lost despite posting stronger technical evidence at 91.3/100 and superior 13-week return at 9.4% because its structure at 74.9 carries more messiness, and critically, GDX's macro fit at 42.0/100 is savaged by liquidity stress at -9 and credit stress at -7—liabilities that GLD's monetary hedge positioning sidesteps entirely.
Precious Metals earns 10% as a top-2 overweight, reflecting its 82.3 final score—the second-highest category ranking this week. The macro case is iron-clad: monetary hedge bid is active at +14 basis points and disinflation pressure is active at +6, creating a 78.0/100 category-level macro fit that no other sector can match in a disinflation regime. GLD's trend at 100/100 combined with strong volume confirmation at 77.1/100 persistence builds conviction that this is not a volatility bounce but a structural reposition into safety. The 13-week return of 6.6% paired with unchanged category-relative strength signals healthy, non-stretched accumulation. This allocation competes with Utilities & Infrastructure for top-2 status, but the difference is that Precious Metals has the macro catalyst explicitly in its favor, while Utilities relies on technical setup alone. Hold this through any near-term pullback; the setup will offer better entry only if liquidity stress indicators reverse sharply.
Utilities & Infrastructure — PAVE
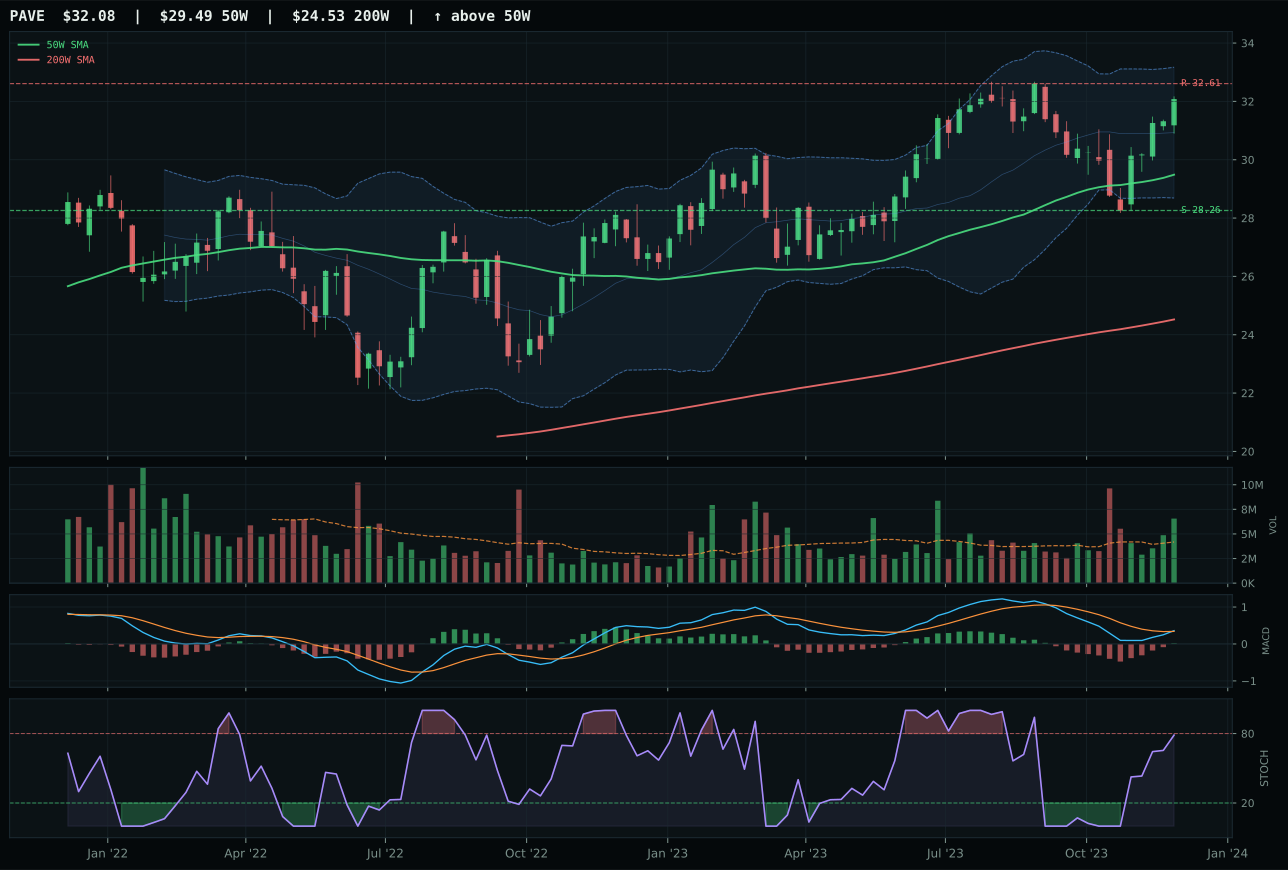
PAVE has a neutral structure profile with -3.4% 13-week relative strength versus SPY.
A failed hold above support would weaken the setup.
Actionable but governed by invalidation levels.
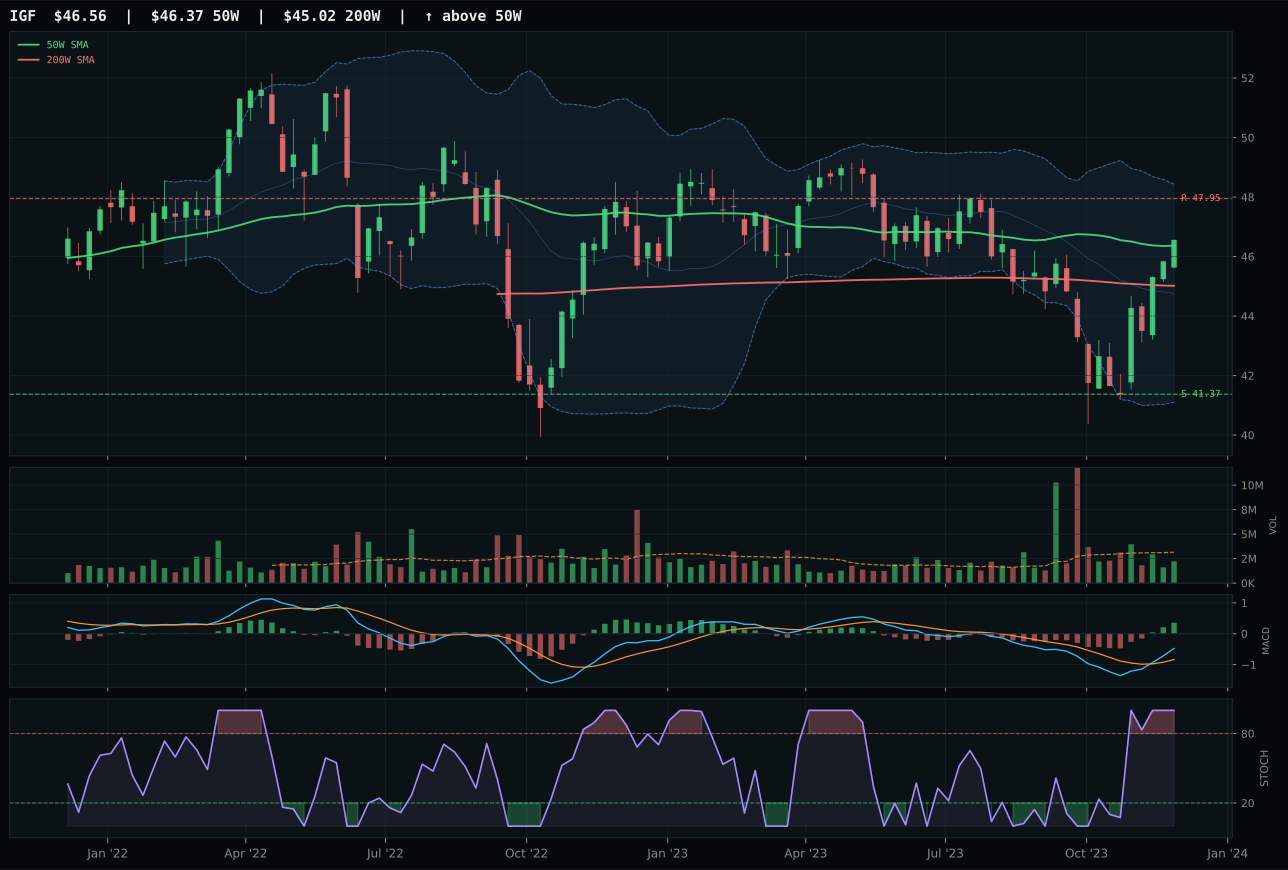
IGF has a compression near 50W profile with 0.7% 13-week relative strength versus SPY.
A failed hold above support would weaken the setup.
Actionable but governed by invalidation levels.
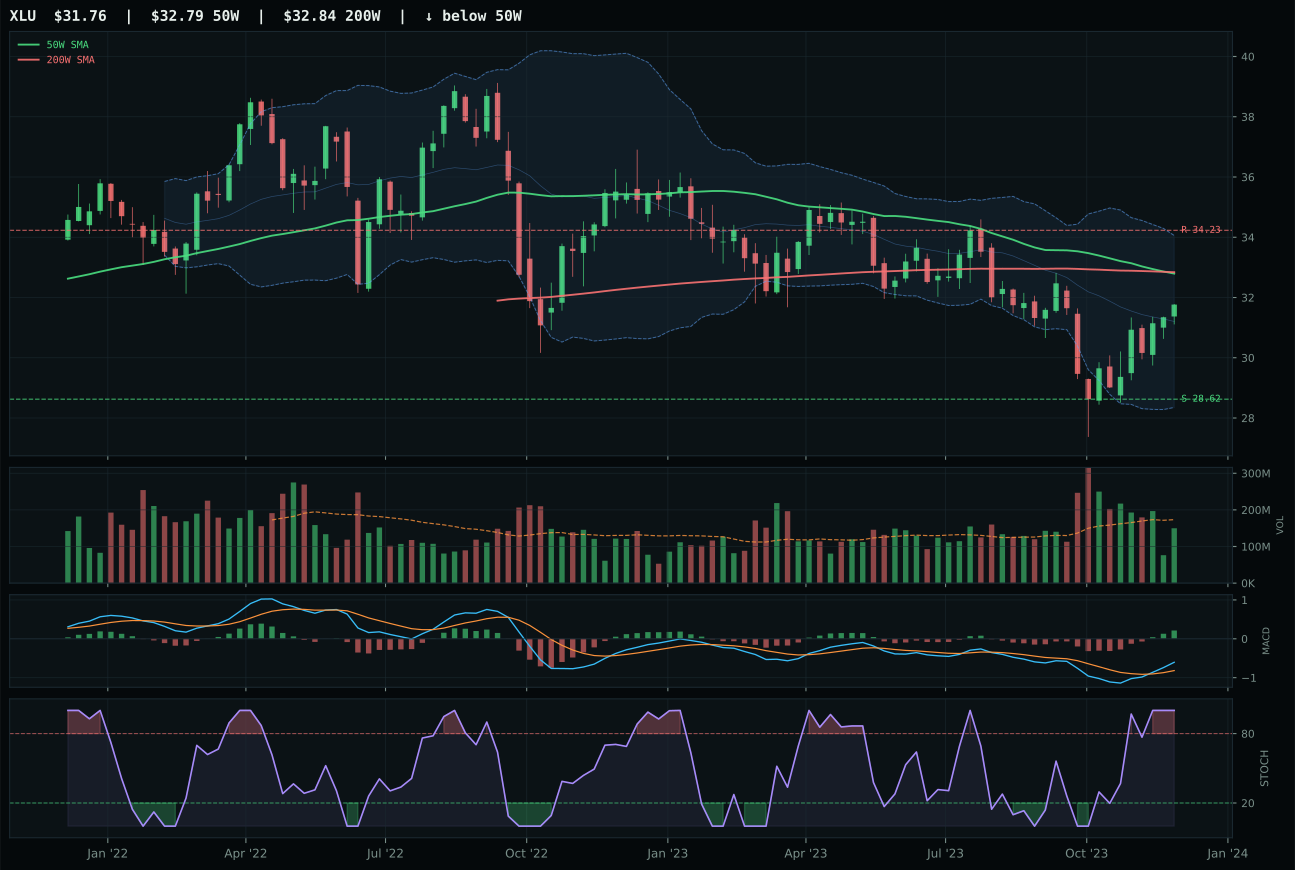
XLU has a neutral structure profile with -0.3% 13-week relative strength versus SPY.
Extension and support failure are the main tactical risks.
Tracked, but not top-2 eligible because: structurally broken.
PAVE wins a close category call against IGF by trading at a superior price level relative to support and commanding better volume confirmation: at 8.8% above the 50W, PAVE sits in the sweet spot where further accumulation is possible without excessive extension risk, while IGF's compression near the 50W offers no expansion runway. PAVE's accumulation-level volume at 1.57x the 20W is the category's strongest signal of institutional buying, translating to 78.8/100 volume-price confirmation versus IGF's weaker 62. Stochastic RSI at rising mid-zone (0.79) also outweighs IGF's overbought momentum setup—the former offers room to extend, the latter invites profit-taking. Critically, PAVE's category-relative strength at -3.0% against IGF's +1.0% seems backward until volume context clarifies: PAVE is accumulating despite relative underperformance, suggesting fresh institutional conviction uncorrelated to near-term relative value, whereas IGF's modest outperformance is stalling at compression.
Utilities & Infrastructure earns 10% as a top-2 overweight, with a 61.9 final score that barely edges out Precious Metals' 82.3 for second place—a critical call showing the system's sensitivity to macro regime shifts. The category-level macro fit at 64.0/100 is solid, driven by disinflation help at +7 and disinflation pressure active at +6, complemented by real asset sponsorship at +7 (rare positive input) and tempered only by liquidity stress at -3. PAVE's 94.9/100 trend combined with 83.0/100 timing and 69.8/100 momentum confirmation create technical conviction despite the -1.6% 13-week return, suggesting this is a reaccumulation phase rather than breakout weakness. The 1.57x accumulation-level volume is the portfolio's highest volume conviction signal outside GLD, indicating true institutional repositioning into infrastructure as a disinflation play. This allocation is justified by the macro-technical confluence: utilities profit from lower rates, infrastructure benefits from capex stimulus, and PAVE's volume action proves institutional money is acting on that thesis right now.
Technology — IGV
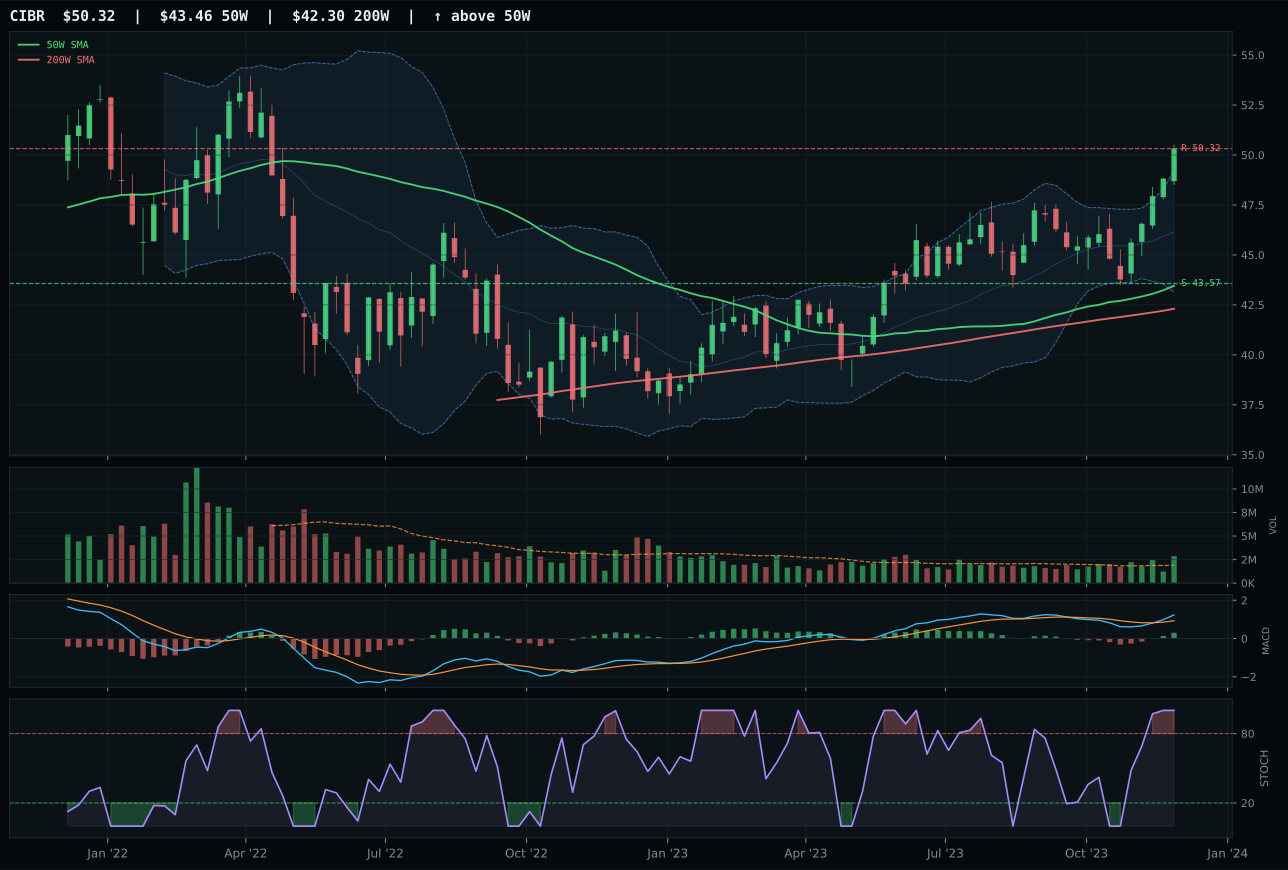
CIBR has a vertical extension profile with 4.8% 13-week relative strength versus SPY.
A failed hold above support would weaken the setup.
Actionable but governed by invalidation levels.
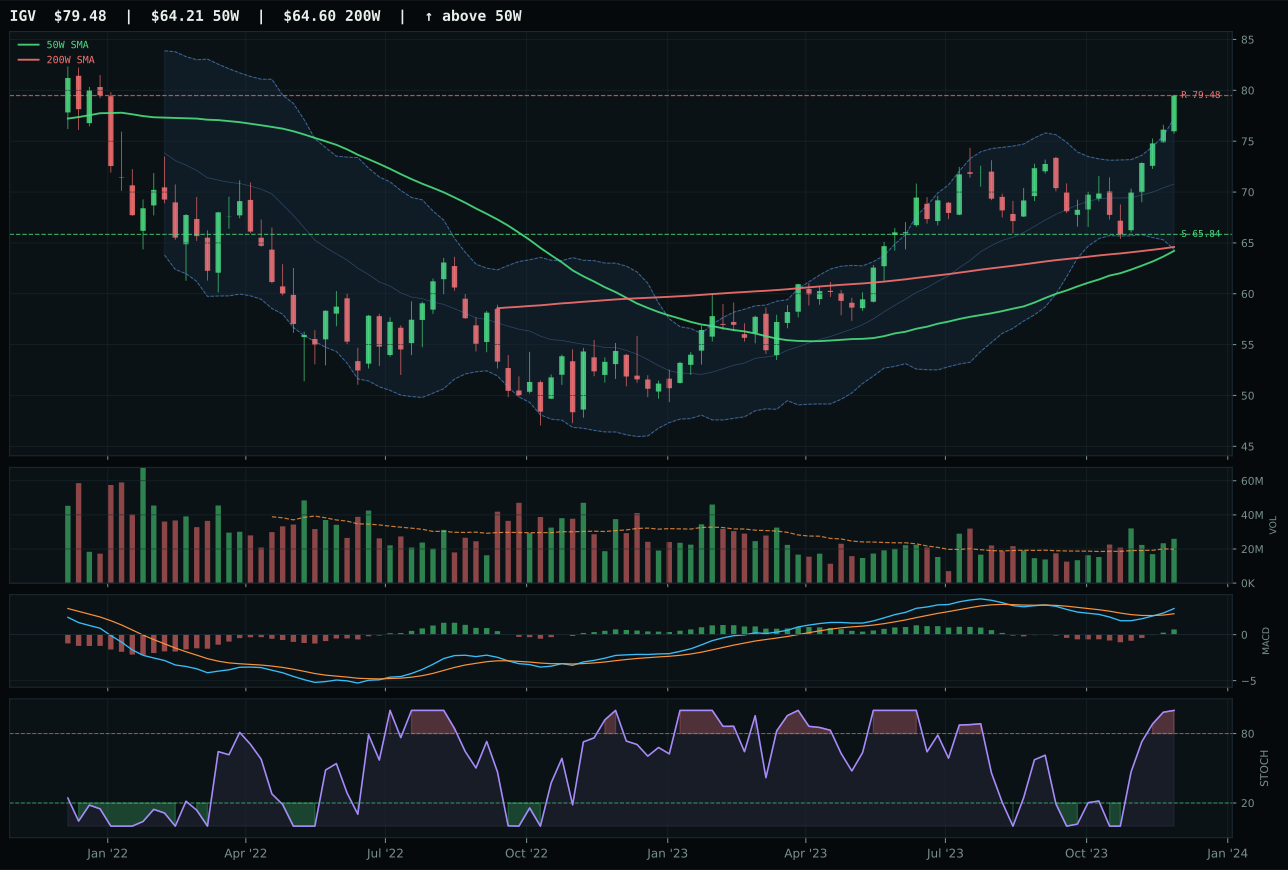
IGV has a vertical extension profile with 8.1% 13-week relative strength versus SPY.
A failed hold above support would weaken the setup.
Actionable but governed by invalidation levels.
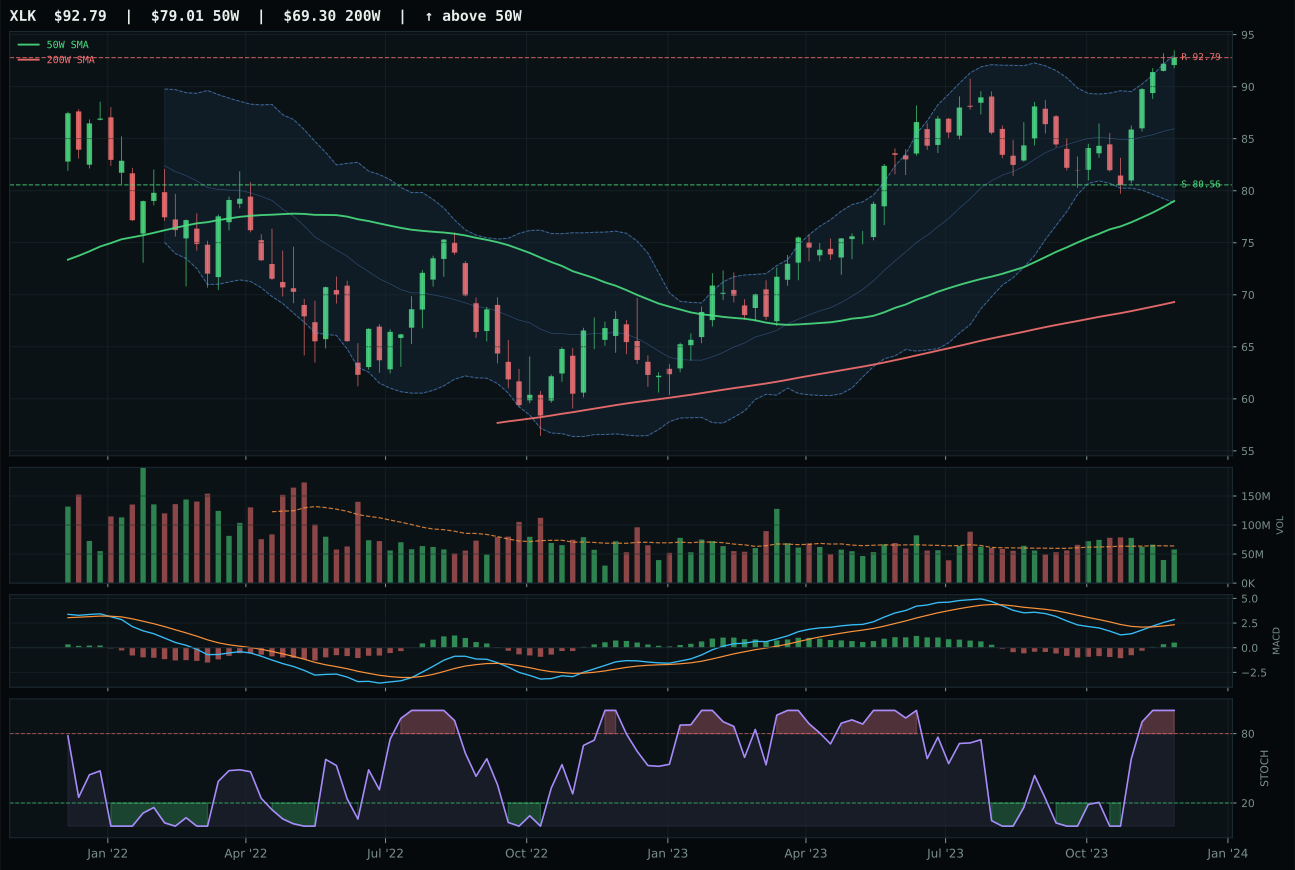
XLK has a vertical extension profile with 3.6% 13-week relative strength versus SPY.
A failed hold above support would weaken the setup.
Actionable but governed by invalidation levels.
IGV wins the category with a 3.3% relative strength advantage over its peers, capturing the category leadership despite sitting 23.8% above its 50-week moving average. The extension penalizes entry timing, but MACD is bullish and improving while volume participation at 1.30x the 20-week average confirms institutional sponsorship behind the move. CIBR lost ground specifically because category-relative strength lagged at 0.0%, unable to sustain peer leadership despite matching IGV's trend strength at 100/100 and posting a cleaner 93.6 technical evidence score. The real differentiation centers on which name is accumulating share: IGV's above-average volume and 8.1% SPY-relative strength signal genuine buying pressure, whereas CIBR's neutral volume posture suggests the move is rotating rather than freshly driven.
Technology earns a 5% allocation as a tier-2 category, held despite a 61.8 final score that ranks it outside the top-2 overweights. Disinflation helps the category at +7 basis points in macro fit, but liquidity stress at -10 and credit stress at -7 create a structural headwind that prevents it from competing with Precious Metals and Utilities for the overweight slots. The category's technical evidence of 62% weights the ETF fundamentals fairly high, yet macro/narrative fit at just 45.0/100 reflects an environment where duration-sensitive growth lacks conviction. IGV's vertical extension setup—up 23.8% from the 50W—means every new entry is fighting gravity; what would change this allocation is either a consolidation back to the 50W on improving volume or a sustained macro shift away from the current disinflation-credit pressure regime.
Nuclear Energy — URA
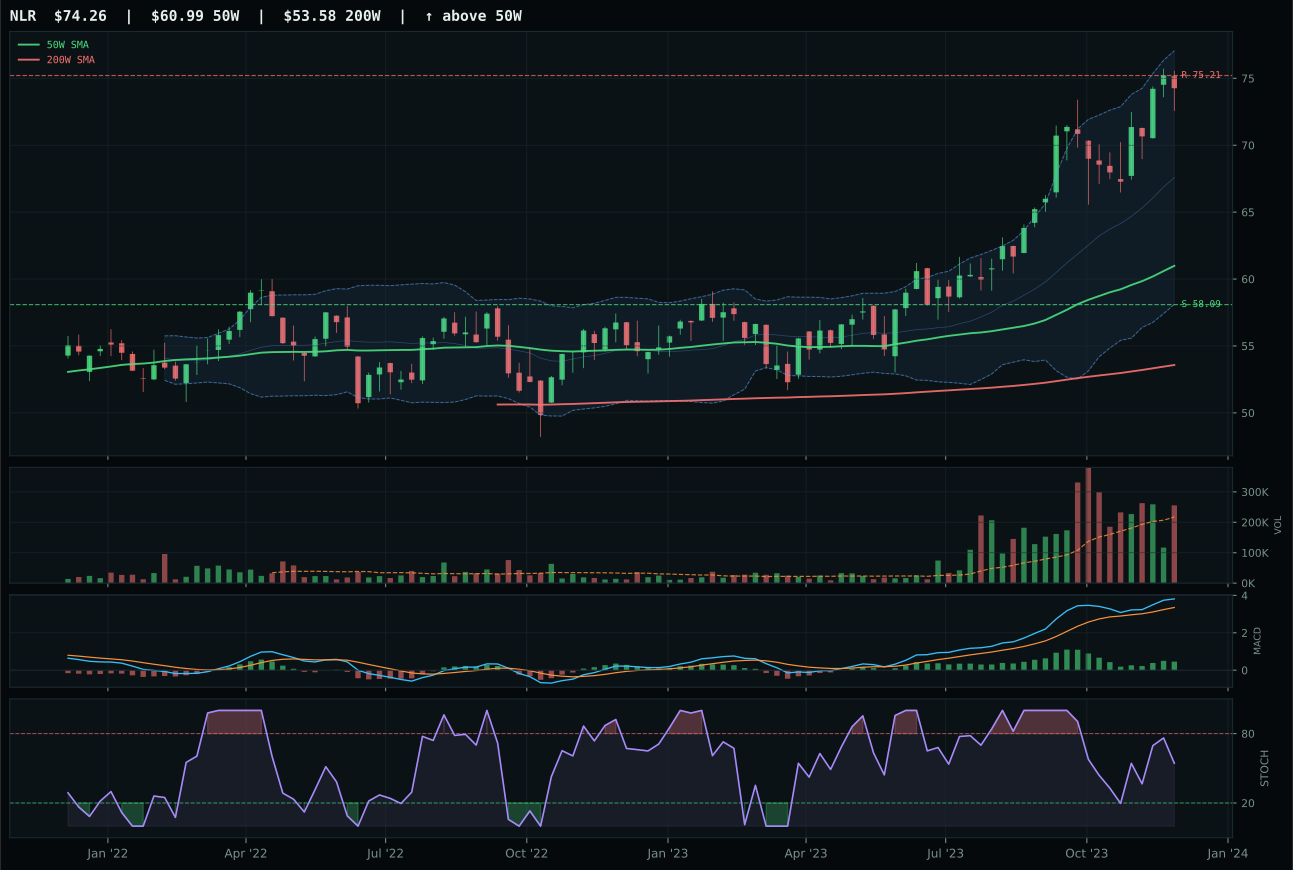
NLR has a vertical extension profile with 12.1% 13-week relative strength versus SPY.
A failed hold above support would weaken the setup.
Actionable but governed by invalidation levels.
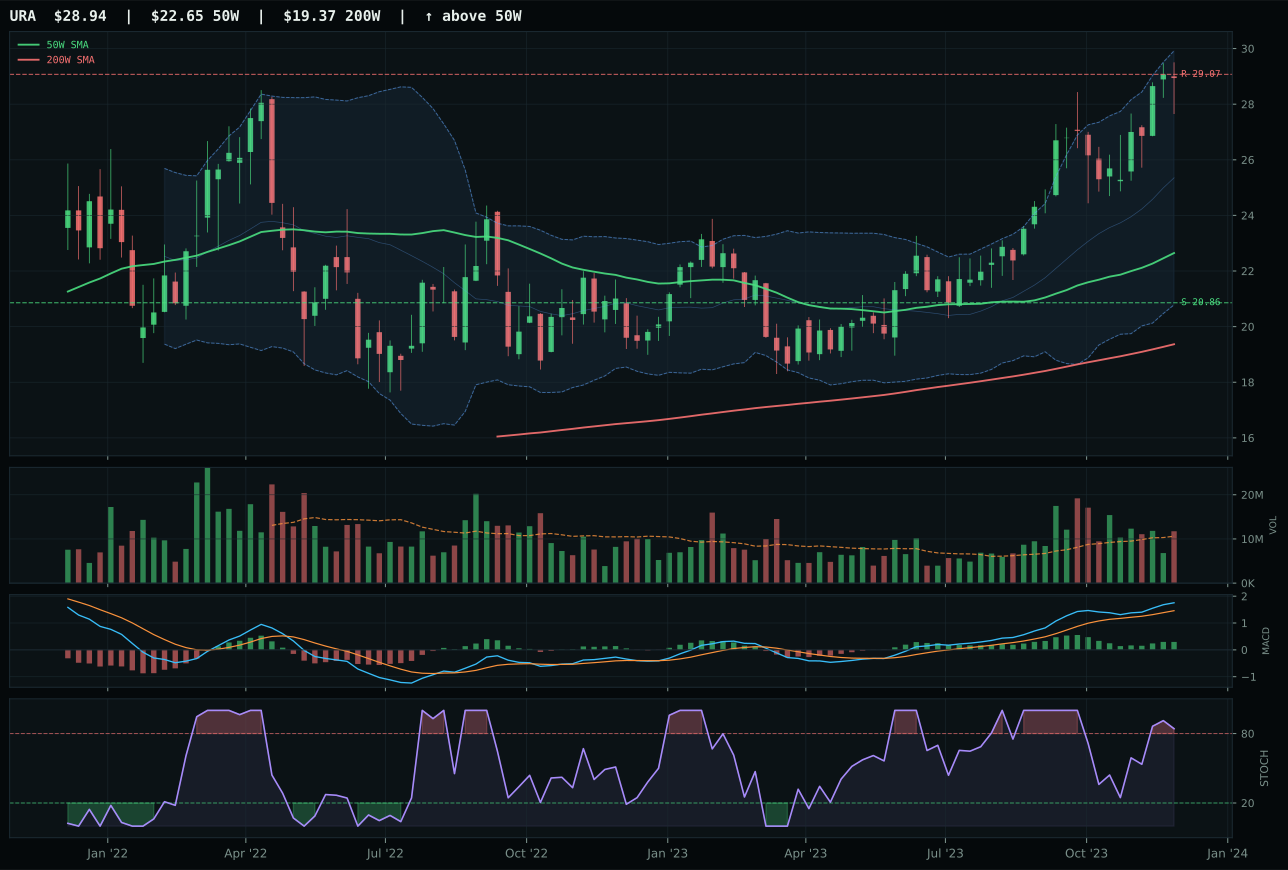
URA has a vertical extension profile with 17.3% 13-week relative strength versus SPY.
A failed hold above support would weaken the setup.
Actionable but governed by invalidation levels.
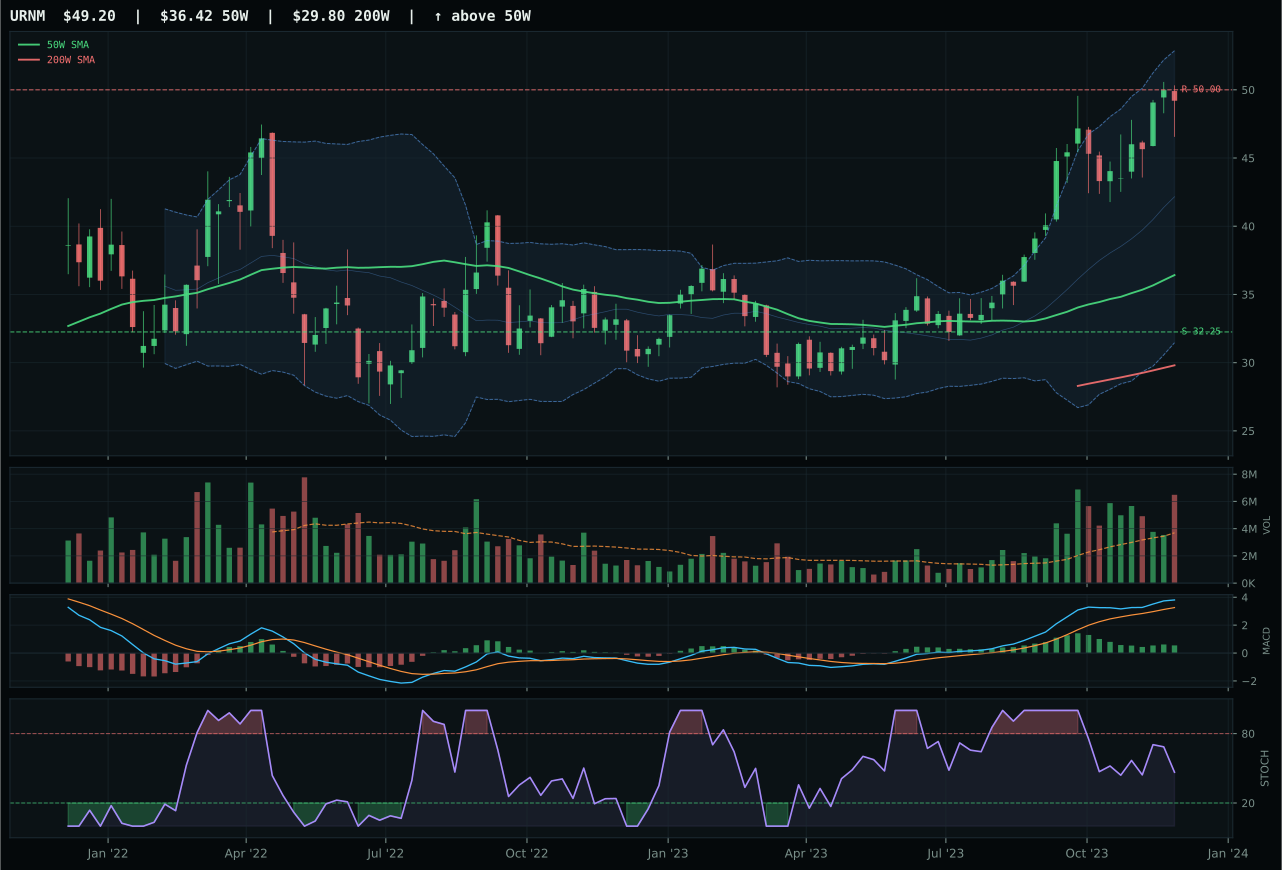
URNM has a vertical extension profile with 24.1% 13-week relative strength versus SPY.
A failed hold above support would weaken the setup.
Actionable but governed by invalidation levels.
URA wins the category on pure momentum and relative strength despite sitting 27.8% extended above the 50W—a dangerous setup that timing penalizes at just 37.0/100. Its 19.0% 13-week return and 17.3% SPY-relative strength are extraordinary, and the 100.0/100 momentum confirmation score reflects sustained institutional buying that has not broken. The trade-off is obvious: URA has paid the extension penalty and now offers minimal margin of safety (risk-reward 37.2/100), but the volume participation at 1.11x the 20W and persistence at 76.3/100 prove this is not a retail melt-up but a regime-driven flow. NLR lost by just 8.7 points because its superior technical evidence at 87.0/100 and lower entry risk cannot overcome URA's absolute momentum dominance and -5.2% category-relative weakness that makes it the laggard despite solid 12.1% SPY-relative strength. In this regime, pure momentum wins over durability.
Nuclear Energy receives 5% as tier-2, with a 60.2 final score that sits comfortably in the middle tier despite strong category-relative momentum. The macro fit at 45.0/100 is neutral—no category-specific descriptor profile weighs for or against—but real asset sponsorship at +7 provides a modest tailwind while credit stress at -5 and liquidity stress at -7 create modest headwinds that net to approximate equilibrium. What keeps this in the portfolio is URA's absolute momentum: 19.0% 13-week return paired with 100.0/100 momentum confirmation creates conviction that this move has further to go despite the extension risk. The timing penalty at 37.0/100 is a warning, not a disqualifier; URA's structure and relative strength combination argue that pullbacks will find support and that this is a regime leader, not a bounce. To move this to top-2 would require either a macro catalyst shift or URA to consolidate and reset its relative strength back toward the 50W on accumulation volume—currently, it trades on pure technical leadership.
Emerging Markets — ILF
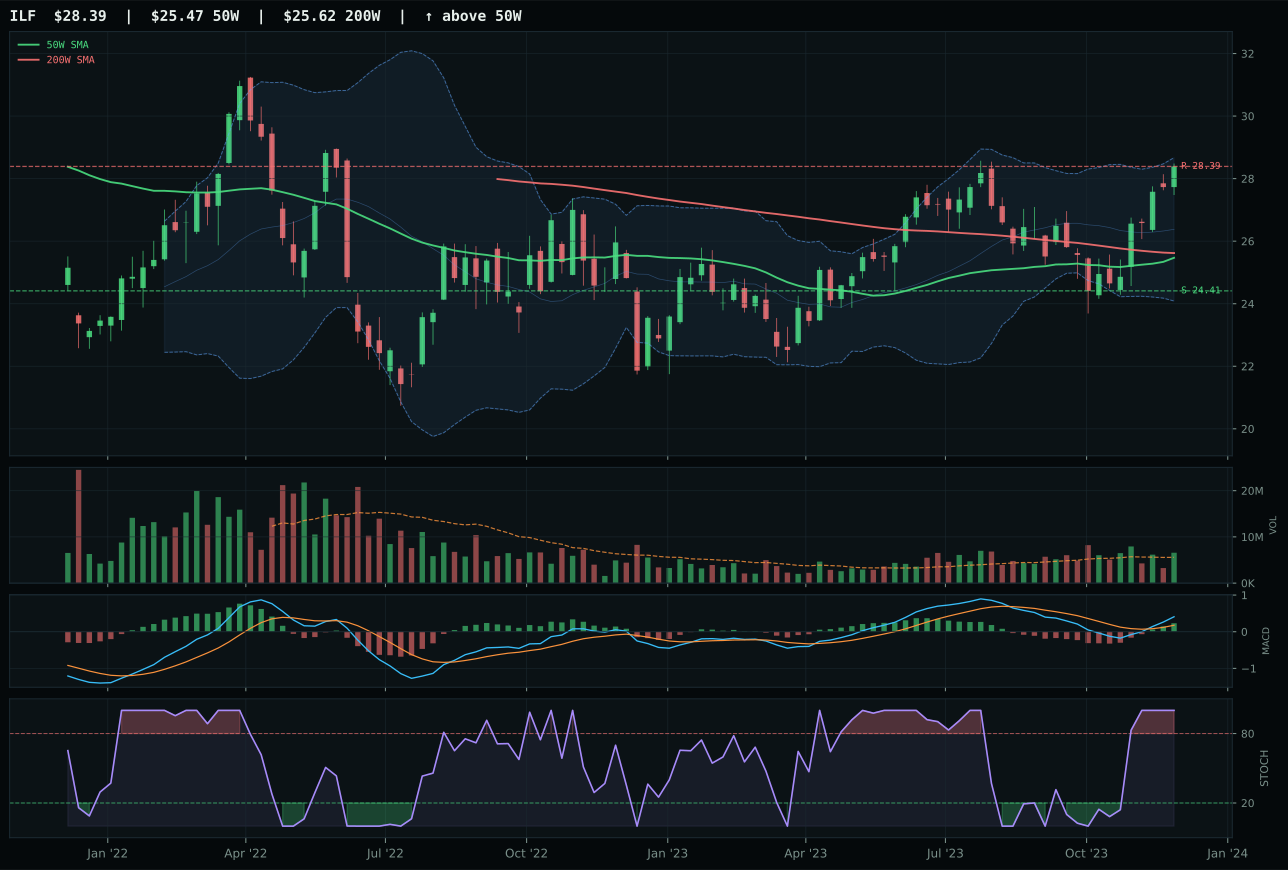
ILF has a neutral structure profile with 5.5% 13-week relative strength versus SPY.
A failed hold above support would weaken the setup.
Actionable but governed by invalidation levels.
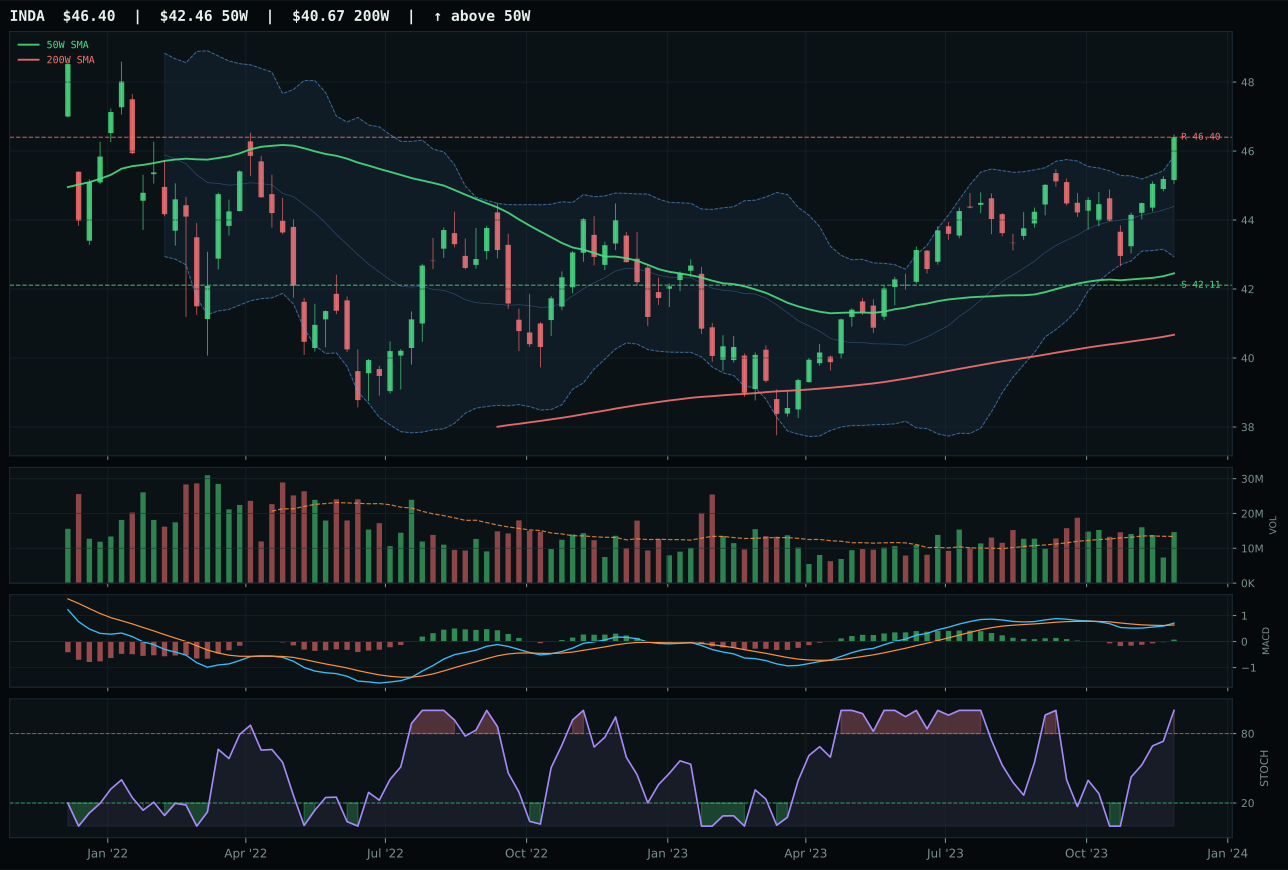
INDA has a neutral structure profile with 3.1% 13-week relative strength versus SPY.
A failed hold above support would weaken the setup.
Actionable but governed by invalidation levels.
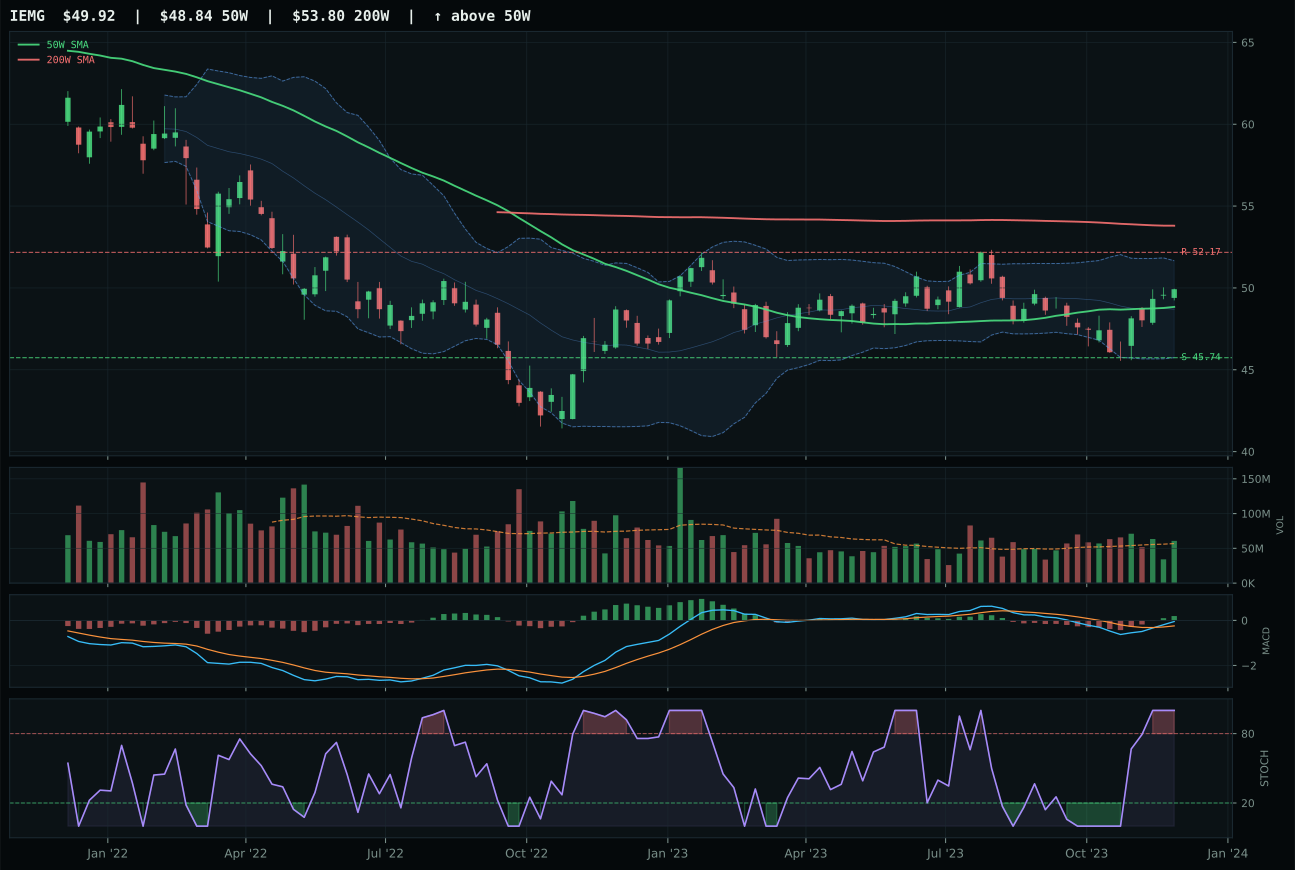
IEMG has a compression near 50W profile with -1.1% 13-week relative strength versus SPY.
A failed hold above support would weaken the setup.
Actionable but governed by invalidation levels.
ILF wins Emerging Markets with a balanced technical setup and category-relative strength advantage: 11.5% above the 50W is extended enough to show conviction but not so far as to invite mean-reversion trades, and the 2.4% category-relative strength edge over INDA reflects superior peer leadership. Volume participation at 1.18x the 20W is above-average and points to accumulation rather than rotation, while the 97.8/100 momentum confirmation confirms this is real buying, not a statistical artifact. INDA lost despite posting superior trend at 100/100 and timing at 75/100 because its neutral volume at 1.0x the 20W (versus ILF's above-average) and category-relative strength at 0.0% signal rotation rather than fresh accumulation—the hallmark of a trade past its inflection point. ILF's 7.3% 13-week return trails INDA's 4.9% in absolute terms but leads in relative merit because it arrived with better volume confirmation.
Emerging Markets earns 5% as tier-2, held despite a 53.6 final score that ranks it clearly outside the top-2 due to structural macro headwinds. Credit stress at -10 and liquidity stress at -10 combine to create a -20 basis point category-level drag that overwhelms the +8 boost from commodity breadth positive, leaving the 30.0/100 macro fit as one of the weakest in the portfolio. ILF's 87.2/100 technical evidence carries the allocation, but it is fighting against a regime where emerging currencies are vulnerable and risk-off positioning penalizes beta. The category remains in the portfolio because ILF's volume-price confirmation at 79.2/100 suggests institutional participation despite the macro headwinds, and its position 11.5% above the 50W on above-average volume means the technical setup is cleaner than support-based alternatives. For Emerging Markets to reach top-2, either liquidity stress indicators need to reverse sharply or ILF needs to demonstrate a breakout above recent extension highs on expanding volume—currently, it is a technical-only conviction trade.
Defense & Aerospace — XAR
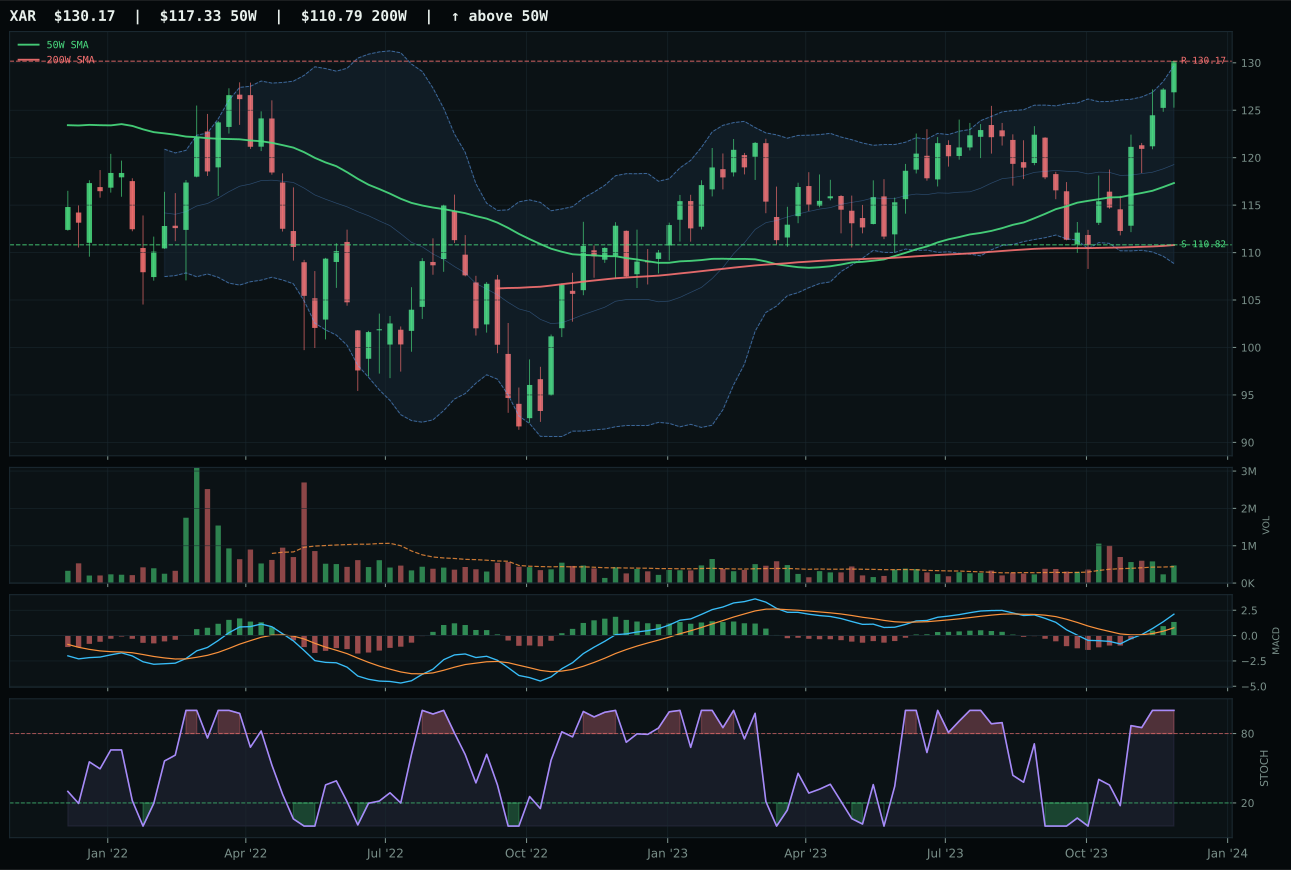
XAR has a neutral structure profile with 4.6% 13-week relative strength versus SPY.
A failed hold above support would weaken the setup.
Actionable but governed by invalidation levels.
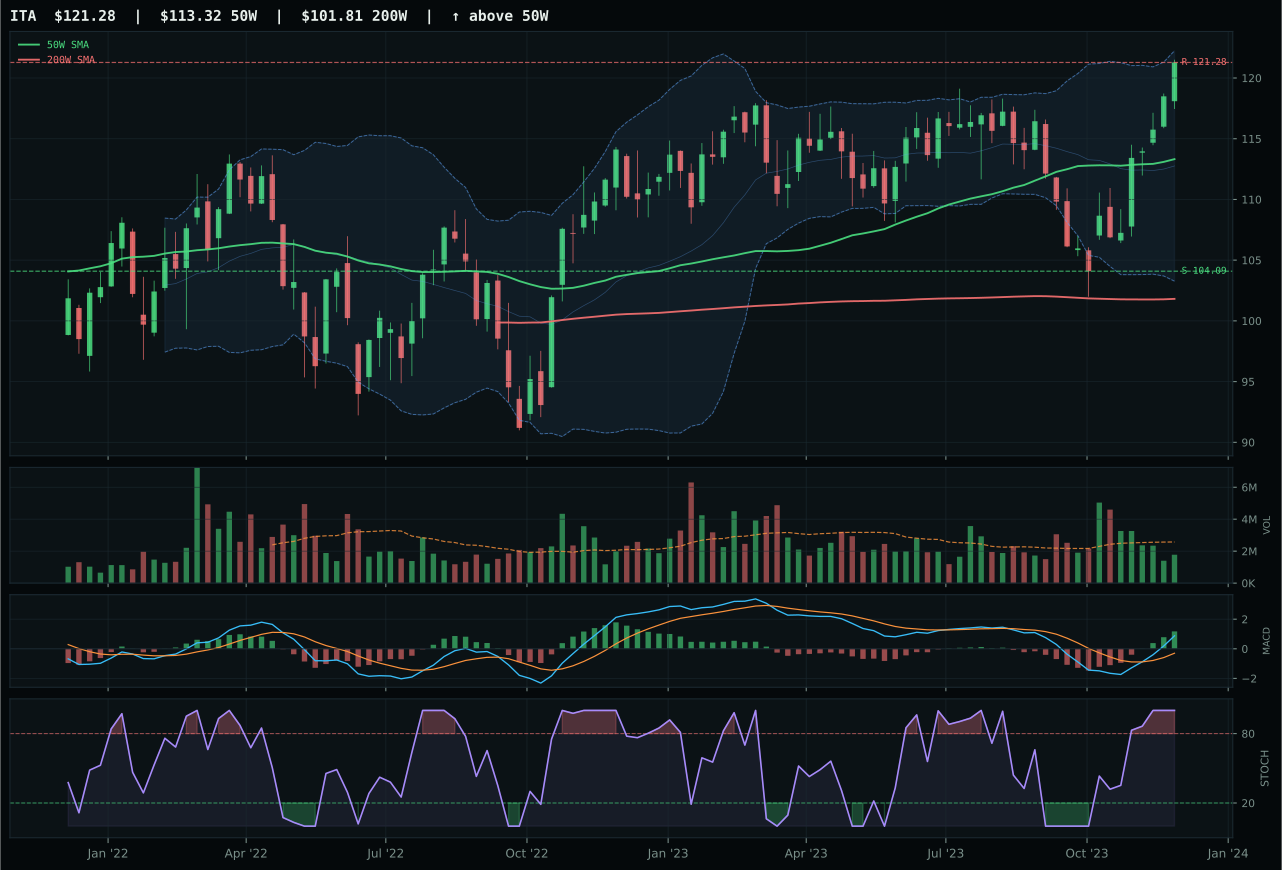
ITA has a neutral structure profile with 2.4% 13-week relative strength versus SPY.
A failed hold above support would weaken the setup.
Actionable but governed by invalidation levels.
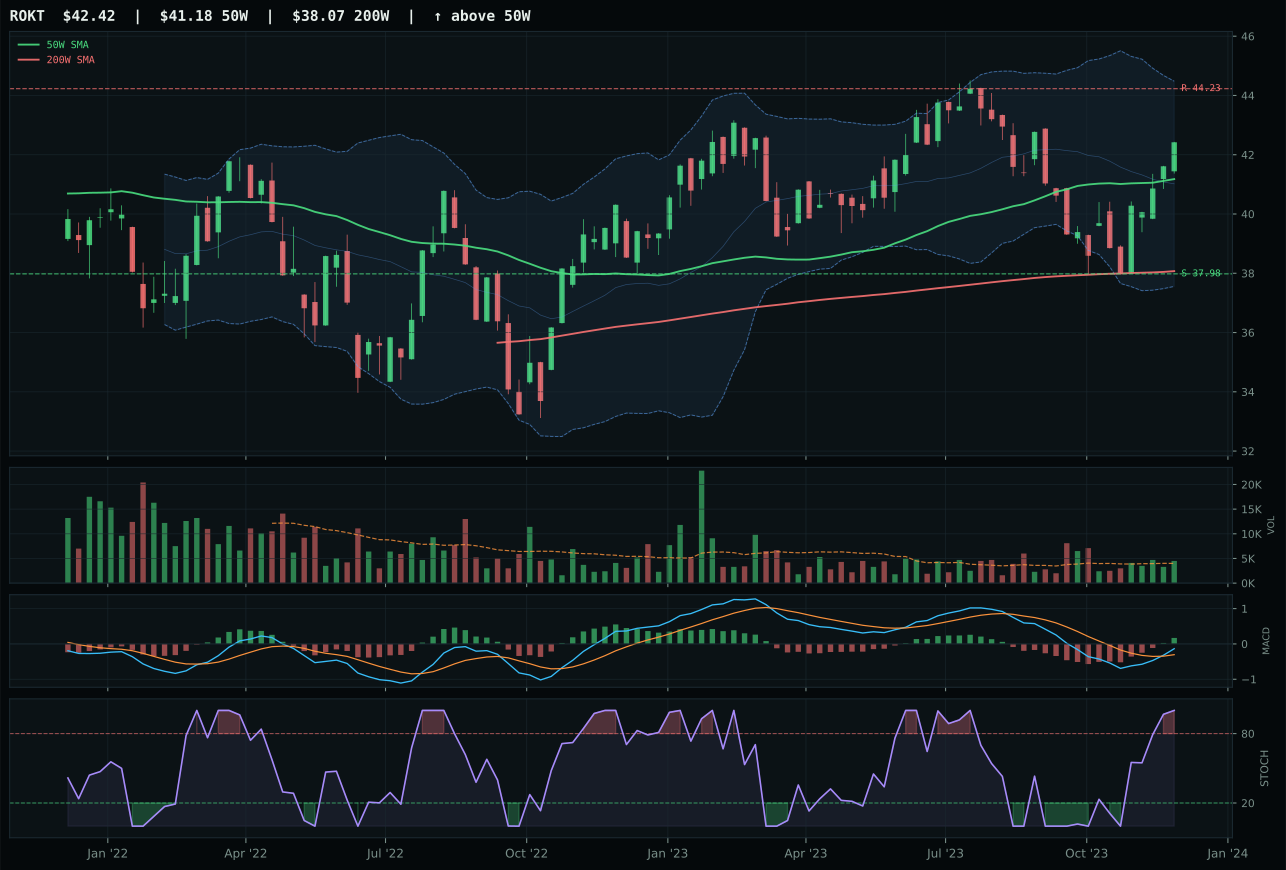
ROKT has a neutral structure profile with -2.6% 13-week relative strength versus SPY.
A failed hold above support would weaken the setup.
Tracked, but not top-2 eligible because: .
XAR wins a tight category decision by a single technical vector: category-relative strength of 2.2% against ITA's 0.0%, despite ITA posting a stronger 100/100 trend score. Volume confirmation was the deciding factor; XAR trades with neutral participation at 1.08x the 20W while ITA shows thin participation, meaning XAR's 4.6% SPY-relative strength is building on actual accumulation rather than short-covering. Both names sit in neutral structure near the 52W high, both have bullish-improving MACD, and both sport overbought stochastic RSI, making the category feel mature. The 0.6-point gap to ITA signals this is a setup-quality decision, not a breakaway conviction—XAR's compressed structure into the move is cleaner than ITA's extended posture, giving it marginal edge in risk-adjusted positioning.
Defense & Aerospace receives 5% as tier-2, with a 53.5 final score that ranks it just outside the top-2. Neutral macro fit at 50.0/100 reflects balanced positioning—credit stress at +2 actually helps the category slightly, while liquidity stress at -4 is moderate compared to other headwinds. The category's technical evidence of 81.4/100 is respectable, and the real story is that momentum confirmation (92.2/100) is carrying the weight; this is a trade on conviction and positioning, not on macro catalysts. XAR's 6.3% 13-week return and steady 4.6% SPY-relative strength provide the backbone, but without fresh macro tailwinds or a meaningful pullback to reset the entry, this allocation will rotate out quickly if the broader market softens. A move to top-2 would require either renewed geopolitical risk premia or a significant technical break below current support.
AI — BOTZ
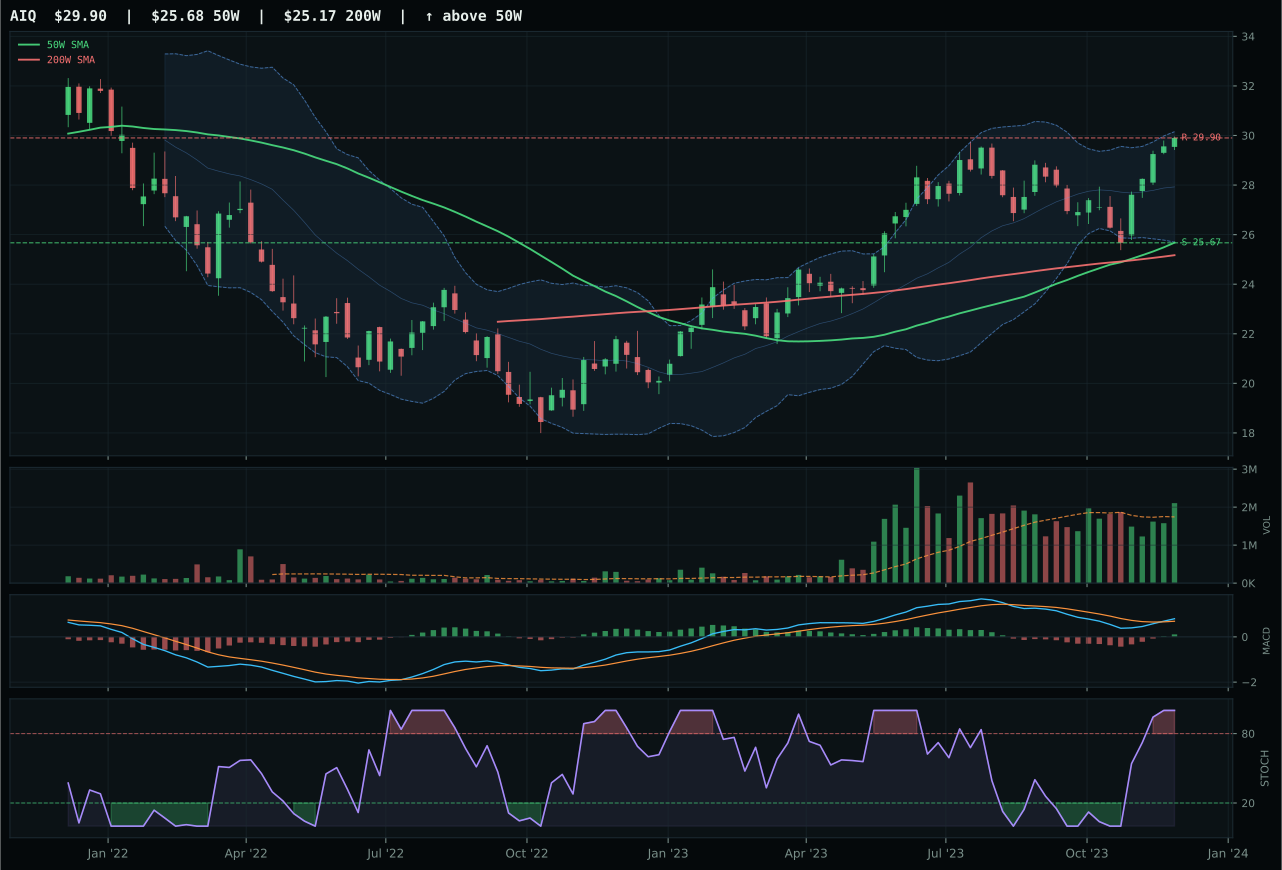
AIQ has a vertical extension profile with 2.0% 13-week relative strength versus SPY.
A failed hold above support would weaken the setup.
Actionable but governed by invalidation levels.
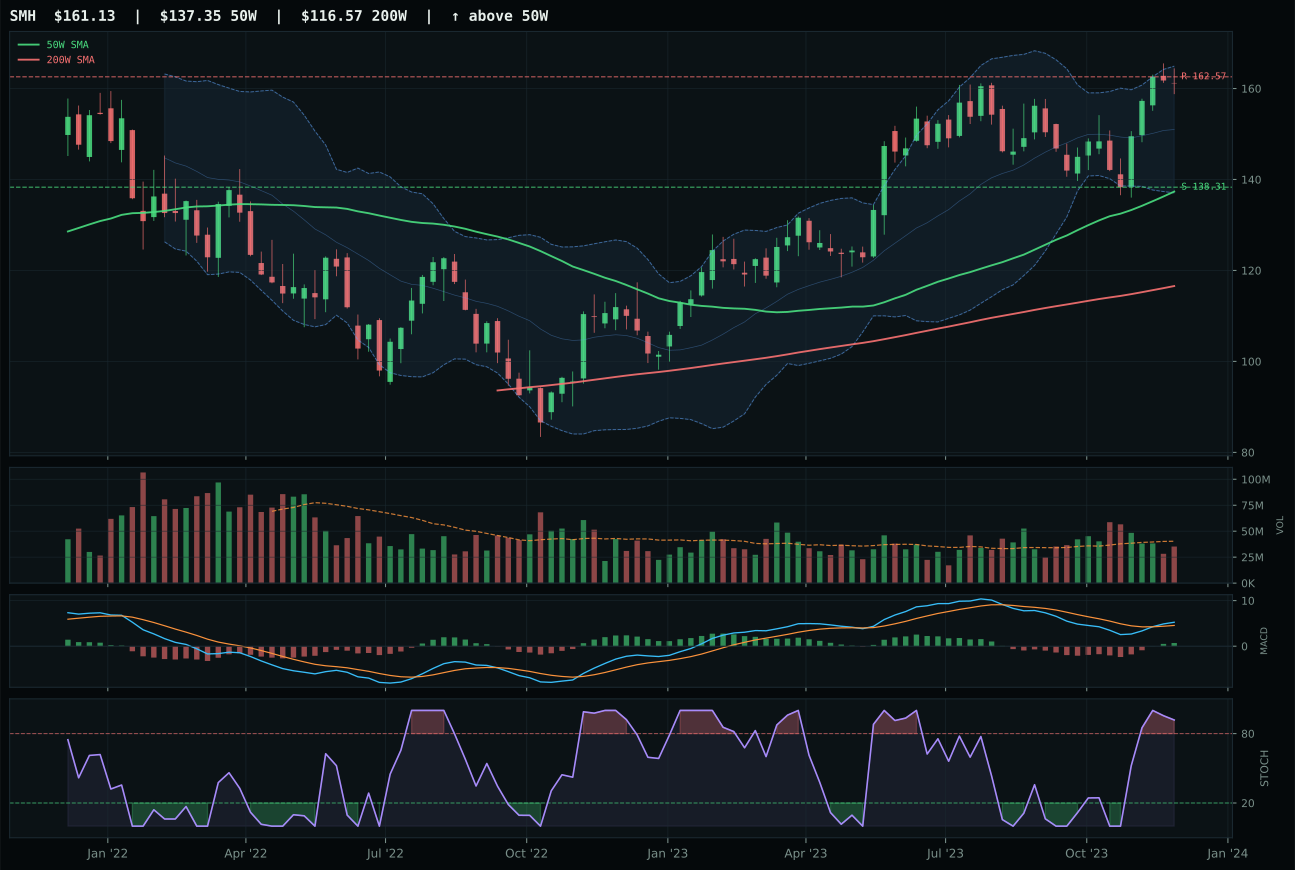
SMH has a vertical extension profile with 1.4% 13-week relative strength versus SPY.
A failed hold above support would weaken the setup.
Actionable but governed by invalidation levels.
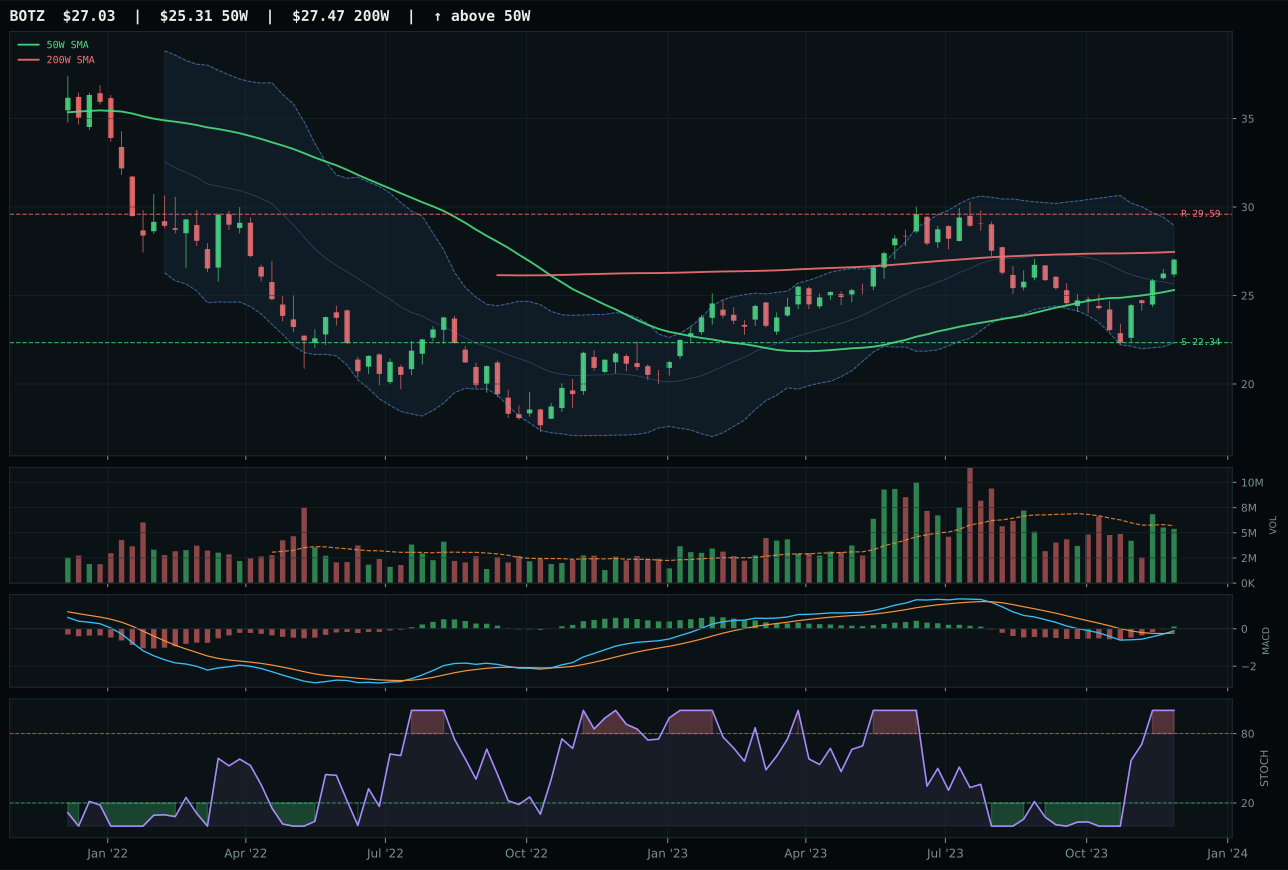
BOTZ has a neutral structure profile with -0.6% 13-week relative strength versus SPY.
A failed hold above support would weaken the setup.
Actionable but governed by invalidation levels.
BOTZ defeats AIQ by flipping the timing equation: instead of chasing vertical extension 16.4% above the 50W (AIQ's setup), BOTZ compresses at just 6.8% above the moving average, affording a superior timing score of 75.0 versus AIQ's 37.0. This proximity to support creates asymmetric risk-reward at 52.4/100 versus AIQ's weaker 45.7, turning a category with -0.6% SPY-relative strength into the best alternative in a weak field. BOTZ's neutral volume at 0.95x the 20W average is less enthusiastic than AIQ's above-average participation, but the setup matters more than the volume character when prices are stretched; BOTZ's position allows it to hold conviction without overpaying. The 7.5-point gap versus AIQ is decisive, reflecting BOTZ's structural advantage as support-based rather than extension-based.
AI receives 5% as tier-2, reflecting a 53.0 category score that sits well below the top-2 threshold despite healthy trend scores. Liquidity stress at -12 and credit stress at -8 are crushing the macro fit to just 35.0/100, making this a technical-driven play rather than a macro-aligned one. The category's disinflation benefit of +5 and the fact that 4-week momentum is strong (BOTZ at 10.6%) keep it eligible, but without a macro relief from the current tightness, AI remains a crowded trade that only squeezes into the portfolio because its technical setup is cleaner than alternatives further down the list. For AI to move into top-2, either the category-relative strength across all three names needs to improve by 200+ basis points or credit stress indicators need to reset.
Industrial Metals — PICK
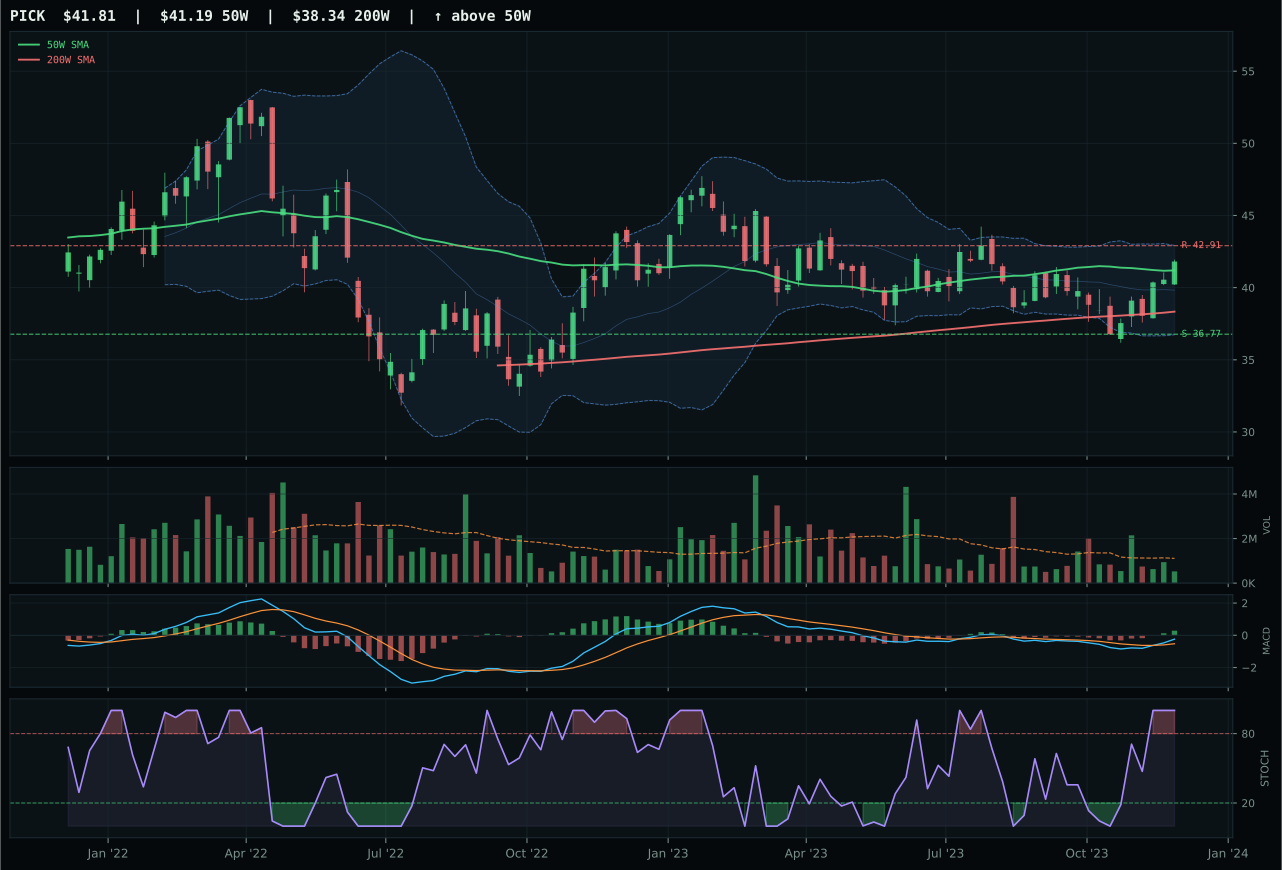
PICK has a compression near 50W profile with 0.6% 13-week relative strength versus SPY.
A failed hold above support would weaken the setup.
Actionable but governed by invalidation levels.
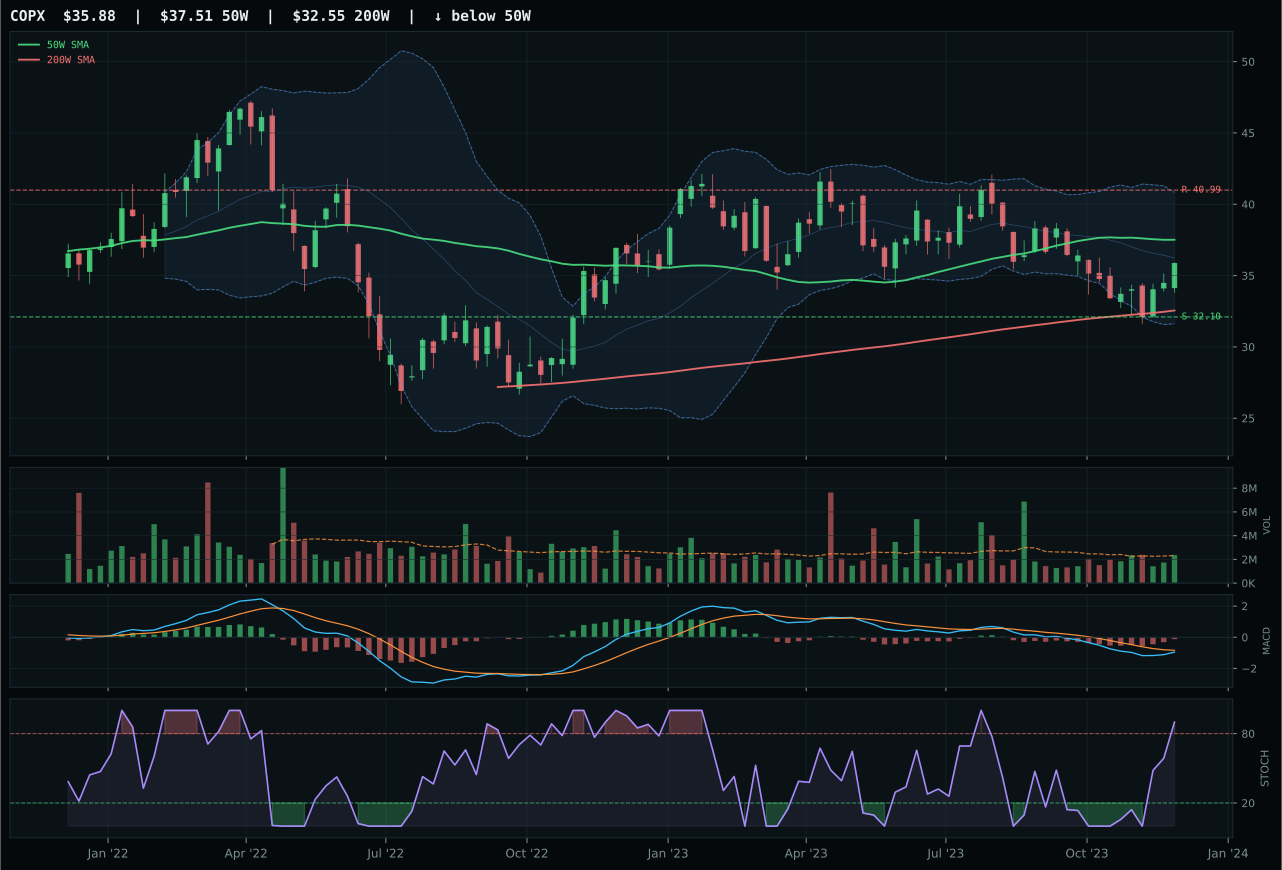
COPX has a neutral structure profile with -8.1% 13-week relative strength versus SPY.
A failed hold above support would weaken the setup.
Actionable but governed by invalidation levels.
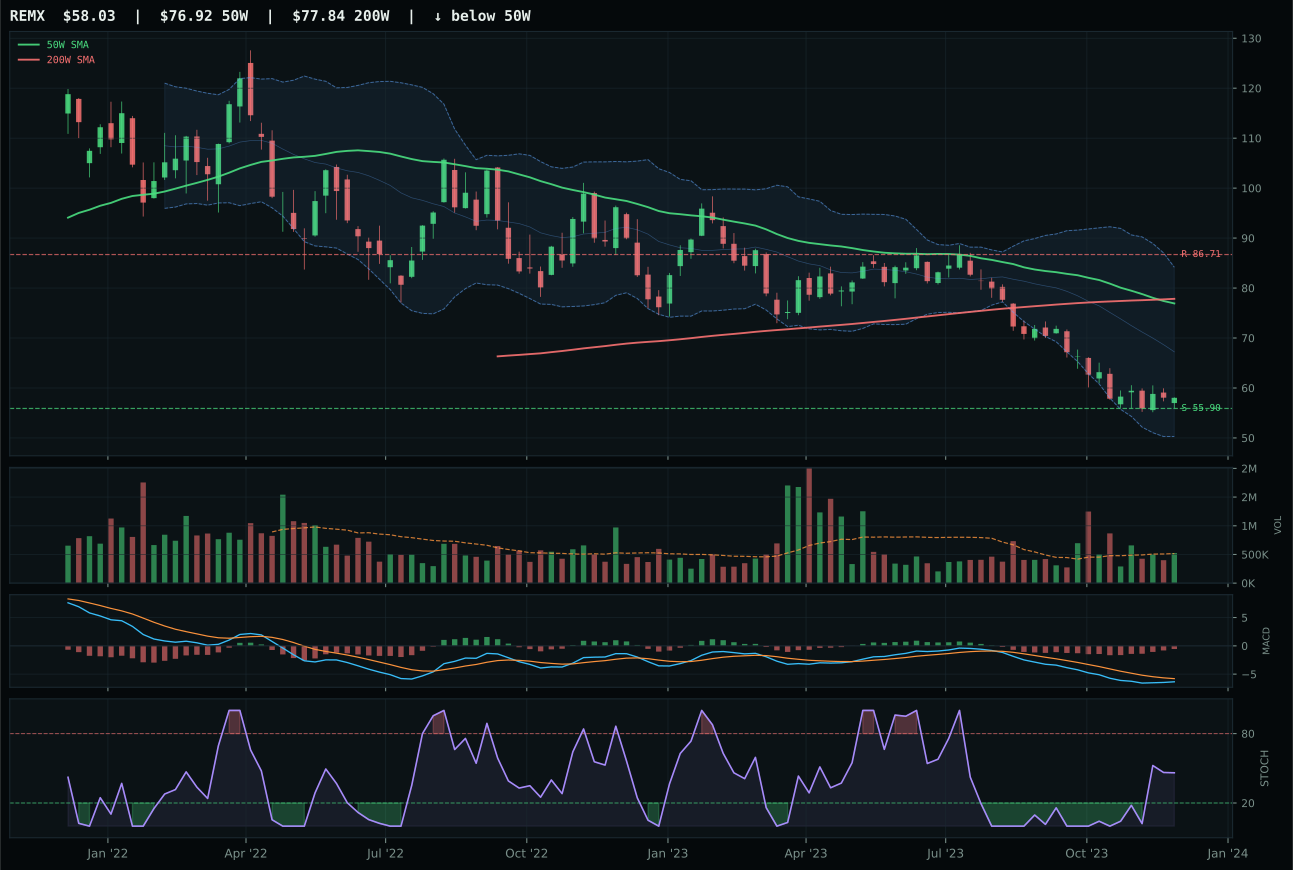
REMX has a pullback into support profile with -21.0% 13-week relative strength versus SPY.
Extension and support failure are the main tactical risks.
Tracked, but not top-2 eligible because: structurally broken.
PICK wins decisively with a 24.4-point margin over COPX by executing the optimal tactical setup: price sits just 1.5% above the 50W in compression (timing score 100.0/100) rather than extended, offering maximum asymmetry. The chart decision is clean—stochastic RSI rising into overbought, MACD bullish and improving, support at 36.77—creating a setup that can expand on any fresh weekly close above resistance at 42.91. PICK's 8.6% category-relative strength is exceptional, telling us capital is flowing here specifically, and its 85.5/100 momentum confirmation reflects genuine ownership despite thin volume participation at 0.48x the 20W. COPX's bearish-but-improving MACD and collapsed category-relative strength at 0.0% disqualify it despite a superior 62.0/100 macro fit driven by metals scarcity at +12; timing and relative strength trump macro narrative when technicals are this clear.
Industrial Metals earns 5% as tier-2, carrying a 45.9 final score that lags Precious Metals substantially despite favorable macro inputs. The category-level macro fit at 65.0/100 is robust—metals scarcity at +14, commodity breadth positive at +10, and real asset sponsorship at +6 all push in the same direction—but the 62% weighting toward technical evidence means PICK's setup excellence (timing 100/100, structure 71.7/100) must carry the full load. Liquidity stress at -8 and credit stress at -7 create friction that prevents the category from competing higher, and the fact that COPX's technical evidence at 54.7/100 is so much weaker than PICK's 81.1/100 creates a category-wide vulnerability. This allocation holds because PICK's compression setup offers better risk-reward than extended names, but the thin volume participation warns that conviction is not yet institutional-scale. A move to higher allocation would require COPX to stabilize its trend or volume to meaningfully expand above 1.0x the 20W average.
Agriculture & Livestock — MOO
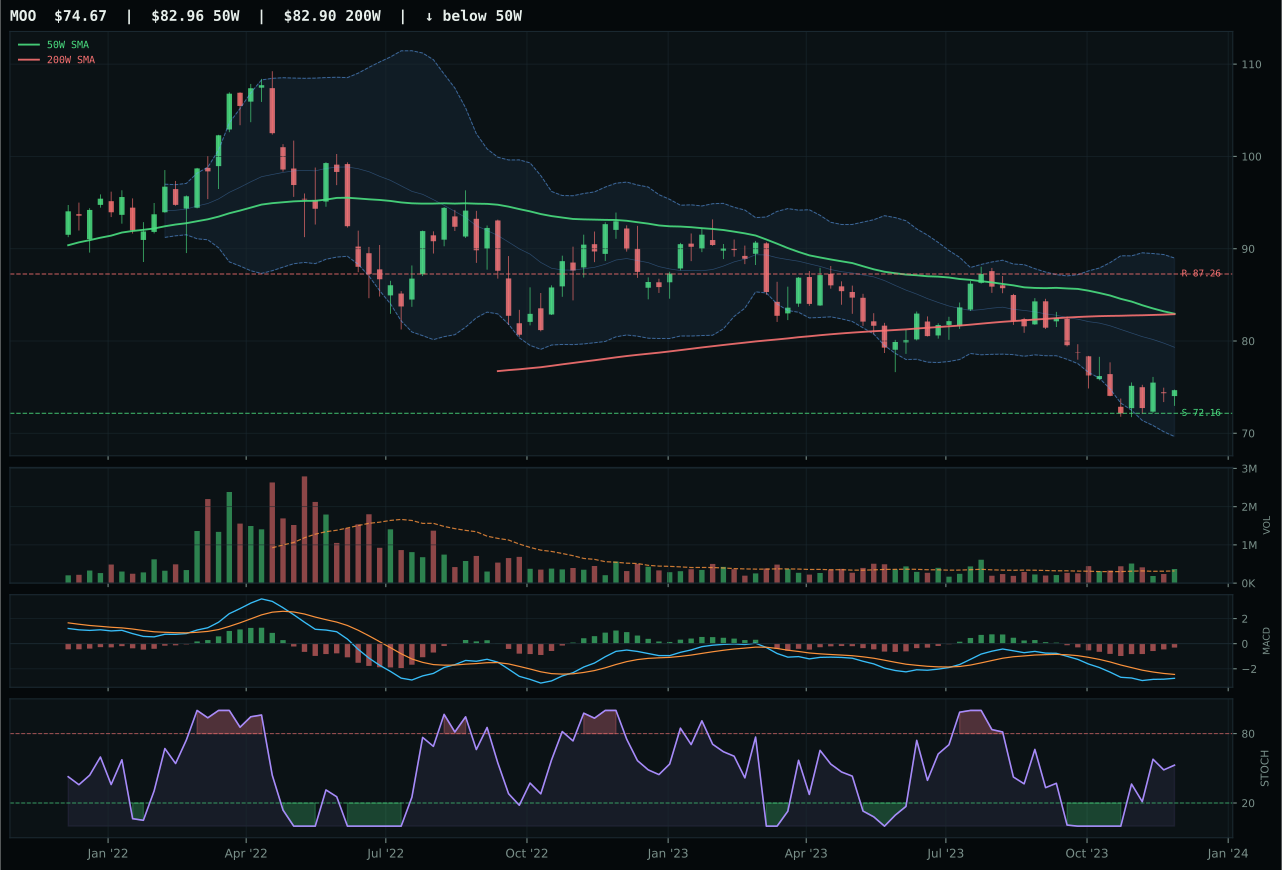
MOO has a pullback into support profile with -13.2% 13-week relative strength versus SPY.
A failed hold above support would weaken the setup.
Actionable but governed by invalidation levels.
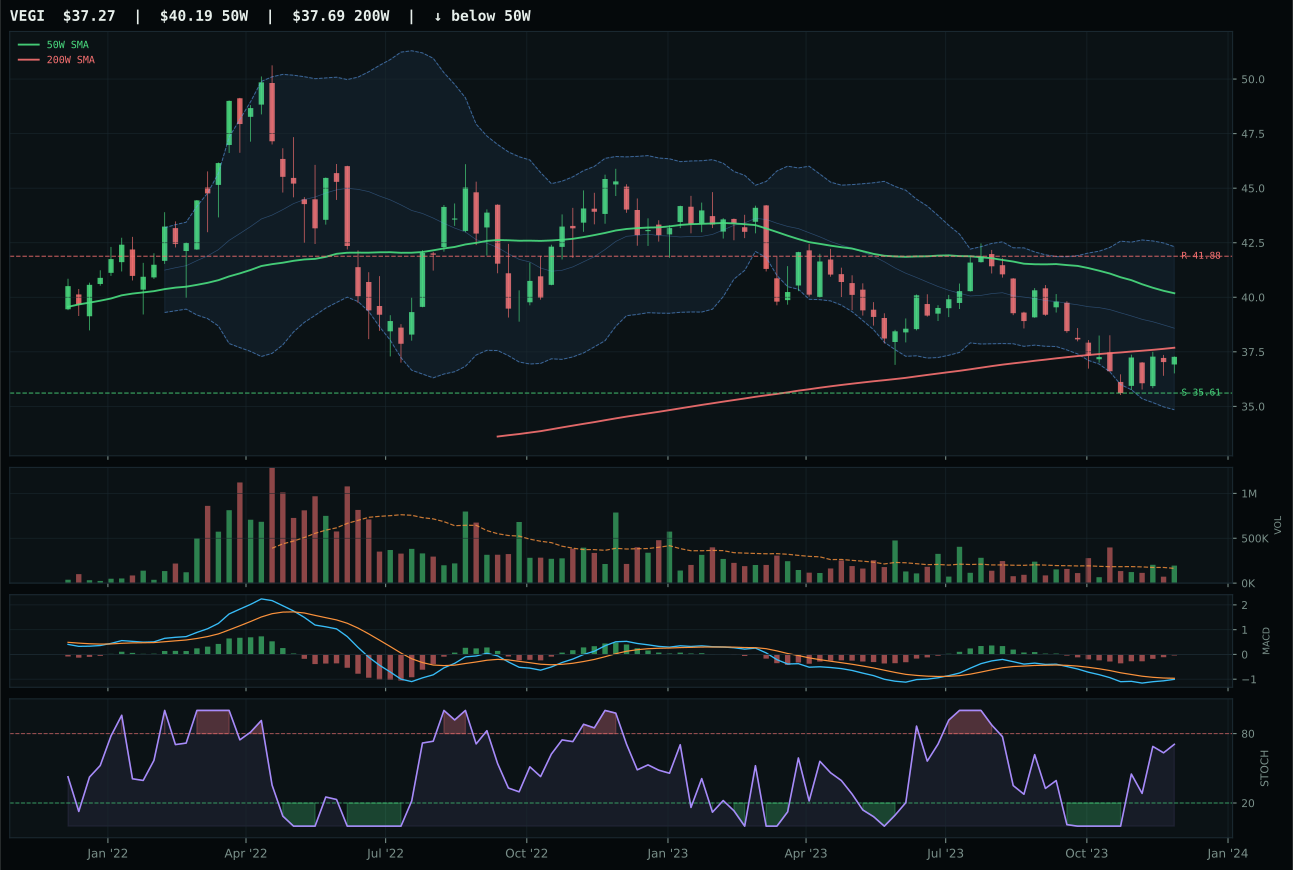
VEGI has a pullback into support profile with -9.3% 13-week relative strength versus SPY.
A failed hold above support would weaken the setup.
Tracked, but not top-2 eligible because: .
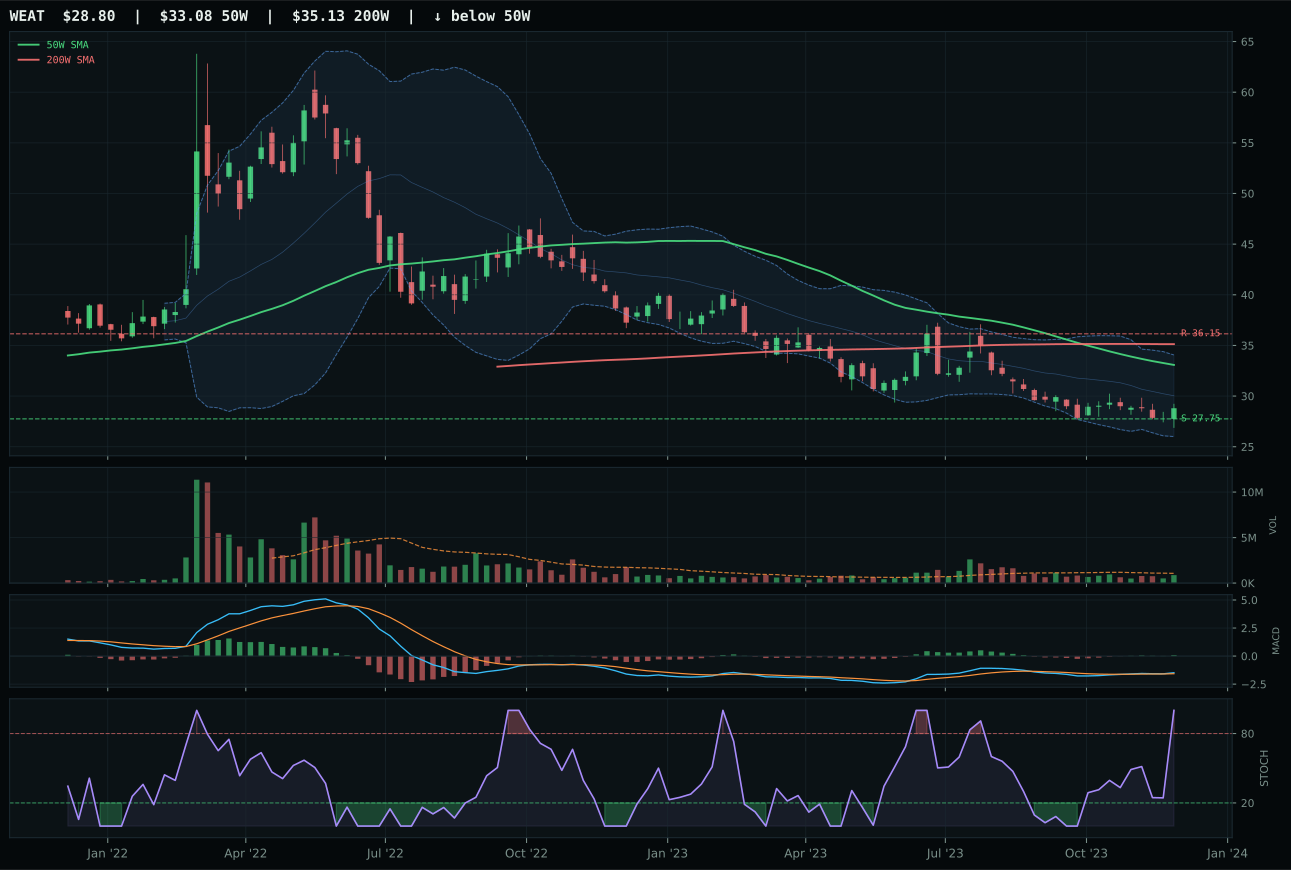
WEAT has a pullback into support profile with -4.5% 13-week relative strength versus SPY.
Extension and support failure are the main tactical risks.
Tracked, but not top-2 eligible because: structurally broken.
MOO wins the category not because it is strong, but because the entire category is broken and MOO's risk-reward at 90.0/100 is the sole salvageable metric. Price sits 10% below the 50W in active pullback into support at 72.16, with stochastic RSI rising from oversold into mid-zone—a textbook repair setup. MOO's 13-week return of -11.4% is deeply negative, its SPY-relative strength at -13.2% shows complete underperformance, and its momentum confirmation score of just 16.4/100 signals no institutional interest. The technical evidence of 26.5/100 is among the lowest in the portfolio, yet the timing score of 93.0/100 and defined support structure create a setup that, if it holds, offers a legitimate mean-reversion opportunity. VEGI lost only because its risk-reward at 87.5 is slightly worse and its trend evidence at 45.0 is marginally softer.
Agriculture & Livestock is excluded entirely this week at 0% allocation, ranking 9th or 10th among the 10 categories with a 14.7 final score that reflects catastrophic technical deterioration. The macro environment is openly hostile: disinflation pressure at -8 crushes real-asset sentiment, and while commodity breadth positive at +5 and real asset sponsorship at +8 attempt to support the category, they are outweighed by the -6 disinflation hurt and a -4 liquidity stress drag. MOO's 26.5% technical evidence score combined with 50.0/100 macro fit (the best the category can muster) yields a blended result too weak to defend capital allocation. The category will return to the portfolio only after a structural break: either a confirmed bottom with volume confirmation, a meaningful shift in inflation expectations, or a multi-week consolidation that resets relative strength back toward the moving averages.
Traditional Energy — XOP
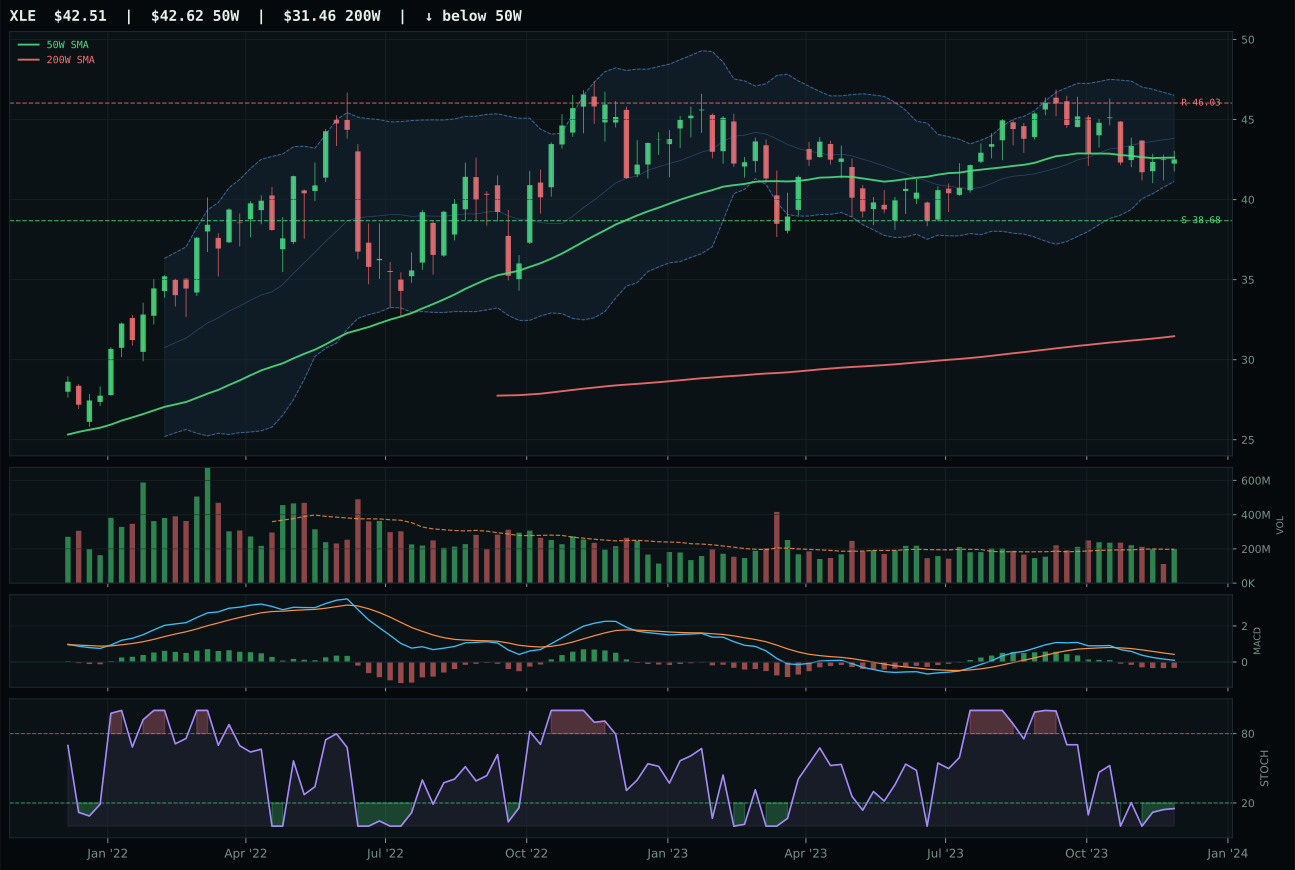
XLE has a compression near 50W profile with -8.1% 13-week relative strength versus SPY.
A failed hold above support would weaken the setup.
Actionable but governed by invalidation levels.
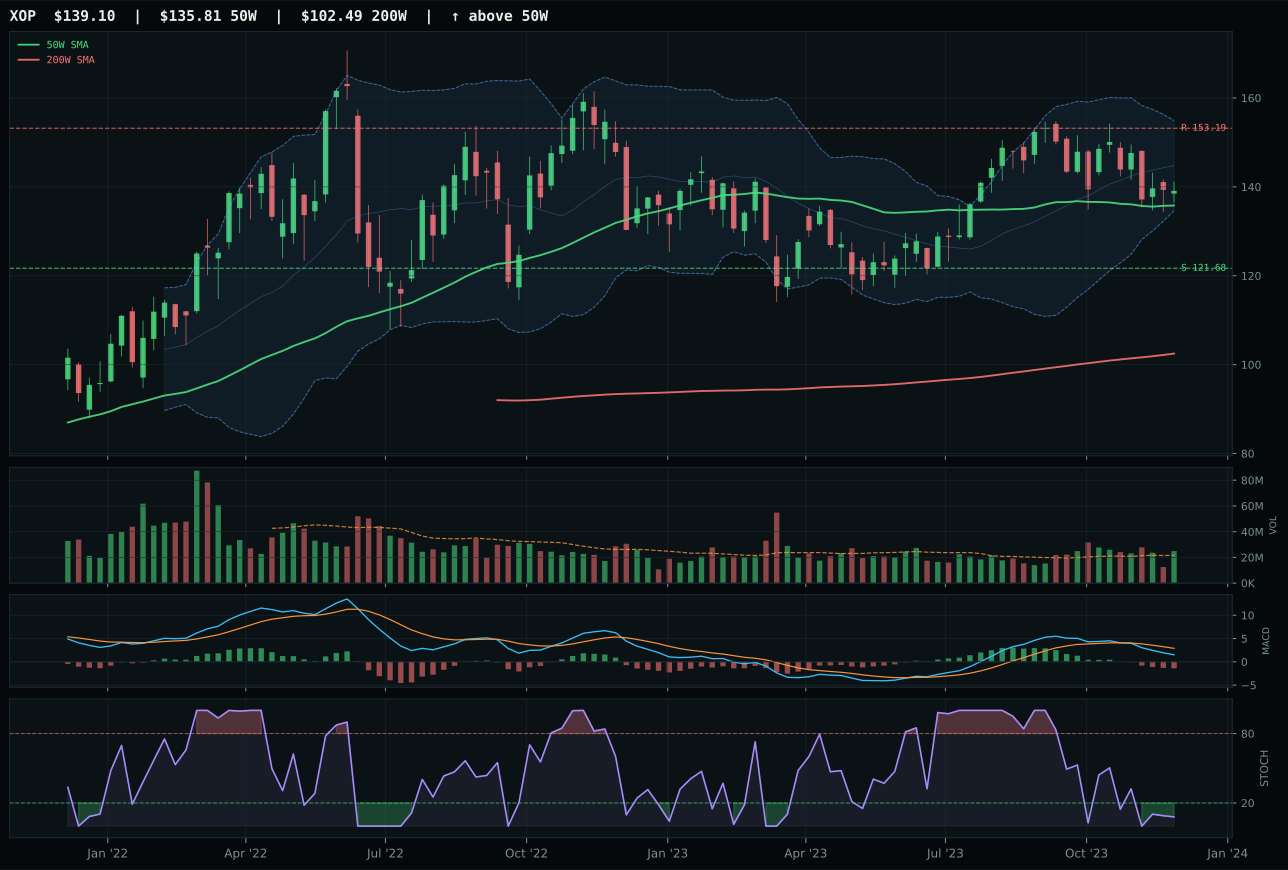
XOP has a compression near 50W profile with -10.5% 13-week relative strength versus SPY.
A failed hold above support would weaken the setup.
Actionable but governed by invalidation levels.
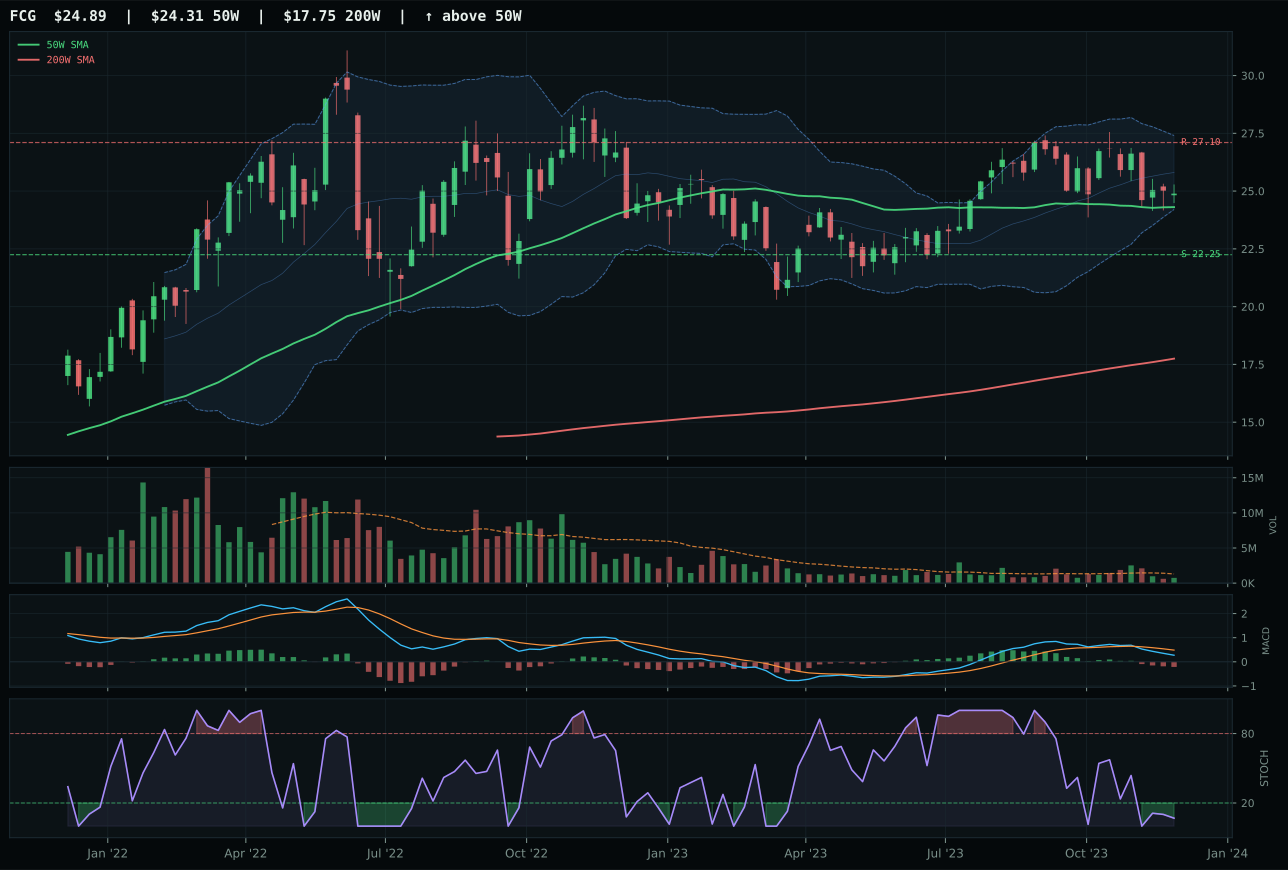
FCG has a compression near 50W profile with -9.9% 13-week relative strength versus SPY.
A failed hold above support would weaken the setup.
Actionable but governed by invalidation levels.
XOP wins a deeply impaired category not because it is compelling, but because XLE lost worse: XOP's 1.15x above-average volume participation at least shows someone is accumulating, whereas XLE's neutral volume at equilibrium signals indifference. Both are trading compression near the 50W (timing 100/100 for each), both have bearish-weakening MACD, and both are oversold-turning-up on stochastic RSI—a setup that could bounce or could break further lower. XOP's 13-week return of -8.7% is abysmal, its SPY-relative strength at -10.5% represents complete structural underperformance, and its momentum confirmation at just 8.2/100 shows zero institutional conviction. The 11-point margin versus XLE is artificial; both are walking wounded, and XOP's above-average volume is the only differentiator. Volume-price confirmation at 27.4/100 and persistence at 32.6/100 confirm this is noise, not a trade.
Traditional Energy is excluded entirely at 0% allocation, ranking 9th or 10th with a devastating 4.4 final score—the lowest in the entire portfolio. The macro regime is overtly hostile: disinflation hurts the category at -10 basis points, disinflation pressure is active at -10, and credit stress at -7 plus liquidity stress at -7 combine to create a -34 basis point macro headwind that no real asset sponsorship at +7 can overcome. The category-level macro fit at 23.0/100 is the weakest in the universe, and even XOP's best technical effort—timing at 100/100 on the compression setup—cannot rationalize capital allocation when momentum confirmation is at 8.2/100 and 13-week returns are -8.7%. Energy returns to the portfolio only after a structural pivot: either crude stabilizes with volume, or the broader macro regime shifts from disinflation back toward inflation risk. Do not bottom-fish; wait for confirmation.