
2023-11-24
Informational purposes only. The content in this report, including allocations, analysis, and commentary, is provided solely for informational and educational purposes. It does not constitute financial advice, investment advice, trading advice, or any other type of advice. Past performance does not guarantee future results. Always conduct your own research and consult a qualified financial professional before making investment decisions.
Weekly Allocation
| Ticker | Category | Weight | Role |
|---|---|---|---|
| FBTC | 50% | Overlay | |
| IGV | Technology | 10% | Top-2 (10%) |
| BOTZ | AI | 10% | Top-2 (10%) |
| URNM | Nuclear Energy | 5% | Tier-2 (5%) |
| GLD | Precious Metals | 5% | Tier-2 (5%) |
| PAVE | Utilities & Infrastructure | 5% | Tier-2 (5%) |
| XAR | Defense & Aerospace | 5% | Tier-2 (5%) |
| ILF | Emerging Markets | 5% | Tier-2 (5%) |
| PICK | Industrial Metals | 5% | Tier-2 (5%) |
Trade Instructions — Monday Open
Sell the tranche from 2023-10-27 (completing its 4-week hold). Buy the new tranche. Instructions show net portfolio changes — same-asset positions cancel, weight changes show the delta.
| Action | Ticker | Instruction |
|---|---|---|
| SELL | NLR | Sell 50% of NLR position (reduce 5.00% → 2.50%) |
| SELL | GLD | Sell 17% of GLD position (reduce 7.50% → 6.25%) |
| SELL | XLU | Sell 50% of XLU position (reduce 2.50% → 1.25%) |
| SELL | XLK | Sell 20% of XLK position (reduce 6.25% → 5.00%) |
| SELL | FCG | Sell entire FCG position (1.25% of portfolio) |
| SELL | ITA | Sell 33% of ITA position (reduce 3.75% → 2.50%) |
| SELL | INDA | Sell entire INDA position (1.25% of portfolio) |
| SELL | MOO | Sell 33% of MOO position (reduce 3.75% → 2.50%) |
| BUY | XAR | Buy XAR — 11.11% of freed cash (adds 1.25% to portfolio) |
| BUY | ILF | Buy ILF — 11.11% of freed cash (adds 1.25% to portfolio) |
| BUY | PICK | Buy PICK — 11.11% of freed cash (adds 1.25% to portfolio) |
| BUY | IGV | Buy IGV — 22.22% of freed cash (adds 2.50% to portfolio) |
| BUY | BOTZ | Buy BOTZ — 22.22% of freed cash (adds 2.50% to portfolio) |
| BUY | URNM | Buy URNM — 11.11% of freed cash (adds 1.25% to portfolio) |
| BUY | PAVE | Buy PAVE — 11.11% of freed cash (adds 1.25% to portfolio) |
Current Portfolio After Trade
Combined holdings across all 4 active tranches. Each tranche is 25% of the portfolio.
| Ticker | % of Portfolio | Weight Bar |
|---|---|---|
| FBTC | 50.00% | |
| GLD | 6.25% | |
| XLK | 5.00% | |
| SMH | 5.00% | |
| XAR | 3.75% | |
| URA | 3.75% | |
| ILF | 3.75% | |
| ITA | 2.50% | |
| MOO | 2.50% | |
| NLR | 2.50% | |
| IGF | 2.50% | |
| PICK | 2.50% | |
| IGV | 2.50% | |
| BOTZ | 2.50% | |
| XLU | 1.25% | |
| XLE | 1.25% | |
| URNM | 1.25% | |
| PAVE | 1.25% |
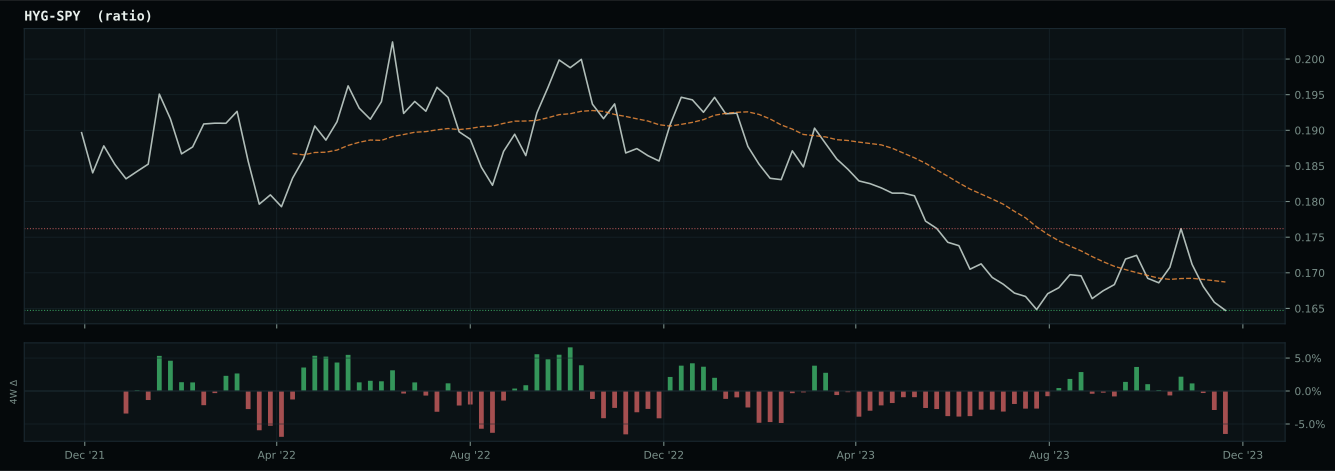
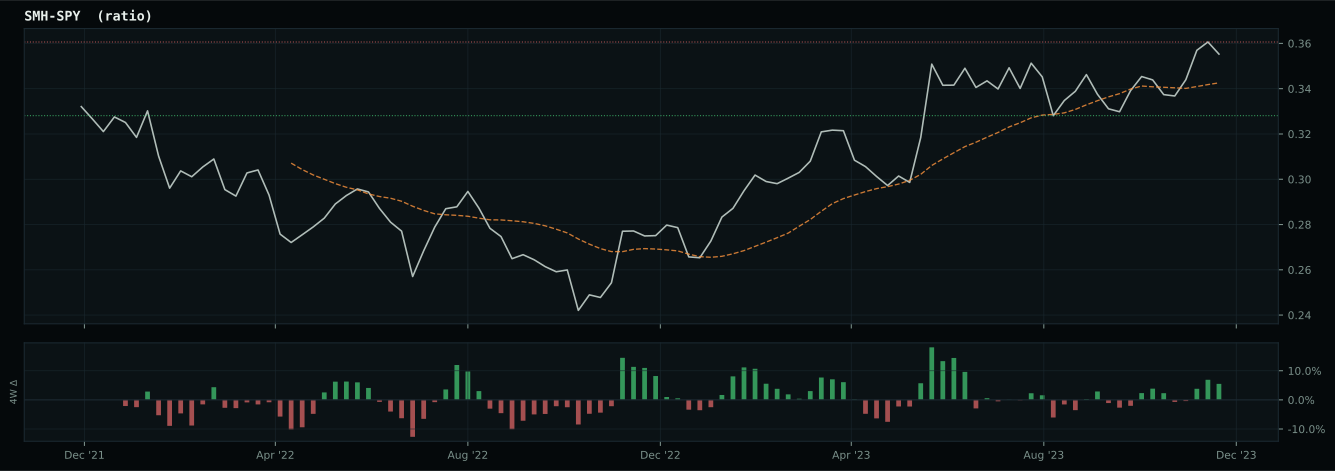
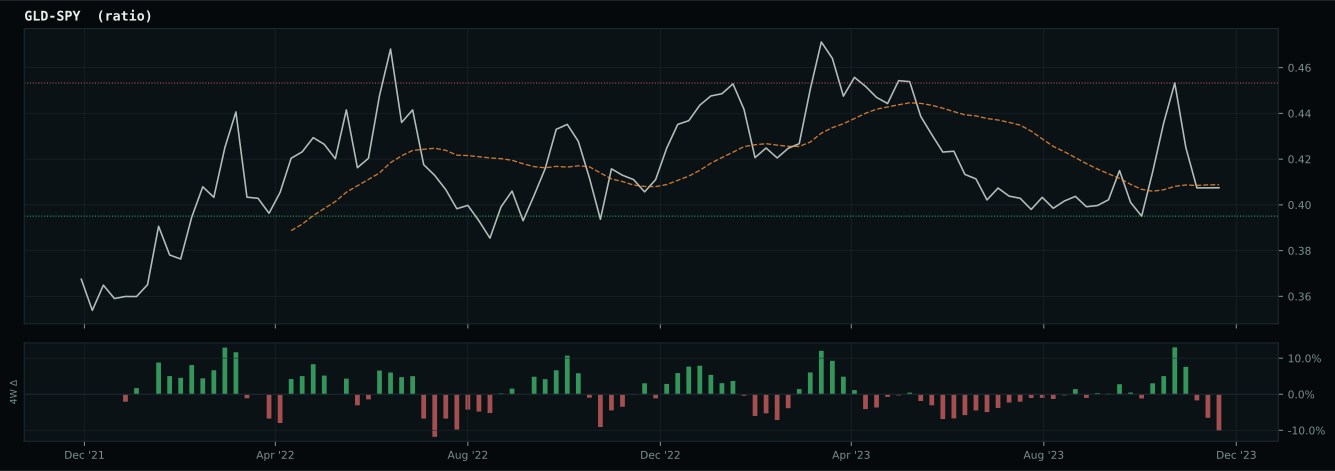
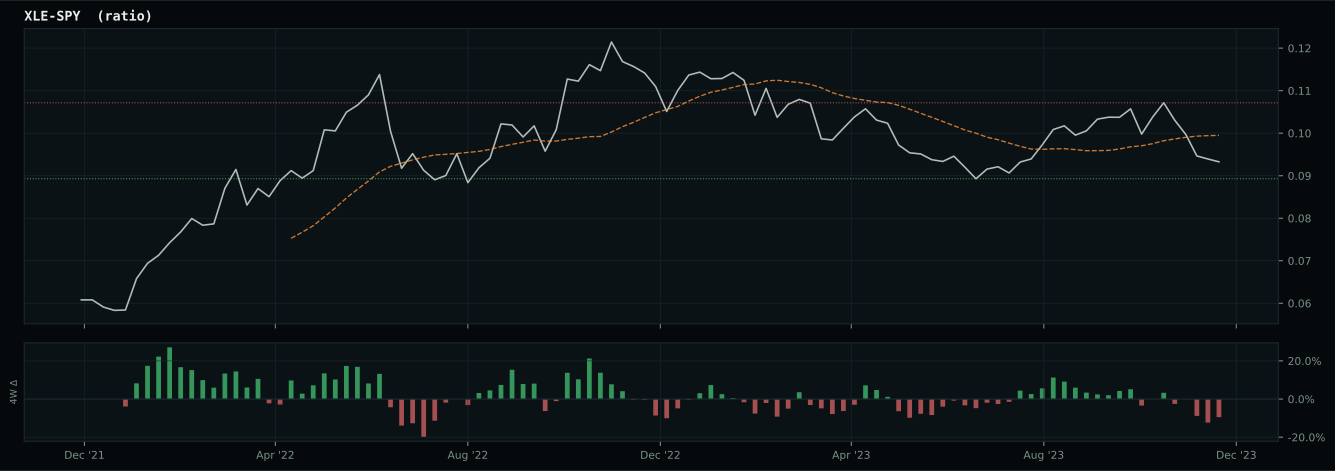
Macro Regime — Disinflation
Macro Evidence Charts
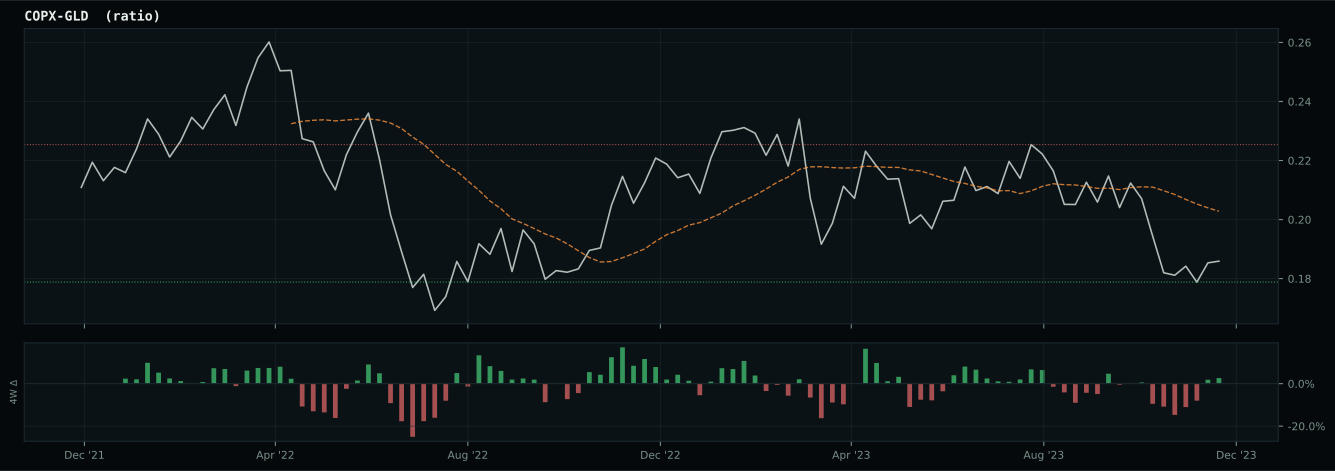
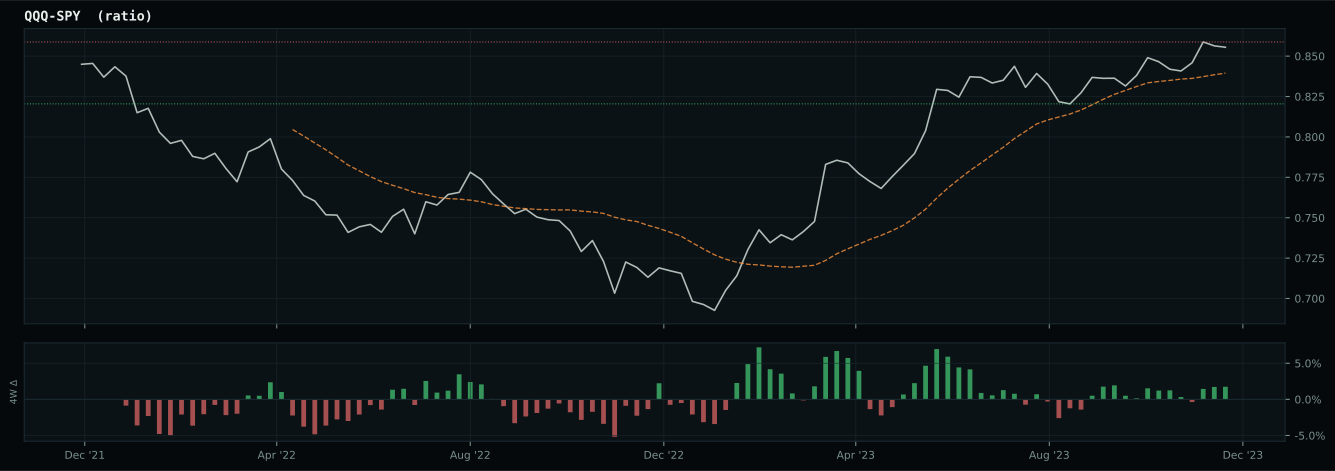
Market-implied signals behind the macro regime scores. Each ratio compares two assets; the direction and slope of the ratio is what the macro engine reads.
Crypto Regime — TrendBTC
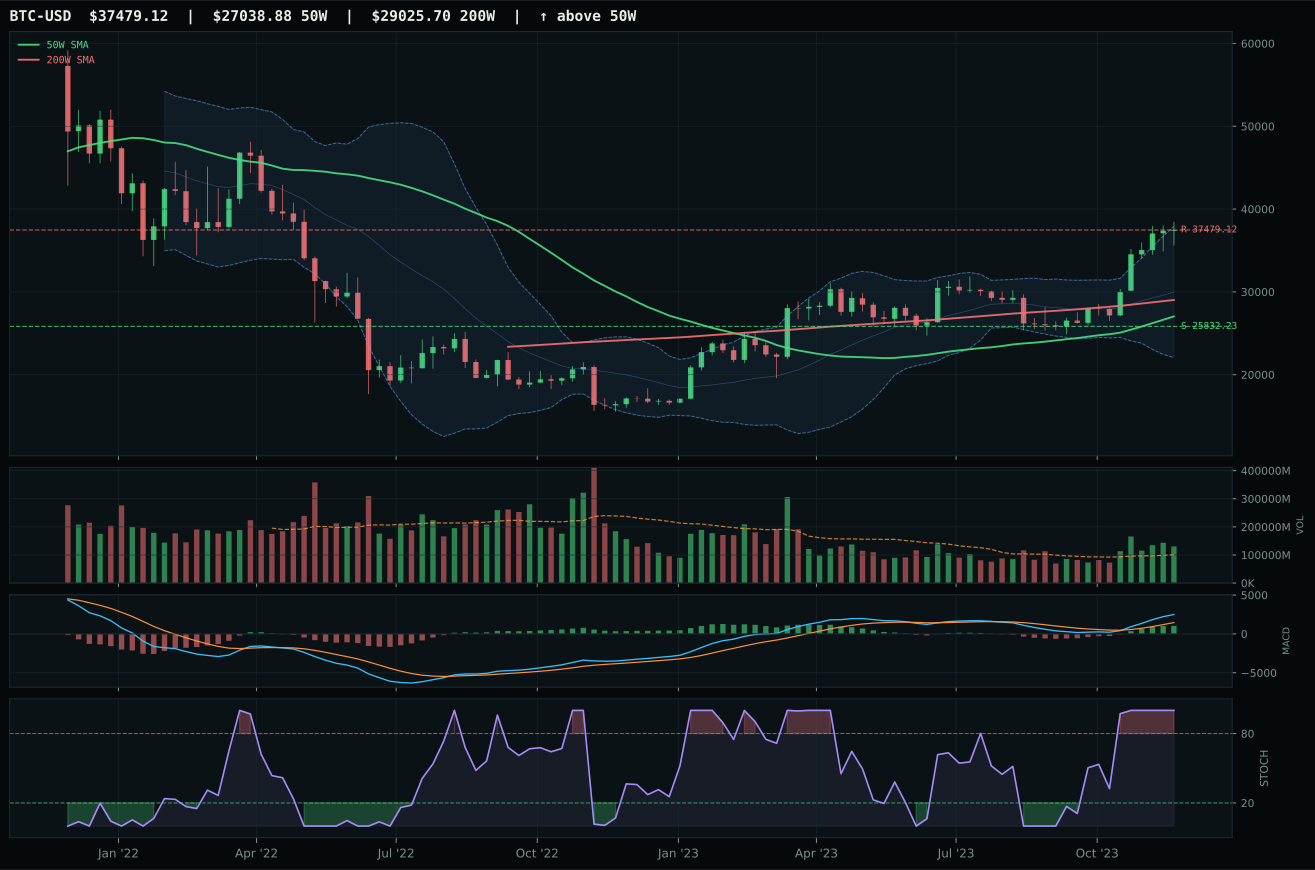
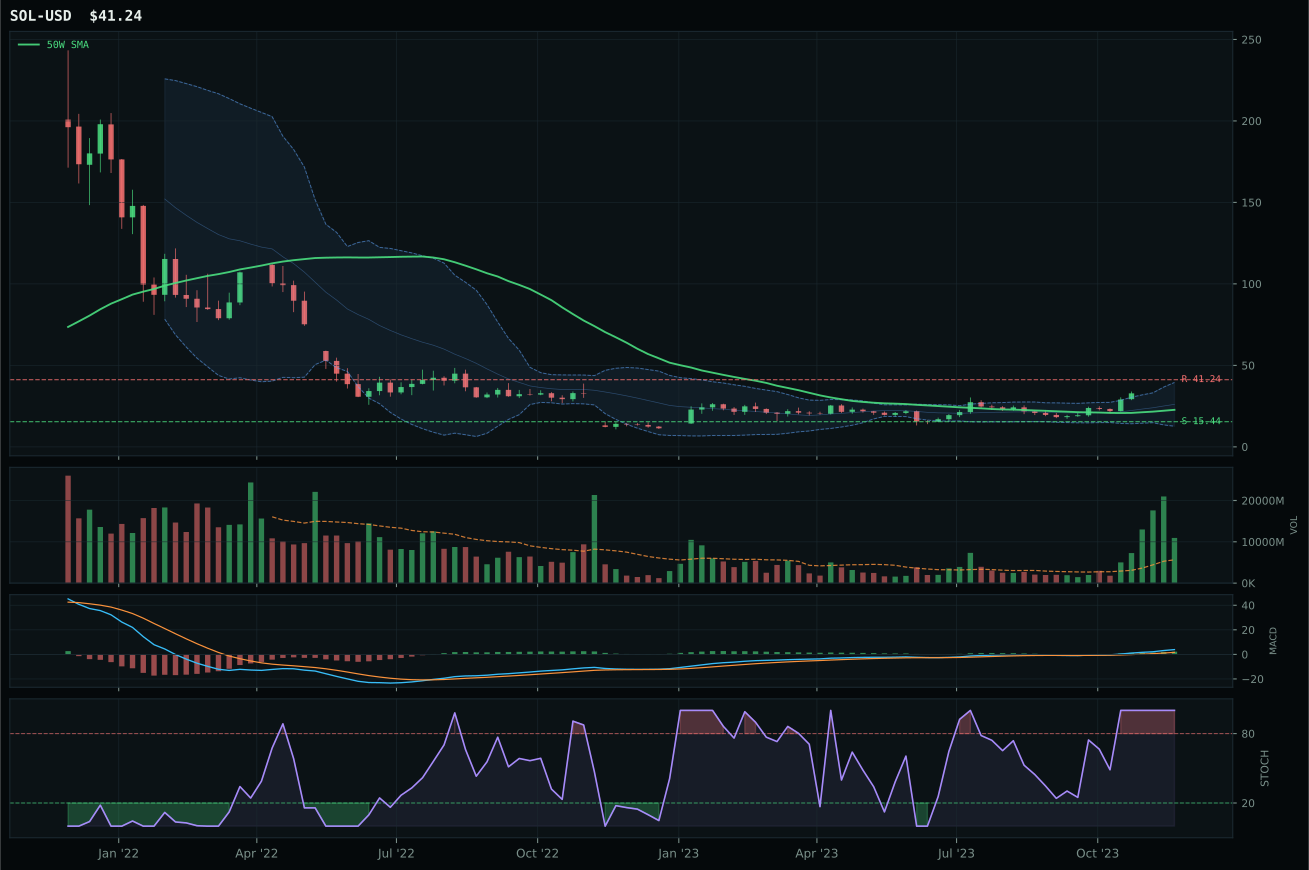
post-touch structure is too wide to count as a range; max/min close ratio is 2.29
TrendBTC confirmed: 2 consecutive closes above rising/flat 50W SMA
one or more available conditions failed
Category Rankings
| Rank | Category | Winner | Score | Alloc | 4W Ret | Peers (4W) |
|---|---|---|---|---|---|---|
| 1 | Technology | IGV | 68.0 | 20% | +7.54% | CIBR +10.8% · XLK +4.4% |
| 2 | AI | BOTZ | 61.8 | 20% | +8.71% | AIQ +5.8% · SMH +7.8% |
| 3 | Nuclear Energy | URNM | 58.3 | 10% | -1.66% | URA +1.9% · NLR -3.8% |
| 4 | Precious Metals | GLD | 53.0 | 10% | +2.36% | SLV -2.0% · GDX +6.7% |
| 5 | Utilities & Infrastructure | PAVE | 52.9 | 10% | +10.71% | IGF +3.2% · XLU -0.4% |
| 6 | Defense & Aerospace | XAR | 52.8 | 10% | +7.08% | ITA +6.6% · ROKT +7.6% |
| 7 | Emerging Markets | ILF | 31.6 | 10% | +5.08% | IEMG +0.9% · INDA +7.6% |
| 8 | Industrial Metals | PICK | 18.3 | 10% | +6.79% | COPX +12.2% · REMX +7.1% |
| 9 | Agriculture & Livestock | MOO | 2.5 | 0% | +1.70% | VEGI +2.4% · WEAT +5.6% |
| 10 | Traditional Energy | XOP | 2.4 | 0% | +1.27% | XLE +1.4% · FCG -0.4% |
Technology — IGV
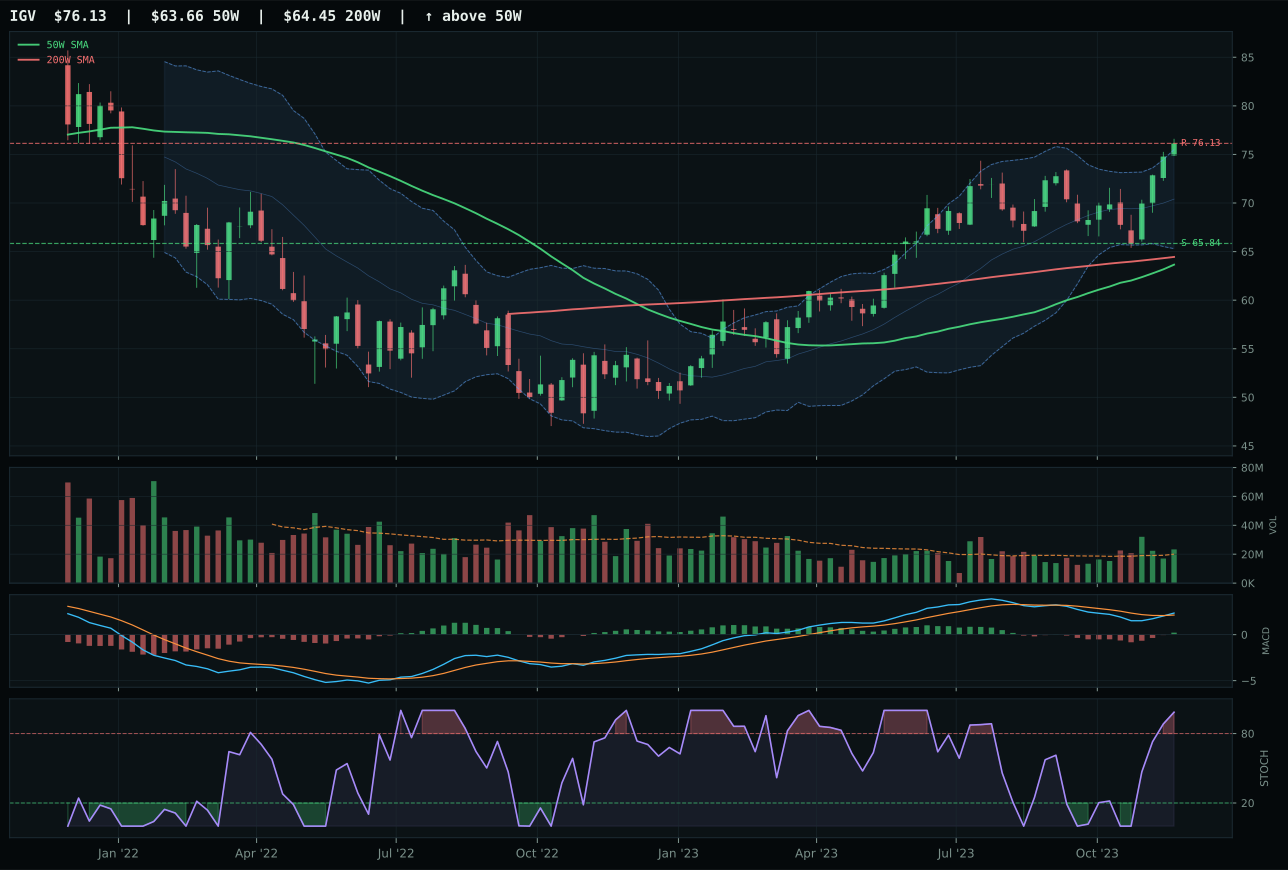
IGV has a vertical extension profile with 6.6% 13-week relative strength versus SPY.
A failed hold above support would weaken the setup.
Actionable but governed by invalidation levels.
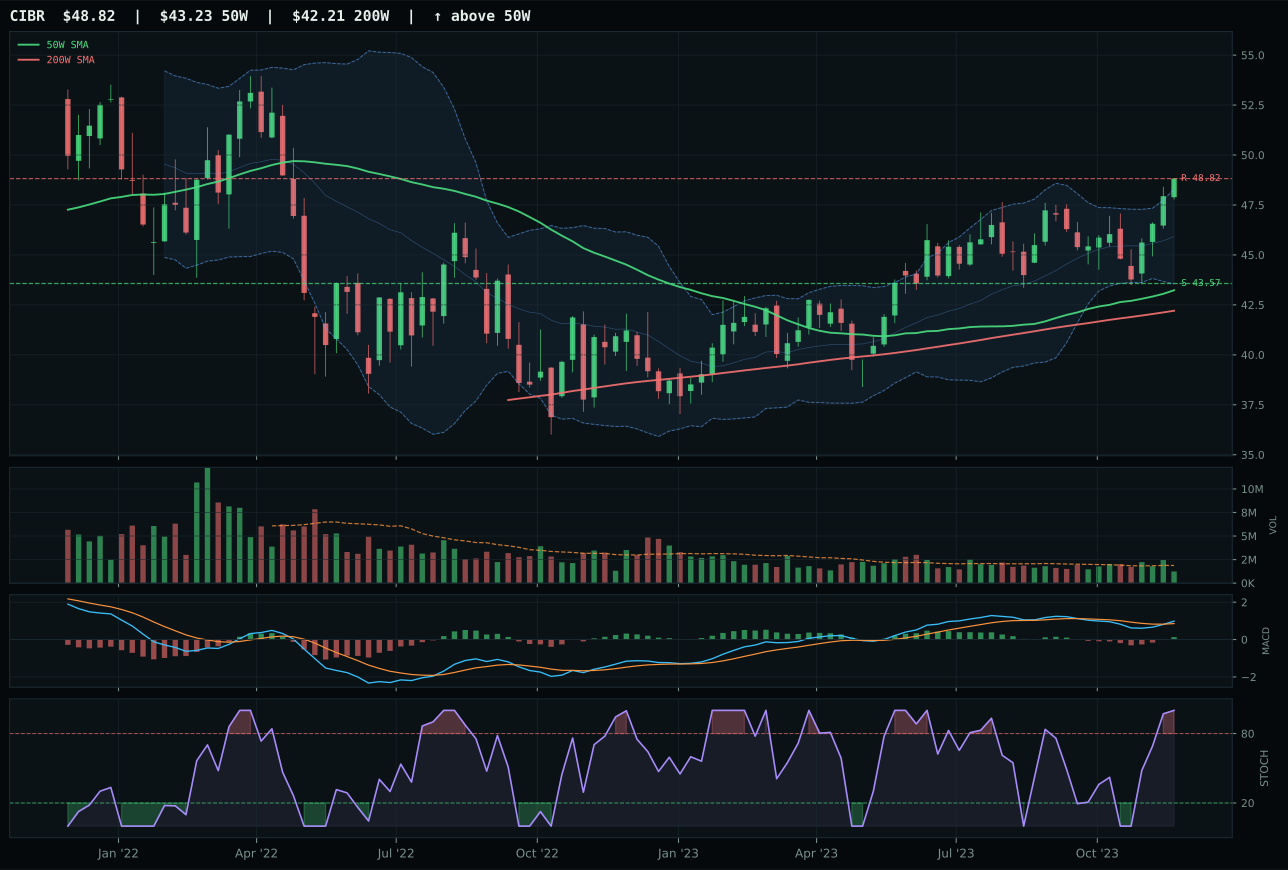
CIBR has a neutral structure profile with 3.8% 13-week relative strength versus SPY.
A failed hold above support would weaken the setup.
Actionable but governed by invalidation levels.
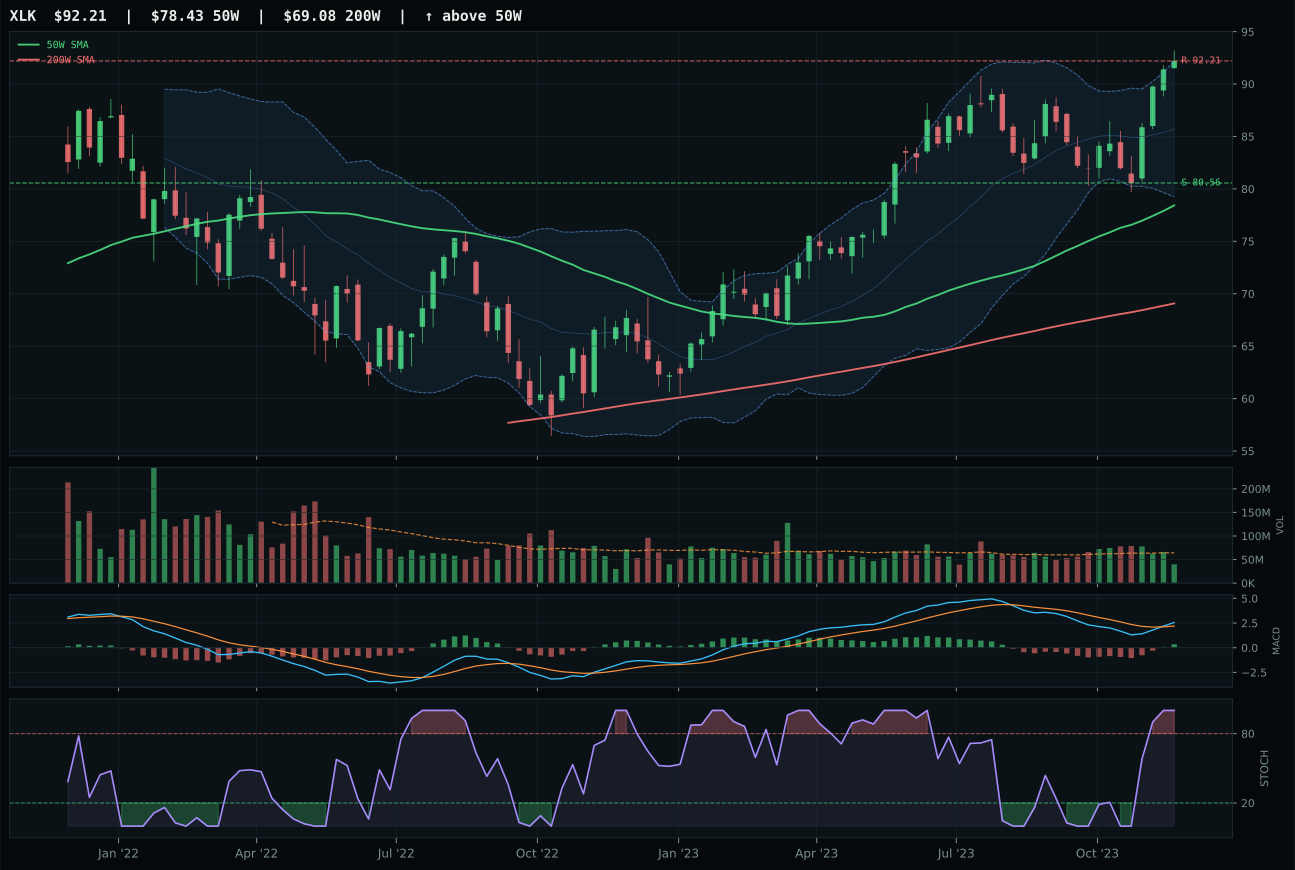
XLK has a vertical extension profile with 5.8% 13-week relative strength versus SPY.
A failed hold above support would weaken the setup.
Actionable but governed by invalidation levels.
IGV claims the category with a clean vertical extension setup that's being accumulated rather than rejected. The 19.6% distance above the 50W would normally be punitive for entry risk, but above-average volume participation at 1.17x the 20-week average and a +6.6% relative strength versus SPY confirm that institutional buyers are still supporting the move. CIBR lost here despite bullish MACD and overbought stochastic RSI because its structure scored 6.3 points lower (73.0 vs 79.3), its category-relative strength lagged at -2.0%, and volume confirmation was thinner—a meaningful gap that reflects enterprise software (IGV) outpacing cybersecurity (CIBR) in the current hiring and capex cycle.
Technology earned one of two 10% allocation slots because it ranked among the two highest-scoring categories at 68.0, and the macro regime supports it decisively. Disinflation pressures favor duration-sensitive growth, and the active descriptors show risk appetite positive at +9 and AI growth sponsorship at +6, more than offsetting the -10 liquidity stress hit. IGV's 10.1% 13-week return and category-relative dominance over CIBR confirm breadth is real. The 62/38 weighting toward technical evidence over macro narrative means this setup had to prove itself on the chart, and it did: above both moving averages, clean structure, above-average volume. The only tension is extension depth—nearly 20% above the 50W limits upside, and the stochastic RSI overbought at 0.98 signals the move is stretched. Allocation here is justified because the macro tailwind and technical proof order outweigh near-term entry risk; however, any break below the 50W would immediately disqualify this position.
AI — BOTZ
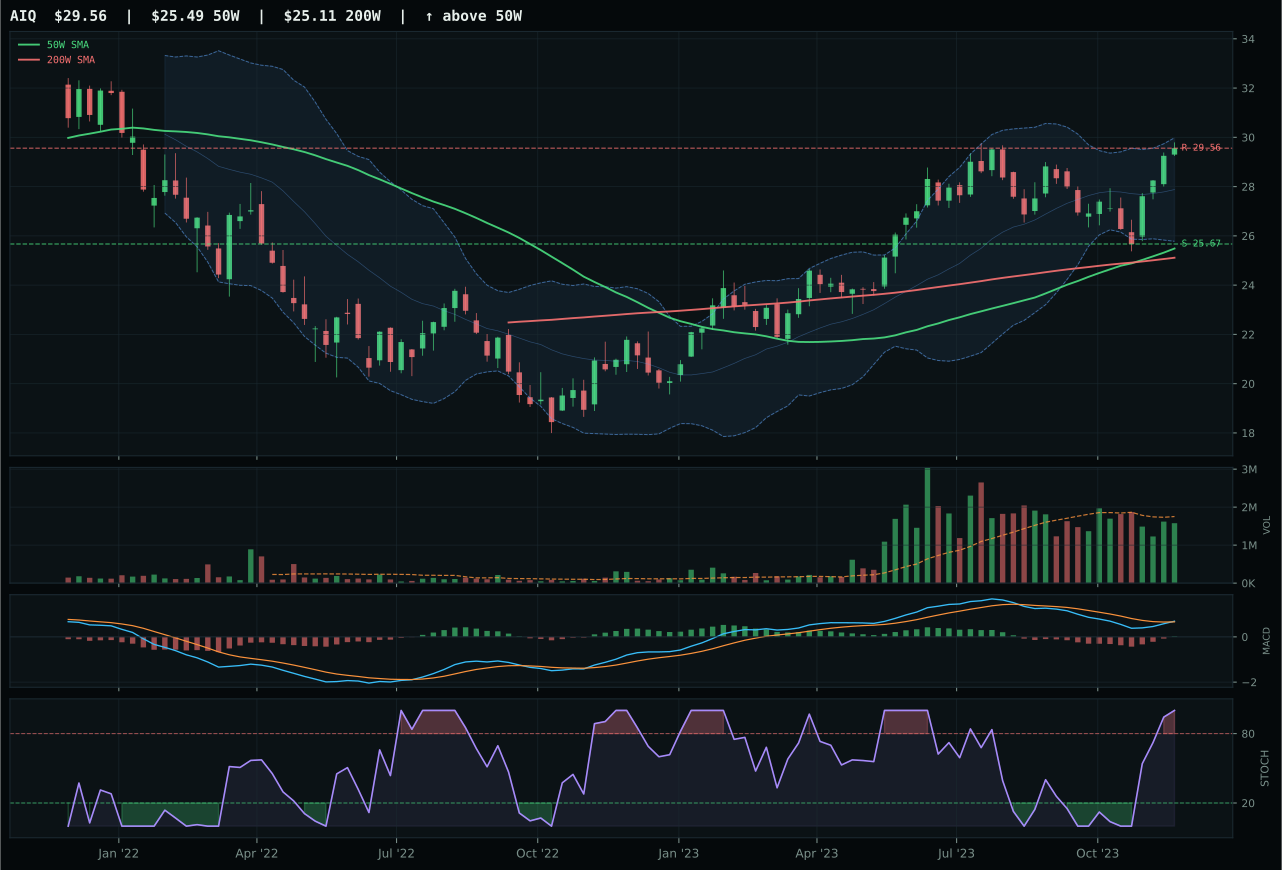
AIQ has a vertical extension profile with 3.9% 13-week relative strength versus SPY.
A failed hold above support would weaken the setup.
Actionable but governed by invalidation levels.
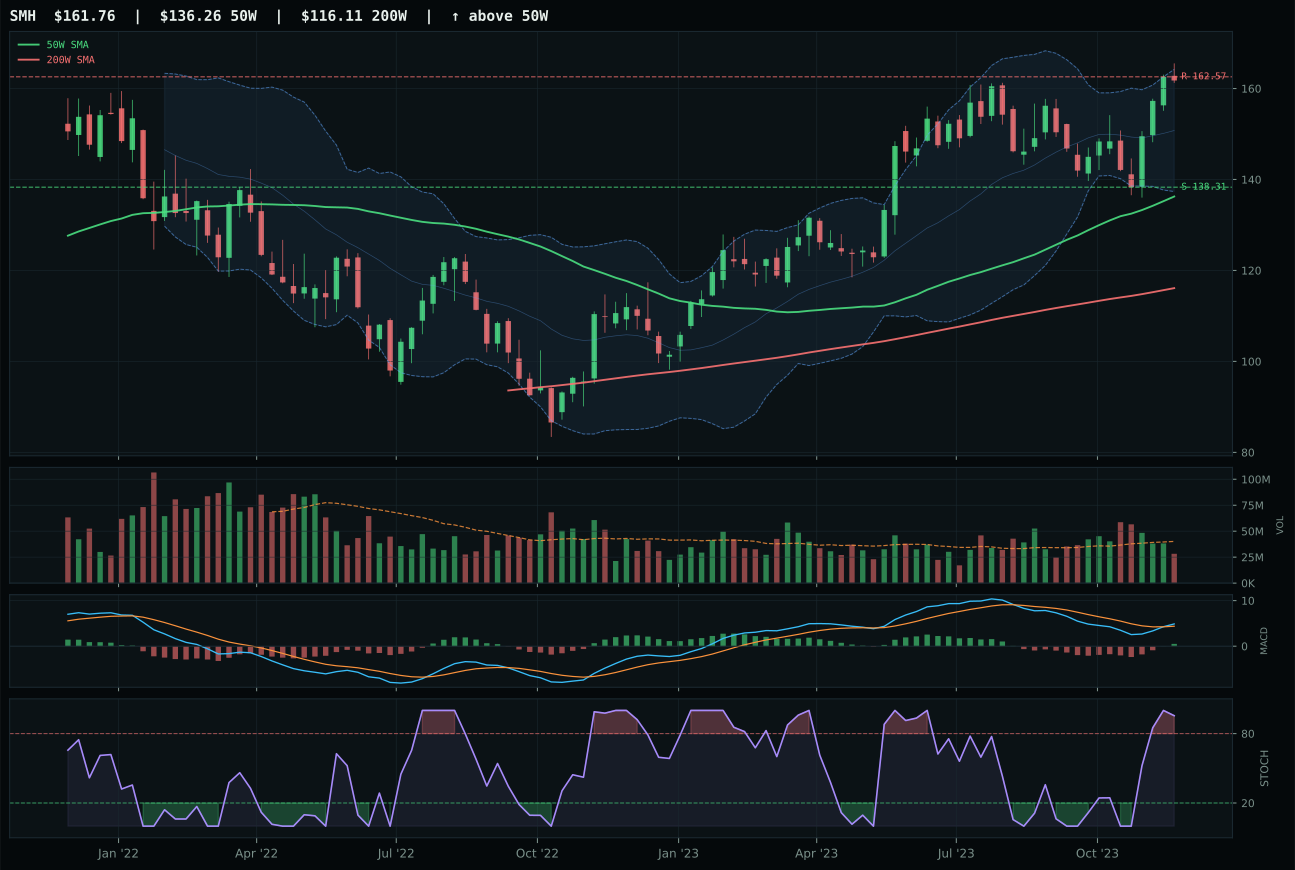
SMH has a vertical extension profile with 5.0% 13-week relative strength versus SPY.
A failed hold above support would weaken the setup.
Actionable but governed by invalidation levels.
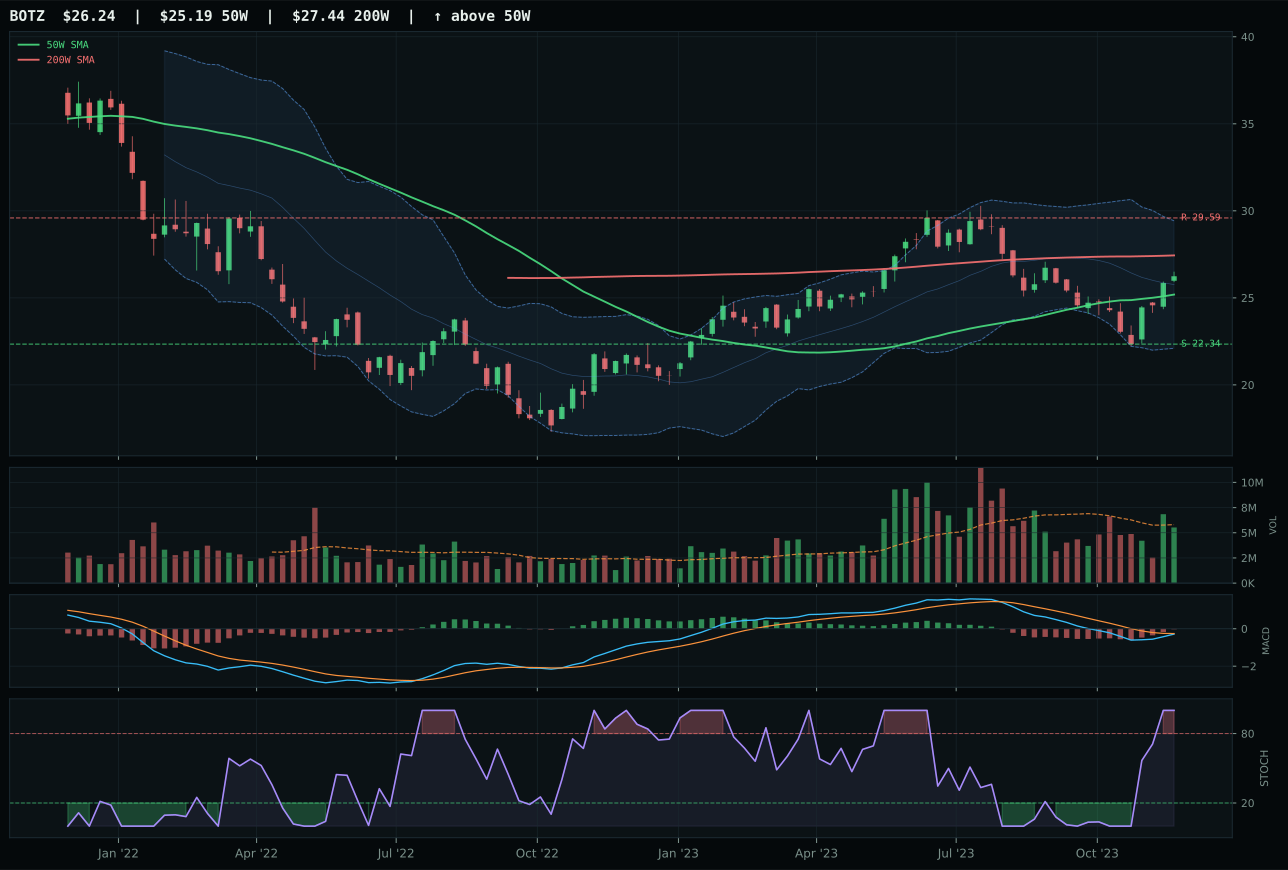
BOTZ has a neutral structure profile with -1.7% 13-week relative strength versus SPY.
A failed hold above support would weaken the setup.
Actionable but governed by invalidation levels.
BOTZ won a tight race by offering superior timing and risk-reward, despite trailing in absolute momentum and relative strength. Price at 4.2% below the 50W and sitting in the Fibonacci 0.382 retracement zone (the middle decision point) delivered a 90.0 timing score versus AIQ's 37.0, which had already stretched 16.0% above its 50W. BOTZ's risk-reward tilted better at 64.7 versus 46.5 because downside to support was 17.5% while upside was capped, whereas AIQ was offering negative asymmetry into an already-extended zone. The MACD is still improving and stochastic is overbought on both, but BOTZ's neutral structure (71.3) and slightly cleaner compression allow the allocator to own robotics and physical AI cyclicality without fighting the tape on entry.
AI earned the second 10% allocation slot at 61.8, placing it among the top two categories despite being the weaker performer technically compared to Technology. The macro case is compelling: AI growth sponsorship contributes +14 and risk appetite positive adds +10, which vastly outweighs the -12 liquidity stress and -8 credit stress headwinds. The category-level macro fit of 59.0 reflects strong narrative support even though technical evidence checks in at 63.9. BOTZ's positioning inside support (rather than above resistance) makes it a lower-risk entry than extended peers, and the improving MACD suggests accumulation has begun. However, this 10% weight assumes support holds near 22.34. The 73.7% momentum confirmation and 49.4% persistence scores reveal this is a mean-reversion setup relying on macro sponsorship and support defense—not a sustained breakout. If the 200W breaks, this entire allocation becomes questionable; the macro tailwind alone cannot overcome broken trend. This is a conviction call on disinflation favoring AI capex despite current technical weakness.
Nuclear Energy — URNM
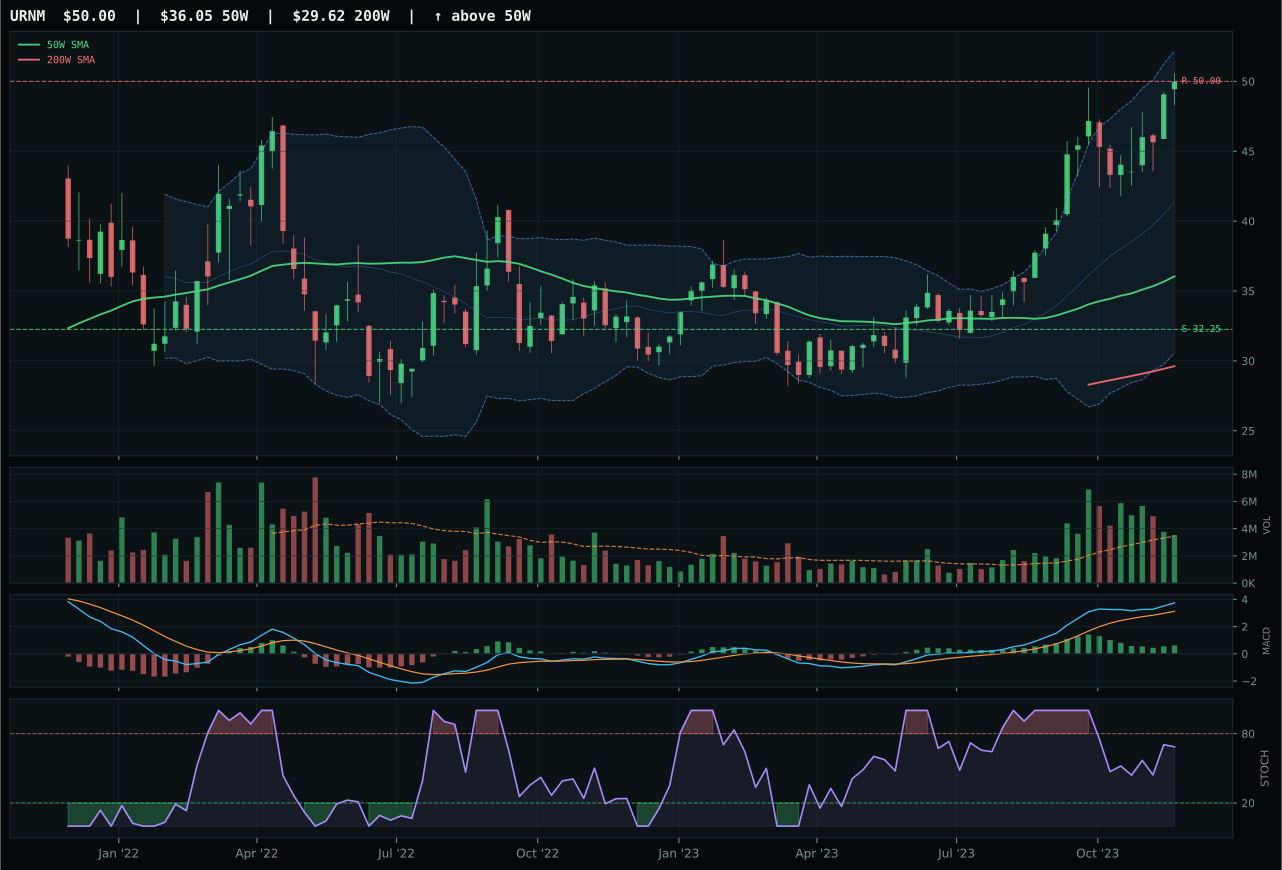
URNM has a vertical extension profile with 29.0% 13-week relative strength versus SPY.
A failed hold above support would weaken the setup.
Actionable but governed by invalidation levels.
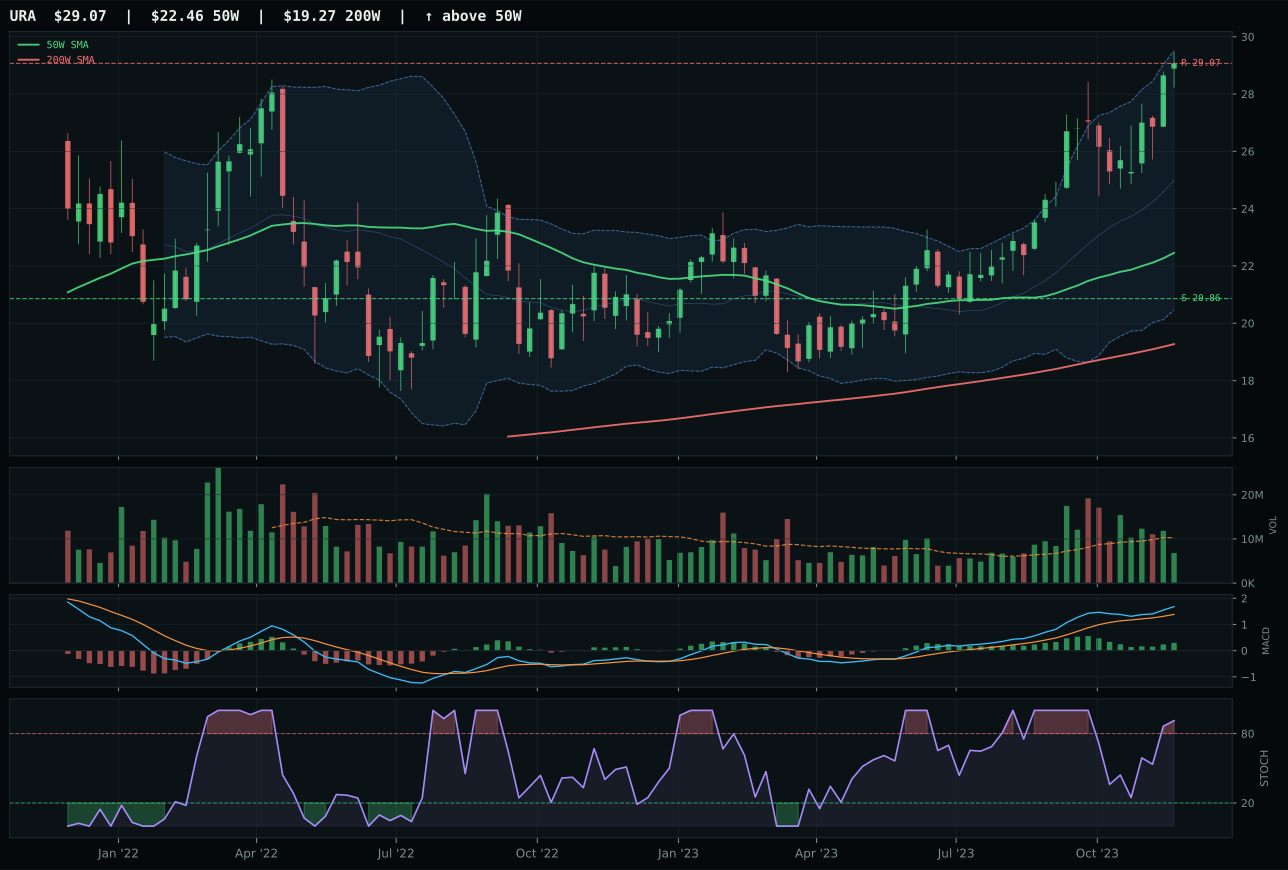
URA has a vertical extension profile with 20.1% 13-week relative strength versus SPY.
A failed hold above support would weaken the setup.
Actionable but governed by invalidation levels.
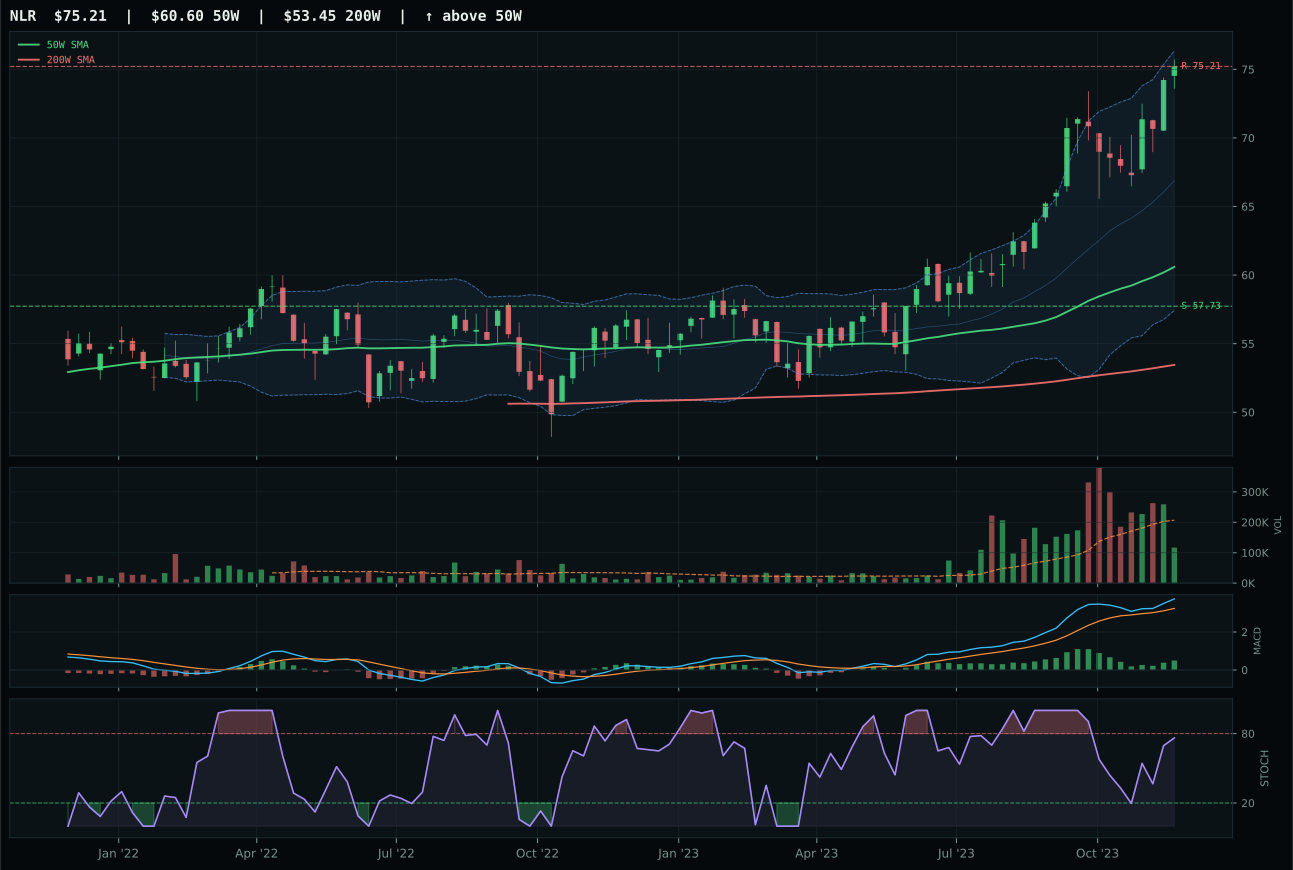
NLR has a vertical extension profile with 14.4% 13-week relative strength versus SPY.
A failed hold above support would weaken the setup.
Actionable but governed by invalidation levels.
URNM crushes its category with dominant trend (100.0) and momentum confirmation (100.0) driven by a 32.5% 13-week return and 29.0% SPY-relative strength, though extended valuation is the only brake on a higher score. Price sits 38.7% above the 50W, which delivers a timing penalty of 53.0 because new buyers are late to the party; the risk-reward is skewed unfavorably at 0.0% upside to resistance and 55.0% downside to support. Despite this geometry, URNM's volume-price confirmation is strong at 78.4 and persistence is exceptional at 96.0, telling you that uranium-miner accumulation is happening across multiple time frames, not just a four-week spike. URA lost because it triggered overbought stochastic momentum (vs URNM's rising mid-zone) and had weaker timing (37.0 vs 53.0), which reflects a less-optimal Fibonacci zone. The category representative is a pure momentum play: the question is not whether the thesis is working, but whether the extension has room to run.
Nuclear Energy earned 5% allocation on a 58.3 score, ranking 2nd or 3rd among non-top-2 categories. The macro fit of 43.0 is moderate—AI growth sponsorship contributes +5 (nuclear for data centers is gaining narrative), but liquidity stress (-7) and credit stress (-5) offset half the benefit. Technical evidence dominates at 81.7, driven by URNM's perfect trend (100.0), exceptional momentum (100.0), and clean persistence (96.0). The 32.5% 13W return and 29.0% RS versus SPY show this is not a narrative play—money is actually flowing in. The only warning is entry risk: 38.7% extension above the 50W means every new buyer is paying top-of-range, and resistance sits at 50.00 with upside to resistance at 0.0% (already there). This position should be held, not enlarged. If URNM breaks below the 50W at 32.25, risk/reward inverts (55% downside, no upside), and the allocation must be cut. For now, URNM benefits from both momentum and narrative (clean energy for AI)—a rare combination. This is tactically held at 5% pending support confirmation.
Precious Metals — GLD
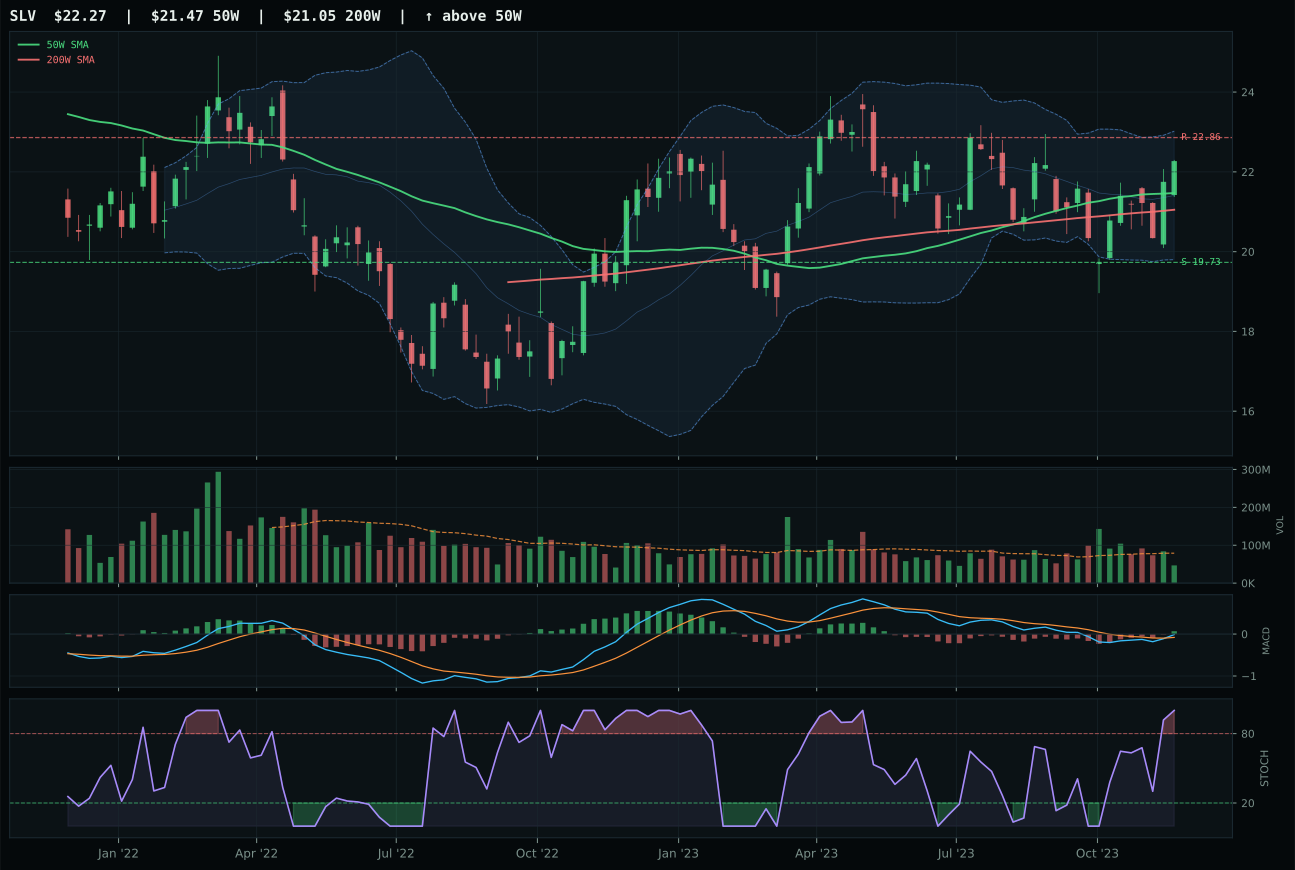
SLV has a neutral structure profile with -3.3% 13-week relative strength versus SPY.
A failed hold above support would weaken the setup.
Actionable but governed by invalidation levels.
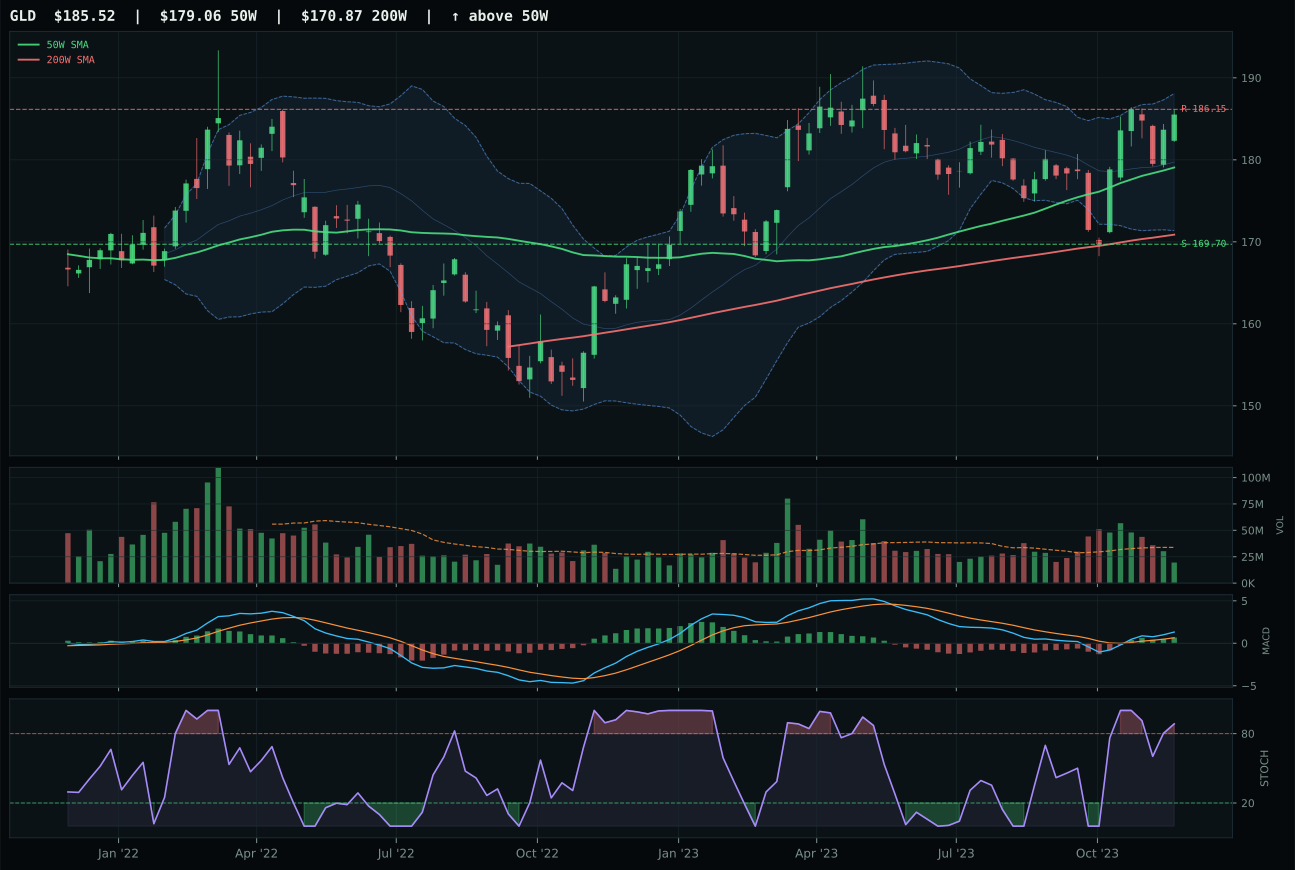
GLD has a neutral structure profile with 1.0% 13-week relative strength versus SPY.
A failed hold above support would weaken the setup.
Actionable but governed by invalidation levels.
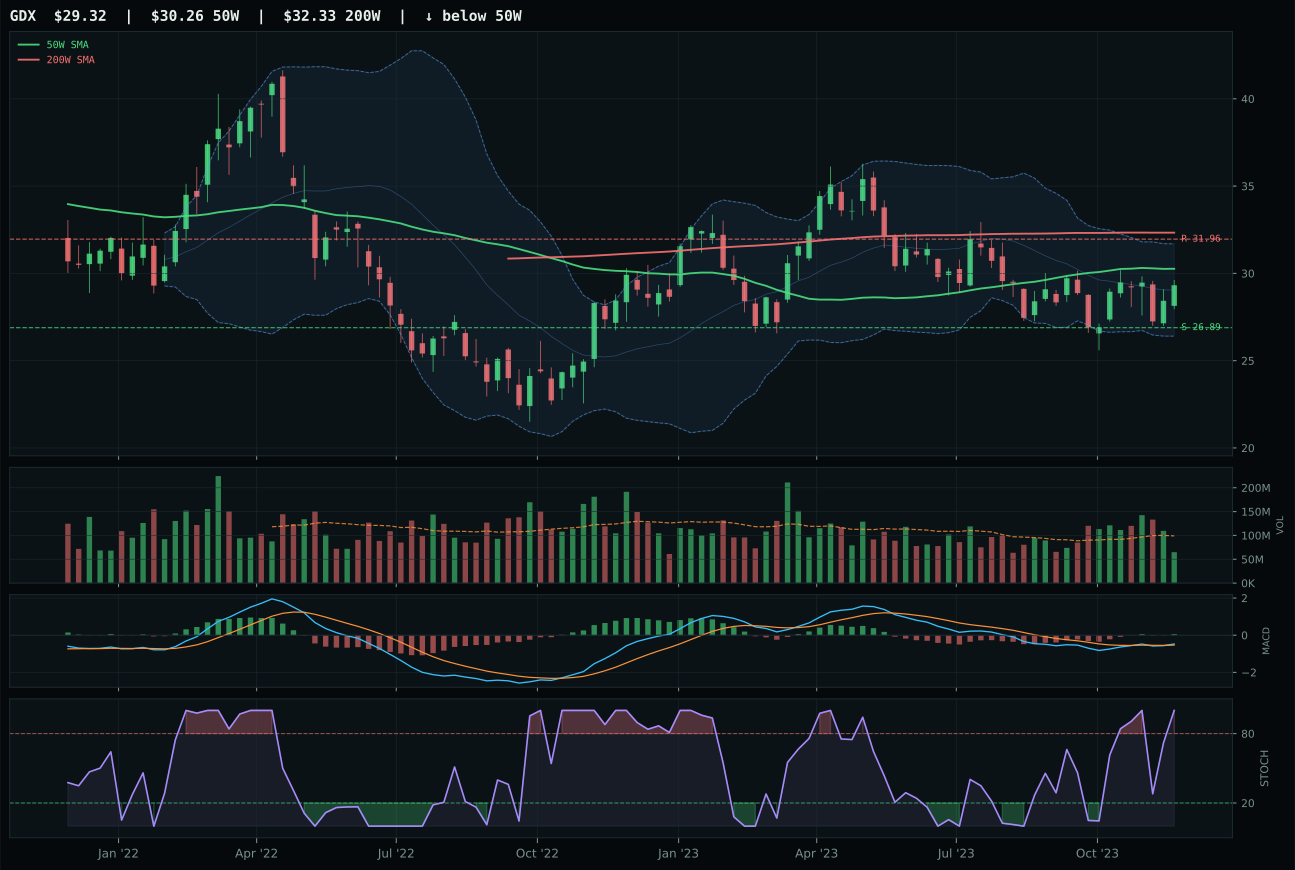
GDX has a neutral structure profile with -0.2% 13-week relative strength versus SPY.
Extension and support failure are the main tactical risks.
Tracked, but not top-2 eligible because: structurally broken.
GLD narrowly edges SLV with a 0.7-point win in a tight race between two bullish, overbought charts. Both are above the 50W and 200W with improving MACD, but GLD's structure is 2.7 points cleaner (73.9 vs 71.2) and category-relative strength is +1.2% versus SLV's -3.0%, a 4.2-point swing. GLD's 4.4% 13-week return and +1.0% SPY relative strength show the yellow metal is being accumulated into the disinflation trade, whereas silver's hybrid monetary-and-industrial beta is suffering as industrial growth expectations fade. Both face timing penalties for being extended (GLD 3.6% from 50W, SLV similar), but GLD's stochastic is rolling over more gracefully (0.88 vs overbought momentum), suggesting less imminent pressure. The portfolio choice here is the cleanest monetary hedge over the messier industrial play.
Precious Metals earned a 5% allocation slot on a 53.0 score, ranking 4th among ten categories and reflecting its defensive but useful role in a disinflation regime. The macro fit of 60.0 supports it: disinflation helps at +8, disinflation pressure contributes +6, and these positive signals outweigh the -4 risk appetite penalty. GLD functions as a monetary hedge when rate cuts loom and credit stress is active (-9 at the category level suggests crowded credit positioning). Technical evidence at 62.5 is solid but not dominant—trend is clean (100.0), but timing (72.0) and risk/reward (45.6) are moderate, showing limited upside past resistance at 186.15. The position sits 3.6% above the 50W with just -0.3% upside to resistance, making it tactically full. Allocation here is strategic (macro insurance against credit deterioration) rather than tactical (momentum chase). Reduce or eliminate if the disinflation narrative reverses or if rate-cut expectations fade; hold if credit stress signals intensify. This is portfolio ballast, not alpha generation.
Utilities & Infrastructure — PAVE
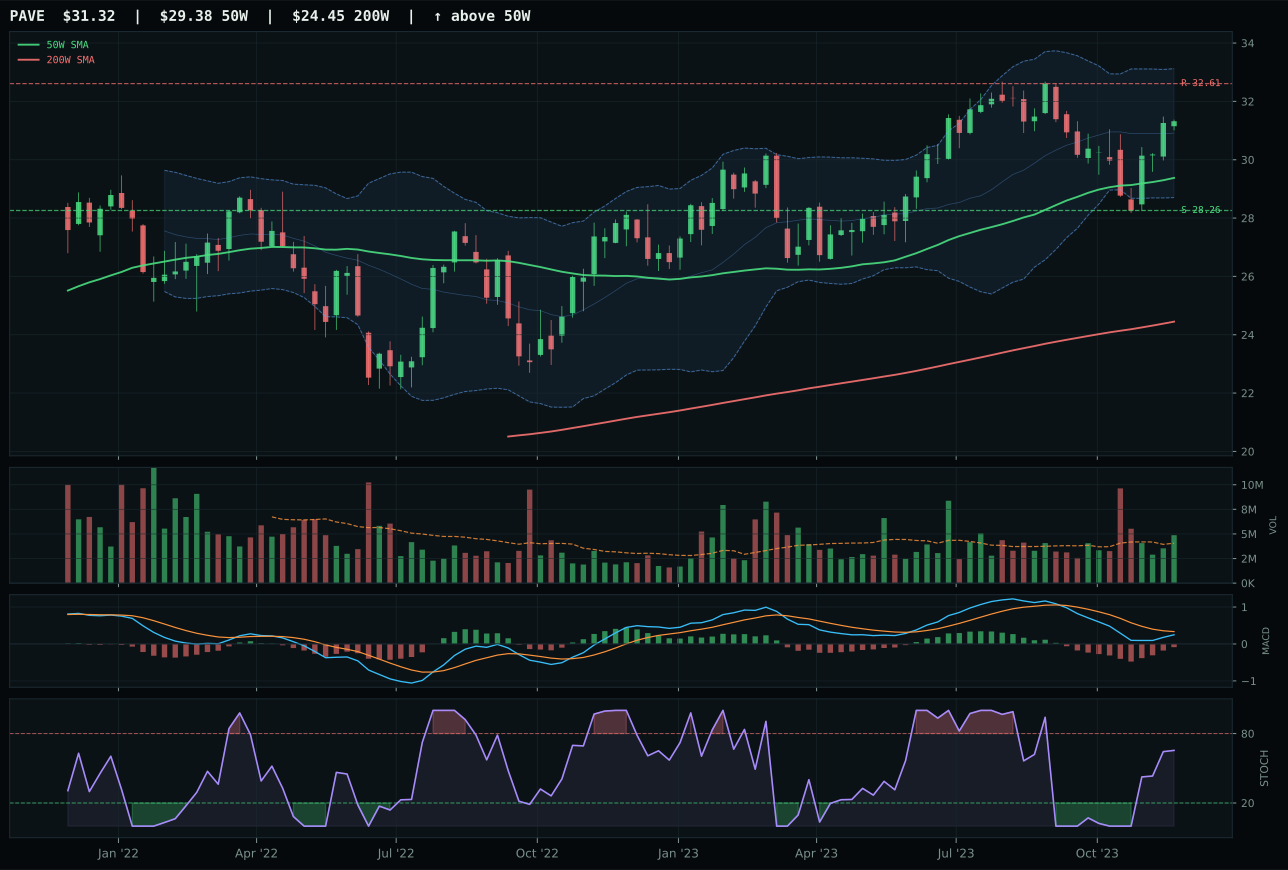
PAVE has a neutral structure profile with -4.0% 13-week relative strength versus SPY.
A failed hold above support would weaken the setup.
Actionable but governed by invalidation levels.
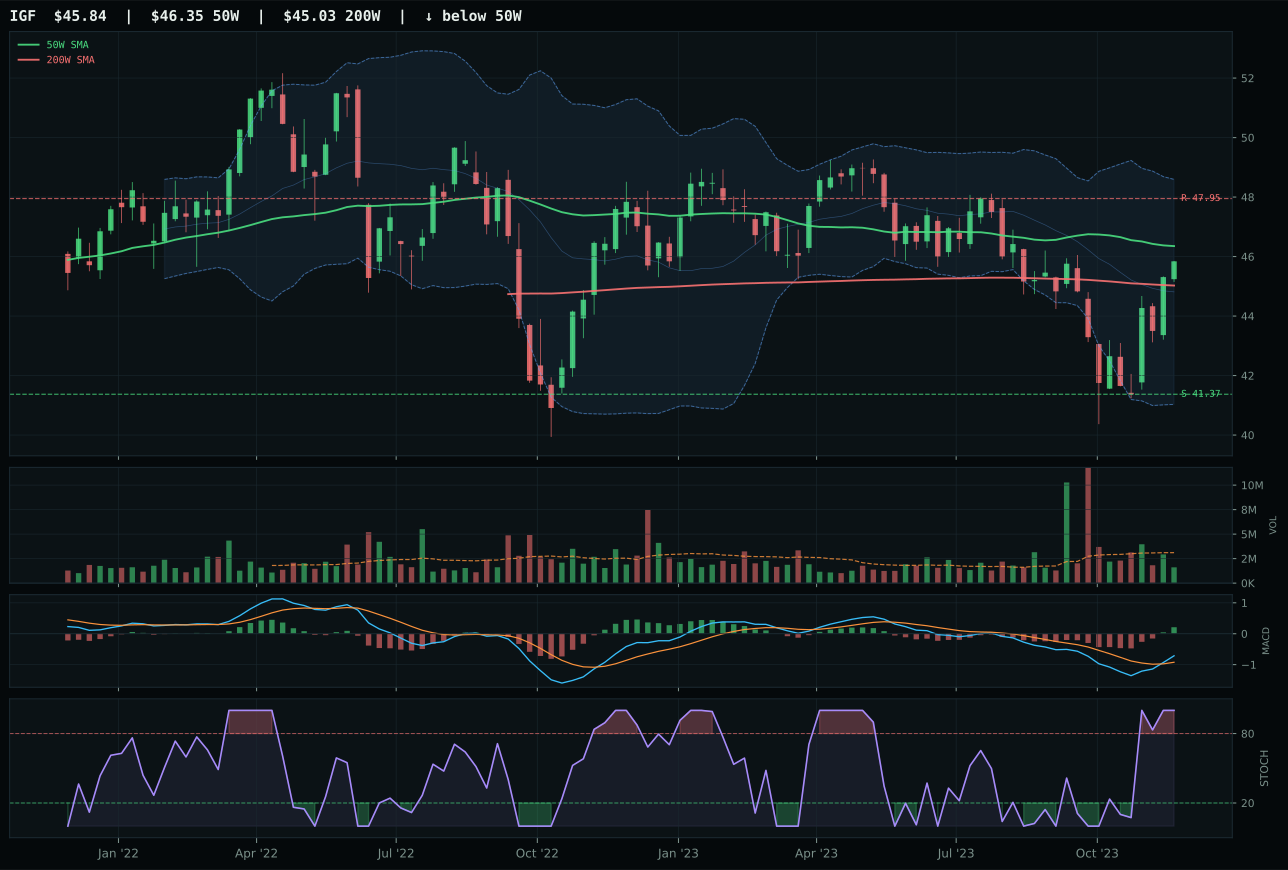
IGF has a compression near 50W profile with -2.1% 13-week relative strength versus SPY.
A failed hold above support would weaken the setup.
Actionable but governed by invalidation levels.
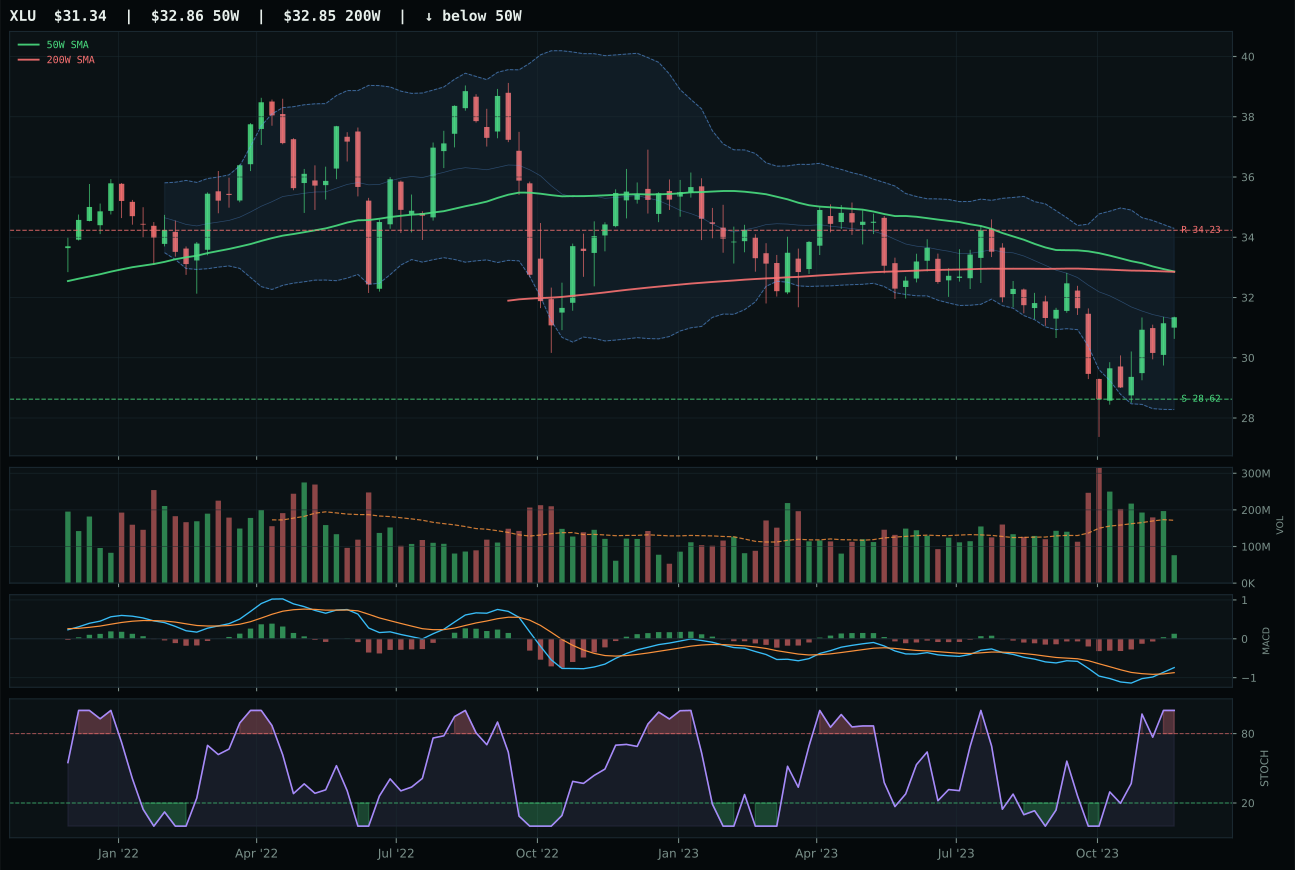
XLU has a neutral structure profile with -5.0% 13-week relative strength versus SPY.
A failed hold above support would weaken the setup.
Actionable but governed by invalidation levels.
PAVE wins against IGF through superior structure and volume sponsorship, earning the category representative slot by 1.8 points. Both are bullish above the 50W and 200W, but PAVE's structure is cleaner at 72.2 versus 68.1, and PAVE alone has above-average volume participation at 1.20x 20W average—meaningful accumulation—versus IGF's thin participation. PAVE's stochastic RSI is rising mid-zone (0.65) while IGF's is overbought momentum, a timing advantage that suggests PAVE has room to extend before rolling over. MACD is improving on both, but PAVE's -0.5% 13-week return and 10.8% four-week return show domestic infrastructure capex is accelerating despite the macro headwinds, whereas IGF's 1.4% 13W and later timing suggest global infrastructure is a follower play. The volume confirmation is decisive: you cannot ignore a 1.20x participation ratio when other candidates offer only 0.5–0.8x.
Utilities & Infrastructure earned 5% allocation on a 52.9 score, ranking 4th or 5th and reflecting its defensive but improving status. The macro fit of 62.0 supports it: disinflation helps at +7, transition/mixed regime contributes +4, and disinflation pressure adds +6, outweighing liquidity stress (-3) and risk appetite negative (-2). This is a classic disinflation winner—bond proxies and infrastructure (capex-dependent, floating-rate exposed) attract capital when rate-cut cycles begin. Technical evidence at 74.0 is strong, driven by clean trend (87.0), good timing (83.0), and PAVE's unique above-average volume (66.2). Risk/reward at 51.6 is moderate (-4% to resistance, 10.8% to support), but the setup is solid. The position should be held; PAVE is tactically recovering from recent weakness and benefiting from both macro (disinflation) and technical (volume) confirmation. Scale into PAVE if MACD crosses into bullish-and-improving and stochastic RSI approaches mid-zone at 0.50; trim if volume drops back below 1.0x average. This is a core allocation for a disinflation portfolio—not exciting but essential.
Defense & Aerospace — XAR
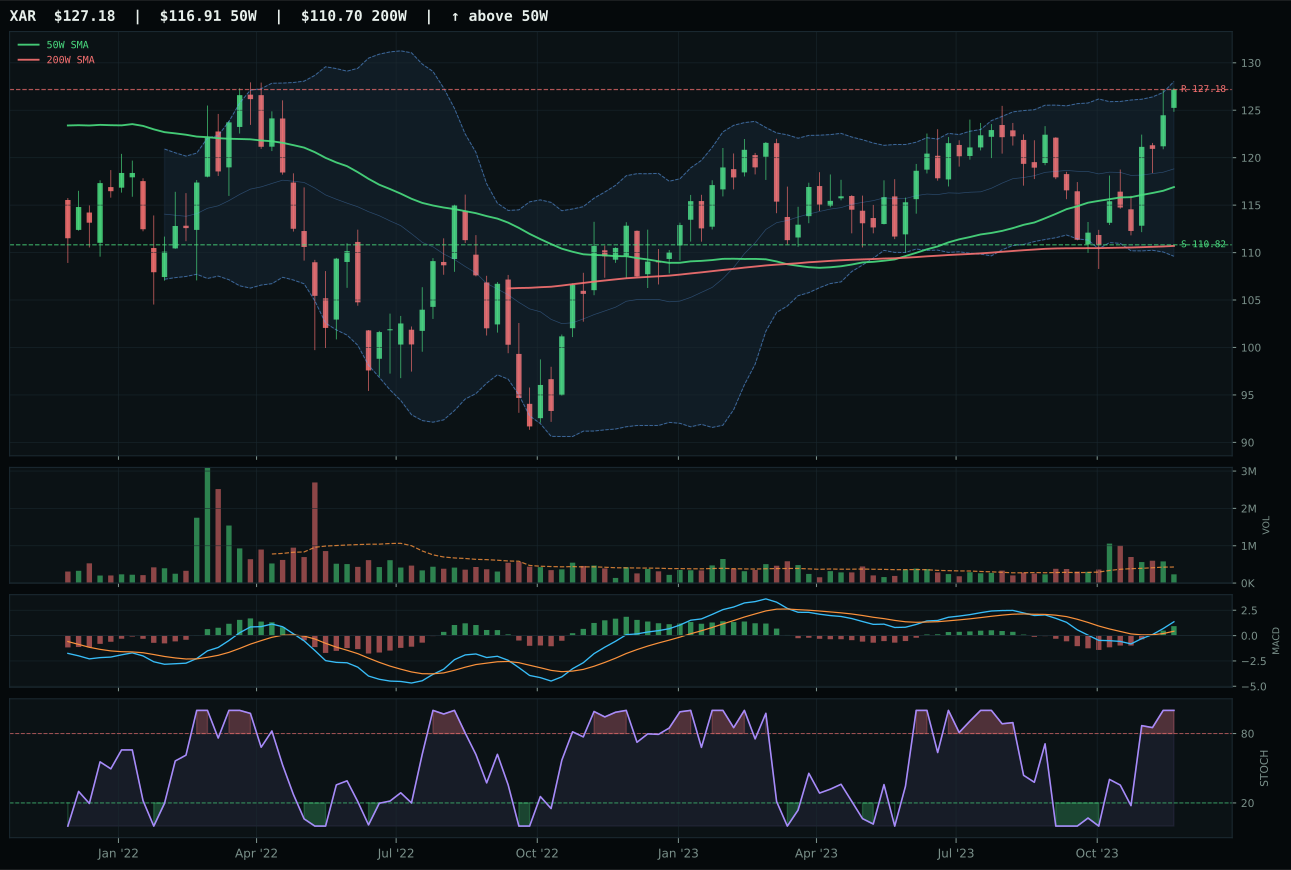
XAR has a neutral structure profile with 3.4% 13-week relative strength versus SPY.
A failed hold above support would weaken the setup.
Actionable but governed by invalidation levels.
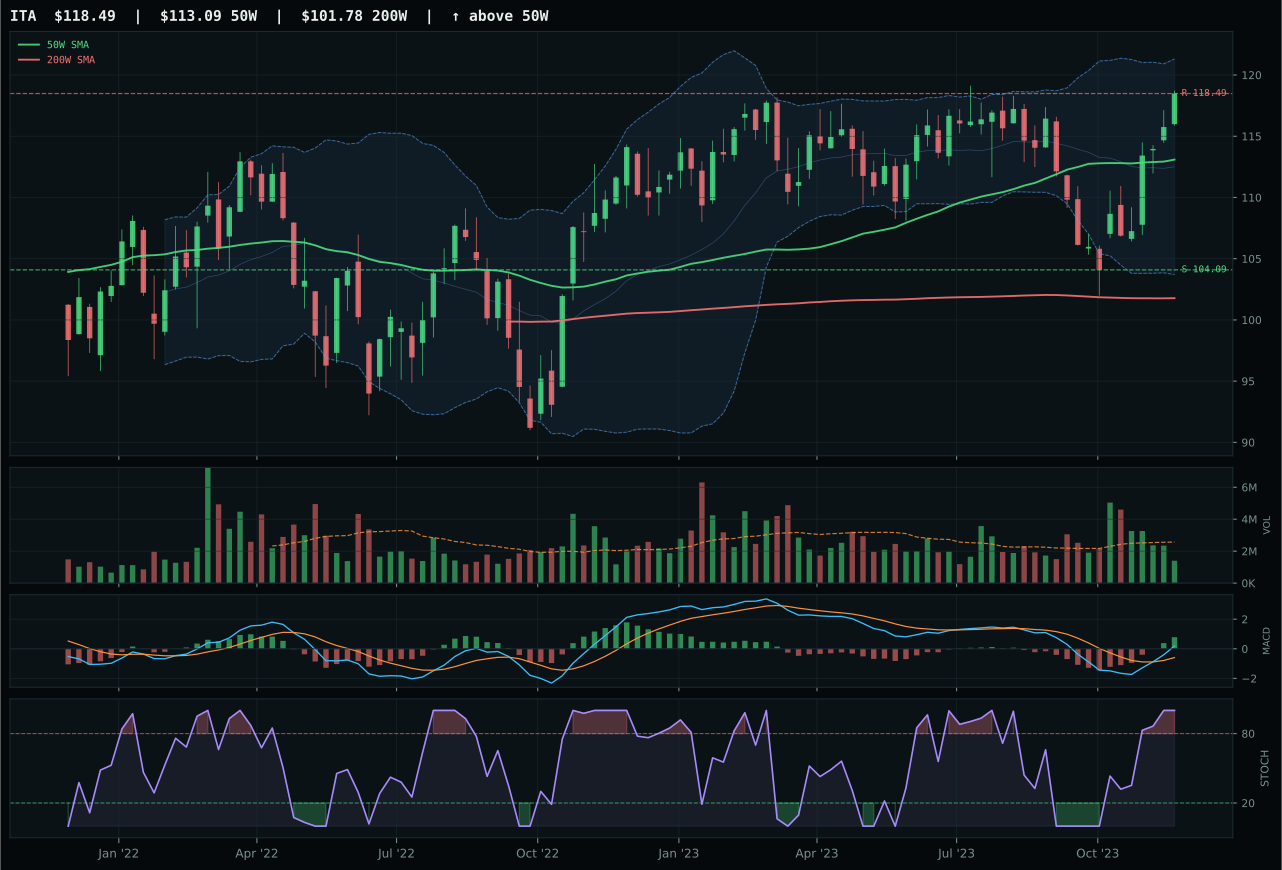
ITA has a neutral structure profile with 0.4% 13-week relative strength versus SPY.
A failed hold above support would weaken the setup.
Actionable but governed by invalidation levels.
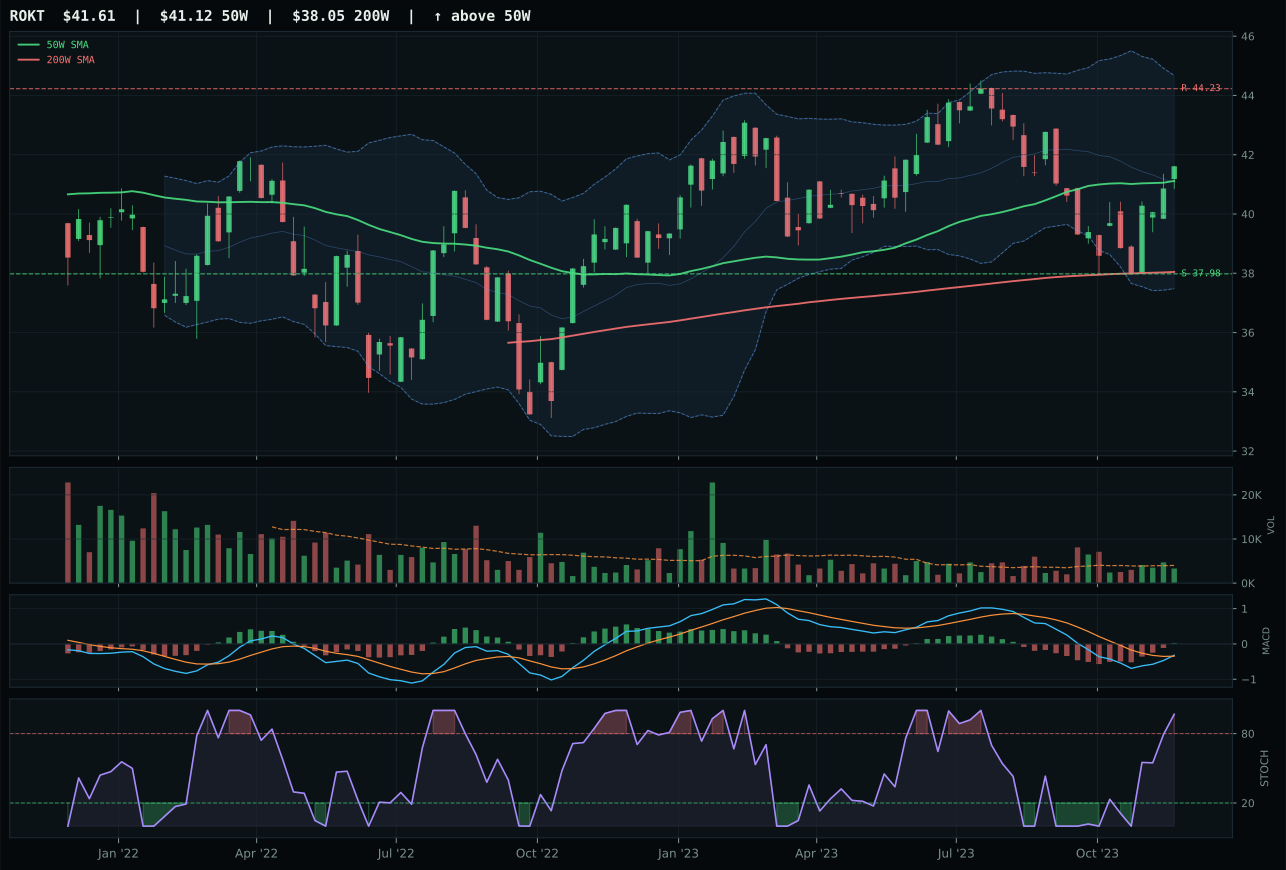
ROKT has a compression near 50W profile with -2.9% 13-week relative strength versus SPY.
A failed hold above support would weaken the setup.
Tracked, but not top-2 eligible because: .
XAR edges ITA by 1.2 points through category-relative strength and marginally cleaner structure. Both are bullish above the 50W and 200W with MACD improving and stochastic overbought, but XAR's 3.0% category-relative strength beats ITA's 0.0%, and the structure score of 67.6 exceeds ITA's 67.1. Volume is thin participation for both, which dampens conviction, but XAR's 6.9% 13-week return and 3.4% SPY relative strength tell you that aerospace and defense prime contractors are being accumulated by the marginal buyer. This is not a deep conviction win, but in a macro environment where liquidity stress and credit stress are active headwinds, a 3-point structure edge and category leadership matter for portfolio construction.
Defense & Aerospace earned a 5% slot—a mid-tier allocation reflecting its 52.8 score and ineligibility for top-2. The macro fit of 51.0 is neutral; the category lacks a strong narrative tailwind, with credit stress (+2) barely offsetting liquidity stress (-4). Technical evidence pulls harder at 74.1, driven entirely by XAR's clean trend setup and 97.5% momentum confirmation. Ranked 3rd or 4th among the ten categories, this position sits at portfolio margin: it deserves capital because the trend is intact and momentum is real, but it lacks the macro sponsorship of top-tier holdings. XAR's thin volume (0.55x average) and near-resistance positioning (resistance at 127.18 versus price at 122.35) suggest limited runway before the setup needs to prove itself through a new base. Allocation here is defensive—a trend-following hedge rather than a conviction macro call. Any downside break below the 50W would trigger a position review; this is tactically held, not strategically committed.
Emerging Markets — ILF
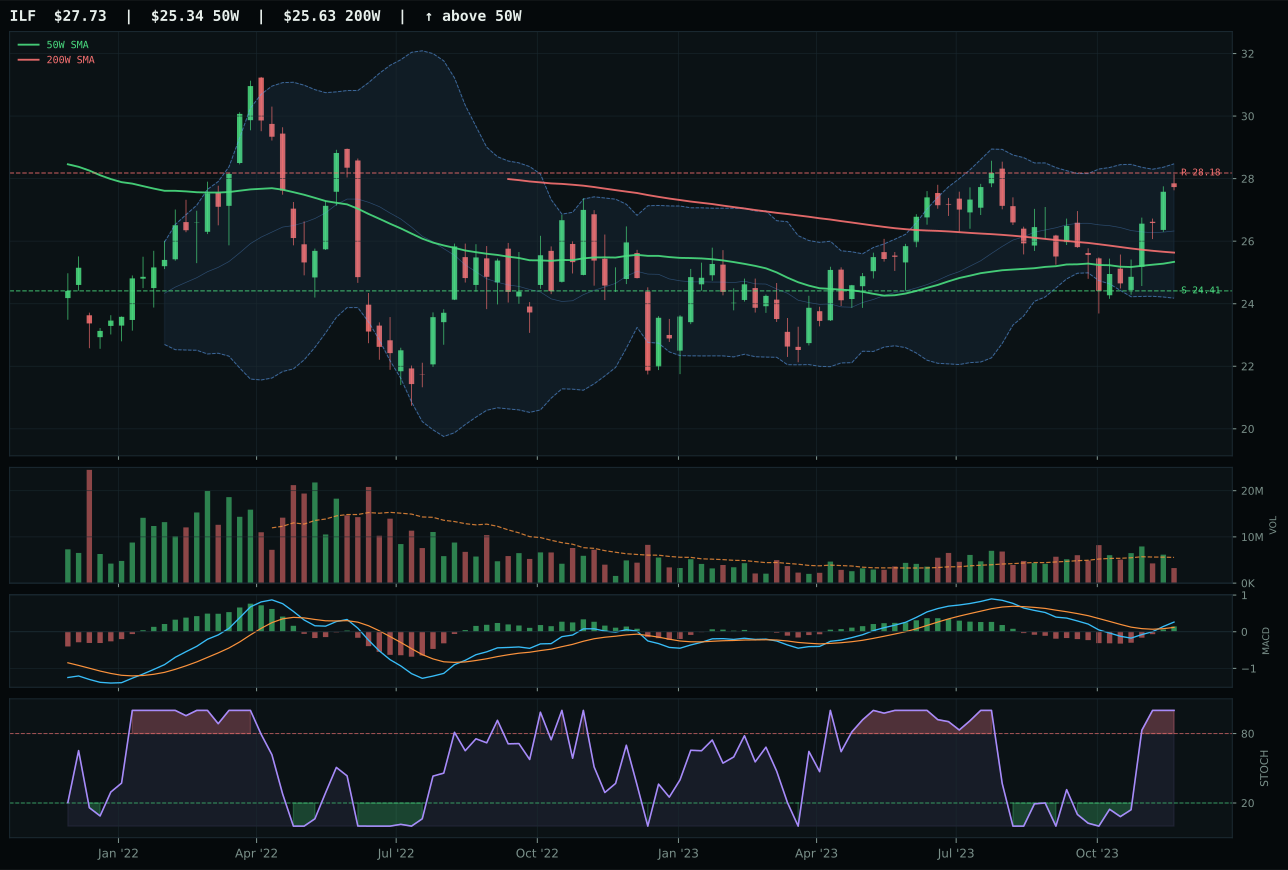
ILF has a neutral structure profile with 1.4% 13-week relative strength versus SPY.
A failed hold above support would weaken the setup.
Actionable but governed by invalidation levels.
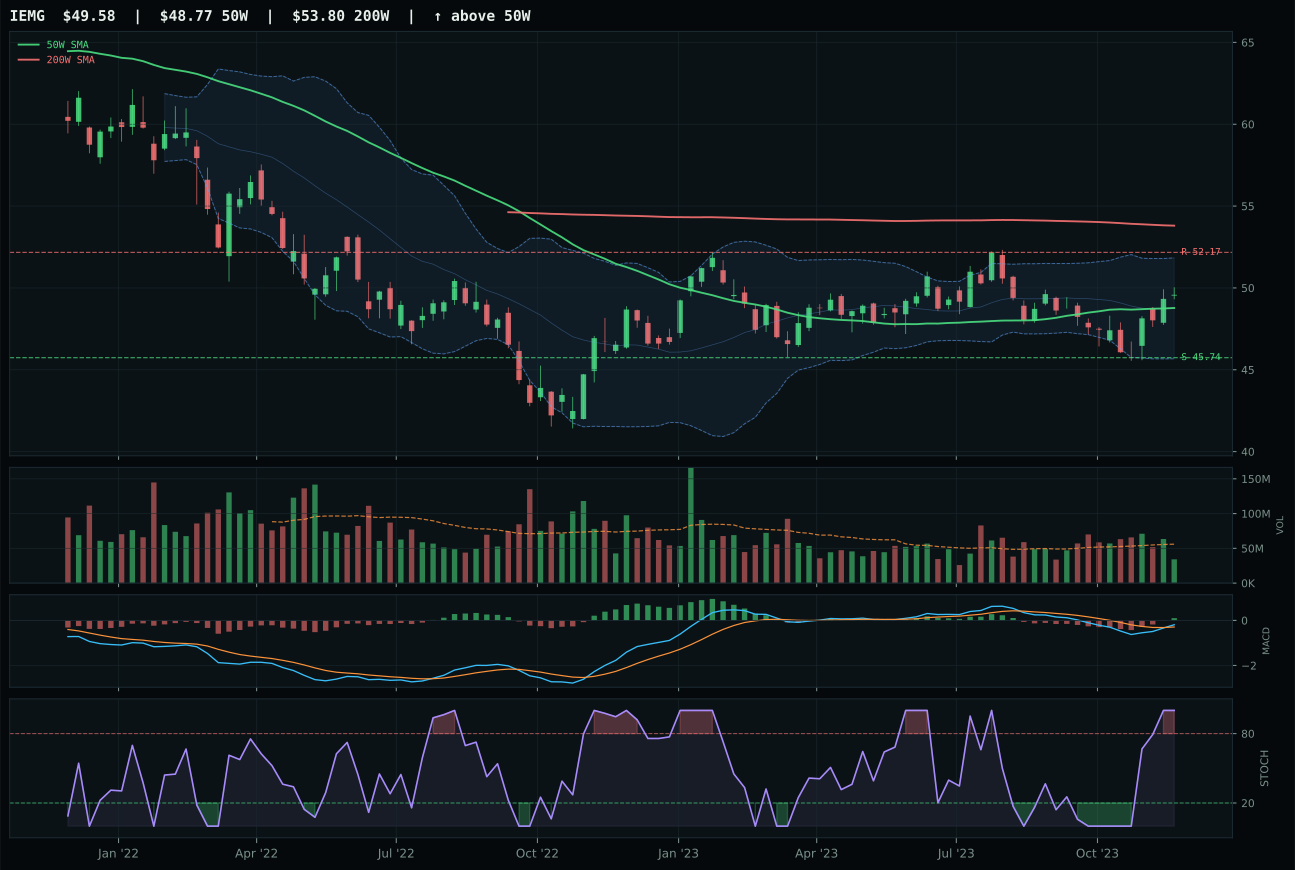
IEMG has a compression near 50W profile with -1.7% 13-week relative strength versus SPY.
A failed hold above support would weaken the setup.
Actionable but governed by invalidation levels.
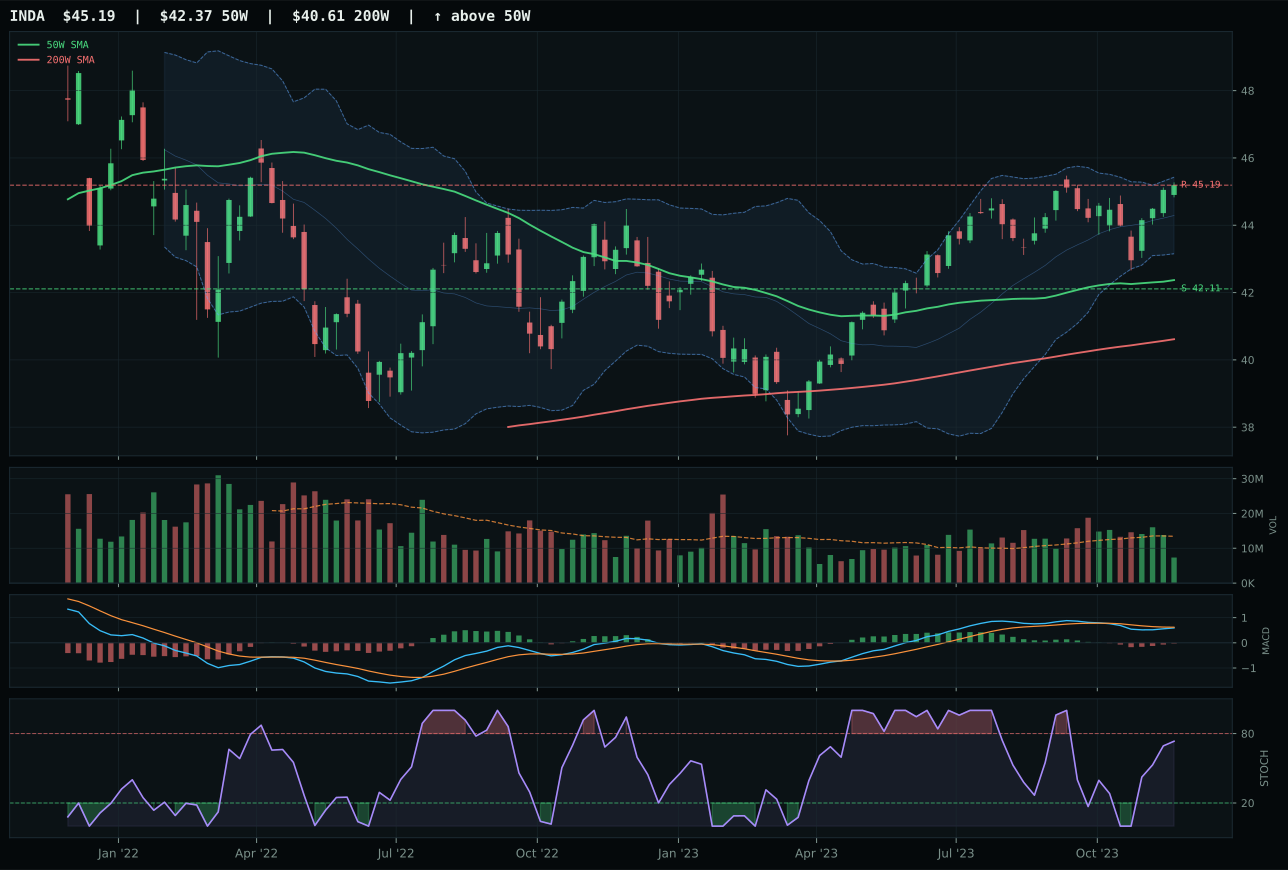
INDA has a neutral structure profile with -0.2% 13-week relative strength versus SPY.
A failed hold above support would weaken the setup.
Actionable but governed by invalidation levels.
ILF edges IEMG by 1.4 points in a close technical race, with the gap driven entirely by structure cleanliness and category-relative strength. ILF is 9.4% above the 50W with a neutral structure scoring 71.9 versus IEMG's 66.2, and ILF's 1.6% category-relative strength beats IEMG's -1.5%. Both are bullish above the 50W and 200W with improving MACD and overbought stochastic RSI at the Fibonacci 0.236 upper retracement zone, but ILF's 4.8% 13-week return and 11.5% four-week return show momentum gathering rather than peaking. IEMG's compression setup is theoretically better for mean reversion, but IEMG's thinner breadth (1.8% 13W vs 4.8%) and lower four-week velocity (unspecified vs 11.5%) indicate Latin America is outperforming broad emerging markets. The portfolio is favoring regional commodity and value beta over core EM diversity.
Emerging Markets earned 5% allocation on a 31.6 score, ranking lower (6th or 7th) and reflecting caution given strong macro headwinds. The category macro fit of 38.0 shows credit stress (-10) and liquidity stress (-10) are severe, partially offset by risk appetite positive at +8. Technical evidence at 69.1 is solid (ILF's 92.0 trend and 86.8 momentum confirmation), but it cannot overcome the macro regime's uncertainty toward emerging economies. ILF's -4.0% RS versus SPY shows this position is lagging the broad market—outperforming its peers does not mean outperforming the S&P. This allocation is portfolio ballast: diversification into non-USD exposure without aggressive conviction. If credit stress signals ease or if emerging-market relative strength improves (RS turns positive), scale into ILF. For now, hold 5% as a diversification hedge, knowing that top-tier capital (Technology, AI) will flow to dollar-based domestic growth. ILF is a 'hope' position rather than a 'confidence' position; reduce if credit stress intensifies, maintain if volatility remains.A
Industrial Metals — PICK
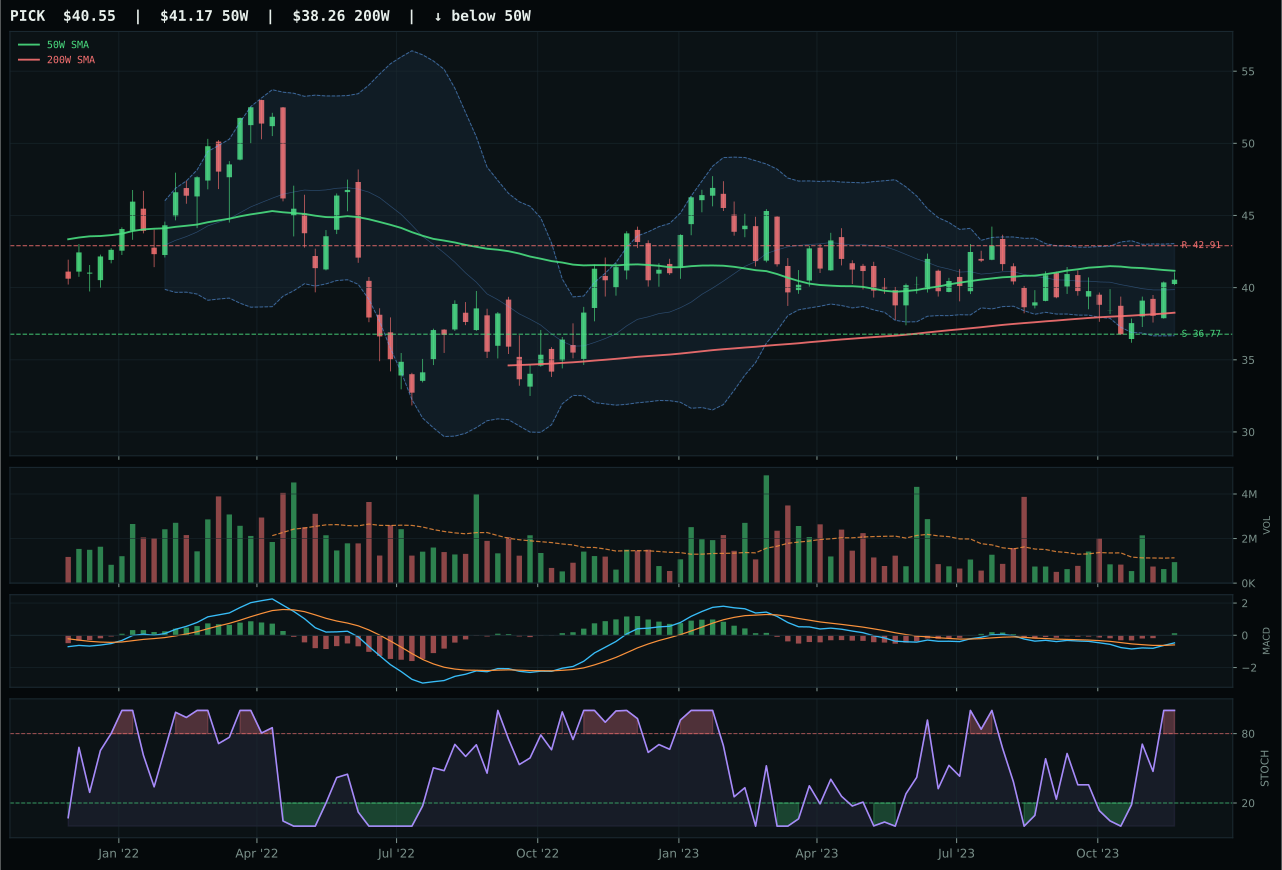
PICK has a compression near 50W profile with 0.5% 13-week relative strength versus SPY.
A failed hold above support would weaken the setup.
Actionable but governed by invalidation levels.
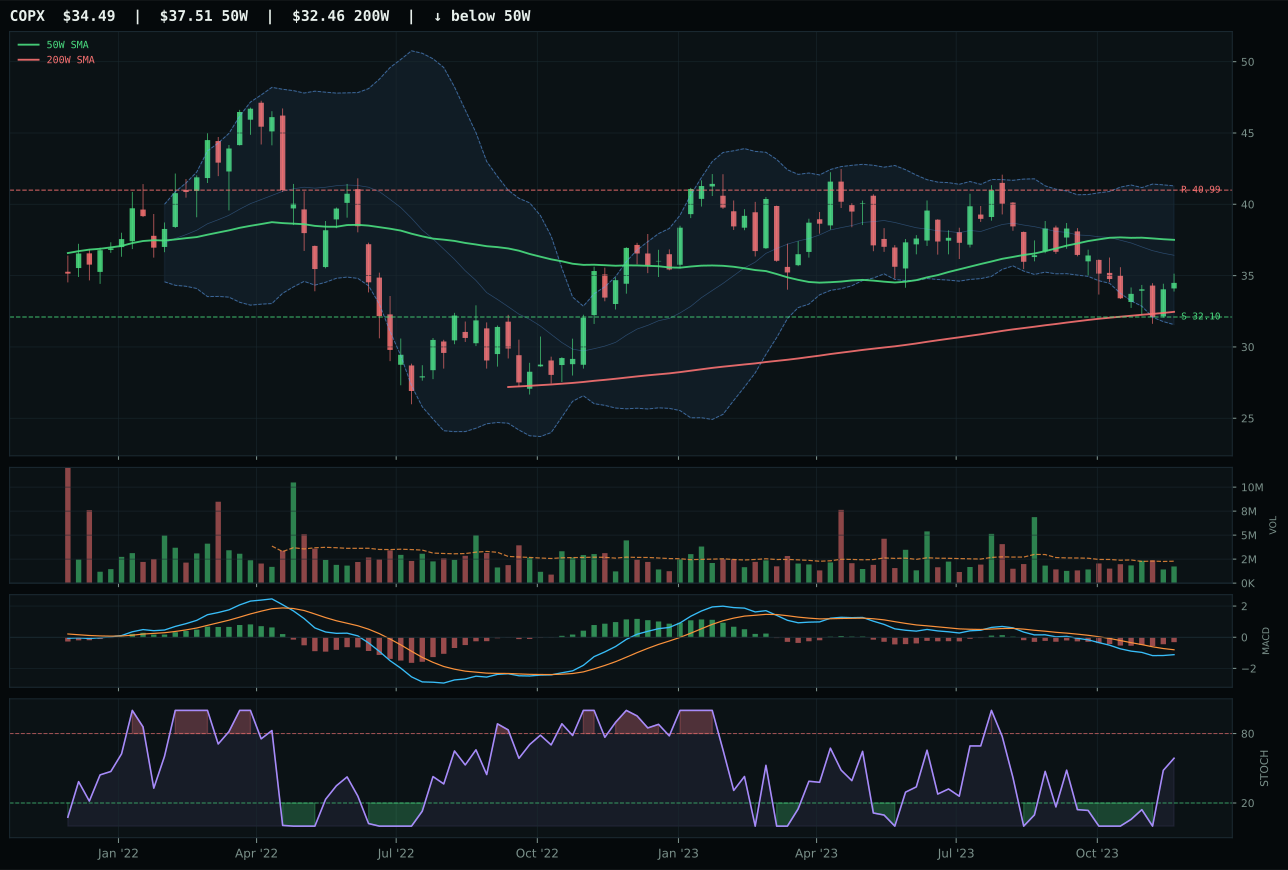
COPX has a neutral structure profile with -8.8% 13-week relative strength versus SPY.
A failed hold above support would weaken the setup.
Actionable but governed by invalidation levels.
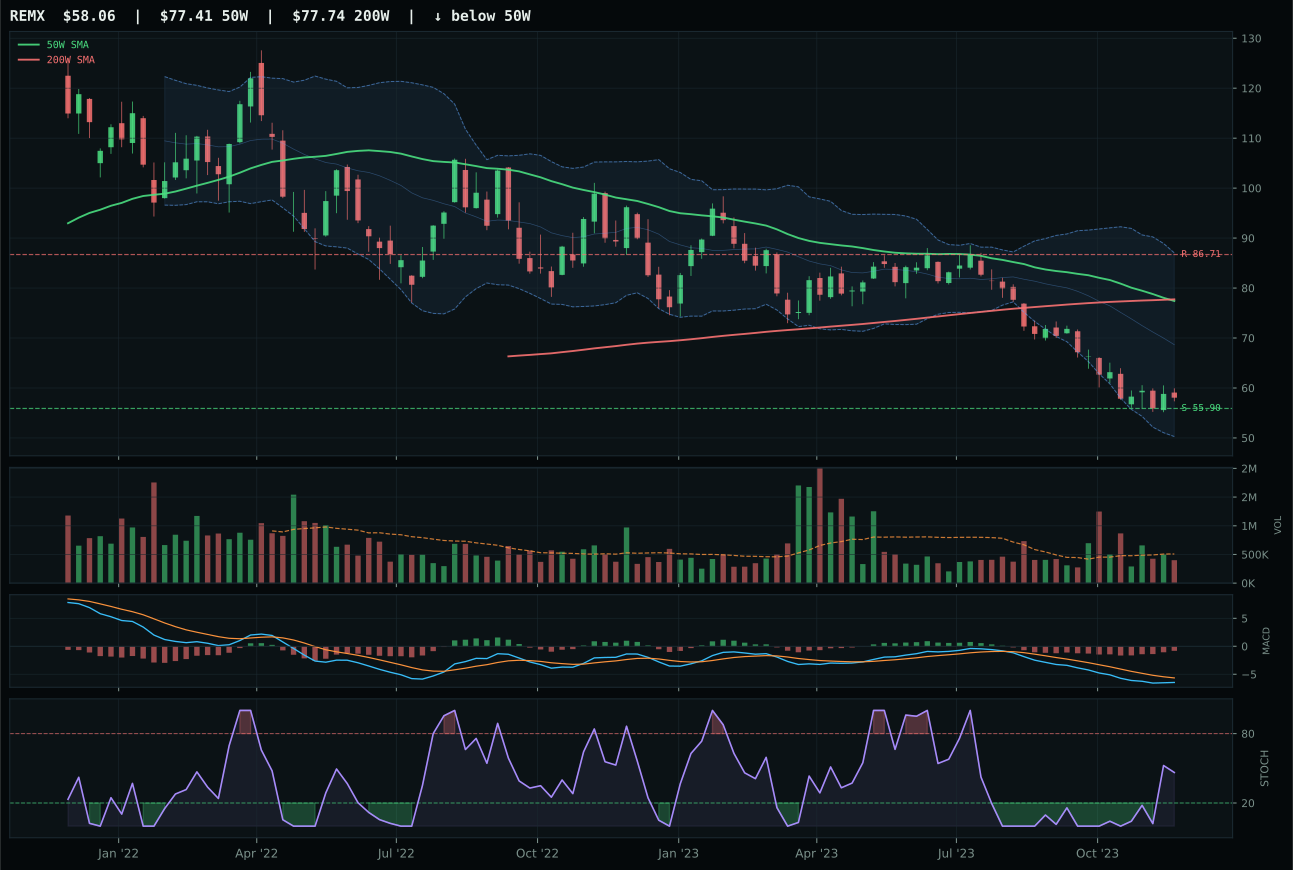
REMX has a pullback into support profile with -21.5% 13-week relative strength versus SPY.
Extension and support failure are the main tactical risks.
Tracked, but not top-2 eligible because: structurally broken.
PICK dominates the category with superior timing, structure, and momentum confirmation, beating COPX by 18.4 points in a decisive win. PICK is only -1.5% from the 50W (versus COPX's deeper drawdown) and sitting in the Fibonacci 0.618 deep retracement zone, delivering a perfect 100.0 timing score; it is compressing (not extended), so the risk-reward is balanced at 10.3% downside to support versus -5.5% upside to resistance. MACD is bullish and improving while COPX's is bearish, and PICK's 9.4% category-relative strength crushes COPX's 0.0%. The four-week return of 8.0% shows recent accumulation, and neutral volume at 0.83x 20W confirms the move is not on panic or desperation. Mining breadth is being accumulated into commodity value, and PICK is the clearest entry point.
Industrial Metals earned 5% despite a low 18.3 category score, placing it 5th or 6th and reflecting portfolio diversification rather than conviction. The macro fit of 35.0 is weak: liquidity stress hits -8 and credit stress adds -7, both headwinds crushing commodity-adjacent exposure. Technical evidence at 85.6 carries the load entirely—PICK's 100.0 timing score and 95.0 momentum confirmation (8.0% 4W return, 9.4% category RS) show a potential reversal is forming, but it is early. The allocation assumes PICK's compression near the 50W breaks upside; if support breaks at 36.77, the entire position becomes untenable. This is a tactical mean-reversion bet on industrial metals not collapsing further, useful as a small hedge to disinflation (which eventually demands industrial recovery). Capital here competes directly with Technology and AI for allocation; PICK's 5% is justified only if the macro regime begins signaling recovery demand. Monitor credit stress closely; if stress eases, PICK becomes a core position. For now, it is a small speculative hedge inside a cautious portfolio.
Agriculture & Livestock — MOO
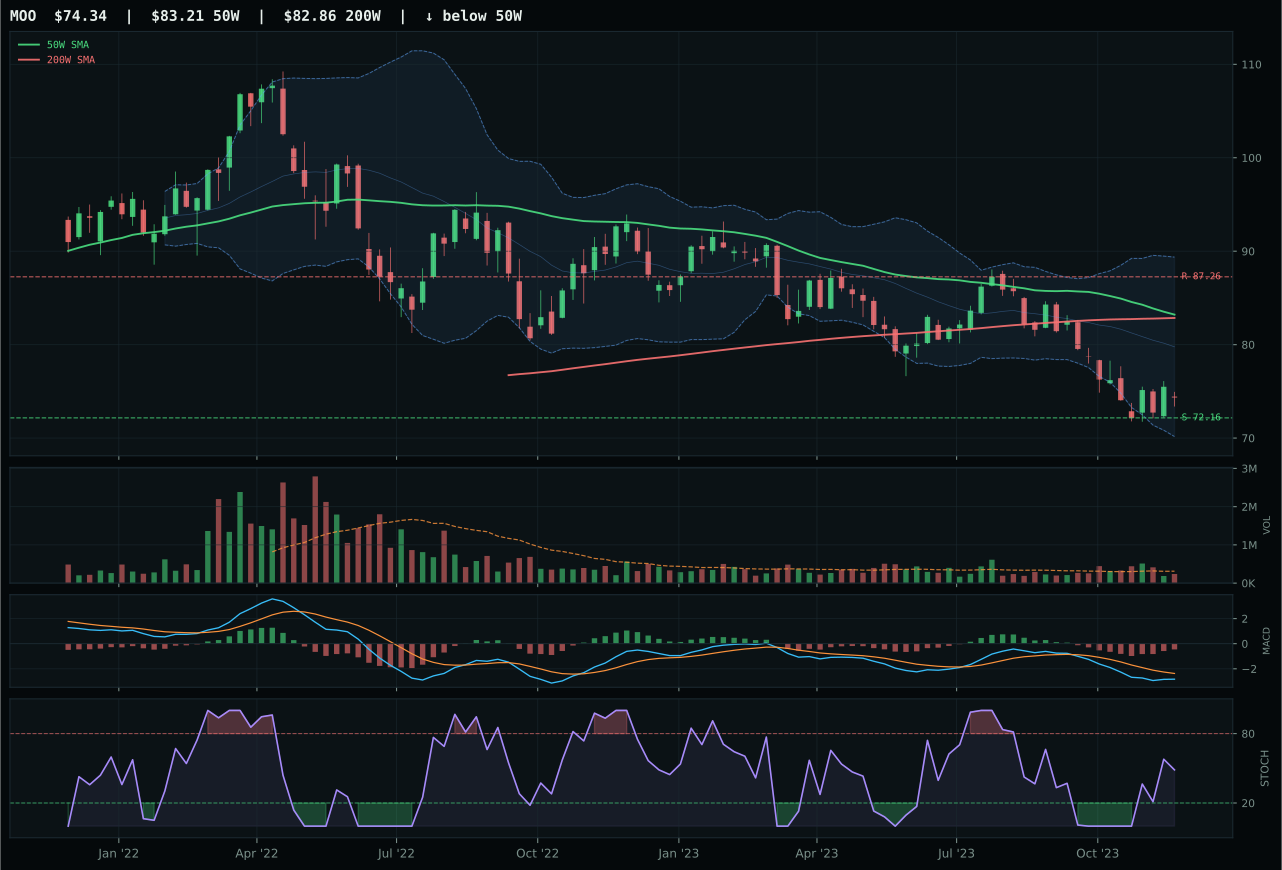
MOO has a pullback into support profile with -12.4% 13-week relative strength versus SPY.
A failed hold above support would weaken the setup.
Actionable but governed by invalidation levels.
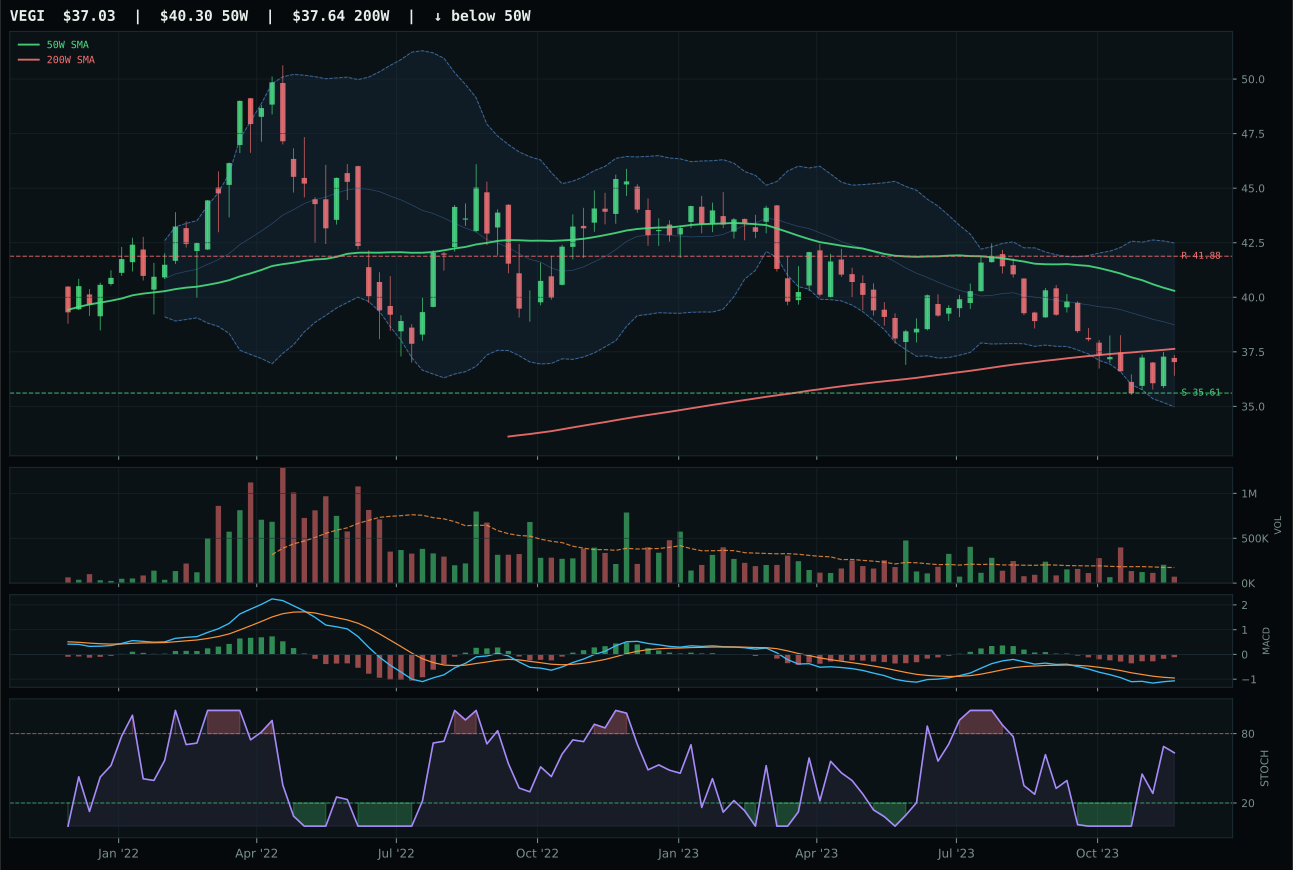
VEGI has a pullback into support profile with -8.3% 13-week relative strength versus SPY.
A failed hold above support would weaken the setup.
Tracked, but not top-2 eligible because: .
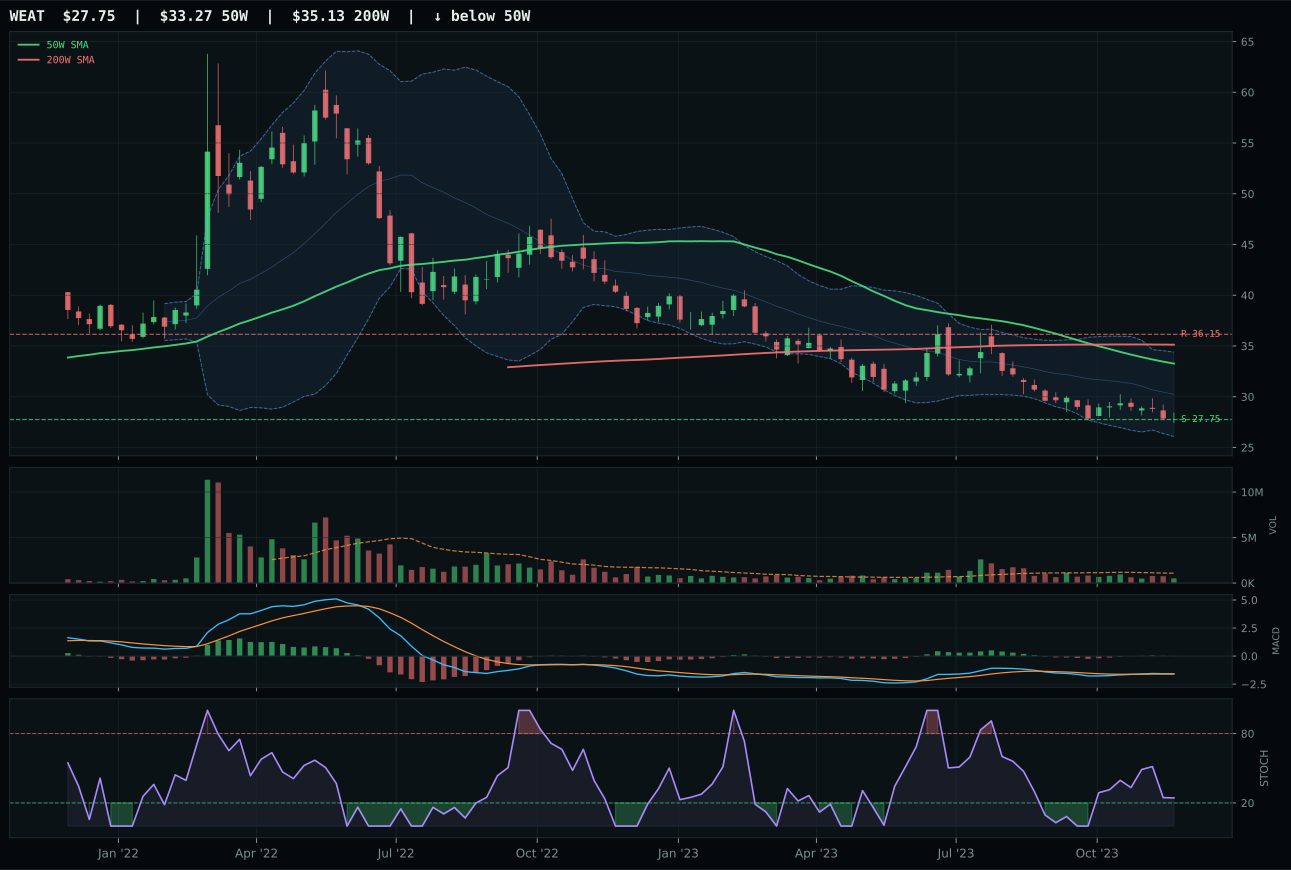
WEAT has a pullback into support profile with -13.1% 13-week relative strength versus SPY.
Extension and support failure are the main tactical risks.
Tracked, but not top-2 eligible because: structurally broken.
MOO wins a deeply challenged category by being the least bad chart and the only one with acceptable risk-reward dynamics. Price is -10.7% below the 50W and sitting in the Fibonacci 0.786 repair zone (near the 52-week low), which creates a 90.0 risk-reward score: upside to resistance is only -14.8% (means resistance is below current price), while downside to support is just 3.0%, so capital can be sized to the downside risk and still capture any reversion. VEGI lost because structure was slightly less clean (63.0 vs 64.4) and volume was thin where MOO was at least neutral at 0.76x 20W average. This is a category where the baseline technical scores are all low: MOO's trend is 33.0, momentum is 28.4, but the trade-off in geometry (pullback into a defined support with favorable risk-reward) is what earns the representative slot.
Agriculture & Livestock earned 0% allocation despite MOO winning the category. The final score of 2.5 is the lowest among all ten categories, and the macro fit of 32.0 explains why: disinflation pressure contributes -8, disinflation broadly hurts at -6, and liquidity stress adds -4. The category is fighting headwinds on every front. MOO's 49.2 technical evidence score is respectable in isolation (showing a potential reversal coil), but it cannot overcome the 45.0 macro narrative fit. The 28.4% momentum confirmation reveals that despite improving stochastics, the recent trend (-8.9% 13W) and relative strength (-12.4% versus SPY) are severely negative. This category is excluded entirely until either: (1) the macro regime shifts away from disinflation, (2) commodity input costs matter more in the market's narrative, or (3) MOO establishes a higher low and shows volume-backed reversal. For now, agriculture is capital-inefficient. Every dollar deployed here is a dollar not available for positive-momentum categories like Technology and AI.
Traditional Energy — XOP
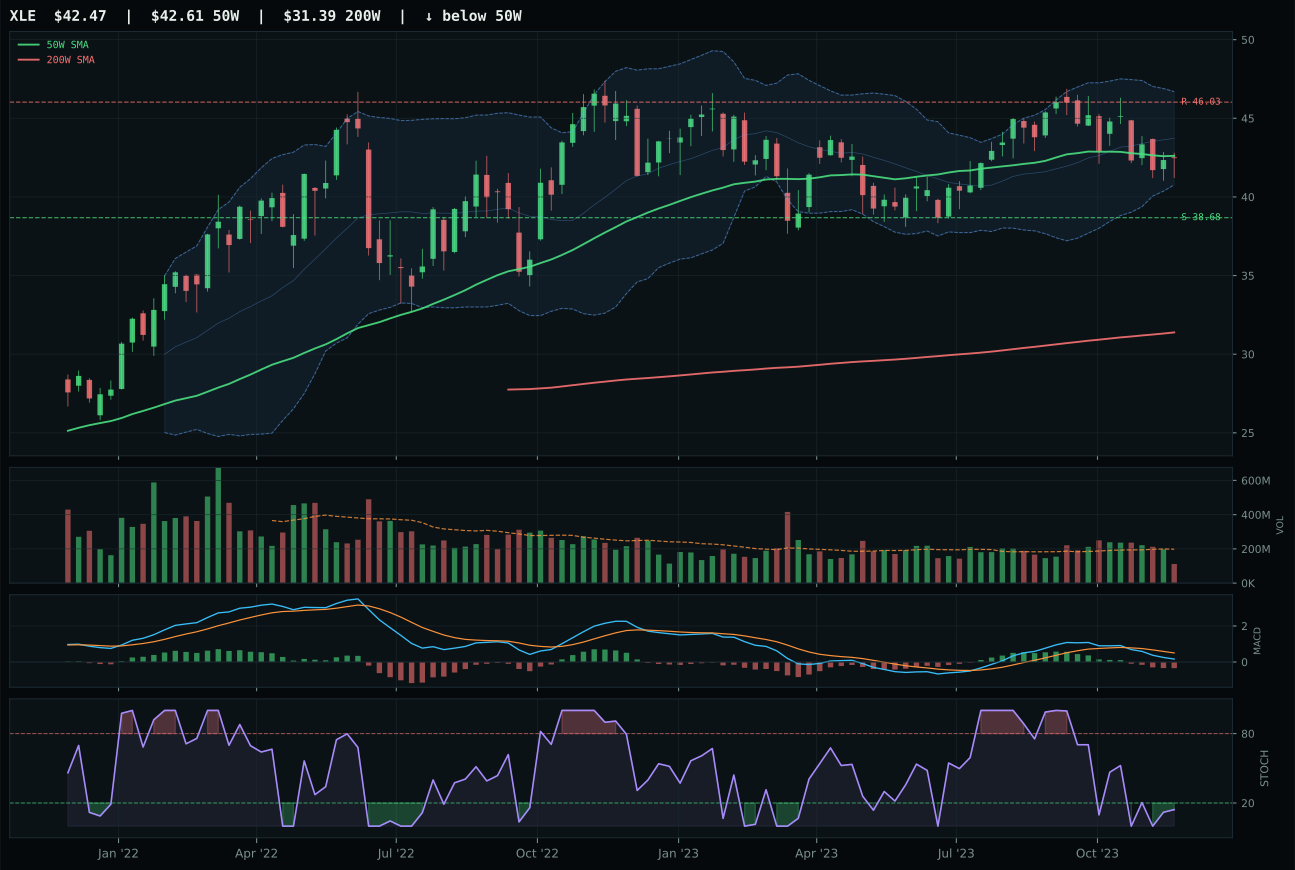
XLE has a compression near 50W profile with -6.5% 13-week relative strength versus SPY.
A failed hold above support would weaken the setup.
Actionable but governed by invalidation levels.
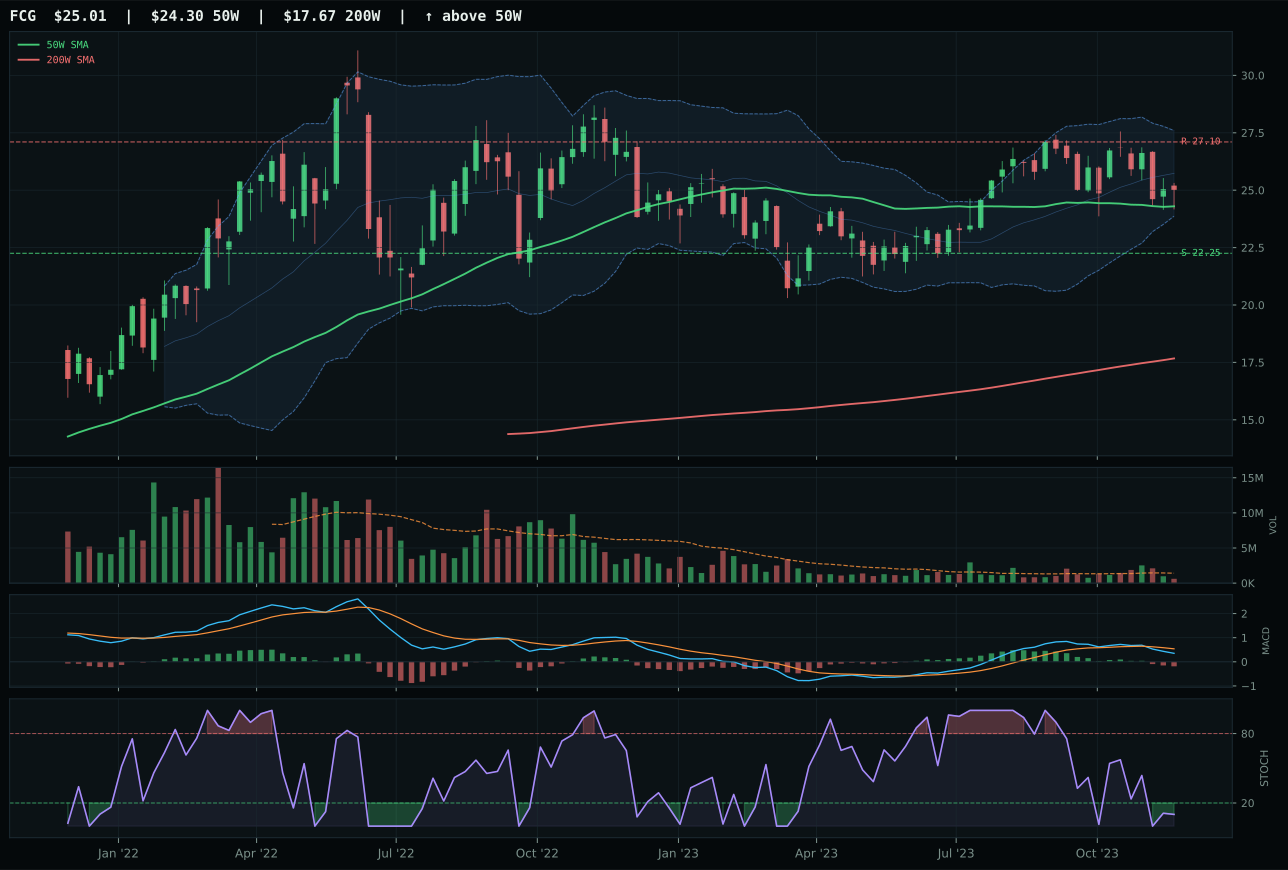
FCG has a compression near 50W profile with -6.5% 13-week relative strength versus SPY.
A failed hold above support would weaken the setup.
Actionable but governed by invalidation levels.
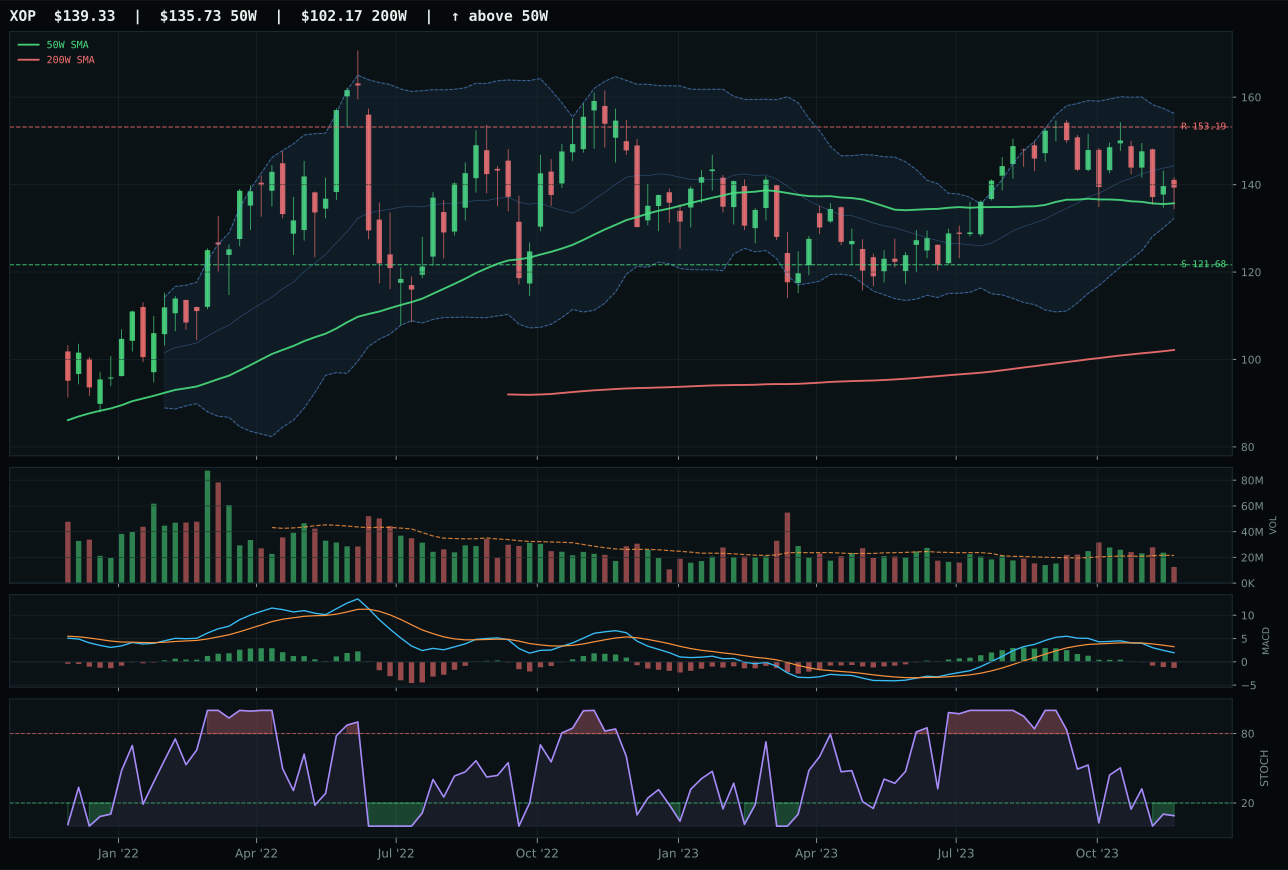
XOP has a compression near 50W profile with -8.0% 13-week relative strength versus SPY.
A failed hold above support would weaken the setup.
Actionable but governed by invalidation levels.
XOP wins by the narrowest margin in a deeply troubled category, narrowly beating XLE and FCG because the composite technical evidence barely favors its profile. XOP is above the 50W and 200W (70.0 trend score), compressing at only 2.7% distance, and offering a 95.0 timing score because it sits in the upper retracement zone where mean reversion has room to work. However, the momentum confirmation is abysmal at 5.3: the 13-week return is -4.5% and SPY-relative strength is -8.0%, reflecting sustained underperformance despite the tight compression. MACD is bearish/weakening and stochastic is oversold, which are technically improving signals, but volume is thin at 0.58x 20W average. XOP edges XLE (37.2 reasoned score vs 41.3) in the tiebreaker because exploration beta offers leverage to any stabilization, whereas integrated energy (XLE) offers no asymmetric upside.
Traditional Energy earned 0% allocation with a 2.4 final score—the second-worst category after Agriculture. Macro fit of 16.0 is catastrophic: disinflation pressure contributes -10, credit stress -7, liquidity stress -7, and risk appetite positive only +7. The regime is outright hostile to energy demand. XOP's 29.4 technical evidence cannot overcome this structural macro headwind. Volume is thin at 0.58x average, momentum confirmation collapsed to 5.3% (negative 4W and 13W returns, negative RS), and persistence at 32.7% shows the trend is not holding. MACD is bearish/weakening, not improving, which means even the early-stage reversal thesis is weak. Energy gets 0% unless: (1) the macro regime shifts to inflation, (2) supply shocks emerge, or (3) the sector confirms reversal with above-average volume and MACD bullish-and-improving. For now, energy is a capital trap. Every cent deployed to XOP or XLE is better spent accumulating compression bases in Industrial Metals or supporting the top two categories.