
2023-11-17
Informational purposes only. The content in this report, including allocations, analysis, and commentary, is provided solely for informational and educational purposes. It does not constitute financial advice, investment advice, trading advice, or any other type of advice. Past performance does not guarantee future results. Always conduct your own research and consult a qualified financial professional before making investment decisions.
Weekly Allocation
| Ticker | Category | Weight | Role |
|---|---|---|---|
| FBTC | 50% | Overlay | |
| XLK | Technology | 10% | Top-2 (10%) |
| SMH | AI | 10% | Top-2 (10%) |
| URA | Nuclear Energy | 5% | Tier-2 (5%) |
| IGF | Utilities & Infrastructure | 5% | Tier-2 (5%) |
| ILF | Emerging Markets | 5% | Tier-2 (5%) |
| GLD | Precious Metals | 5% | Tier-2 (5%) |
| XAR | Defense & Aerospace | 5% | Tier-2 (5%) |
| PICK | Industrial Metals | 5% | Tier-2 (5%) |
Trade Instructions — Monday Open
Sell the tranche from 2023-10-20 (completing its 4-week hold). Buy the new tranche. Instructions show net portfolio changes — same-asset positions cancel, weight changes show the delta.
| Action | Ticker | Instruction |
|---|---|---|
| SELL | FCG | Sell 67% of FCG position (reduce 3.75% → 1.25%) |
| SELL | URNM | Sell entire URNM position (2.50% of portfolio) |
| SELL | INDA | Sell 50% of INDA position (reduce 2.50% → 1.25%) |
| SELL | XLU | Sell 33% of XLU position (reduce 3.75% → 2.50%) |
| SELL | COPX | Sell entire COPX position (1.25% of portfolio) |
| BUY | XLK | Buy XLK — 14.29% of freed cash (adds 1.25% to portfolio) |
| BUY | SMH | Buy SMH — 28.57% of freed cash (adds 2.50% to portfolio) |
| BUY | URA | Buy URA — 14.29% of freed cash (adds 1.25% to portfolio) |
| BUY | IGF | Buy IGF — 14.29% of freed cash (adds 1.25% to portfolio) |
| BUY | ILF | Buy ILF — 14.29% of freed cash (adds 1.25% to portfolio) |
| BUY | PICK | Buy PICK — 14.29% of freed cash (adds 1.25% to portfolio) |
Current Portfolio After Trade
Combined holdings across all 4 active tranches. Each tranche is 25% of the portfolio.
| Ticker | % of Portfolio | Weight Bar |
|---|---|---|
| FBTC | 50.00% | |
| GLD | 7.50% | |
| XLK | 6.25% | |
| NLR | 5.00% | |
| SMH | 5.00% | |
| ITA | 3.75% | |
| MOO | 3.75% | |
| URA | 3.75% | |
| XLU | 2.50% | |
| XAR | 2.50% | |
| IGF | 2.50% | |
| ILF | 2.50% | |
| FCG | 1.25% | |
| INDA | 1.25% | |
| XLE | 1.25% | |
| PICK | 1.25% |
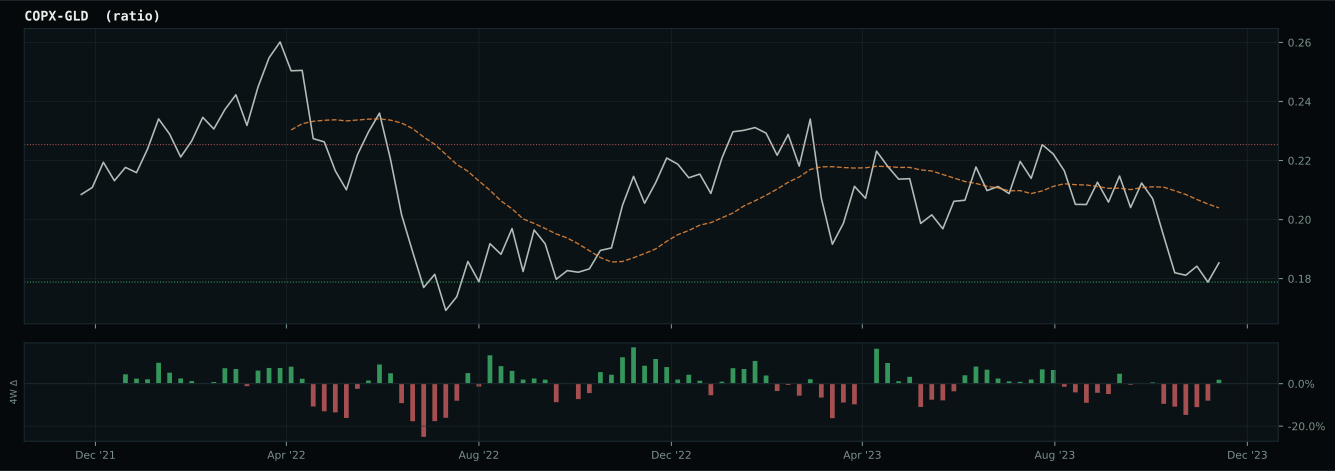
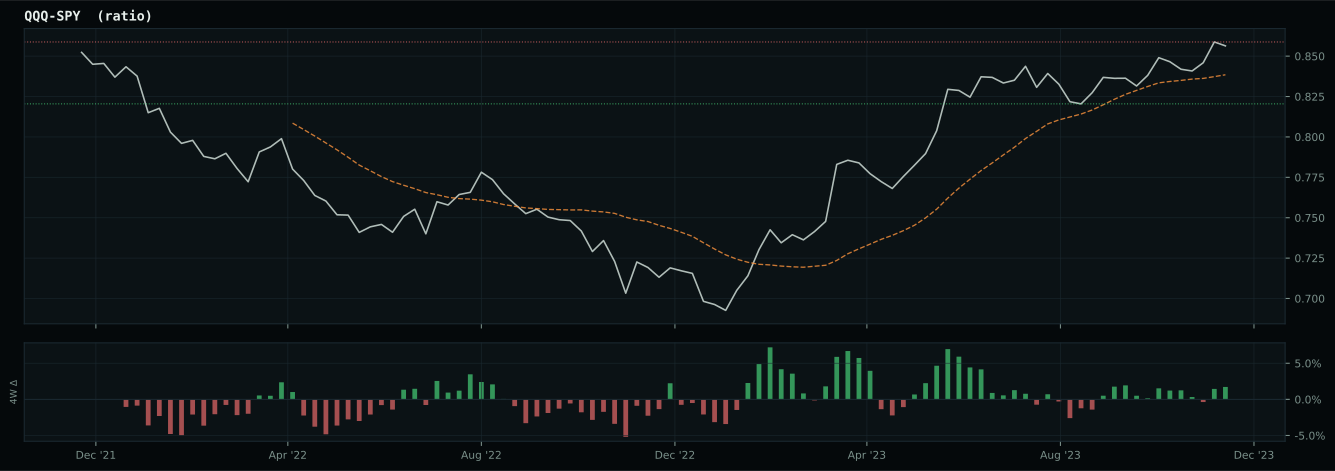
Macro Regime — Disinflation
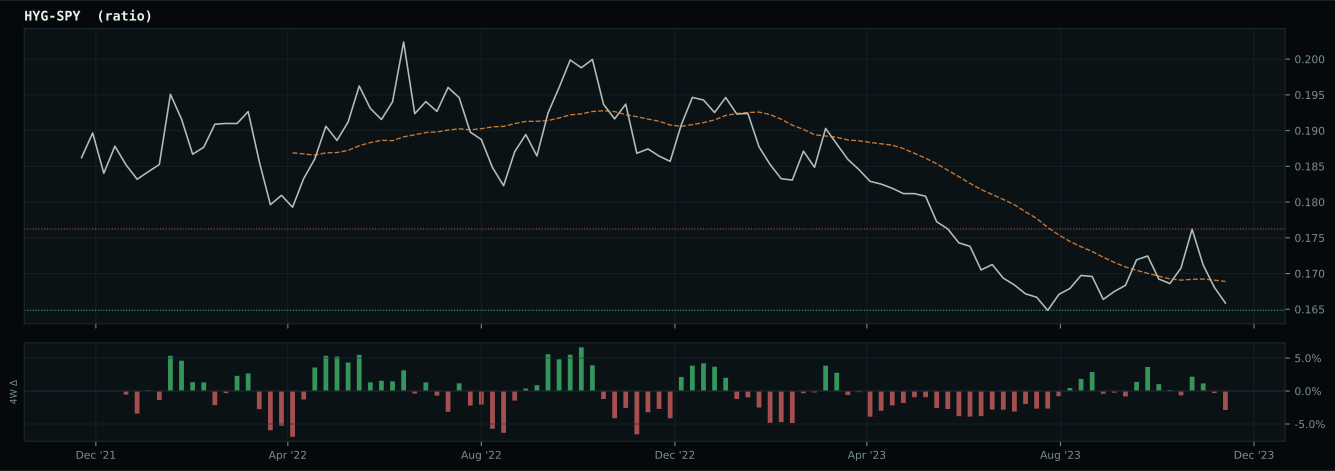
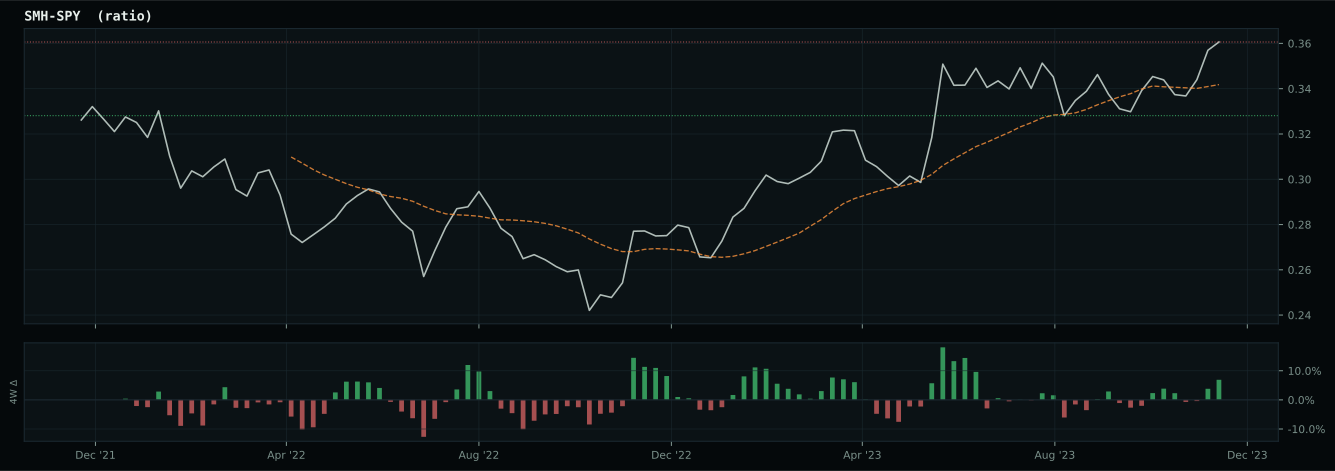
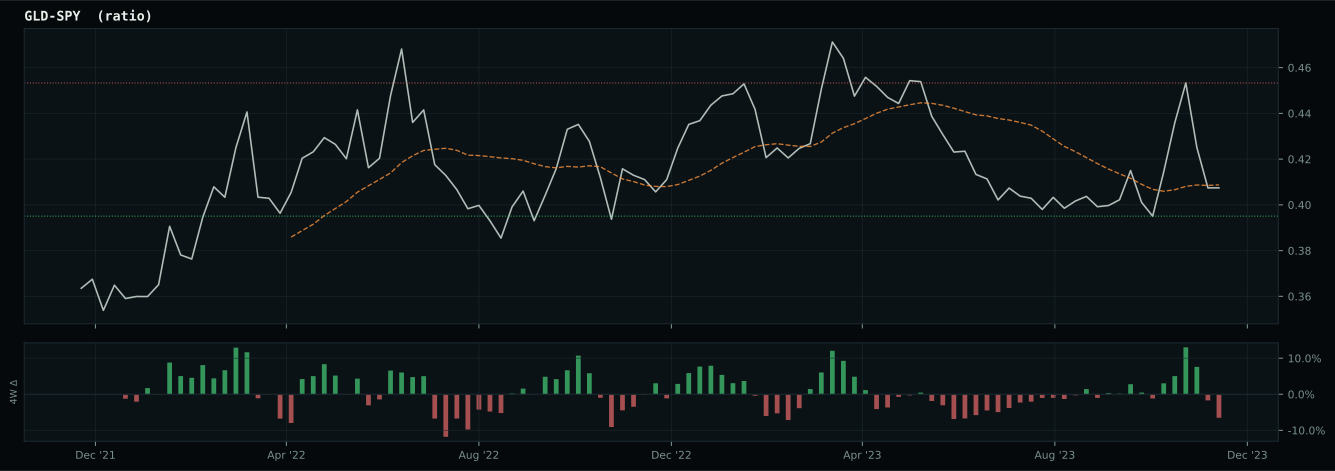
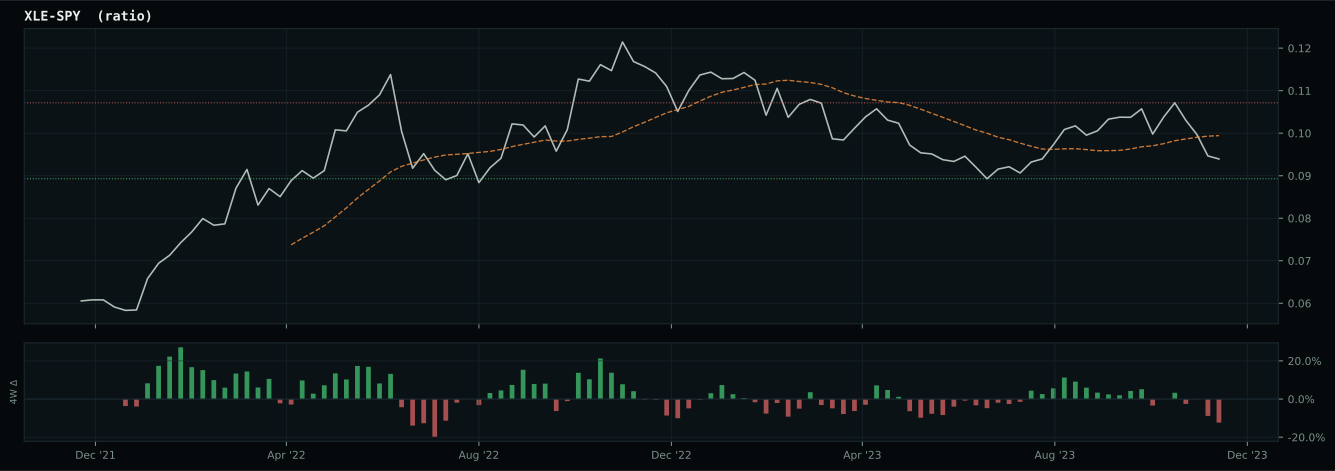
Macro Evidence Charts
Market-implied signals behind the macro regime scores. Each ratio compares two assets; the direction and slope of the ratio is what the macro engine reads.
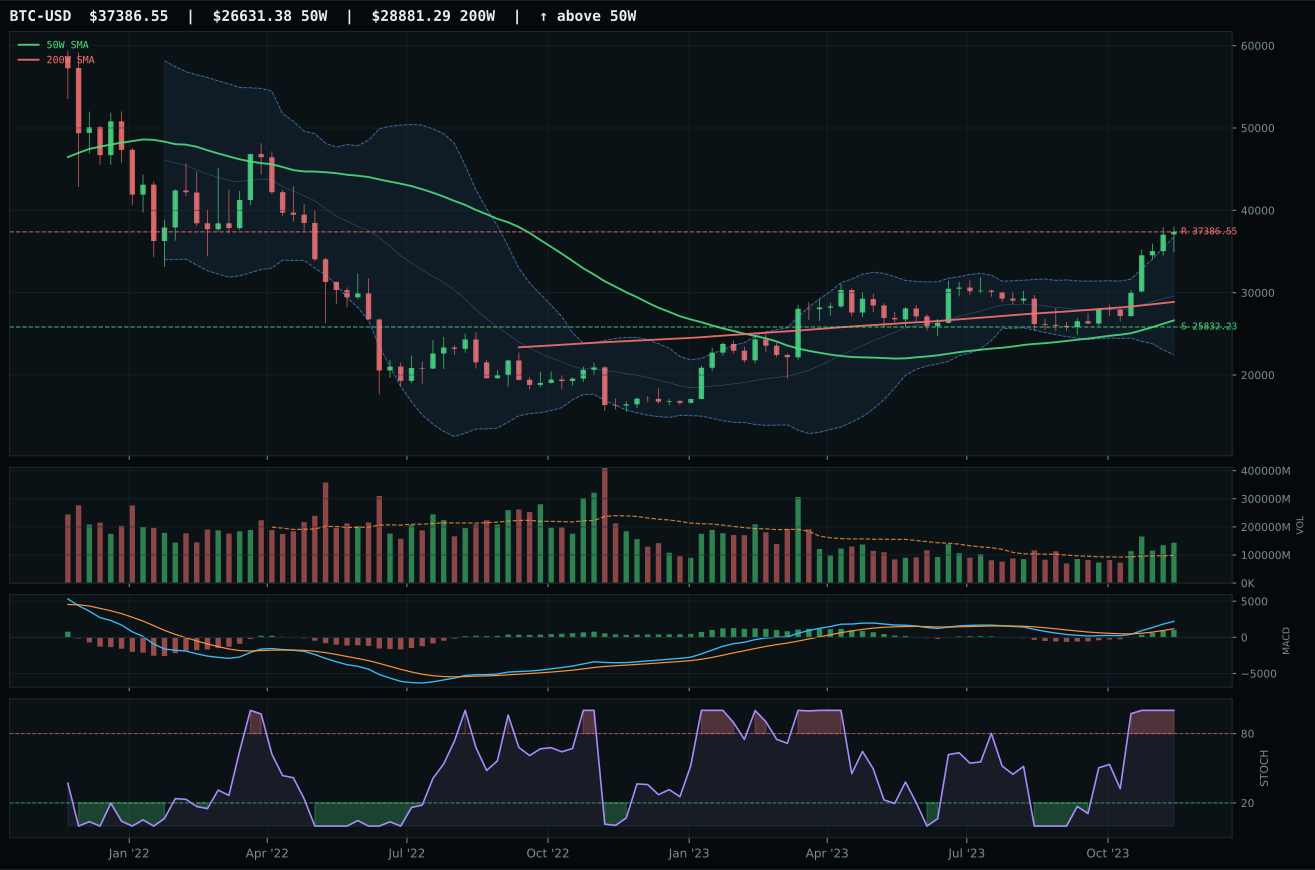
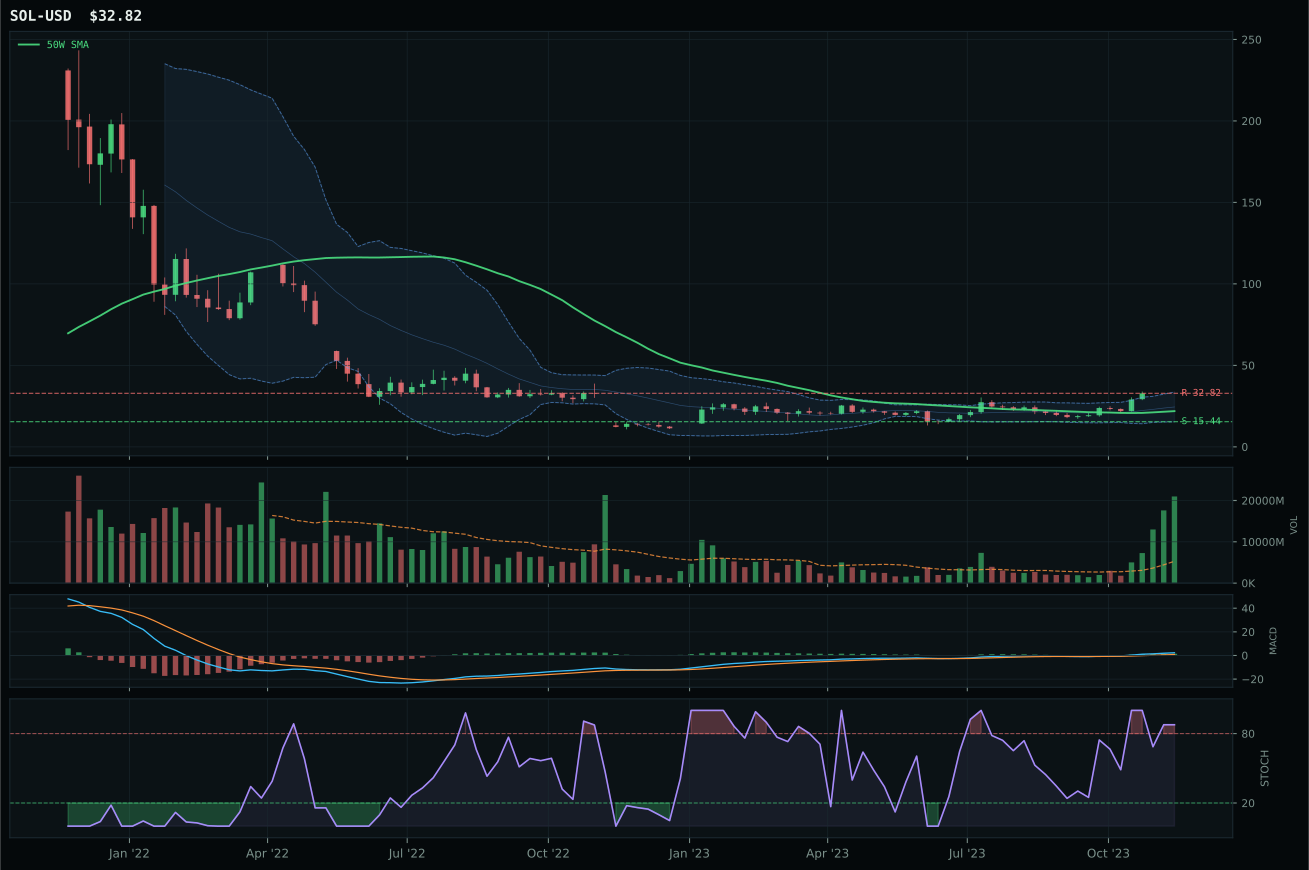
Crypto Regime — TrendBTC
post-touch structure is too wide to count as a range; max/min close ratio is 2.27
TrendBTC confirmed: 2 consecutive closes above rising/flat 50W SMA
one or more available conditions failed
Category Rankings
| Rank | Category | Winner | Score | Alloc | 4W Ret | Peers (4W) |
|---|---|---|---|---|---|---|
| 1 | Technology | XLK | 68.3 | 20% | +4.49% | IGV +7.1% · CIBR +12.3% |
| 2 | AI | SMH | 65.8 | 20% | +6.62% | AIQ +4.7% · BOTZ +8.6% |
| 3 | Nuclear Energy | URA | 63.1 | 10% | +1.94% | URNM -3.0% · NLR -3.7% |
| 4 | Utilities & Infrastructure | IGF | 62.9 | 10% | +5.13% | XLU +2.5% · PAVE +10.0% |
| 5 | Emerging Markets | ILF | 54.9 | 10% | +4.63% | IEMG +1.4% · INDA +7.9% |
| 6 | Precious Metals | GLD | 54.4 | 10% | +2.84% | SLV +2.1% · GDX +9.2% |
| 7 | Defense & Aerospace | XAR | 53.9 | 10% | +6.37% | ITA +7.9% · ROKT +5.9% |
| 8 | Industrial Metals | PICK | 20.9 | 10% | +6.31% | COPX +9.1% · REMX +0.7% |
| 9 | Agriculture & Livestock | MOO | 2.3 | 0% | -0.20% | VEGI +1.9% · WEAT +5.4% |
| 10 | Traditional Energy | XOP | 0.4 | 0% | -2.03% | XLE -0.1% · FCG -2.4% |
Technology — XLK
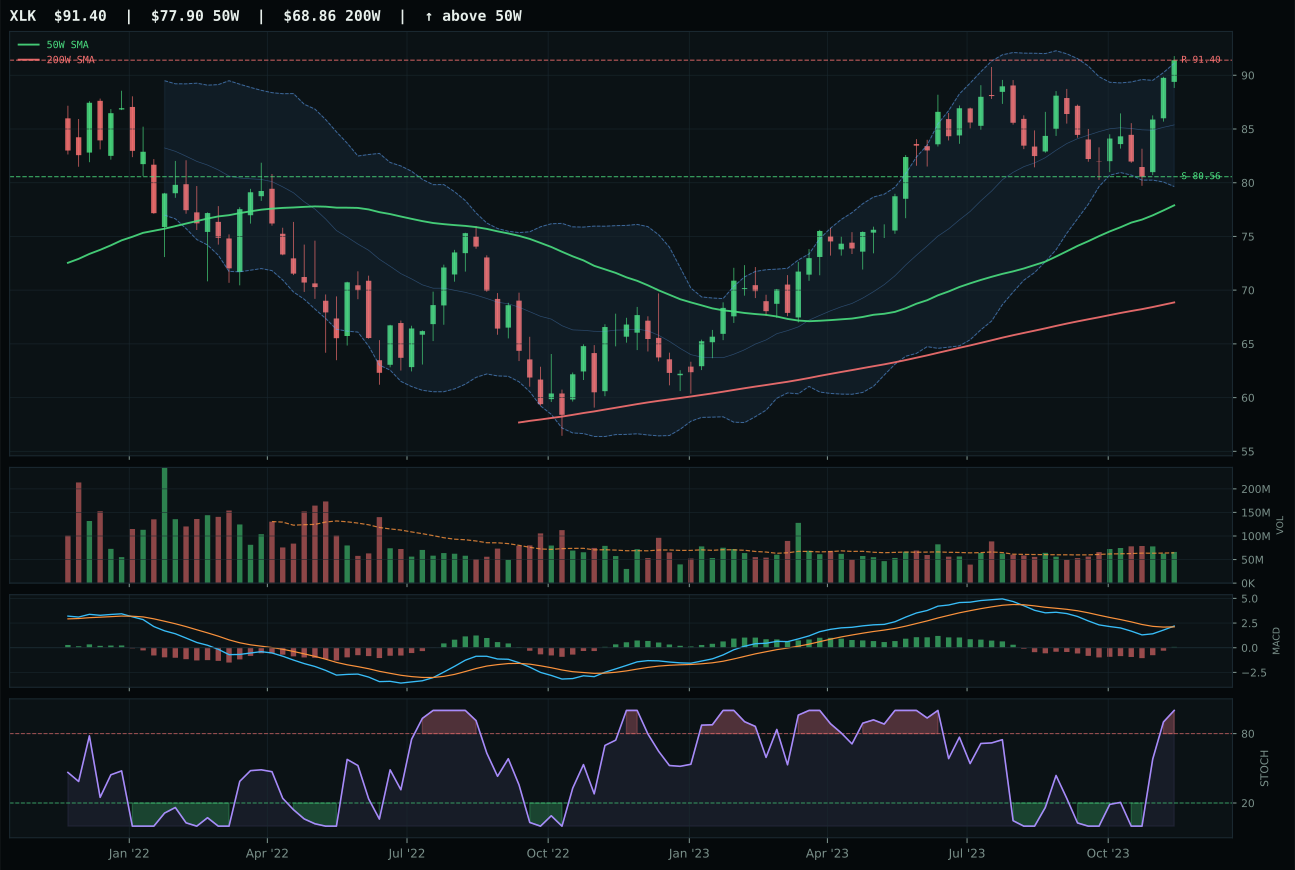
XLK has a vertical extension profile with 7.5% 13-week relative strength versus SPY.
A failed hold above support would weaken the setup.
Actionable but governed by invalidation levels.
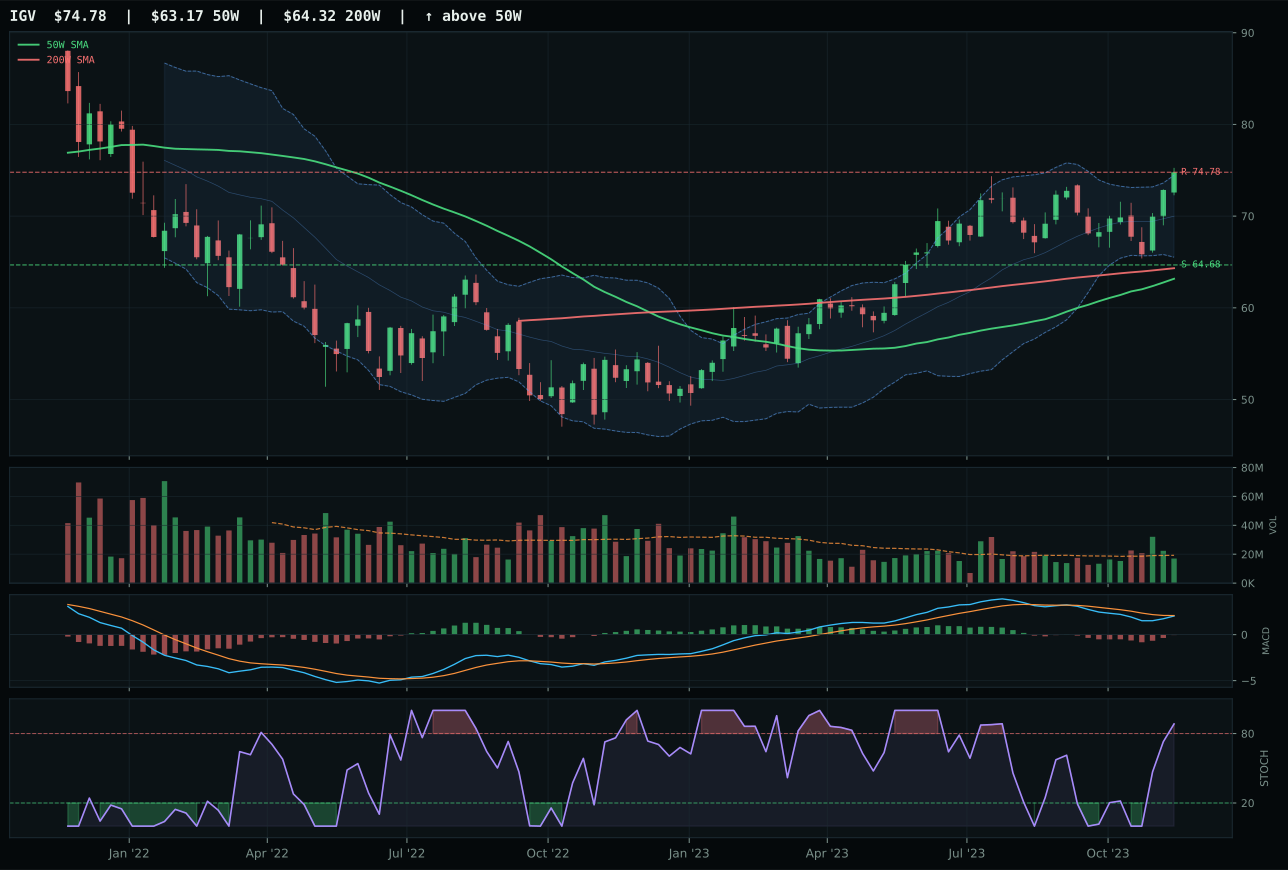
IGV has a vertical extension profile with 8.1% 13-week relative strength versus SPY.
A failed hold above support would weaken the setup.
Actionable but governed by invalidation levels.
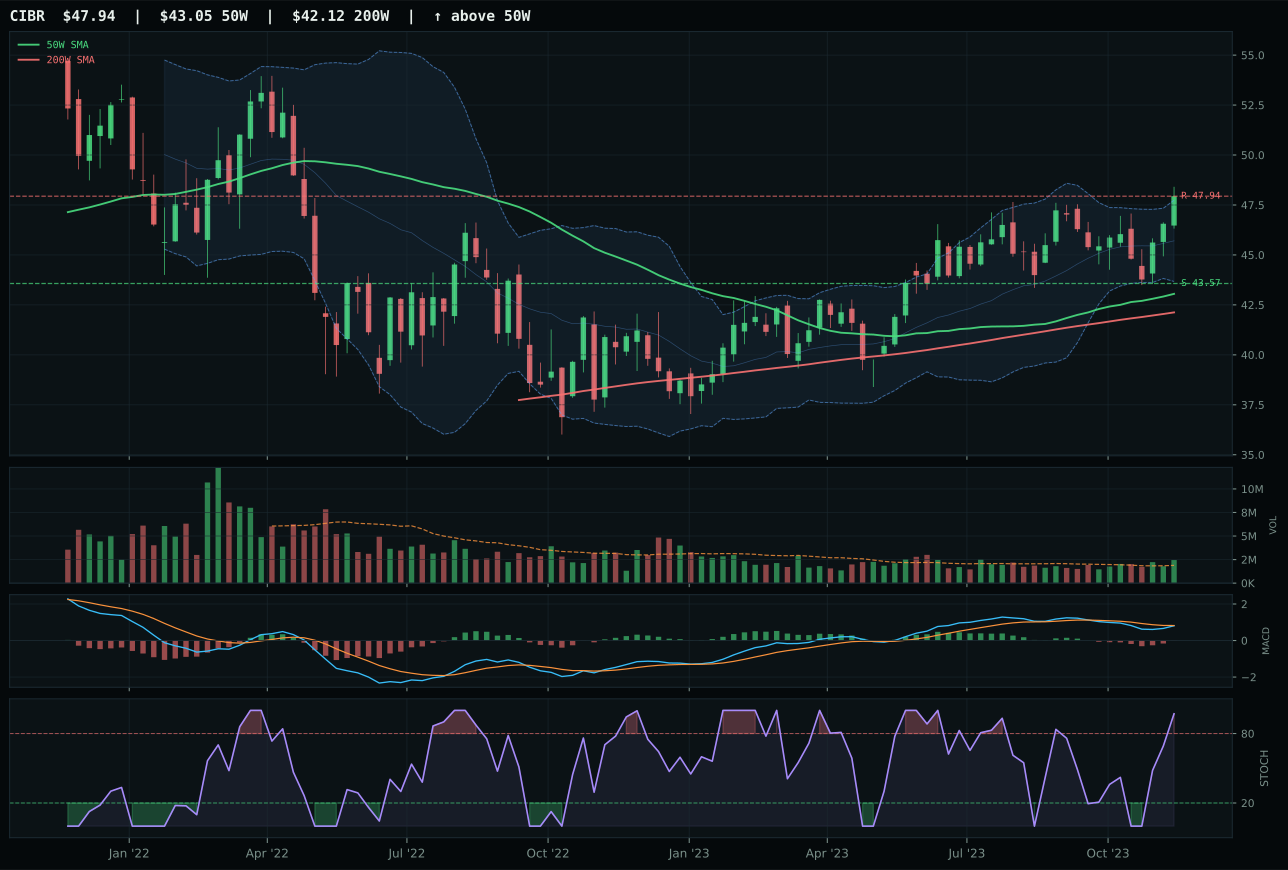
CIBR has a neutral structure profile with 5.7% 13-week relative strength versus SPY.
A failed hold above support would weaken the setup.
Actionable but governed by invalidation levels.
XLK wins the Technology category because its trend is flawless—price sits above both the 50-week and 200-week moving averages with a positive 50W slope of 0.6%—and relative strength versus SPY of 7.5% demonstrates institutional accumulation into what is now a 17.3% extension. The chart is vertically extended, which normally penalizes entry quality, but XLK's MACD bullish and improving signal combined with overbought stochastic momentum at 1.00 confirms the move is being sponsored rather than rejected. Volume at 1.03x the 20-week average remains neutral, meaning buyers are not yet forced to chase, and category-relative strength of exactly 0.0% indicates XLK is winning within its own three-ETF basket without pulling away from peers on relative merit alone. IGV lost this head-to-head because its MACD is bearish but improving—a weaker momentum signature—and its risk-reward score of 46.2 trails XLK's 47.7, signaling less favorable downside cushion relative to upside potential.
Technology earns the 10% top-2 overweight allocation because it scored 68.3 on the category ranking, placing it among the two highest eligible final category scores in the portfolio this week. The disinflation regime actively supports both the AI growth sponsorship descriptor (+6) and broad risk appetite (+9), while liquidity stress headwinds (-10) are being overridden by the strength of technical evidence at 72.0 and macro fit at 48.0. XLK's bullish trend and improving MACD provide near-term confirmation that this strength is not merely a bounce; the 13-week return of 10.8% and flat category-relative strength suggest the move has room to persist without obvious crowding. Against the portfolio's 50% crypto overlay in TrendBTC mode, this allocation is justified as a core structural hedge into AI-enabled compute demand where entry timing, though extended, is supported by institutional sponsorship rather than retail chasing.
AI — SMH
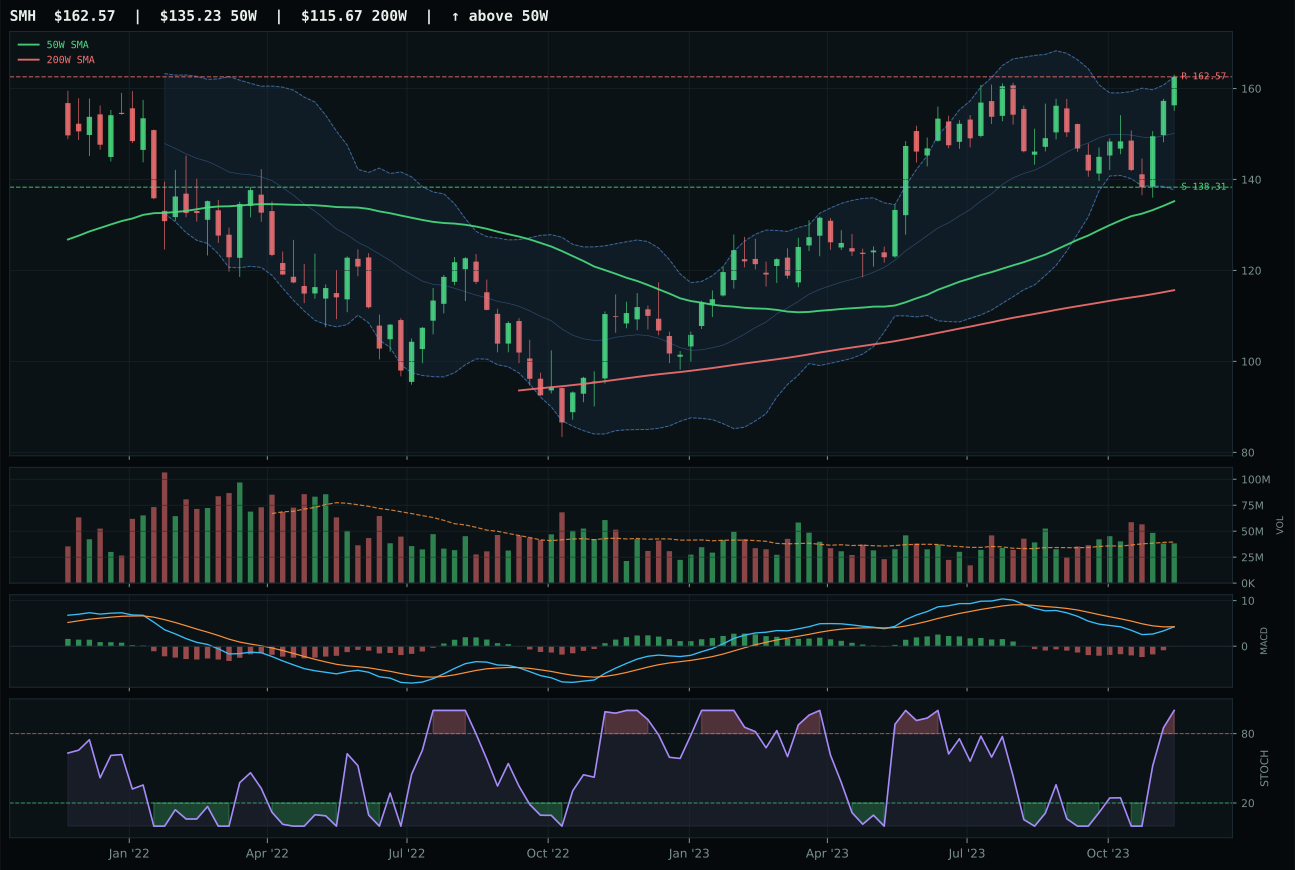
SMH has a vertical extension profile with 8.0% 13-week relative strength versus SPY.
A failed hold above support would weaken the setup.
Actionable but governed by invalidation levels.
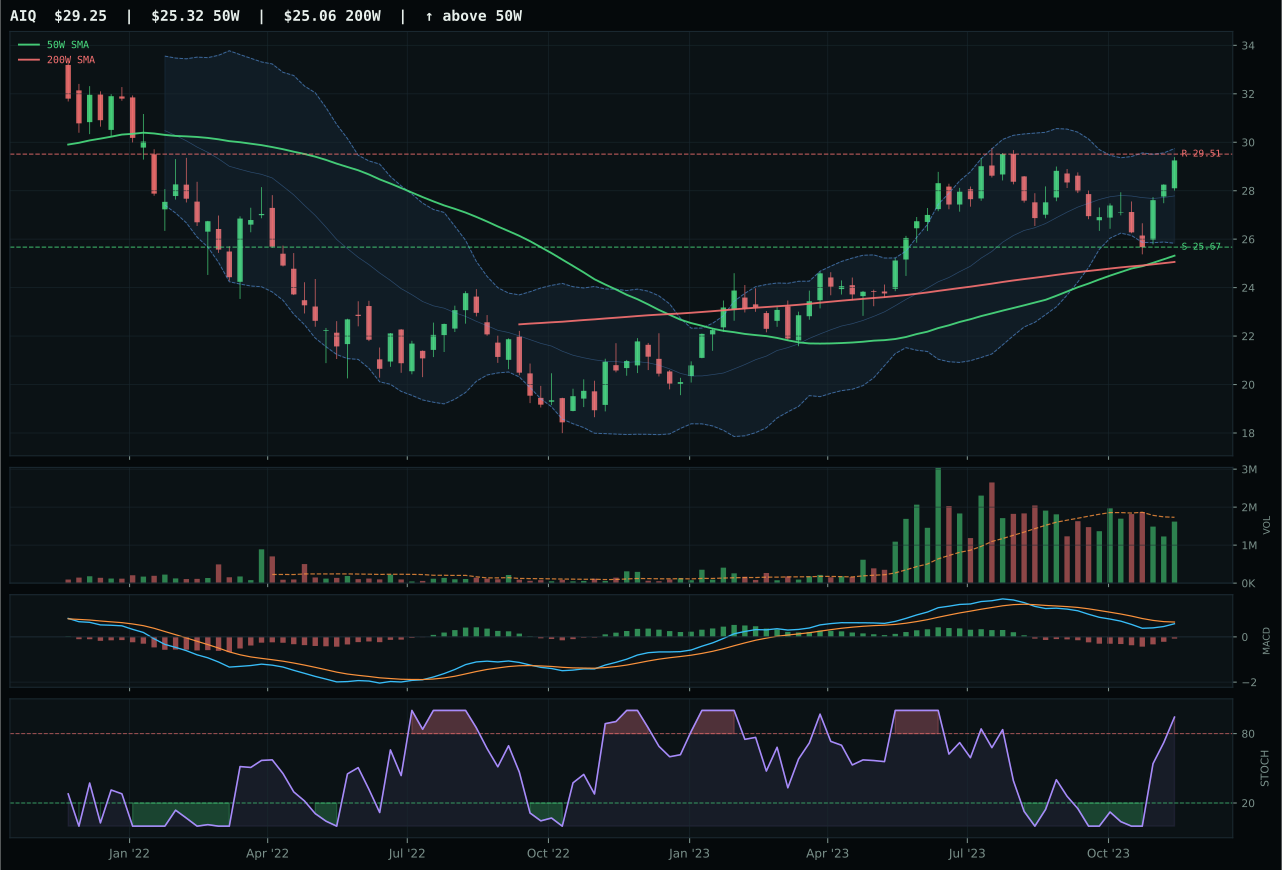
AIQ has a vertical extension profile with 5.6% 13-week relative strength versus SPY.
A failed hold above support would weaken the setup.
Actionable but governed by invalidation levels.
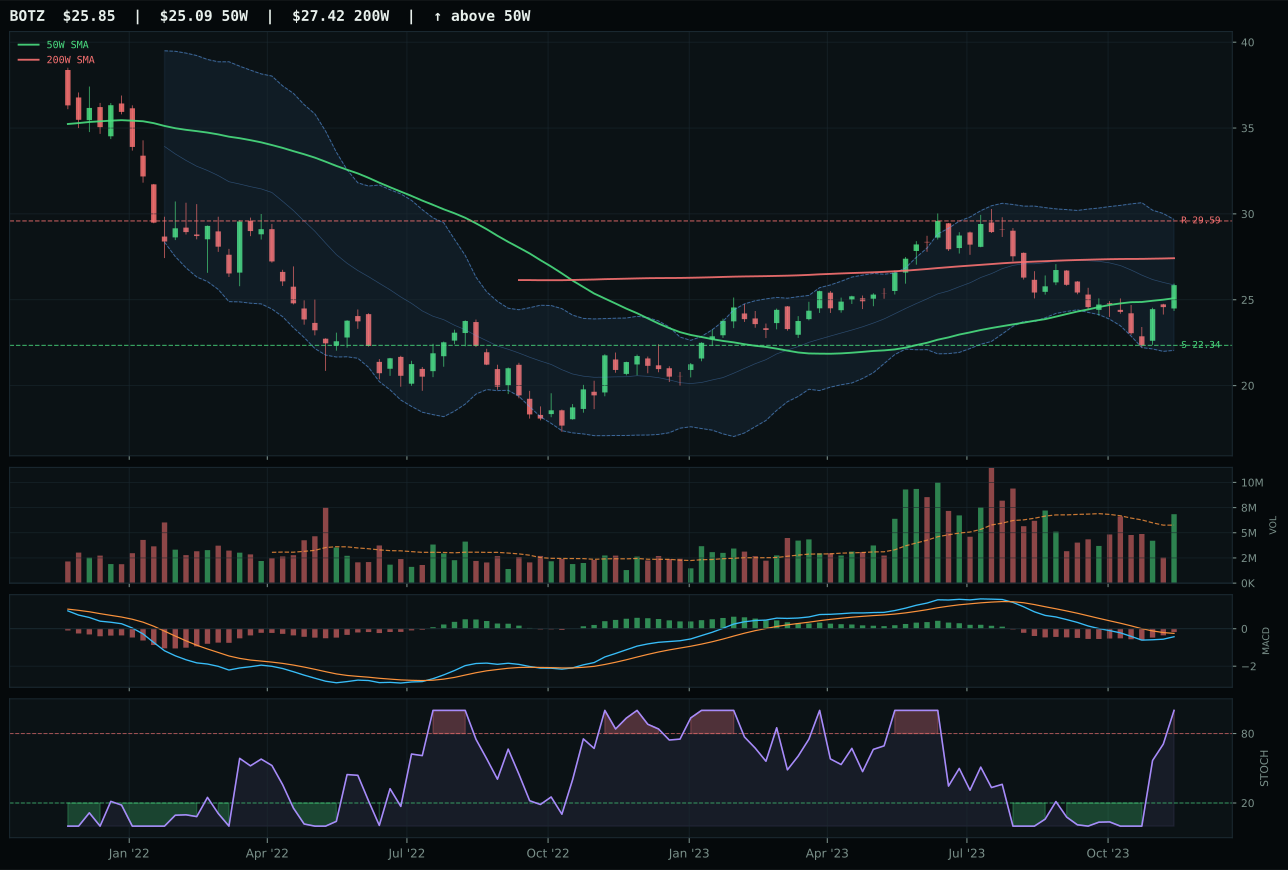
BOTZ has a neutral structure profile with -1.6% 13-week relative strength versus SPY.
A failed hold above support would weaken the setup.
Actionable but governed by invalidation levels.
SMH wins AI because semiconductors are delivering the most complete technical picture: price extends 20.2% above the 50W with a 0.8% positive slope, and unlike its peers, SMH's MACD is bullish and improving—a critical advantage over AIQ's bearish but improving signal. The 13-week return of 11.3% and 26-week return of 22.0% demonstrate multi-timeframe momentum, and category-relative strength of 2.4% proves SMH is outpacing the median within its own three-ETF basket. Volume remains neutral at 0.97x average, which is healthy confirmation that strength is not exhaustion-driven. AIQ's technical evidence scored only 60.4 versus SMH's 72.0, and its structure rated 69.1 compared to SMH's 72.8, creating a 6-point category-level score gap that reflects AIQ's lagging breadth and weaker risk-reward profile of 38.1 versus SMH's 45.2.
AI earns the 10% top-2 overweight allocation because it scored 65.8 on the category ranking, placing it second among eligible categories this week. The AI growth sponsorship descriptor is actively firing at +14 macro points, and broad risk appetite sits at +10, creating a strong tailwind in disinflation. What separates AI from lower-ranked categories is SMH's combination of trend strength (100/100), momentum confirmation (100/100), and volume-price sponsorship (72.1/100), which together deliver 72.0 technical evidence despite the chart sitting 20.2% extended. The macro case rests on energy-efficient compute demand for data centers and inference workloads; disinflation actually helps here because it reduces discount rates on high-margin software and chip design cash flows. At 10% allocation, this category serves as a structural play on secular AI adoption regardless of near-term macro cycles.
Nuclear Energy — URA
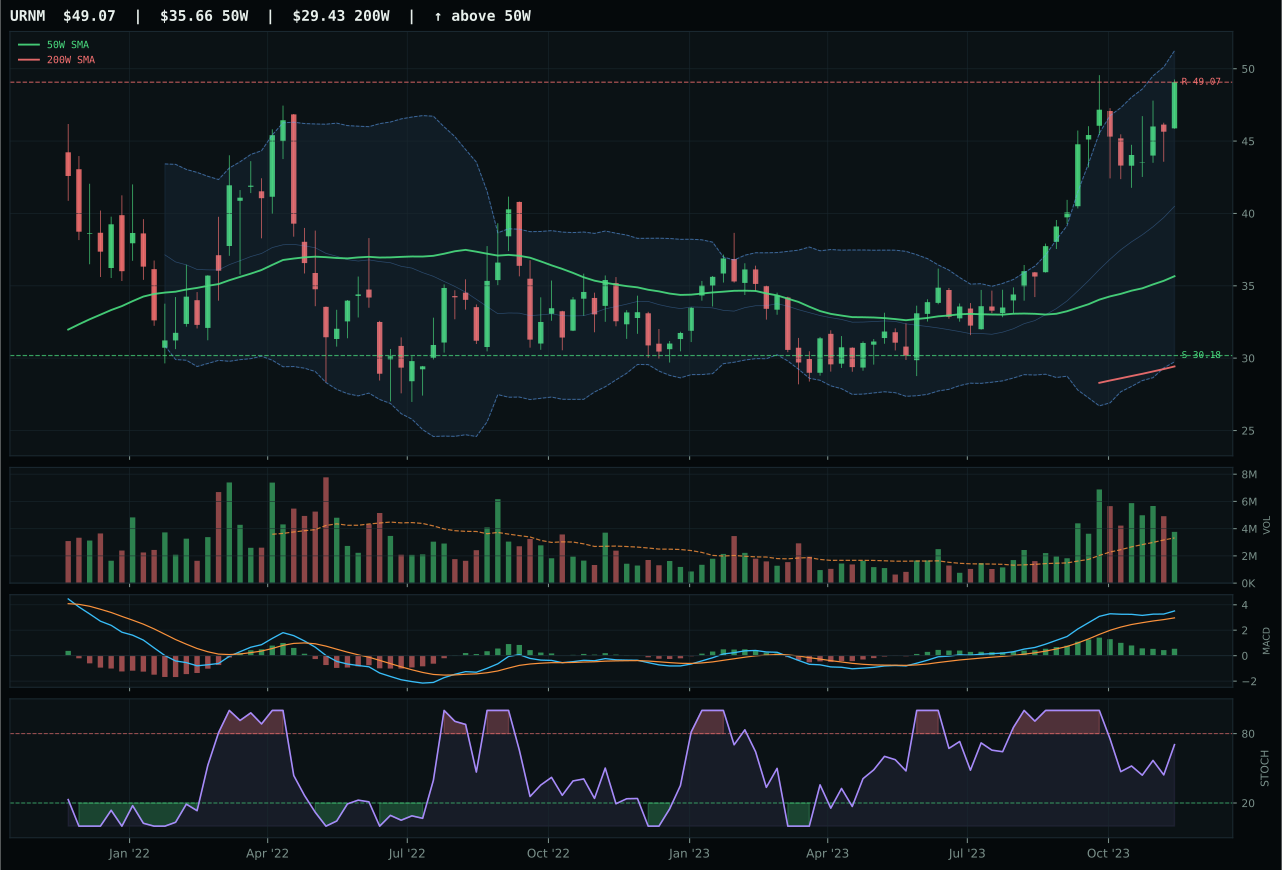
URNM has a vertical extension profile with 34.4% 13-week relative strength versus SPY.
A failed hold above support would weaken the setup.
Actionable but governed by invalidation levels.
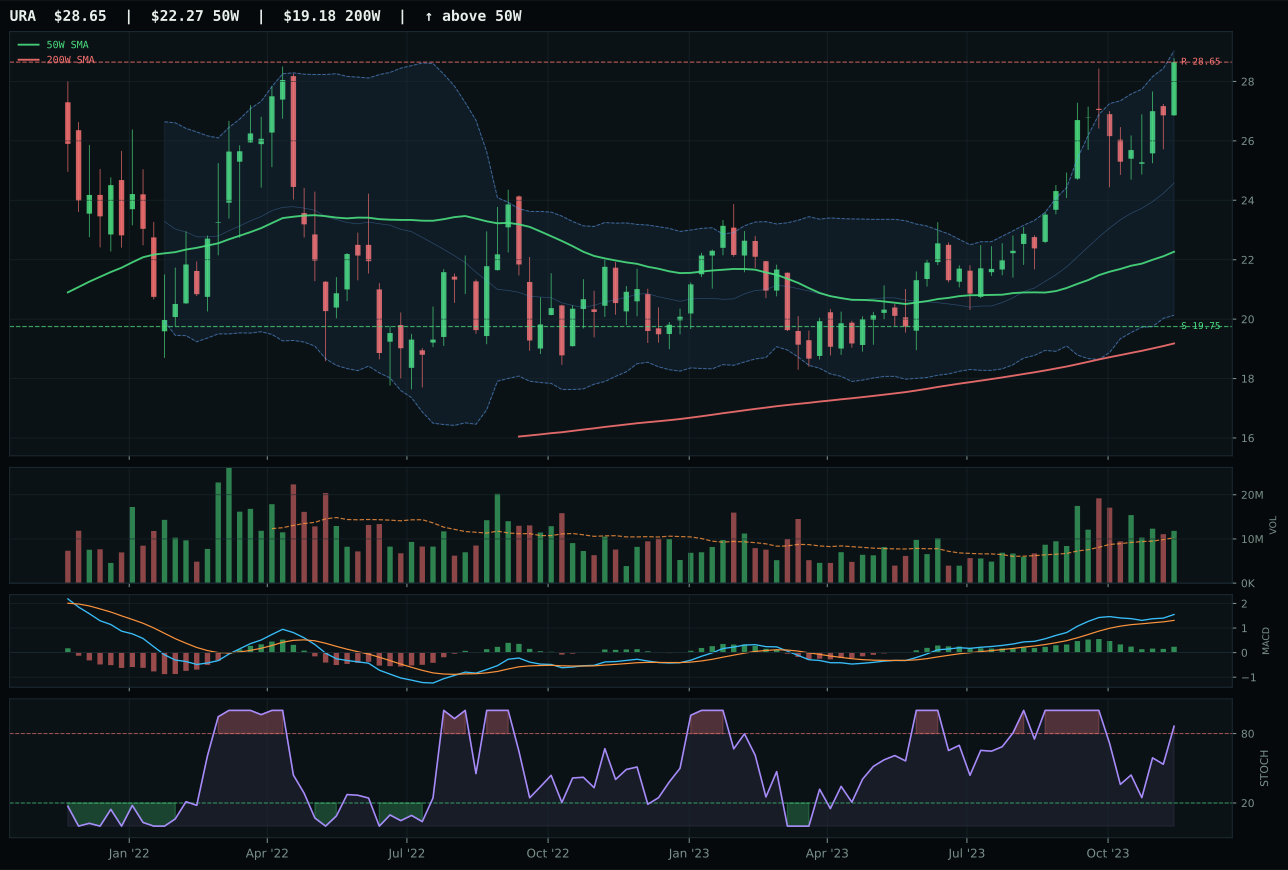
URA has a vertical extension profile with 24.7% 13-week relative strength versus SPY.
A failed hold above support would weaken the setup.
Actionable but governed by invalidation levels.
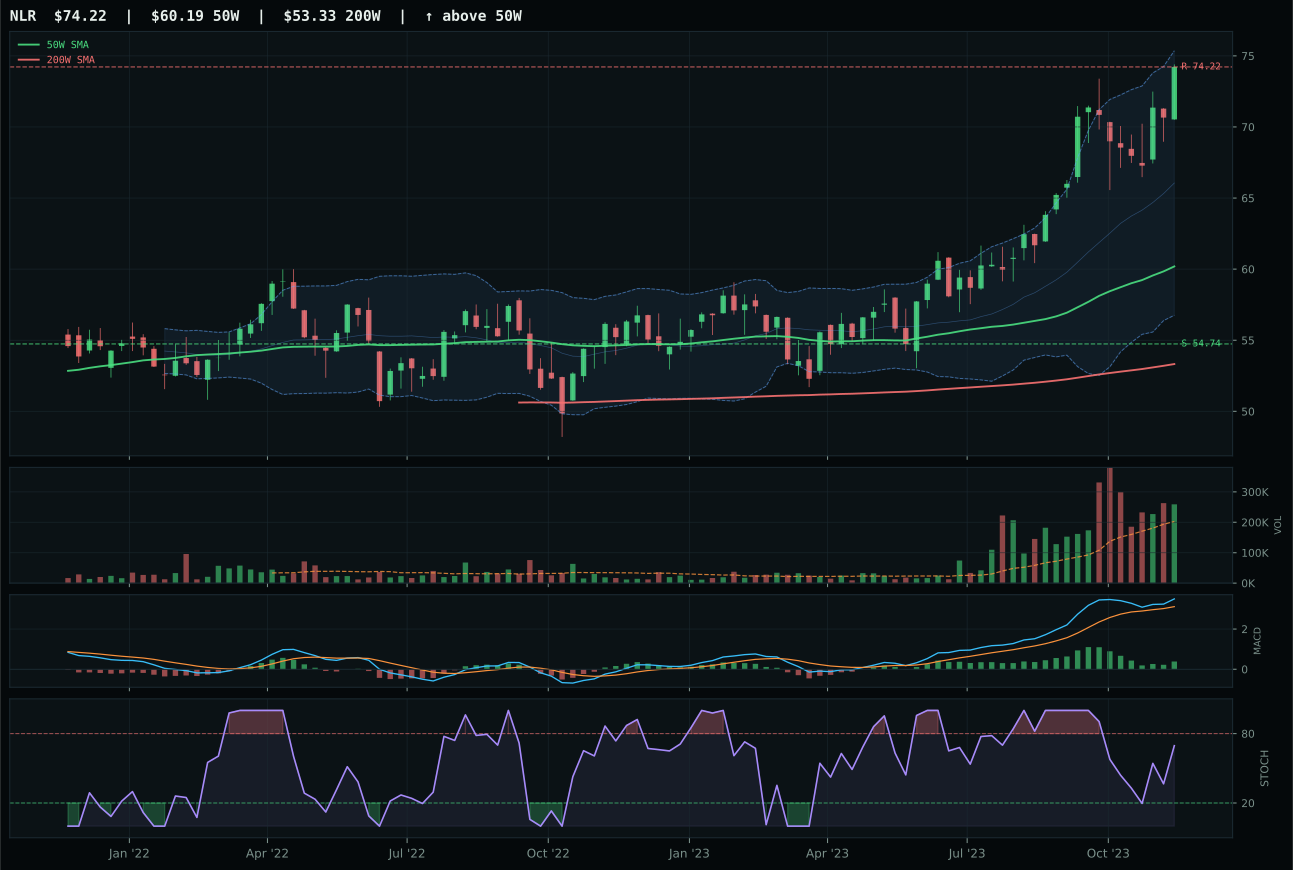
NLR has a vertical extension profile with 17.1% 13-week relative strength versus SPY.
A failed hold above support would weaken the setup.
Actionable but governed by invalidation levels.
URA wins Nuclear Energy because it delivers the cleanest entry timing relative to its extension, though this remains a stretched setup overall. Price is 28.7% above the 50W, the most extended position in the portfolio after SMH, but URA's MACD is bullish but flattening—not yet deteriorating—and volume at 1.15x average provides sponsorship conviction. The 13-week return of 28.0% and 26-week return of 42.5% demonstrate this is a multi-quarter trend, not a flash momentum squeeze. Category-relative strength is neutral at 0.0%, but momentum confirmation scored a perfect 100.0 across trend, relative strength, and volume-price mechanics. URNM lost despite scoring 84.8 on technical evidence because it is even more extended at 37.6% from the 50W, stretching the timing score to just 48.0, and its risk-reward of 39.3 trails URA's 40.2. When both setups are extended, the one with less extreme extension and better margin to support wins the positioning battle.
Nuclear Energy receives 5% tier-2 allocation because the category score of 63.1 ranks it third or fourth overall but does not crack the top-2 overweight threshold. Macro fit of 50.0 is neutral because no category-specific descriptor profile is activated; the AI growth sponsorship is generic rather than nuclear-specific. The risk asymmetry is unfavorable: URA offers 45.1% downside to support but only 0.0% upside to resistance at current price levels, meaning fresh buyers are paying peak premium for what is becoming a crowded trade. URA's 28.0% 13-week return has already captured the structural AI compute + electricity demand thesis; allocation at 5% is conservative recognition that this category deserves a position but not a core weight. The allocation will feel like a mistake if energy demand accelerates and URA breaks resistance, but will prove prudent if any macro surprise triggers rotation out of extended momentum trades. This is a hold-tight position that requires strong discipline to avoid adding into further extension.
Utilities & Infrastructure — IGF
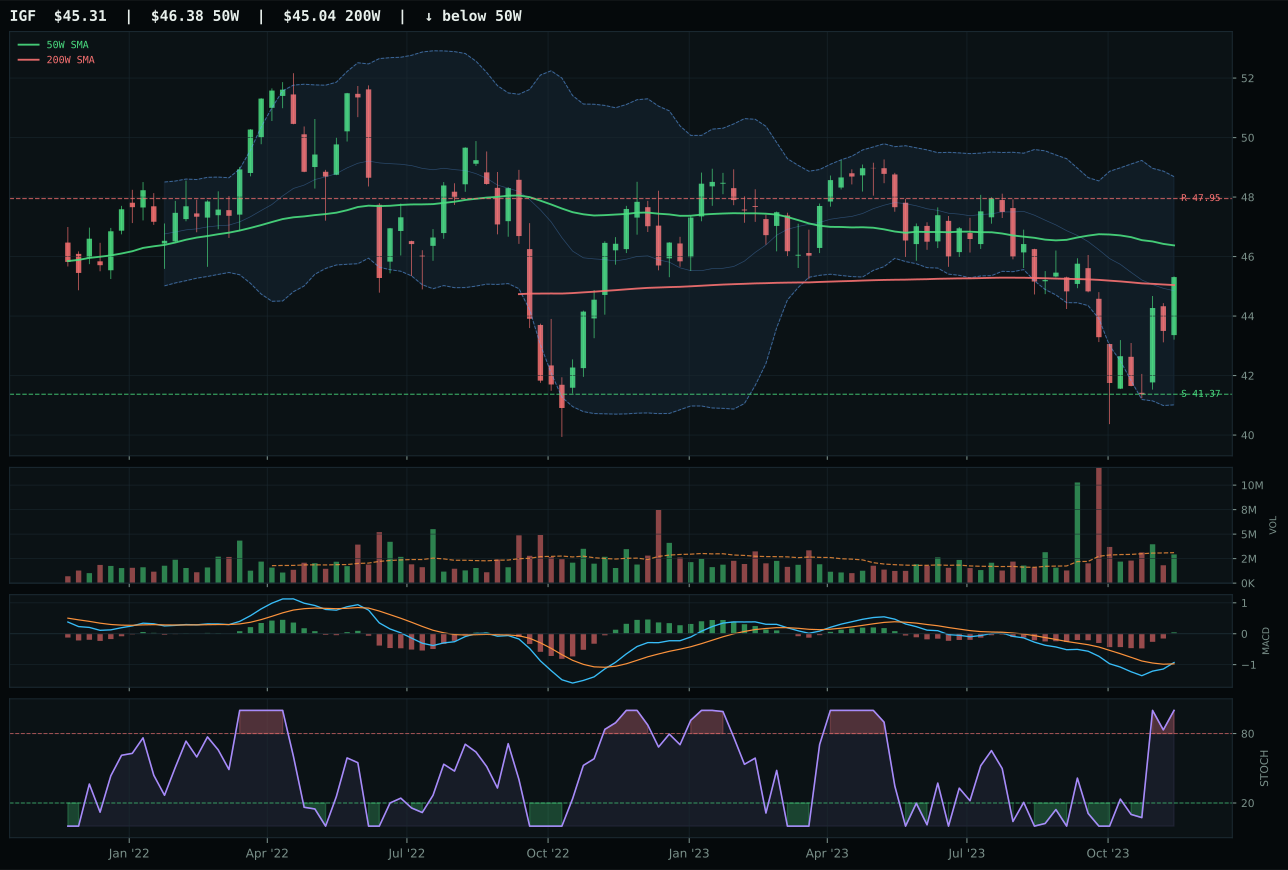
IGF has a compression near 50W profile with -2.9% 13-week relative strength versus SPY.
A failed hold above support would weaken the setup.
Actionable but governed by invalidation levels.
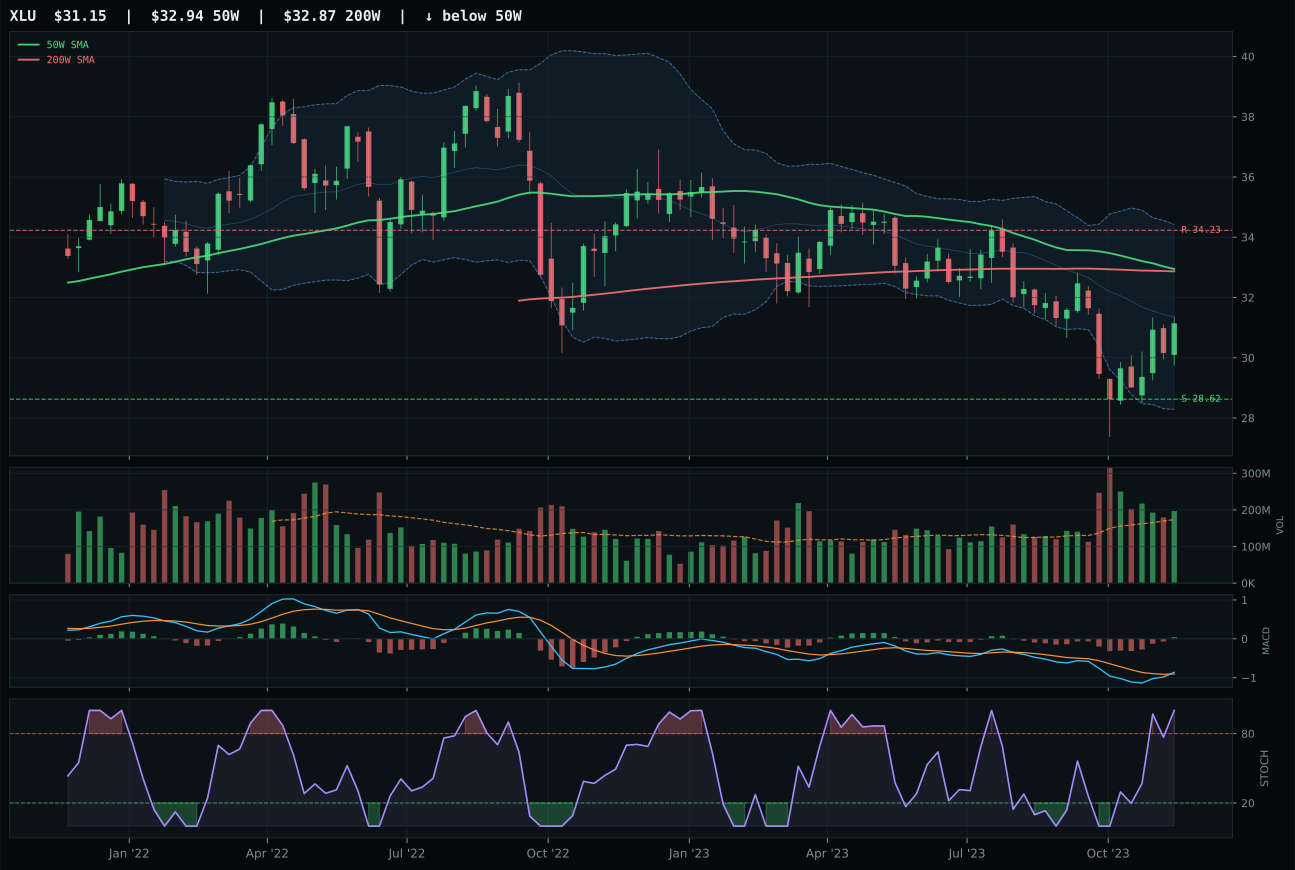
XLU has a neutral structure profile with -5.2% 13-week relative strength versus SPY.
A failed hold above support would weaken the setup.
Actionable but governed by invalidation levels.
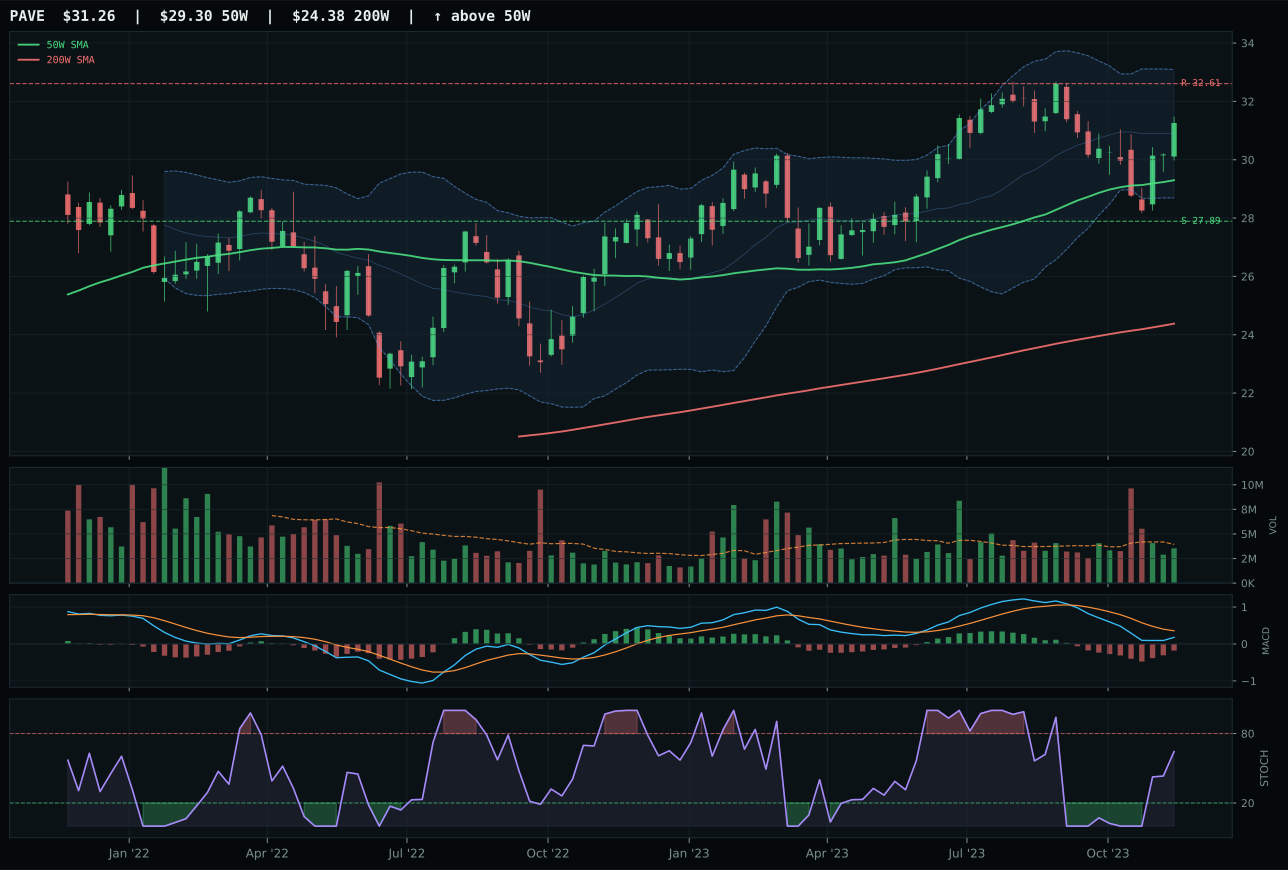
PAVE has a neutral structure profile with -3.4% 13-week relative strength versus SPY.
A failed hold above support would weaken the setup.
Actionable but governed by invalidation levels.
IGF wins Utilities & Infrastructure by delivering perfect timing in a pullback setup. Price is 2.3% below the 50W—a near-perfect entry zone—and compression is tight at 82.6, signaling that resistance at 47.95 is within reach if buyers step in. Timing scored a perfect 100.0 because MACD is bullish and improving, stochastic RSI is overbought momentum at 1.00, and the Fib zone sits at the 0.500 mid-point, a classic mean-reversion inflection. The 4-week return of 8.8% proves buyers are already accumulating despite the 13-week return of only 0.3%, which confirms this is early-stage mean reversion rather than continuation of downtrend. Category-relative strength of 0.5% is neutral but positive. Structure at 69.7 is solid for a compression setup. XLU lost primarily because timing was weaker at 75.0—it is not as close to key moving averages—and category-relative strength of -1.7% shows it is lagging within peers. The 22.3-point category score gap reflects IGF's superior setup geometry.
Utilities & Infrastructure receives 5% tier-2 allocation because the category score of 62.9 ranks it among the higher-scoring middle-tier categories but outside the top-2 overweight. Macro fit of 54.0 is supported by disinflation help (+7) and disinflation pressure descriptor (+6), making this one of the better macro fits in the portfolio. Infrastructure yields become more attractive as nominal rates fall, and regulated utility cash flows benefit from lower discount rates. IGF's 100.0 timing score and compression near-support setup signal this is a clean entry, not chasing extension. However, the category's structural relationship to interest rates means it could suffer if rate expectations reverse suddenly; the 5% allocation reflects confidence in the near-term setup but caution on macro durability. This position works best in a scenario where rates fall further and risk appetite remains stable; it becomes vulnerable if bond yields stabilize or equity risk premiums compress. The allocation is a defensive barbell piece that works as a hedge against equity drawdown scenarios.
Emerging Markets — ILF
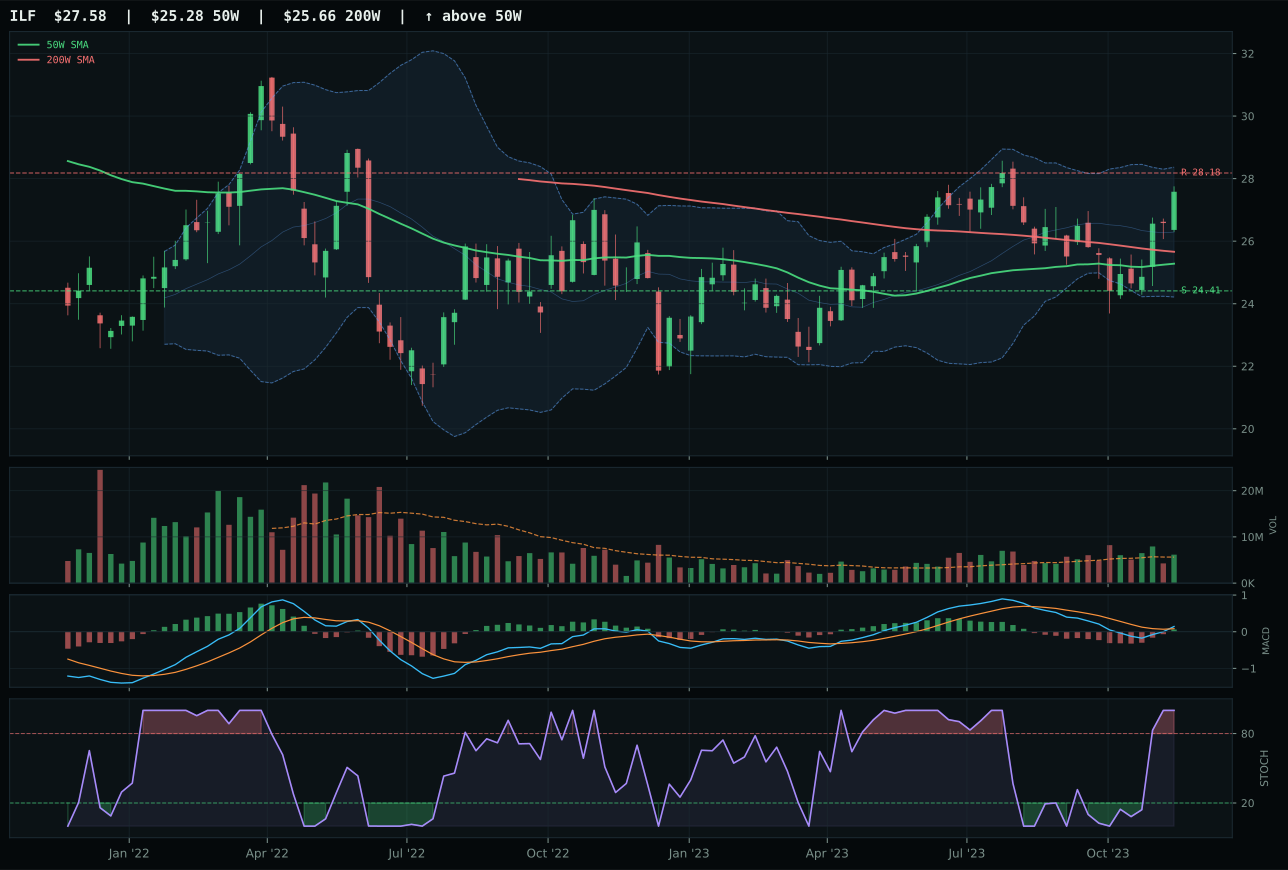
ILF has a neutral structure profile with 3.1% 13-week relative strength versus SPY.
A failed hold above support would weaken the setup.
Actionable but governed by invalidation levels.
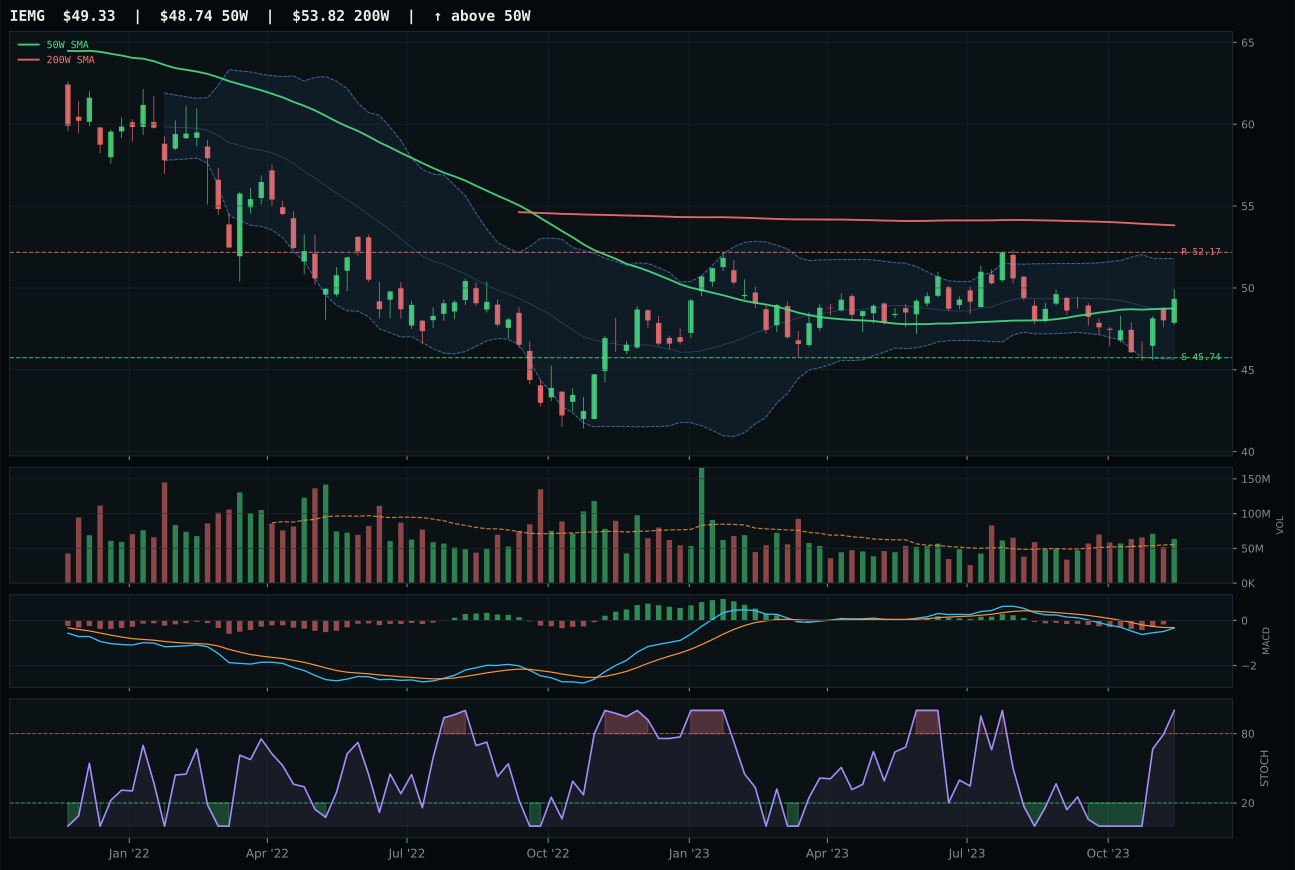
IEMG has a compression near 50W profile with -0.6% 13-week relative strength versus SPY.
A failed hold above support would weaken the setup.
Actionable but governed by invalidation levels.
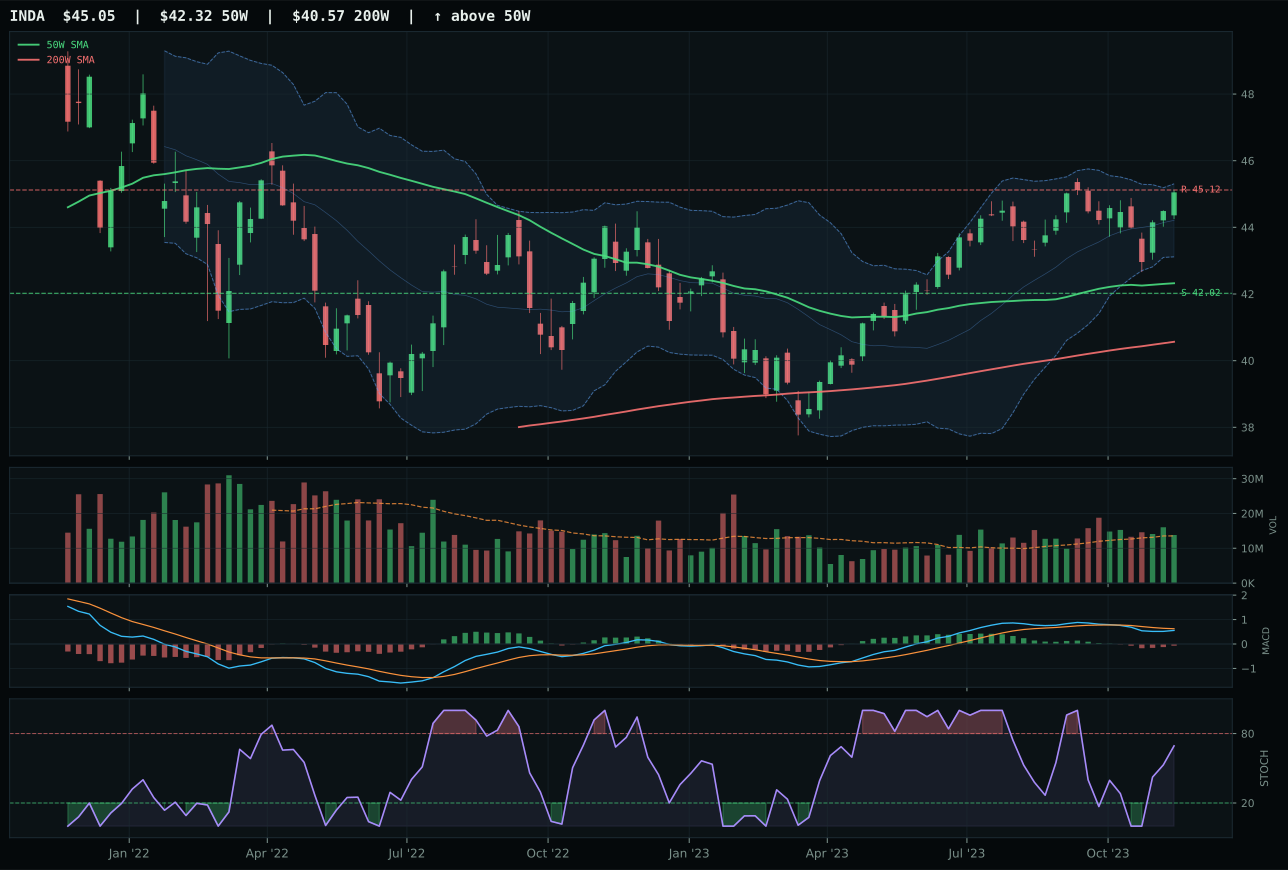
INDA has a neutral structure profile with 0.7% 13-week relative strength versus SPY.
A failed hold above support would weaken the setup.
Actionable but governed by invalidation levels.
ILF wins Emerging Markets because it combines bullish MACD with stronger trend mechanics than its peers. Price is 9.1% above the 50W with a near-flat 0.1% slope—solid foundation without excess extension—and the 13-week return of 6.4% is modest but clean. Crucially, MACD is bullish and improving, a significant advantage over IEMG's bearish but improving profile. Category-relative strength of 2.4% proves ILF is gaining ground within its peer set, while IEMG's -1.3% relative strength shows it is losing the technical battle despite higher volume participation. Trend scored 94.6 for ILF and structure scored 73.5, both strong. The 4-week return of 11.9% combined with neutral volume at 1.09x average suggests accumulation is happening without forced chasing. IEMG lost because its MACD is weaker, structure is less clean at 70.5, and category-relative weakness of -1.3% indicates institutional capital is flowing to ILF rather than broad EM.
Emerging Markets receives 5% tier-2 allocation because the category score of 54.9 places it firmly in the middle pack, below top-2 overweights but above zero-allocation categories. Macro fit of 35.0 is weak; credit stress (-8) and liquidity stress (-7) are active headwinds that constrain EM outflows in disinflation. ILF specifically is Latin America commodity and value beta, meaning it benefits from any risk-appetite spike but suffers if credit stress intensifies or capital rotation reverses. The 5% allocation reflects ILF's clean technical setup and relative-strength leadership within EM, not a macro conviction on emerging markets broadly. This category sits at the margin; if broader macro deteriorates, EM is first to sell; if risk appetite strengthens, it is first to bounce. The allocation is a tactical probe into the idea that disinflation may support EM real asset pricing, but the position must remain humble given the active macro headwinds.
Precious Metals — GLD
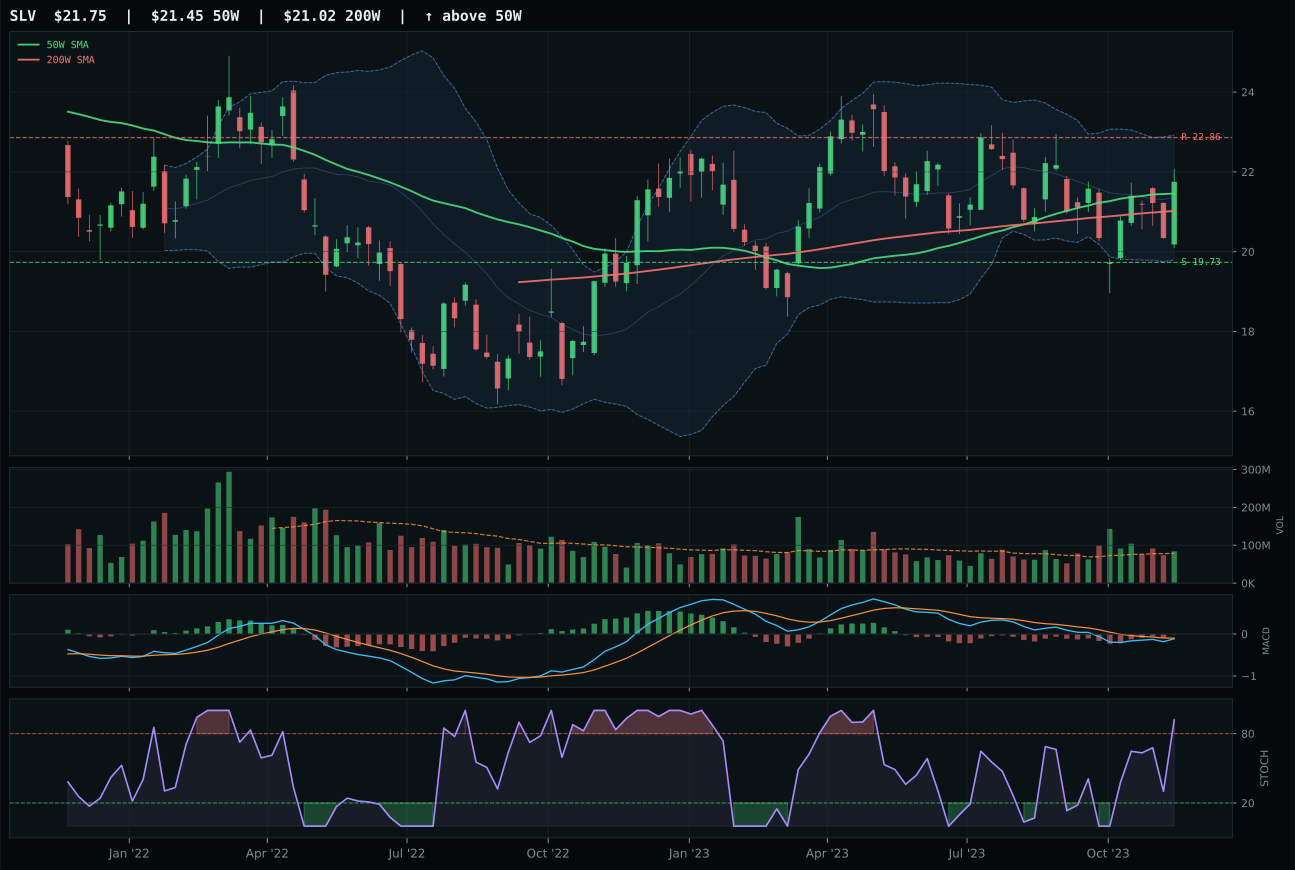
SLV has a compression near 50W profile with 0.9% 13-week relative strength versus SPY.
A failed hold above support would weaken the setup.
Actionable but governed by invalidation levels.
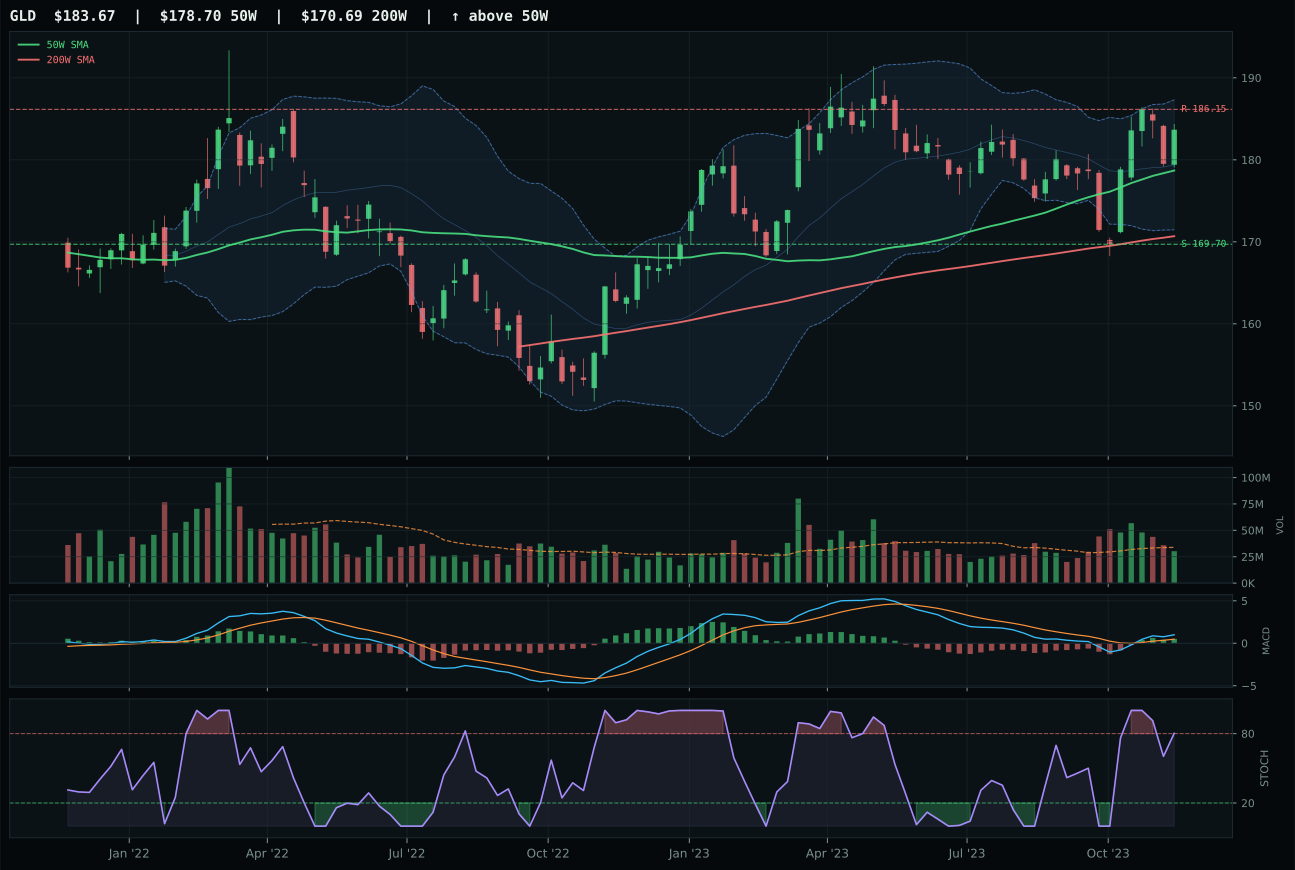
GLD has a compression near 50W profile with 1.5% 13-week relative strength versus SPY.
A failed hold above support would weaken the setup.
Actionable but governed by invalidation levels.
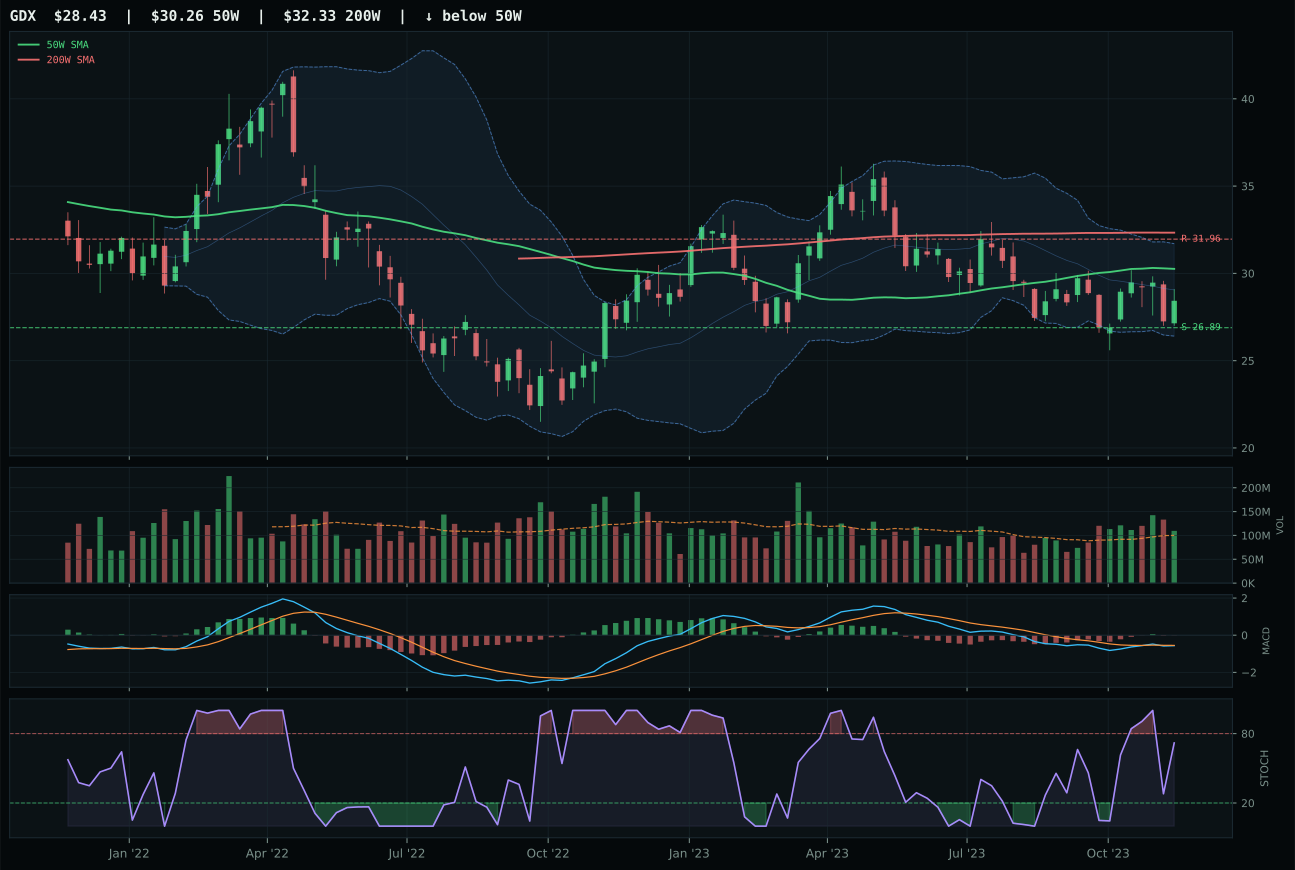
GDX has a neutral structure profile with 0.3% 13-week relative strength versus SPY.
Extension and support failure are the main tactical risks.
Tracked, but not top-2 eligible because: structurally broken.
GLD wins Precious Metals because it owns the cleanest technical signal: MACD is bullish and improving, a critical advantage over SLV's bearish but improving status. Price sits 2.8% above the 50W in compression, which provides expansion potential if 50W support holds, and at that proximity to the moving average, new buyers are not chasing extended moves but instead defending a level. The 13-week return of 4.8% is modest but sustained, and category-relative strength of 0.5% signals GLD is slightly outpacing its peer median. Stochastic RSI at 0.80 is overbought rolling over—not yet crashed—suggesting there is room for accumulation before exhaustion. Structure scored 75.7 for GLD versus SLV's 70.5, reflecting cleaner compression mechanics and higher confidence that any expansion will be sponsor-driven. SLV's lagging MACD and 0.0% category-relative strength mean it is not gaining traction within its own peer set.
Precious Metals receives 5% tier-2 allocation because the category score of 54.4 does not crack the top-2 overweight threshold, placing it in the middle ranks. The disinflation descriptor actively supports this category at +8 macro points—lower discount rates raise real yields on non-yielding gold—but risk appetite is negative at -4, creating a mixed macro profile. GLD's technical evidence of 69.9 is respectable but not exceptional compared to top-2 categories, and macro fit of 54.0 reflects this tension: gold benefits from falling nominal yields but suffers if equity risk appetite remains firm. The 5% allocation acknowledges disinflation tailwinds and GLD's clean trend setup, but the category's reliance on tail-risk pricing means it ranks below offensive growth exposures. This slot is best viewed as a modest portfolio ballast that can expand if equity volatility spiked or if macro surprise shifted toward hard landing; for now, it's a holding pattern awaiting either greater macro urgency or a break above resistance at 186.15.
Defense & Aerospace — XAR
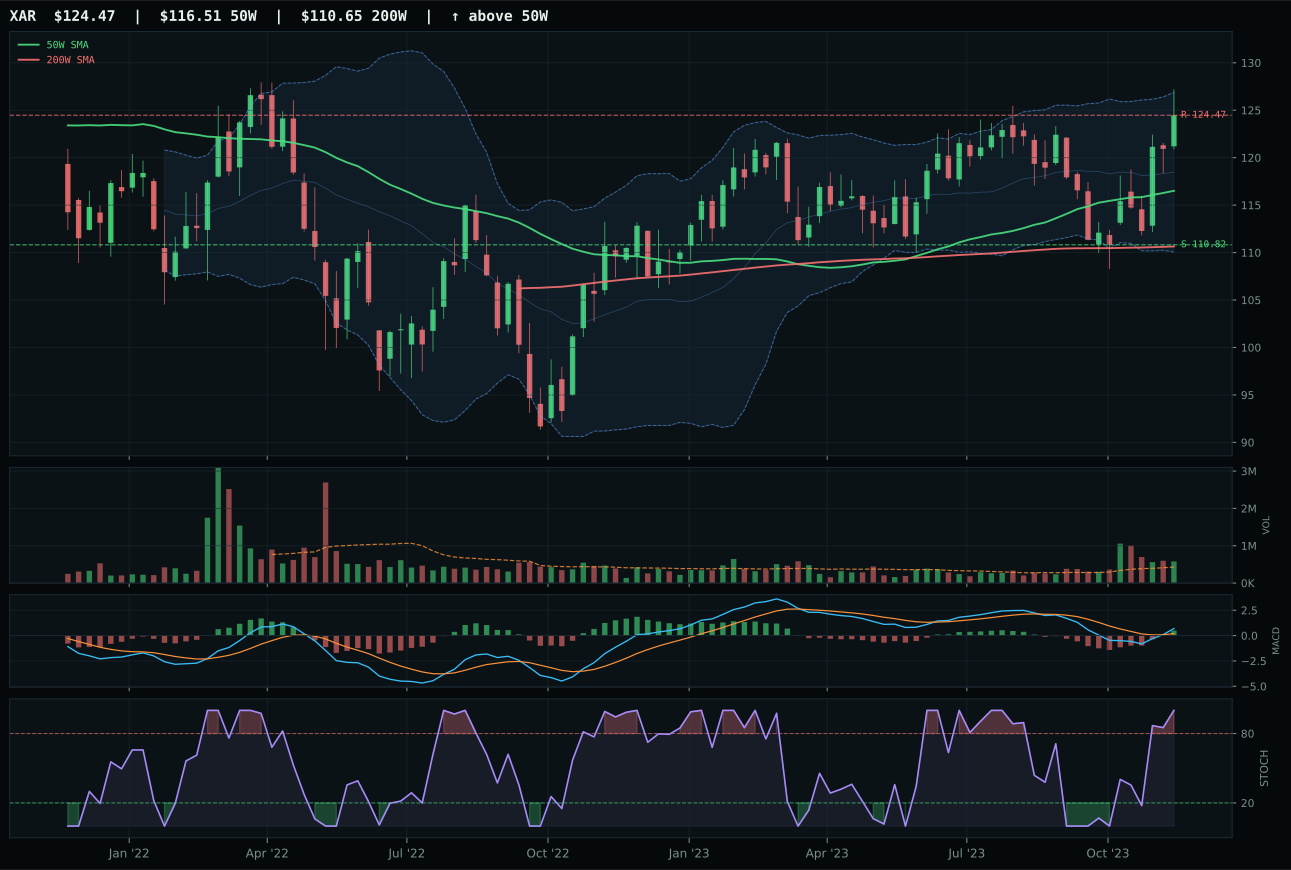
XAR has a neutral structure profile with 1.0% 13-week relative strength versus SPY.
A failed hold above support would weaken the setup.
Actionable but governed by invalidation levels.
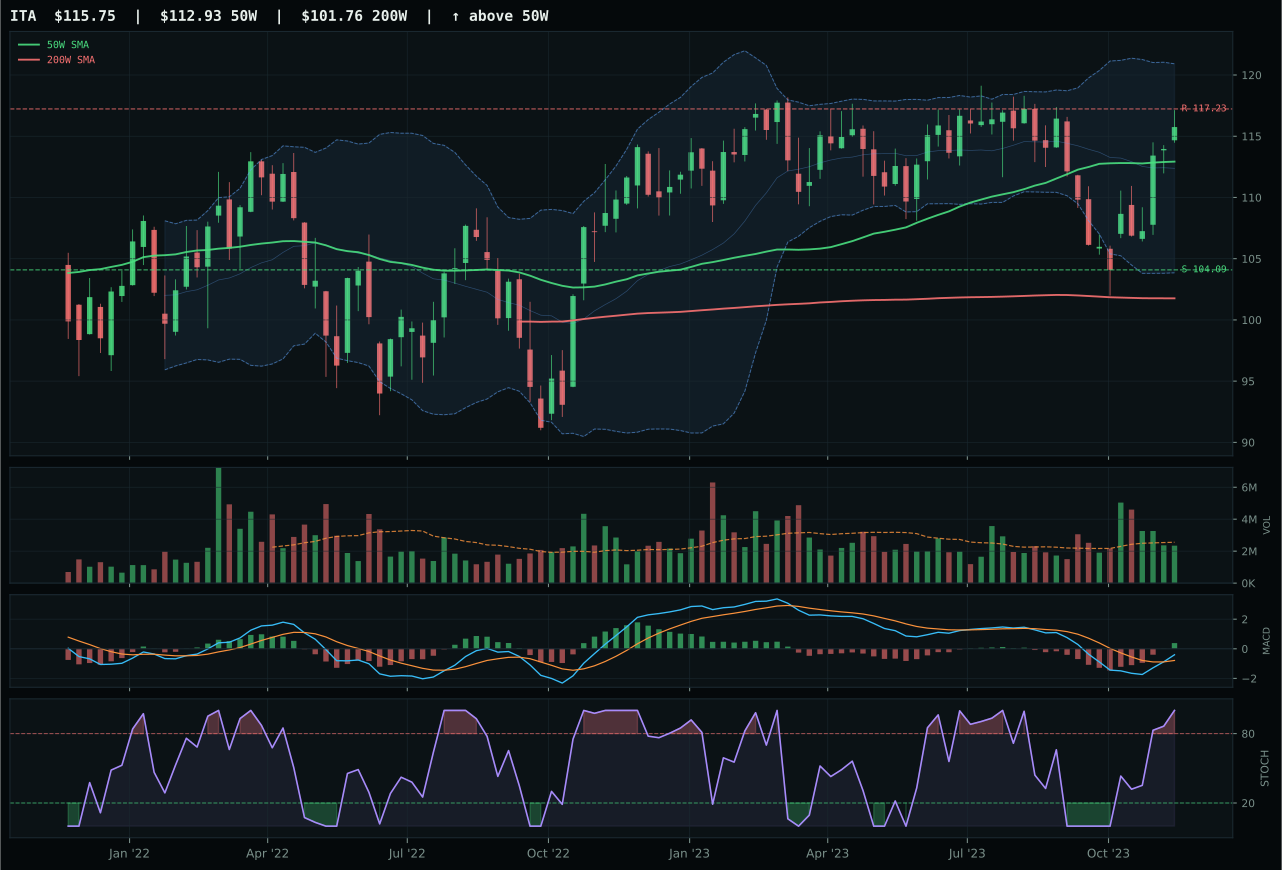
ITA has a compression near 50W profile with -2.3% 13-week relative strength versus SPY.
A failed hold above support would weaken the setup.
Actionable but governed by invalidation levels.
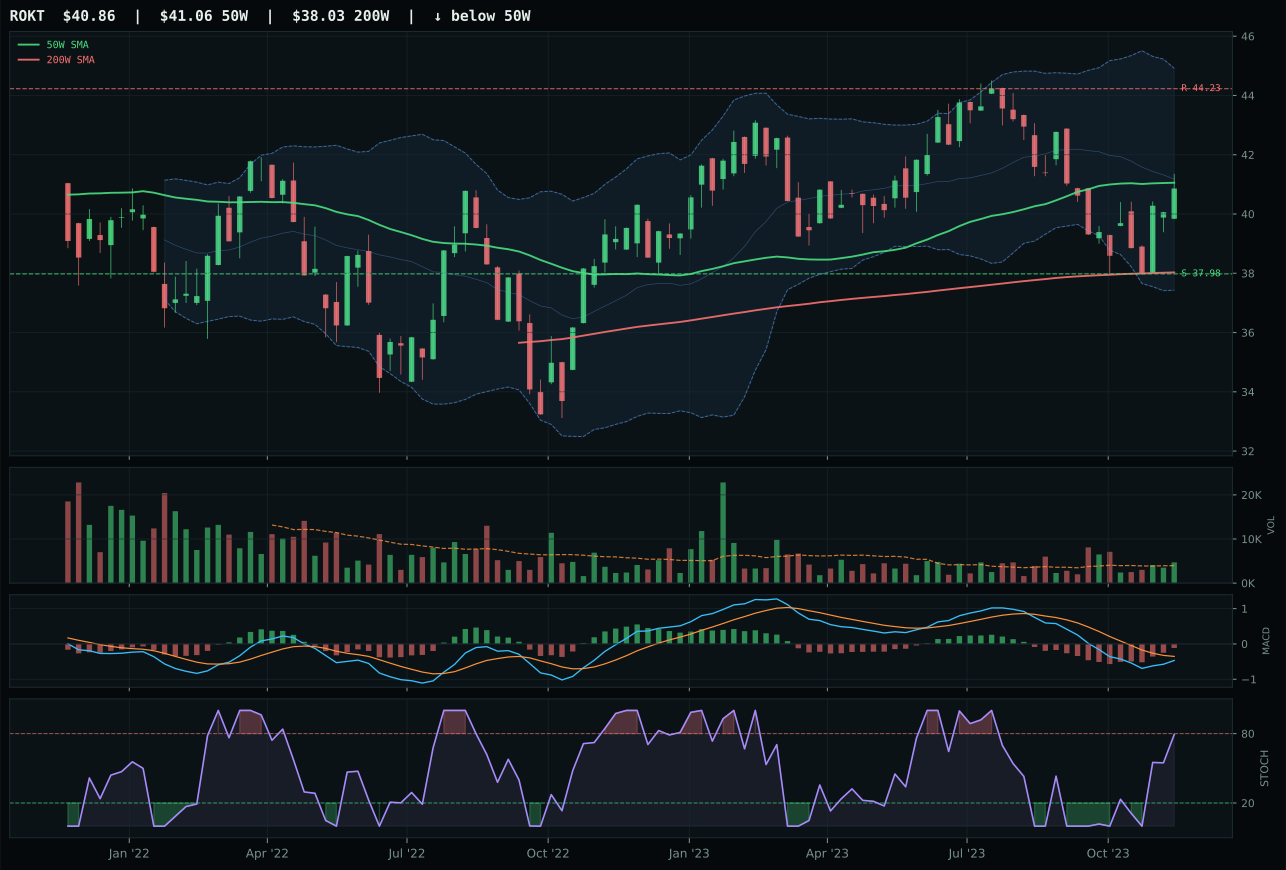
ROKT has a compression near 50W profile with -5.0% 13-week relative strength versus SPY.
A failed hold above support would weaken the setup.
Tracked, but not top-2 eligible because: .
XAR wins Defense & Aerospace through superior volume sponsorship and timing. Price sits only 6.8% above the 50W with a shallow 0.2% slope, which would normally reduce conviction, but XAR's volume at 1.36x average participation and above-average momentum confirmation score of 91.8 shows institutional accumulation despite neutral structure. The MACD is bullish and improving, stochastic RSI hits overbought at 1.00, and the Fib zone sits in upper retracement / momentum, indicating this is not an extension chase but a clean breakout from a consolidation. Risk-reward is favorable at 56.7, offering 12.3% downside to support against potential upside to resistance. ITA lost because its risk-reward is weaker at 47.0, volume participation is neutral, and category-relative strength of 0.0% versus XAR's 3.3% reveals XAR is pulling ahead within the peer group. The 1.1-point category score gap is tight, but XAR's volume conviction tips the balance.
Defense & Aerospace receives 5% tier-2 allocation despite ranking third overall because the category score of 53.9 places it firmly outside the top-2 overweight threshold. XAR's technical evidence is strong at 87.4, but macro fit of 50.0 is neutral—no category-specific descriptor profile was available—and broader portfolio macro headwinds (liquidity stress -4) do not align. In disinflation, defense typically trades as a barbell: either a crisis hedge or a benign-regime afterthought. This week's allocation reflects XAR's clean timing and volume sponsorship as sufficient justification for a small conviction position, but the category's lack of macro tailwind keeps it from competing with AI or Technology for larger capital. The 5% slot signals opportunity for tactical accumulation if technical deterioration accelerates elsewhere, but does not represent a core thematic positioning.
Industrial Metals — PICK
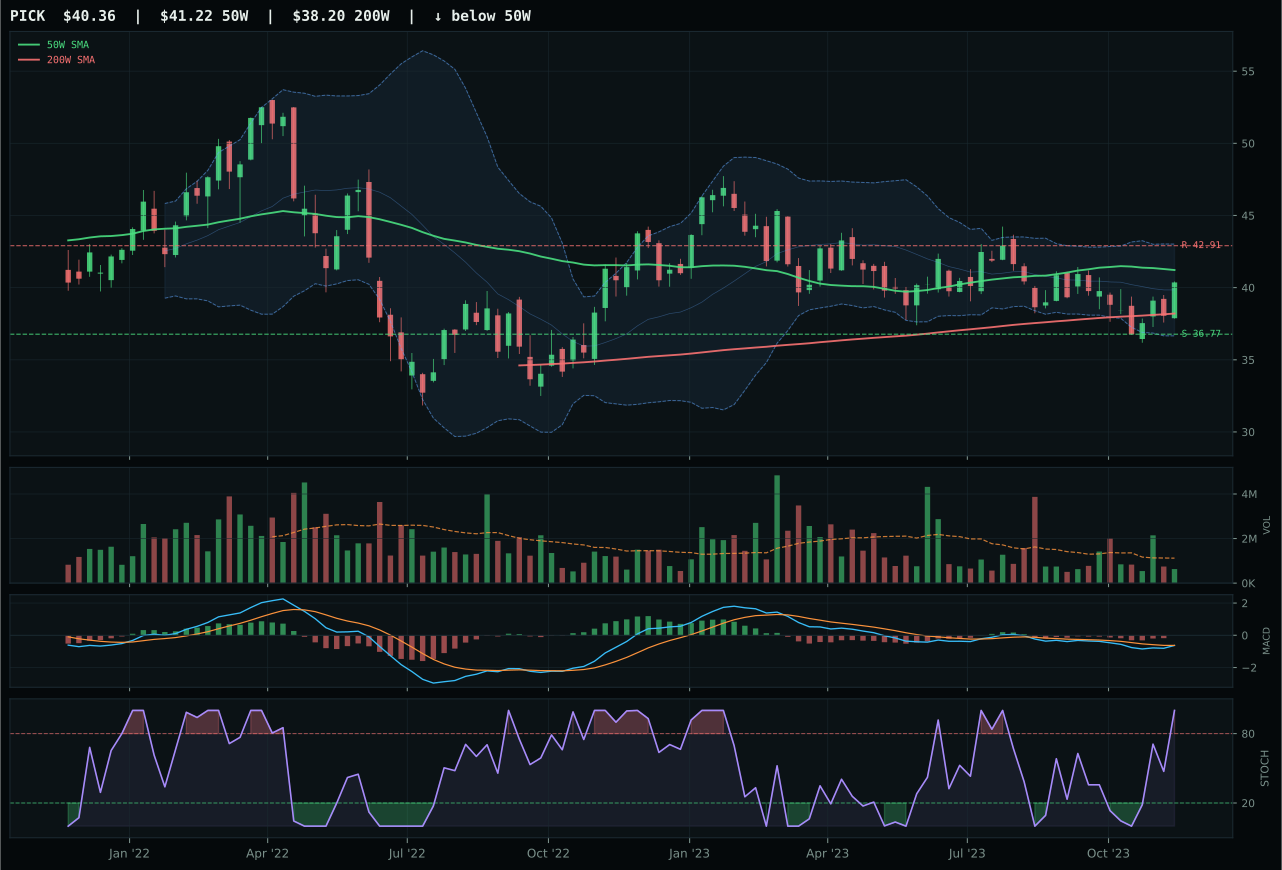
PICK has a compression near 50W profile with 1.2% 13-week relative strength versus SPY.
A failed hold above support would weaken the setup.
Actionable but governed by invalidation levels.
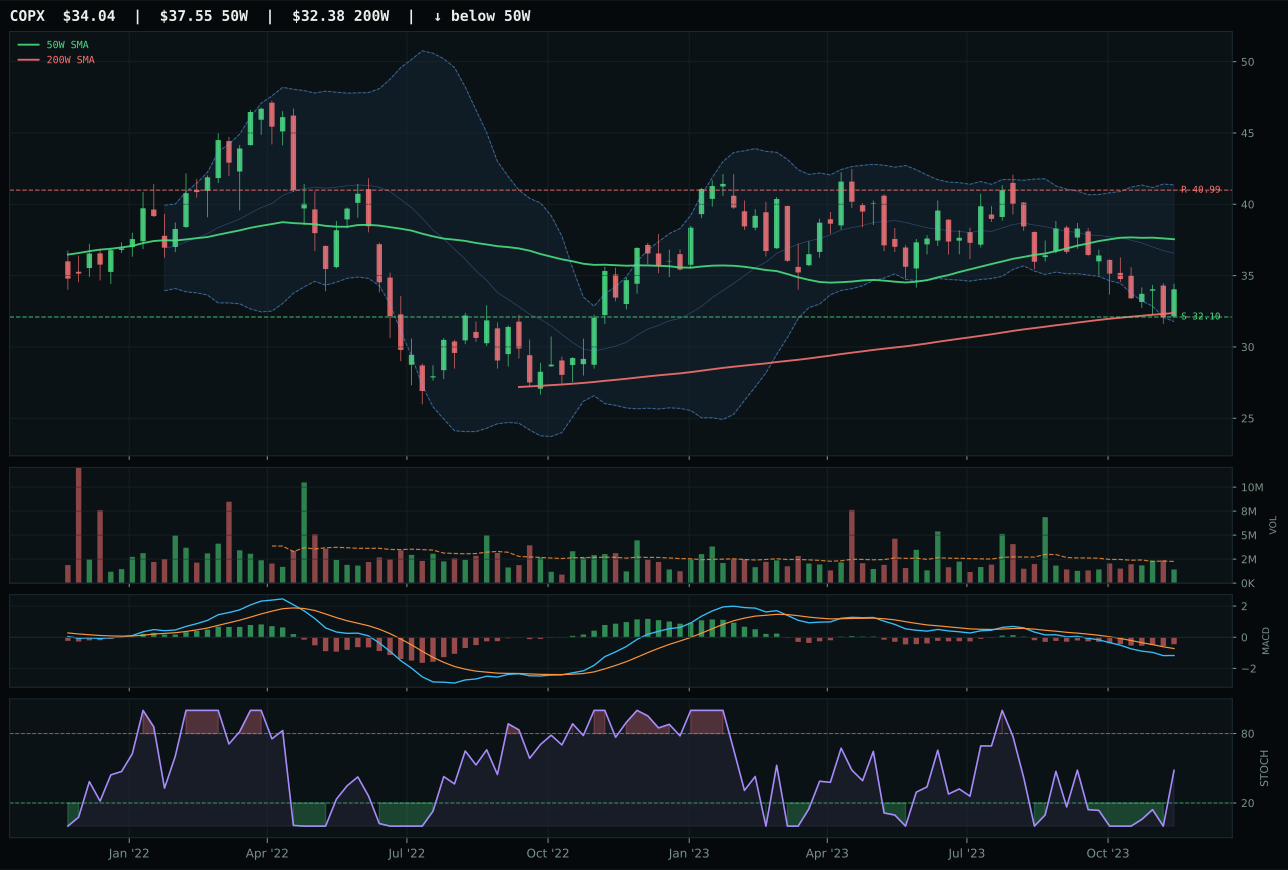
COPX has a neutral structure profile with -8.6% 13-week relative strength versus SPY.
A failed hold above support would weaken the setup.
Actionable but governed by invalidation levels.
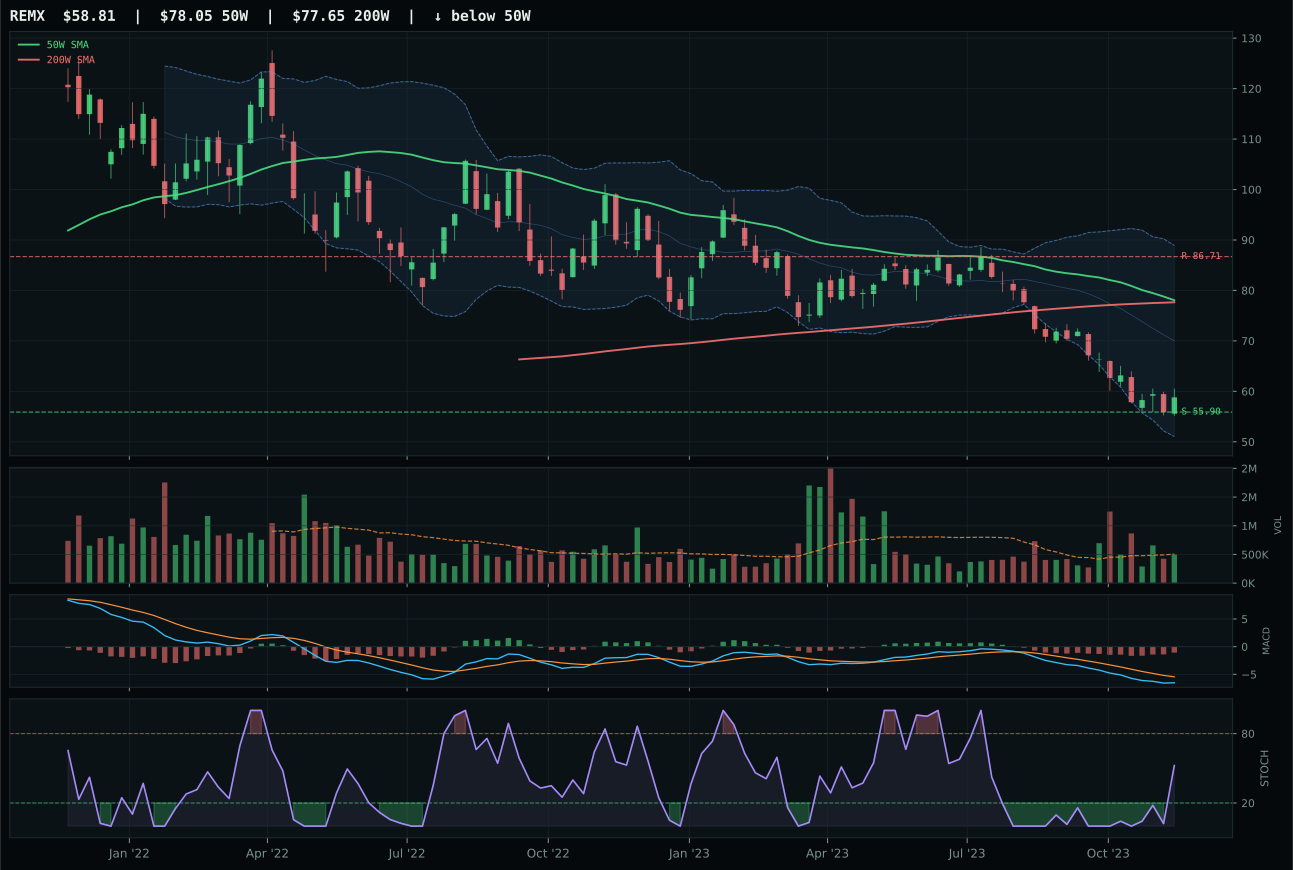
REMX has a neutral structure profile with -21.9% 13-week relative strength versus SPY.
A failed hold above support would weaken the setup.
Actionable but governed by invalidation levels.
PICK wins Industrial Metals because it commands the most favorable risk-reward and timing in an otherwise weak category. Price is 2.1% below the 50W but still above the 200W, and the chart is compressing near the 50W—a textbook setup for expansion if support holds. Crucially, timing scored 100.0 because MACD is bearish but improving, stochastic RSI is overbought momentum at 1.00, and the Fib zone sits in deep retracement / value near 0.618, signaling a tested low. The 4W return of 9.8% coupled with 13W return of 4.5% and category-relative strength of 9.8% show PICK is pulling away from peer laggards. Risk-reward of 64.0 offers 9.8% downside to support and -5.9% upside to resistance, an asymmetry that rewards tactical entry. COPX lost because timing is weaker at 83.0, structure is less clean at 64.9, and category-relative strength of 0.0% proves it is not gaining ground within peers. The 17.3-point gap reflects COPX's failure to confirm recovery from its lows.
Industrial Metals receives 5% tier-2 allocation because the category score of 20.9 ranks it outside the top-2, reflecting both technical weakness and severe macro headwinds. The category-level macro fit is only 35.0, dragged down by liquidity stress (-8) and credit stress (-7) that penalize cyclical commodity demand in a disinflation regime. PICK's technical evidence of 65.6 is adequate for a tactical position, but the macro case is fragile: lower inflation reduces industrial production expectations, and miners face cost pressures that reduce profitability. The 5% allocation reflects PICK's favorable timing setup—it is near support and early in recovery—and the view that any risk-appetite spike would lift the entire category. However, this is a conditional position; if credit stress intensifies or PICK loses the 50W support at 36.77, the allocation should contract sharply. The slot exists primarily to avoid missing a mean-reversion if macro sentiment shifts, not because the structural case is compelling.
Agriculture & Livestock — MOO
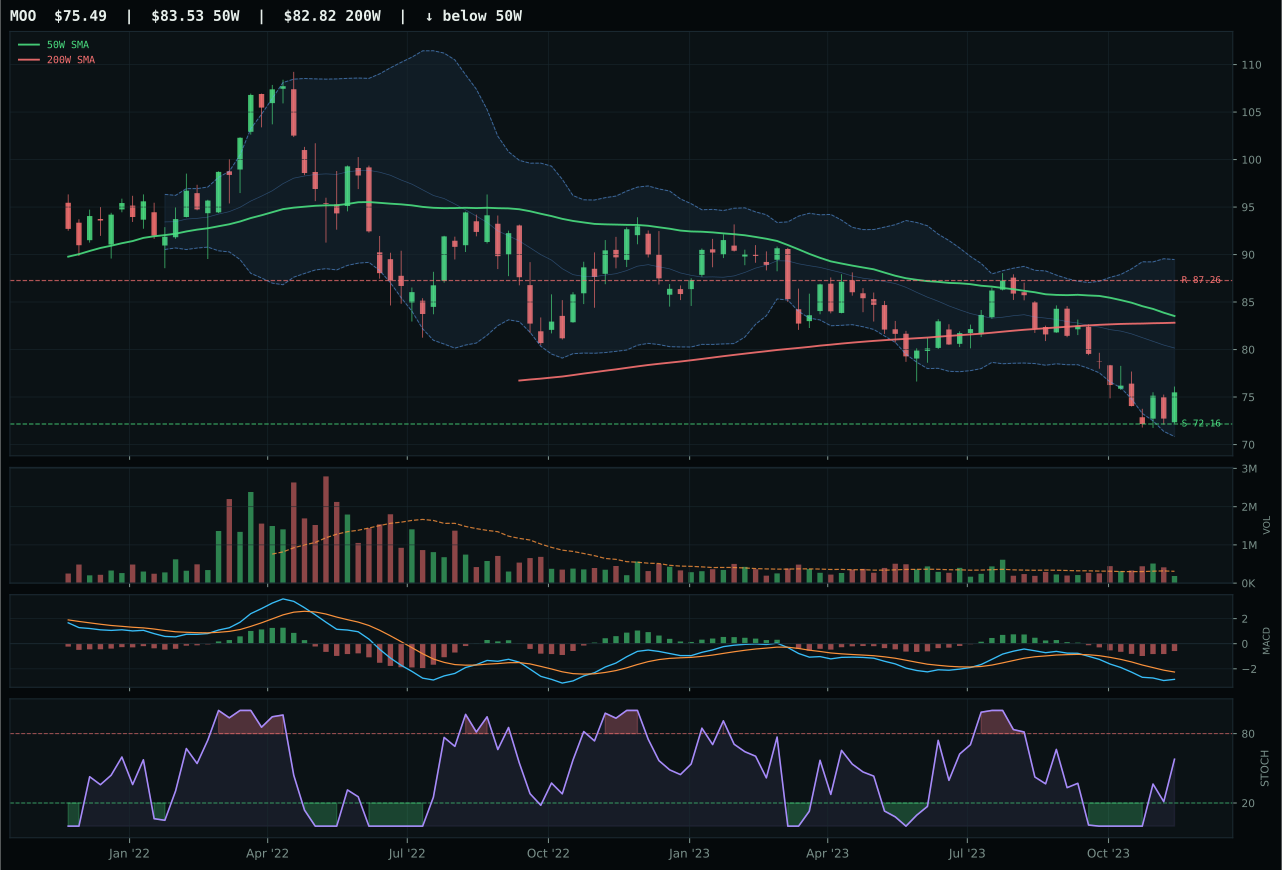
MOO has a pullback into support profile with -11.4% 13-week relative strength versus SPY.
A failed hold above support would weaken the setup.
Actionable but governed by invalidation levels.
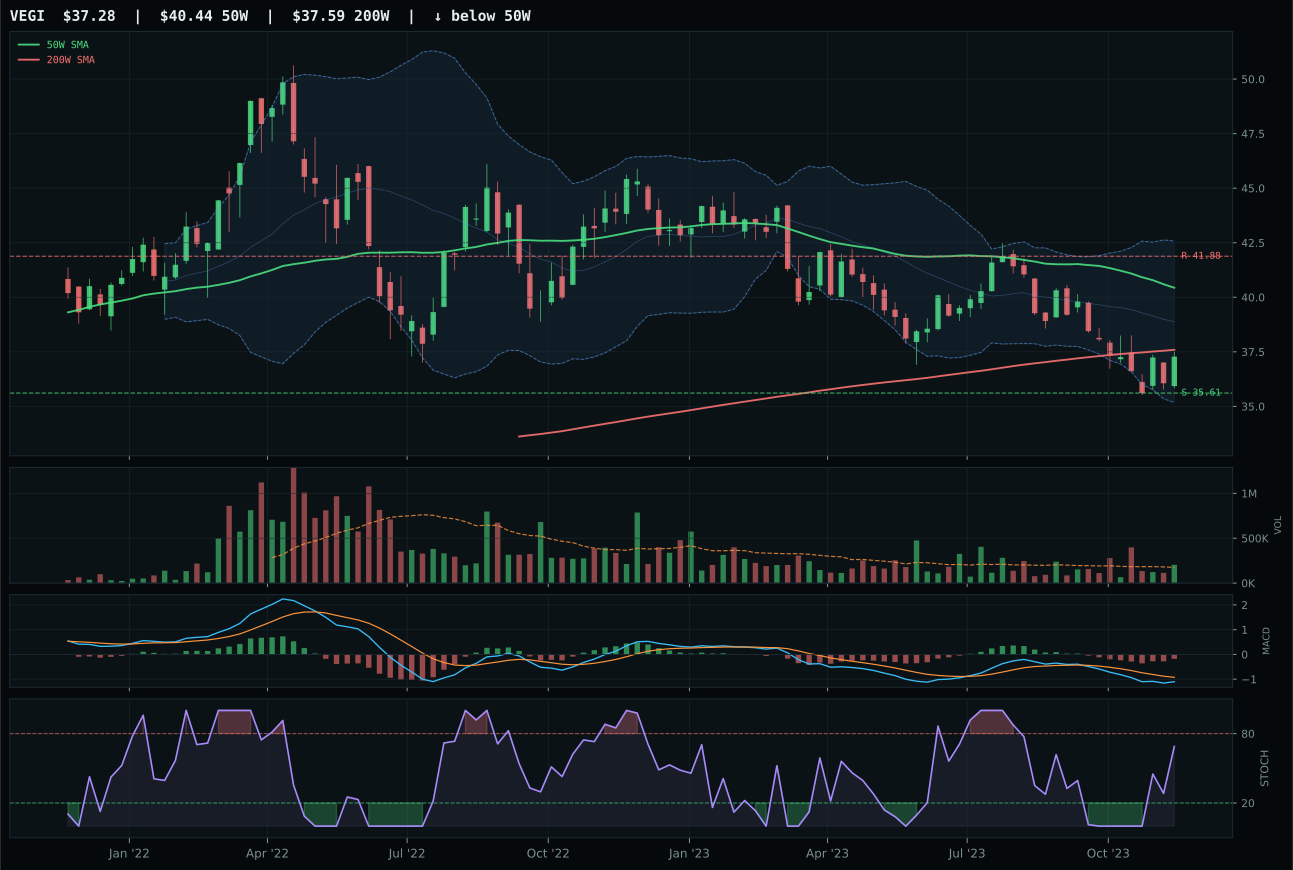
VEGI has a pullback into support profile with -8.3% 13-week relative strength versus SPY.
A failed hold above support would weaken the setup.
Tracked, but not top-2 eligible because: .
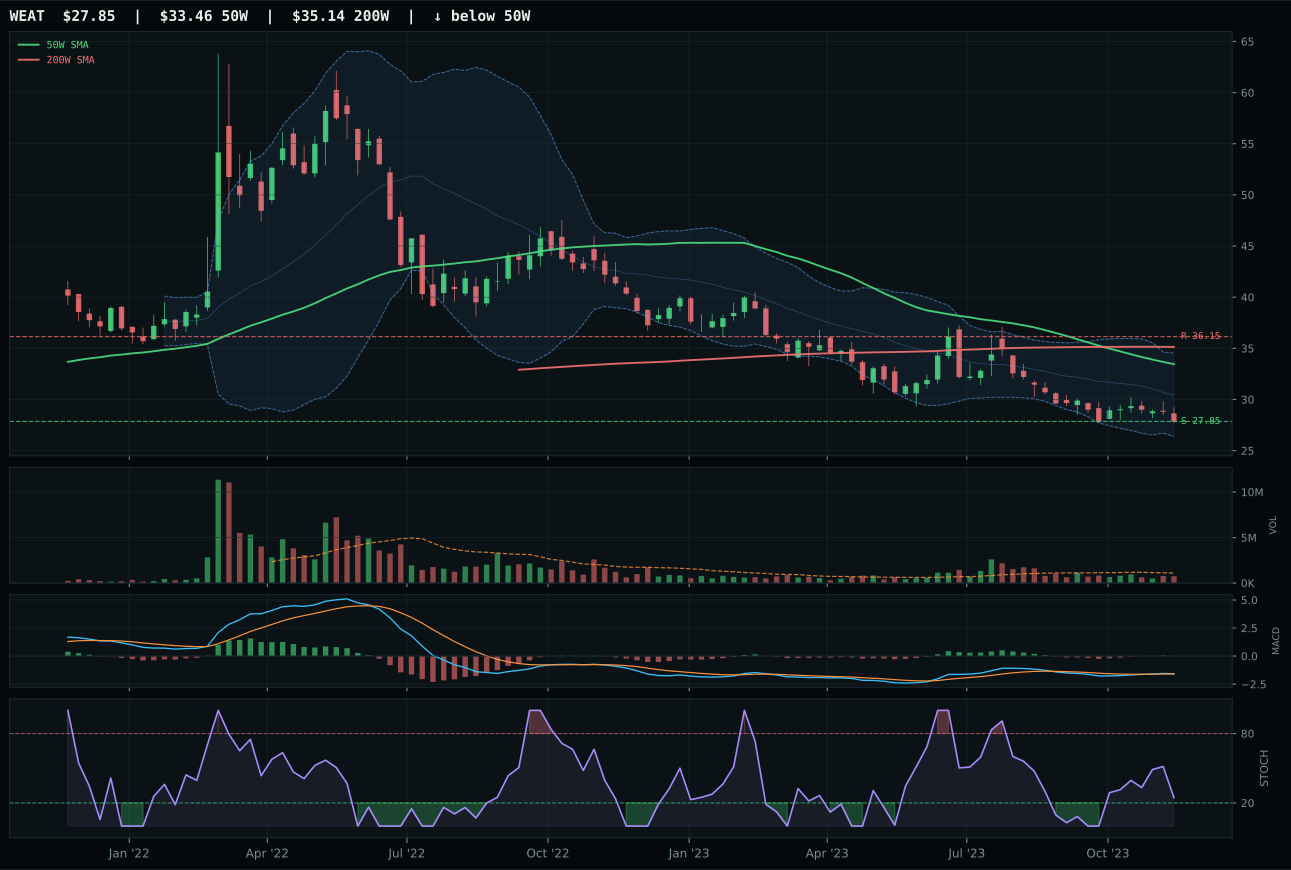
WEAT has a pullback into support profile with -14.7% 13-week relative strength versus SPY.
Extension and support failure are the main tactical risks.
Tracked, but not top-2 eligible because: structurally broken.
MOO wins Agriculture & Livestock by default in what is a weak category; the victory margin versus VEGI is only 0.8 points on technical merit and represents the lesser of two undesirable setups. Price is 9.6% below the 50W moving average, confirming this is a broken uptrend, and 13-week return of -8.2% with SPY-relative weakness of -11.4% shows the category is structurally out of favor. MOO's sole advantage is its risk-reward score of 90.0, which offers 4.6% downside to support and -13.5% upside to resistance—a favorable asymmetry for a pullback setup. MACD is bearish but improving and stochastic RSI is rising mid-zone, telegraphing early-stage recovery rather than continuance of selling. Volume at 0.60x average is thin, meaning any rebound will require fresh accumulation rather than short-covering. VEGI lost because its risk-reward of 87.2 trails MOO's 90.0, a marginal technical edge that matters only because neither setup is compelling.
Agriculture & Livestock receives 0% allocation this week, ranking 9th or 10th among categories, because the category score collapsed to 2.3 after the category reasoner tested the ETF basket against macro state and eligibility filters. Disinflation pressure is actively penalizing this exposure at -8 macro points, and liquidity stress at -4 compounds the headwind. The category-level macro fit of 32.0 is among the weakest in the portfolio, reflecting structural disinterest in commodity input costs during a deflationary cycle. MOO's technical evidence of 49.8 is barely half of what the best categories deliver, and thin participation at 0.60x average means any rebound lacks institutional conviction. This category needs either macro pivot back toward inflation risk or technical repair that breaks price above key moving averages; neither condition is present. Allocation will remain zero until MOO reclaims the 50W and volume participation picks up materially.
Traditional Energy — XOP
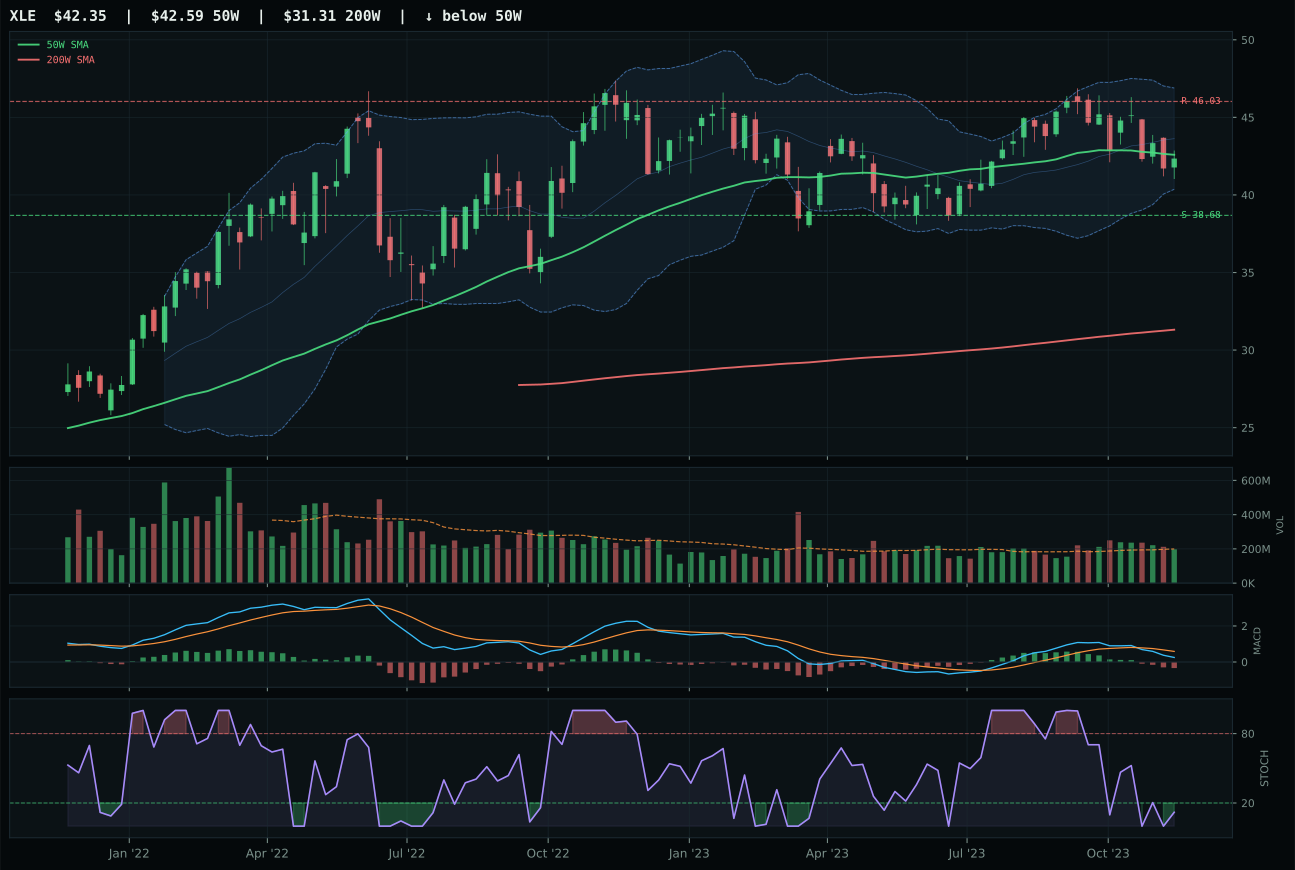
XLE has a compression near 50W profile with -7.9% 13-week relative strength versus SPY.
A failed hold above support would weaken the setup.
Actionable but governed by invalidation levels.
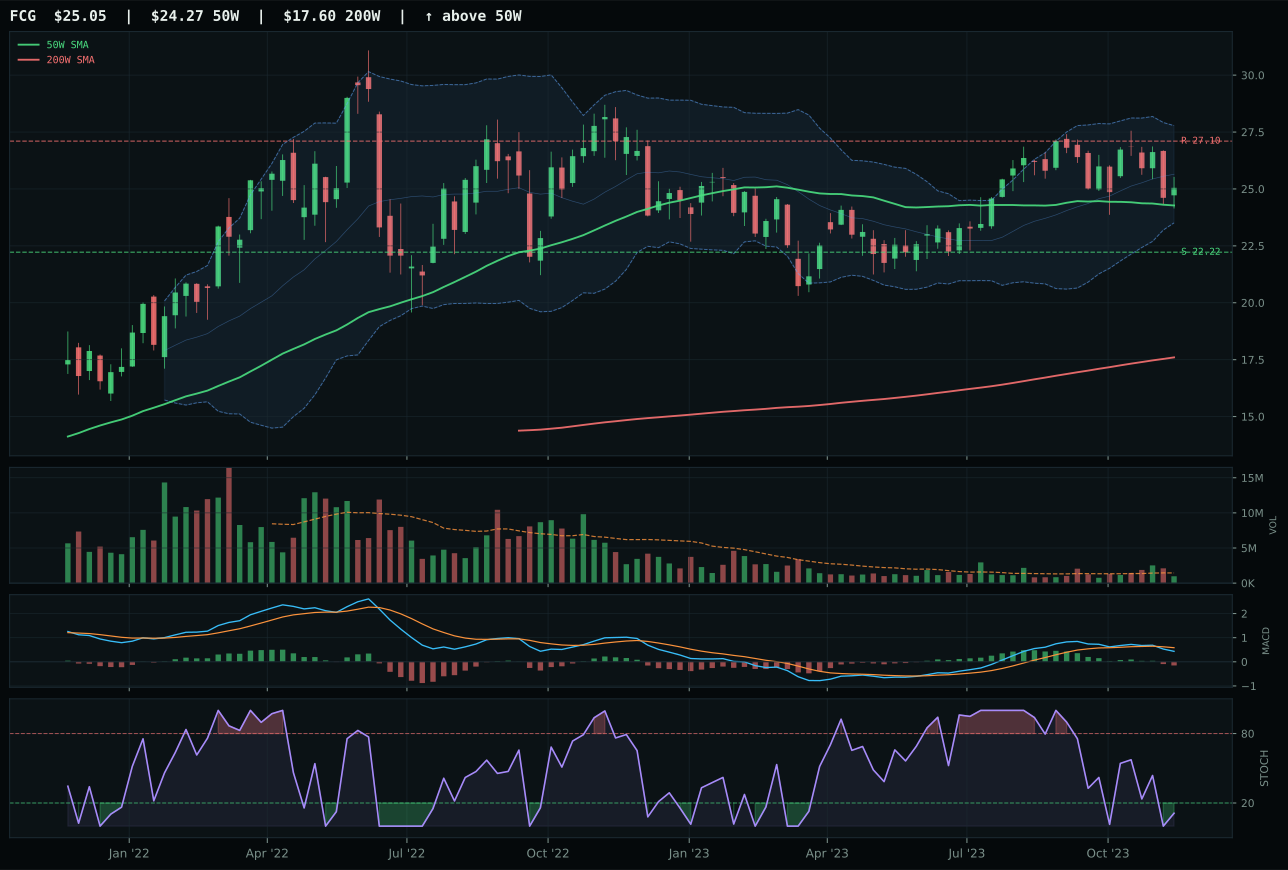
FCG has a neutral structure profile with -7.6% 13-week relative strength versus SPY.
A failed hold above support would weaken the setup.
Actionable but governed by invalidation levels.
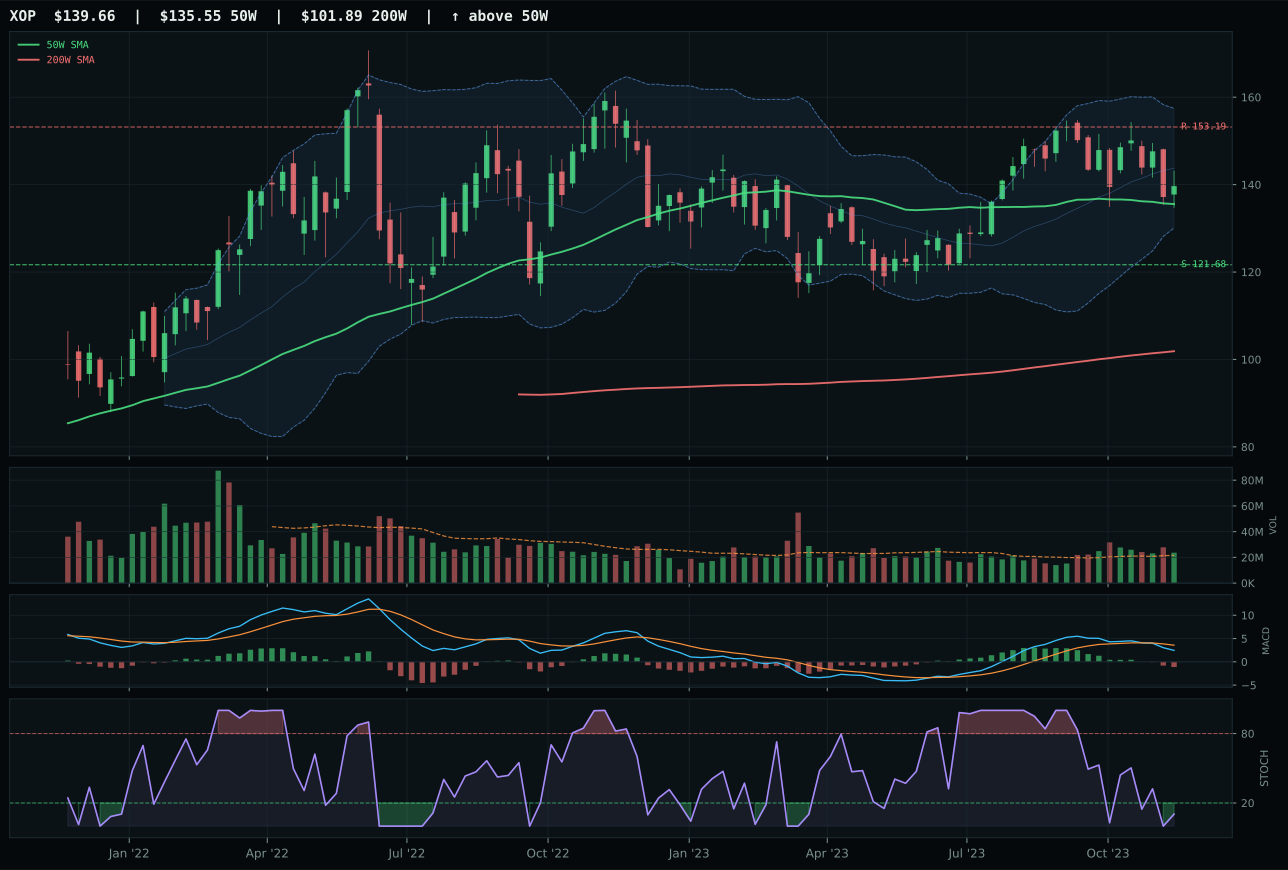
XOP has a neutral structure profile with -8.8% 13-week relative strength versus SPY.
A failed hold above support would weaken the setup.
Actionable but governed by invalidation levels.
XOP wins Traditional Energy by a narrow margin over XLE, but this victory is hollow because both setups are structurally challenged. Price sits 3.0% above the 50W with a flat -0.1% slope, meaning the uptrend is stalling, and the MACD is bearish/weakening—a significant warning. The 13-week return of -5.6% confirms that energy is being actively sold into any relief bounce, and SPY-relative weakness of -8.8% shows this is a structural underperformance, not a temporary divergence. Risk-reward of 63.8 looks favorable only because the category is so weak; it offers potential 14.8% downside cushion to support. Stochastic RSI at 0.10 is oversold, technically suggesting oversold relief bounce potential. XLE lost because it has compression near the 50W rather than neutral structure, and its MACD is bearish/weakening with stochastic RSI oversold turn up, denying it even the thin technical edge XOP possesses. Neither setup is investable on its merits.
Traditional Energy receives 0% allocation this week, ranking among the bottom categories, because the category score of 0.4 reflects near-complete macro misalignment in a disinflation regime. The category-level macro fit is devastatingly low at 16.0, with disinflation pressure penalizing at -10 macro points and credit stress at -7. Lower inflation translates directly to lower commodity prices and reduced production economics; this is structural headwind, not temporary noise. XOP's technical evidence of 27.6 is among the weakest in the portfolio, and momentum confirmation is nearly zero at 2.0, meaning even tactical buyers are not showing up. Volume-price confirmation is thin at 29.2 and persistence is weak at 32.0, confirming this is a category in structural liquidation. The allocation will remain zero until either the macro regime shifts toward inflation or energy makes a clean break above major resistance; right now, any position is fighting the macro tide.