
2023-11-10
Informational purposes only. The content in this report, including allocations, analysis, and commentary, is provided solely for informational and educational purposes. It does not constitute financial advice, investment advice, trading advice, or any other type of advice. Past performance does not guarantee future results. Always conduct your own research and consult a qualified financial professional before making investment decisions.
Weekly Allocation
| Ticker | Category | Weight | Role |
|---|---|---|---|
| FBTC | 50% | Overlay | |
| ITA | Defense & Aerospace | 10% | Top-2 (10%) |
| URA | Nuclear Energy | 10% | Top-2 (10%) |
| XLK | Technology | 5% | Tier-2 (5%) |
| GLD | Precious Metals | 5% | Tier-2 (5%) |
| IGF | Utilities & Infrastructure | 5% | Tier-2 (5%) |
| SMH | AI | 5% | Tier-2 (5%) |
| MOO | Agriculture & Livestock | 5% | Tier-2 (5%) |
| ILF | Emerging Markets | 5% | Tier-2 (5%) |
Trade Instructions — Monday Open
Sell the tranche from 2023-10-13 (completing its 4-week hold). Buy the new tranche. Instructions show net portfolio changes — same-asset positions cancel, weight changes show the delta.
| Action | Ticker | Instruction |
|---|---|---|
| SELL | XLE | Sell 67% of XLE position (reduce 3.75% → 1.25%) |
| SELL | URNM | Sell 50% of URNM position (reduce 5.00% → 2.50%) |
| SELL | XAR | Sell 33% of XAR position (reduce 3.75% → 2.50%) |
| SELL | PAVE | Sell entire PAVE position (1.25% of portfolio) |
| SELL | INDA | Sell 33% of INDA position (reduce 3.75% → 2.50%) |
| BUY | ITA | Buy ITA — 28.57% of freed cash (adds 2.50% to portfolio) |
| BUY | SMH | Buy SMH — 14.29% of freed cash (adds 1.25% to portfolio) |
| BUY | URA | Buy URA — 28.57% of freed cash (adds 2.50% to portfolio) |
| BUY | IGF | Buy IGF — 14.29% of freed cash (adds 1.25% to portfolio) |
| BUY | ILF | Buy ILF — 14.29% of freed cash (adds 1.25% to portfolio) |
Current Portfolio After Trade
Combined holdings across all 4 active tranches. Each tranche is 25% of the portfolio.
| Ticker | % of Portfolio | Weight Bar |
|---|---|---|
| FBTC | 50.00% | |
| GLD | 7.50% | |
| XLK | 5.00% | |
| NLR | 5.00% | |
| MOO | 3.75% | |
| FCG | 3.75% | |
| XLU | 3.75% | |
| ITA | 3.75% | |
| XAR | 2.50% | |
| INDA | 2.50% | |
| URNM | 2.50% | |
| SMH | 2.50% | |
| URA | 2.50% | |
| XLE | 1.25% | |
| COPX | 1.25% | |
| IGF | 1.25% | |
| ILF | 1.25% |
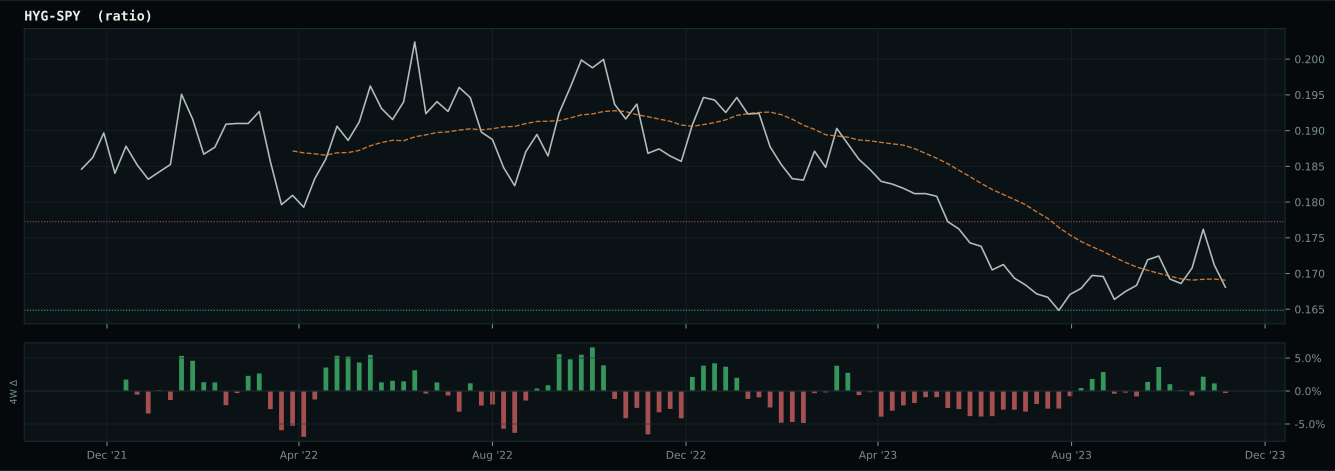
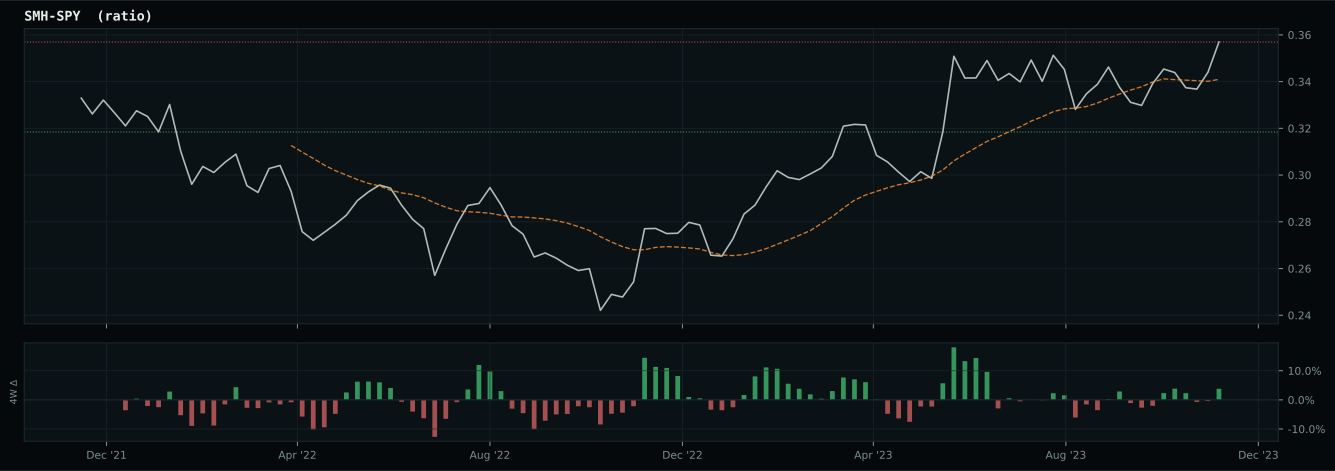
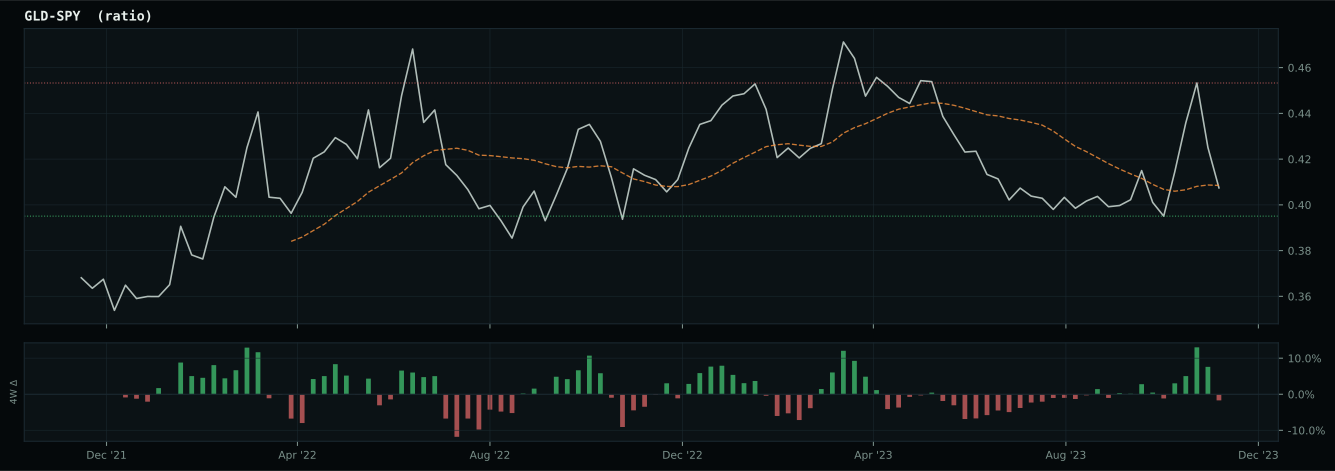
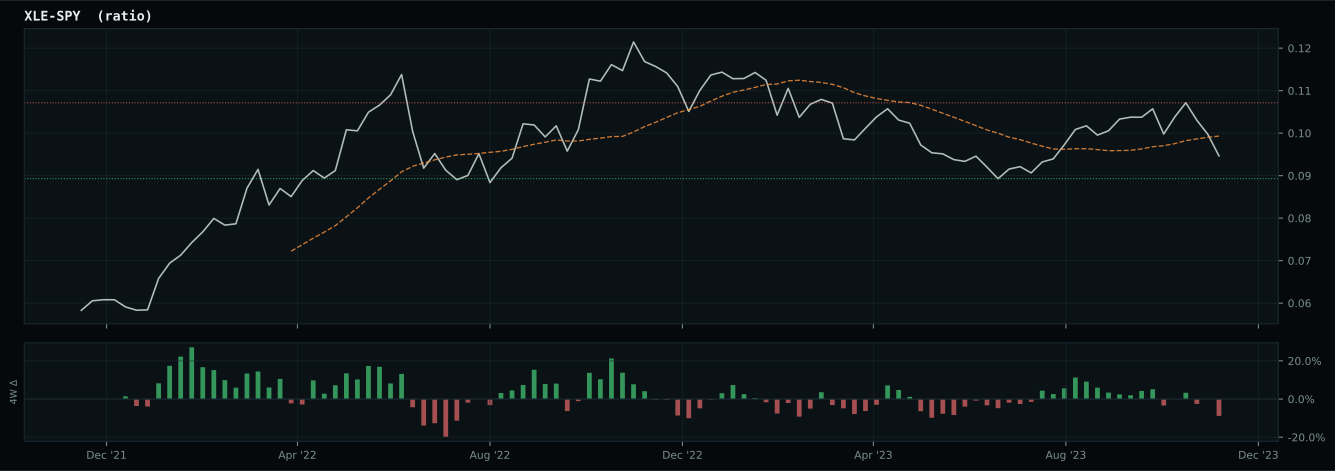
Macro Regime — Disinflation
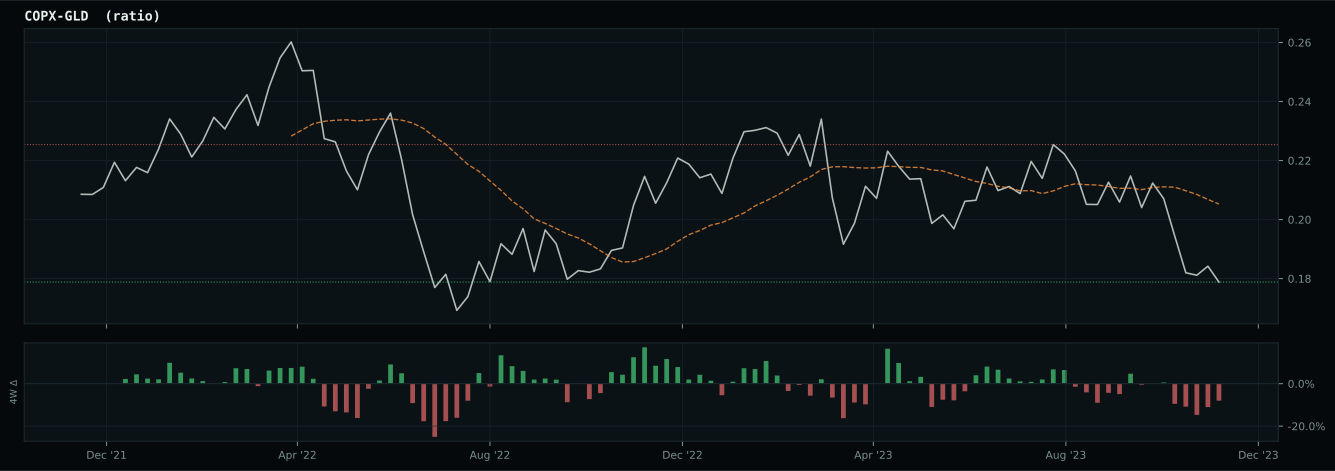
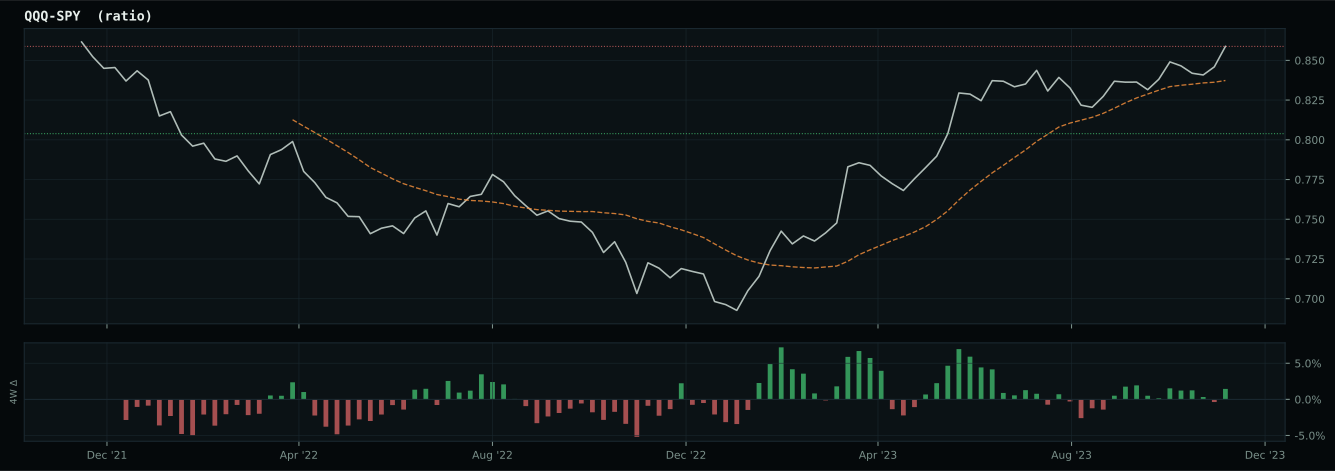
Macro Evidence Charts
Market-implied signals behind the macro regime scores. Each ratio compares two assets; the direction and slope of the ratio is what the macro engine reads.
Crypto Regime — TrendBTC
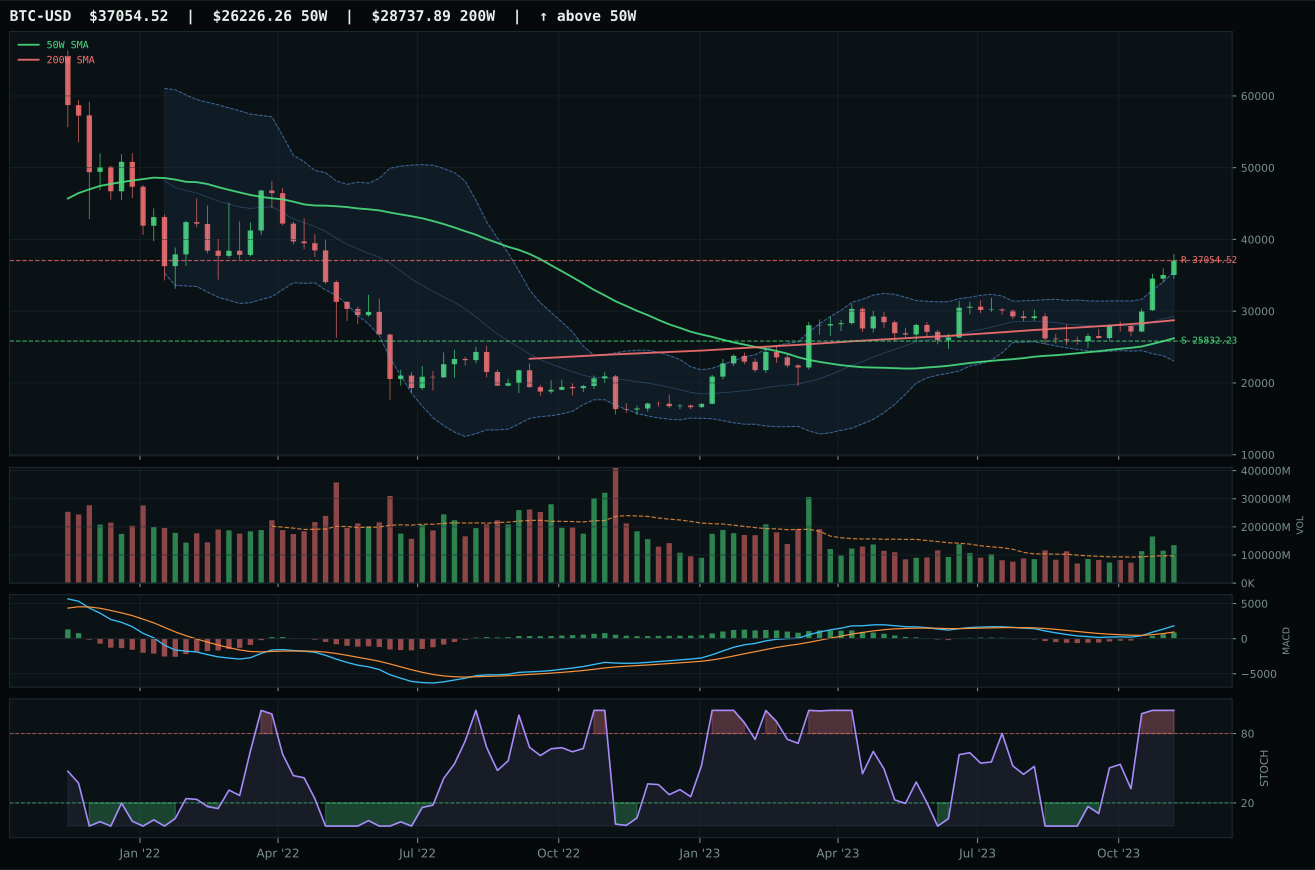
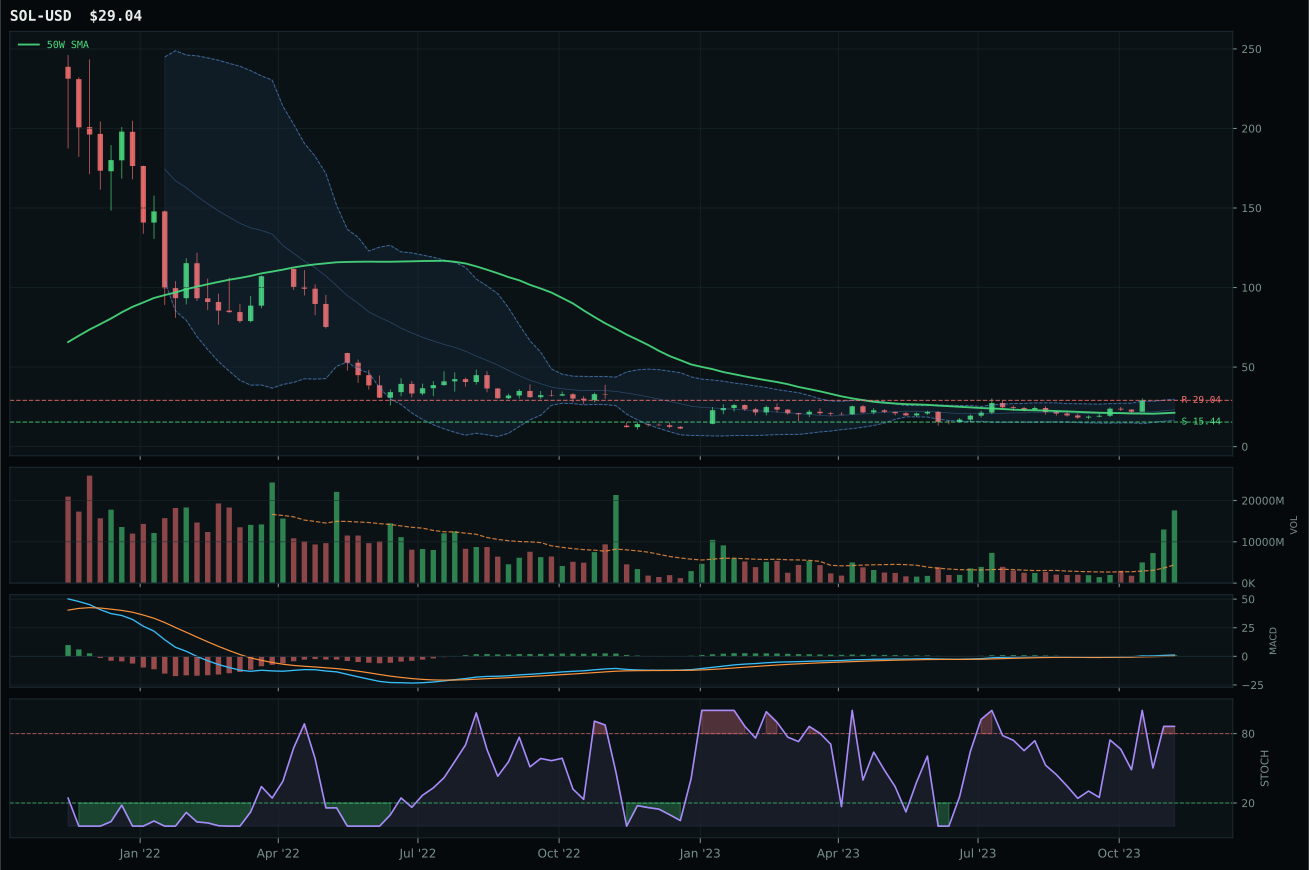
post-touch structure is too wide to count as a range; max/min close ratio is 2.15
TrendBTC confirmed: 2 consecutive closes above rising/flat 50W SMA
one or more available conditions failed
Category Rankings
| Rank | Category | Winner | Score | Alloc | 4W Ret | Peers (4W) |
|---|---|---|---|---|---|---|
| 1 | Defense & Aerospace | ITA | 59.4 | 20% | +6.47% | XAR +8.0% · ROKT +6.8% |
| 2 | Nuclear Energy | URA | 59.3 | 20% | +7.89% | URNM +6.8% · NLR +4.3% |
| 3 | Technology | XLK | 58.8 | 10% | +4.11% | IGV +8.6% · CIBR +9.6% |
| 4 | Precious Metals | GLD | 52.1 | 10% | +2.84% | SLV +3.9% · GDX +8.1% |
| 5 | Utilities & Infrastructure | IGF | 49.6 | 10% | +6.87% | PAVE +6.8% · XLU +4.8% |
| 6 | AI | SMH | 47.4 | 10% | +4.63% | AIQ +6.4% · BOTZ +9.1% |
| 7 | Emerging Markets | ILF | 12.6 | 10% | +5.84% | INDA +7.0% · IEMG +2.6% |
| 8 | Industrial Metals | PICK | 5.8 | 10% | +6.76% | COPX +9.4% · REMX +2.0% |
| 9 | Traditional Energy | XOP | 1.5 | 0% | -4.46% | FCG -5.1% · XLE -1.5% |
| 10 | Agriculture & Livestock | MOO | — | 0% | +2.06% | VEGI +2.4% · WEAT +3.3% |
Defense & Aerospace — ITA
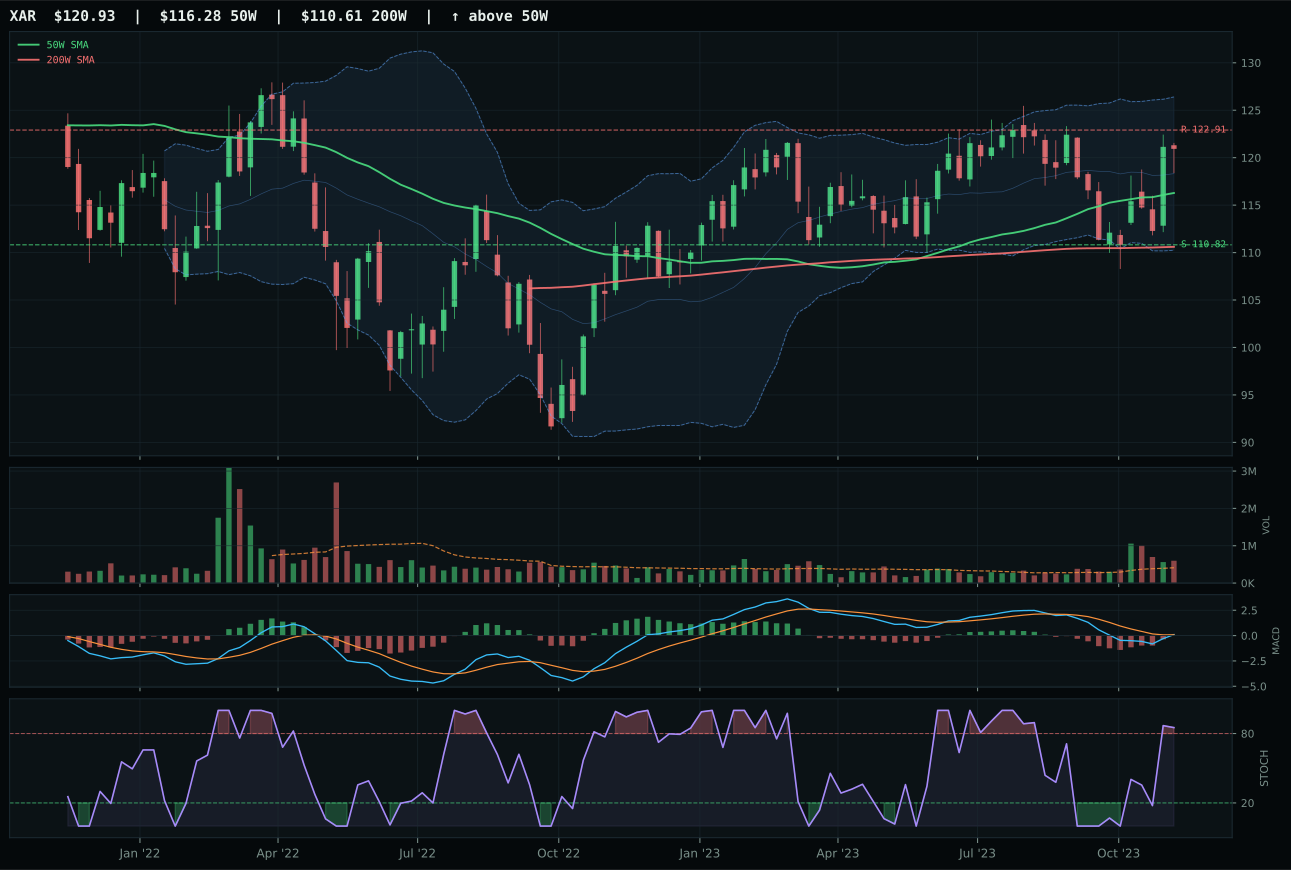
XAR has a neutral structure profile with 0.1% 13-week relative strength versus SPY.
A failed hold above support would weaken the setup.
Actionable but governed by invalidation levels.
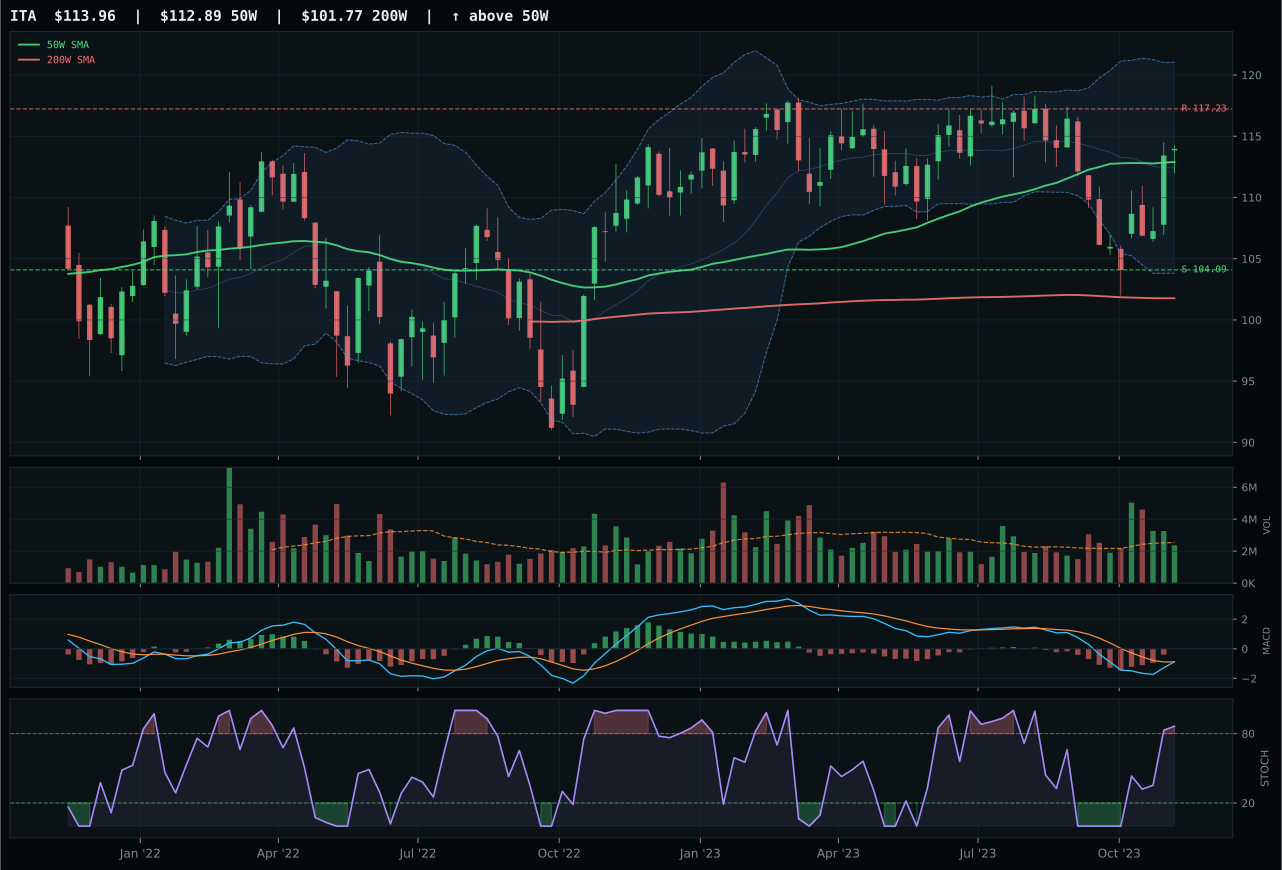
ITA has a compression near 50W profile with -1.7% 13-week relative strength versus SPY.
A failed hold above support would weaken the setup.
Actionable but governed by invalidation levels.
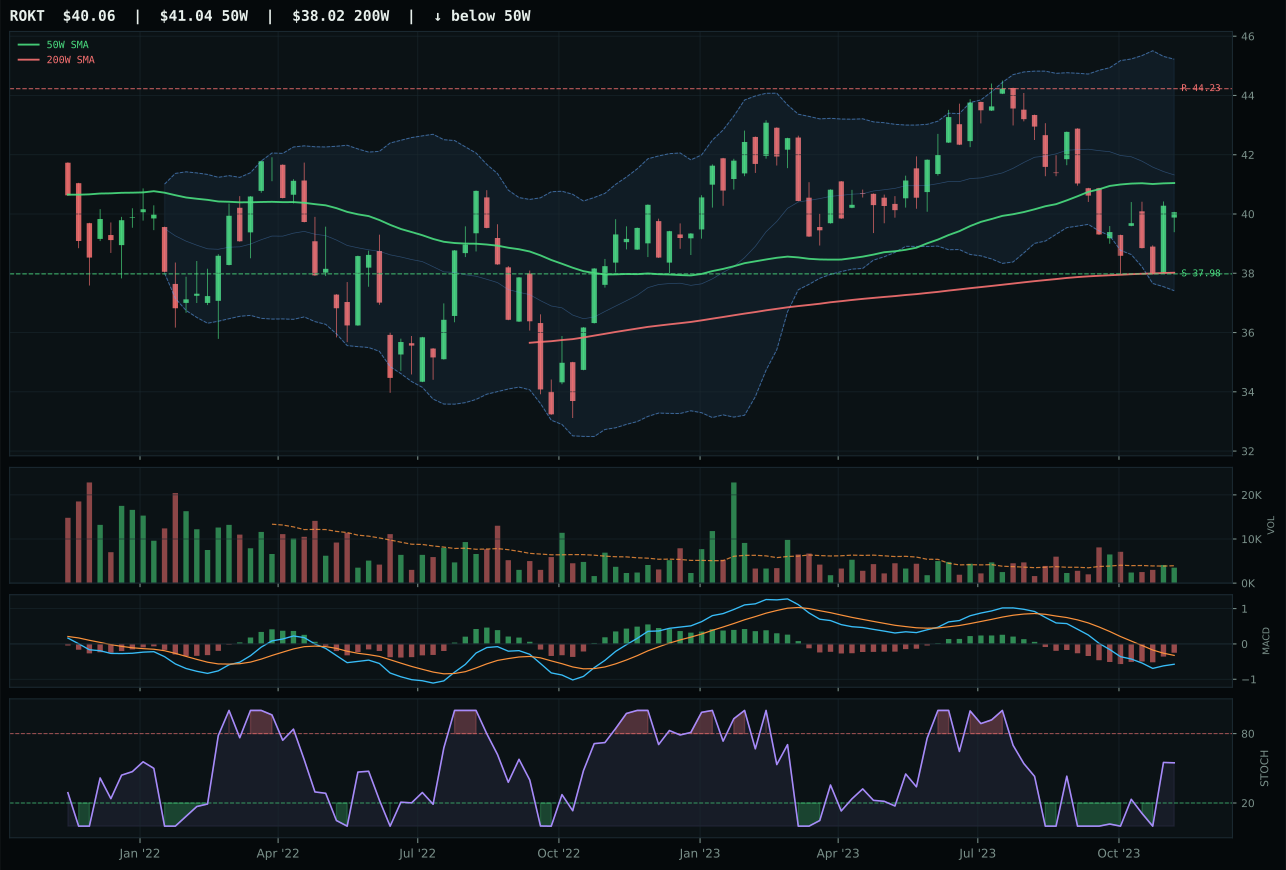
ROKT has a compression near 50W profile with -5.6% 13-week relative strength versus SPY.
A failed hold above support would weaken the setup.
Tracked, but not top-2 eligible because: .
ITA won a close decision over XAR—a mere 0.2-point gap—by virtue of superior timing: a perfect 100.0 score from sitting just 0.9% away from its 50-week moving average, with MACD bullish and improving and stochastic RSI at 0.86 (overbought momentum). That proximity to support is the setup's strength; rather than extended and vulnerable like many peers, ITA is coiling near its 50-week at 104.09, compressing 82.8% of its recent range into a narrow band. XAR carried stronger overall technical evidence at 83.5 versus ITA's 73.7, and its 0.1% category-relative strength slightly beat ITA's 0.0%, yet XAR's 90.0 timing score and 48.2 risk-reward could not overcome ITA's cleaner entry geometry. Volume at 0.93x the 20-week average is neutral across both—neither is showing accumulation urgency—but ITA's compression setup offers better asymmetry: 9.5% downside to support versus a flat risk-reward that rewards patience more than chasing at current levels.
Defense & Aerospace claimed a top-2 position at 10% allocation on the strength of a 59.4 final category score, making it one of two highest-ranked exposures in the portfolio this week. The category's 60.0 macro fit is surprisingly robust: active descriptors for broad market bear (+6), dollar pressure (+3), and credit stress (+2) align perfectly with a disinflation regime where equity risk is subordinate to yield preservation and geopolitical hedges. ITA's -2.8% 13-week return and -1.7% SPY-relative underperformance look weak in isolation, but that's precisely why it holds: the defense sector's negative correlation to equity risk appetite makes it ballast in a mixed-regime environment. The 100.0 timing score on ITA's compression near the 50-week adds optionality; if equity risk appetite reignites, the coil can expand upside. That said, the category's persistence score of 58.3 reveals fragility—volume-price confirmation at 62.1 is middling—meaning this allocation works as hedge against further stress but will underperform in a risk-on inflection.
Nuclear Energy — URA
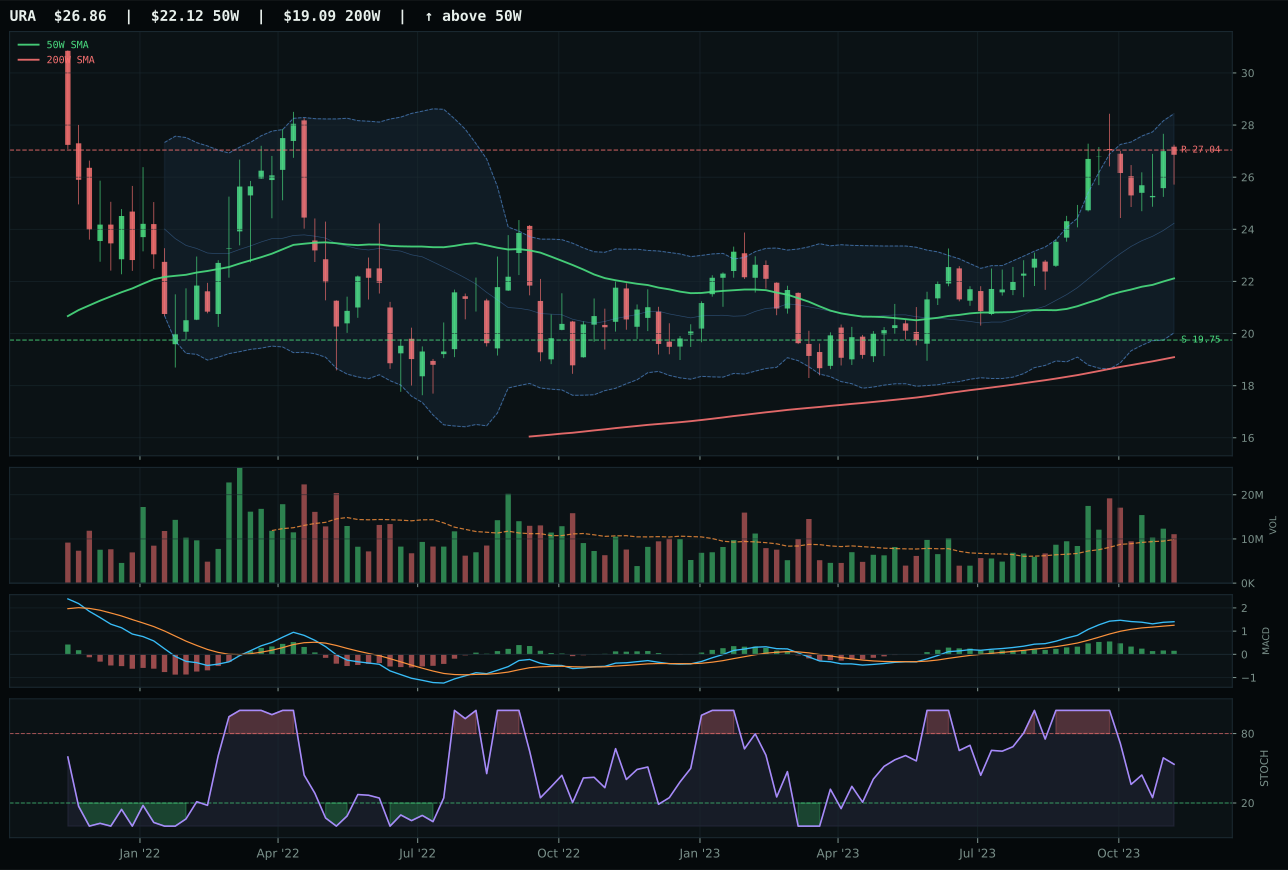
URA has a vertical extension profile with 18.6% 13-week relative strength versus SPY.
A failed hold above support would weaken the setup.
Actionable but governed by invalidation levels.
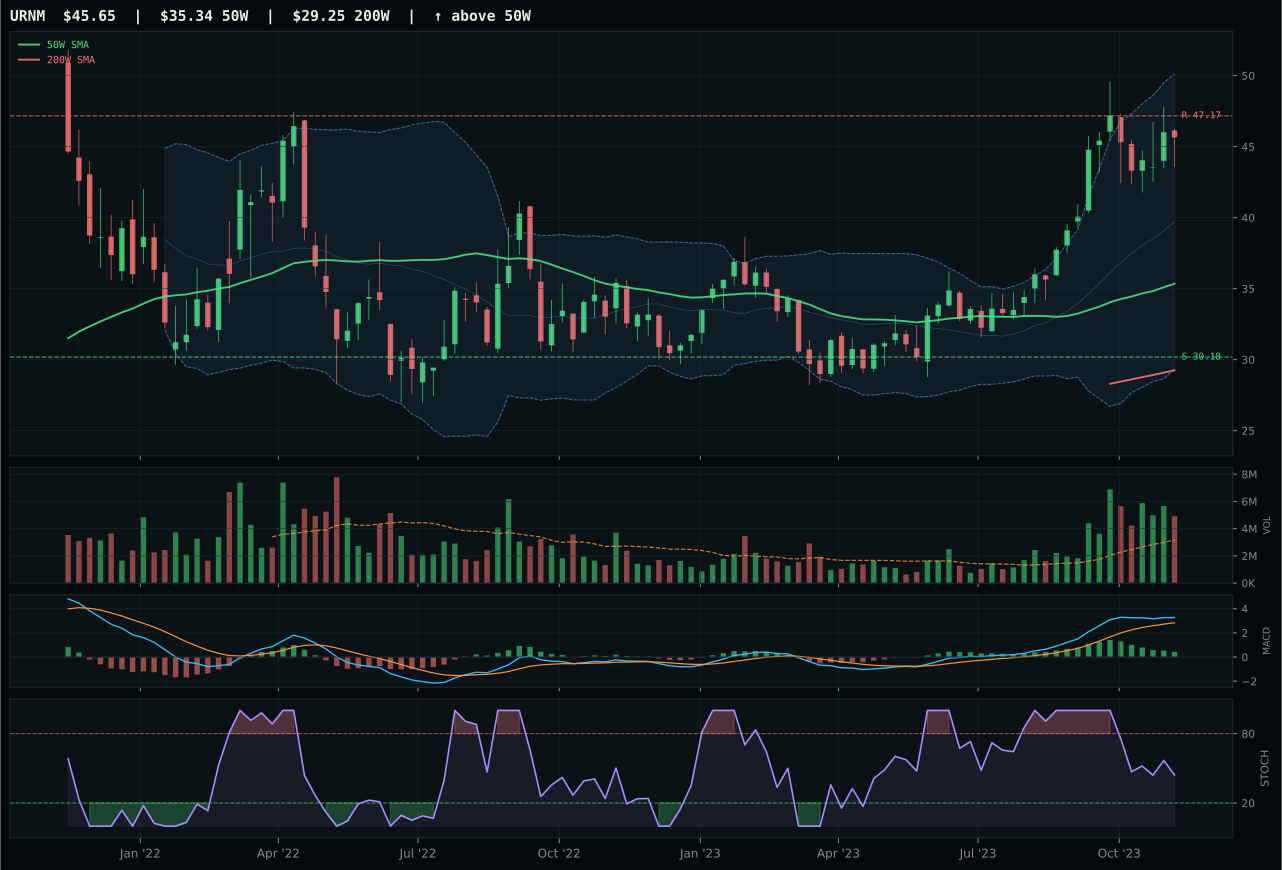
URNM has a vertical extension profile with 27.9% 13-week relative strength versus SPY.
A failed hold above support would weaken the setup.
Actionable but governed by invalidation levels.
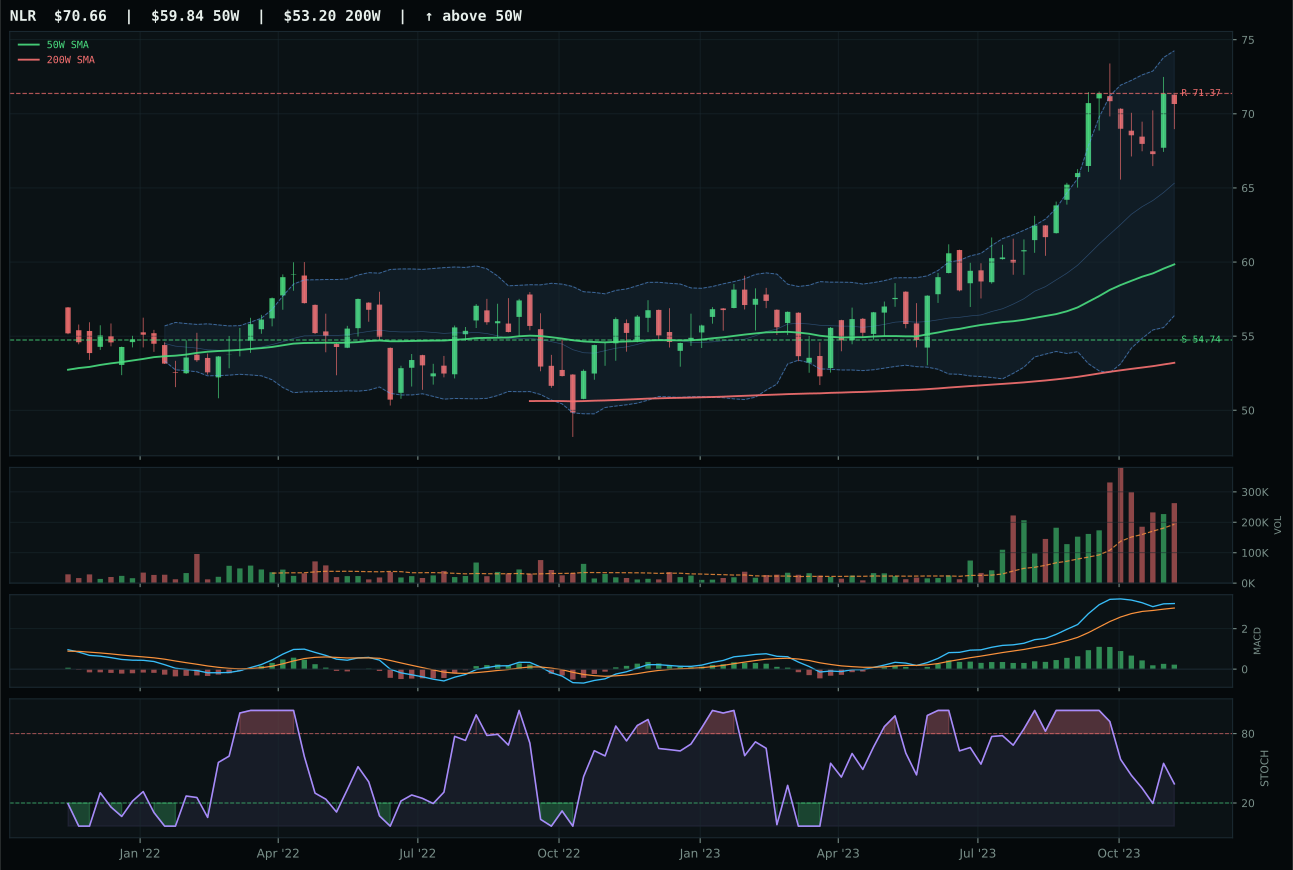
NLR has a vertical extension profile with 14.3% 13-week relative strength versus SPY.
A failed hold above support would weaken the setup.
Actionable but governed by invalidation levels.
URA beat URNM decisively despite both holding bullish MACD prints because URA's timing of 56.0 versus URNM's 48.0 reflects price proximity to moving averages and momentum trajectory. URA sits 21.5% extended above the 50-week, while URNM sits 29.2% extended—both vertical extensions, but URA's tighter extension and rising stochastic RSI at 0.53 (mid-zone, not falling like URNM's 0.60 falling/neutral) carry more sustainable momentum. Structure favors URA decisively at 76.9 versus URNM's 70.6: cleanliness of 66.7 versus URNM's lower ratio, compression of 69.2 versus 60.0-range approximates, and trend confirmation from 100.0 on both but sustained by URA's 18.6% SPY-relative strength versus URNM's exceptional 27.9% (which paradoxically becomes a liability—too far, too fast). Volume-price confirmation swings the decision: URA shows 74.0/100 with above-average participation confirming the move; URNM shows distribution pressure, meaning sellers are meeting buyers at these highs. URNM's higher absolute SPY strength is a bear flag, not a bull signal.
Nuclear Energy earned a top-2 position at 10% allocation on a 59.3 final category score, making it one of the portfolio's two highest-ranked categories this week. The category-level macro fit of 43.0 may look modest, but it benefits from the AI growth sponsorship descriptor at +5 and is only mildly dragged by active liquidity stress (-7) and credit stress (-5)—a much lighter macro burden than most peers. URA's 17.4% 13-week return and 18.6% SPY-relative strength are genuine outperformance; the 100.0 momentum confirmation score on above-average volume participation signals real capital flow into uranium thematic exposure. The timing score of 56.0 reflects that while URA is extended 21.5% above the 50-week, its rising stochastic RSI and bullish MACD (even if flattening) carry more credibility than peers. Downside to support is 36.0%, a real risk in any rotation, but the portfolio's 50% crypto overlay halves the actual capital committed to URA from its 10% position to 5% effective; the tail risk is managed. For URA to remain in top-2, it needs to hold above its 19.75 support and sustain volume; if distribution pressure emerges at extension like URNM shows, the category would reset lower.
Technology — XLK
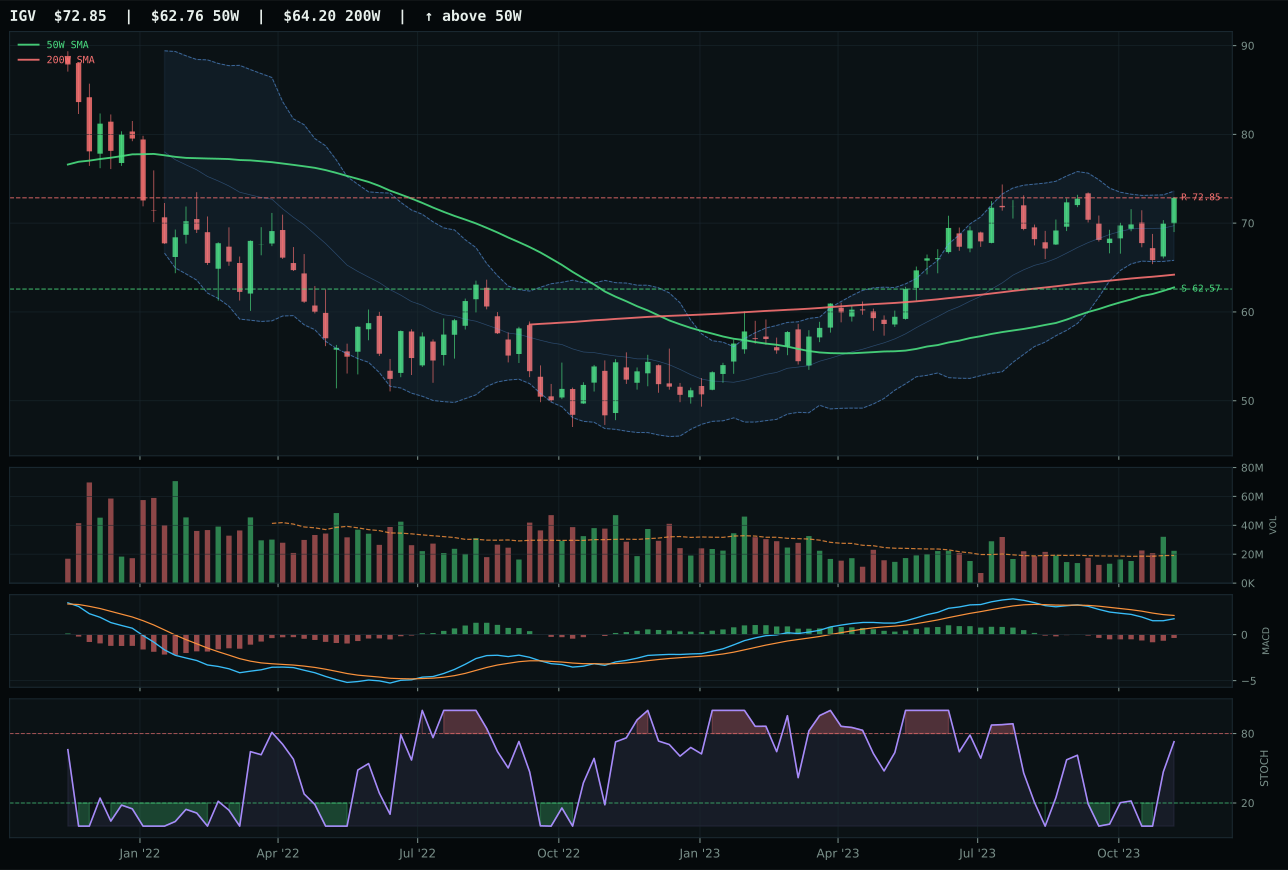
IGV has a vertical extension profile with 8.0% 13-week relative strength versus SPY.
A failed hold above support would weaken the setup.
Actionable but governed by invalidation levels.
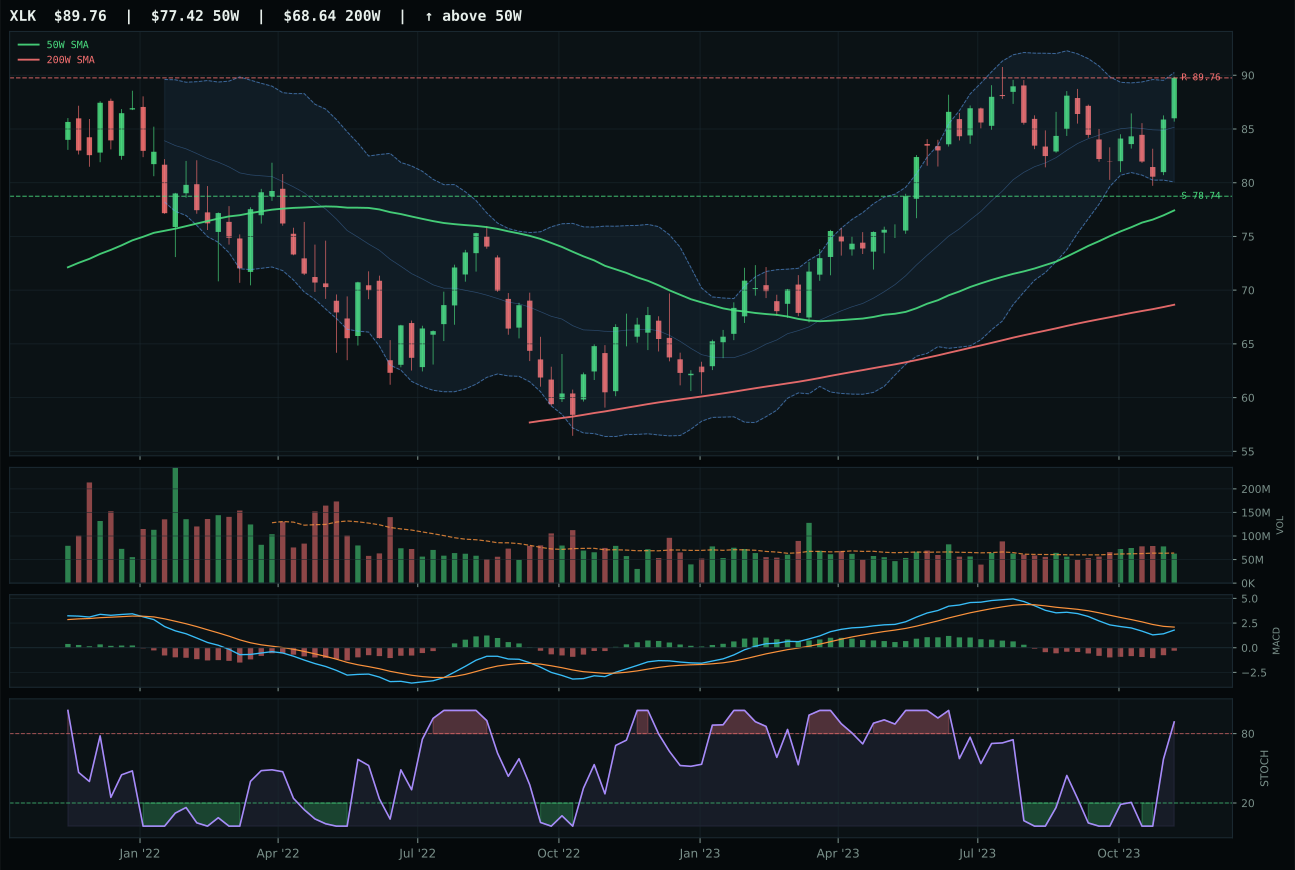
XLK has a vertical extension profile with 8.7% 13-week relative strength versus SPY.
A failed hold above support would weaken the setup.
Actionable but governed by invalidation levels.
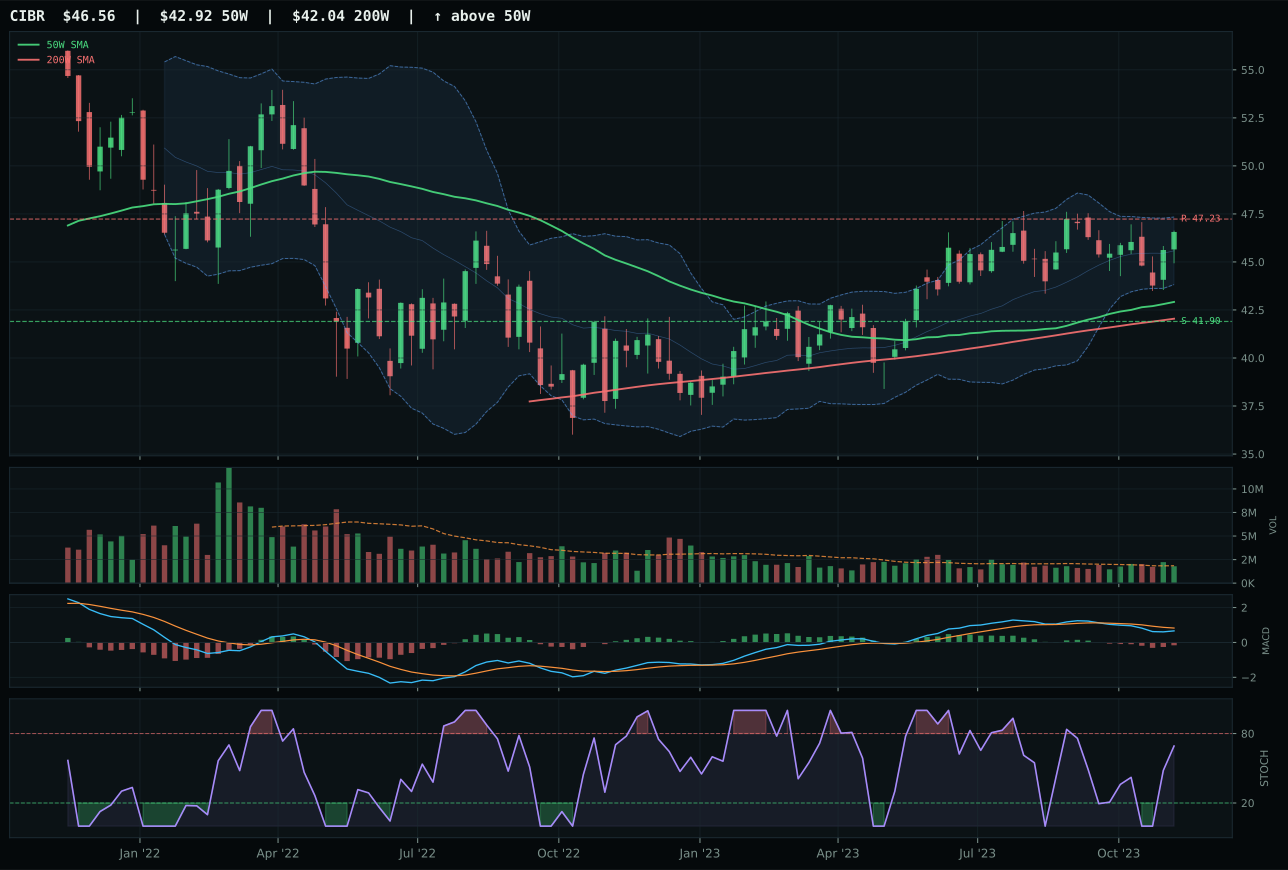
CIBR has a neutral structure profile with 4.3% 13-week relative strength versus SPY.
A failed hold above support would weaken the setup.
Actionable but governed by invalidation levels.
XLK won the category by maintaining price above both the 50-week and 200-week moving averages with a steady 0.6% slope, establishing clean trend confirmation that IGV matched but couldn't exceed. The 8.7% relative strength versus SPY, paired with a 0.7% outperformance of the category median, signals genuine internal breadth—new money is rotating into profitable tech names rather than chasing duration or software alone. Where IGV stumbled was its 0.0% category-relative strength and weaker risk-reward math: 45.8 versus XLK's 47.3, a gap that matters when both charts sit in vertical extension 15-17% above their 50-week anchors. Volume at 0.98x the 20-week average confirms XLK's move is being held, not dumped; the MACD is bearish but improving, and stochastic RSI sitting at 0.90 marks overbought momentum—uncomfortable for fresh longs, but the structure is too clean to dismiss.
Technology earned 5% allocation as a tier-3 category this week, ranking outside the top-two overweights despite a respectable 58.8 final score. The tension is real: trend scores hit 100.0 on pure price structure, but momentum confirmation and volume-price persistence lag at 65.3 and 66.5 respectively, and the category's macro fit of 55.0 cannot compete with the disinflation backdrop that energizes defensive and precious metals exposures. A 15.9% vertical extension above the 50-week means every entry today is paying a late tax; XLK's risk-reward sits at 47.3, implying only 0.0% upside to resistance against 14% downside to support. What keeps Technology in the portfolio rather than relegated entirely is its 8.7% SPY outperformance and the active AI growth sponsorship descriptor, which adds structural confidence. For Technology to reclaim a top-2 slot, timing would need to reset—either price pullback to compress the extension or MACD confirmation to accelerate from its current improving-but-bearish state.
Precious Metals — GLD
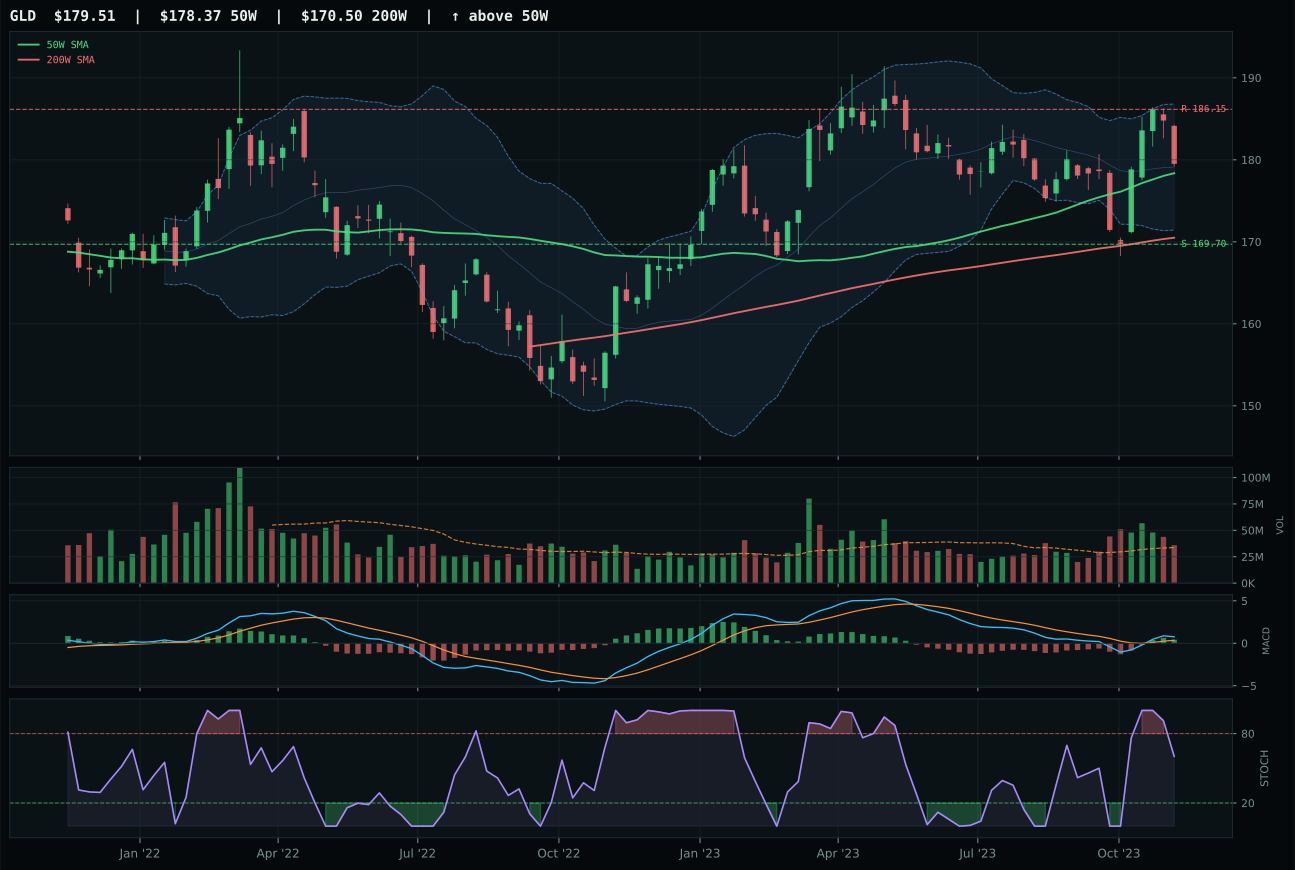
GLD has a compression near 50W profile with 2.2% 13-week relative strength versus SPY.
A failed hold above support would weaken the setup.
Actionable but governed by invalidation levels.
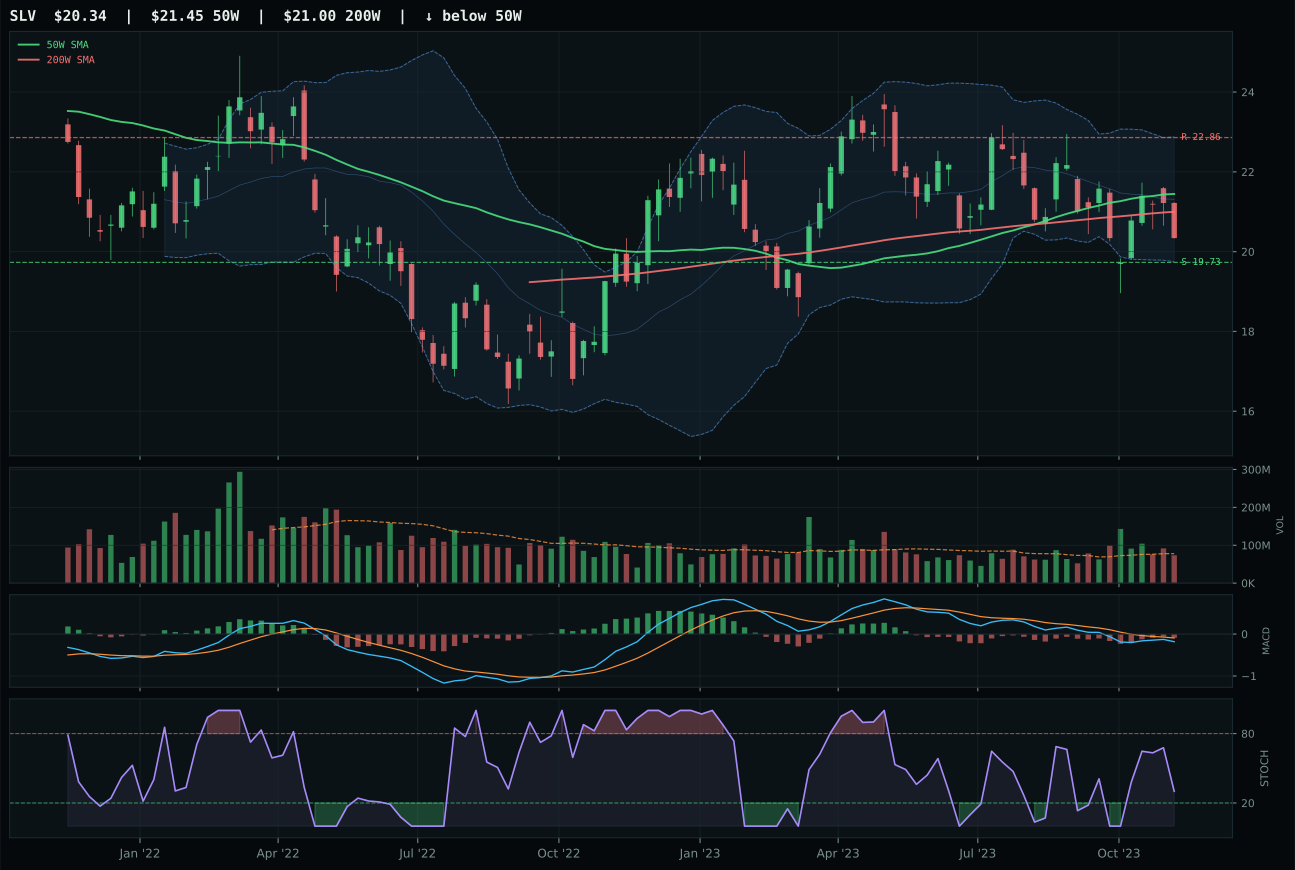
SLV has a pullback into support profile with -1.1% 13-week relative strength versus SPY.
A failed hold above support would weaken the setup.
Actionable but governed by invalidation levels.
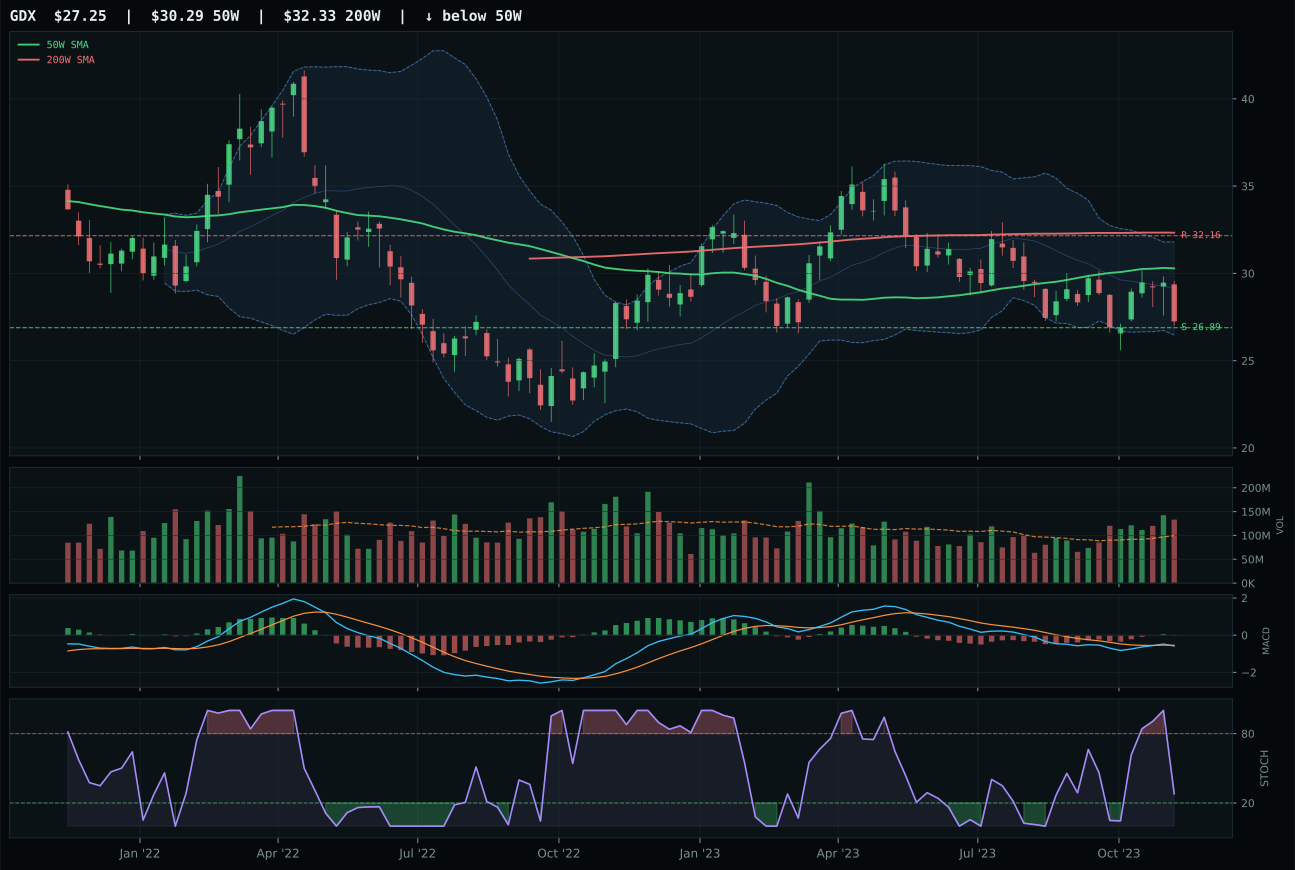
GDX has a pullback into support profile with -6.4% 13-week relative strength versus SPY.
Extension and support failure are the main tactical risks.
Tracked, but not top-2 eligible because: structurally broken.
GLD beat SLV decisively on the strength of a bullish MACD with improving slope versus SLV's bearish-but-improving posture, a difference that compounds when both charts are compressing near their 50-week levels. GLD's 100.0 timing score reflects its position just 0.6% away from the 50-week moving average with MACD bullish and improving and stochastic RSI at 0.60 (falling/neutral, implying equilibrium rather than exhaustion). SLV's timing score of 85.0 loses points on two counts: MACD remains bearish, and its chart is pulling into repair at a deeper Fibonacci zone (0.618 on the deep retracement) rather than the middle retracement where GLD sits. GLD's 3.3% category-relative strength widens the gap further; SLV carries 0.0%, suggesting capital is rotating to the clean monetary hedge rather than the hybrid monetary-industrial story. Structure quality favors GLD at 75.8 versus 70.5, and most critically, GLD's 64.1 risk-reward (5.8% downside to support, -3.6% upside to resistance) offers true asymmetry in a value context, whereas SLV's 98.0 risk-reward looks impressive only because the upside calculation is more constrained.
Precious Metals earned 5% allocation as a tier-3 category, placing it firmly outside top-2 contention despite a solid 52.1 final score and an exceptional 77.0 category-level macro fit. The macro story is compelling: monetary hedge bid is active at +14, disinflation pressure is present at +6, and the macro regime itself is actively helping gold valuation. Yet technical evidence scored only 61.9 at the category level, and when the 3/2/1 weighted basket is tested (GLD 83.0, SLV 60.4, GDX 31.1, yielding 66.8 before final stress tests), the category reasoner applies persistence and volume-price confirmation filters that compress the final score to 52.1. GLD's 1.1% 13-week return and 69.7/100 volume-price confirmation reveal that while MACD and timing are constructive, breadth participation remains tepid. The category serves as a portfolio stabilizer and a play on monetary anxiety, but the execution is restrained—not the explosive accumulation that would justify top-tier allocation. For Precious Metals to climb into 10% weighting, GLD would need sustained volume acceleration at current levels, or a tactical VIX spike that triggers genuine haven-flow participation.
Utilities & Infrastructure — IGF
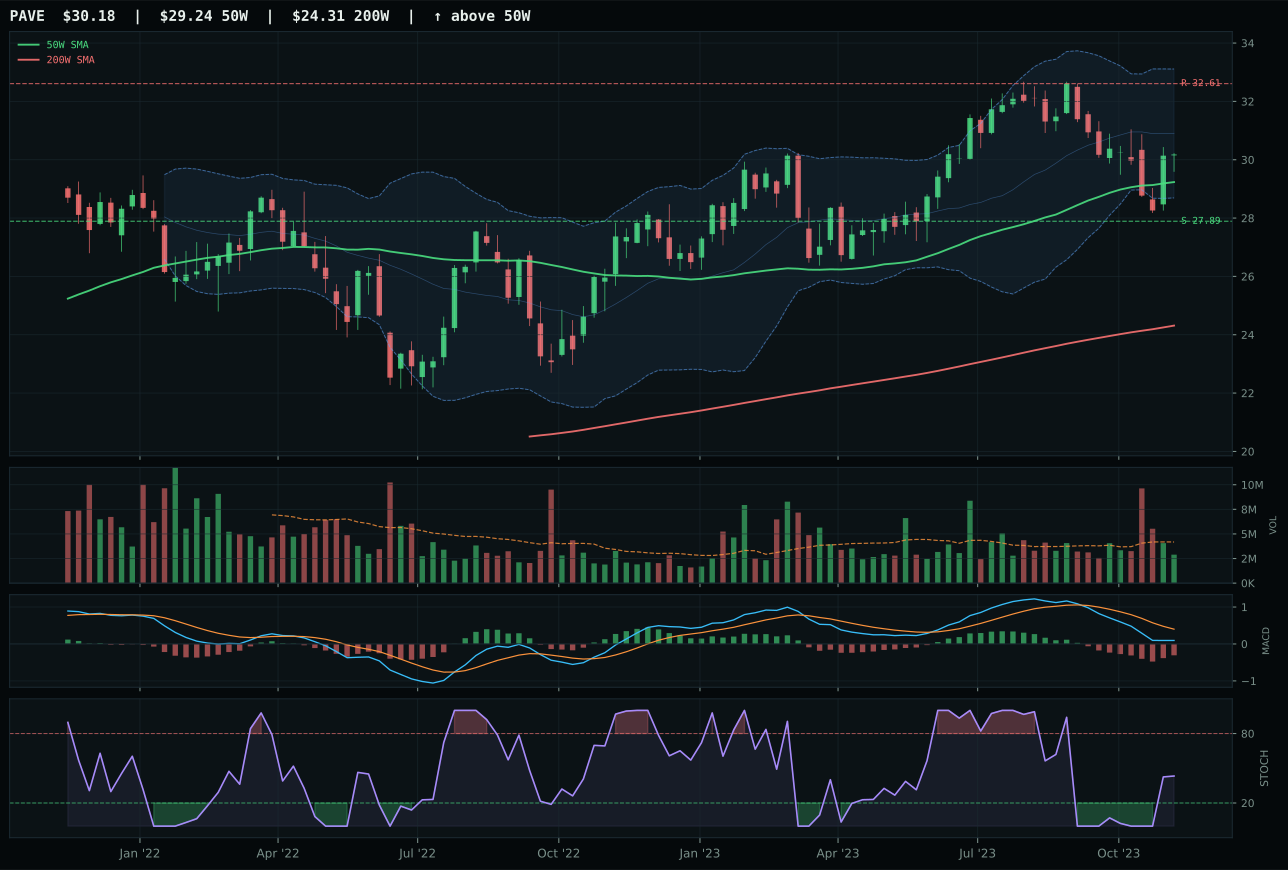
PAVE has a neutral structure profile with -4.9% 13-week relative strength versus SPY.
A failed hold above support would weaken the setup.
Actionable but governed by invalidation levels.
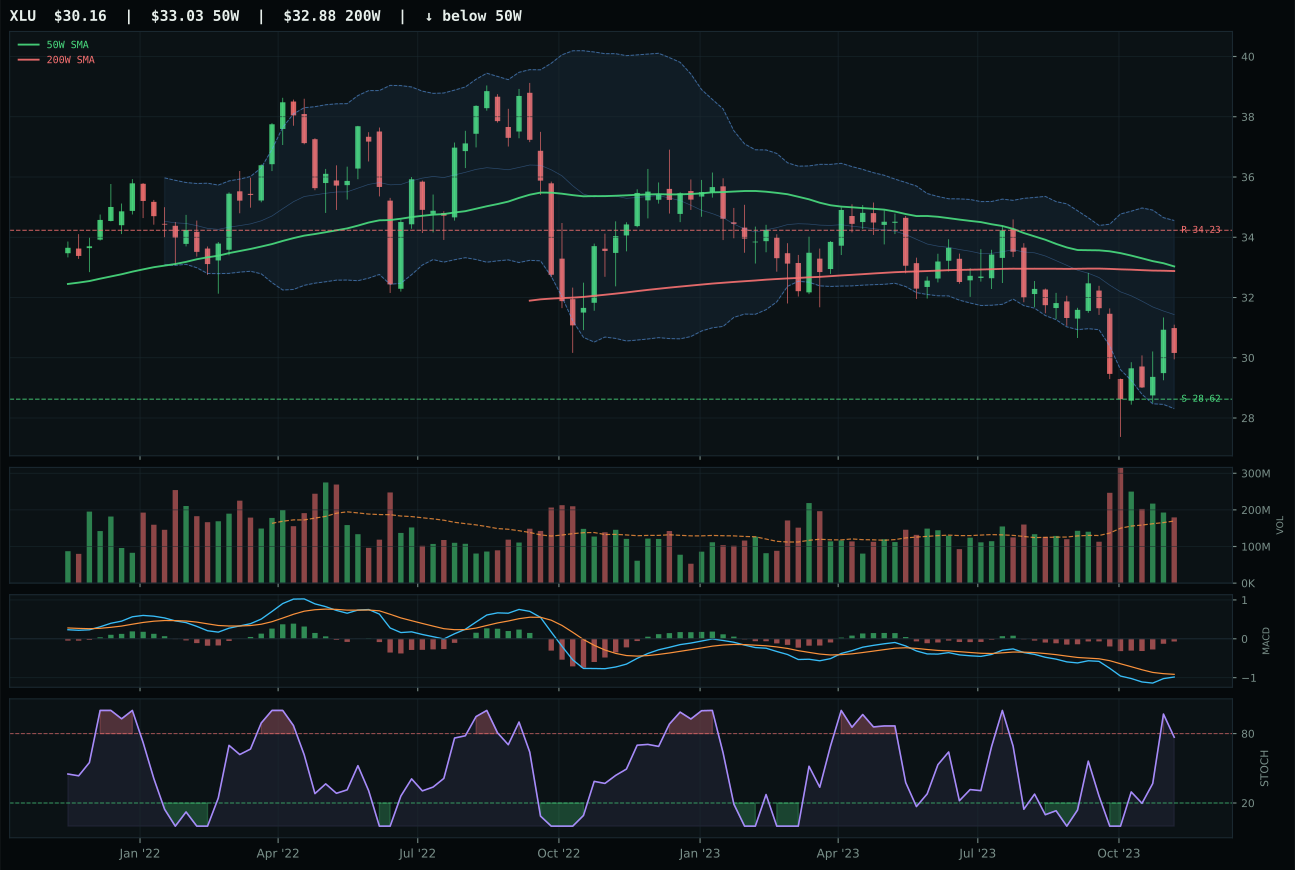
XLU has a neutral structure profile with -5.5% 13-week relative strength versus SPY.
A failed hold above support would weaken the setup.
Actionable but governed by invalidation levels.
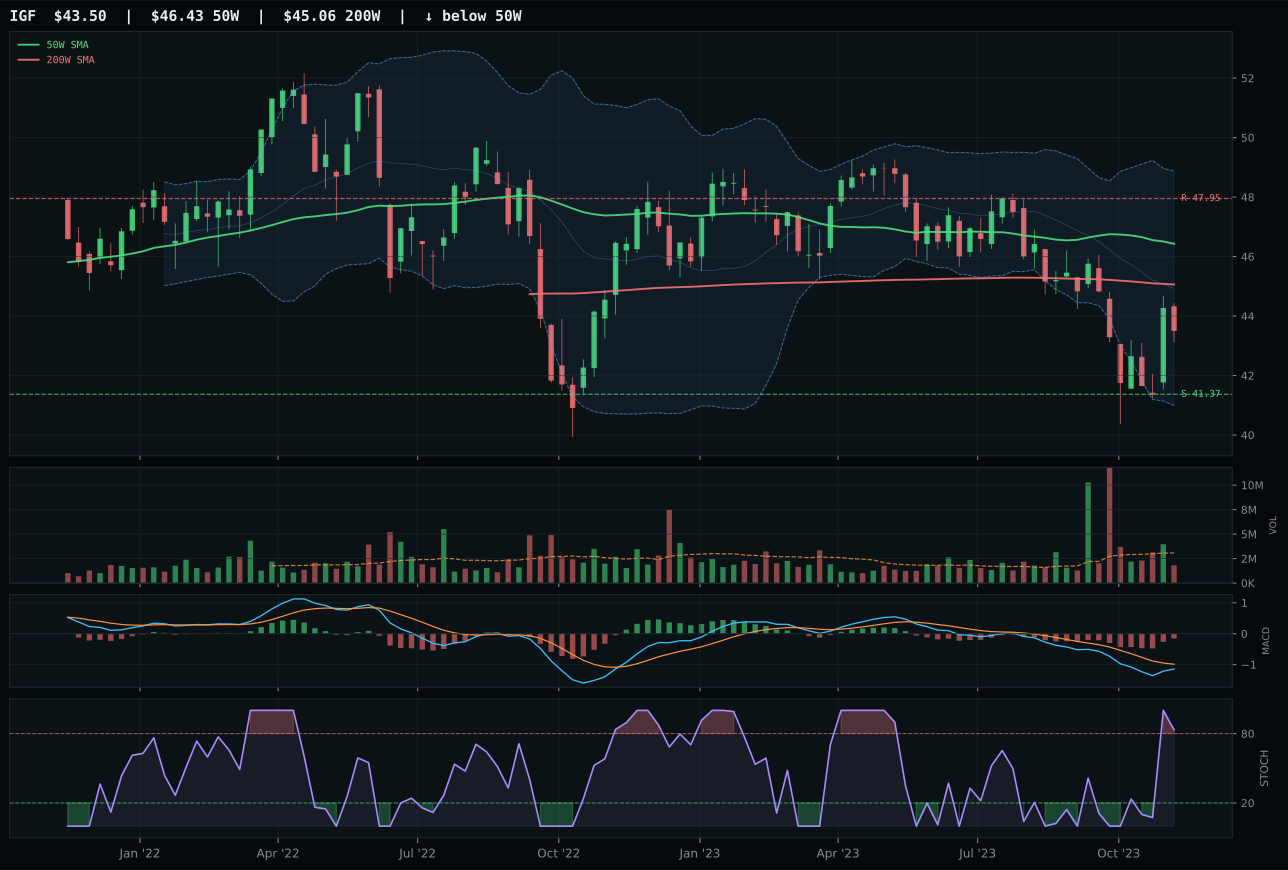
IGF has a neutral structure profile with -5.2% 13-week relative strength versus SPY.
A failed hold above support would weaken the setup.
Actionable but governed by invalidation levels.
IGF defeated PAVE despite being deeper in drawdown—a counterintuitive outcome that reflects PAVE's superior technical evidence score of 64.5 versus IGF's 47.0 being offset by IGF's superior risk-reward. IGF's 85.5 risk-reward versus PAVE's 69.3 is the decisive margin: IGF at -6.3% below the 50-week offers 5.1% downside to support against a 9.3% upside haircut to resistance, creating genuine asymmetry in a value region; PAVE at +3.2% above the 50-week is exposed upward toward resistance at 32.61 with only a 6.1% downside buffer. Both show MACD bearish but improving and stochastic RSI rising mid-zone in neutral structure, but PAVE's rising momentum and trend strength of 86 create an illusion of momentum that overhead resistance invalidates. Category-relative strength barely moves the needle—PAVE at 0.3%, IGF at 0.0%—so the decision rests on positioning for duration: PAVE is a momentum pullback play, IGF is a repair-zone value trap that offers better asymmetry if support holds.
Utilities & Infrastructure earned 5% allocation as a tier-3 category with a 49.6 final score, landing comfortably in the middle ranks of the portfolio. The category's 66.0 macro fit is respectable—active descriptors for transition/mixed (+4), disinflation (+7), and disinflation pressure (+6) provide structural support, while broad market bear (+4) adds a defensive tilt. The category's technical evidence of 47.0 drags down the composite, but IGF's 75.0 timing score on price sitting 6.3% below the 50-week in the deep retracement zone reflects the portfolio's preference for value positioning in a rate-cutting regime. IGF's -6.3% 13-week return and -5.2% SPY-relative underperformance look weak, but 5% allocation is appropriate for a true value hedge rather than a momentum vehicle. Volume-price confirmation at 38.8/100 and persistence at 40.2/100 are both well below the portfolio median, confirming that this is a holding position on the thesis that disinflation helps duration and yield—not on active accumulation. For Utilities & Infrastructure to climb into 10% weighting, PAVE would need to clear overhead resistance with volume, or IGF would need to stabilize at support with rising stochastic RSI, neither of which has materialized.
AI — SMH
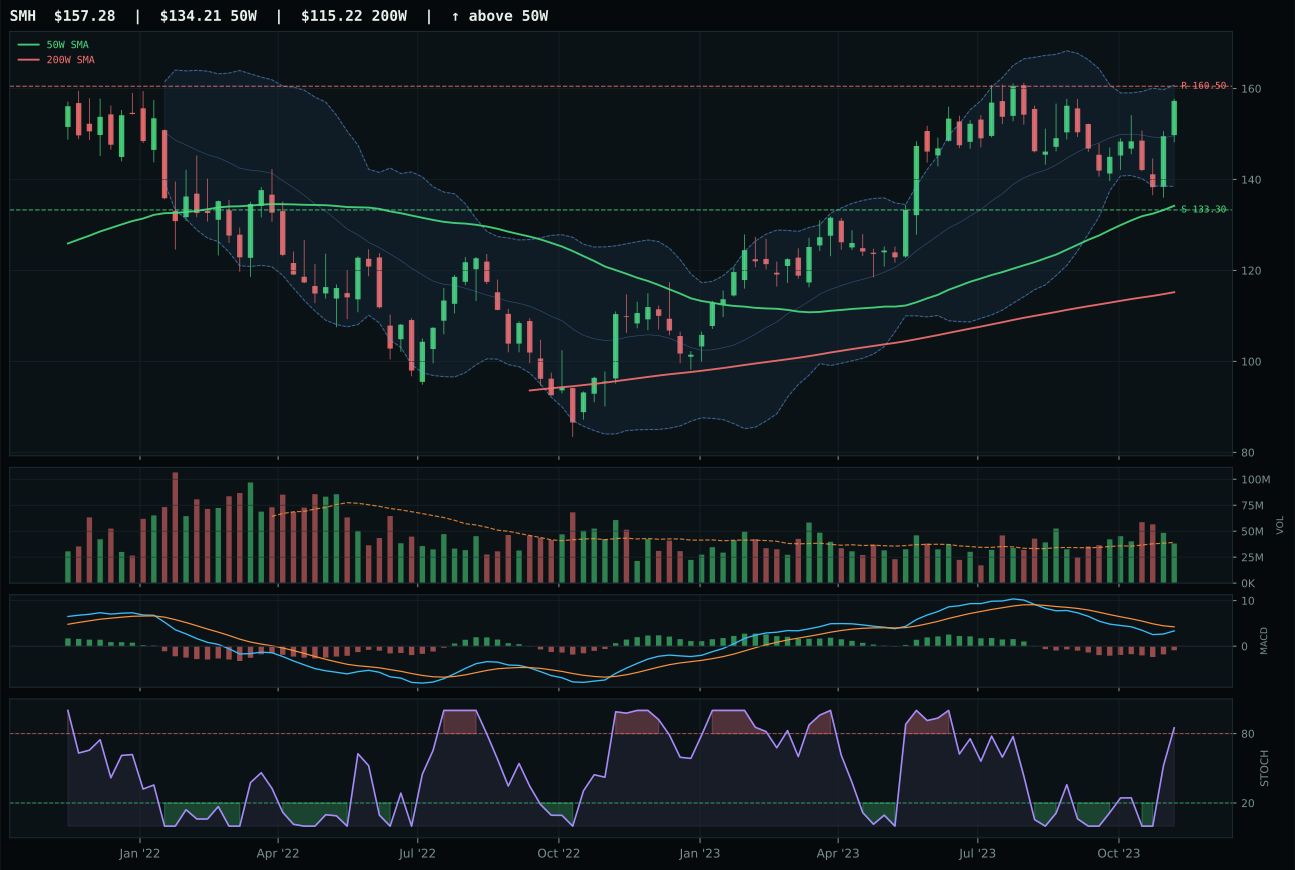
SMH has a vertical extension profile with 8.7% 13-week relative strength versus SPY.
A failed hold above support would weaken the setup.
Actionable but governed by invalidation levels.
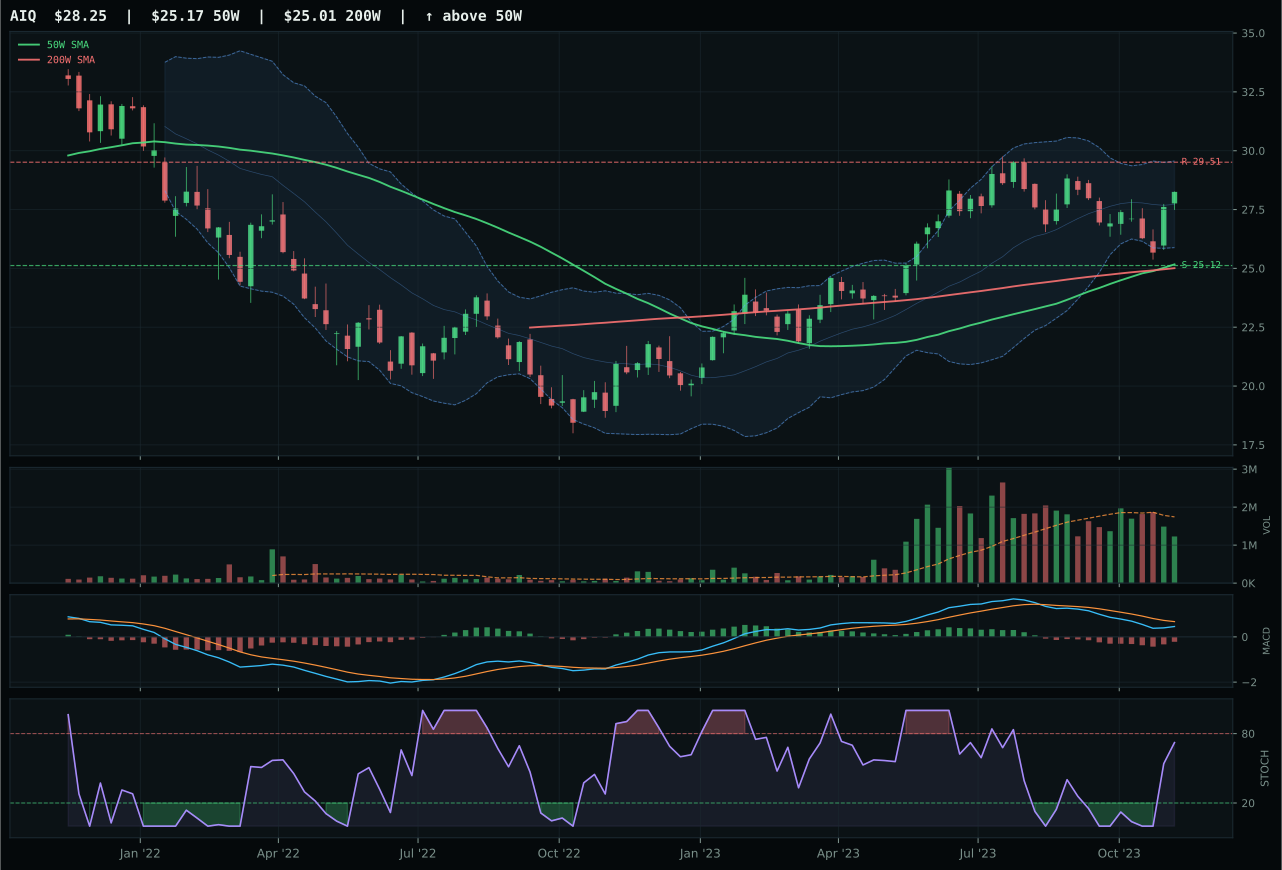
AIQ has a neutral structure profile with 3.5% 13-week relative strength versus SPY.
A failed hold above support would weaken the setup.
Actionable but governed by invalidation levels.
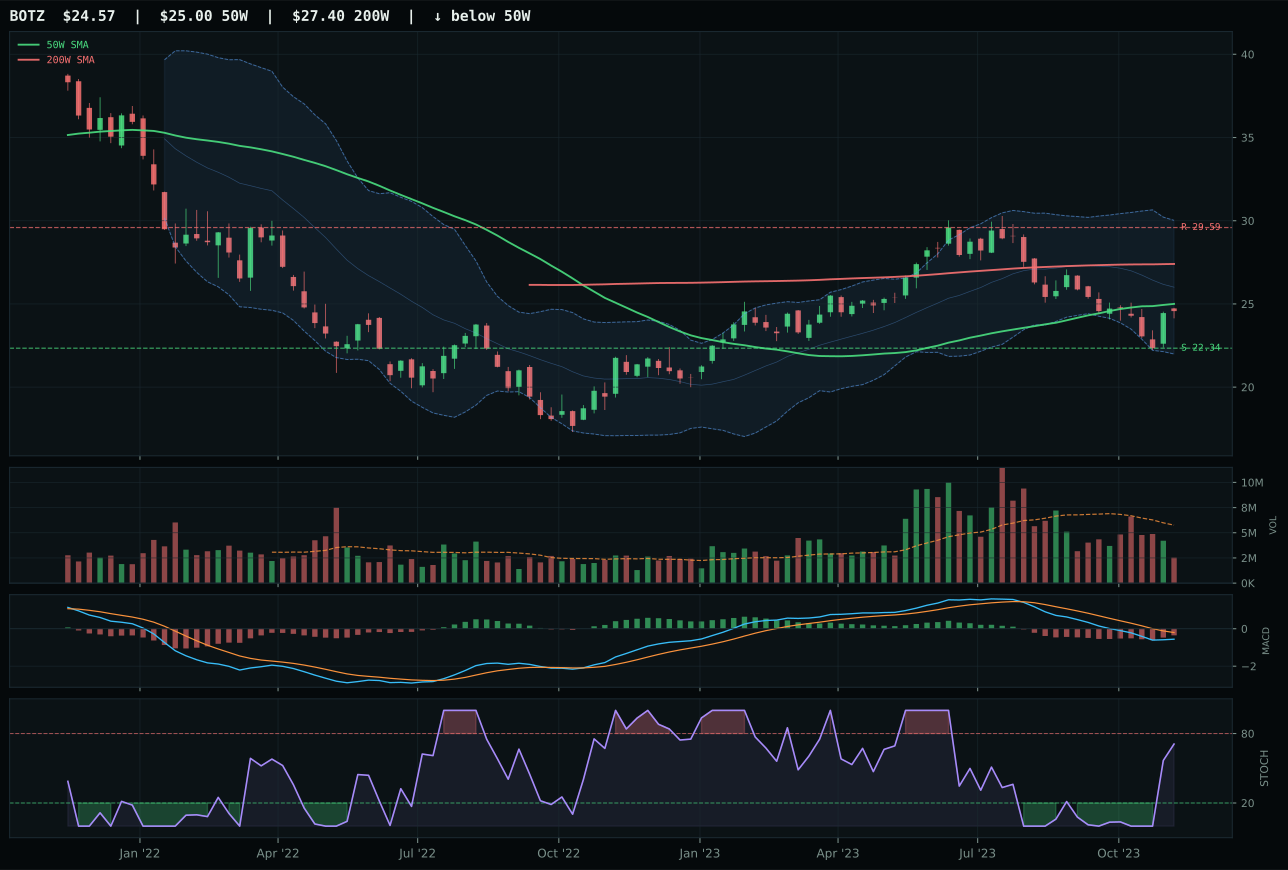
BOTZ has a compression near 50W profile with -5.4% 13-week relative strength versus SPY.
Extension and support failure are the main tactical risks.
Tracked, but not top-2 eligible because: structurally broken.
SMH edged AIQ because semiconductor and compute hardware leadership carries heavier volume-price sponsorship than software applications when both face timing pressure. The 5.2% category-relative strength versus AIQ's 0.0% is a decisive tell: buyers are rotating capital into the infrastructure layer, not the application layer. SMH's structure scored 72.4 versus AIQ's 67.2—cleaner compression, better cleanliness at 58.3—and while both sit in vertical extension with MACD bearish but improving, SMH's stochastic RSI at 0.85 (overbought momentum) carries above-average participation energy. AIQ's setup looks theoretically better on some metrics: a composite score of 76 versus SMH's 67, a trend reading of 98 versus 100. But that composite advantage dissolves when the category reasoner applies persistence and setup quality filters; AIQ's thin participation and neutral structure cannot defend against SMH's stronger relative strength inside its own three-ETF basket and better macro sponsorship from the AI growth descriptor.
AI holds 5% as a tier-3 category, dropped from contention by a 47.4 final score that reflects deep structural weakness despite strong near-term momentum. The category-level macro fit sits at 47.0—dragged down by active liquidity stress and credit stress descriptors that hit -12 and -8 respectively—creating a headwind even as SMH posts a 7.6% 13-week return and 92.2% momentum confirmation score. The disinflation regime helps AI consumption narratives, yet the broader risk appetite stance and commodity volatility are dampening capital flows. What's notable is that SMH's 17.2% extension above its 50-week anchor mirrors the broader tech malaise: the move works, but timing is treacherous and downside to support is only 18% against the 21.5% of gains already won. For AI to climb into tier-2 allocation, the category would need either a reset lower—compressing the extension—or a MACD acceleration that converts from bearish-but-improving to genuinely bullish, coupled with relief from the active liquidity and credit stress drags.
Emerging Markets — ILF
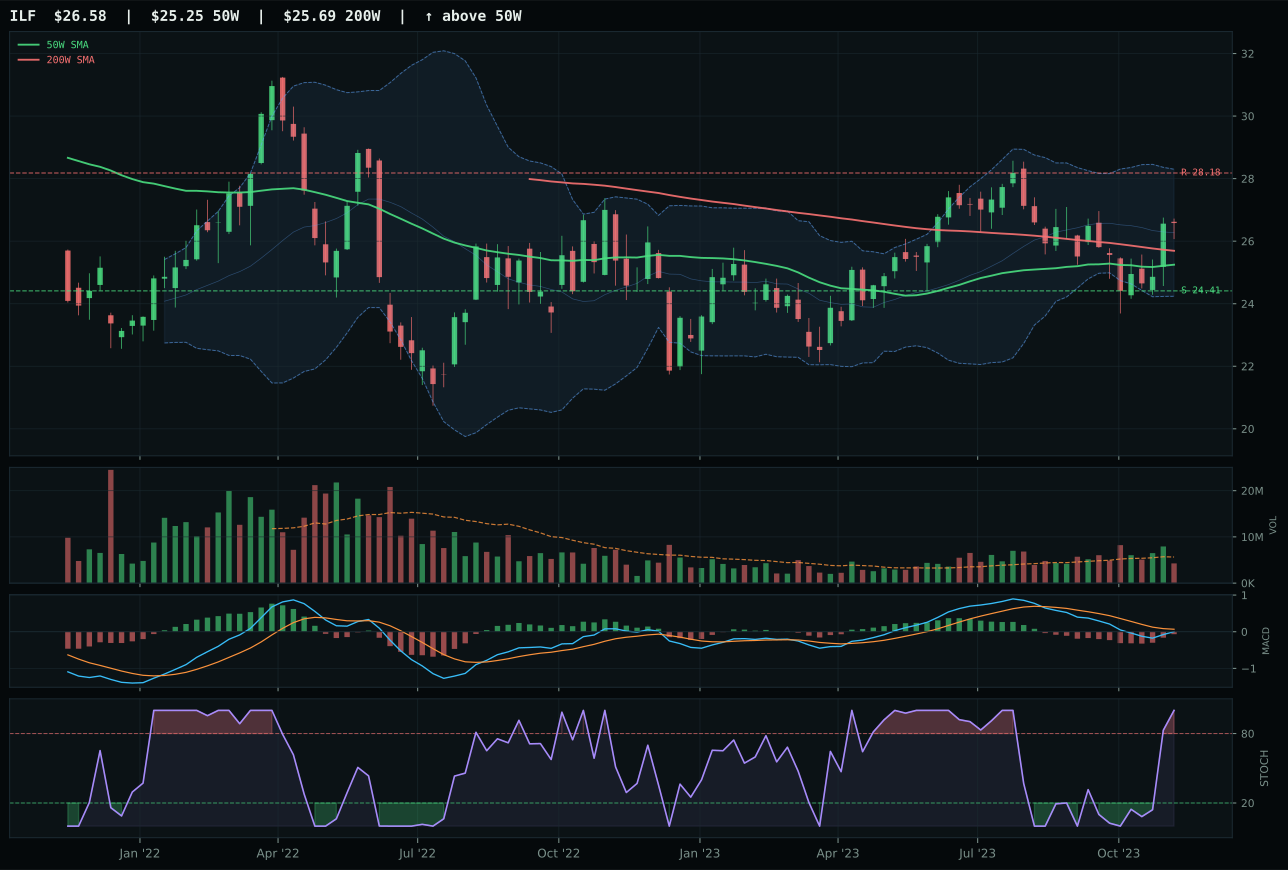
ILF has a neutral structure profile with 1.1% 13-week relative strength versus SPY.
A failed hold above support would weaken the setup.
Actionable but governed by invalidation levels.
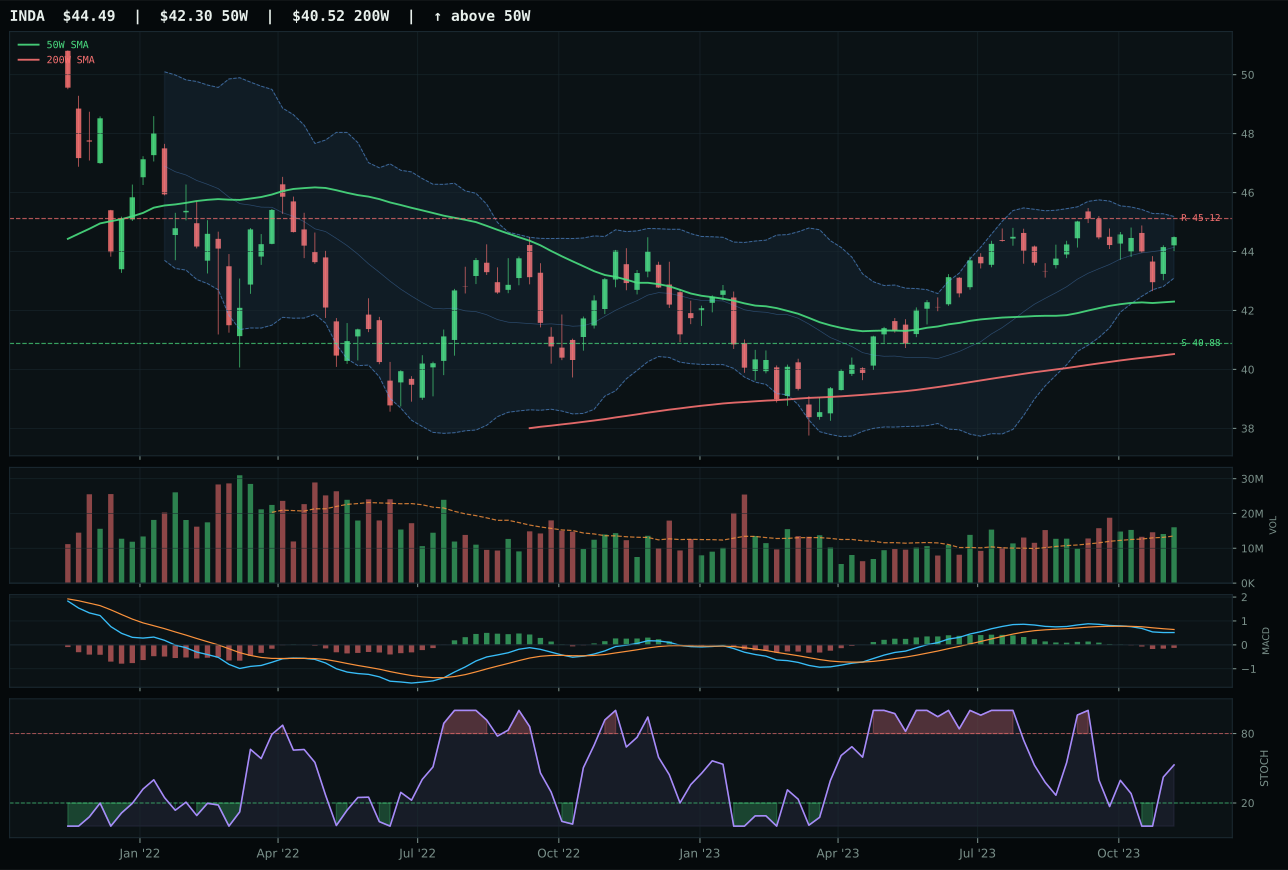
INDA has a neutral structure profile with 3.1% 13-week relative strength versus SPY.
A failed hold above support would weaken the setup.
Actionable but governed by invalidation levels.
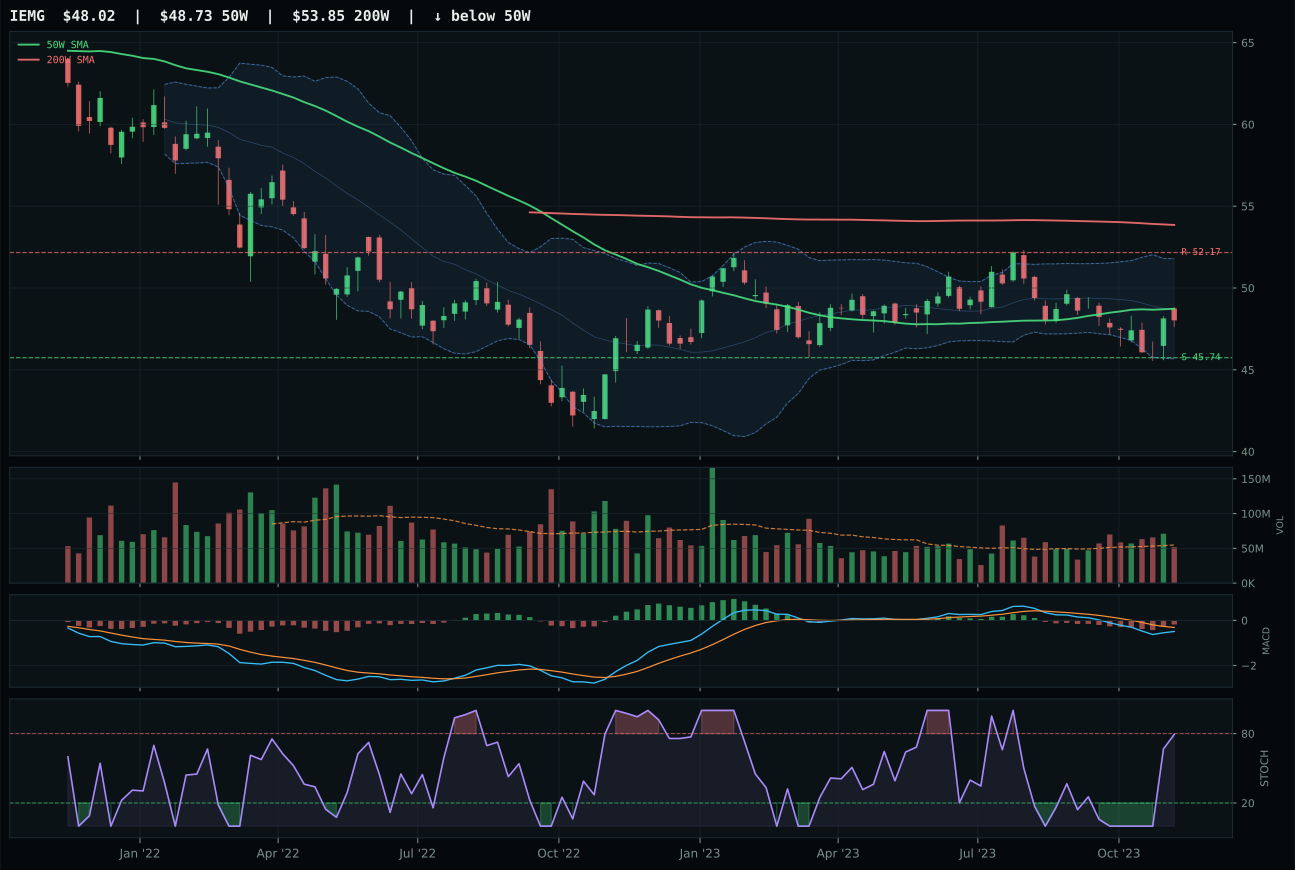
IEMG has a pullback into support profile with -1.6% 13-week relative strength versus SPY.
Extension and support failure are the main tactical risks.
Tracked, but not top-2 eligible because: structurally broken.
ILF edged INDA by 1.4 points in a close decision where the winner was chosen by risk-reward arithmetic and MACD confirmation rather than trend strength. ILF's 56.5 risk-reward versus INDA's 47.9 reflects a deeper valuation markdown: ILF's -0.1% 13-week return leaves it closer to support levels, offering a 8.9% downside buffer versus INDA's 6.1%, with similar upside skew. Both charts sit in neutral structure in the upper retracement Fibonacci zone, both carry 85+ trend scores, and both show MACD bearish but improving. ILF's category-relative strength of 0.0% matches INDA's 2.1% advantage, so the separating factor is technical: ILF's stochastic RSI at 1.00 (overbought momentum) signals potential mean-reversion pull-in, whereas INDA's rising mid-zone reading leaves room for continued compression. ILF's 73.5 structure score beats INDA's higher trend reading because structure cleanliness matters more in a region of decision—ILF's 58.3 cleanliness and 77.4 compression signal coiling, while INDA's above-average volume participation argues for ongoing grind rather than reversal.
Emerging Markets earned 5% allocation as a tier-3 category, reflecting a weakened 12.6 final score and a deeply challenged 15.0 category-level macro fit. The macro headwinds are relentless: dollar pressure at -14, credit stress at -10, liquidity stress at -10, and broad market bear at -9 create a quadruple drag that even the active risk appetite positive descriptor (+8) cannot overcome. The category's 3/2/1 weighted basket (ILF 51.3, INDA 46.3, IEMG 31.8) scores 46.4 pre-stress, which drops sharply to 12.6 after the category reasoner applies persistence (55.3 on ILF, well below median) and volume-price confirmation filters. ILF's 65.5 momentum confirmation on a -0.1% 13-week return reveals that any positive near-term flow is noise against a macro backdrop that penalizes dollar-weak emerging market equity. The allocation holds as a token position because some risk appetite is active and valuations are marked down, but conviction is minimal. For Emerging Markets to climb into tier-2 at 10%, the dollar would need to weaken structurally, or credit stress and liquidity stress descriptors would need to toggle off—neither is likely within the current disinflation regime.
Agriculture & Livestock — MOO
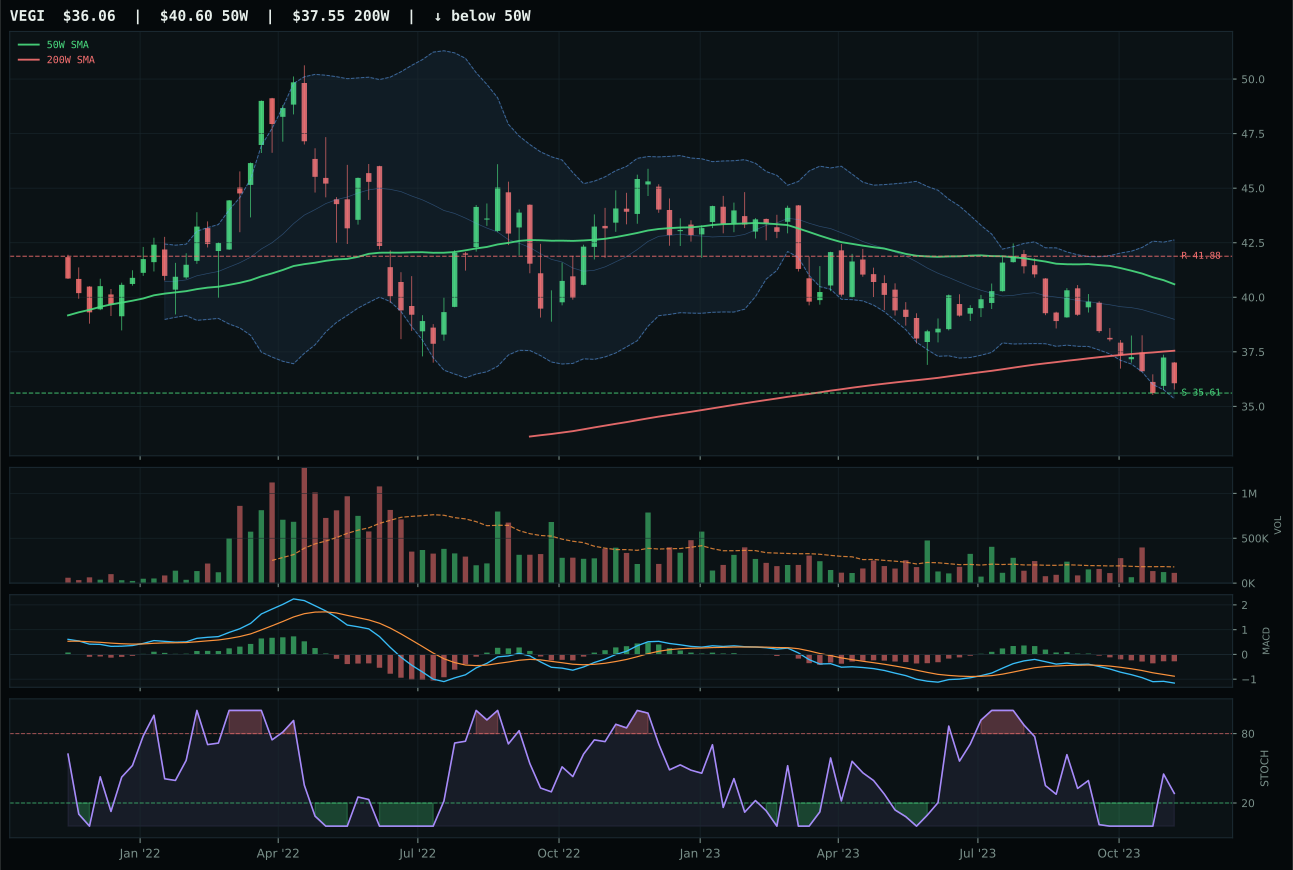
VEGI has a pullback into support profile with -11.0% 13-week relative strength versus SPY.
A failed hold above support would weaken the setup.
Tracked, but not top-2 eligible because: .
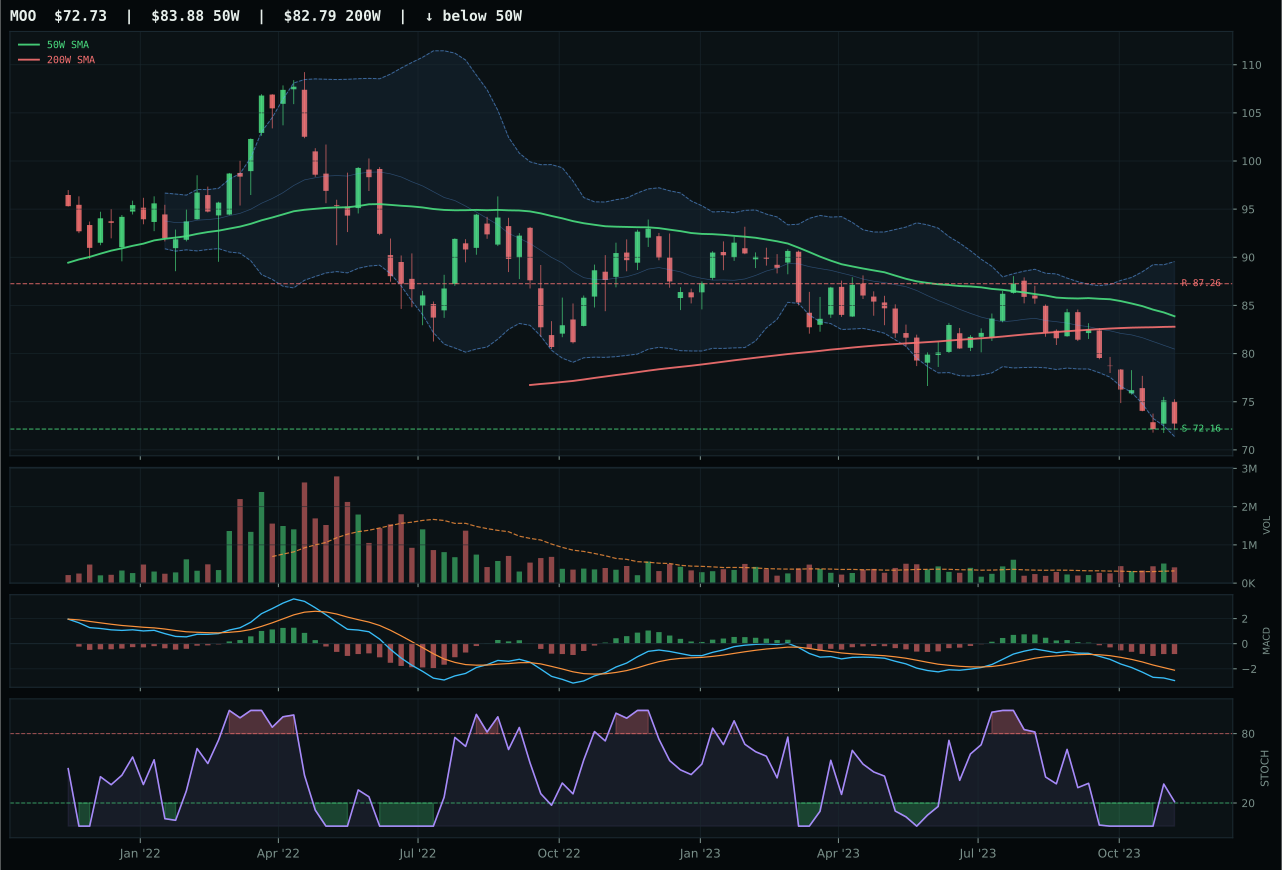
MOO has a pullback into support profile with -14.0% 13-week relative strength versus SPY.
A failed hold above support would weaken the setup.
Actionable but governed by invalidation levels.
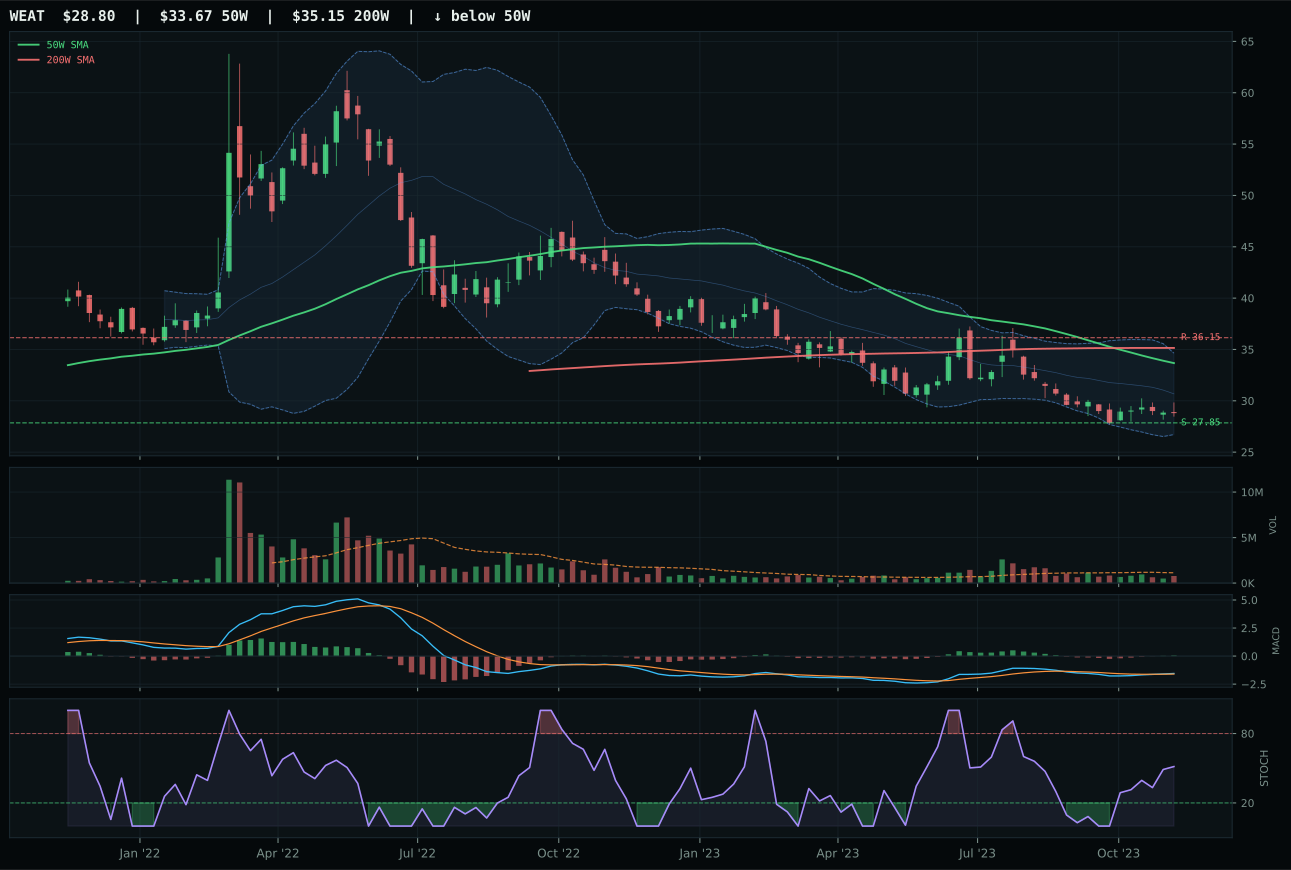
WEAT has a pullback into support profile with -9.4% 13-week relative strength versus SPY.
Extension and support failure are the main tactical risks.
Tracked, but not top-2 eligible because: structurally broken.
MOO won a decisive 10.8-point margin over VEGI—a clear category outcome despite the absolute score of near-zero across both. MOO's 67.0 structure score beat VEGI's 62.9 by maintaining tighter compression (81.0 vs. comparable ranges), and crucially, its above-average participation at 1.30x the 20-week volume average prevented the kind of orphaned rebound that thin participation creates. Both charts sit at the same deep support (72.16), MACD is bearish/weakening for both, and stochastic RSI is rising mid-zone—the setup is repair-zone symmetry. MOO's 13-week return of -15.2% and -14.0% SPY-relative underperformance are brutal metrics, yet the score drivers reveal why MOO edges: its volume-price rejection is being executed with real participation, not a whisper. VEGI's thin participation means any support hold will be fragile; MOO at least shows market-maker engagement at the lows. Neither is a quality long, but MOO's slightly better structural cleanliness and volume authenticity make it the lesser evil.
Agriculture & Livestock received 5% allocation this week—completely excluded from the portfolio—after a category-level macro fit of 32.0 decimated any technical argument. The disinflation regime specifically hurts agricultural equity valuations: food prices are softening, input costs are normalizing, and the margin expansion story that sustained this sector through 2021-2023 has inverted. Active descriptors show disinflation pressure at -8 and liquidity stress at -4, creating a toxic backdrop. The category's 3/2/1 weighted basket starts at 32.0 with WEAT (41.4), VEGI (28.3), and MOO (11.4)—a top-ranked ETF that's only modestly competent—then the category reasoner stress-tests this basket against the macro regime and returns a final score of 0.0. Even MOO's 90.0 risk-reward (16.7% upside to resistance, 0.8% downside to support) cannot compensate for its -15.2% 13-week return and the technical reality that both MACD (bearish/weakening) and volume-price confirmation (3.1/100) confirm that selling is active, not buying. For agriculture to earn any allocation, the disinflation descriptor would need to reverse, or commodity prices would need to stabilize with visible accumulation volume at current support levels.
Industrial Metals — PICK
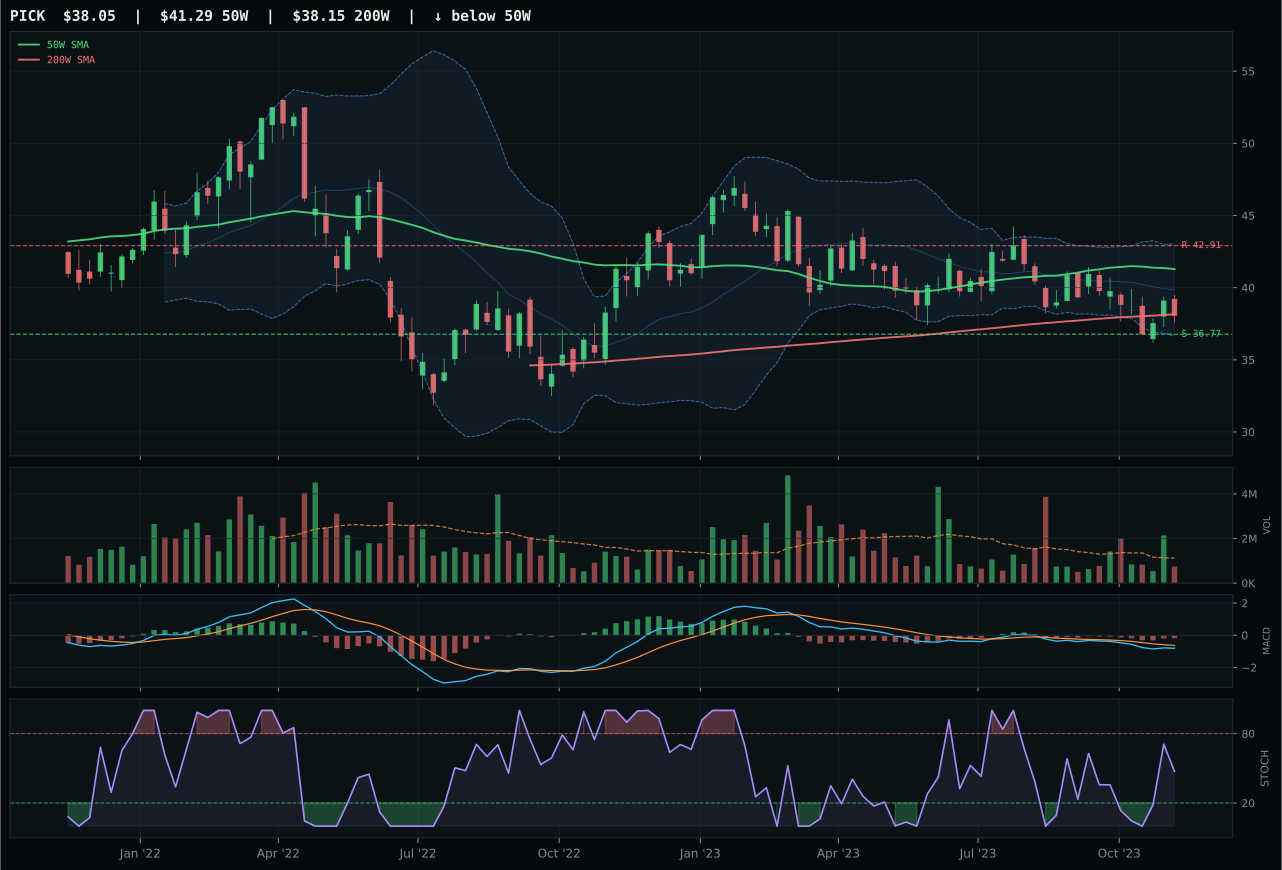
PICK has a pullback into support profile with -4.8% 13-week relative strength versus SPY.
A failed hold above support would weaken the setup.
Actionable but governed by invalidation levels.
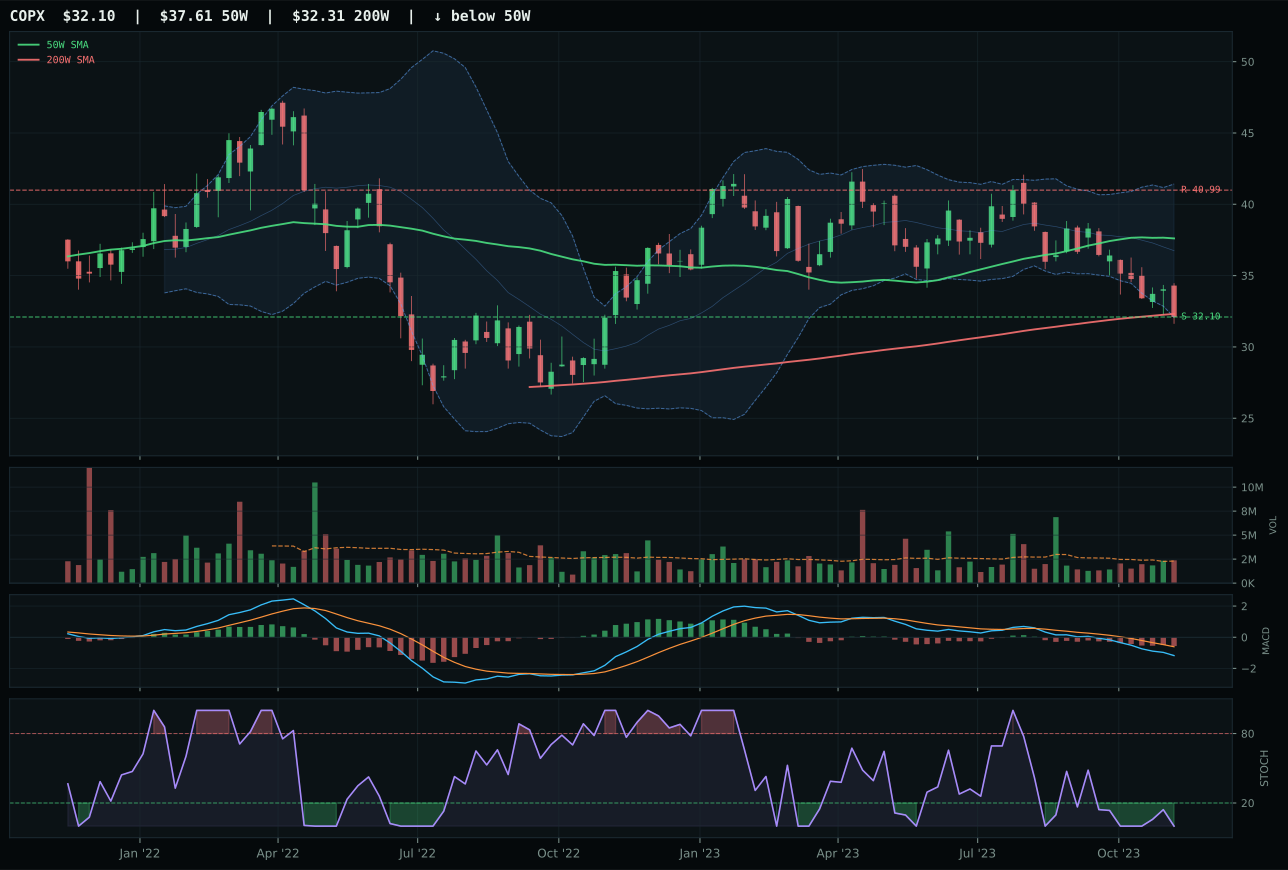
COPX has a pullback into support profile with -15.4% 13-week relative strength versus SPY.
A failed hold above support would weaken the setup.
Actionable but governed by invalidation levels.
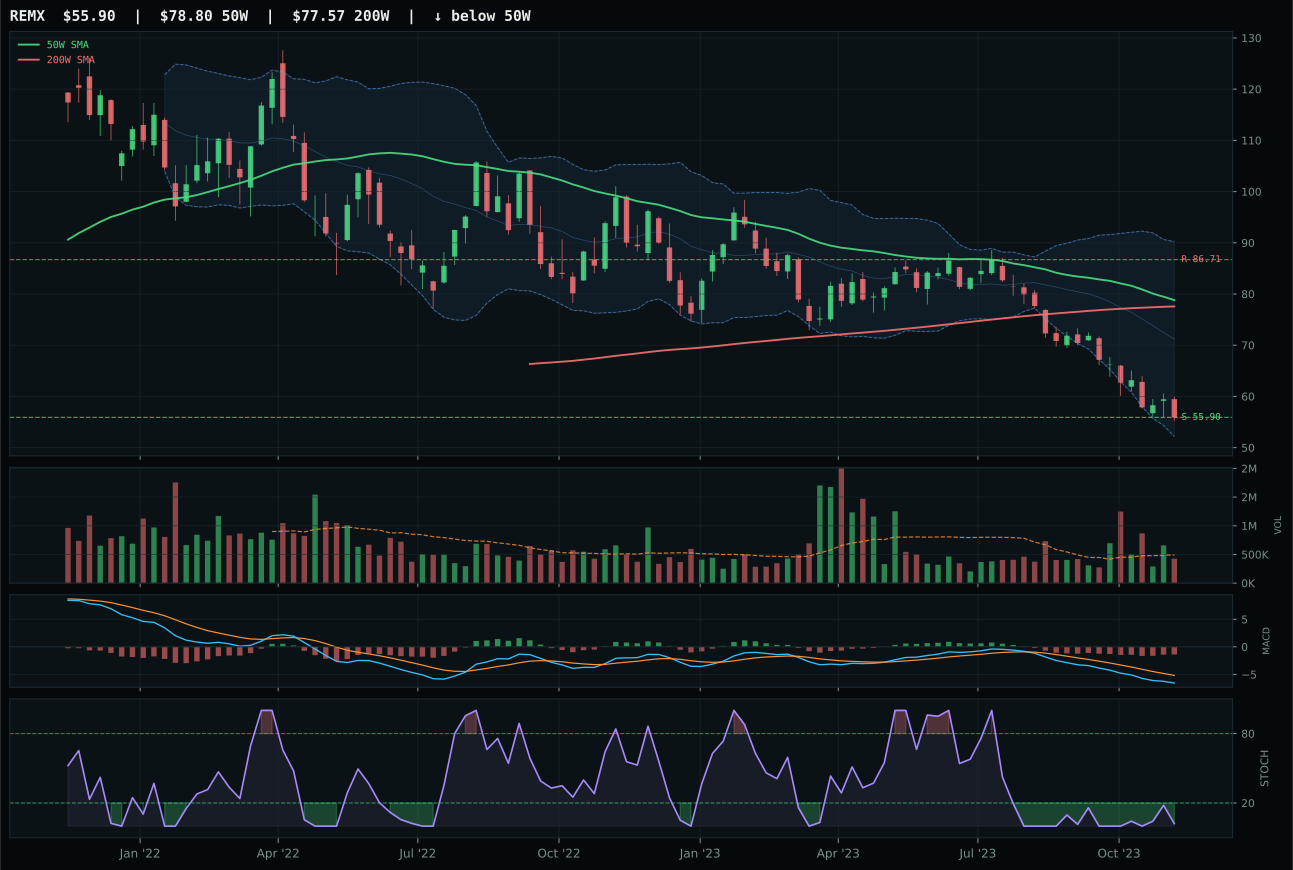
REMX has a pullback into support profile with -26.9% 13-week relative strength versus SPY.
A failed hold above support would weaken the setup.
Actionable but governed by invalidation levels.
PICK defeated COPX by 28.6 points despite both sitting in the same pullback-into-support repair zone, primarily because PICK's timing score of 93.0 versus COPX's 60.0 reflects an entirely different market posture. PICK sits 7.8% below the 50-week with stochastic RSI at 0.47 (rising mid-zone), MACD bearish but improving, suggesting buyers may be testing support; COPX is 8.3% below the 50-week, stochastic RSI is oversold at near 0.00, and MACD is bearish/weakening—a more dire technical picture. Category-relative strength amplifies the decision: PICK shows 10.6% outperformance of the category median, while COPX carries 0.0%, meaning capital is discriminating among miners and choosing the broader index over pure copper scarcity. PICK's 90.0 risk-reward is matched by COPX, but PICK achieves it with rising stochastic RSI momentum and improving MACD, whereas COPX's oversold RSI and weakening MACD suggest the pain is still being distributed. Structure favors PICK at 68.7 versus 66.4—modestly cleaner compression—but the real margin is timing and relative strength.
Industrial Metals received 0% allocation, completely excluded from the portfolio, after a dismal 5.8 final category score reflecting a 28.0 macro fit and deeply negative technical evidence. The macro regime is openly hostile: liquidity stress, credit stress, and dollar pressure all active at -8, -7, and -7 respectively, creating a triplet headwind. Disinflation pressure is not active here (unlike precious metals), so there is no offsetting narrative for industrial commodity equity. The 3/2/1 weighted basket (PICK 53.8, COPX 23.2, REMX 16.1) generates a 37.3 starting point, but when stress-tested against persistence, volume-price confirmation, and the macro regime, it collapses to 5.8. PICK's 47.8 momentum confirmation and 49.4 volume-price confirmation are marginal—not low enough to disqualify, but weak enough to signal that any bounce at support is reactive, not accumulation-driven. The 90.0 risk-reward scores across all three ETFs are optical illusions: they reflect the deep markdown of prices relative to resistance, not fundamental demand. For Industrial Metals to earn even 5% allocation, the dollar would need to weaken materially, or risk appetite would need to flip hard toward reflation—neither of which is in the active macro descriptor set this week.
Traditional Energy — XOP
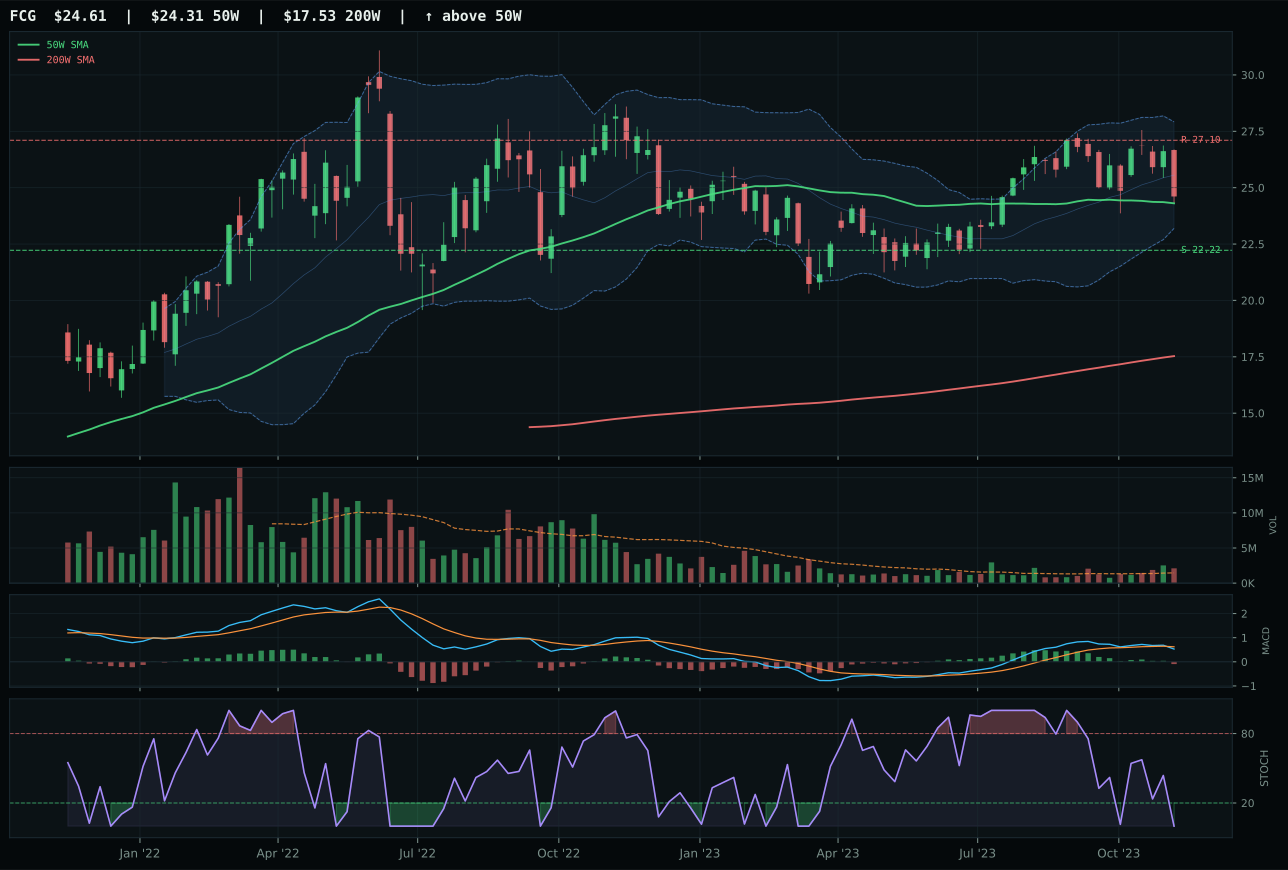
FCG has a compression near 50W profile with -5.5% 13-week relative strength versus SPY.
A failed hold above support would weaken the setup.
Actionable but governed by invalidation levels.
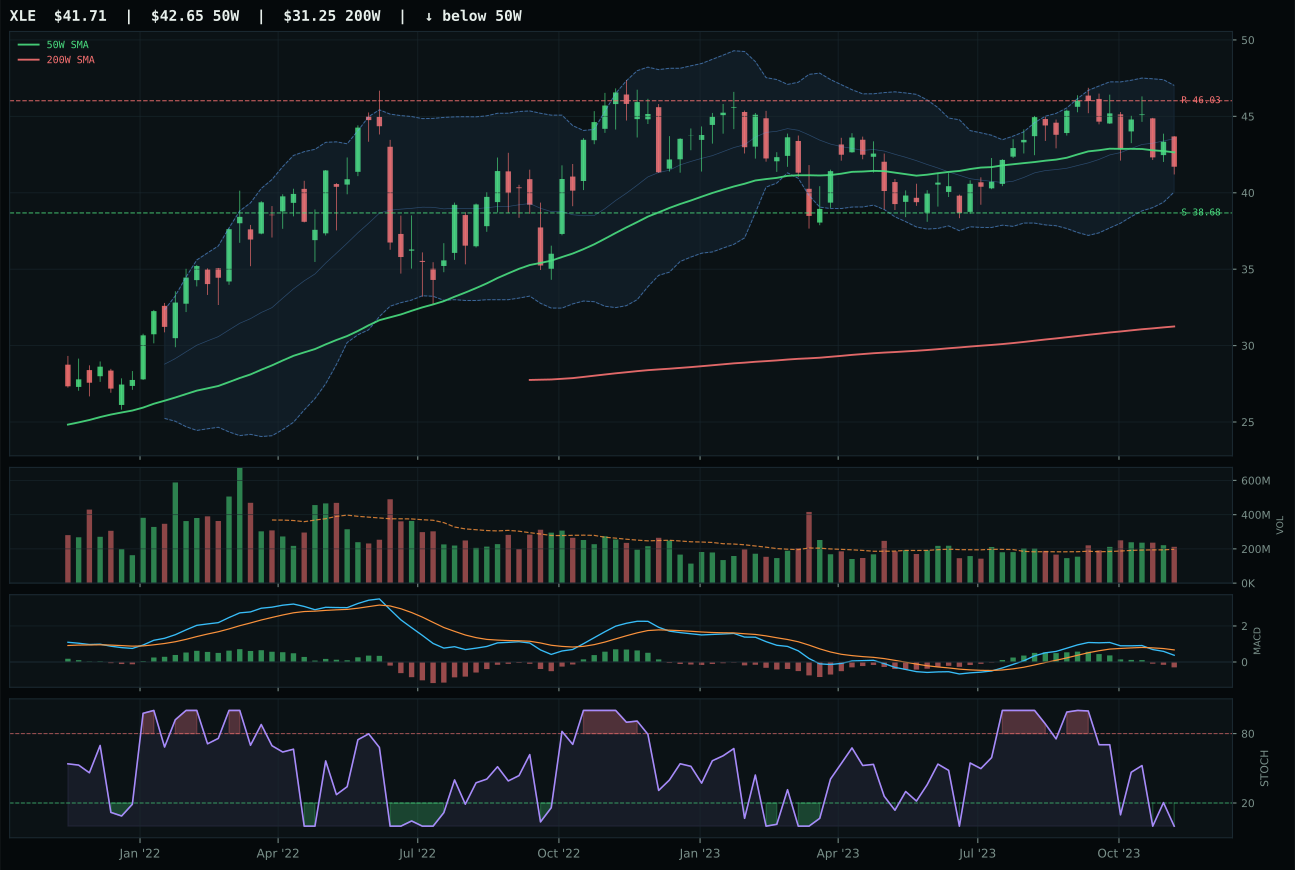
XLE has a compression near 50W profile with -6.1% 13-week relative strength versus SPY.
A failed hold above support would weaken the setup.
Actionable but governed by invalidation levels.
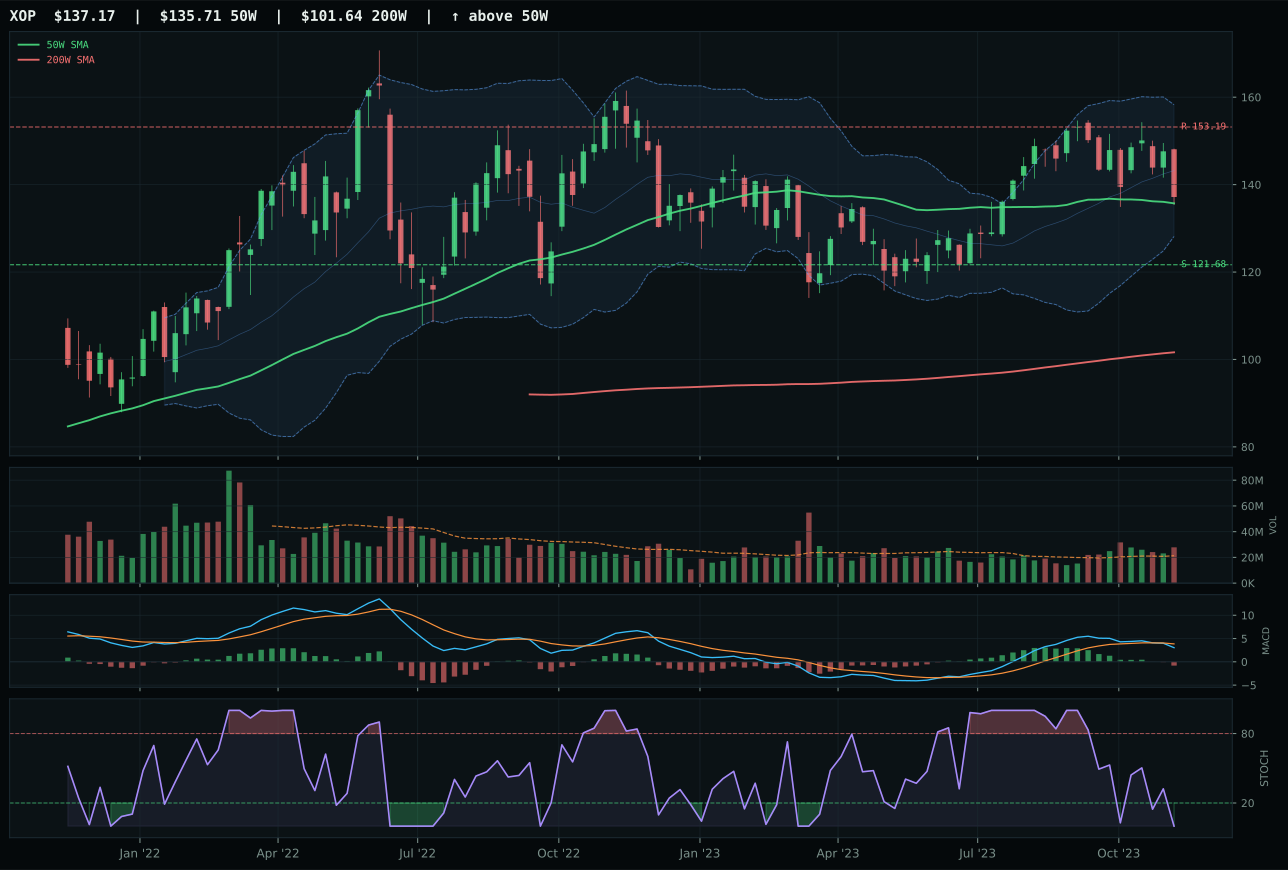
XOP has a compression near 50W profile with -6.7% 13-week relative strength versus SPY.
A failed hold above support would weaken the setup.
Actionable but governed by invalidation levels.
XOP edged FCG by 0.9 points in a near-tie that hinged on structure quality: XOP's 72.3 versus FCG's 69.9. Both charts sit in compression near the 50-week with timing scores of 100.0 each, reflecting a middle retracement Fibonacci zone where decision-making is binary. Both show MACD bearish/weakening and stochastic RSI oversold at near 0.00—identical technicals, which means the winner is decided by secondary filters. XOP's structure edges higher because its compression ratio of 70.9 tightens the range slightly, and its cleanliness score of 50.0 matches FCG's, creating a marginal technical advantage. Volume is above-average participation for both at 1.31x the 20-week for XOP, so sponsorship is even. The real difference is category-relative strength: XOP's -0.6% lag to the median is fractionally better than FCG's +0.6% outperformance in a category where all players are underwater—a relative strength stat in a deteriorating basket is a low bar to clear, but XOP clears it by positioning as exploration beta when nobody wants it.
Traditional Energy received 0% allocation—completely excluded—after a catastrophic 1.5 final category score, the second-lowest in the portfolio behind Industrial Metals. The macro fit is actively poisonous at 16.0: disinflation hurts energy valuations by -10, disinflation pressure is active at -10, and credit stress and liquidity stress each subtract -7. The category baseline rejects energy consumption narratives when rate expectations are falling. The 3/2/1 weighted basket (FCG 37.9, XLE 30.7, XOP 29.0) scores 34.0 pre-stress-test, but the final category reasoner compounds the weakness: both XOP and FCG show MACD bearish/weakening, stochastic RSI oversold without a reversal print, and volume-price confirmation at 26.1 and persistence at 34.1 (XOP's numbers) indicate that strength is noise, not accumulation. A 6.9% momentum confirmation score on XOP screams weakness; the -7.8% 13-week return and -6.7% SPY-relative underperformance are not weather delays or seasonal production rolls—they are structural sector rejection. For Traditional Energy to earn even 5%, the disinflation regime would need to invert or risk appetite would need to spike hard on geopolitical escalation; neither is signaling this week.