
2023-11-03
Informational purposes only. The content in this report, including allocations, analysis, and commentary, is provided solely for informational and educational purposes. It does not constitute financial advice, investment advice, trading advice, or any other type of advice. Past performance does not guarantee future results. Always conduct your own research and consult a qualified financial professional before making investment decisions.
Weekly Allocation
| Ticker | Category | Weight | Role |
|---|---|---|---|
| FBTC | 50% | Overlay | |
| NLR | Nuclear Energy | 10% | Top-2 (10%) |
| GLD | Precious Metals | 10% | Top-2 (10%) |
| XLK | Technology | 5% | Tier-2 (5%) |
| XLU | Utilities & Infrastructure | 5% | Tier-2 (5%) |
| XAR | Defense & Aerospace | 5% | Tier-2 (5%) |
| MOO | Agriculture & Livestock | 5% | Tier-2 (5%) |
| XLE | Traditional Energy | 5% | Tier-2 (5%) |
| SMH | AI | 5% | Tier-2 (5%) |
Trade Instructions — Monday Open
Sell the tranche from 2023-10-06 (completing its 4-week hold). Buy the new tranche. Instructions show net portfolio changes — same-asset positions cancel, weight changes show the delta.
| Action | Ticker | Instruction |
|---|---|---|
| SELL | FCG | Sell 40% of FCG position (reduce 6.25% → 3.75%) |
| SELL | URNM | Sell 33% of URNM position (reduce 7.50% → 5.00%) |
| SELL | INDA | Sell 25% of INDA position (reduce 5.00% → 3.75%) |
| SELL | CIBR | Sell entire CIBR position (1.25% of portfolio) |
| SELL | PAVE | Sell 50% of PAVE position (reduce 2.50% → 1.25%) |
| SELL | PICK | Sell entire PICK position (1.25% of portfolio) |
| BUY | XLE | Buy XLE — 12.50% of freed cash (adds 1.25% to portfolio) |
| BUY | GLD | Buy GLD — 25.00% of freed cash (adds 2.50% to portfolio) |
| BUY | MOO | Buy MOO — 12.50% of freed cash (adds 1.25% to portfolio) |
| BUY | XLK | Buy XLK — 12.50% of freed cash (adds 1.25% to portfolio) |
| BUY | XLU | Buy XLU — 12.50% of freed cash (adds 1.25% to portfolio) |
| BUY | NLR | Buy NLR — 25.00% of freed cash (adds 2.50% to portfolio) |
Current Portfolio After Trade
Combined holdings across all 4 active tranches. Each tranche is 25% of the portfolio.
| Ticker | % of Portfolio | Weight Bar |
|---|---|---|
| FBTC | 50.00% | |
| GLD | 7.50% | |
| URNM | 5.00% | |
| XLK | 5.00% | |
| NLR | 5.00% | |
| INDA | 3.75% | |
| XAR | 3.75% | |
| XLE | 3.75% | |
| MOO | 3.75% | |
| XLU | 3.75% | |
| FCG | 3.75% | |
| PAVE | 1.25% | |
| COPX | 1.25% | |
| ITA | 1.25% | |
| SMH | 1.25% |
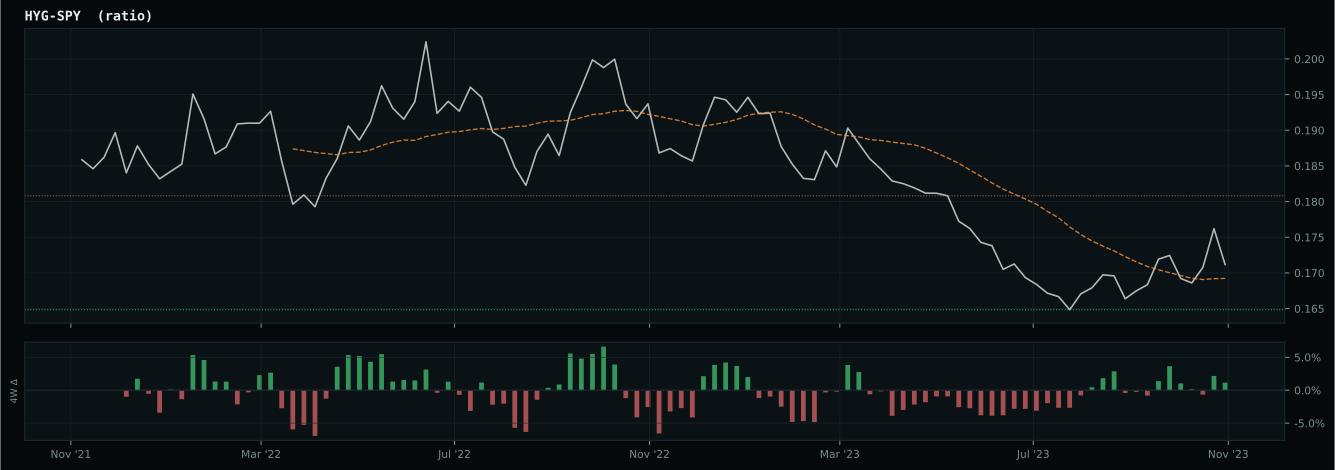
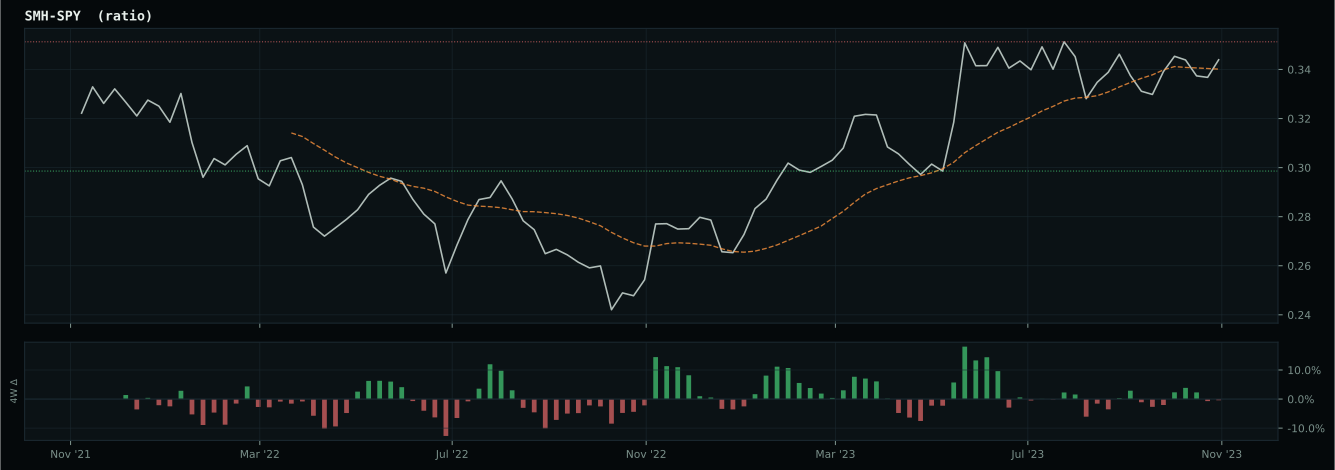
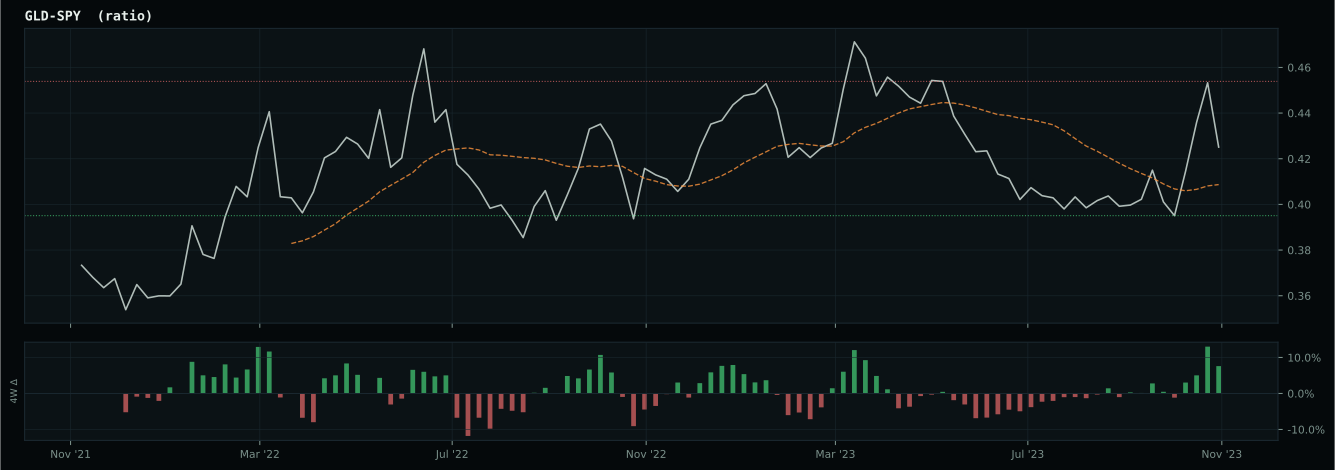
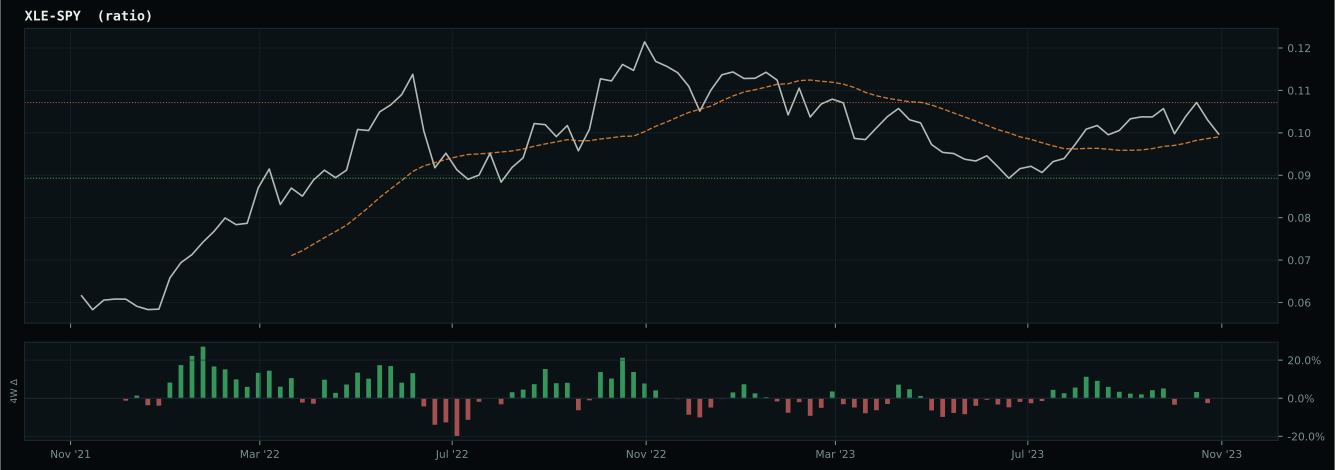
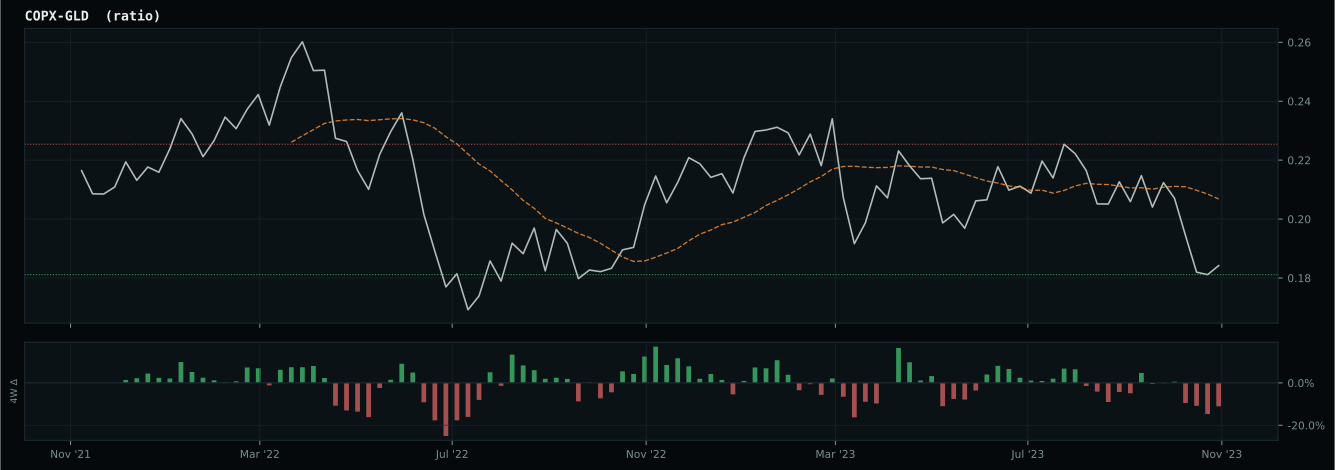
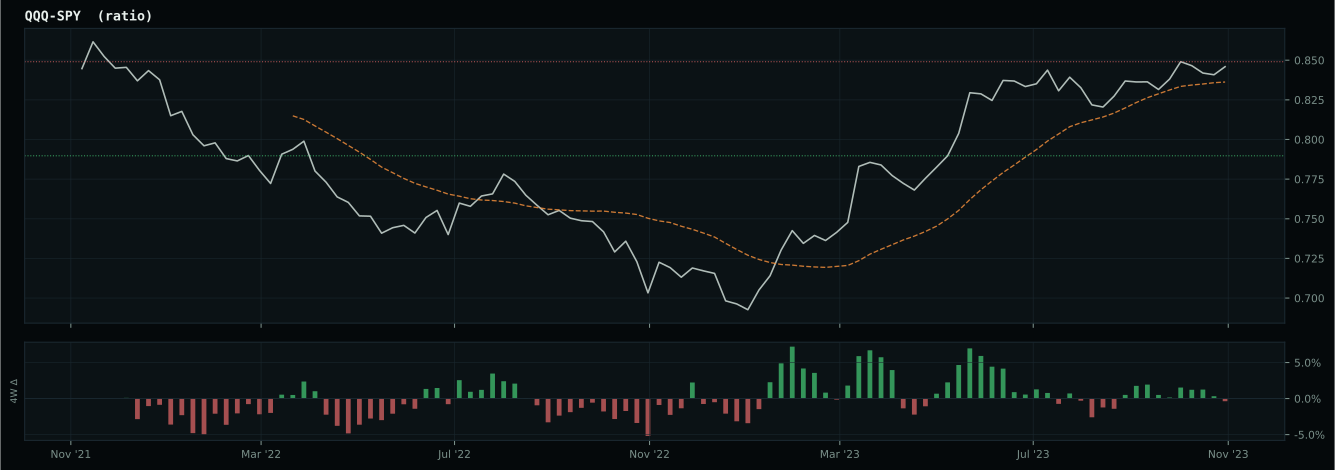
Macro Regime — Disinflation
Macro Evidence Charts
Market-implied signals behind the macro regime scores. Each ratio compares two assets; the direction and slope of the ratio is what the macro engine reads.
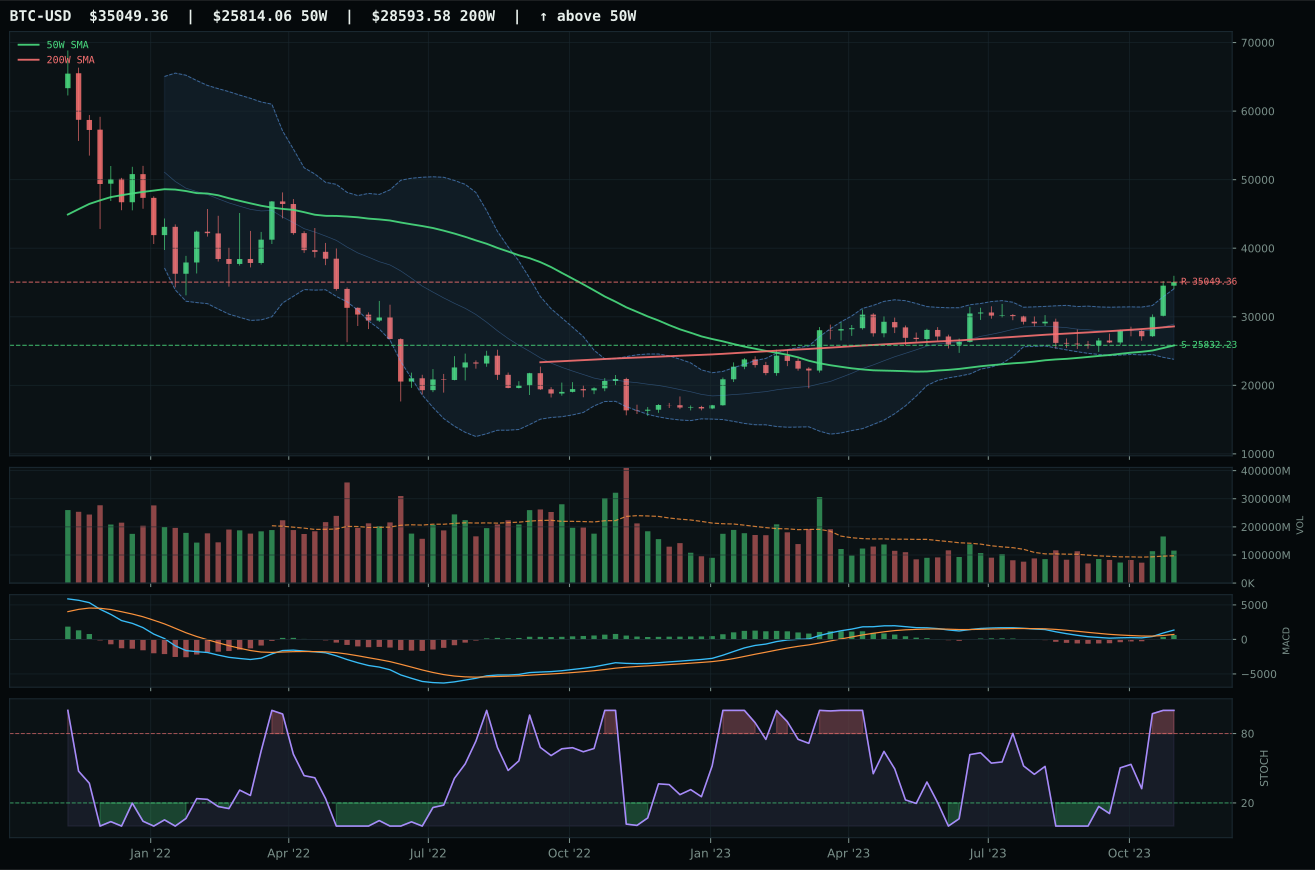
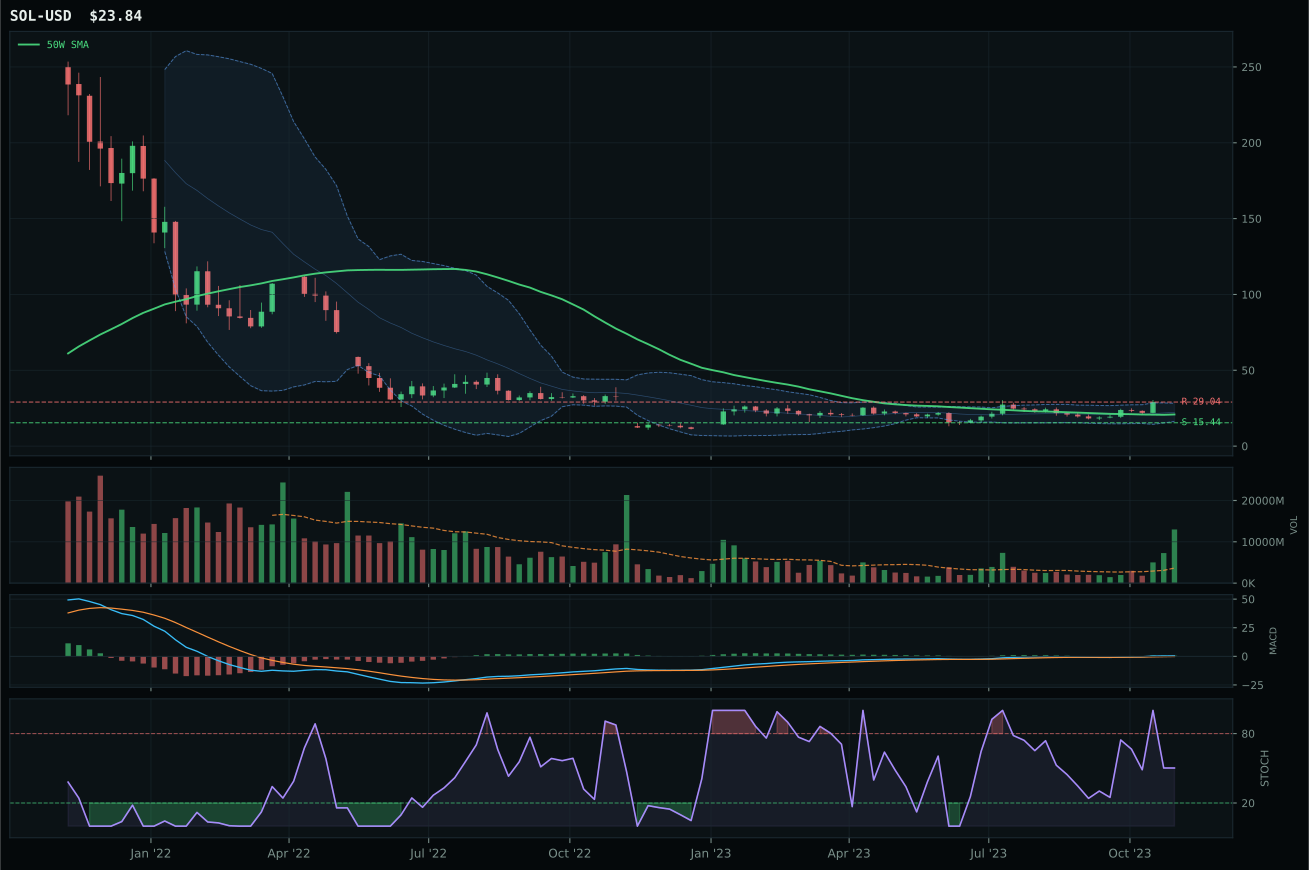
Crypto Regime — TrendBTC
post-touch structure is too wide to count as a range; max/min close ratio is 2.12
TrendBTC confirmed: 2 consecutive closes above rising/flat 50W SMA
one or more available conditions failed
Category Rankings
| Rank | Category | Winner | Score | Alloc | 4W Ret | Peers (4W) |
|---|---|---|---|---|---|---|
| 1 | Nuclear Energy | NLR | 70.2 | 20% | +4.57% | URNM +8.2% · URA +7.3% |
| 2 | Precious Metals | GLD | 56.7 | 20% | +2.97% | SLV +7.2% · GDX +6.0% |
| 3 | Technology | XLK | 55.6 | 10% | +6.83% | IGV +12.2% · CIBR +9.9% |
| 4 | Utilities & Infrastructure | XLU | 52.8 | 10% | +2.03% | IGF +4.5% · PAVE +5.6% |
| 5 | Defense & Aerospace | XAR | 52.6 | 10% | +6.41% | ITA +6.0% · ROKT +6.5% |
| 6 | Traditional Energy | XLE | 28.9 | 10% | -3.40% | FCG -7.6% · XOP -7.0% |
| 7 | AI | SMH | 28.9 | 10% | +6.34% | AIQ +6.7% · BOTZ +7.9% |
| 8 | Emerging Markets | ILF | 17.9 | 10% | +5.75% | INDA +6.3% · IEMG +1.6% |
| 9 | Industrial Metals | PICK | 14.7 | 0% | +5.23% | COPX +2.6% · REMX -4.0% |
| 10 | Agriculture & Livestock | MOO | — | 0% | -1.35% | VEGI +0.1% · WEAT +0.9% |
Nuclear Energy — NLR
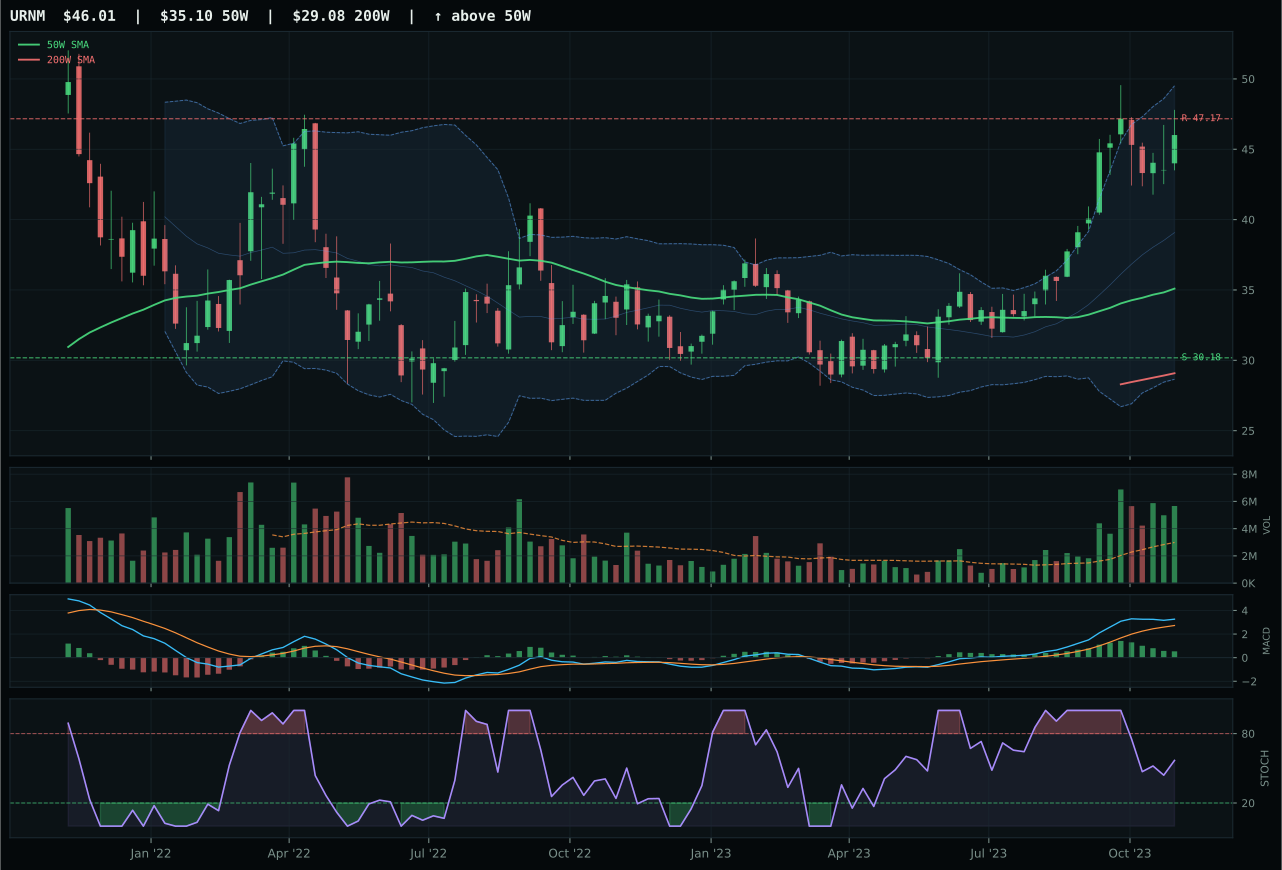
URNM has a vertical extension profile with 36.5% 13-week relative strength versus SPY.
A failed hold above support would weaken the setup.
Actionable but governed by invalidation levels.
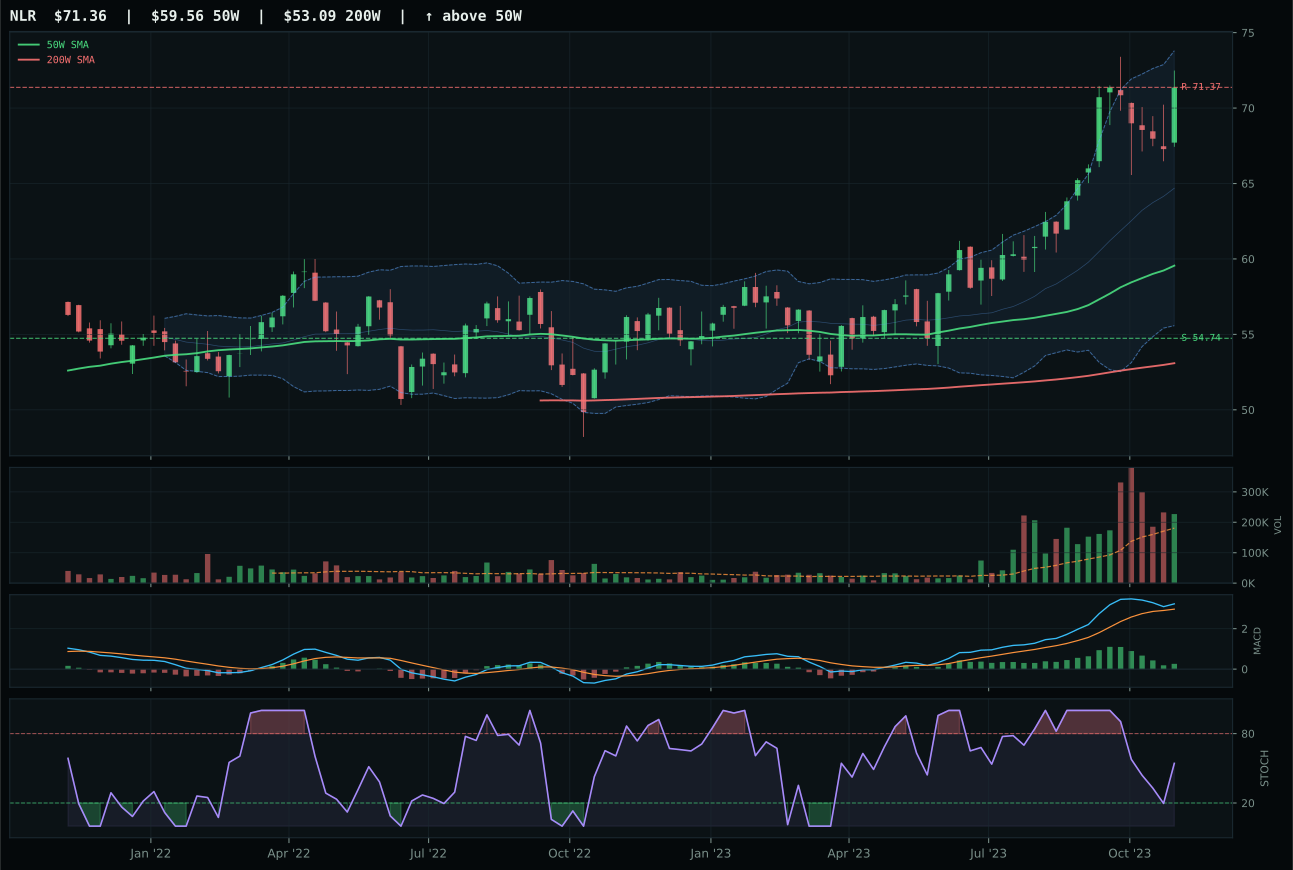
NLR has a vertical extension profile with 20.1% 13-week relative strength versus SPY.
A failed hold above support would weaken the setup.
Actionable but governed by invalidation levels.
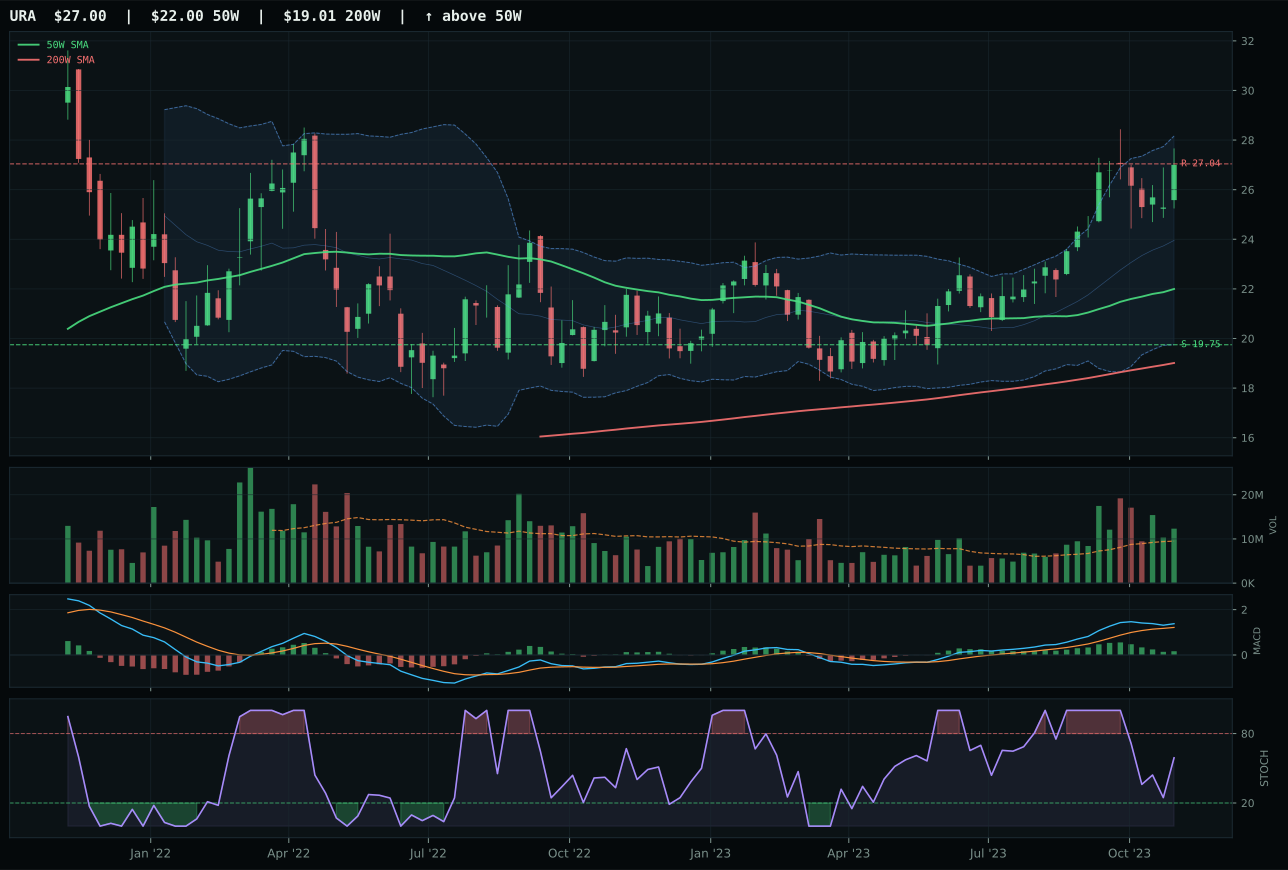
URA has a vertical extension profile with 23.8% 13-week relative strength versus SPY.
A failed hold above support would weaken the setup.
Actionable but governed by invalidation levels.
NLR wins as the category representative with a 2.7-point lead over URNM because it trades at 19.8% extension from the 50-week while URNM is stretched at 31.1%, creating a crucial timing advantage. Both show perfect trend scores of 100, bullish-but-flattening MACD, and rising-mid-zone stochastic RSI, but NLR's timing of 48.0 versus URNM's 56 reflects that the early extension has priced in more of the energy scarcity premium into URNM. NLR's momentum confirmation at 100/100 ties URNM's, but the 13-week return of 17.4% with RS versus SPY of 20.1% shows that nuclear utilities have delivered conviction-level outperformance without the extreme uranium-miner volatility. Volume-price confirmation at 72.3/100 for NLR versus URNM's higher participation suggests that NLR buyers are more methodical institutional accumulation while URNM is attracting retail chasing extended moves. The category-relative strength of -3.7% for NLR is actually an advantage: it means the nuclear utilities story is being adopted by core holdings rather than speculation.
Nuclear Energy earns 10% allocation as a top-2 overweight with a 70.2 final score reflecting exceptional technical evidence of 83.6/100 paired with solid macro fit of 56.0. Energy scarcity is explicitly active at 9 points, supporting the category's core narrative, while liquidity stress pulls back 7 points—a net positive environment. NLR's trend score of 100 combined with momentum confirmation of 100 creates a rare symmetry where price discovery and participation alignment both confirm the move. The risk is obvious: timing score of 48.0 signals significant extension, and risk-reward at 37.0 offers only 0.0% upside to resistance while downside to support spans 30.4%. This is allocated despite stretched entry because the macro regime (energy scarcity, disinflation supporting utility dividends) and the category momentum (nuclear is the thematic winner in the energy transition) align with portfolio construction. At 10%, NLR serves as a conviction bet on energy infrastructure transition rather than a value entry; it works as top-2 because it offers the best risk-adjusted macro exposure, not because it is the cheapest entry point.
Precious Metals — GLD
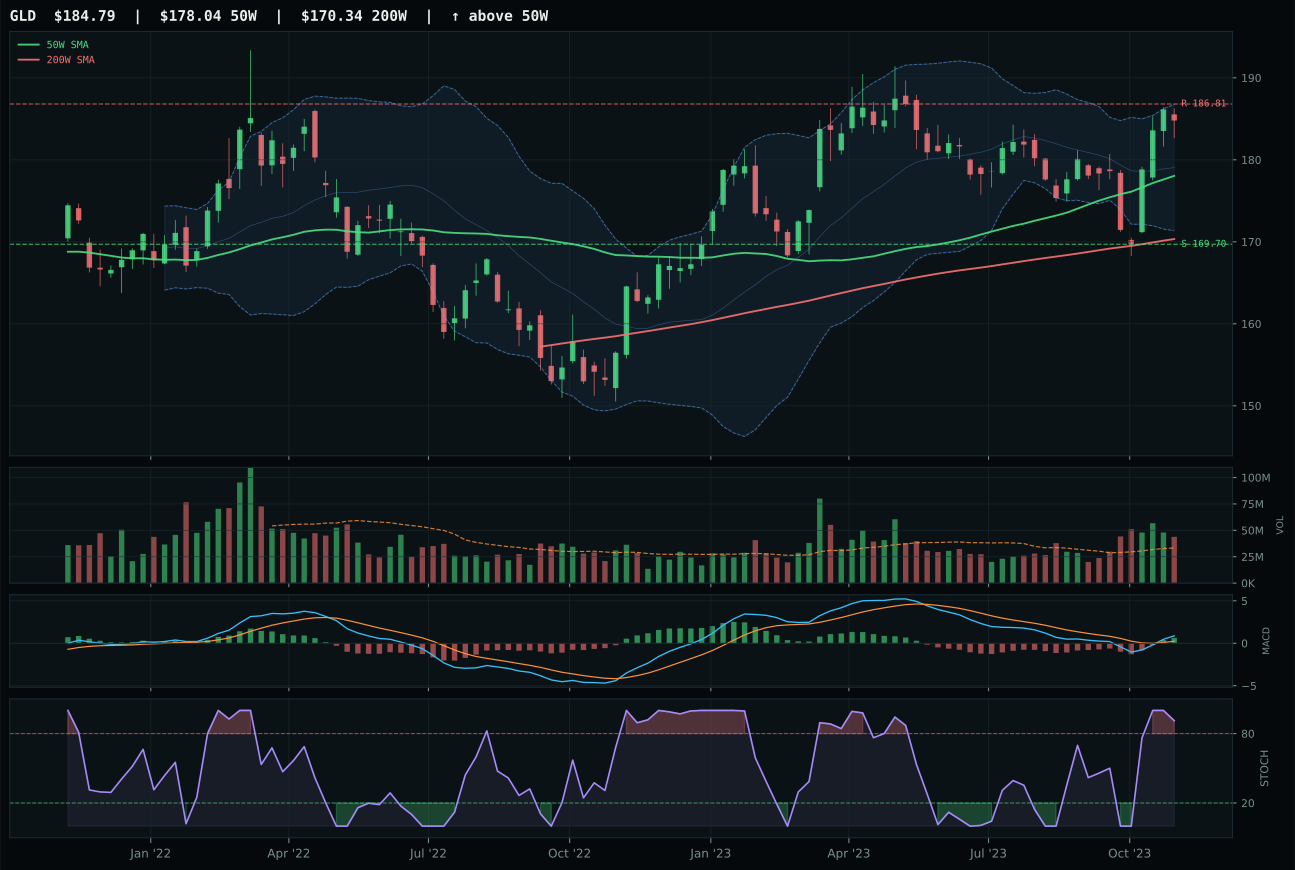
GLD has a neutral structure profile with 5.3% 13-week relative strength versus SPY.
A failed hold above support would weaken the setup.
Actionable but governed by invalidation levels.
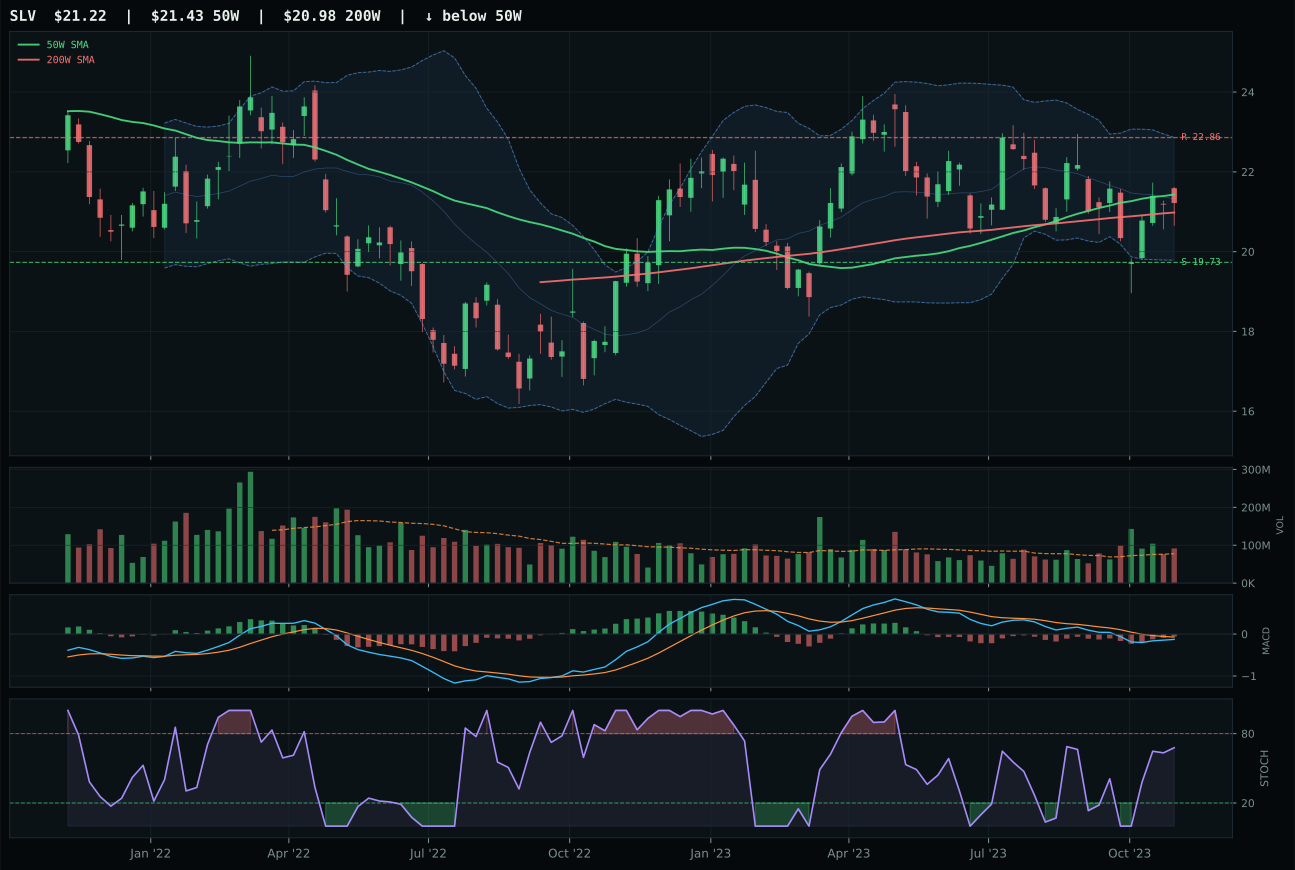
SLV has a compression near 50W profile with 0.7% 13-week relative strength versus SPY.
A failed hold above support would weaken the setup.
Actionable but governed by invalidation levels.
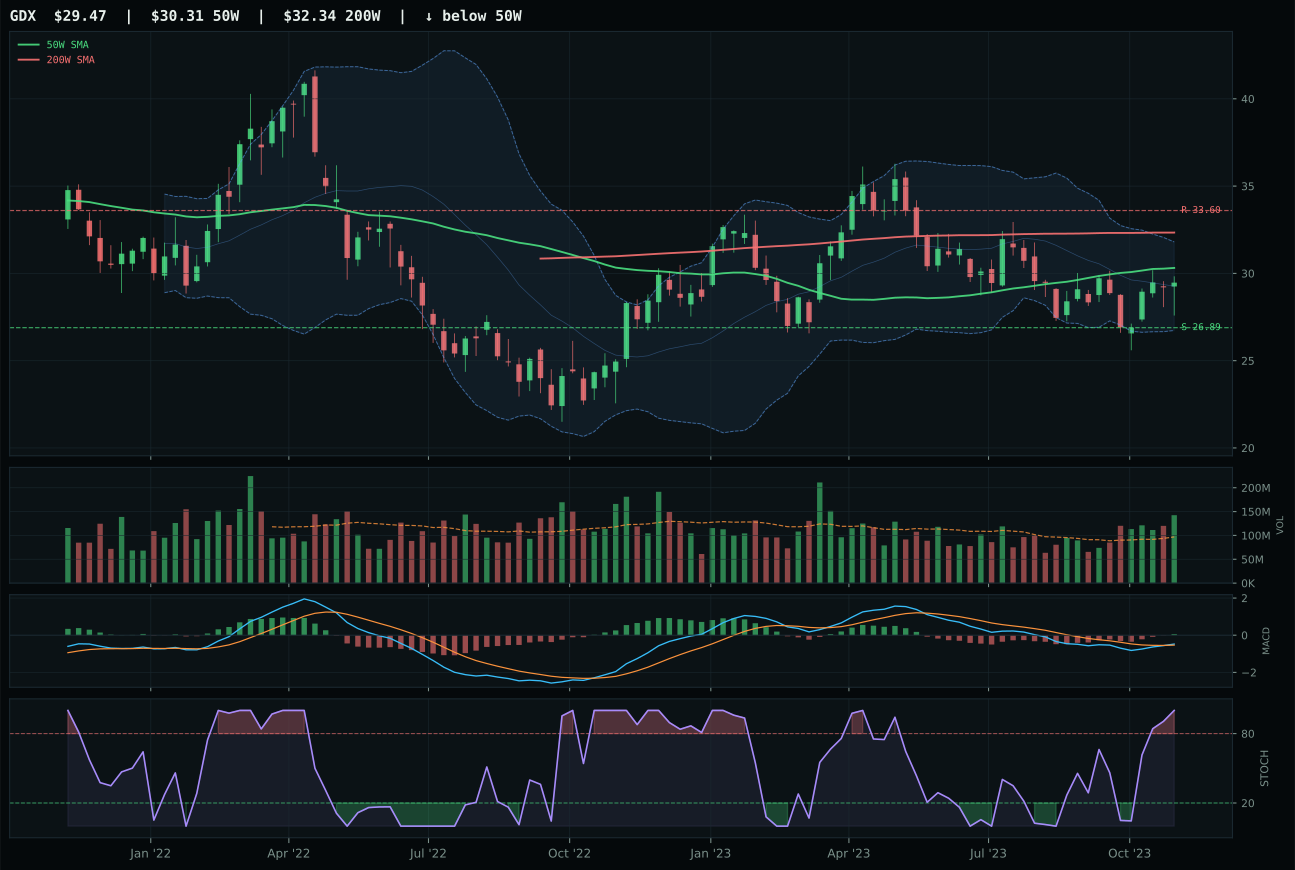
GDX has a compression near 50W profile with 2.4% 13-week relative strength versus SPY.
Extension and support failure are the main tactical risks.
Tracked, but not top-2 eligible because: structurally broken.
GLD dominates the category with a 13.2-point lead over SLV because gold owns a clean trend story with perfect 100/100 score reflecting price above both moving averages and strong relative strength of 5.3% versus SPY. More importantly, GLD's MACD is bullish and improving while SLV's remains bearish but improving—that distinction matters when assessing whether accumulation is turning conviction into momentum. GLD's category-relative strength of 2.9% versus SLV's negative 1.7% tells the story of capital flowing into the monetary hedge narrative rather than the hybrid industrial-monetary play. Stochastic RSI sits overbought momentum at 0.91 for GLD, signaling extension, but the volume confirmation at 80.8/100 and momentum confirmation at 97.5/100 show that buyers are still actively engaged and accepting higher prices. SLV's structure at 75.8 versus GLD's 78.6 represents the tightening risk—when silver fails to confirm gold's strength on structure measures, it suggests the market is pricing in recession resistance via gold while hedging against industrial demand collapse.
Precious Metals earns 10% as a top-2 overweight category, the stronger of the two portfolio anchors with a 56.7 final score driven by exceptional technical evidence of 90.0/100 and powerful macro fit of 74.0. The monetary hedge bid is active at 14 points, and disinflation itself provides an 8-point boost—the macro regime is explicitly favorable for gold. GLD's composite technical score of 87 reflects a rare combination of perfect trend, near-50W proximity at 3.8%, bullish MACD, and strong volume confirmation that creates a virtuous setup where entry timing and macro tailwind align. The risk is that 47.2 risk-reward score signals limited upside room to resistance at 186.81, but the category's allocation reflects a defensive positioning call rather than an aggressive momentum bet. In a disinflation regime with liquidity concerns, GLD at 10% serves as both a conviction macro hedge and a technical leader with confirmed sponsorship.
Technology — XLK
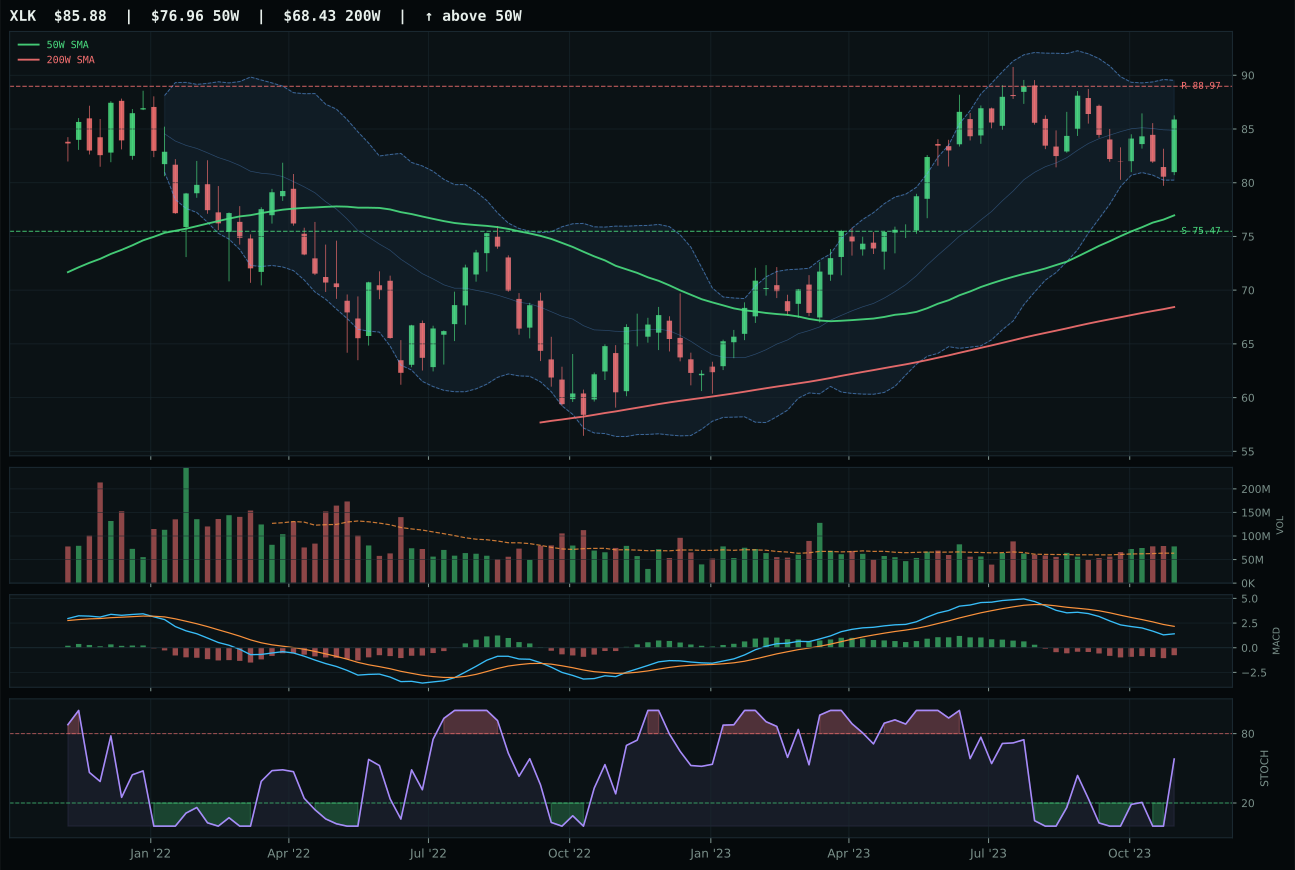
XLK has a neutral structure profile with 3.1% 13-week relative strength versus SPY.
A failed hold above support would weaken the setup.
Actionable but governed by invalidation levels.
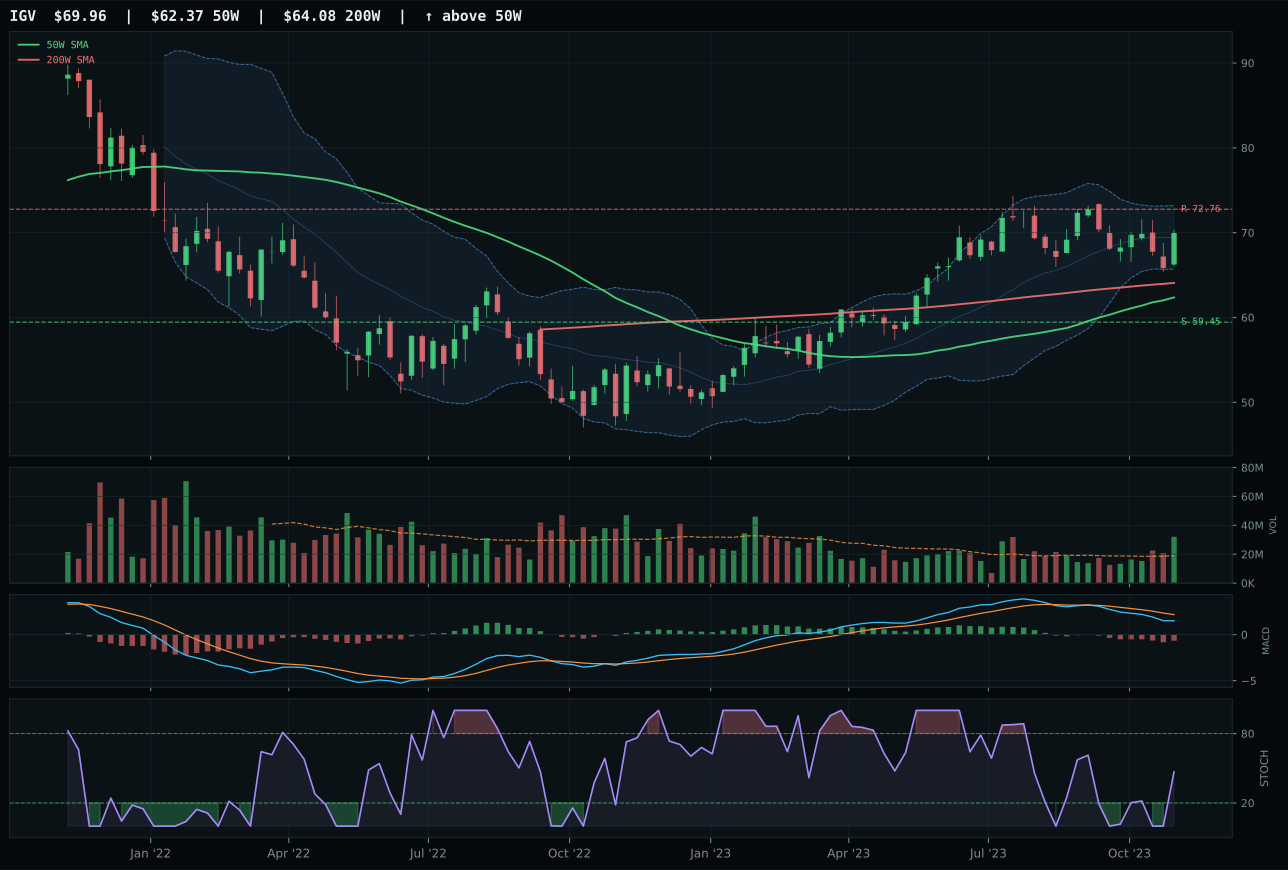
IGV has a neutral structure profile with 3.6% 13-week relative strength versus SPY.
A failed hold above support would weaken the setup.
Actionable but governed by invalidation levels.
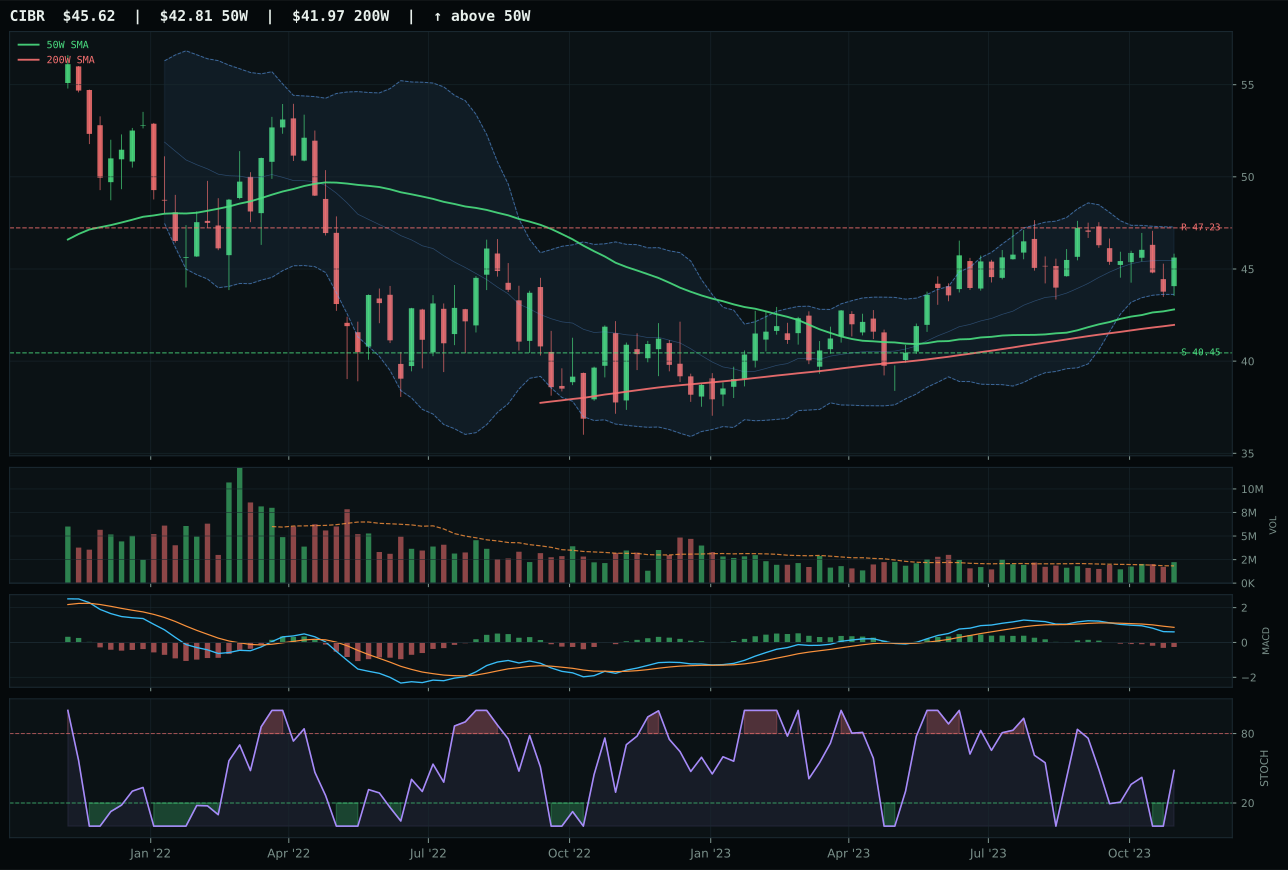
CIBR has a neutral structure profile with 4.0% 13-week relative strength versus SPY.
A failed hold above support would weaken the setup.
Actionable but governed by invalidation levels.
XLK wins the category with a 3.8-point margin over IGV because its trend structure remains above both the 50-week and 200-week moving averages while its timing score of 83.0 beats IGV's 78.0. The technical edge comes from XLK's superior stochastic RSI setup in the rising mid-zone and above-average volume participation at 1.23x the 20-week average, which confirms accumulation rather than mere bounce. IGV's MACD has weakened to bearish while its momentum confirmation lags at 51 versus XLK's 65, signaling that enterprise software is losing sponsorship relative to broader profitable technology leadership. What matters here is not just the 3.1% relative strength versus SPY—it's that XLK's volume is actively confirming the move while every new buyer is stepping in at progressively higher prices, reducing the probability of a clean continuation from this level.
Technology earns 5% allocation as a tier-2 category, ranking below the top-two overweights in a 50% overlay regime. The macro environment presents real headwinds: liquidity stress is active and pulling down the category-level macro fit score to 41.0 despite disinflation offering a modest 7-point tailwind. XLK's technical evidence of 76.8/100 carries the category forward, but the 47.0 category-level macro fit and 55.6 final score place it outside the premium allocation tiers. For Technology to graduate to top-2, either the macro descriptor backdrop would need to shift—particularly if dollar pressure or liquidity stress reversed—or the category would require a cleaner breakout setup with less extension risk built into current valuations. At 5%, the position acknowledges XLK's directional strength while respecting the macro regime's structural bias against duration-sensitive technology.
Utilities & Infrastructure — XLU
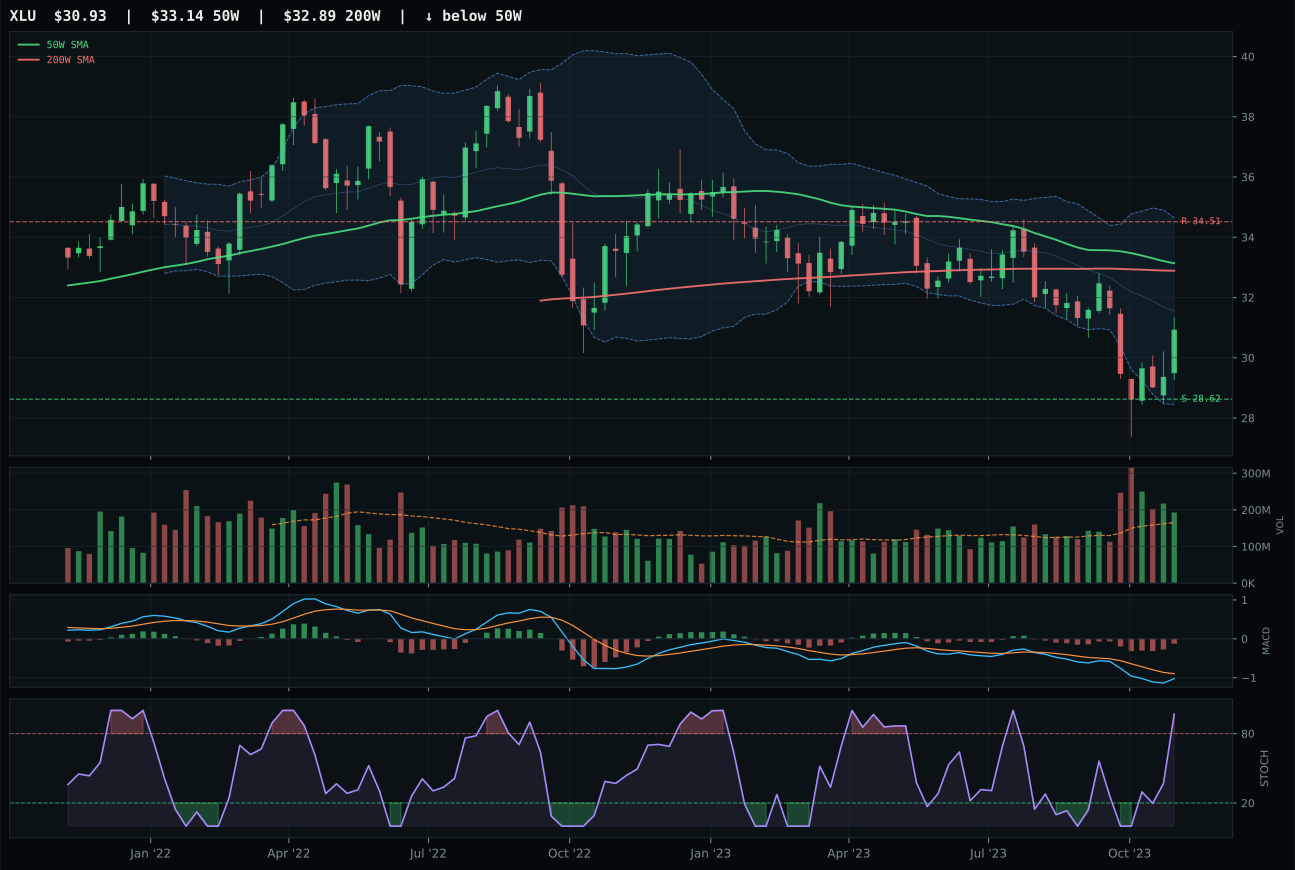
XLU has a neutral structure profile with -0.6% 13-week relative strength versus SPY.
A failed hold above support would weaken the setup.
Actionable but governed by invalidation levels.
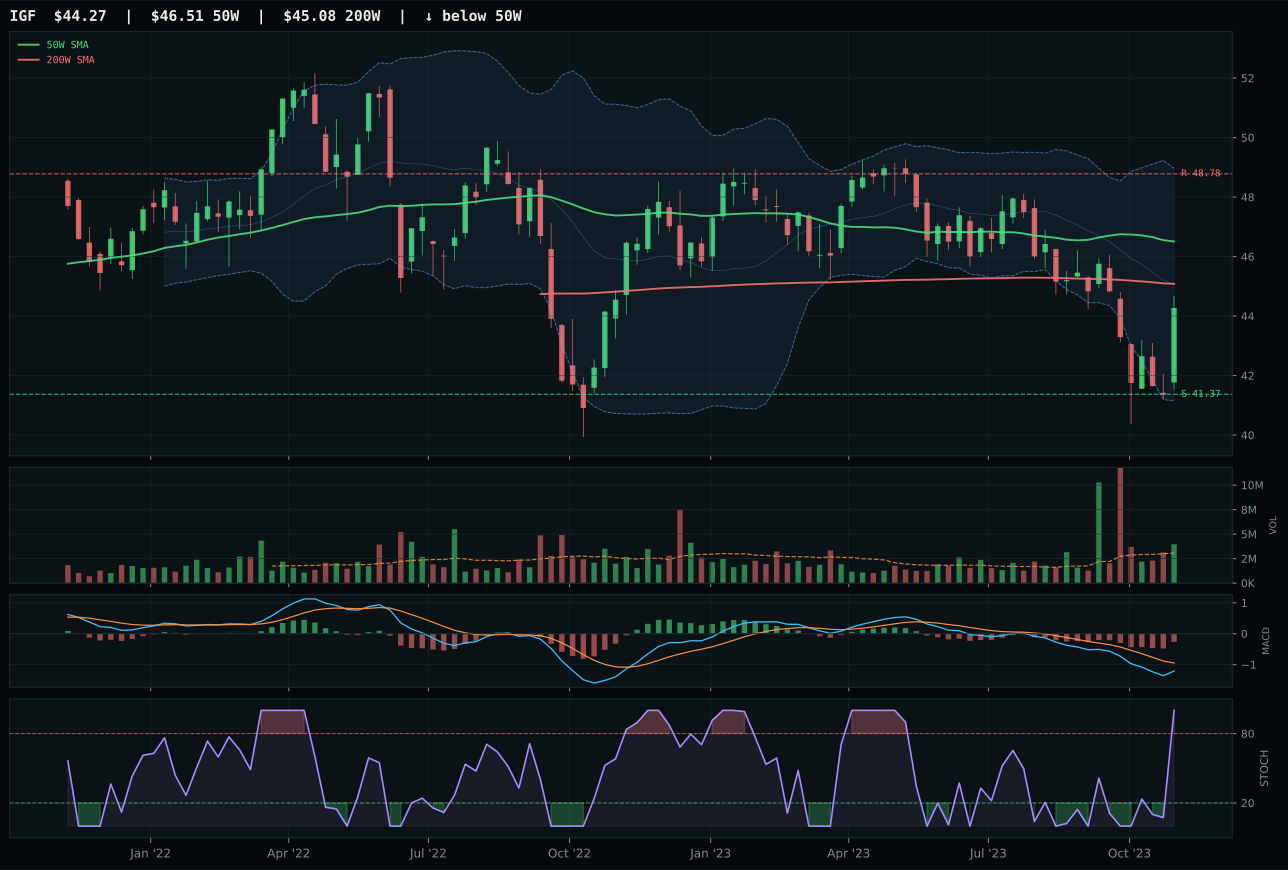
IGF has a neutral structure profile with -1.0% 13-week relative strength versus SPY.
A failed hold above support would weaken the setup.
Actionable but governed by invalidation levels.
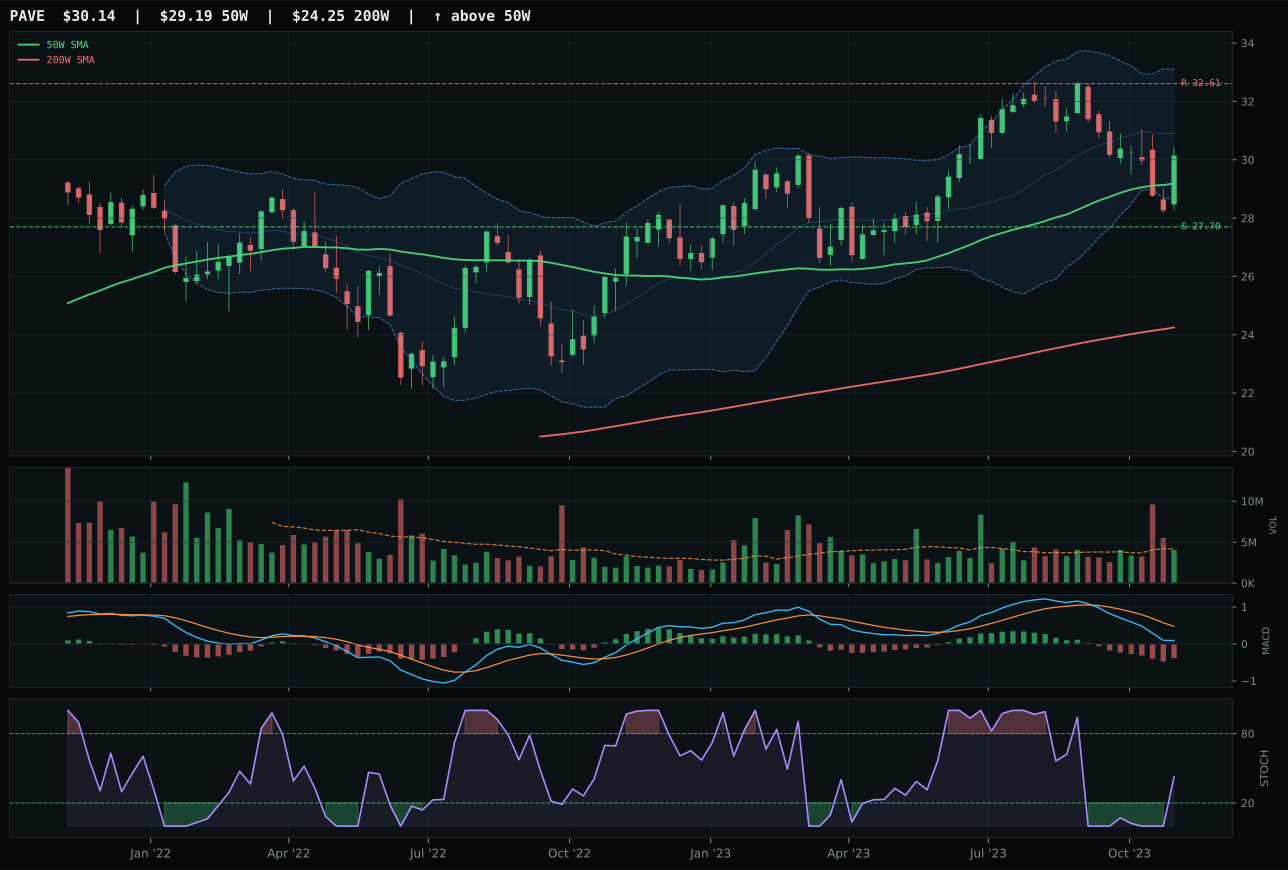
PAVE has a neutral structure profile with -3.2% 13-week relative strength versus SPY.
A failed hold above support would weaken the setup.
Actionable but governed by invalidation levels.
XLU wins by narrowest margins—just 0.4% category-relative strength versus IGF's 0.0%—because both are structurally similar but XLU's cleanliness at 73.8 marginally edges IGF's 72.3. Both charts show price well below the 50-week moving average (XLU at -6.7%, IGF at a similar level implied by context), which makes this a support-recovery setup rather than trend-following. The timing scores are nearly identical at 75.0 for XLU and 90 for IGF, but XLU's advantage emerges in momentum confirmation at 67.1 versus IGF's 62, suggesting that regulated utility accumulation is slightly more convincing than global infrastructure income. Volume participation at 1.17x for XLU versus IGF's comparable level means the buying on the dip is happening, but neither shows exceptional conviction. The stochastic RSI is overbought momentum at 0.97 for both, indicating the bounce is already underway and entry timing is narrowing.
Utilities & Infrastructure earns 5% allocation as a tier-2 category with a 52.8 final score reflecting moderate technical evidence of 60.3/100 paired with respectable macro fit of 56.0. Disinflation is explicitly supportive at 7 points, as lower growth expectations favor defensive dividend plays, and the transition-mixed regime helps utilities at 4 additional points. However, the category's rank below top-2 reflects that both the technical setup and macro backdrop, while positive, are not dominant relative to the stronger macro convictions in Gold and Nuclear Energy. XLU's current position 6.7% below the 50-week makes it a recovery candidate rather than a new-leg-higher candidate—the category offers value and income, not momentum. At 5%, Utilities serves as a defensive sleeve acknowledging that dividend yields and rate-sensitive regulatory returns will outperform in disinflation, but the allocation size reflects that absolute attractiveness lags more conviction-level setups. To graduate to top-2, the category would need either a technical reset that broke above resistance with broad-based volume, or a macro shock that made defensive yields the dominant narrative override.
Defense & Aerospace — XAR
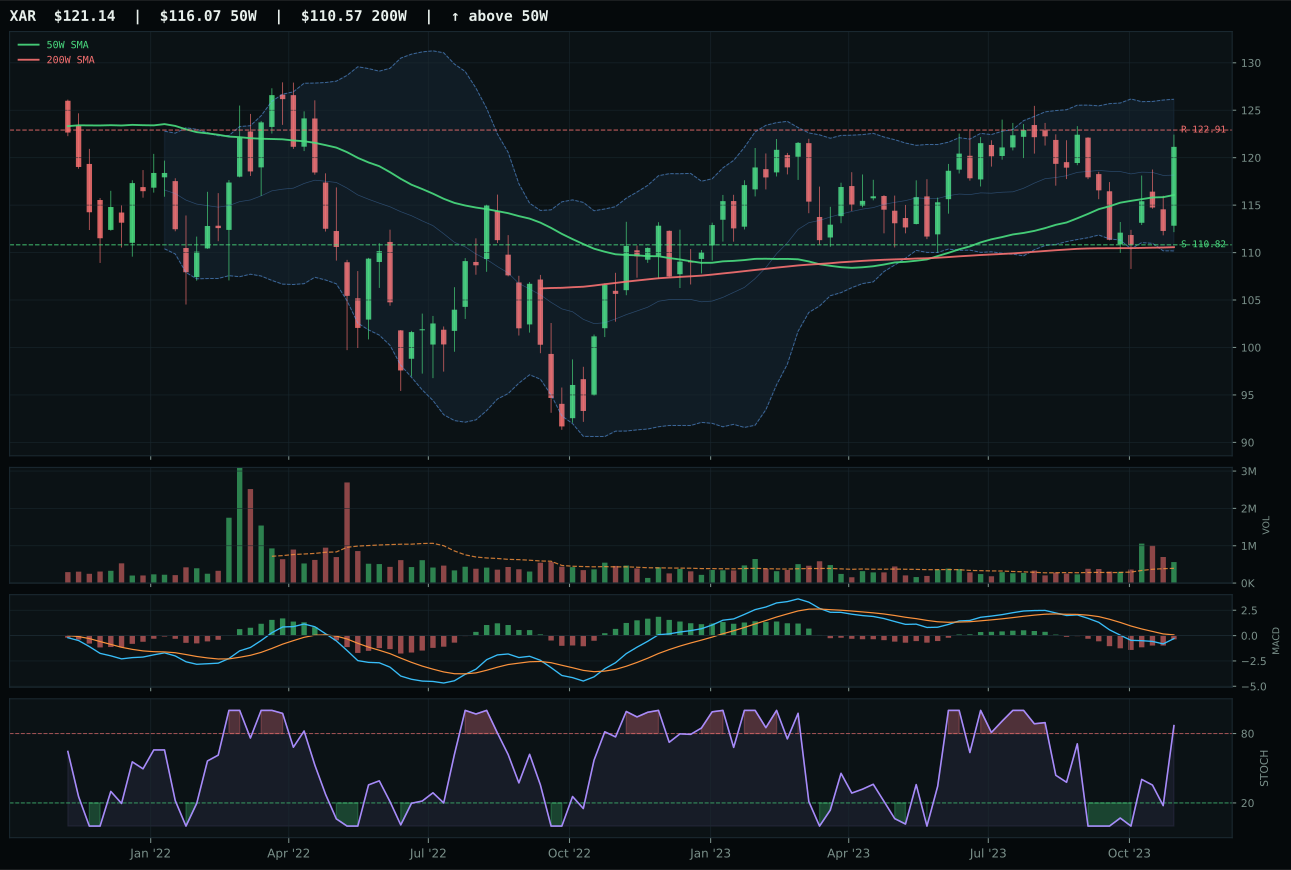
XAR has a neutral structure profile with 1.9% 13-week relative strength versus SPY.
A failed hold above support would weaken the setup.
Actionable but governed by invalidation levels.
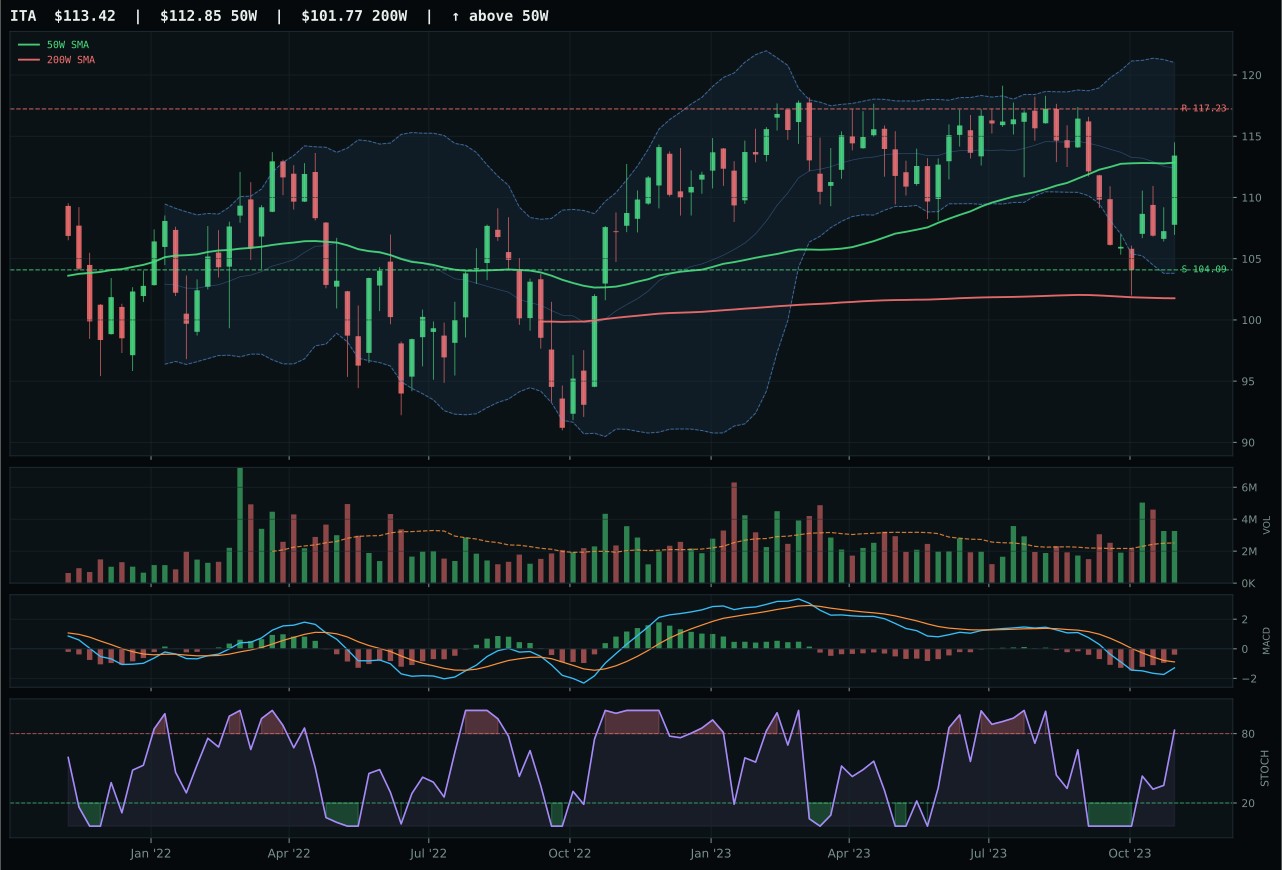
ITA has a compression near 50W profile with 0.8% 13-week relative strength versus SPY.
A failed hold above support would weaken the setup.
Actionable but governed by invalidation levels.
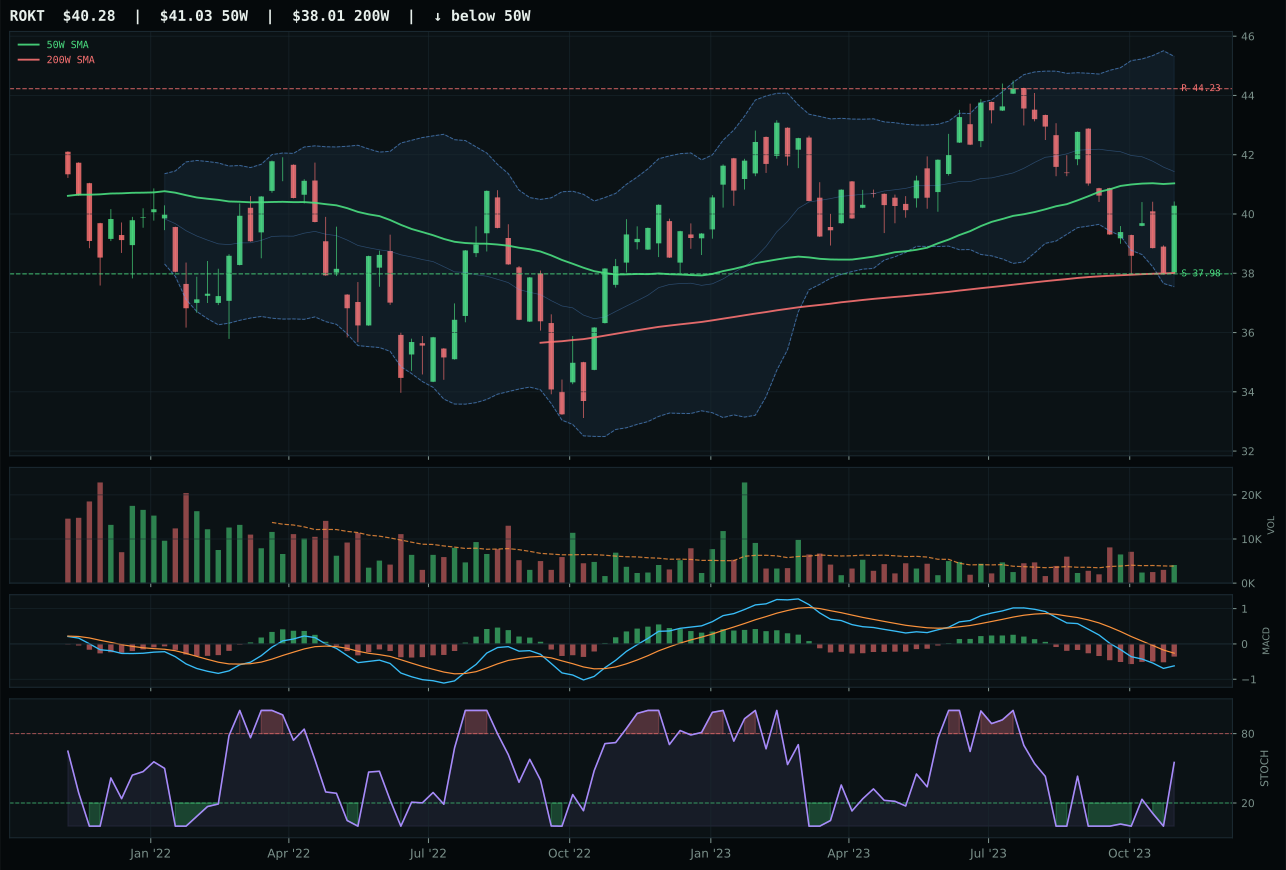
ROKT has a compression near 50W profile with -4.0% 13-week relative strength versus SPY.
A failed hold above support would weaken the setup.
Tracked, but not top-2 eligible because: .
XAR wins the category by category-relative strength, posting 1.1% versus ITA's 0.0%, a tight decision that hinges on technical confirmation. Both charts show price in the upper retracement zone with stochastic RSI in overbought momentum territory, but XAR's neutral structure at 69.3 bests ITA's compression-near-50W setup at an implied tighter zone. The real separation emerges in momentum confirmation: XAR's 76.8 score versus ITA's 72, driven by XAR's stronger 4-week return of 9.3% and the category-relative strength advantage. Both are only 1-4% from the 50-week moving average, which means XAR's narrower distance of 4.4% represents less entry risk. Volume-price confirmation favors XAR at 71.0 versus 66, suggesting that accumulation into strength is slightly more visible in the defense broad-base play than in the defense-prime durability story.
Defense & Aerospace earns 5% allocation as a tier-2 category with a 52.6 final score that reflects strong technical evidence of 75.0/100 for XAR balanced against neutral macro fit at 52.0 category-level. Dollar pressure and energy scarcity each add modest support, but liquidity stress pulls back 4 points, leaving the macro backdrop neither clearly helpful nor harmful. The category ranks below the top-2 overweights because two higher-scoring categories offered better risk-adjusted setups; however, XAR's near-50W compression and overbought momentum do present entry-timing risk that limits aggressive sizing. At 5%, the position captures the leadership signal without overcommitting to a chart pattern that is already extended from mean-reversion perspectives. Movement into top-2 would require either macro conditions that explicitly support defense capex or a technical reset that offers a cleaner accumulation entry point.
Traditional Energy — XLE
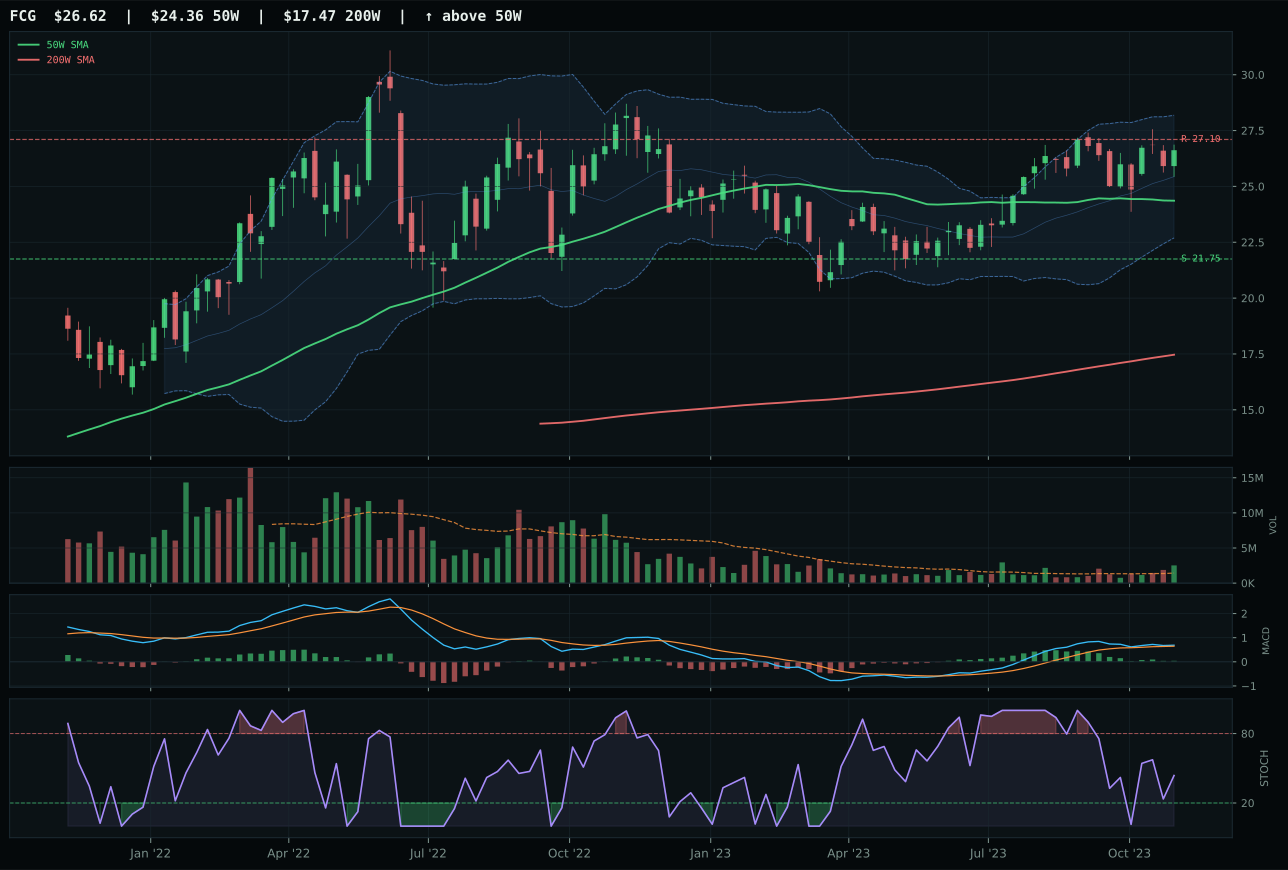
FCG has a neutral structure profile with 5.5% 13-week relative strength versus SPY.
A failed hold above support would weaken the setup.
Actionable but governed by invalidation levels.
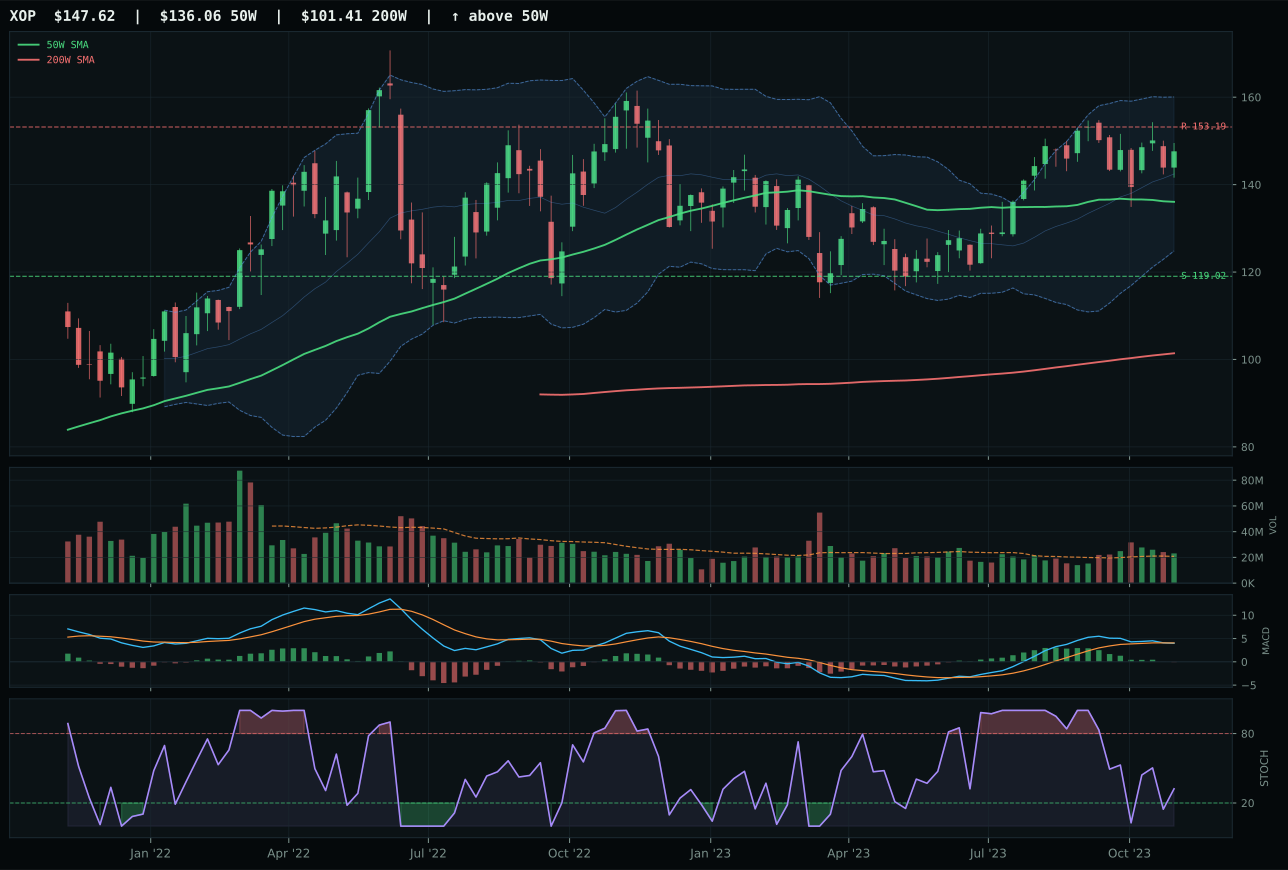
XOP has a neutral structure profile with 5.1% 13-week relative strength versus SPY.
A failed hold above support would weaken the setup.
Actionable but governed by invalidation levels.
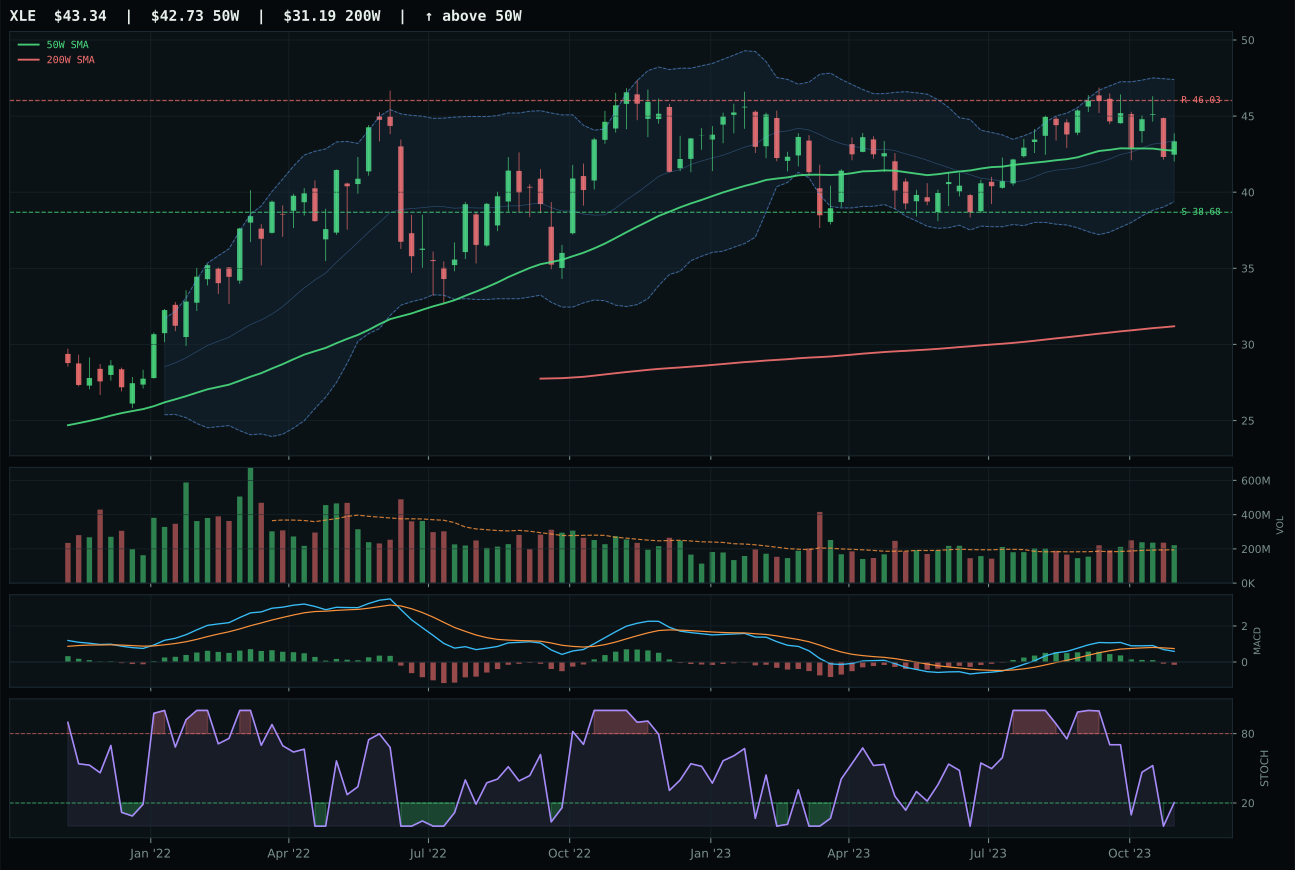
XLE has a compression near 50W profile with 2.4% 13-week relative strength versus SPY.
A failed hold above support would weaken the setup.
Actionable but governed by invalidation levels.
XLE wins despite being a runner-up by technical composite score because its timing score of 100.0 beats all peers—price sits only 1.4% from the 50-week moving average in the middle retracement decision zone, making it the least stretched entry point in the category. FCG, the higher technical scorer at 81 composite, trades at 9.3% from its 50-week, which means every buyer at current prices is giving up the mean-reversion edge that XLE still preserves. XLE's compression-near-50W setup offers expansion potential if the level holds as support, whereas FCG is already in upper retracement territory with bullish MACD and overbought stochastic. Volume participation favors XLE at above-average versus FCG's accumulation/confirmation—a subtle but important distinction when assessing whether the rally is broadening or narrowing. The category-relative strength of -2.6% for XLE versus 0.4% for FCG is not a weakness; it reflects that integrated energy is consolidating while natural gas, as a pure supply story, is experiencing isolated momentum.
Traditional Energy earns 5% allocation as a tier-2 category with a 28.9 final score hamstrung by macro regime mismatch. Disinflation pressure penalizes the category by 10 points—lower growth expectations mean lower energy demand expectations—outweighing energy scarcity's 16-point boost. The reasoned ETF proof order shows FCG at 82.4 technical evidence but XLE as the category representative at only 43.6, reflecting that while natural gas has superior near-term momentum, the integrated energy play offers better macro positioning and entry timing. At 5%, this is a tactical holding respecting the energy scarcity narrative without overweighting a category that is structurally challenged in a disinflation regime. The allocation acknowledges that crude oil and energy equity have support, but the growth-sensitive nature of demand in a slowing economy makes this a defensive hold rather than a capital commitment. Movement to tier-1 would require inflation expectations to shift or crude supply shocks to overwhelm demand concerns.
AI — SMH
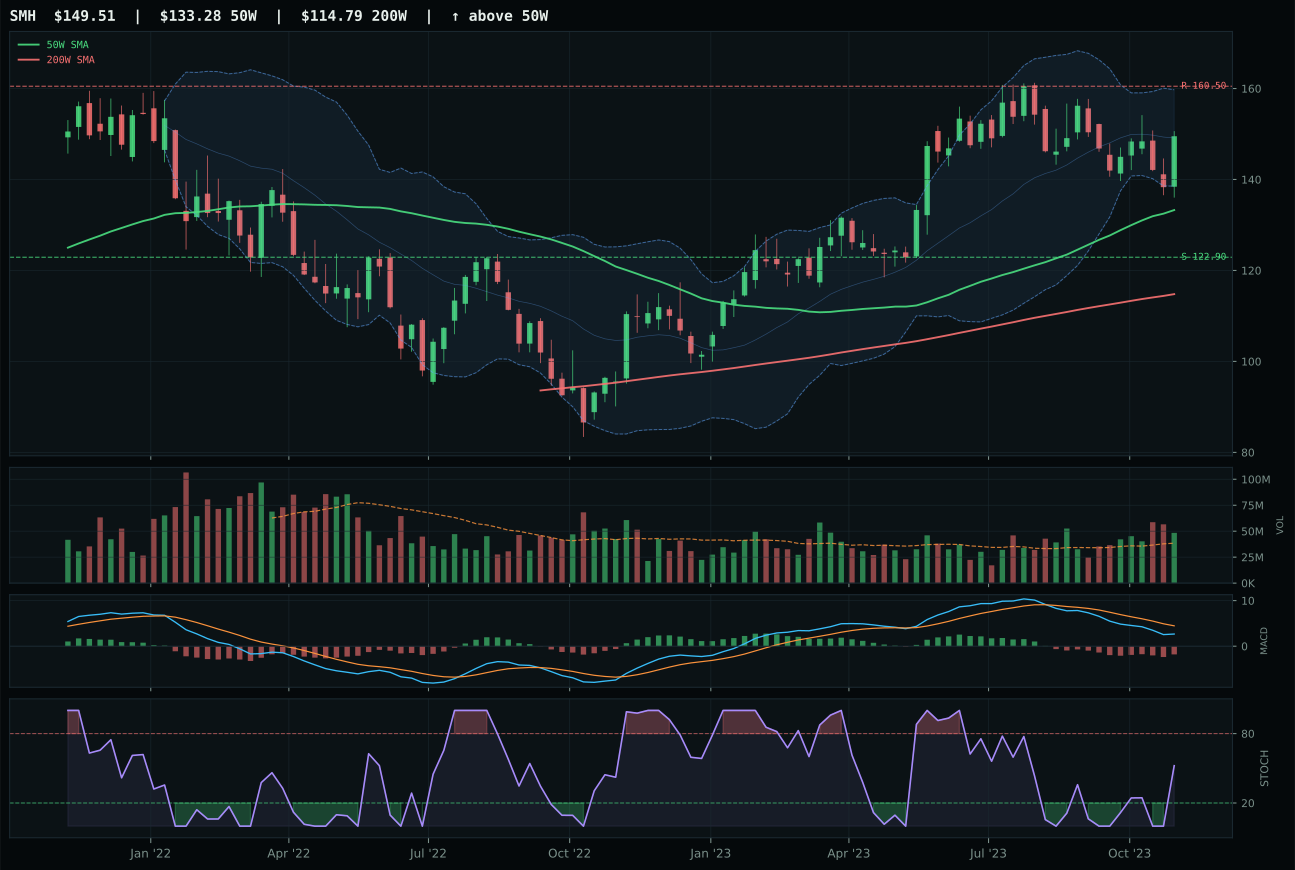
SMH has a neutral structure profile with -0.4% 13-week relative strength versus SPY.
A failed hold above support would weaken the setup.
Actionable but governed by invalidation levels.
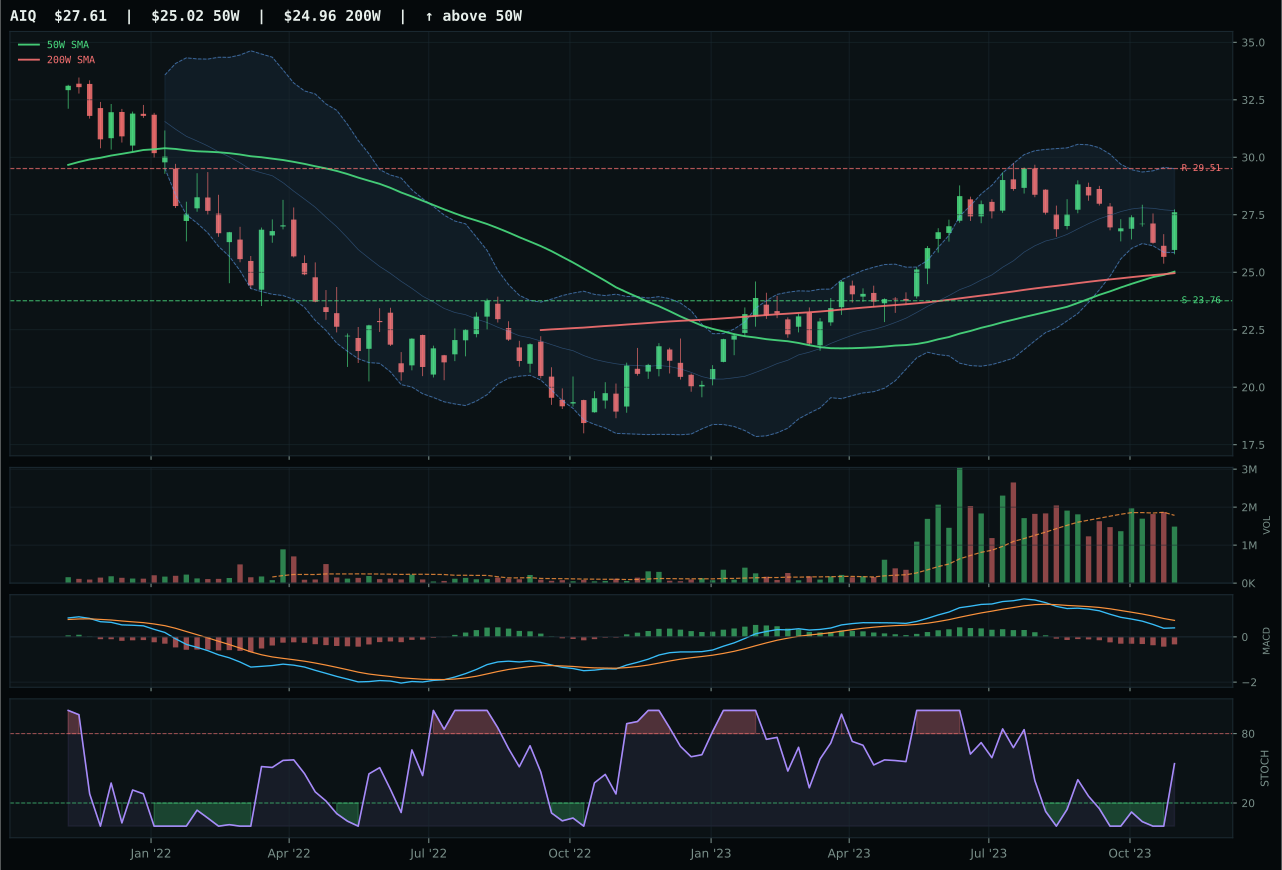
AIQ has a neutral structure profile with 0.0% 13-week relative strength versus SPY.
A failed hold above support would weaken the setup.
Actionable but governed by invalidation levels.
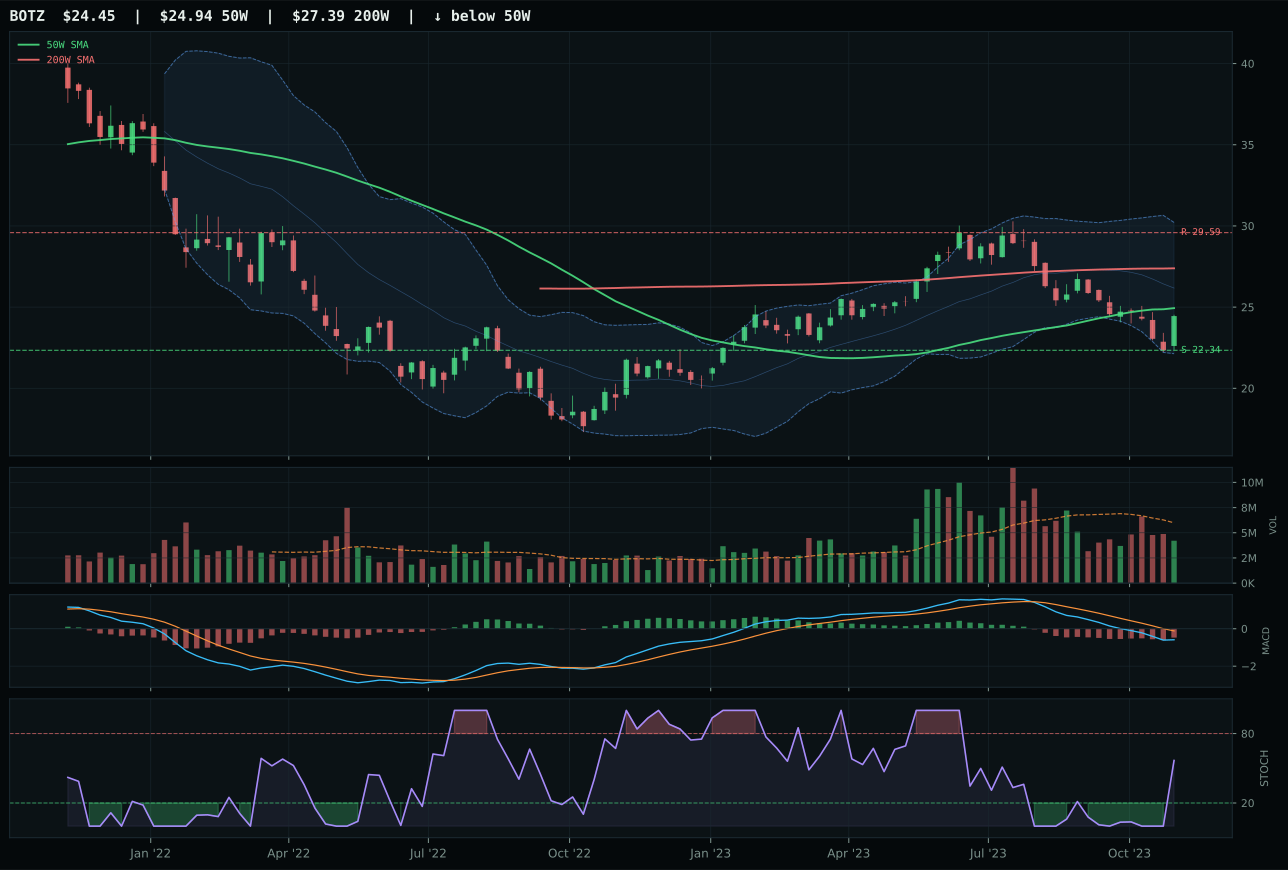
BOTZ has a compression near 50W profile with -8.5% 13-week relative strength versus SPY.
Extension and support failure are the main tactical risks.
Tracked, but not top-2 eligible because: structurally broken.
SMH wins over AIQ by 7.7 points because semiconductors hold better structure at 72.3 versus AIQ's 66.2 cleanliness, and more importantly, SMH delivers above-average volume participation while AIQ's volume sits at neutral. The timing edge favors SMH at 83.0 when AIQ scores only 78.0, driven by SMH's better stochastic RSI positioning in the rising mid-zone and a price point 12.2% from the 50-week that feels less stretched than typical AI software multiples. Despite both facing a -3% and -2.7% thirteen-week return respectively, SMH's momentum confirmation of 54.0 bests AIQ's 36, and the composite technical evidence of 69.5/100 versus 47.7 reflects the market's preference for the hardware constraint story over the application-layer story. Volume breadth matters when sentiment is mixed: SMH's 1.26x participation says there are willing buyers of compute risk, while AIQ's neutral volume suggests hesitation.
AI receives 5% allocation as a tier-2 category with a final score of 28.9, hamstrung by macro conditions that don't favor capital-intensive technology right now. Liquidity stress is the primary weight—active at -12 points—outweighing the modest disinflation boost of 5 points. The category-level macro fit of 39.0 is well below the threshold required for top-2 consideration, and SMH's 60.5 reasoned technical score, while the highest in the basket, still reflects a setup where the risk-reward asymmetry has shifted negative. At 5%, this is a floor position acknowledging that semiconductor strength is real but not strong enough to overcome the broader macro constraint. Dollar pressure and liquidity concerns will need to ease before AI moves into a higher allocation tier; for now, the category is held at tactical weight rather than strategic overweight.
Agriculture & Livestock — MOO
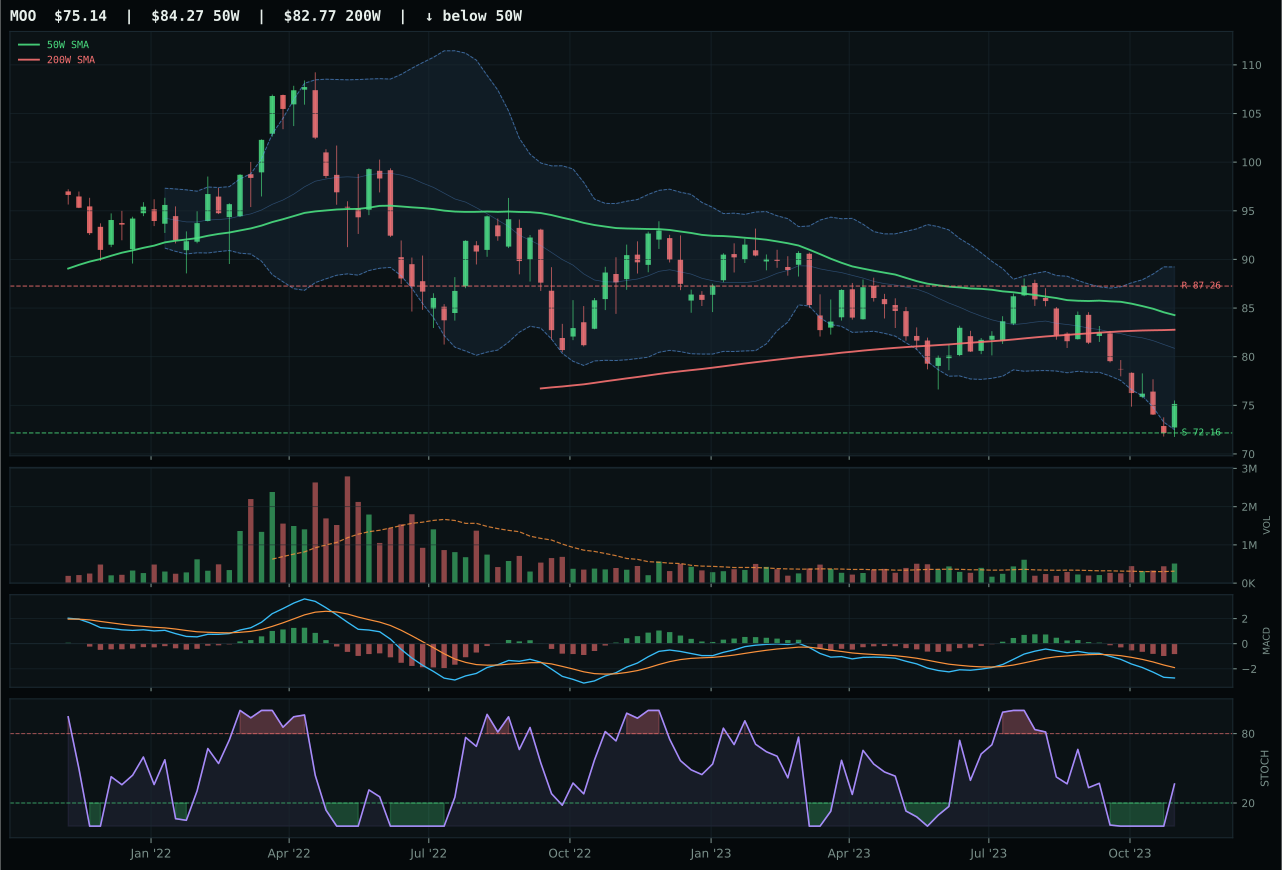
MOO has a pullback into support profile with -9.8% 13-week relative strength versus SPY.
A failed hold above support would weaken the setup.
Actionable but governed by invalidation levels.
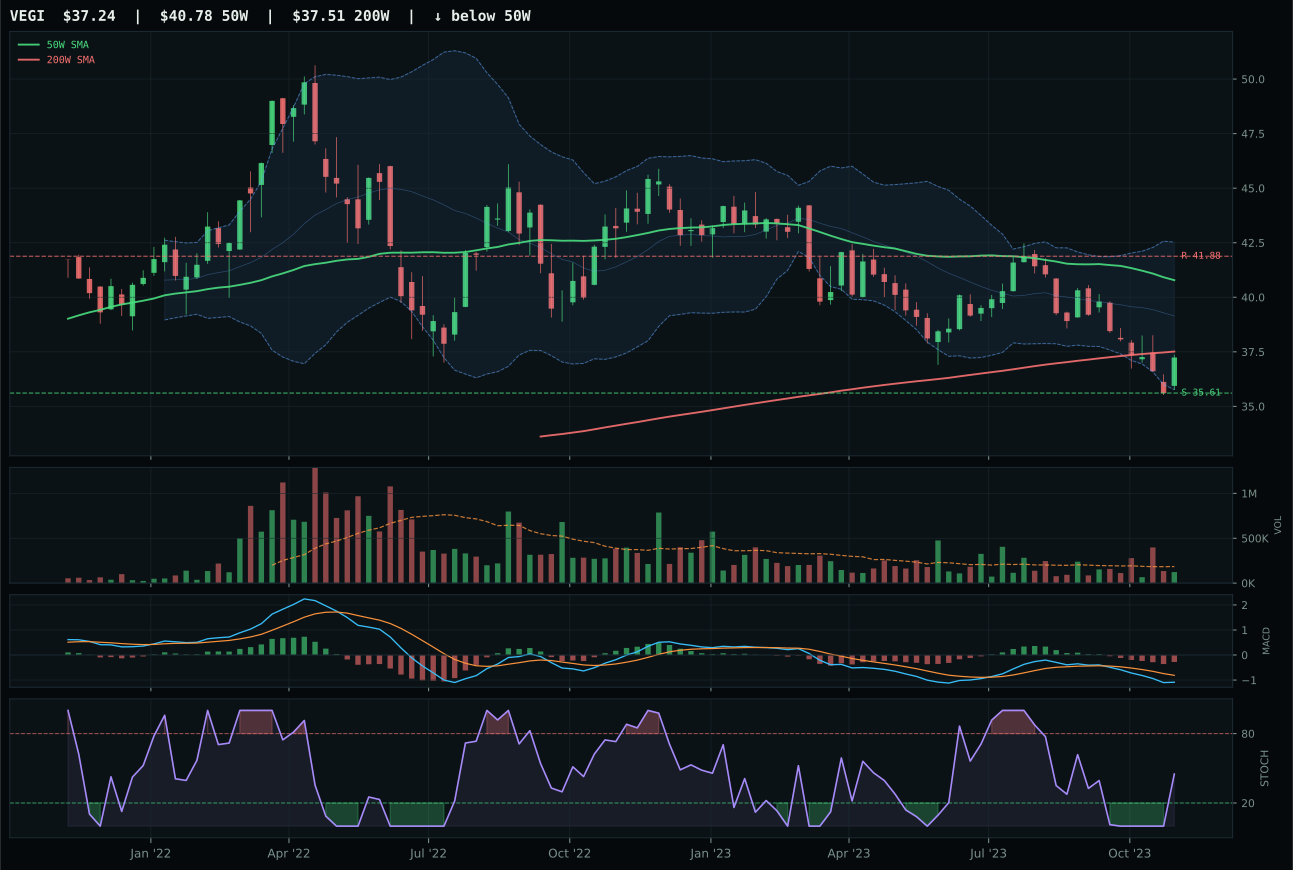
VEGI has a pullback into support profile with -7.4% 13-week relative strength versus SPY.
A failed hold above support would weaken the setup.
Tracked, but not top-2 eligible because: .
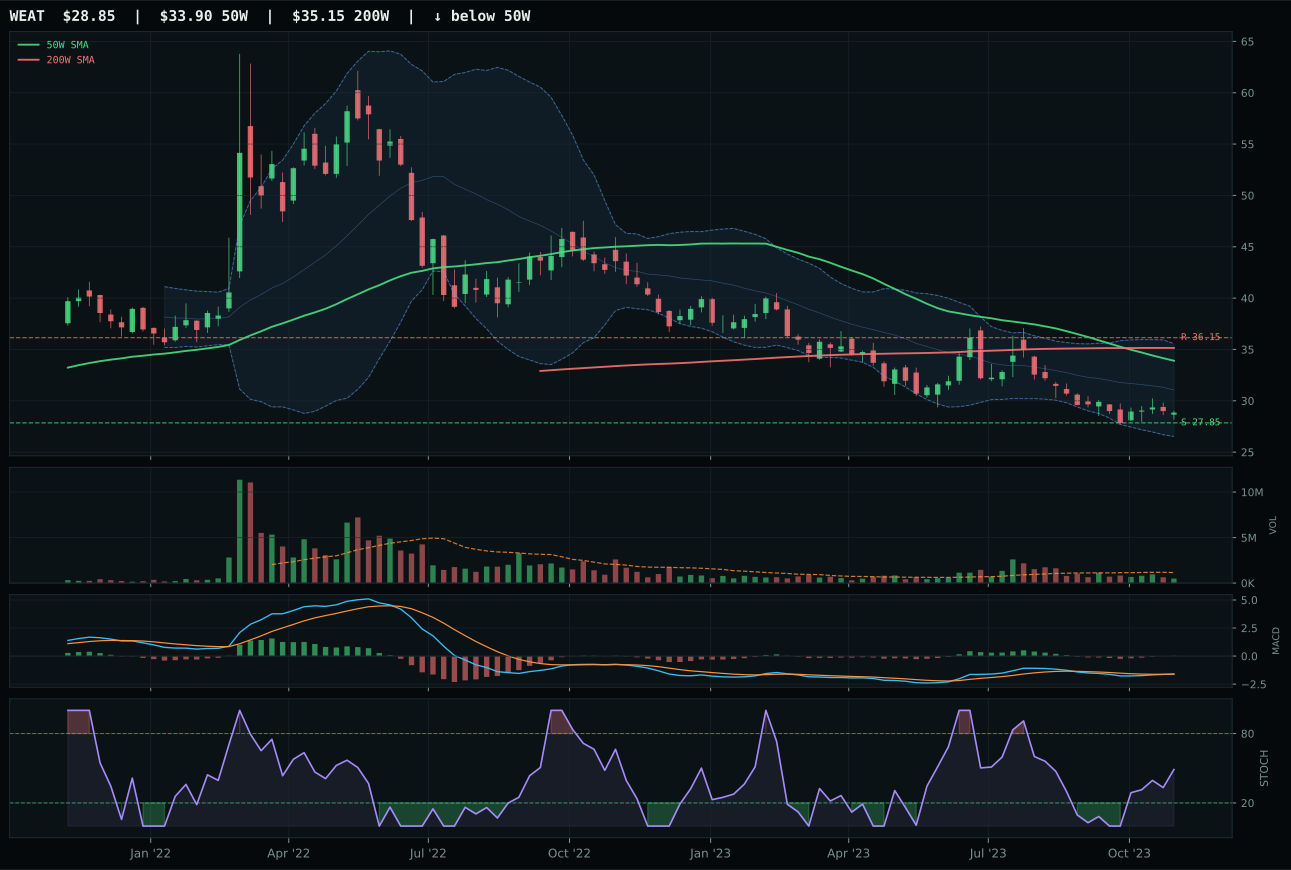
WEAT has a pullback into support profile with -8.7% 13-week relative strength versus SPY.
Extension and support failure are the main tactical risks.
Tracked, but not top-2 eligible because: structurally broken.
MOO wins by 8.3 points over VEGI because its risk-reward framework is superior at 95.0 versus 88.6, structure is cleaner at 70.8 versus 63.1, and volume tells the crucial story—MOO shows accumulation/confirmation at 1.64x the 20-week average while VEGI delivers only thin participation. Price is pulling into support near 72.16 with the stochastic RSI rising from mid-zone, which is exactly the setup pattern that creates defined invalidation zones for risk management. MOO's momentum confirmation of 11.7 is weak, and the 13-week return of -12.5% reflects genuine damage, but the beauty of the setup is that downside is capped at 4.1% to support while resistance sits 13.9% higher. VEGI's thinner volume and lower structure quality suggest that if this sector does stabilize, the market will gravitate toward the name showing active buying rather than the one drifting on fumes.
Agriculture receives 5% allocation this week because its 0.0 final score reflects a category that is fundamentally broken under the current macro regime. Disinflation pressure actively penalizes commodity-driven exposure by 8 points, and both liquidity stress and dollar pressure add downward weight. The 3/2/1 weighted basket started at 34.7, well below the threshold needed for allocation, and the category reasoner's testing against macro state and descriptor checklist confirmed zero justification for capital commitment. MOO's technical setup is not the problem—the structure and volume actually show early-stage accumulation—but macro regime fit is the killer. To earn 5% allocation, the category would need a major shift in inflation expectations, a meaningful dollar weakness event, or explicit central bank support for agricultural prices. Until that macro reset occurs, this category sits on the sidelines.
Emerging Markets — ILF
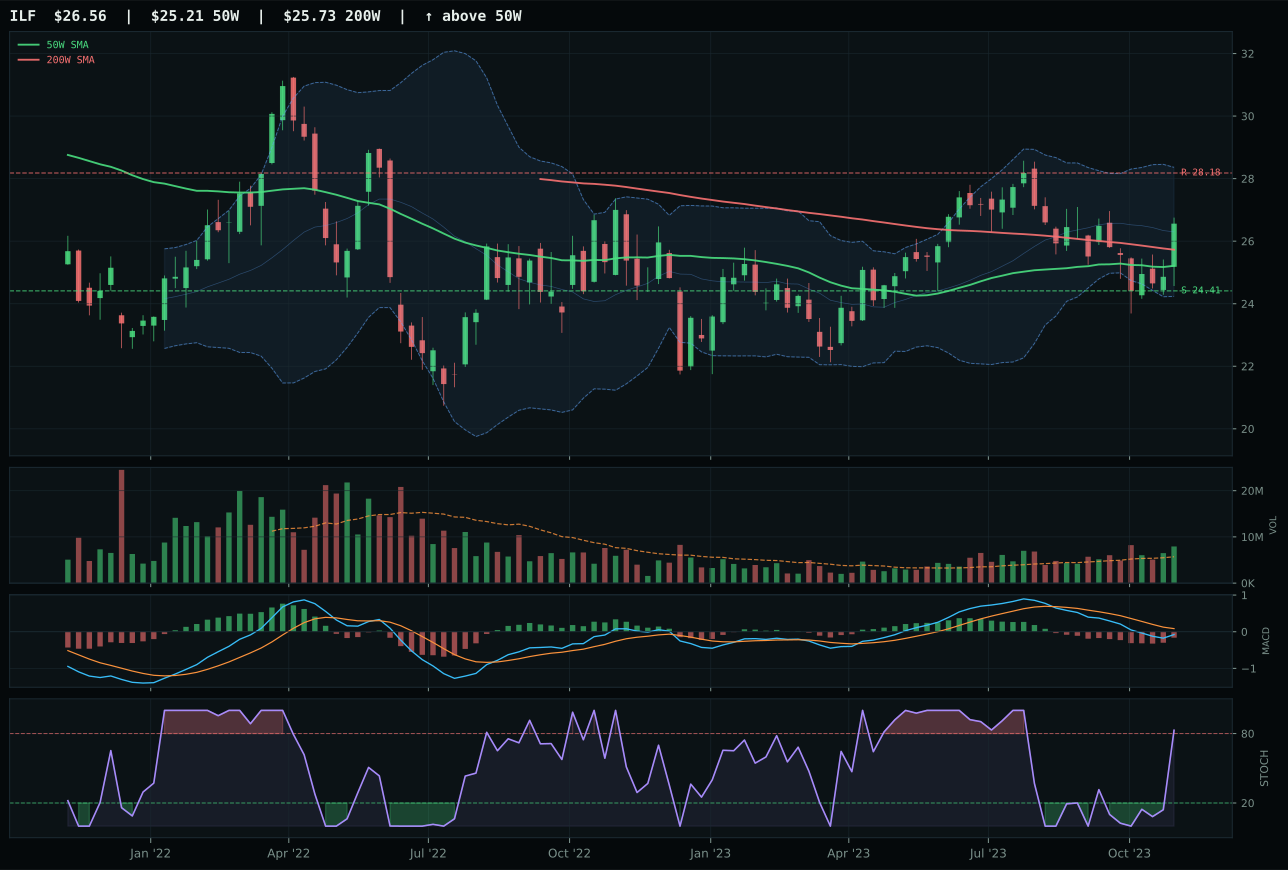
ILF has a neutral structure profile with 0.6% 13-week relative strength versus SPY.
A failed hold above support would weaken the setup.
Actionable but governed by invalidation levels.
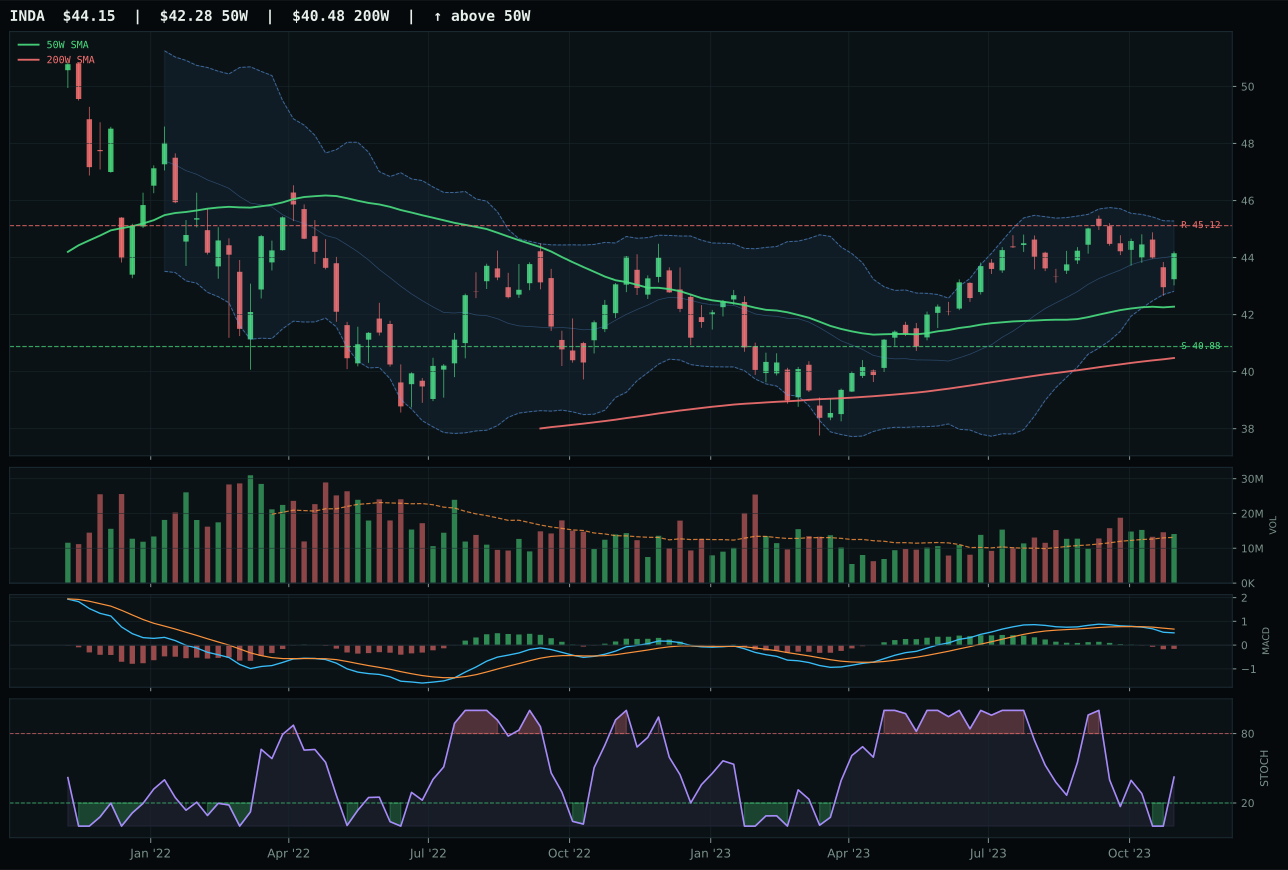
INDA has a neutral structure profile with 3.0% 13-week relative strength versus SPY.
A failed hold above support would weaken the setup.
Actionable but governed by invalidation levels.
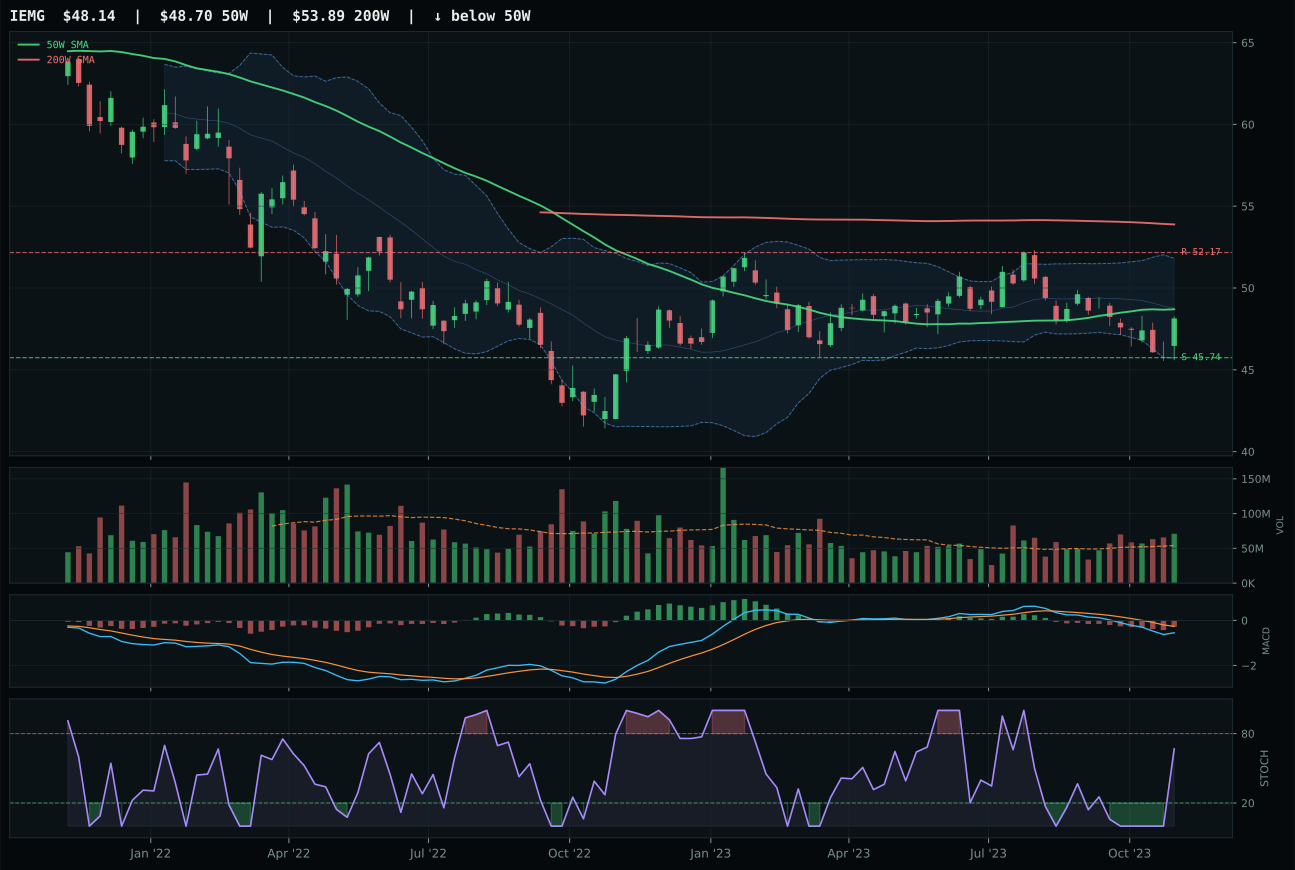
IEMG has a compression near 50W profile with -2.1% 13-week relative strength versus SPY.
Extension and support failure are the main tactical risks.
Tracked, but not top-2 eligible because: structurally broken.
ILF wins by 1.6 points over INDA because its risk-reward framework is materially better at 56.8 versus 49.8, and volume participation favors Latin America at above-average versus India's neutral standing. Both charts show price above moving averages with neutral structure and MACD bearish but improving, but ILF's overbought stochastic RSI at 0.83 versus INDA's rising mid-zone at 0.54 suggests ILF is closer to consolidation while INDA could continue grinding higher. The real separation lies in category-relative strength: ILF's 0.0% versus INDA's 2.4% might seem to favor India, but the market's preference for Latin America's commodity-driven beta over India's quality-growth narrative tells a story about where capital is actually rotating. ILF's cleaner technical structure and superior risk-reward make it the better representative even though the category as a whole is fundamentally challenged by macro headwinds.
Emerging Markets receives 0% allocation this week, ranked 9th or 10th with a 17.9 final score that places it outside the portfolio entirely. Dollar pressure is ferociously active at -14 points, and liquidity stress adds another -10, creating a 24-point headwind that no technical setup can overcome. The category-level macro fit of 26.0 is among the lowest in the portfolio, and the reasoned ETF proof order shows ILF at 58.0, INDA at 46.8, and IEMG at 34.3—a spread indicating no clear conviction in any emerging market narrative. In a strong-dollar, liquidity-stressed environment, foreign equity returns are punished twice: once on earnings growth expectations and again on currency translation. To earn allocation, Emerging Markets would require either a substantial dollar reversal, explicit central bank liquidity injection, or a geopolitical event that drives capital flight into dollar-denominated assets. None of these conditions currently obtain, so the category sits on the sidelines until macro regime parameters shift.
Industrial Metals — PICK
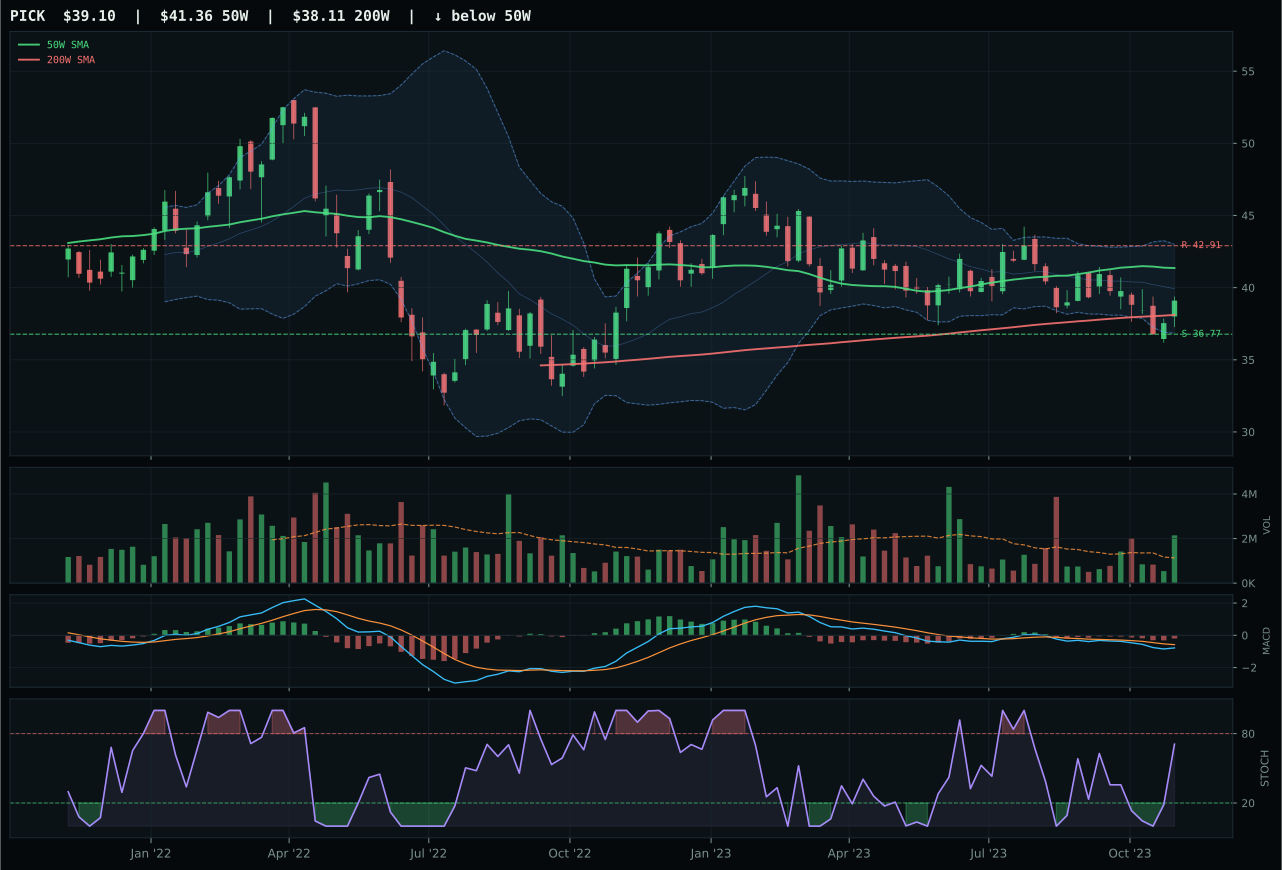
PICK has a neutral structure profile with -3.4% 13-week relative strength versus SPY.
A failed hold above support would weaken the setup.
Actionable but governed by invalidation levels.
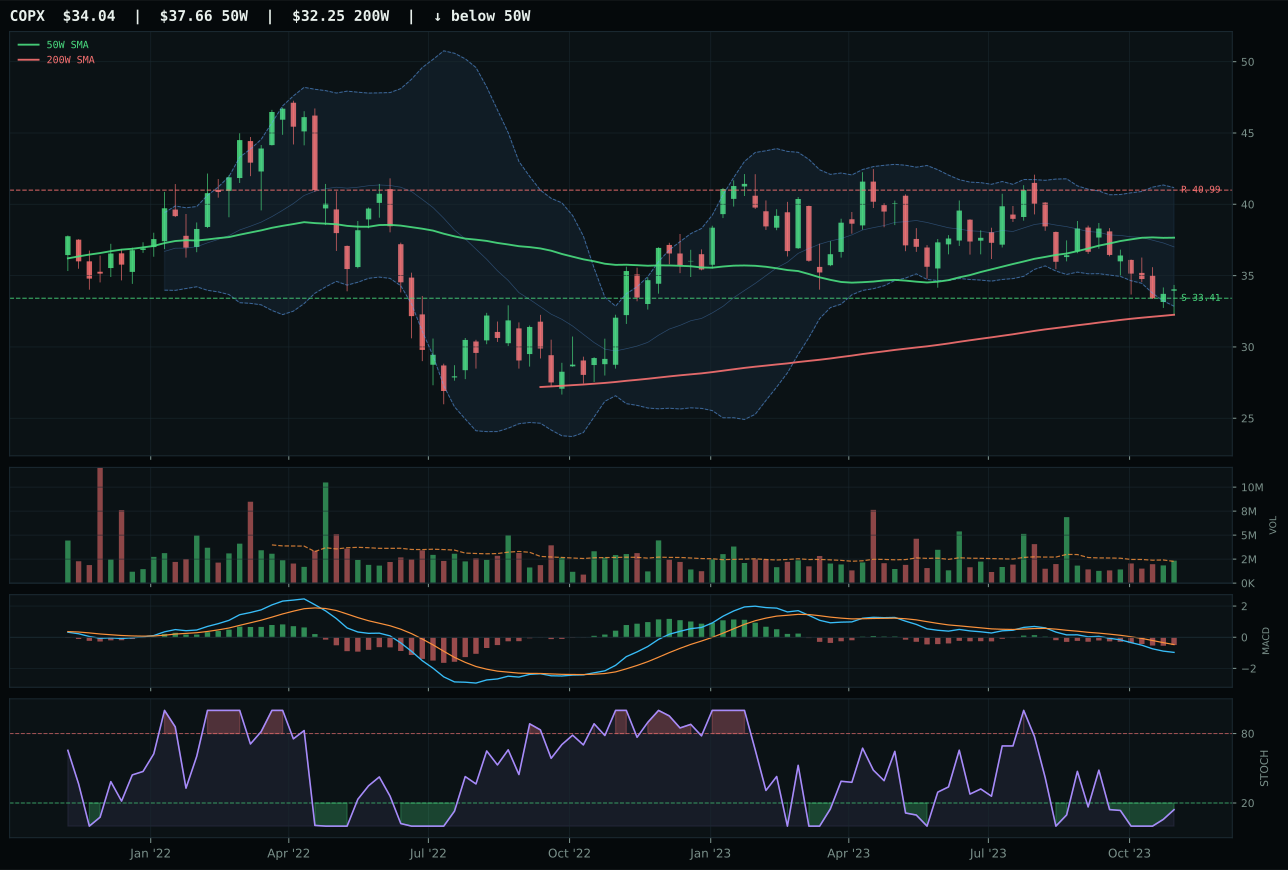
COPX has a pullback into support profile with -12.3% 13-week relative strength versus SPY.
A failed hold above support would weaken the setup.
Actionable but governed by invalidation levels.
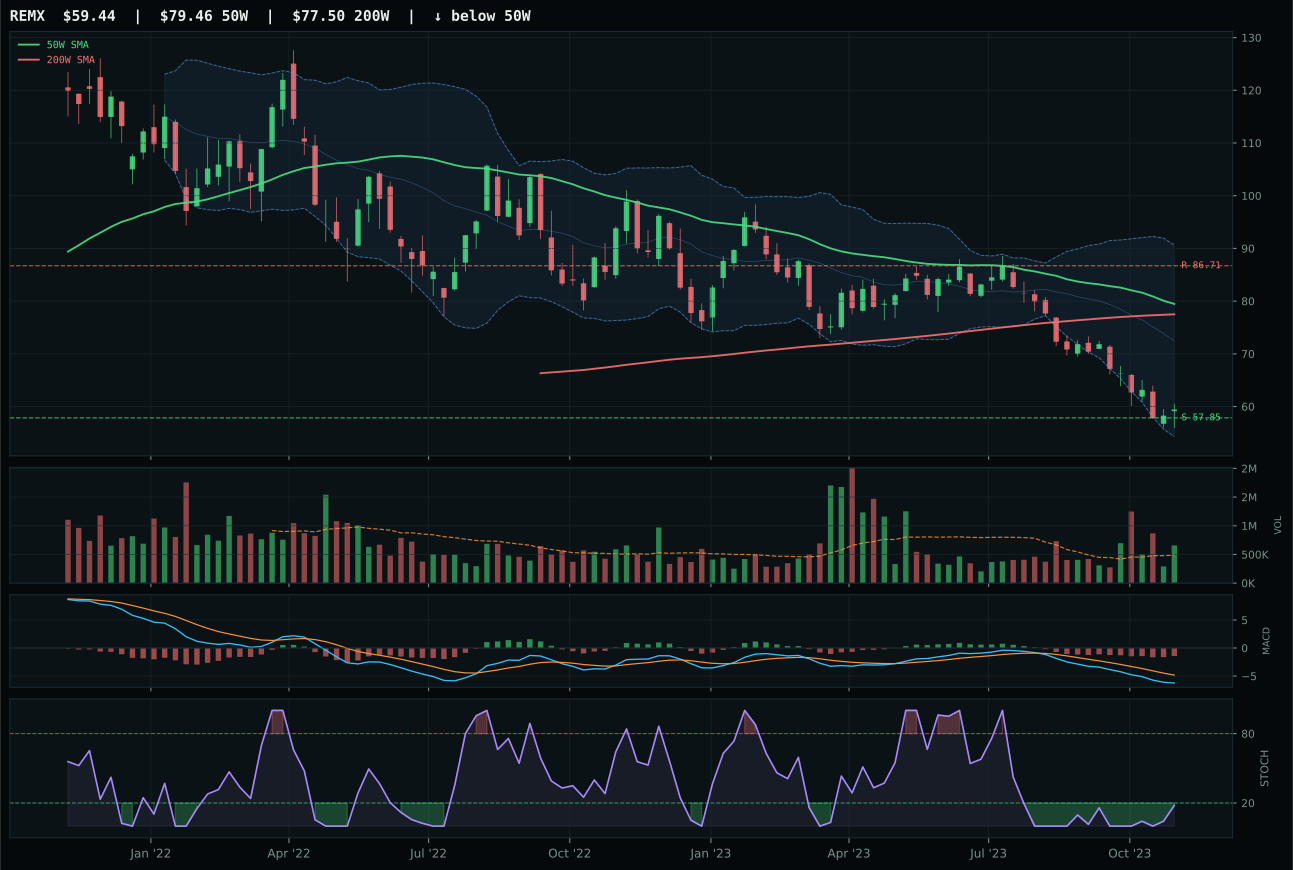
REMX has a pullback into support profile with -22.9% 13-week relative strength versus SPY.
A failed hold above support would weaken the setup.
Actionable but governed by invalidation levels.
PICK wins over COPX by 2.4 points because its structure is cleaner at 76.9 versus 66.8, timing is better at 85.0 versus 94 for COPX, and critically, volume tells the accumulation story—PICK shows 1.89x participation on 20-week average while COPX sits at neutral. The category-relative strength edge of 8.9% for PICK versus 0.0% for COPX is significant when both are pulling into support: it means capital is choosing the diversified mining story over the pure copper scarcity play. PICK's stochastic RSI is rising from mid-zone while COPX is turning up from oversold territory—the former suggests gradual institutional entry while the latter could be a reflexive bounce on thin volume. Risk-reward at 83.2/100 for PICK versus 90 for COPX seems to favor COPX, but when volume participation is missing, those risk-reward edges often fail to materialize because there is no buyer base to defend support levels.
Industrial Metals receives 0% allocation this week, ranked 9th or 10th and excluded from the portfolio because the 14.7 final category score reflects a structural macro mismatch. Dollar pressure and liquidity stress are both active and weight the category down heavily, while the commodity complex itself offers no disinflation tailwind. PICK's technical setup of 51.6/100 is respectable but insufficient to overcome a category-level macro fit of just 35.0. The reasoned ETF proof order shows PICK at 48.0, COPX at 30.0, and REMX at 18.6—a wide dispersion that suggests no clear industrial metals narrative is winning in the current regime. To earn allocation, Industrial Metals would need either a sharp dollar reversal that makes hard assets attractive for international capital, or an explicit energy scarcity or supply shock narrative that lifts commodity valuations regardless of disinflation headwinds. Neither condition obtains, so the category remains off the table.