
2023-10-27
Informational purposes only. The content in this report, including allocations, analysis, and commentary, is provided solely for informational and educational purposes. It does not constitute financial advice, investment advice, trading advice, or any other type of advice. Past performance does not guarantee future results. Always conduct your own research and consult a qualified financial professional before making investment decisions.
Weekly Allocation
| Ticker | Category | Weight | Role |
|---|---|---|---|
| FBTC | 50% | Overlay | |
| NLR | Nuclear Energy | 10% | Top-2 (10%) |
| GLD | Precious Metals | 10% | Top-2 (10%) |
| XLU | Utilities & Infrastructure | 5% | Tier-2 (5%) |
| XLK | Technology | 5% | Tier-2 (5%) |
| FCG | Traditional Energy | 5% | Tier-2 (5%) |
| ITA | Defense & Aerospace | 5% | Tier-2 (5%) |
| INDA | Emerging Markets | 5% | Tier-2 (5%) |
| MOO | Agriculture & Livestock | 5% | Tier-2 (5%) |
Trade Instructions — Monday Open
Sell the tranche from 2023-09-29 (completing its 4-week hold). Buy the new tranche. Instructions show net portfolio changes — same-asset positions cancel, weight changes show the delta.
| Action | Ticker | Instruction |
|---|---|---|
| SELL | XLE | Sell 50% of XLE position (reduce 5.00% → 2.50%) |
| SELL | URNM | Sell 25% of URNM position (reduce 10.00% → 7.50%) |
| SELL | XAR | Sell 25% of XAR position (reduce 5.00% → 3.75%) |
| SELL | PICK | Sell 50% of PICK position (reduce 2.50% → 1.25%) |
| SELL | SLV | Sell entire SLV position (1.25% of portfolio) |
| SELL | IGF | Sell entire IGF position (1.25% of portfolio) |
| SELL | CIBR | Sell 50% of CIBR position (reduce 2.50% → 1.25%) |
| BUY | FCG | Buy FCG — 11.11% of freed cash (adds 1.25% to portfolio) |
| BUY | INDA | Buy INDA — 11.11% of freed cash (adds 1.25% to portfolio) |
| BUY | GLD | Buy GLD — 22.22% of freed cash (adds 2.50% to portfolio) |
| BUY | XLK | Buy XLK — 11.11% of freed cash (adds 1.25% to portfolio) |
| BUY | XLU | Buy XLU — 11.11% of freed cash (adds 1.25% to portfolio) |
| BUY | NLR | Buy NLR — 22.22% of freed cash (adds 2.50% to portfolio) |
| BUY | ITA | Buy ITA — 11.11% of freed cash (adds 1.25% to portfolio) |
Current Portfolio After Trade
Combined holdings across all 4 active tranches. Each tranche is 25% of the portfolio.
| Ticker | % of Portfolio | Weight Bar |
|---|---|---|
| FBTC | 50.00% | |
| URNM | 7.50% | |
| FCG | 6.25% | |
| INDA | 5.00% | |
| GLD | 5.00% | |
| XAR | 3.75% | |
| XLK | 3.75% | |
| XLE | 2.50% | |
| MOO | 2.50% | |
| PAVE | 2.50% | |
| XLU | 2.50% | |
| NLR | 2.50% | |
| PICK | 1.25% | |
| CIBR | 1.25% | |
| SMH | 1.25% | |
| COPX | 1.25% | |
| ITA | 1.25% |
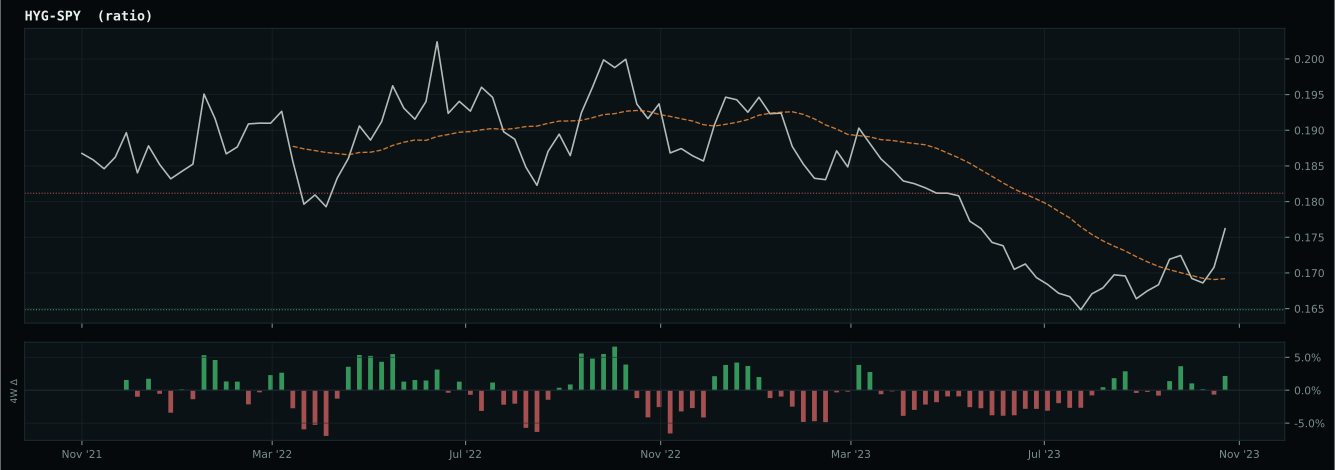
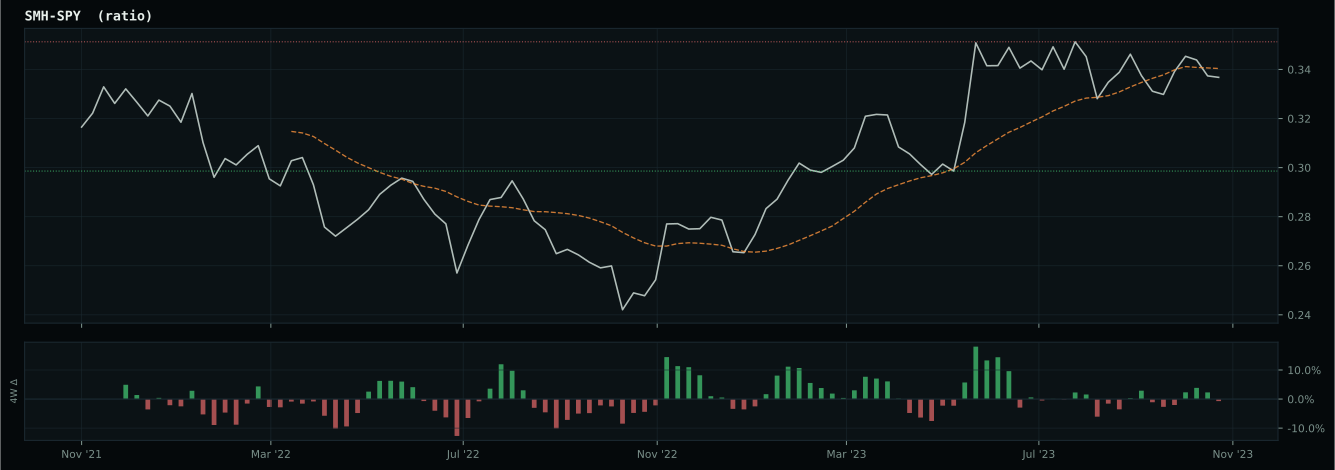
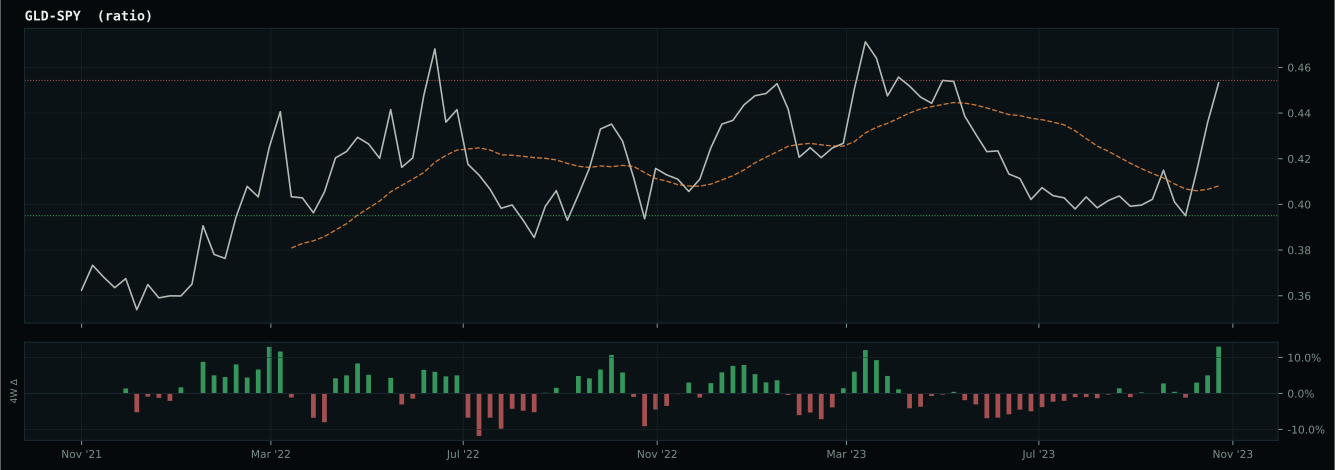
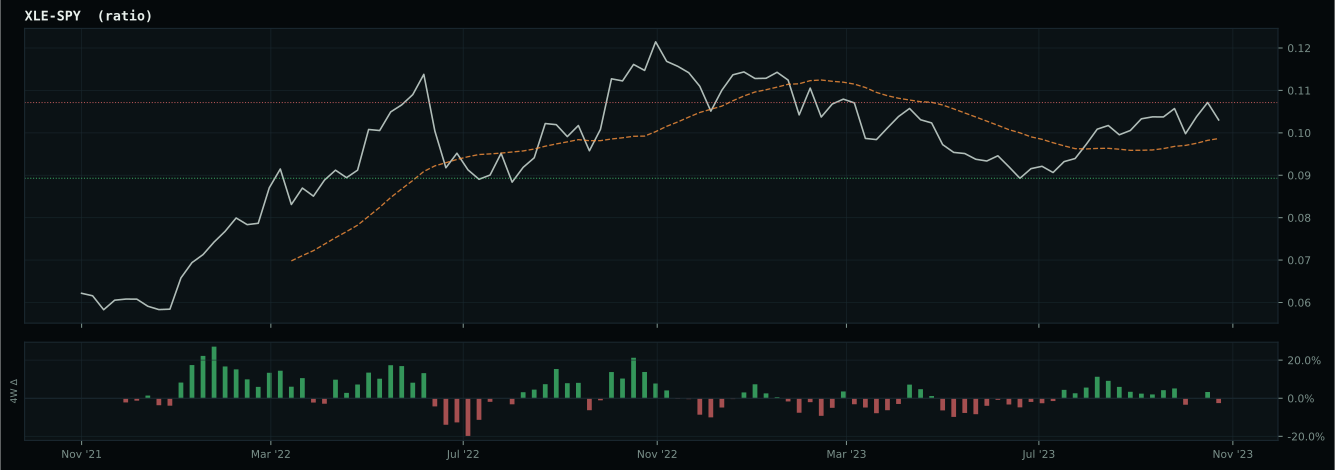
Macro Regime — Disinflation
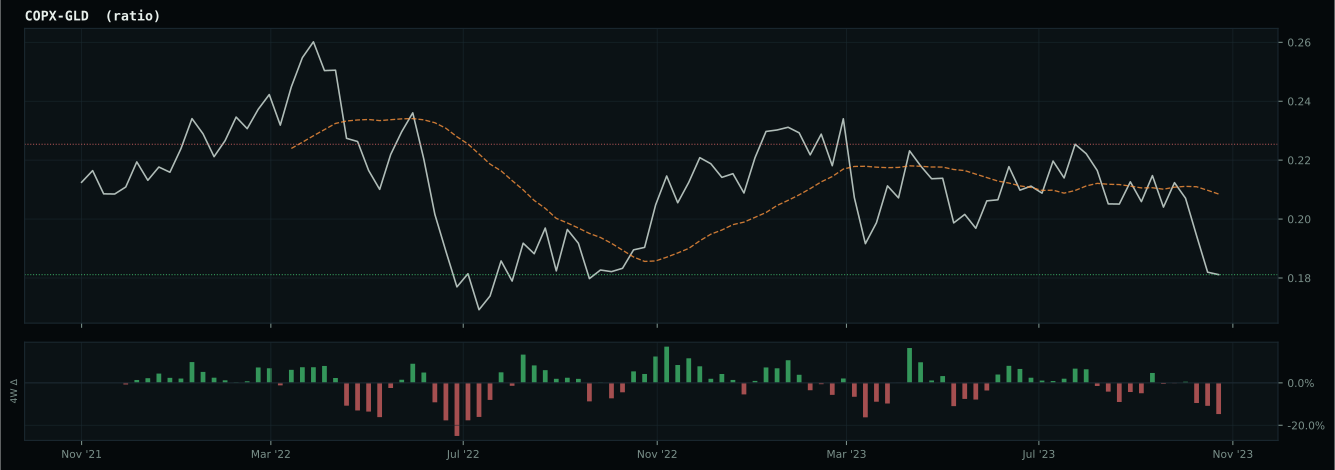
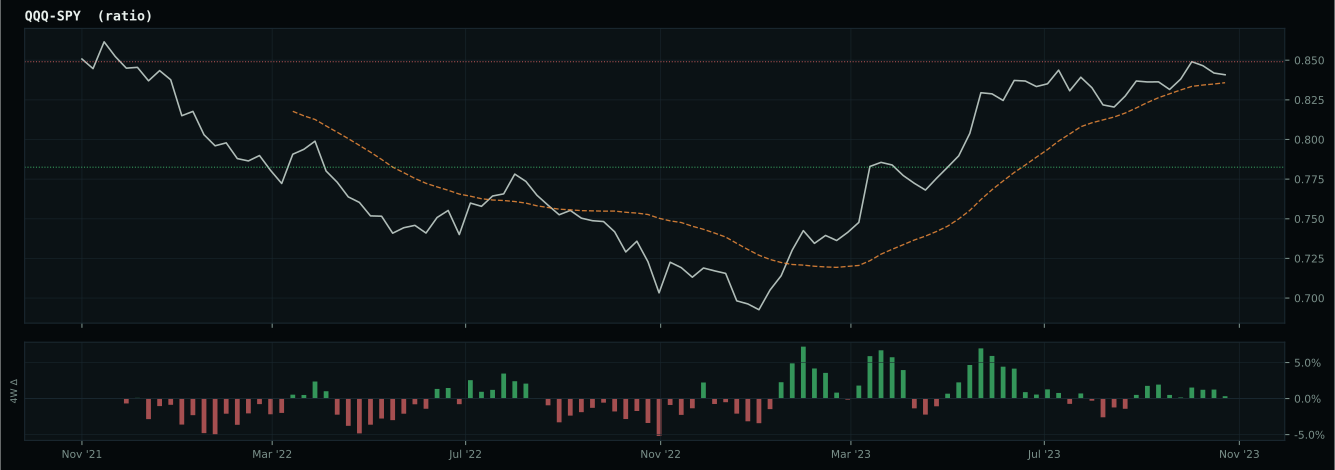
Macro Evidence Charts
Market-implied signals behind the macro regime scores. Each ratio compares two assets; the direction and slope of the ratio is what the macro engine reads.
Crypto Regime — TrendBTC
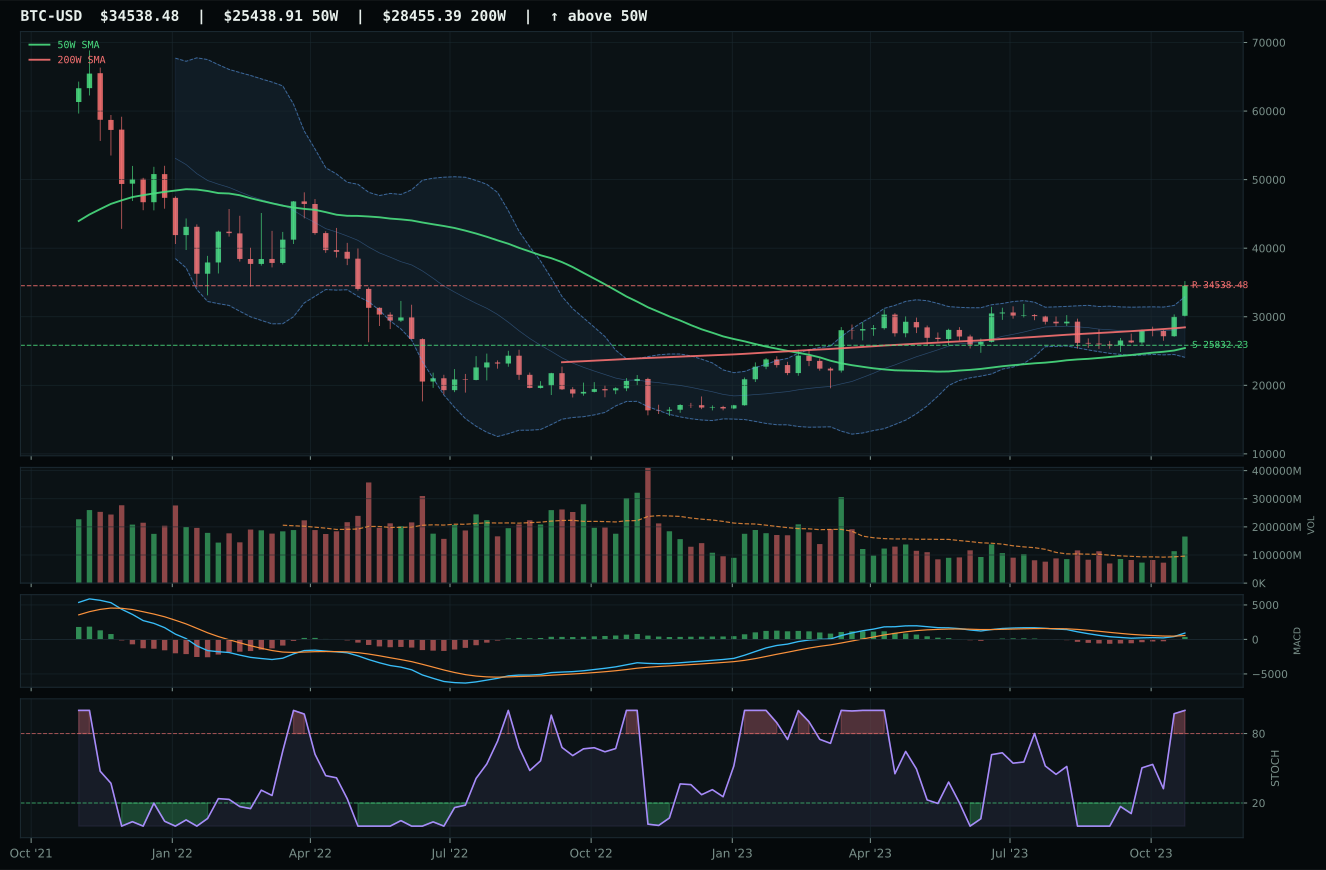
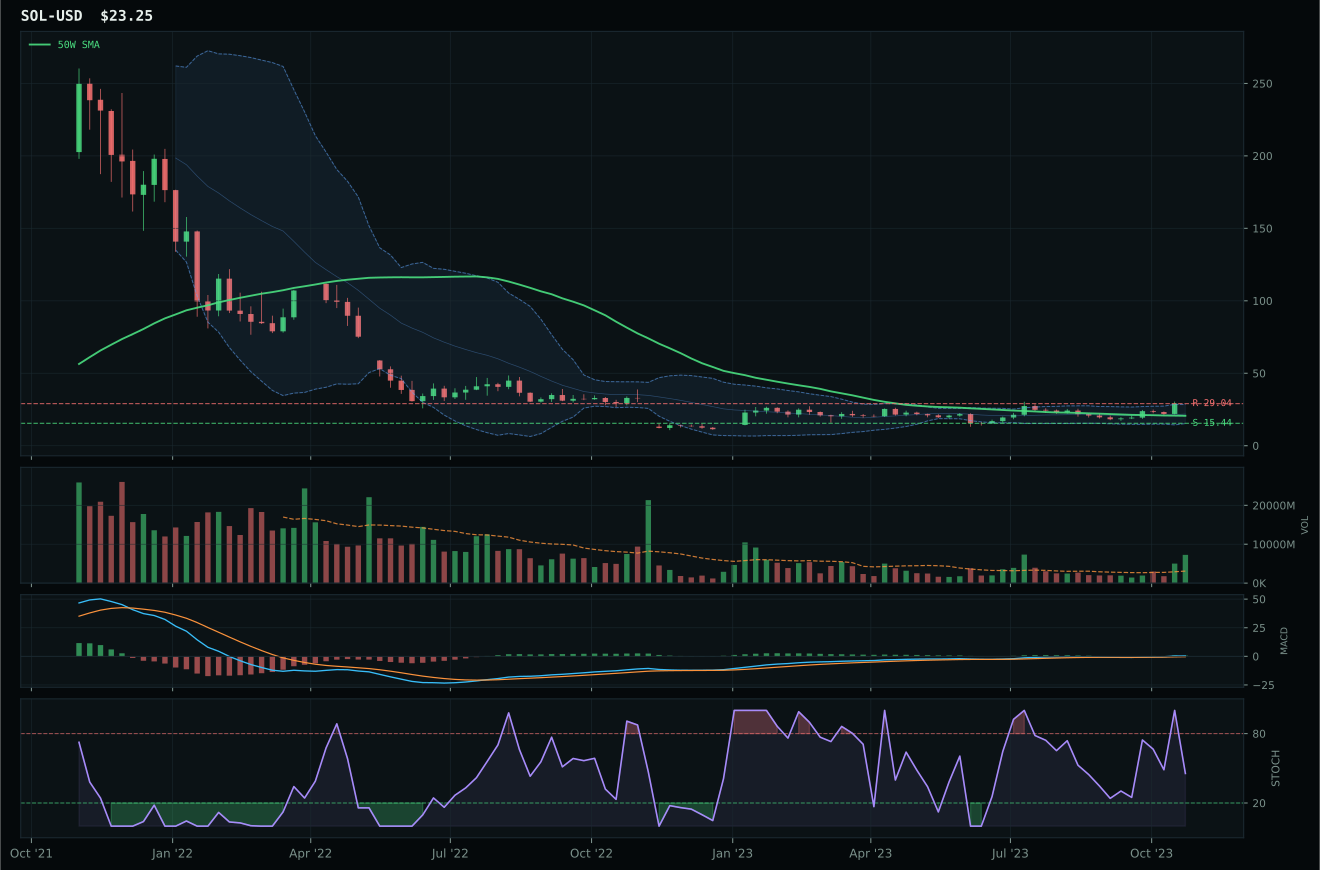
post-touch structure is too wide to count as a range; max/min close ratio is 1.88
TrendBTC confirmed: 2 consecutive closes above rising/flat 50W SMA
one or more available conditions failed
Category Rankings
| Rank | Category | Winner | Score | Alloc | 4W Ret | Peers (4W) |
|---|---|---|---|---|---|---|
| 1 | Nuclear Energy | NLR | 61.7 | 20% | +11.00% | URNM +13.4% · URA +13.4% |
| 2 | Precious Metals | GLD | 58.4 | 20% | +0.55% | SLV +5.0% · GDX +1.6% |
| 3 | Utilities & Infrastructure | XLU | 48.7 | 10% | +6.38% | IGF +9.2% · PAVE +9.5% |
| 4 | Technology | XLK | 45.7 | 10% | +13.69% | CIBR +10.5% · IGV +14.7% |
| 5 | Traditional Energy | FCG | 42.8 | 10% | -4.21% | XOP -3.8% · XLE -0.5% |
| 6 | Defense & Aerospace | ITA | 39.4 | 10% | +9.58% | ROKT +9.0% · XAR +12.5% |
| 7 | AI | AIQ | 16.4 | 10% | +13.75% | SMH +16.5% · BOTZ +15.8% |
| 8 | Industrial Metals | COPX | 11.1 | 10% | +0.53% | PICK +5.8% · REMX -3.6% |
| 9 | Agriculture & Livestock | MOO | — | 0% | +1.80% | VEGI +2.7% · WEAT -3.1% |
| 10 | Emerging Markets | INDA | — | 0% | +4.44% | ILF +10.1% · IEMG +6.3% |
Nuclear Energy — NLR
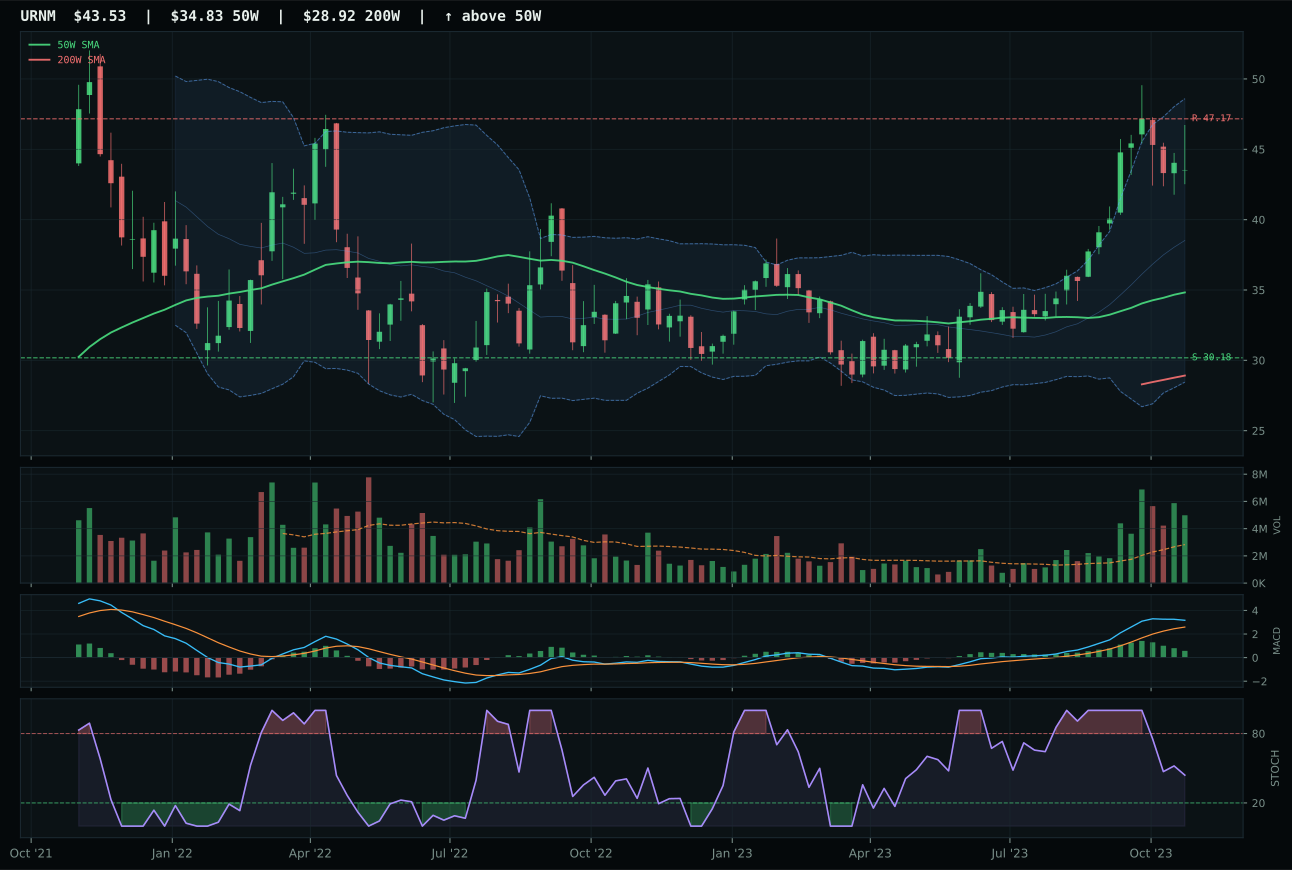
URNM has a vertical extension profile with 40.1% 13-week relative strength versus SPY.
A failed hold above support would weaken the setup.
Actionable but governed by invalidation levels.
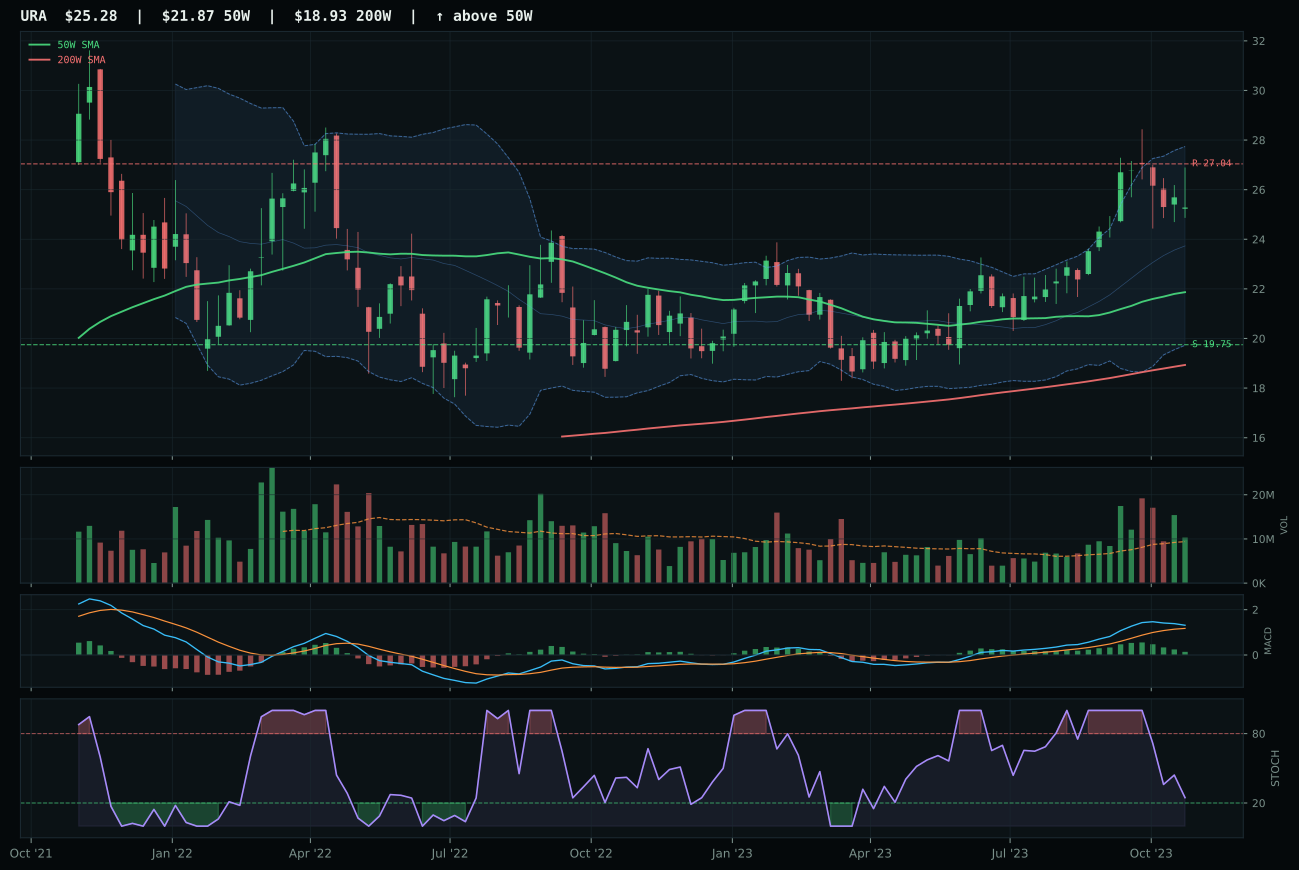
URA has a vertical extension profile with 25.1% 13-week relative strength versus SPY.
A failed hold above support would weaken the setup.
Actionable but governed by invalidation levels.
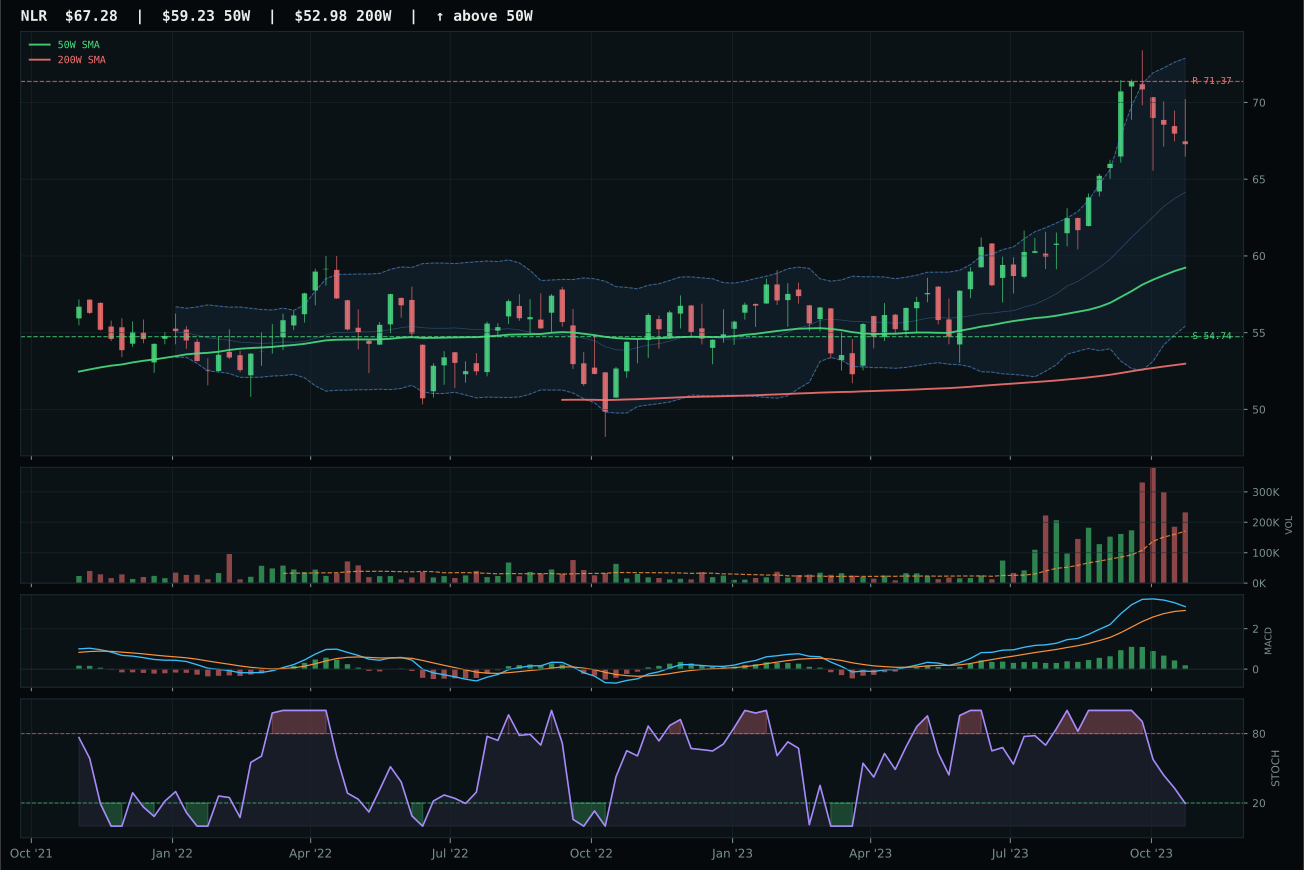
NLR has a neutral structure profile with 22.3% 13-week relative strength versus SPY.
A failed hold above support would weaken the setup.
Actionable but governed by invalidation levels.
NLR crushed Nuclear Energy with an 18.8-point gap over URNM, a dominant margin that reflected structural discipline versus momentum excess. NLR's trend scored a perfect 100.0 with price 13.6% above the 50W (material but not vertical), RS versus SPY at 22.3% (strong but not euphoric), and 50W slope 0.4% (steady, not deteriorating). MACD bullish but flattening and stochastic RSI oversold at 0.20 created the perfect technical environment: the move is real, but it's not stretched to a breaking point where every new buyer is late. Momentum confirmation hit 96.7 from 12.2% 13W return and above-average volume participation at 1.36x the 20W average. URNM's 40.1% RS versus SPY, 29.9% 13W return, and vertical extension setup were seductive on raw momentum, but they represented the exact opposite of what disciplined allocators want: new money chasing already-extended names in a liquidity-stress environment. NLR's structure at neutral (not vertical) meant every pullback was a clean entry point; URNM's vertical extension meant there was nowhere to add without buying right at the peak.
Nuclear Energy earned 10% allocation as top-2 category, justified by 61.7 final category score and 52.0/100 macro fit anchored by energy scarcity (+9 points). NLR's 77.0 technical evidence combined with 65.0 macro fit created a 142-basis-point technical-plus-macro advantage over URNM's 51.6 technical and 50.0 macro fit. The category thesis is dual: (1) energy infrastructure constraints are real, and nuclear is the only dispatchable zero-carbon power source capable of meeting baseline demand; (2) the technical setup in NLR is sustainable, not exhausted. NLR is 13.6% above its 50W, near Fib 0.236 at 68.26, with risk-reward of 49.5 showing -5.7% to resistance and 22.9% to support—an asymmetric setup favoring holders who got in earlier. Allocate 10% and hold through the MACD flattening phase; when stochastic RSI falls back to oversold (it will), that's your add point, not an exit. URNM is a promotion trade; NLR is a position trade. The macro will keep this category bid for 12-24 months, so ride it.
Precious Metals — GLD
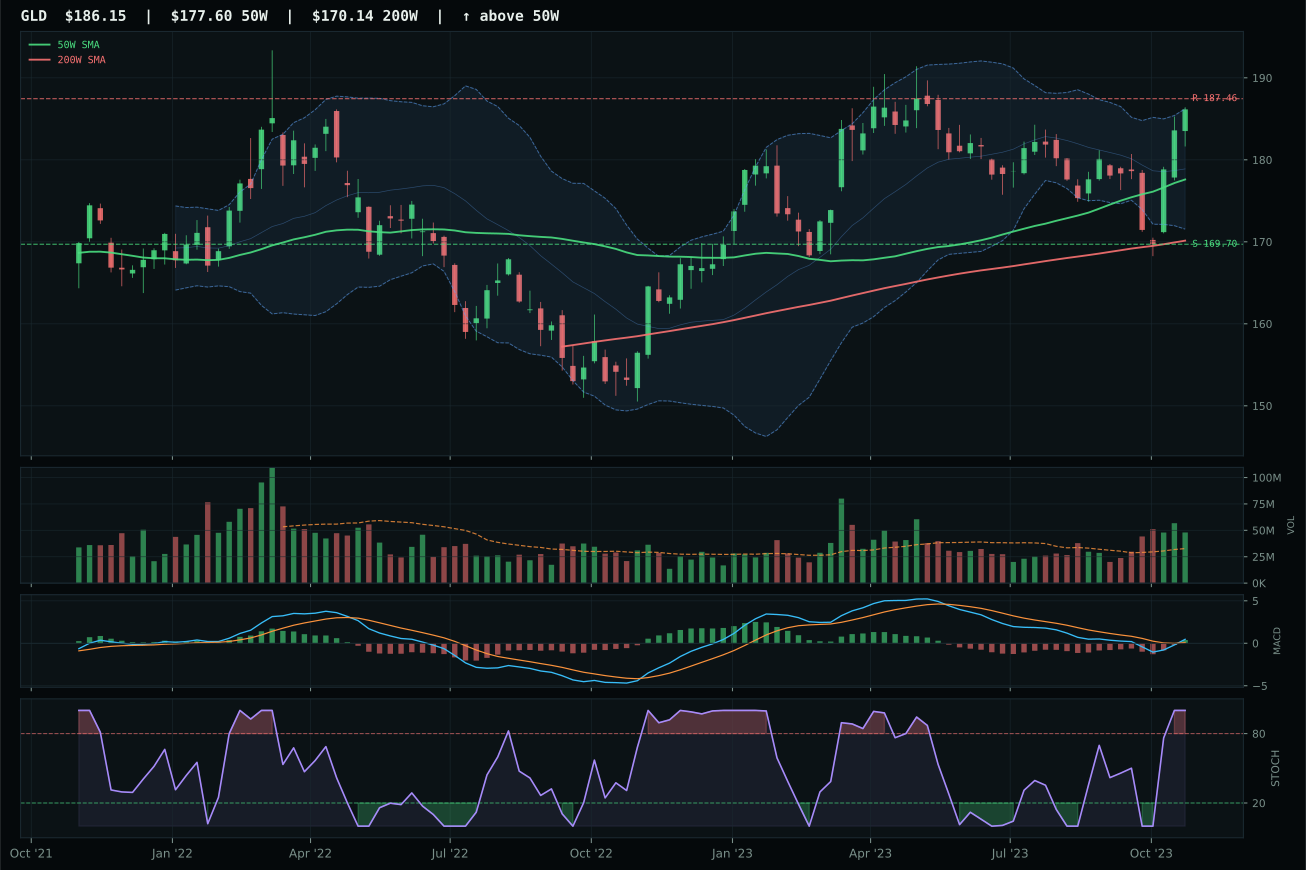
GLD has a neutral structure profile with 12.5% 13-week relative strength versus SPY.
A failed hold above support would weaken the setup.
Actionable but governed by invalidation levels.
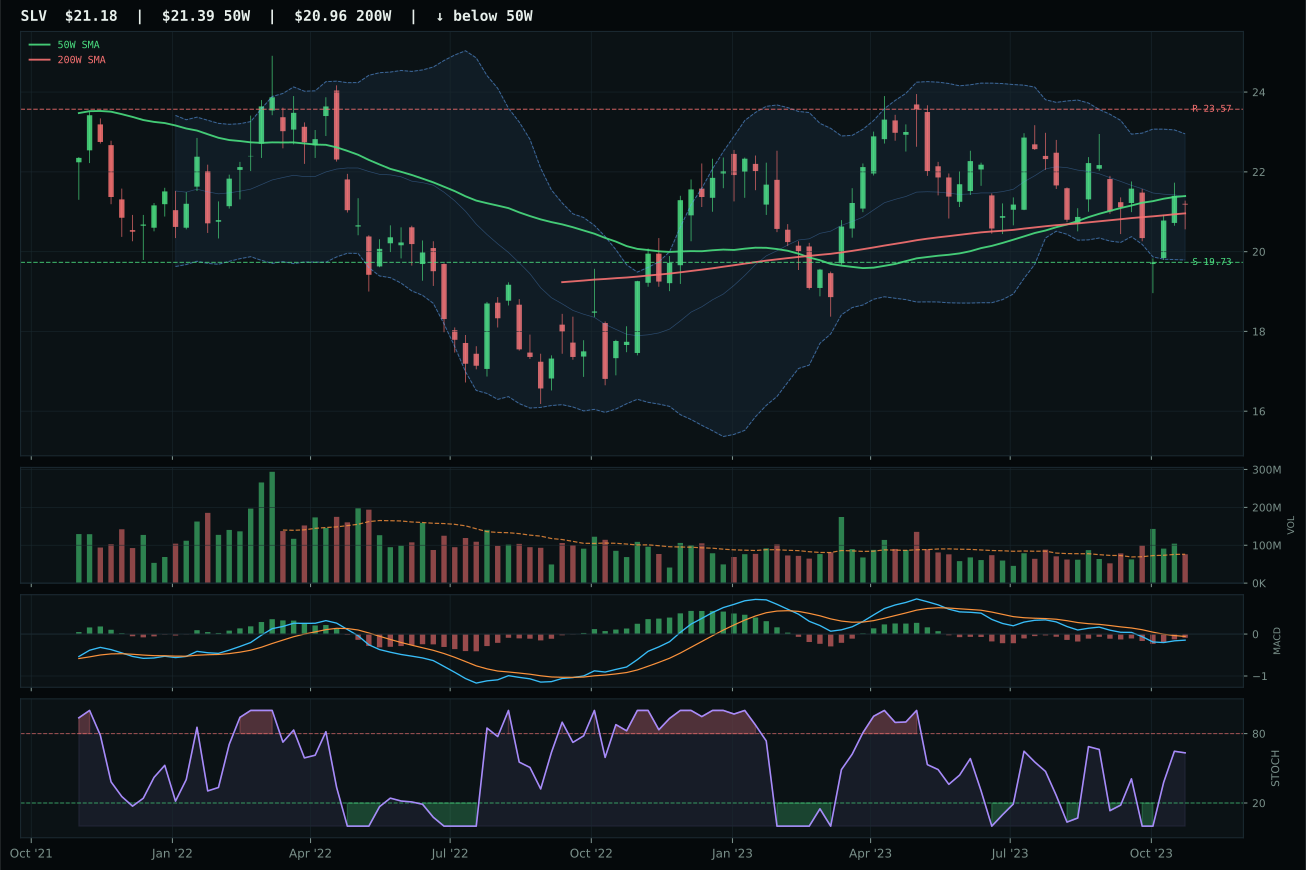
SLV has a compression near 50W profile with 5.0% 13-week relative strength versus SPY.
A failed hold above support would weaken the setup.
Actionable but governed by invalidation levels.
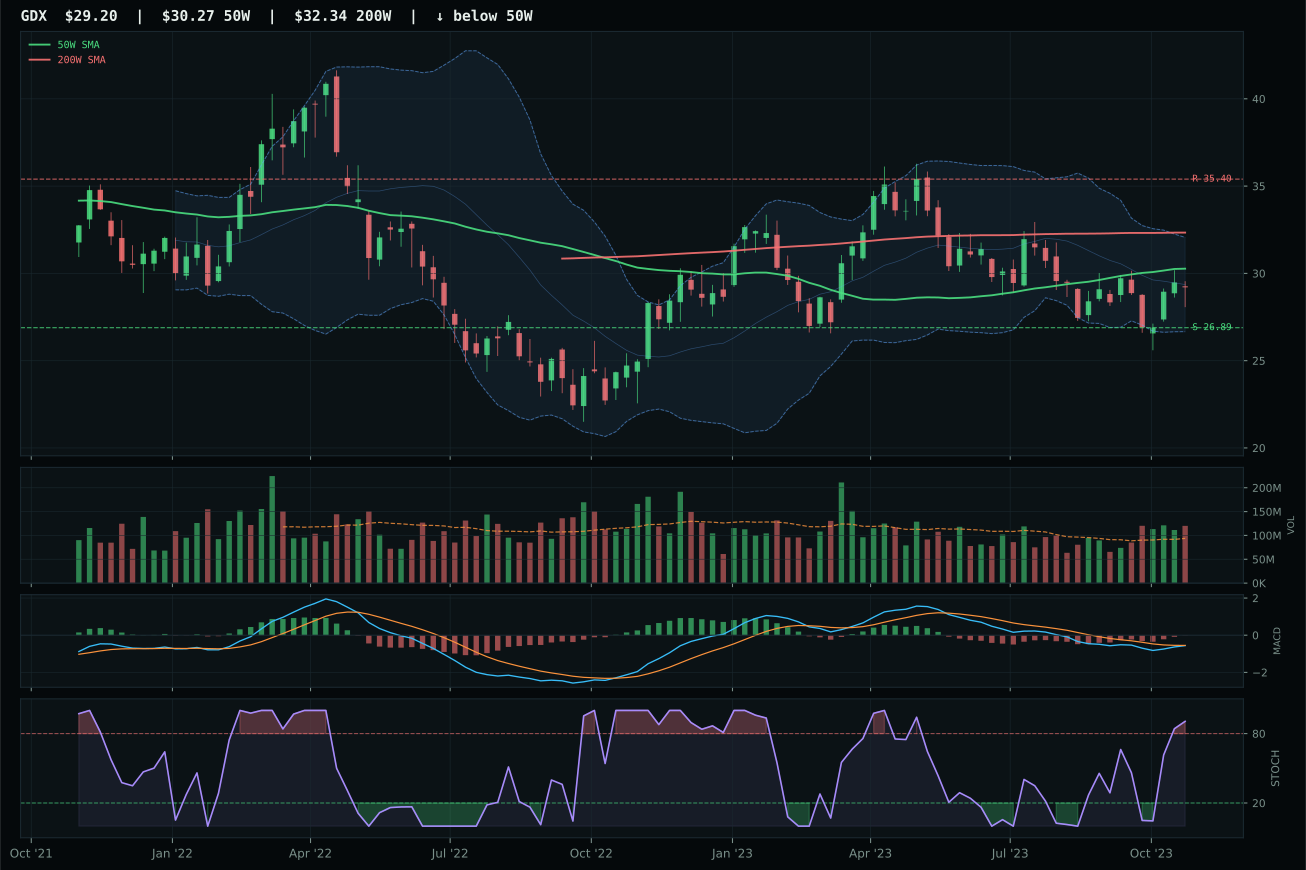
GDX has a neutral structure profile with 5.2% 13-week relative strength versus SPY.
Extension and support failure are the main tactical risks.
Tracked, but not top-2 eligible because: structurally broken.
GLD won Precious Metals and earned its top-2 allocation slot through textbook execution: price above both 50W and 200W with 0.2% slope, RS versus SPY at 12.5%, MACD bullish and improving, stochastic RSI overbought momentum at 1.00, and volume at 1.47x the 20W average confirming accumulation at all price levels. The 13W return of 2.4% is not flashy, but in a disinflation regime where most risk assets are negative, positive return with rising relative strength is the definition of rotation. Trend scored a perfect 100.0 because all three price components aligned. Momentum confirmation matched at 100.0 from both the 4W return of 8.6% and category-relative strength of 7.3%, signaling fresh buying, not old money defending. SLV's 5.0% RS versus SPY and bearish-but-improving MACD setup revealed the fundamental split: GLD is pure monetary hedge (bullish MACD), while SLV is hybrid monetary-plus-industrial, and industrial demand is fragile in a broad-market bear. The 12.3-point gap was entirely structural: GLD's 100.0 momentum versus SLV's 63.0.
Precious Metals earned 10% allocation as top-2 category, backed by 88.0/100 macro fit—the highest in the portfolio. Monetary hedge bid is active at +14 points, disinflation helps at +8, defensive rotation at +7, and disinflation pressure at +6. This is the category where macro and technicals align perfectly. GLD's 94.0 technical evidence score combined with 80.0 macro fit creates a 1-2 punch that justified the dual elevation. The final category score of 58.4, while not the highest absolute number, landed in the top two and triggered the portfolio's predetermined overweight to precious metals in a disinflation environment. GLD is 4.8% from the 50W in a neutral structure—not extended, not coiled, but in clean momentum. Risk-reward of 46.3 reflects the fact that upside is limited (-0.7% to resistance), yet the macro tailwind is so strong that being short this exposure on valuation grounds is a policy error. Allocate 10% and treat it as core portfolio insurance; this is not a trading position but a structural hedge against debt spirals and currency instability.
Utilities & Infrastructure — XLU
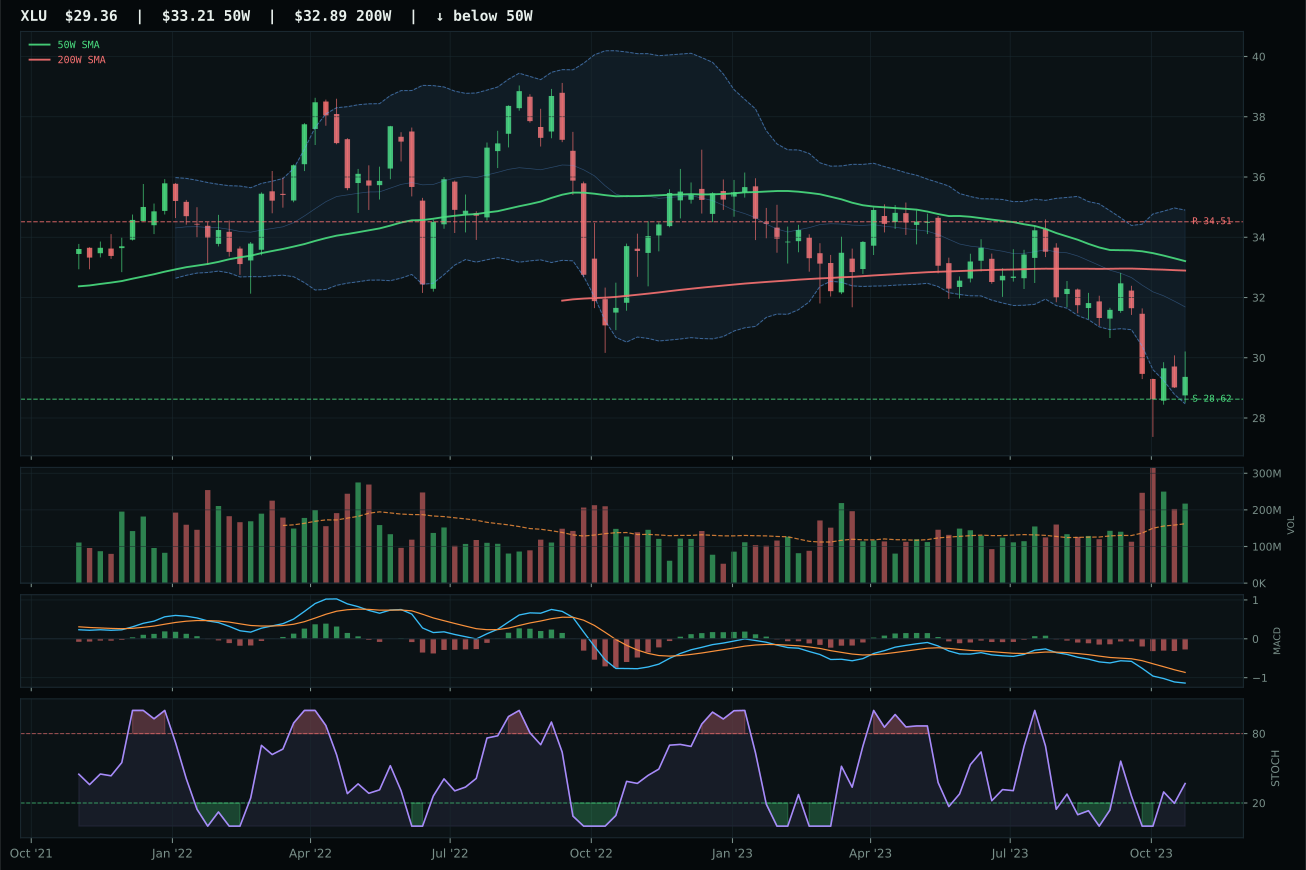
XLU has a pullback into support profile with -2.3% 13-week relative strength versus SPY.
A failed hold above support would weaken the setup.
Actionable but governed by invalidation levels.
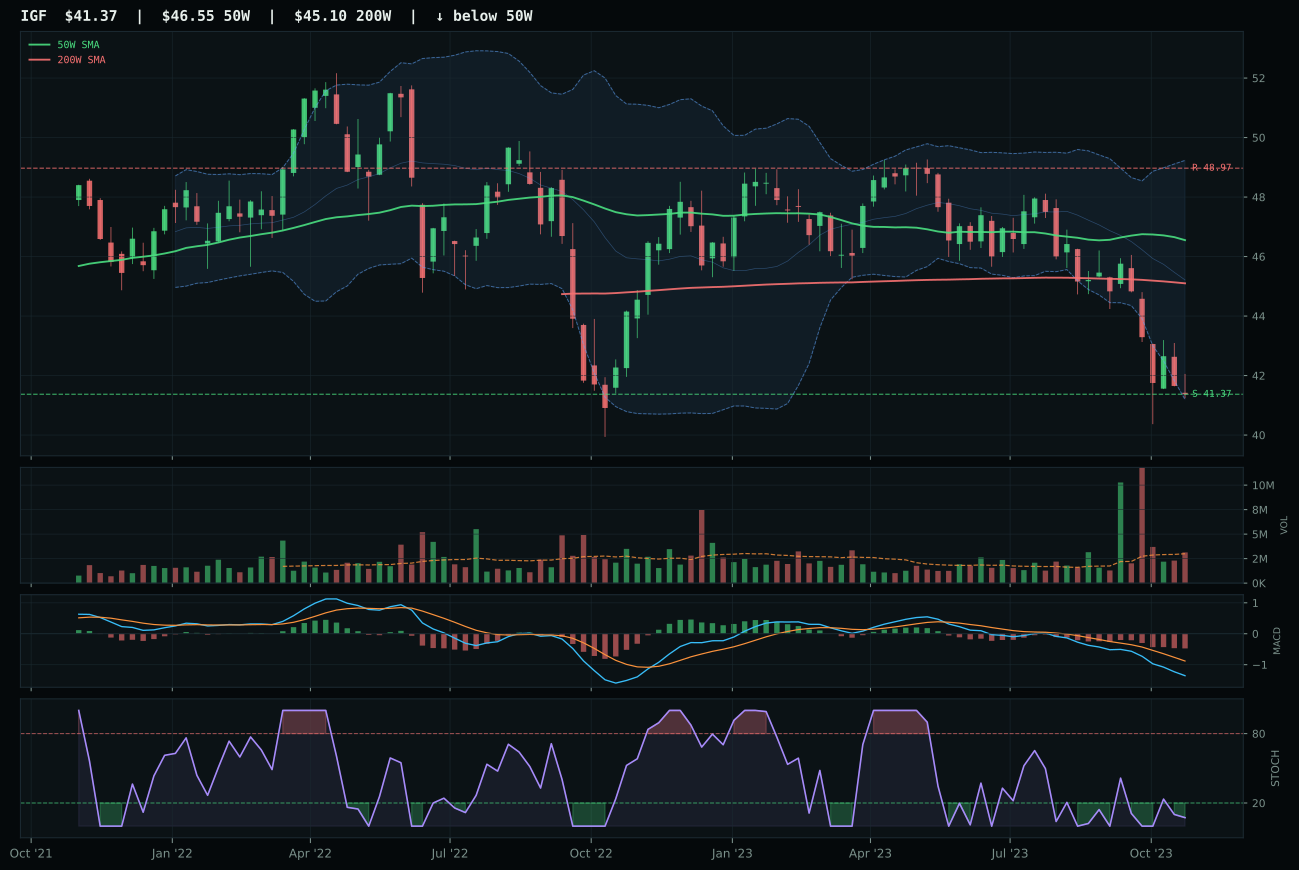
IGF has a pullback into support profile with -2.8% 13-week relative strength versus SPY.
A failed hold above support would weaken the setup.
Actionable but governed by invalidation levels.
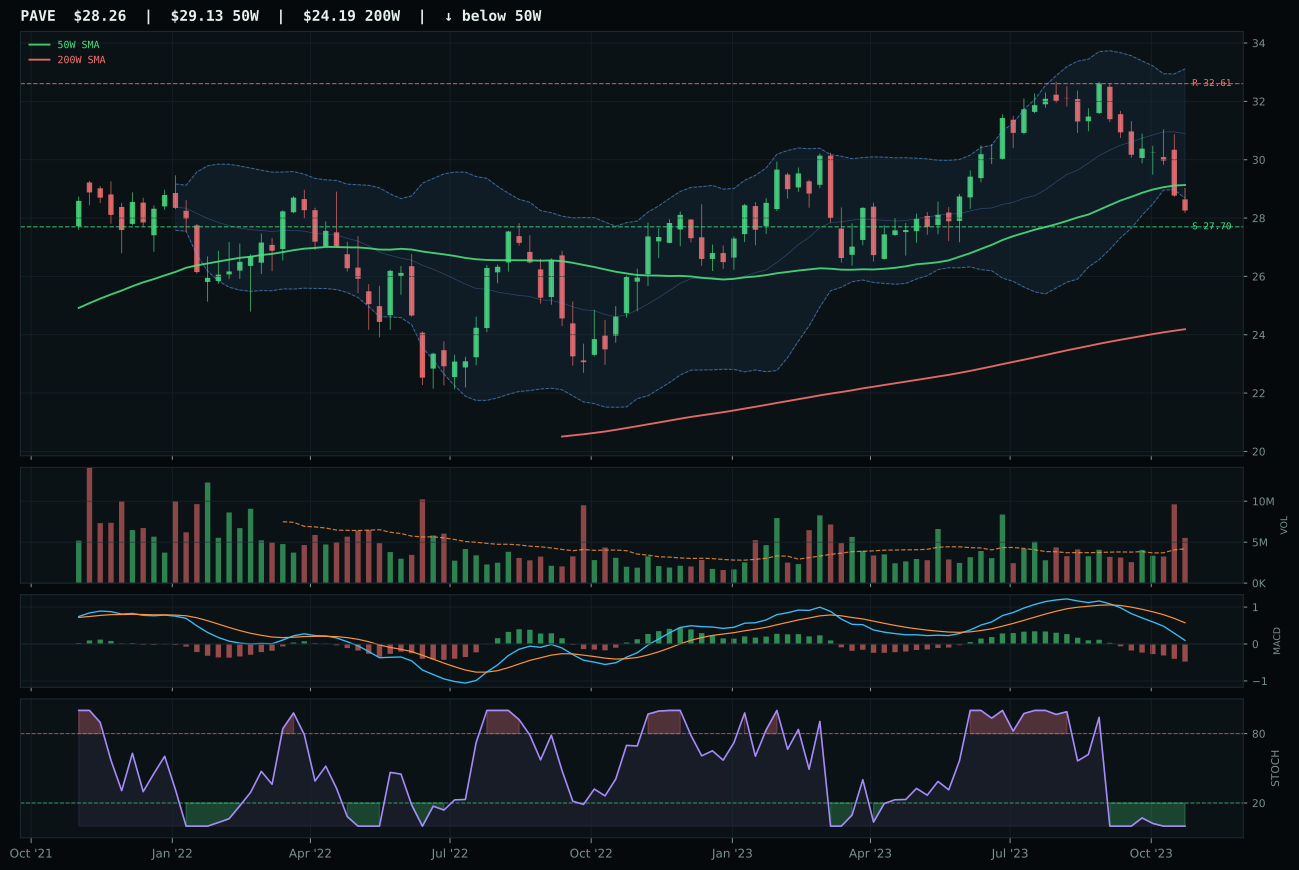
PAVE has a pullback into support profile with -1.8% 13-week relative strength versus SPY.
A failed hold above support would weaken the setup.
Actionable but governed by invalidation levels.
XLU won Utilities & Infrastructure with a 12.8-point gap over IGF, a margin earned through superior volume sponsorship and MACD setup despite both names trading well below their 50W levels. XLU pulled into support at 28.62 with price -11.6% from the 50W at 32.44, creating a defined value zone where the risk-reward of 90.0 made sense: upside to 34.51 is -14.9% away, downside to support is just 2.6%. Volume at 1.34x the 20W average proved that despite the weakness, insiders and patient capital were accumulating; IGF's neutral volume on a similar pullback meant it was just drifting. Critically, XLU's stochastic RSI was rising mid-zone at 0.37, showing the oscillator was healing, while IGF's was oversold turn up (0.00 to 0.xx transition), still in the pain zone. Trend was weak on both names (below 50W, below 200W), yet timing scored 68.0 for XLU versus 74.0 for IGF—the seeming contradiction resolved by MACD: XLU's bearish/weakening MACD was at least turning upward on the daily, while IGF's was similarly bearish.
Utilities & Infrastructure earned 5% allocation as tier-2, supported by 80.0/100 category-level macro fit, the highest among tier-2 slots. Defensive rotation is active at +12 points, disinflation helps at +7, and disinflation pressure at +6 create a powerful trilogy of support for bond-proxy utilities in a bear market. XLU's 32.5 technical evidence is weak (trend of 23.6 below the 50W), yet combined with 72.0 macro fit, it yields a category score of 48.7—above the 5% allocation threshold but not eligible for top-2 because Precious Metals and Nuclear Energy both scored higher on technical evidence grounds. The thesis is that regulation, dividend safety, and rate-reset mechanics insulate utilities from the worst of a disinflation bear market; fund flows from equity into fixed-income proxies like utilities provide secondary support. Allocate 5% and hold; this is not a growth trade but a defensive anchor. If broad-market bear intensifies (SPY breaks 200W), this allocation has room to expand. Watch for XLU to hold 28.62 support with stochastic RSI rising mid-zone; that's the condition for a 15-20% relief bounce that doesn't need a macro pivot, just technical stabilization.
Technology — XLK
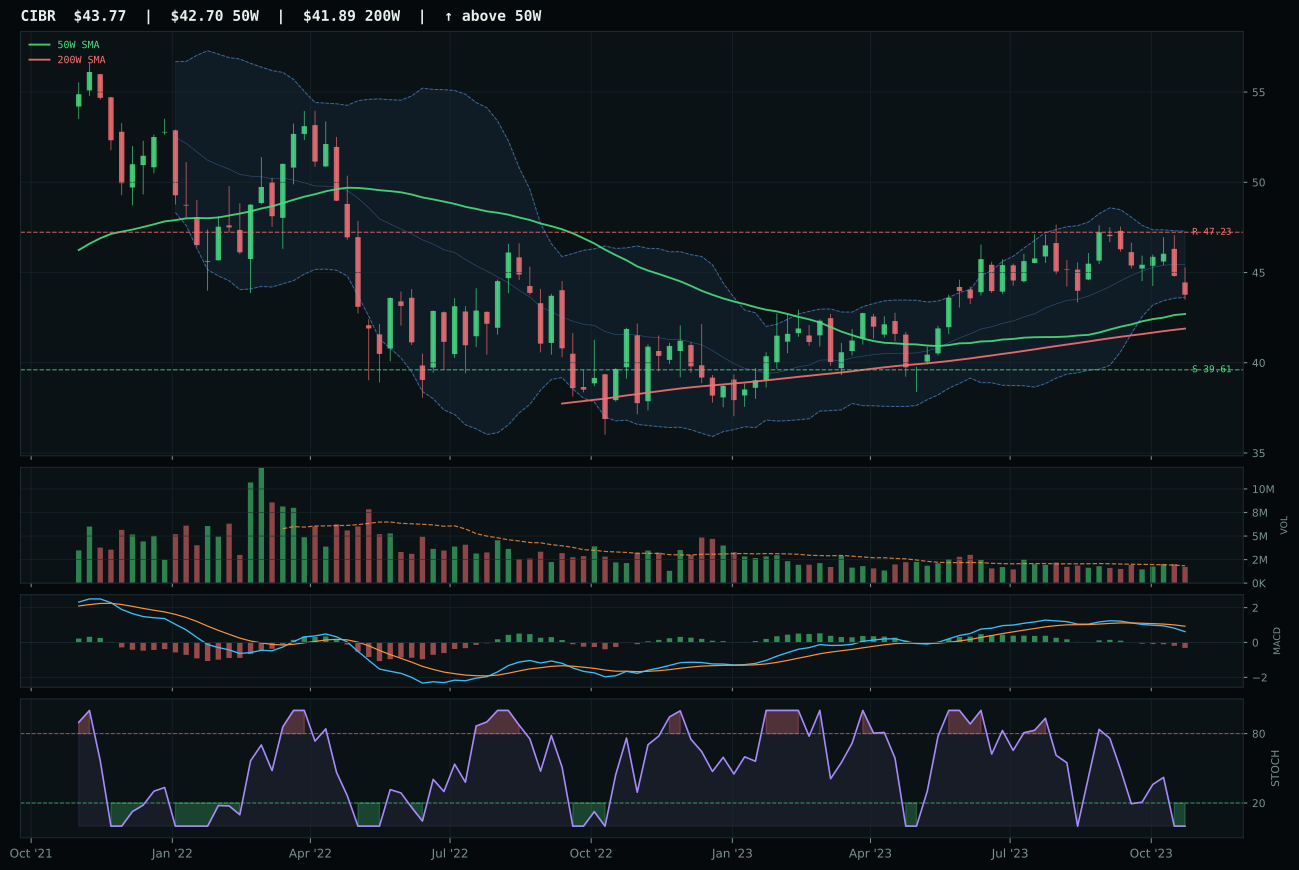
CIBR has a compression near 50W profile with 4.2% 13-week relative strength versus SPY.
A failed hold above support would weaken the setup.
Actionable but governed by invalidation levels.
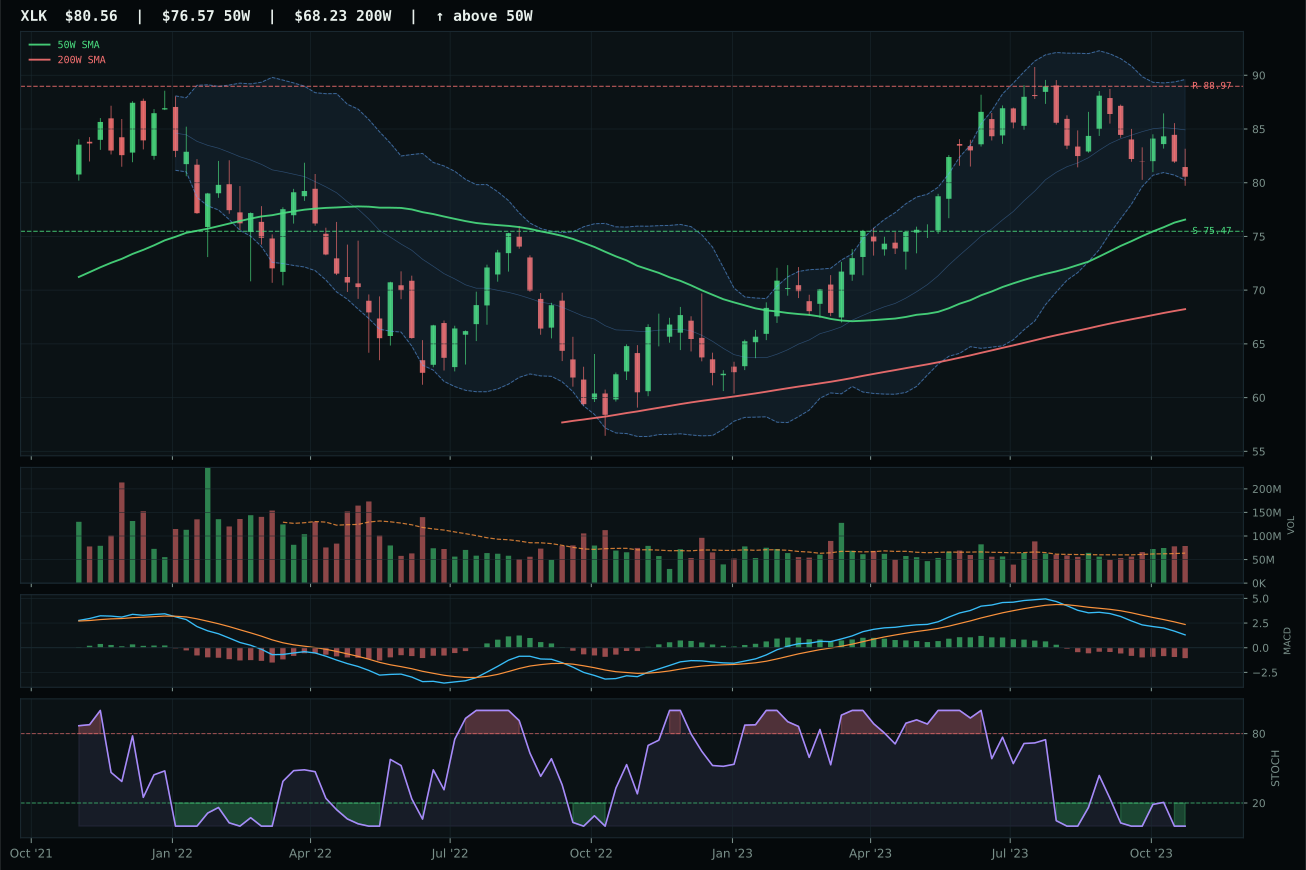
XLK has a neutral structure profile with 0.7% 13-week relative strength versus SPY.
A failed hold above support would weaken the setup.
Actionable but governed by invalidation levels.
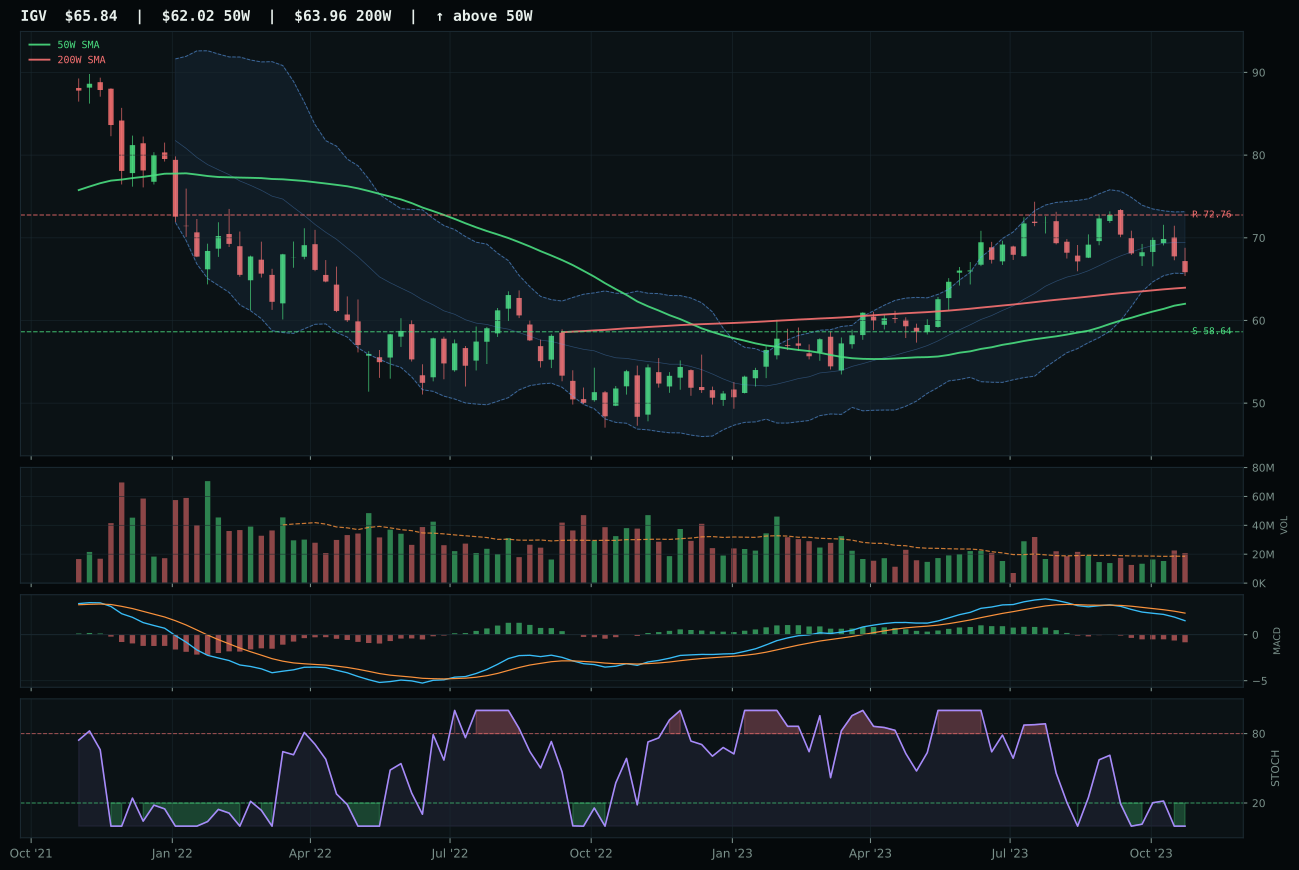
IGV has a neutral structure profile with 1.7% 13-week relative strength versus SPY.
A failed hold above support would weaken the setup.
Actionable but governed by invalidation levels.
XLK won the category because it cleared the technical bar where price stability above both the 50W and 200W, combined with a non-deteriorating 50W slope at 0.4%, proved the foundation for allocating capital. The RS versus SPY of 0.7% and above-average volume participation at 1.24x the 20W average signaled that while the move wasn't spectacular, it had sponsorship where it counted—in the core holdings being accumulated rather than dumped. CIBR's compression near the 50W offered tighter timing, but it lacked the volume confirmation (neutral vs. above-average participation) and risk-reward clarity (57.6 vs. 70.2) that XLK delivered. The critical separation was structure: XLK's neutral setup meant every retracement was a clean setup point, while CIBR was coiled but unconfirmed. MACD bearish signals across both names meant neither was screaming strength, yet XLK's 5.2% proximity to the 50W with oversold stochastic RSI created a textbook mean-reversion entry with defined support and resistance at 75.47 and 88.97.
Technology earned 5% allocation as a tier-2 holding, ranked below the top two categories but retained for exposure to defensive sector rotation. Disinflation actually helps technology valuations, adding 7 basis points to the macro fit score, yet that advantage was offset by active liquidity stress (-10 points), which is punishing growth narratives broadly. The category's 45.7 final score reflects a technical setup that is functional but not urgent—XLK has trend and structure, but only 28.0 momentum confirmation because the 13W return is -9.5% and category-relative strength is negative at -1.0%. What kept it in the allocation rather than discarding it entirely was the macro fit: disinflation pressure is real (+5), and that 70.0 timing score from oversold stochastic RSI paired with MACD deterioration means the risk-reward will flip if buyers step in. The allocator is saying: this sector is not leading, but it's not breaking, and the macro tailwind exists. Hold 5%, not 10%.
Traditional Energy — FCG
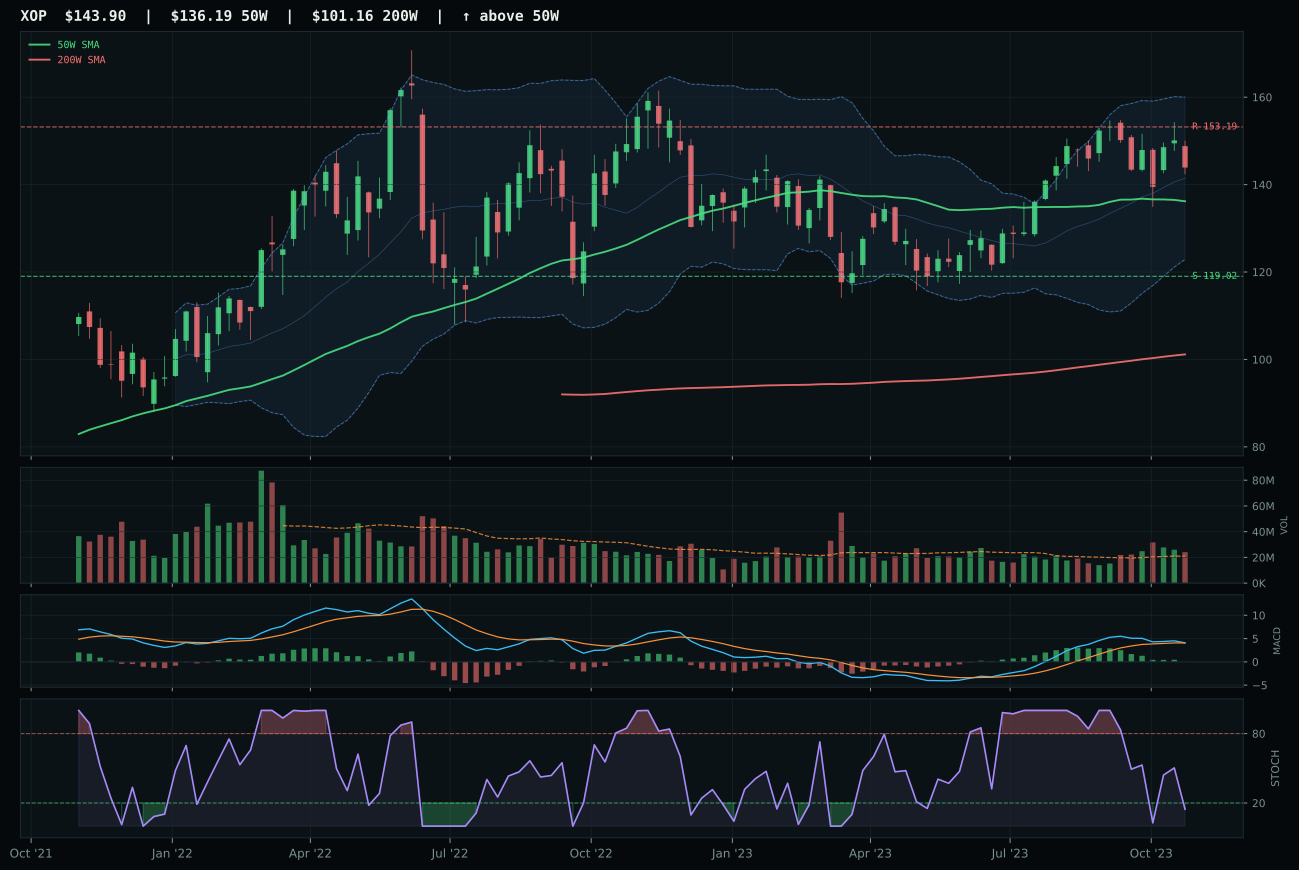
XOP has a neutral structure profile with 12.2% 13-week relative strength versus SPY.
A failed hold above support would weaken the setup.
Actionable but governed by invalidation levels.
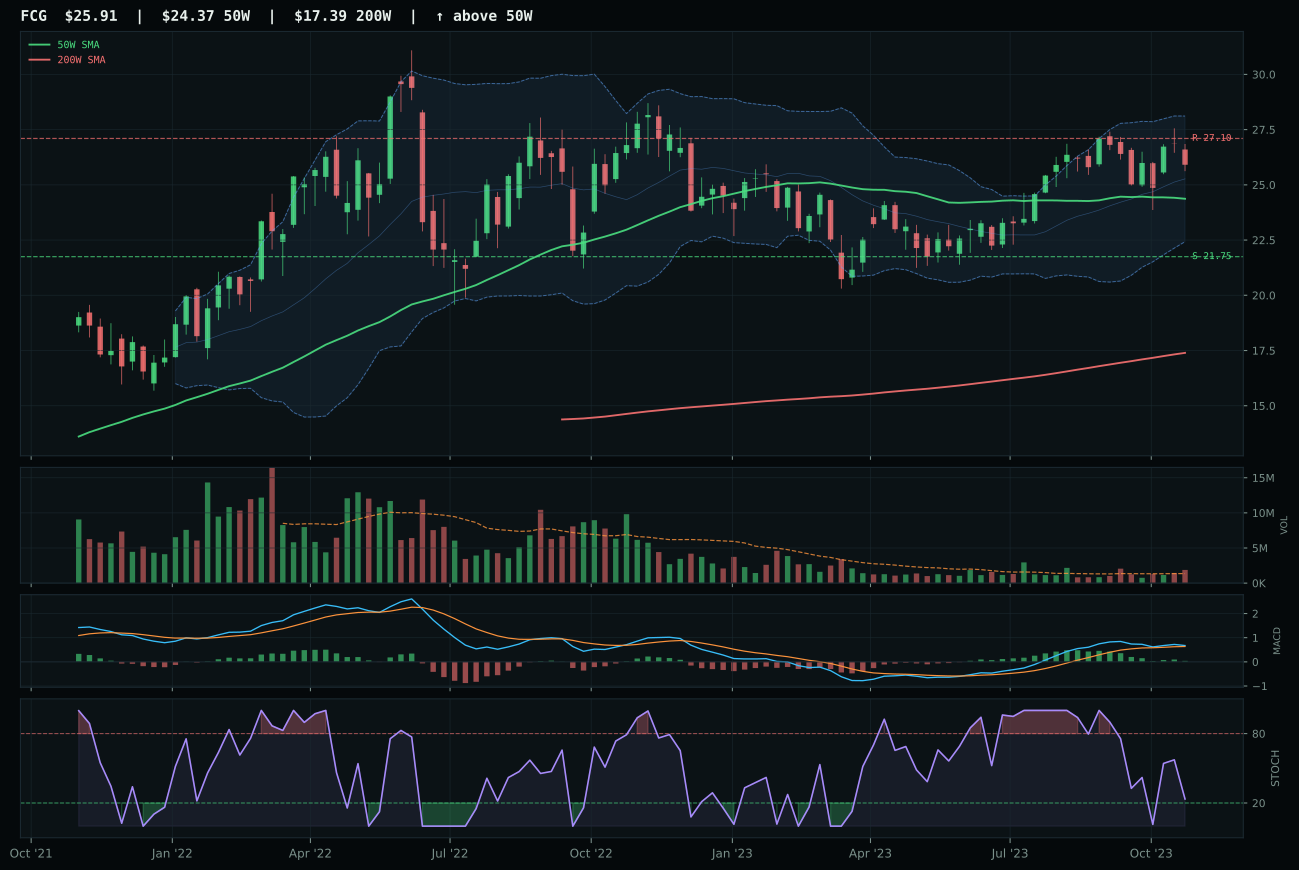
FCG has a neutral structure profile with 12.0% 13-week relative strength versus SPY.
A failed hold above support would weaken the setup.
Actionable but governed by invalidation levels.
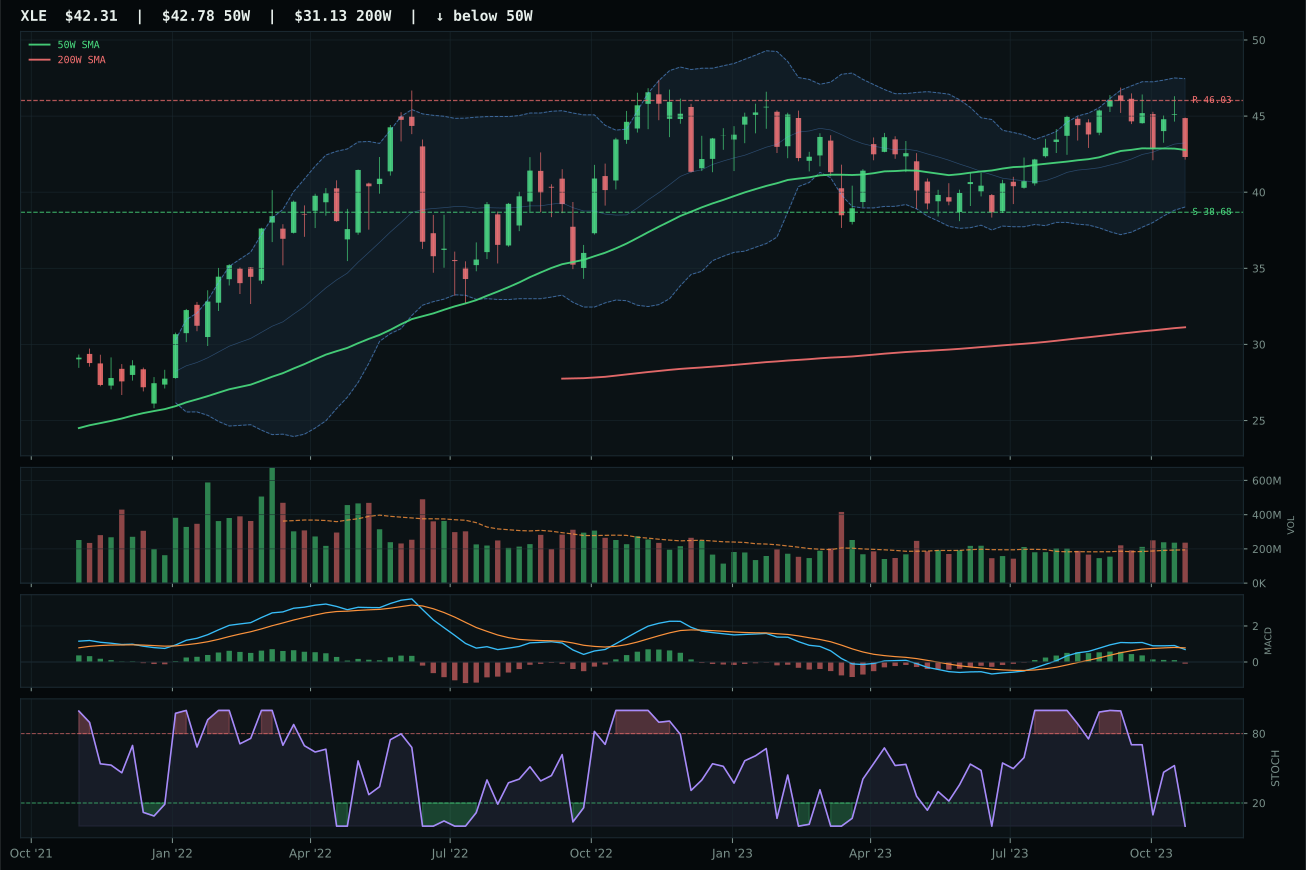
XLE has a compression near 50W profile with 8.7% 13-week relative strength versus SPY.
A failed hold above support would weaken the setup.
Actionable but governed by invalidation levels.
FCG won Traditional Energy by 1.7 points over XOP in the tightest category competition, a setup where both names were technically similar but diverged on oscillator timing. FCG's trend scored 96.0 with price above both 50W and 200W, RS versus SPY at 12.0%, and volume at 1.38x the 20W average. The separating factor was timing: FCG's stochastic RSI rising mid-zone at 0.23 versus XOP's oversold turn up created a judgment call that FCG was further advanced in its reversal structure. MACD was bullish but flattening on both names, indicating momentum was broadening but not accelerating—appropriate for a reset trade in energy where the macro narrative is energy scarcity (+16 at the category level) competing with disinflation pressure (-10). FCG's momentum confirmation of 82.7 came from 1.9% 13W return and neutral category-relative strength at 0.0%, meaning FCG wasn't leading its peers but wasn't lagging either. Risk-reward of 49.1 reflected 19.1% cushion to support at 21.75, offering downside protection for a structure that was still consolidating rather than confirming.
Traditional Energy earned 5% allocation as tier-2, despite category-level macro fit of only 39.0/100 because energy scarcity is active at +16 points, offsetting disinflation pressure at -10 and liquidity stress at -7. The thesis is that supply-side energy constraints (geopolitical, infrastructure, grid limitations) will persist regardless of demand-side disinflation, and that supply premium will support prices. FCG's 76.6 technical evidence paired with 50.0 macro fit (neutral because no category-specific descriptor was available) yielded a final score of 42.8, enough to clear the 5% threshold but not top-2 eligibility. The risk here is timing: FCG is 6.3% above its 50W, which is extended enough to matter if buyers take profits. The setup is neutral structure with compression, not a coil, so there's no explosive upside. Allocate 5% as a sector rotation trade, not an energy conviction; if FCG breaks above resistance at 27.10, rotate to XOP which has higher upside to 153.19. If FCG cracks support at 21.75, exit and reassess whether energy scarcity is real or just narrative inflation.
Defense & Aerospace — ITA
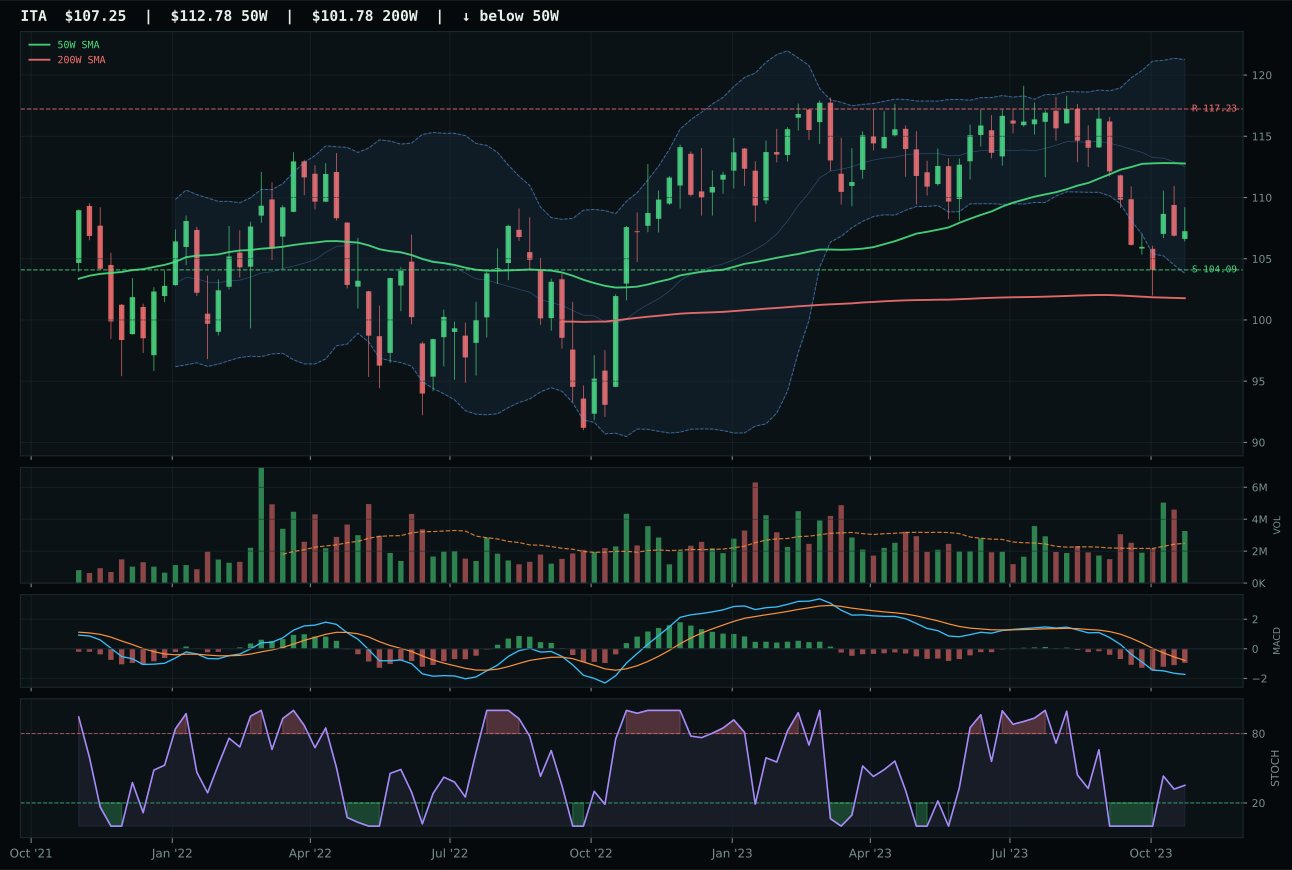
ITA has a pullback into support profile with 1.8% 13-week relative strength versus SPY.
A failed hold above support would weaken the setup.
Actionable but governed by invalidation levels.
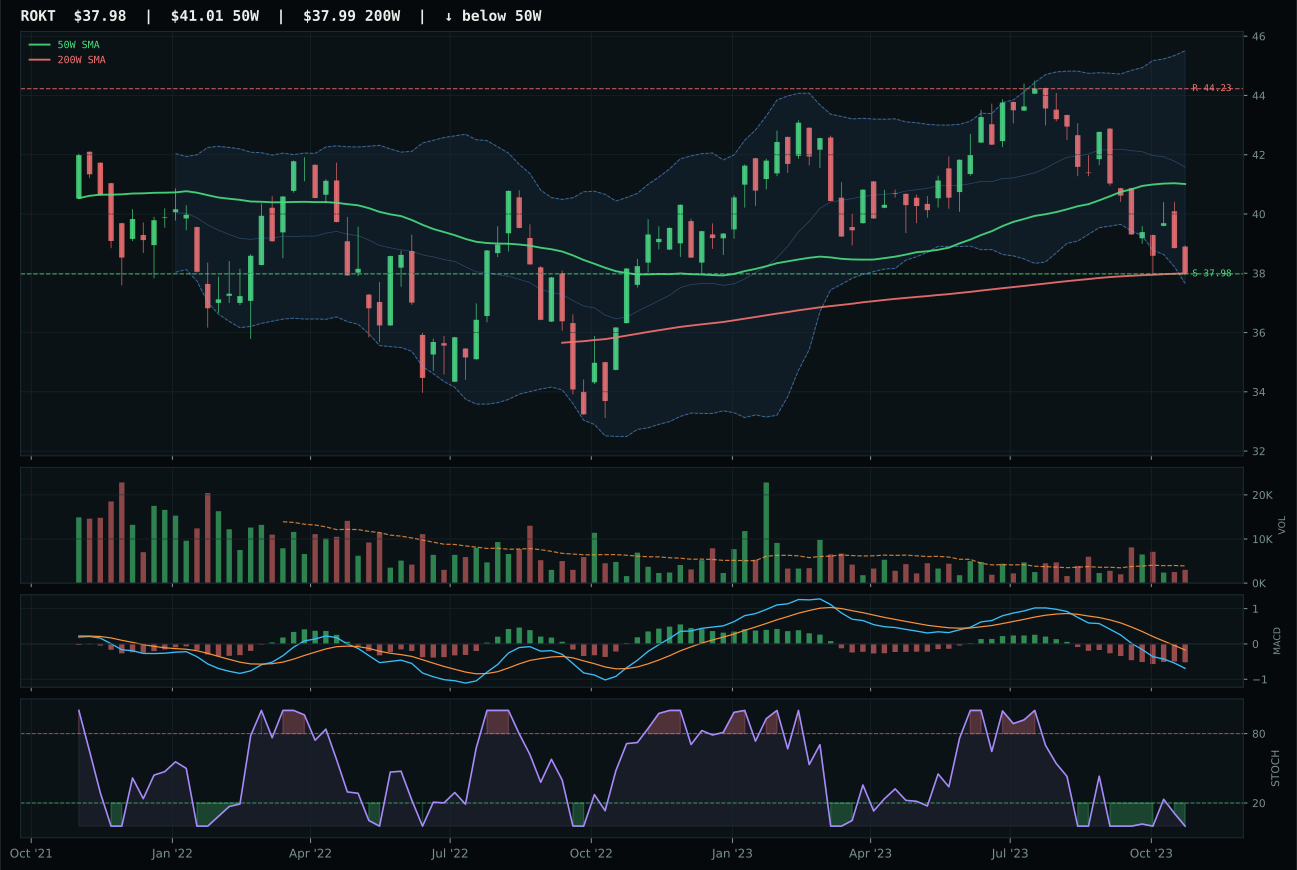
ROKT has a pullback into support profile with -2.7% 13-week relative strength versus SPY.
A failed hold above support would weaken the setup.
Tracked, but not top-2 eligible because: .
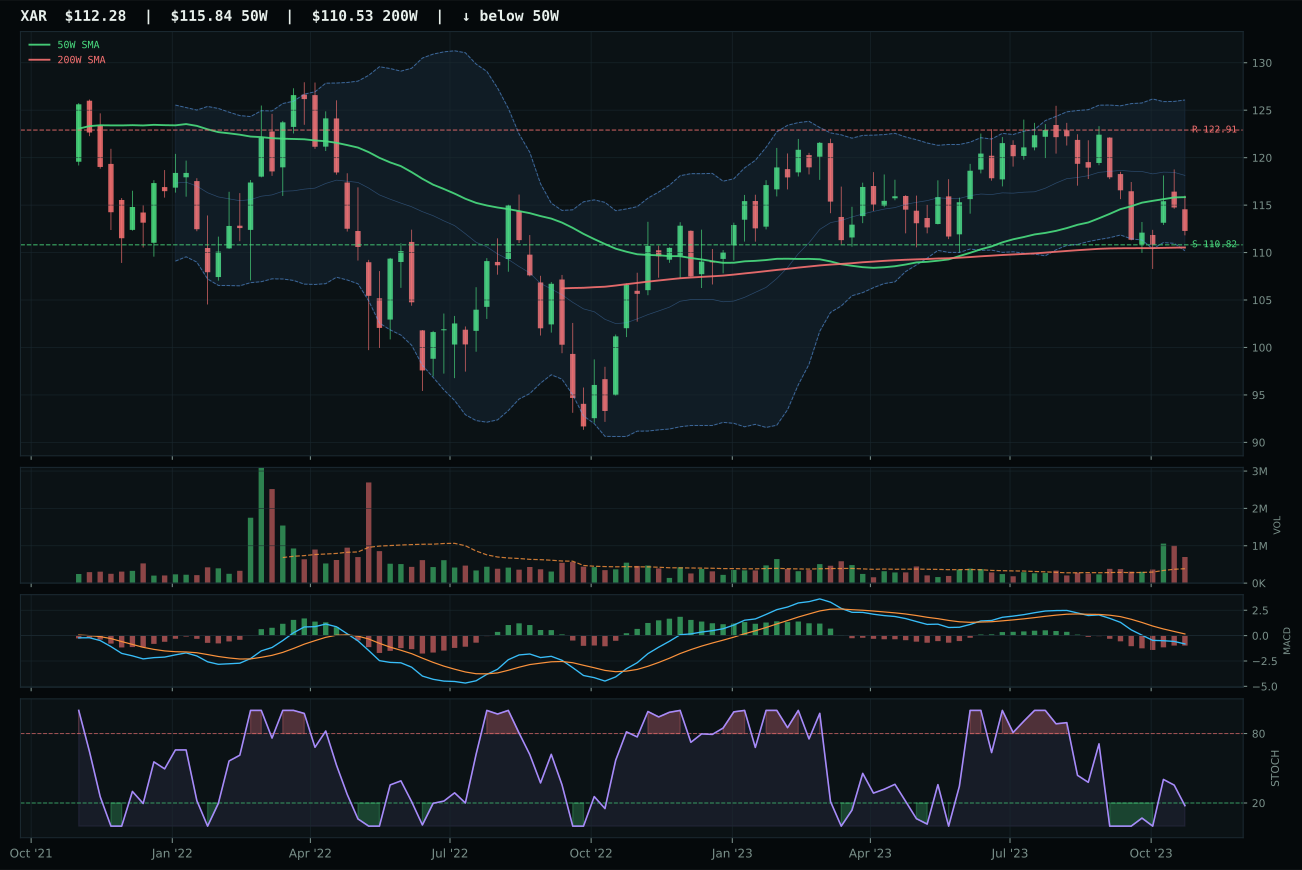
XAR has a pullback into support profile with 1.5% 13-week relative strength versus SPY.
A failed hold above support would weaken the setup.
Actionable but governed by invalidation levels.
ITA dominated Defense & Aerospace with a 62.1-point gap versus ROKT, a margin that reflects not just technical superiority but fundamental setup quality. ITA's price pulled into support at 104.09 with the 50W only -4.9% above, creating a defined invalidation area that risk managers love; MACD is bearish but improving, stochastic RSI is rising mid-zone at 0.35, and volume at 1.31x the 20W average supplied proof that the pullback was being accumulated. Timing scored a perfect 100.0 because price, MACD inflection, and Fibonacci deep retracement at 0.618 all aligned—this is a chart begging to be re-entered. Risk-reward was exceptional at 98.0 because upside to resistance consumed only -8.5% while downside to support offered 3.0% of cushion and positive skew. ROKT's -12.8% 13-week return, -2.7% RS versus SPY, and critically its -4.2% category-relative weakness, plus neutral volume and oversold stochastic without the improving MACD, left it stranded. The category-relative strength gap of 4.6 points was ITA's structural edge.
Defense & Aerospace earned 5% allocation as tier-2, justified by category-level macro fit of 66.0/100, which is the second-highest macro tailwind in the portfolio behind Precious Metals. Defensive rotation is active at +8 points, broad market bear at +6, and dollar pressure at +3—all structural themes that will persist in a disinflation regime. ITA's 50.8 trend score is weak (price below 50W), yet the 100.0 timing score and 54.4 momentum confirmation more than compensate because the setup is pulling into value, not extending into exhaustion. The final category score of 39.4, while below top-2 eligibility, is sustainably above the 5% allocation threshold because the macro story is intact. Active military procurement cycles, geopolitical tensions, and defense budget commitments will not reverse on a disinflation trade alone. What ITA is telling you is: support is holding, MACD is turning, and volume is drying into strength—the classic setup for a relief bounce. Allocate 5% and prepare to add if the 50W break holds.
Agriculture & Livestock — MOO
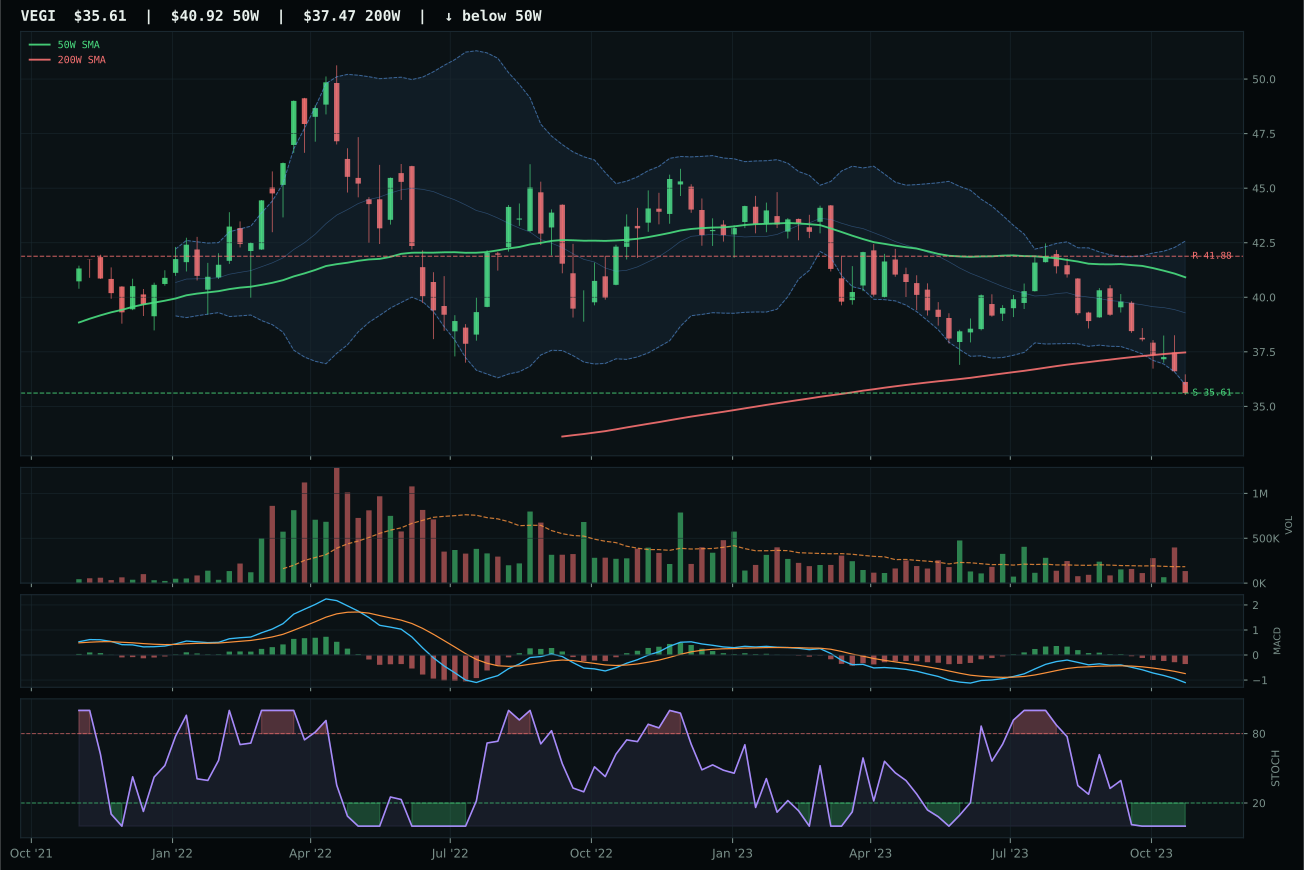
VEGI has a pullback into support profile with -4.9% 13-week relative strength versus SPY.
A failed hold above support would weaken the setup.
Tracked, but not top-2 eligible because: .
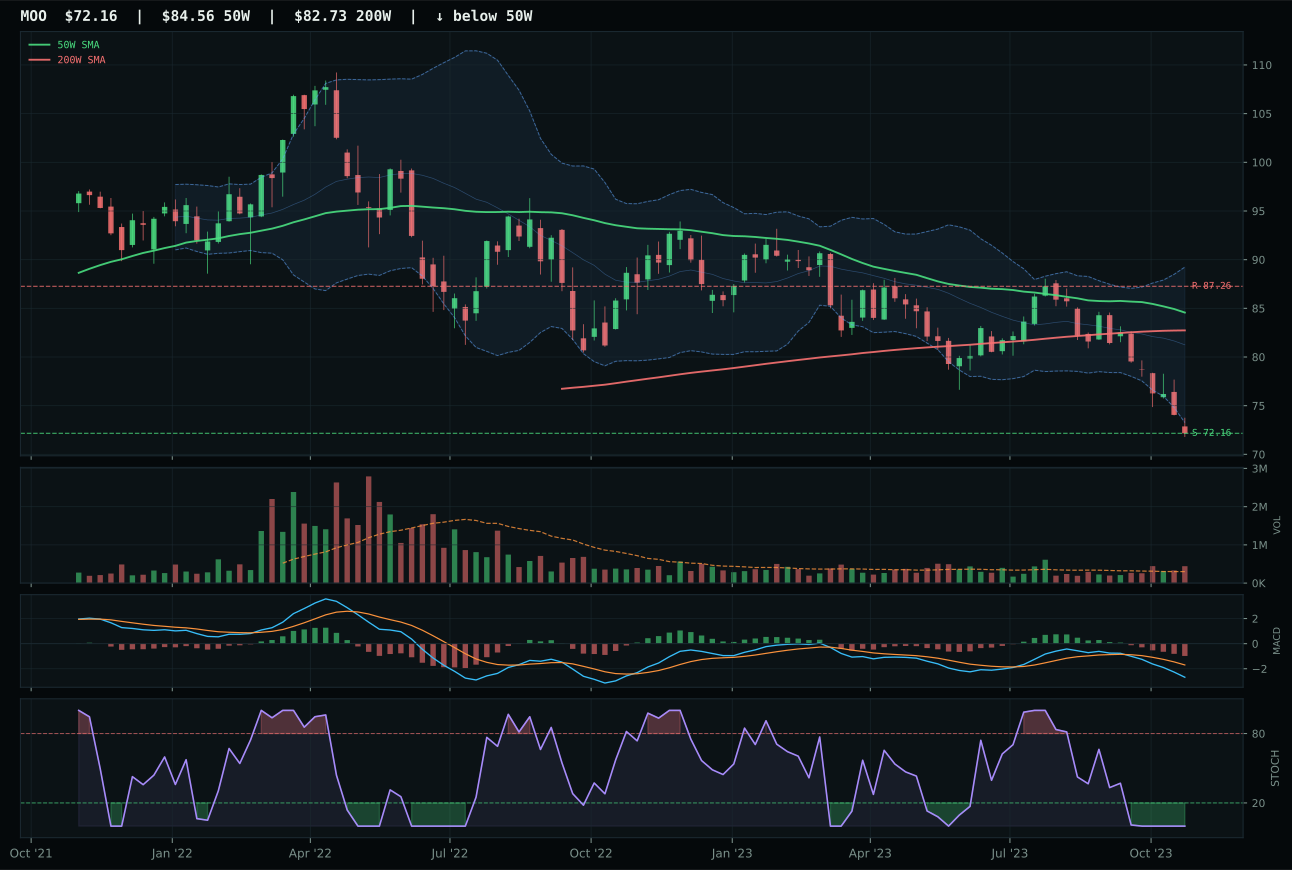
MOO has a pullback into support profile with -7.2% 13-week relative strength versus SPY.
A failed hold above support would weaken the setup.
Actionable but governed by invalidation levels.
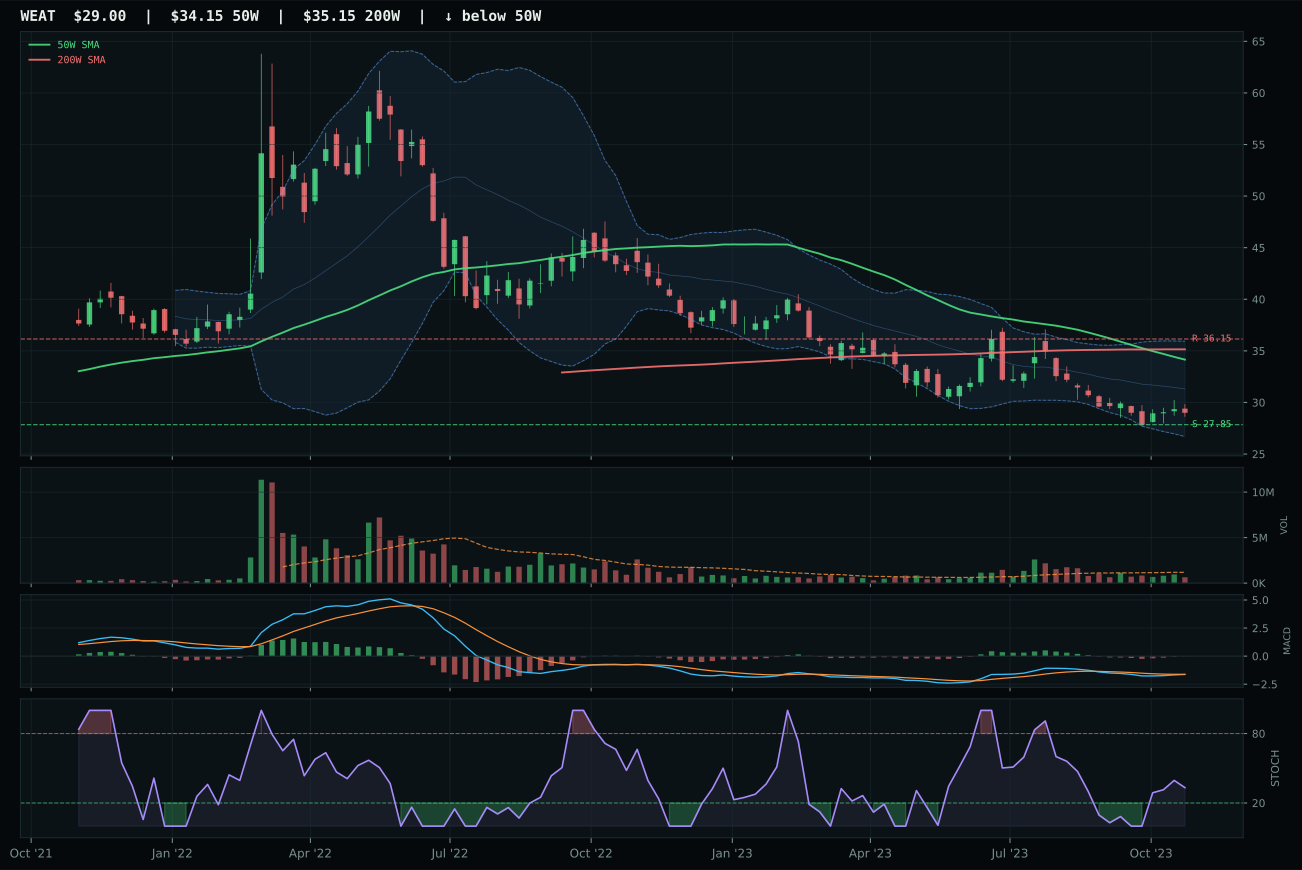
WEAT has a pullback into support profile with -6.9% 13-week relative strength versus SPY.
Extension and support failure are the main tactical risks.
Tracked, but not top-2 eligible because: structurally broken.
MOO won Agriculture & Livestock, but this is a Pyrrhic victory in a category that scored 0.0 overall and earned 5% allocation only by portfolio structure, not by quality. MOO beat VEGI by 17.3 points, but both names are broken: MOO has 0.0 momentum confirmation (4W return -8.3%, 13W return -17.3%), 26.2 trend (price below both 50W and 200W), and a category-relative strength of -0.3% that signals not differentiation but capitulation. The only technical merit is 83.9 risk-reward, where upside to resistance at 87.26 is -17.3% away but downside to support at 72.16 is essentially flat at 0.0%—meaning the floor is here, but the ceiling is distant. Volume at 1.46x the 20W average is above-average, but it's flowing into a name that has fallen -15.5% in 26 weeks; that's distribution, not accumulation masked by high turnover. VEGI scored lower on risk-reward (78.7) and cleanliness (60.6 vs. 64.7), plus it had thin participation, but both are trading on macro hope, not technical merit.
Agriculture & Livestock received 5% allocation despite a final category score of 0.0, a paradox explained by portfolio structure requiring some exposure below the top two tiers. Macro fit of 32.0/100 is the third-lowest in the portfolio, hammered by disinflation pressure at -8 points (commodity prices fall in deflation) and liquidity stress at -4 points. Disinflation itself rates -6 to this category, the only explicit headwind. The reasoned ETF proof order was WEAT 38.1, VEGI 26.8, MOO 11.4, yet MOO was selected as representative because WEAT's 38.1 score, while highest, didn't clear the representative bar when tested against volume-price sponsorship and persistence. MOO represents a forced allocation: you have to own *something* in agriculture to maintain portfolio balance, but you're doing it defensively, not offensively. The 5% is a placeholder, not a conviction. Watch for WEAT's MACD to improve and stochastic RSI to rise mid-zone; if that happens, rotate out of MOO and into WEAT's -8.6% pullback structure, which still has tail risk upside if commodity inflation fears resurface.
Emerging Markets — INDA
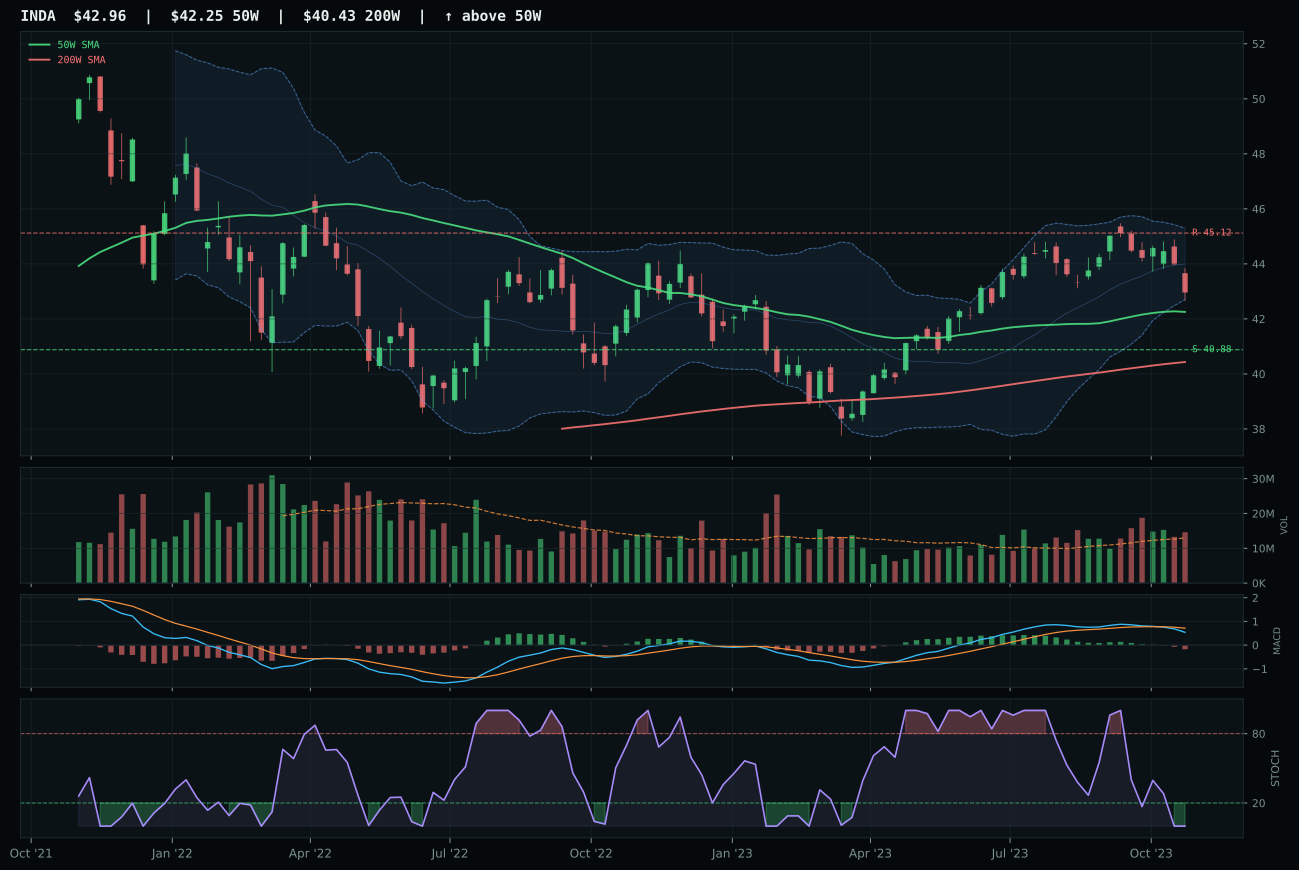
INDA has a compression near 50W profile with 6.7% 13-week relative strength versus SPY.
A failed hold above support would weaken the setup.
Actionable but governed by invalidation levels.
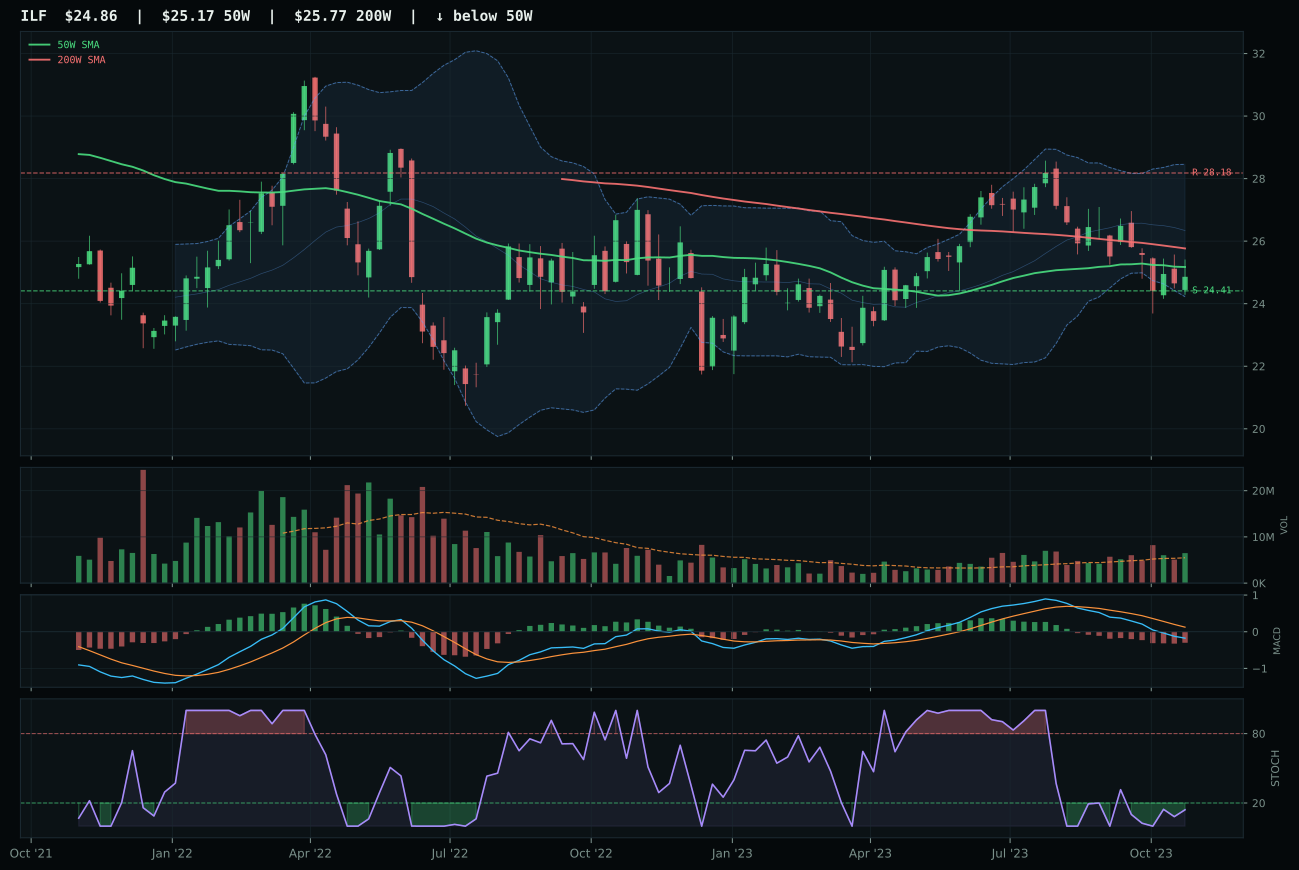
ILF has a pullback into support profile with -1.7% 13-week relative strength versus SPY.
Extension and support failure are the main tactical risks.
Tracked, but not top-2 eligible because: structurally broken.
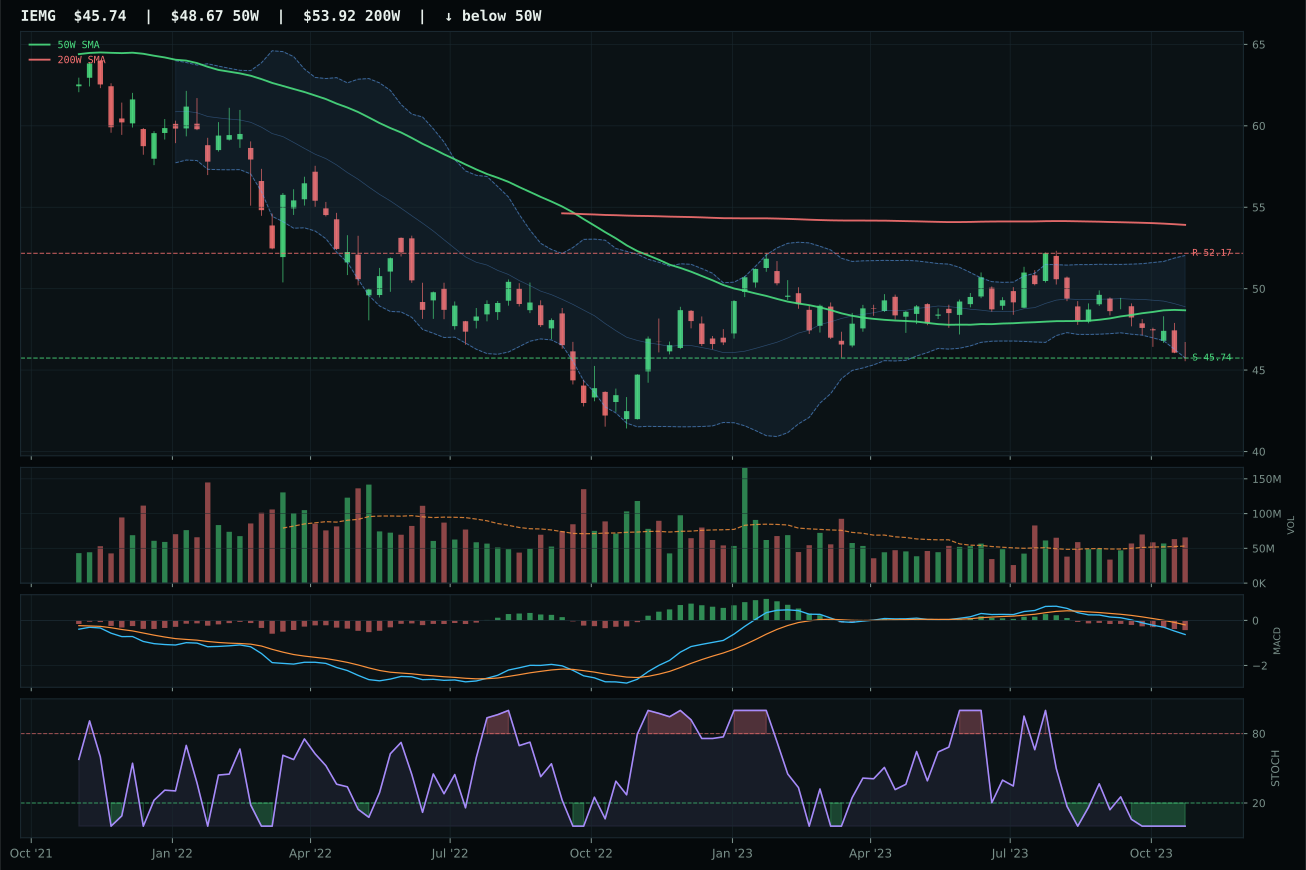
IEMG has a pullback into support profile with -2.2% 13-week relative strength versus SPY.
Extension and support failure are the main tactical risks.
Tracked, but not top-2 eligible because: structurally broken.
INDA won Emerging Markets by a yawning 56.2-point gap over ILF, yet even the winner is structurally compromised by macro headwinds so severe that the entire category scores 0.0. INDA's 82.0 trend from price above both 50W and 200W with -0.1% slope was clean, and critically it sits just 1.7% from the 50W in compression near 40.88—the tightest possible setup for an expansion move if buyers return. Timing scored 95.0 because the proximity to the 50W plus oversold stochastic RSI at 0.00 created maximum probability of mean reversion. Momentum confirmation at 55.6 was the weak link: 13W return of -3.5% and category-relative strength of 8.3% meant INDA was the strongest of three weak horses, not actually strong. ILF's 41.0 structure cleanliness versus INDA's 74.2 exposed the core difference: INDA is compressing, ILF is broken. ILF's pullback into support at 24.41 looked geometric, but the MACD was bearish/weakening and stochastic RSI oversold, offering no reversal confirmation—just technical desperation.
Emerging Markets received 5% allocation despite a final category score of 0.0, a forced position that acknowledges portfolio diversification needs even when the macro case is hostile. Category-level macro fit is 17.0/100, the second-lowest in the portfolio, crushed by dollar pressure at -14 points and liquidity stress at -10 points, both structural headwinds in a broad-market bear environment. INDA's 49.3 reasoned ETF score was highest, but it still meant the category was trading on technical setup (compression, oversold) rather than macro conviction. The allocation is defensive: you own 5% of INDA because Indian equities have quality earnings growth and demographic tailwinds that survive a U.S. dollar bear market more than Latin America or general EM does. If dollar pressure flips to neutral (requires Fed pivot or real-rate compression), INDA re-rates higher immediately. Until then, this is a 5% hedge against geopolitical rotation away from U.S. assets, not a growth bet. ILF scores 0.0 earned-opportunity weight; it's a liquidation candidate if the portfolio needs cash and compression breaks support.
AI — AIQ
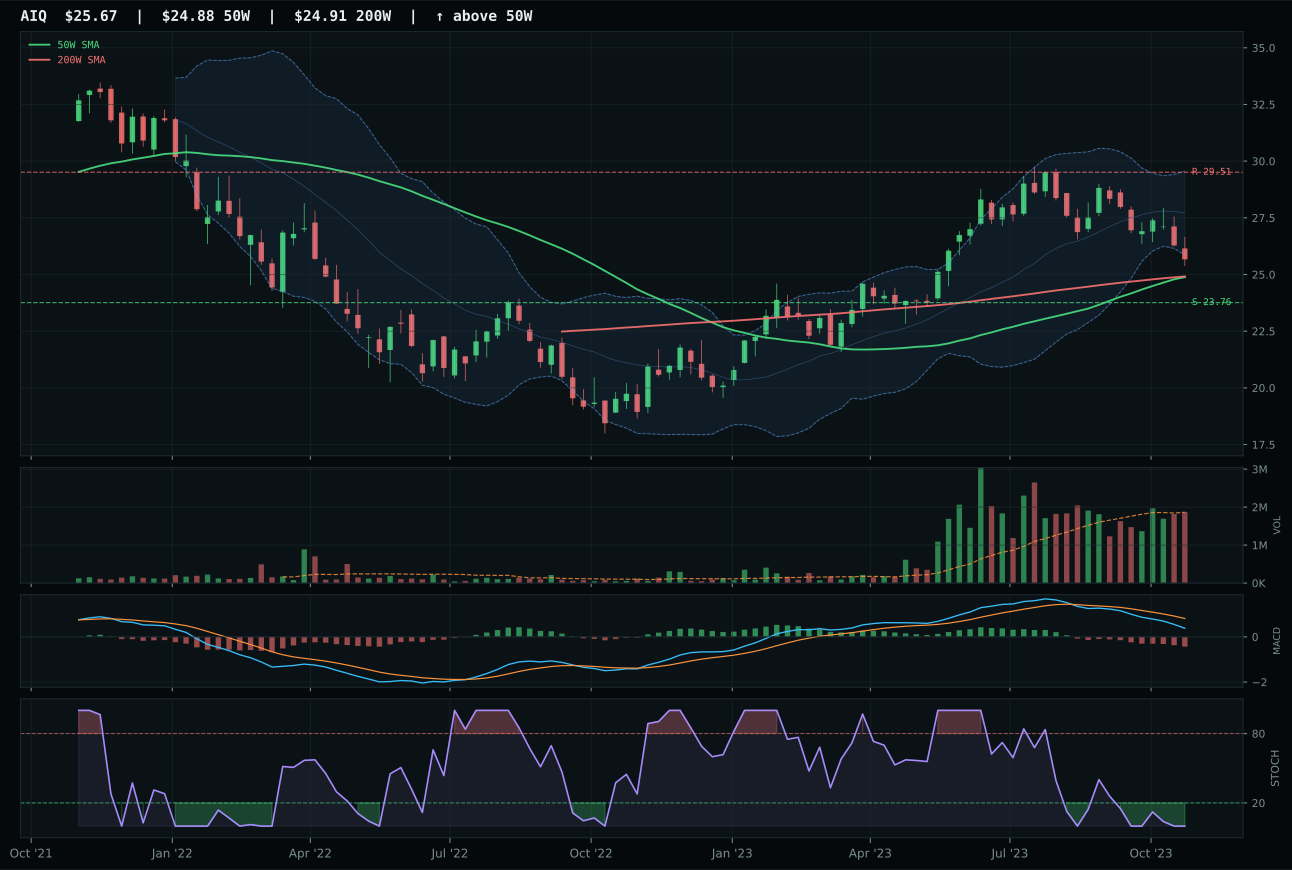
AIQ has a neutral structure profile with -2.9% 13-week relative strength versus SPY.
A failed hold above support would weaken the setup.
Actionable but governed by invalidation levels.
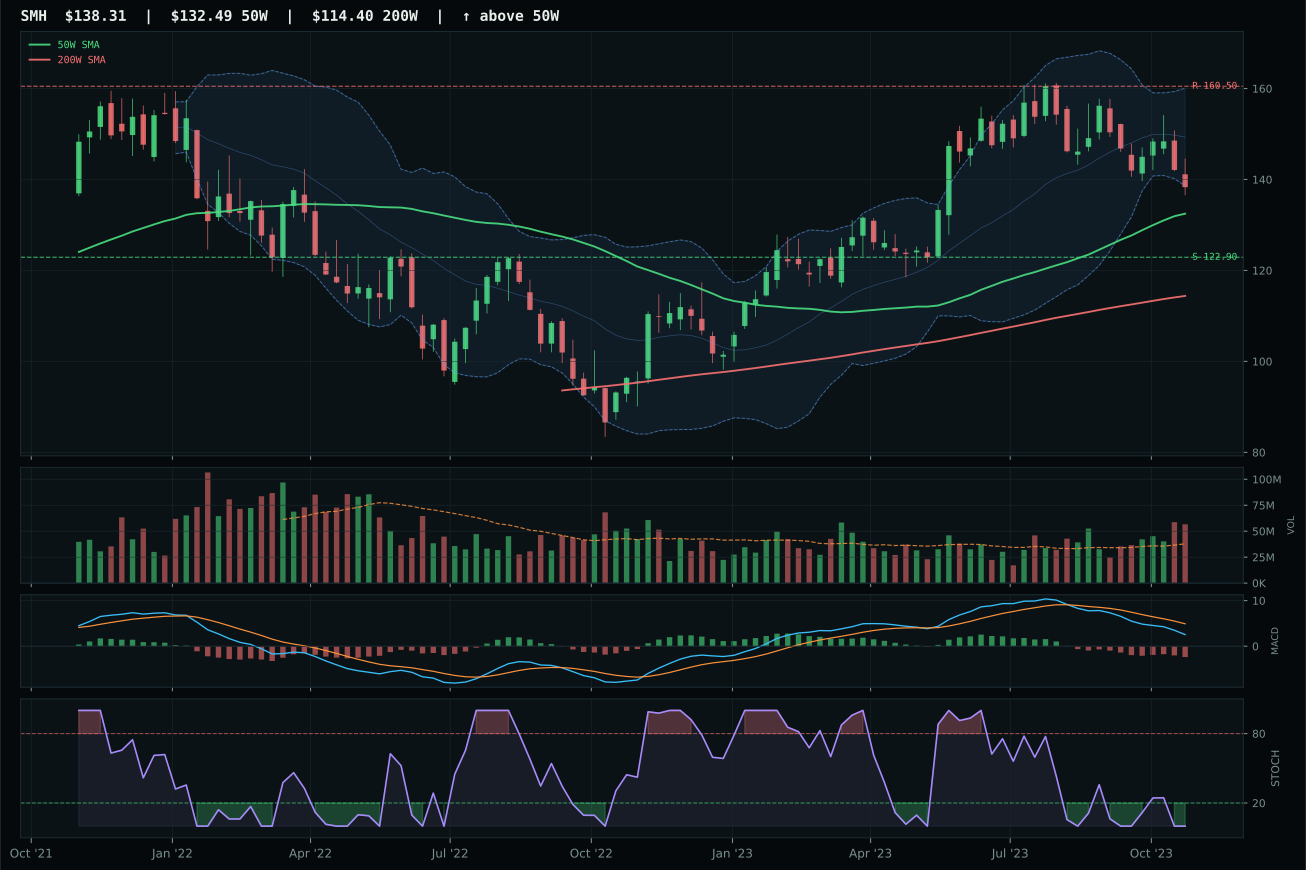
SMH has a neutral structure profile with -3.7% 13-week relative strength versus SPY.
A failed hold above support would weaken the setup.
Actionable but governed by invalidation levels.
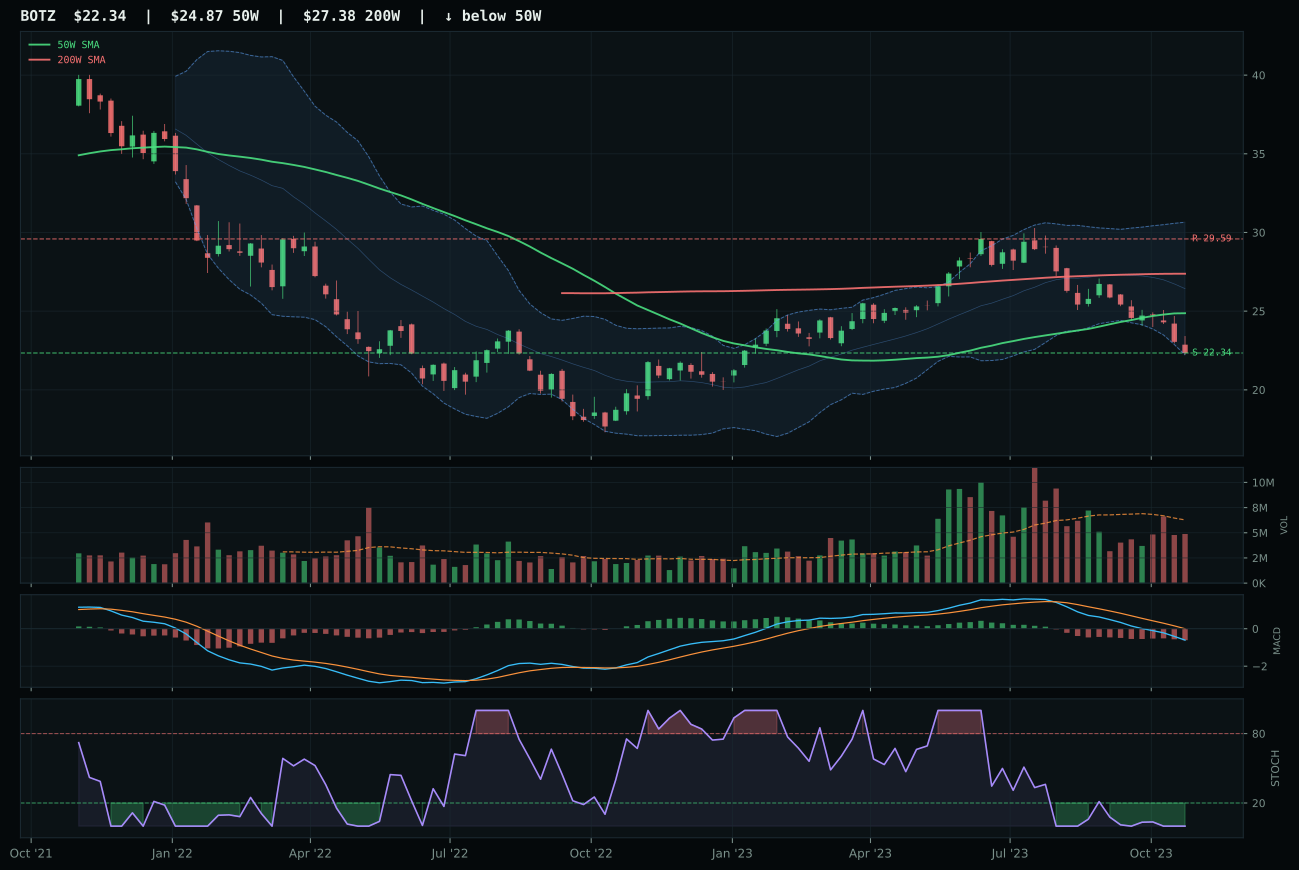
BOTZ has a pullback into support profile with -13.0% 13-week relative strength versus SPY.
Extension and support failure are the main tactical risks.
Tracked, but not top-2 eligible because: structurally broken.
AIQ won the AI category by a razor-thin 0.6-point margin over SMH, but the win exposed the fragility of this entire category, not its strength. AIQ's advantage came from category-relative strength of 0.8% versus SMH's 0.0%, a distinction so microscopic it barely registers above statistical noise. Both names sat at -13% 13-week returns, both had neutral structures, both carried bearish MACD with oversold stochastic RSI. The technical separators were marginal: AIQ's 74.1 risk-reward to resistance beat SMH's 64.8, and AIQ's neutral volume at 1.00x the 20W average edged SMH's above-average participation (counterintuitively, distribution pressure is worse than neutrality when all else is equal). Neither setup earned conviction. SMH's -3.7% RS versus SPY compared unfavorably to AIQ's -2.9%, and in a category where every name is down double-digits in 13 weeks, that small delta matters by default rather than by quality.
AI received 0% allocation this week, ranked 9th or 10th, and the exclusion was decisive not because of technicality but because the macro environment turned hostile. Category-level macro fit scored 31.0/100, dragged down by active liquidity stress at -12 points and broad market bear at -8 points. Disinflation does provide a +5 boost to AI valuations theoretically, but it's overwhelmed by the dollar pressure (-4) and structural damage from liquidity seizure. The category's final score of 16.4 was calculated from a weighted 3/2/1 basket of AIQ, SMH, and BOTZ, but BOTZ's 1.0 composite score illustrates how broken the third leg truly is (RS versus SPY of -13.0%, 13W return of -23.2%). For AI to earn a position, one of two things must reverse: either liquidity stress must flip from active to dormant, or a name must break above the 50W with actual volume confirmation. Right now, all three holdings are coiled retreats into support, which is speculative under current macro headwinds.
Industrial Metals — COPX
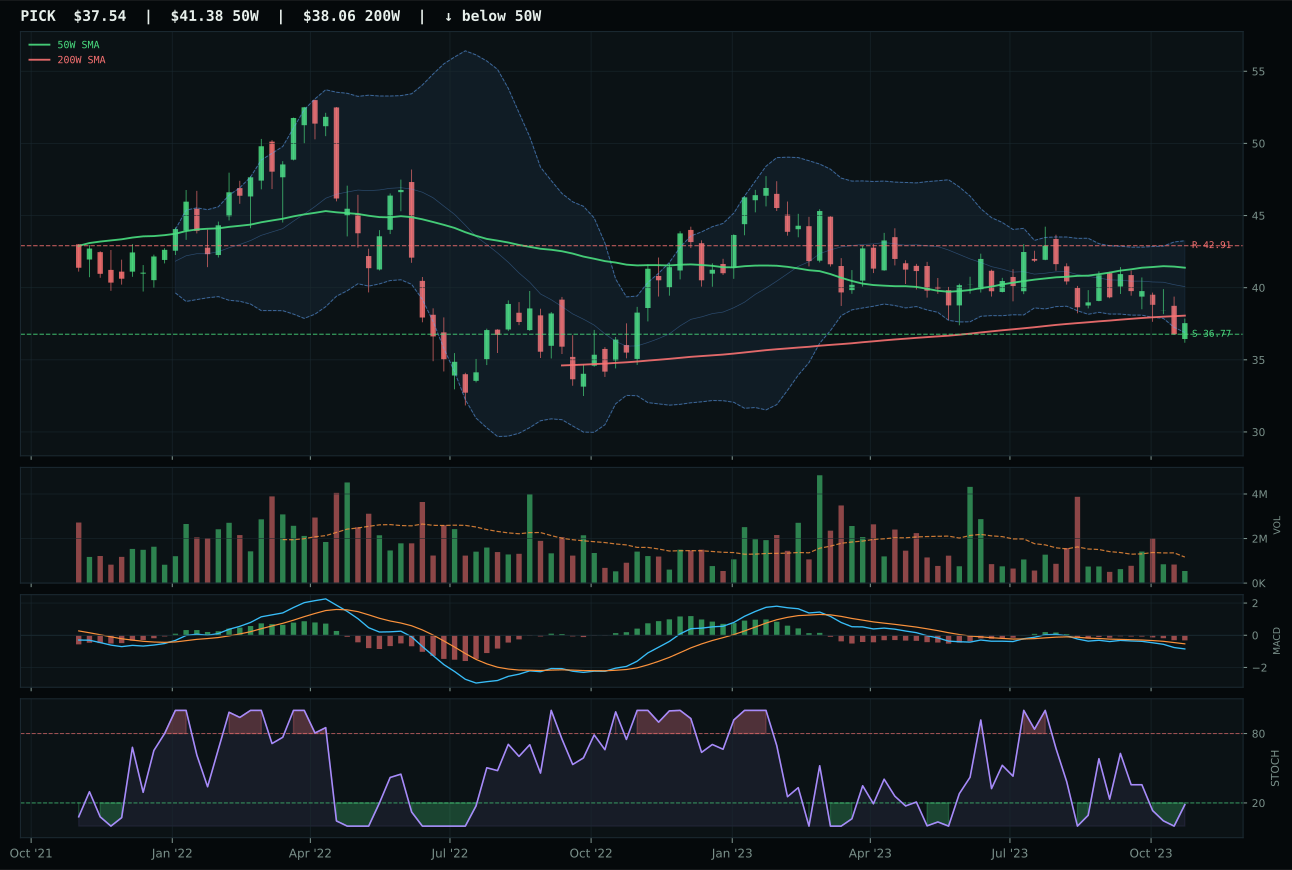
PICK has a pullback into support profile with -2.4% 13-week relative strength versus SPY.
A failed hold above support would weaken the setup.
Actionable but governed by invalidation levels.
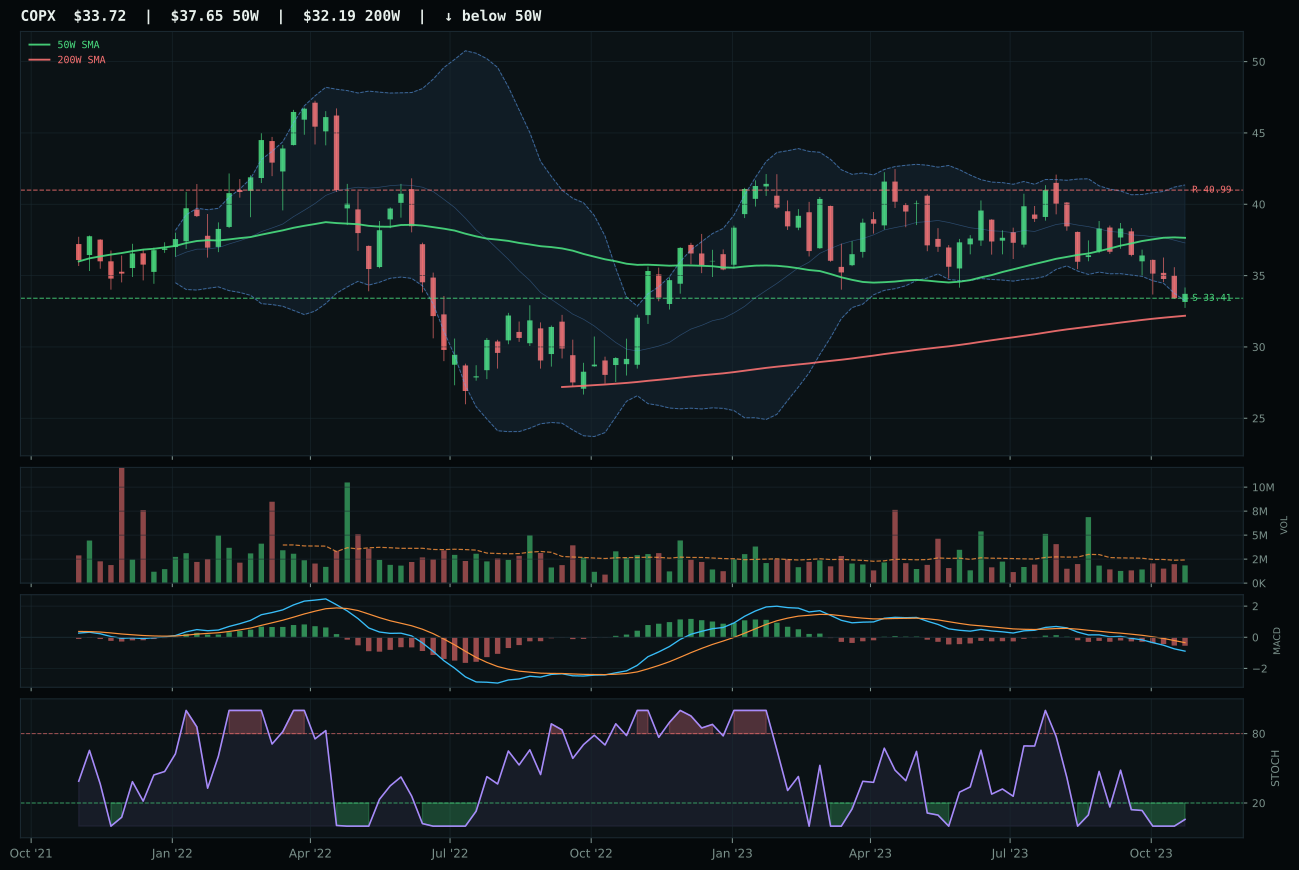
COPX has a pullback into support profile with -7.6% 13-week relative strength versus SPY.
A failed hold above support would weaken the setup.
Actionable but governed by invalidation levels.
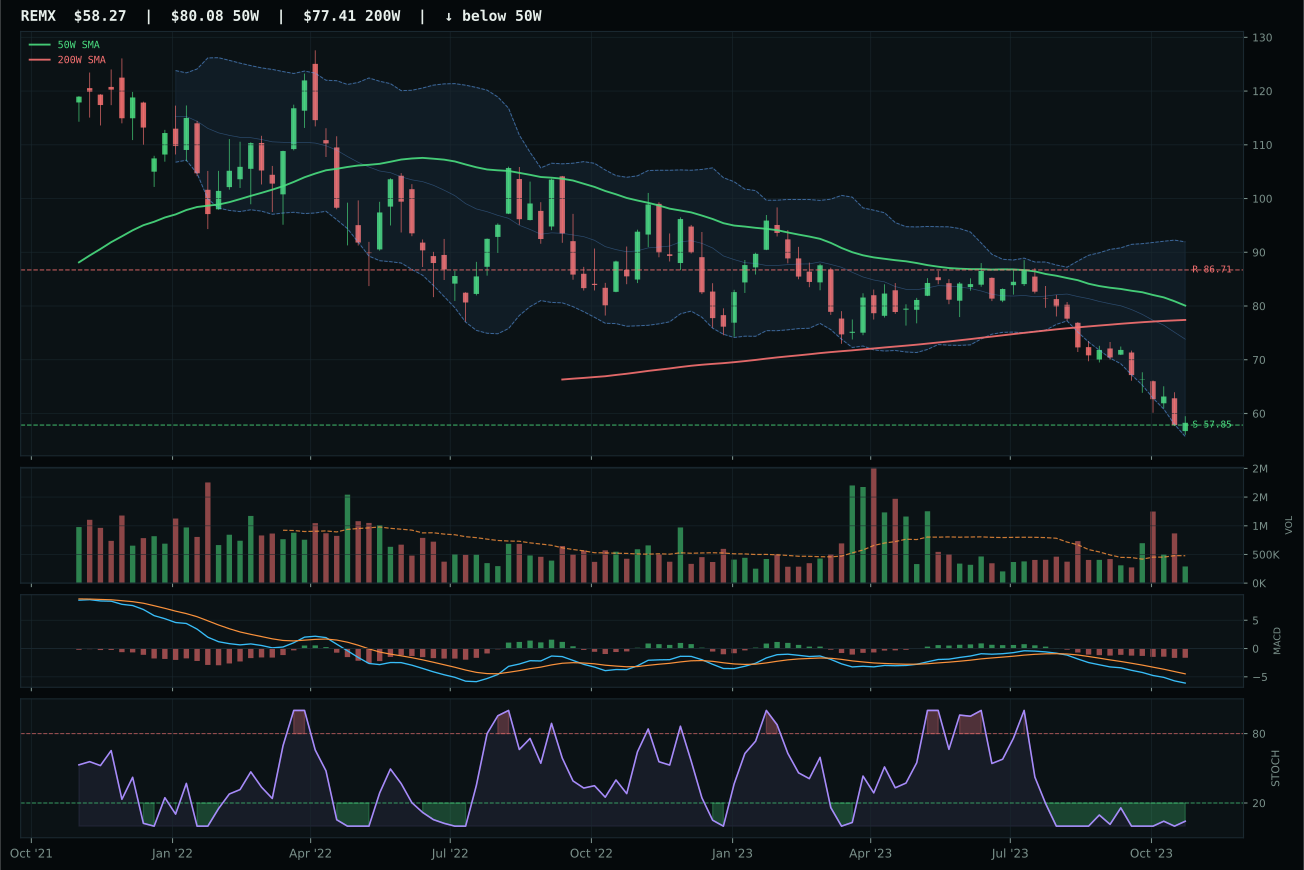
REMX has a pullback into support profile with -18.3% 13-week relative strength versus SPY.
A failed hold above support would weaken the setup.
Actionable but governed by invalidation levels.
COPX edged PICK by just 3.9 points in a category where the winner is still toxic: 11.1 final score, 0% allocation. COPX's advantage came from superior risk-reward (98.0 vs. 90.0) where upside to resistance at 40.99 was -17.7% away but downside to support at 33.41 was only 0.9% above—the classic value-trap setup of a commodity in freefall. Neutral volume at 0.76x the 20W average beat PICK's thin participation, technically, but both were trading on the premise that support holds, not that buyers are committed. COPX's -7.6% RS versus SPY and -17.7% 13-week return told the story: this is a broken name with stochastic RSI oversold turn up at 0.06, which is the only technical mercy—a bottom reversal *could* form here. Trend scored 35.6 (price below 50W, above 200W), timing scored 81.0 from the Fibonacci 0.618 deep retracement, but momentum confirmation was 0.0 because nothing in the past four weeks or thirteen weeks supported current prices.
Industrial Metals received 0% allocation, ranked 9th or 10th, driven by category-level macro fit of 35.0/100 and active liquidity stress at -8 points plus dollar pressure at -7 points. Disinflation is structurally hostile to copper and industrial metals (weaker demand, lower input costs), and the reasoned ETF proof order (PICK 34.9, COPX 29.0, REMX 11.3) reveals cascading weakness—REMX scored only 11.3, a signal that no leg of this category has technical merit. COPX's risk-reward offering 98.0 is a siren song in a liquidity crisis: the trade says upside is distant and downside is proximate, so *mathematically* the payoff is good, but in a market where everyone is liquidating commodity hedges simultaneously, support breaks when it shouldn't. To earn allocation, COPX needs either a 50% move in copper futures (reversing the macro headwind) or a structural shift in dollar direction. Currently, the dollar is buoyant in a flight-to-quality trade, and that's death for COPX. Allocate 0% and wait for either stochastic RSI to rise mid-zone with confirmed MACD turn, or for copper futures to stabilize above their 50W moving average.