
2023-10-20
Informational purposes only. The content in this report, including allocations, analysis, and commentary, is provided solely for informational and educational purposes. It does not constitute financial advice, investment advice, trading advice, or any other type of advice. Past performance does not guarantee future results. Always conduct your own research and consult a qualified financial professional before making investment decisions.
Slow macro Defensive trigger is active (Transition Defense), but crypto-cycle exposure has priority for this run.
Weekly Allocation
| Ticker | Category | Weight | Role |
|---|---|---|---|
| FBTC | 50% | Overlay | |
| FCG | Traditional Energy | 10% | Top-2 (10%) |
| URNM | Nuclear Energy | 10% | Top-2 (10%) |
| GLD | Precious Metals | 5% | Tier-2 (5%) |
| XAR | Defense & Aerospace | 5% | Tier-2 (5%) |
| INDA | Emerging Markets | 5% | Tier-2 (5%) |
| XLU | Utilities & Infrastructure | 5% | Tier-2 (5%) |
| COPX | Industrial Metals | 5% | Tier-2 (5%) |
| XLK | Technology | 5% | Tier-2 (5%) |
Trade Instructions — Monday Open
Sell the tranche from 2023-09-22 (completing its 4-week hold). Buy the new tranche. Instructions show net portfolio changes — same-asset positions cancel, weight changes show the delta.
| Action | Ticker | Instruction |
|---|---|---|
| SELL | XLE | Sell 33% of XLE position (reduce 7.50% → 5.00%) |
| SELL | MOO | Sell 33% of MOO position (reduce 3.75% → 2.50%) |
| SELL | CIBR | Sell 33% of CIBR position (reduce 3.75% → 2.50%) |
| BUY | FCG | Buy FCG — 50.00% of freed cash (adds 2.50% to portfolio) |
| BUY | INDA | Buy INDA — 25.00% of freed cash (adds 1.25% to portfolio) |
| BUY | XLK | Buy XLK — 25.00% of freed cash (adds 1.25% to portfolio) |
Current Portfolio After Trade
Combined holdings across all 4 active tranches. Each tranche is 25% of the portfolio.
| Ticker | % of Portfolio | Weight Bar |
|---|---|---|
| FBTC | 50.00% | |
| URNM | 10.00% | |
| XLE | 5.00% | |
| XAR | 5.00% | |
| FCG | 5.00% | |
| INDA | 3.75% | |
| MOO | 2.50% | |
| CIBR | 2.50% | |
| GLD | 2.50% | |
| PICK | 2.50% | |
| PAVE | 2.50% | |
| XLK | 2.50% | |
| SLV | 1.25% | |
| IGF | 1.25% | |
| SMH | 1.25% | |
| XLU | 1.25% | |
| COPX | 1.25% |
Macro Regime — Late-Cycle Reflation
Defensive overlay cause is not singular enough to concentrate: the sleeve diversifies across liquidity, monetary defense, and defensive equity exposure while the market resolves the next regime.
Macro Evidence Charts
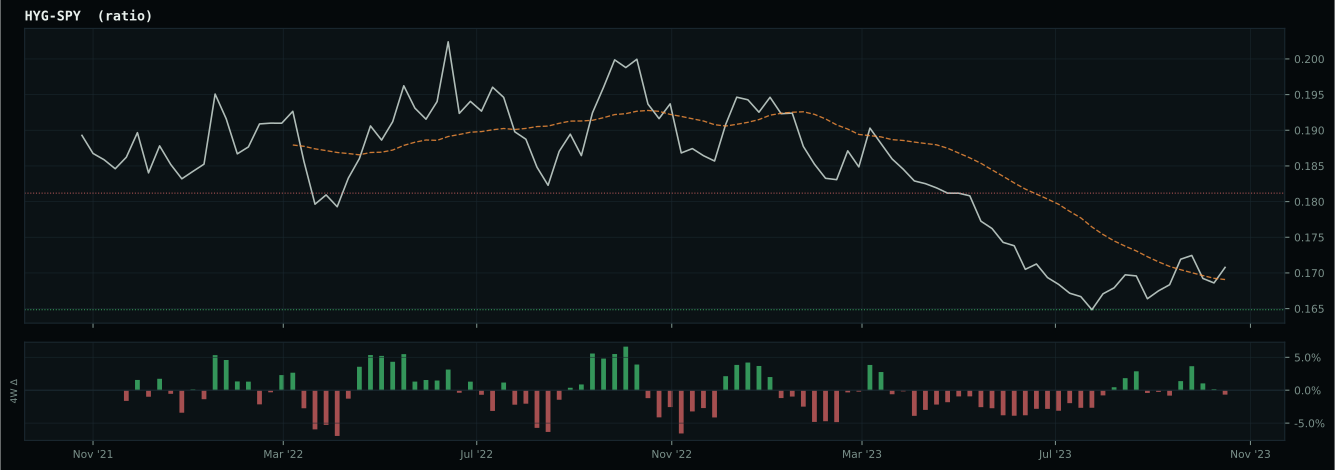
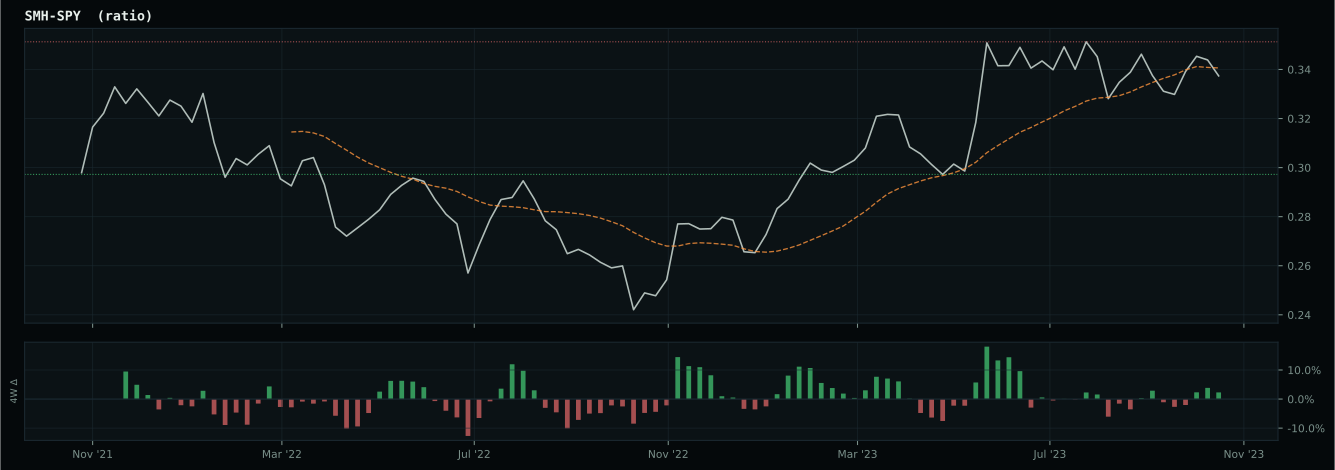
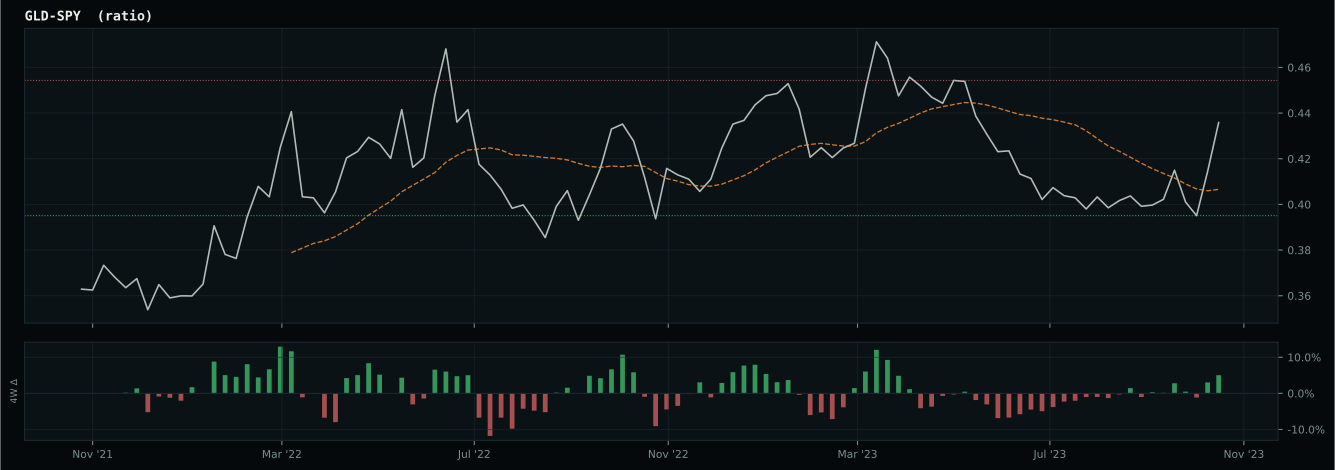
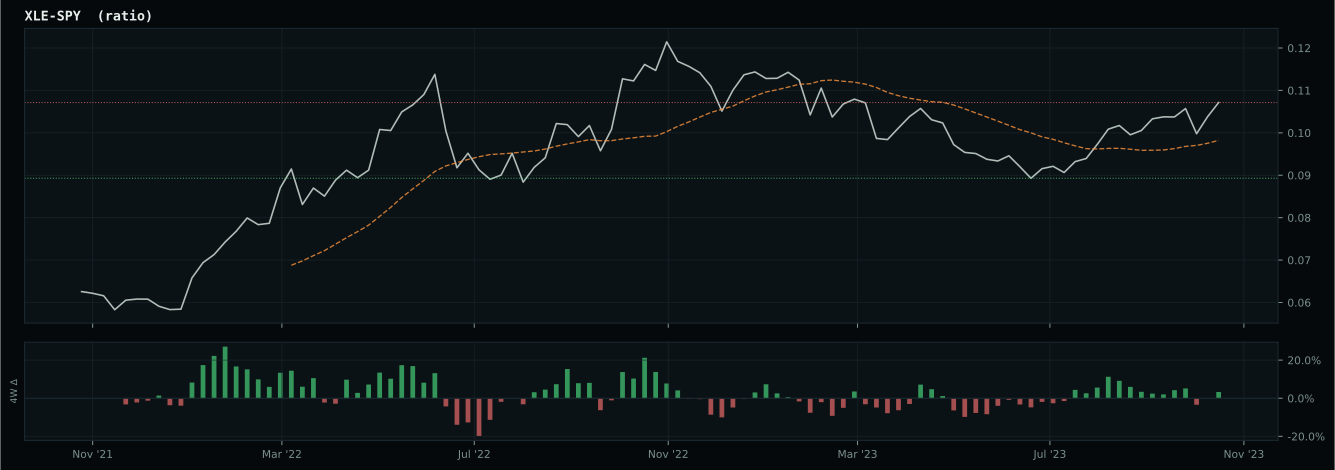
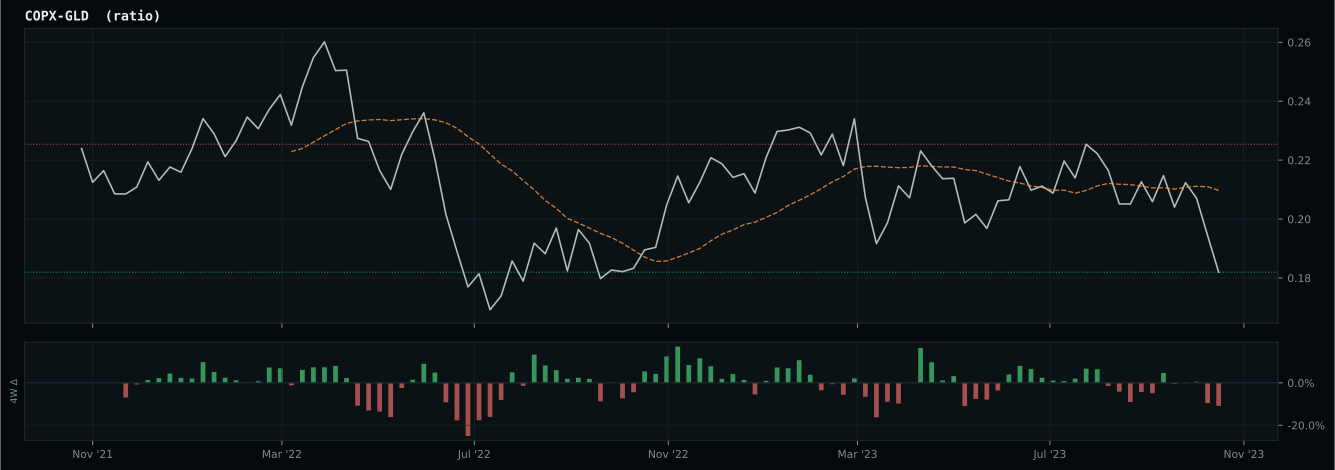
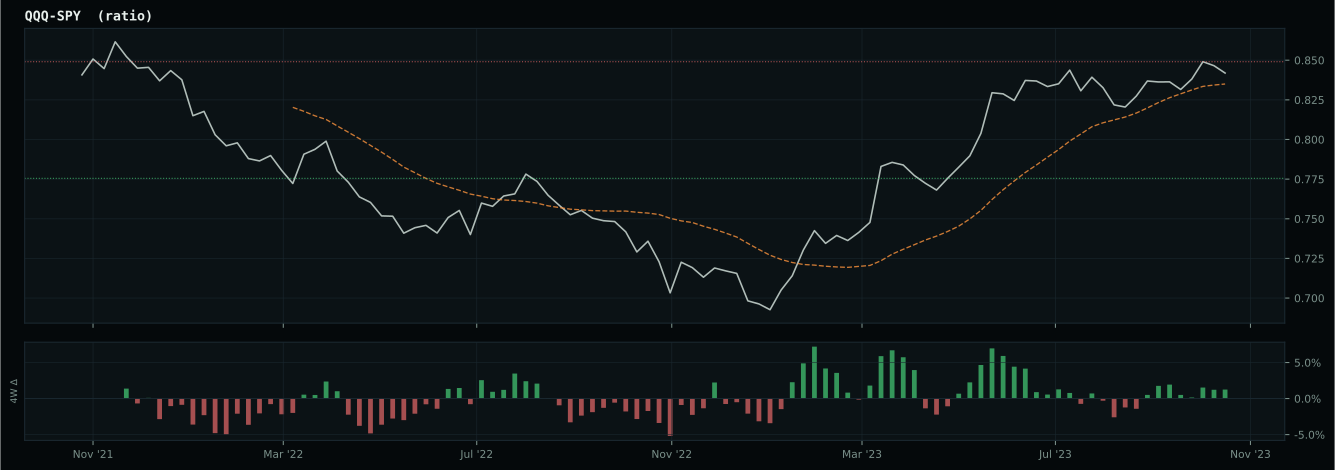
Market-implied signals behind the macro regime scores. Each ratio compares two assets; the direction and slope of the ratio is what the macro engine reads.
Crypto Regime — TrendBTC
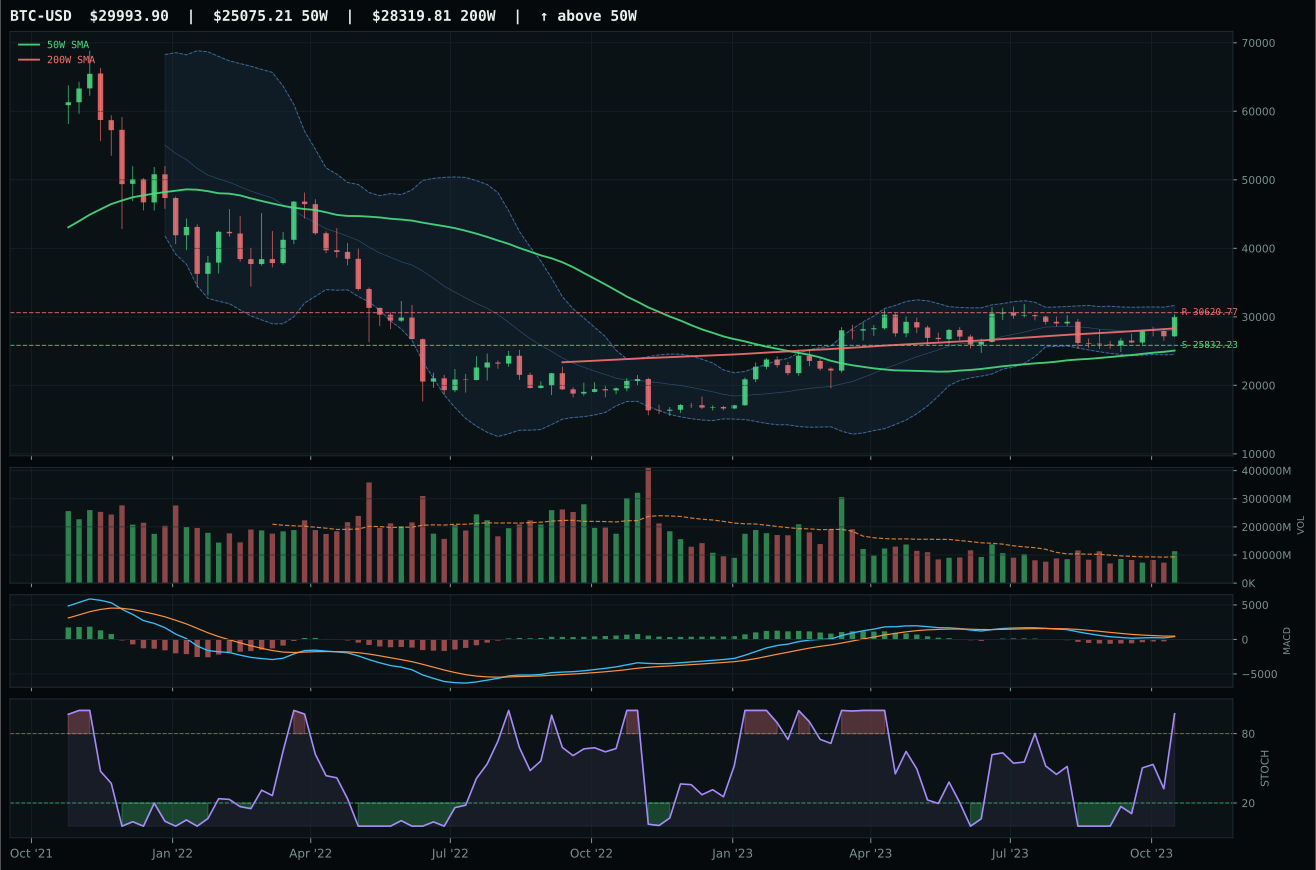
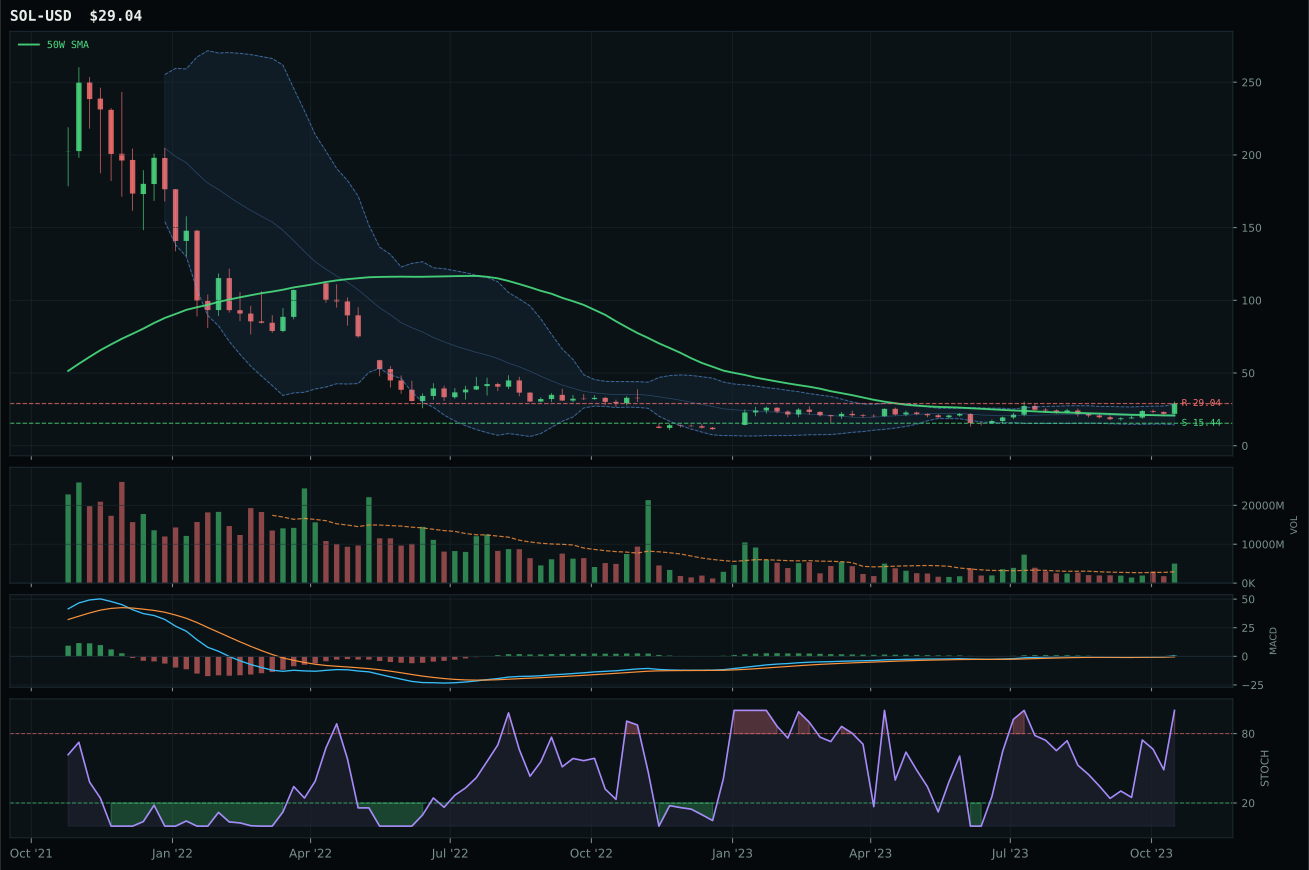
post-touch structure is too wide to count as a range; max/min close ratio is 1.88
TrendBTC confirmed: 2 consecutive closes above rising/flat 50W SMA
one or more available conditions failed
Category Rankings
| Rank | Category | Winner | Score | Alloc | 4W Ret | Peers (4W) |
|---|---|---|---|---|---|---|
| 1 | Traditional Energy | FCG | 78.2 | 20% | -5.26% | XOP -5.2% · XLE -5.2% |
| 2 | Nuclear Energy | URNM | 71.2 | 20% | +13.66% | URA +14.5% · NLR +10.4% |
| 3 | Precious Metals | GLD | 44.7 | 10% | -0.65% | SLV +1.0% · GDX -3.8% |
| 4 | Defense & Aerospace | XAR | 32.5 | 10% | +9.33% | ROKT +5.9% · ITA +8.8% |
| 5 | Utilities & Infrastructure | XLU | 30.6 | 10% | +7.83% | IGF +9.2% · PAVE +8.8% |
| 6 | Industrial Metals | COPX | 28.4 | 10% | +2.87% | PICK +10.5% · REMX +4.1% |
| 7 | Technology | XLK | 27.5 | 10% | +12.34% | CIBR +7.7% · IGV +11.5% |
| 8 | Agriculture & Livestock | MOO | 19.6 | 10% | +2.15% | WEAT -5.6% · VEGI +3.0% |
| 9 | AI | SMH | 6.5 | 0% | +15.34% | AIQ +12.0% · BOTZ +13.6% |
| 10 | Emerging Markets | INDA | — | 0% | +2.84% | IEMG +8.3% · ILF +14.0% |
Traditional Energy — FCG
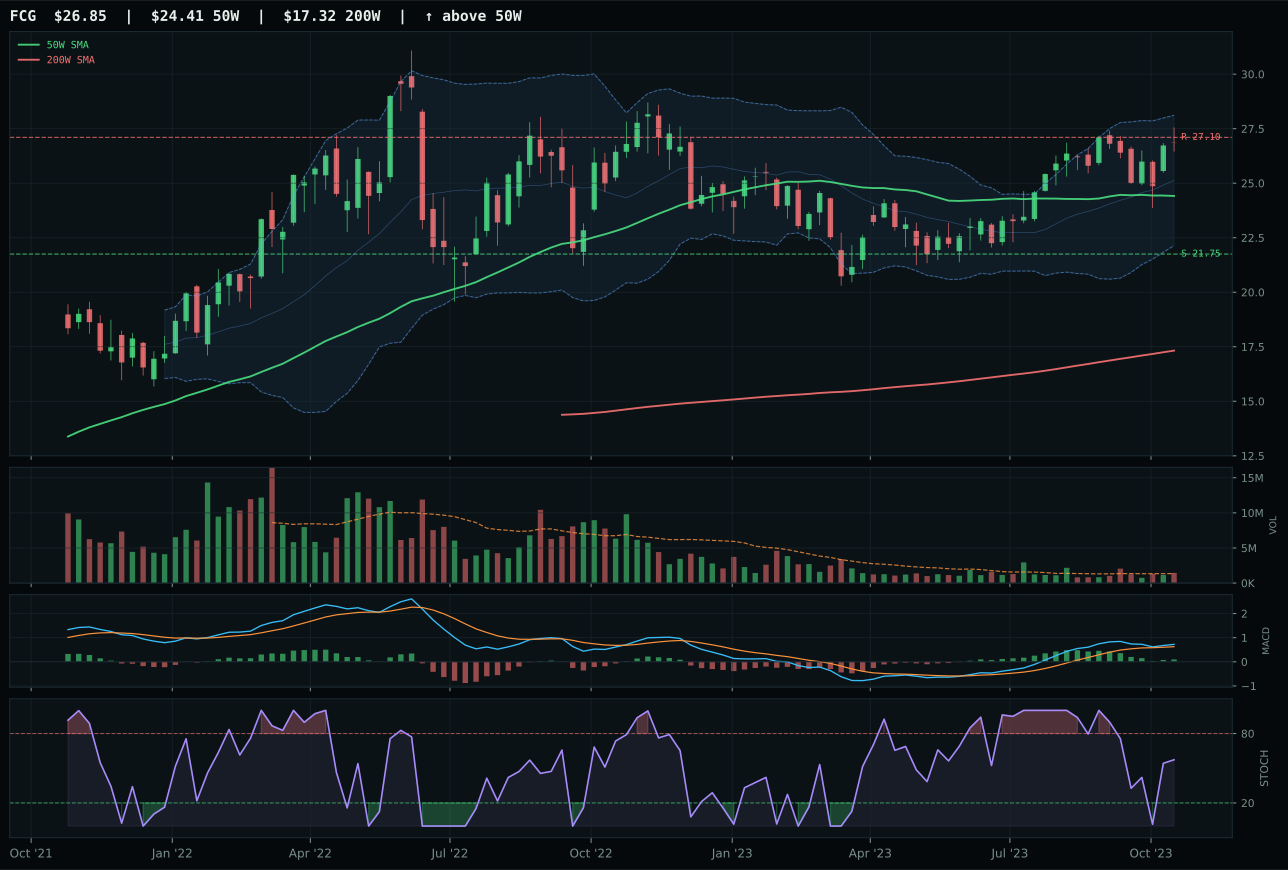
FCG has a neutral structure profile with 16.1% 13-week relative strength versus SPY.
A failed hold above support would weaken the setup.
Actionable but governed by invalidation levels.
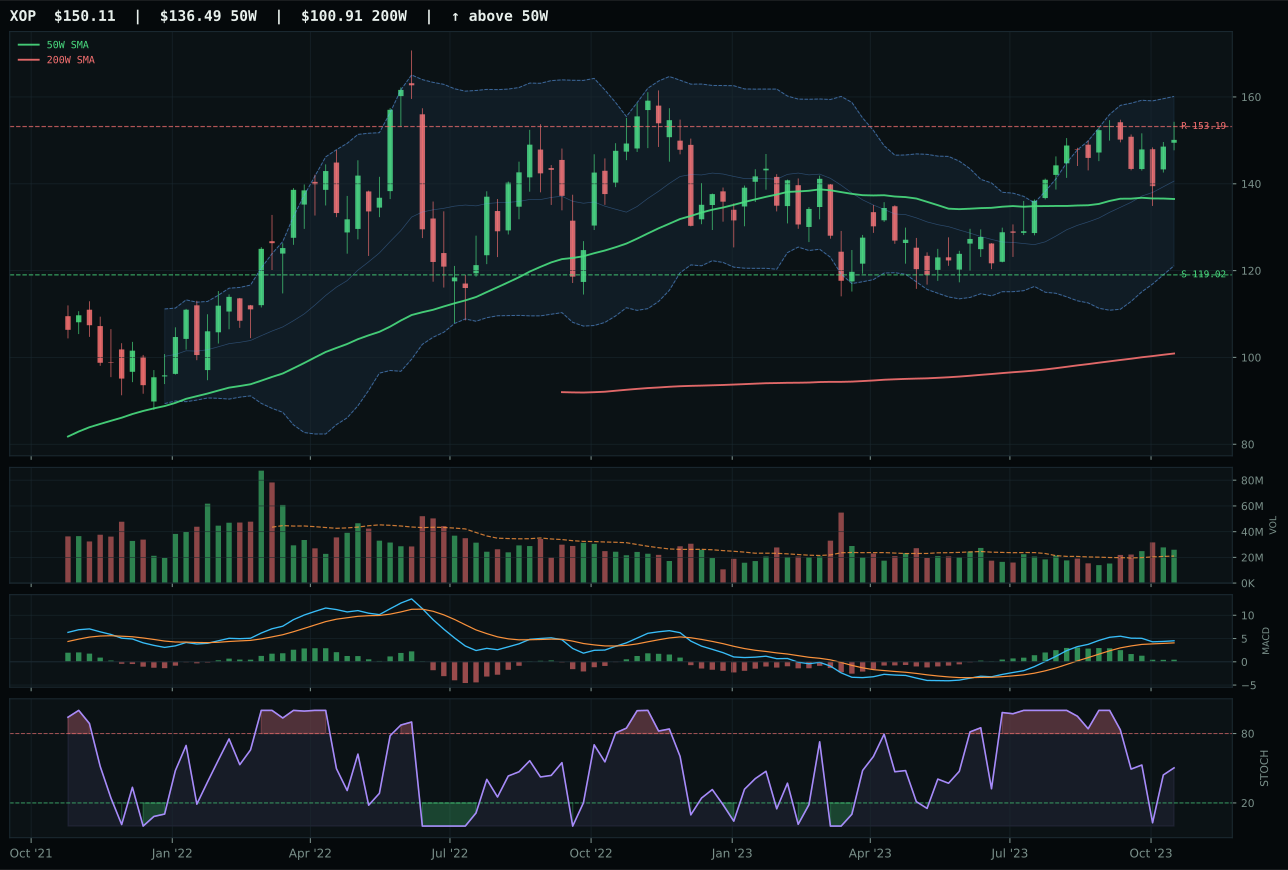
XOP has a neutral structure profile with 17.2% 13-week relative strength versus SPY.
A failed hold above support would weaken the setup.
Actionable but governed by invalidation levels.
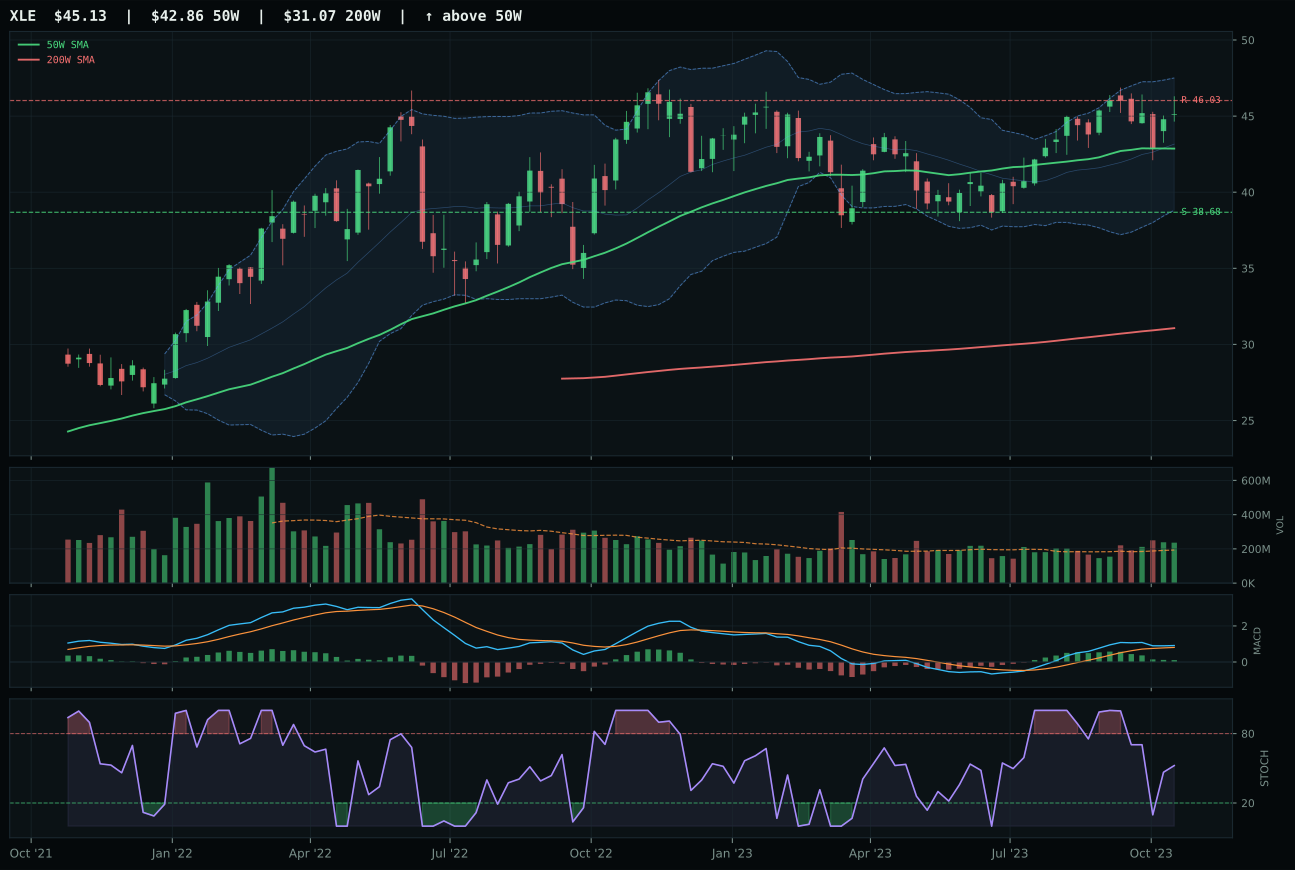
XLE has a neutral structure profile with 13.9% 13-week relative strength versus SPY.
A failed hold above support would weaken the setup.
Actionable but governed by invalidation levels.
FCG wins by a hair—just 0.2 points over XOP—on the basis of superior timing (78.0 vs 70.0) and stochastic RSI at rising mid-zone (0.57) versus XOP's falling/neutral. Both are strong performers with identical trend scores of 96.0 and momentum confirmation at 100.0, backed by 13W returns of 9.2% and 10.3% respectively and RS versus SPY of 16.1% and 17.2%. The setup is neutral structure but near-perfect positioning: price is 10.0% above the 50-week moving average (extended but not stretched), MACD is bullish but flattening (suggesting momentum is peaking), and volume is neutral at 1.06x average. FCG's stochastic RSI at 0.57 rising provides fractional evidence of fresh momentum, while XOP's stochastic at neutral is a yellow flag for potential momentum divergence. Both names sit against resistance with thin upside (less than 1% to the top), meaning new buyers are paying full price for an extended move. The win goes to FCG on the basis of slightly better technical momentum confirmation.
Traditional Energy is allocated 10% as a top-2 overweight, a position that reflects its 78.2 category score—the second-highest eligible score in the portfolio this week. Energy scarcity is the macro driver: that descriptor is active at +16 for the category level, combined with late-cycle reflation at +12 and real asset sponsorship at +7, creating a 71.0/100 macro fit. This puts energy ahead of precious metals on macro grounds, and the technical evidence supports it: FCG's trend score of 96.0, momentum at 100.0, and volume-price confirmation at 75.6/100 signal institutional participation in the move. The risk is entry timing—price is extended 10% above the 50-week line and resistance is just 0.9% away, leaving minimal upside before price hits overhead supply. To sustain the top-2 allocation, FCG needs to break through 27.10 with participation, proving that the energy bid is structural and not tactical. If resistance holds and price rolls over, the allocation should rotate to a lower tier. For now, 10% reflects conviction in energy scarcity as a near-term macro driver within the late-cycle reflation regime.
Nuclear Energy — URNM
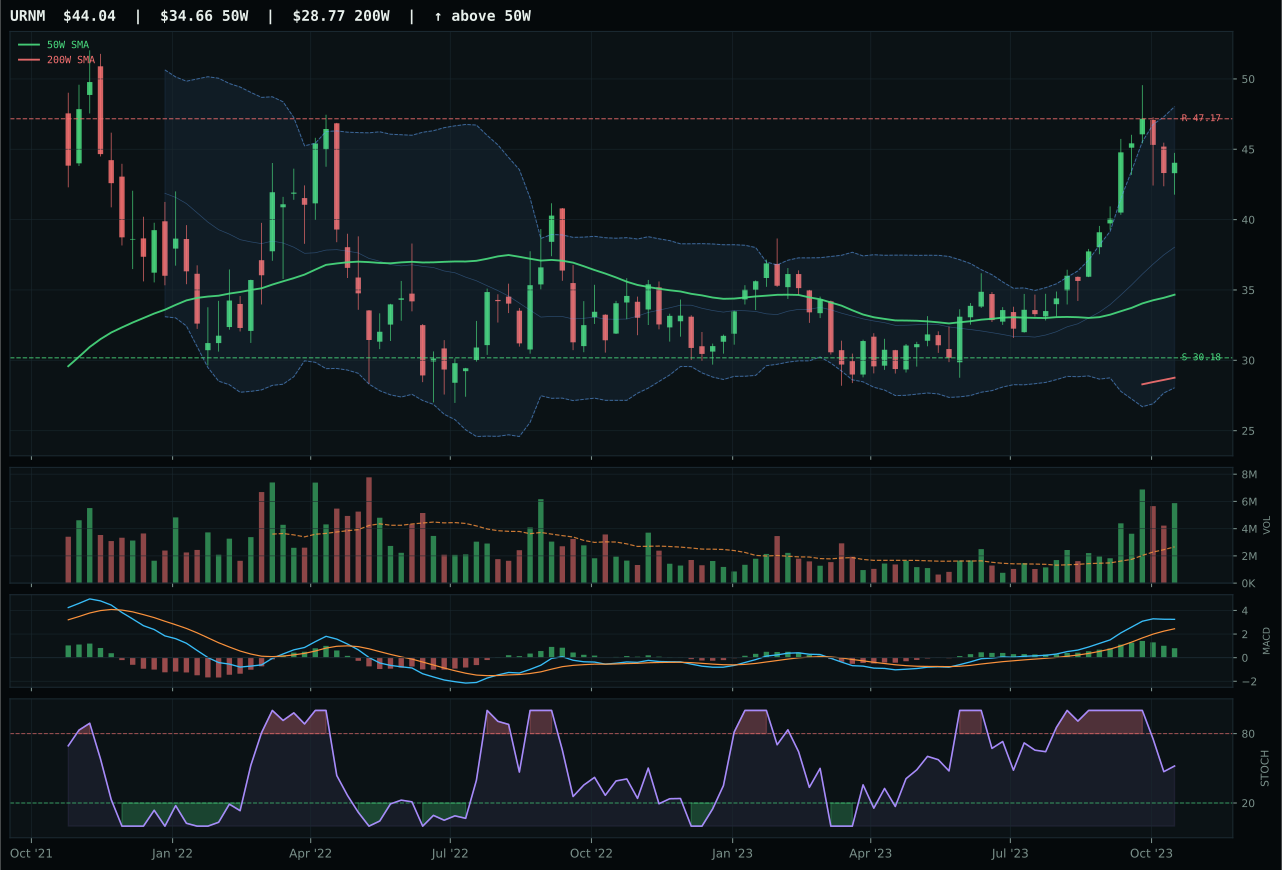
URNM has a vertical extension profile with 39.2% 13-week relative strength versus SPY.
A failed hold above support would weaken the setup.
Actionable but governed by invalidation levels.
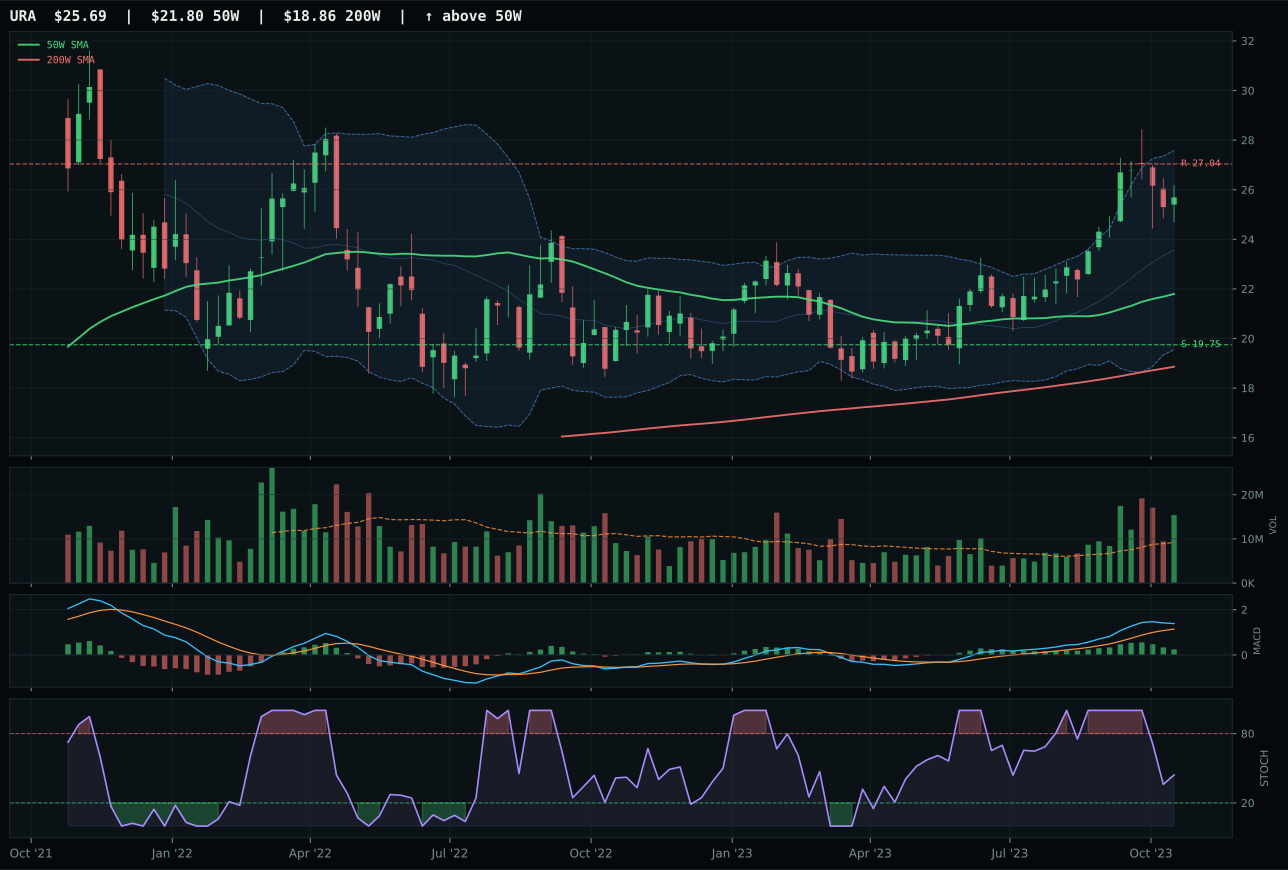
URA has a vertical extension profile with 25.3% 13-week relative strength versus SPY.
A failed hold above support would weaken the setup.
Actionable but governed by invalidation levels.
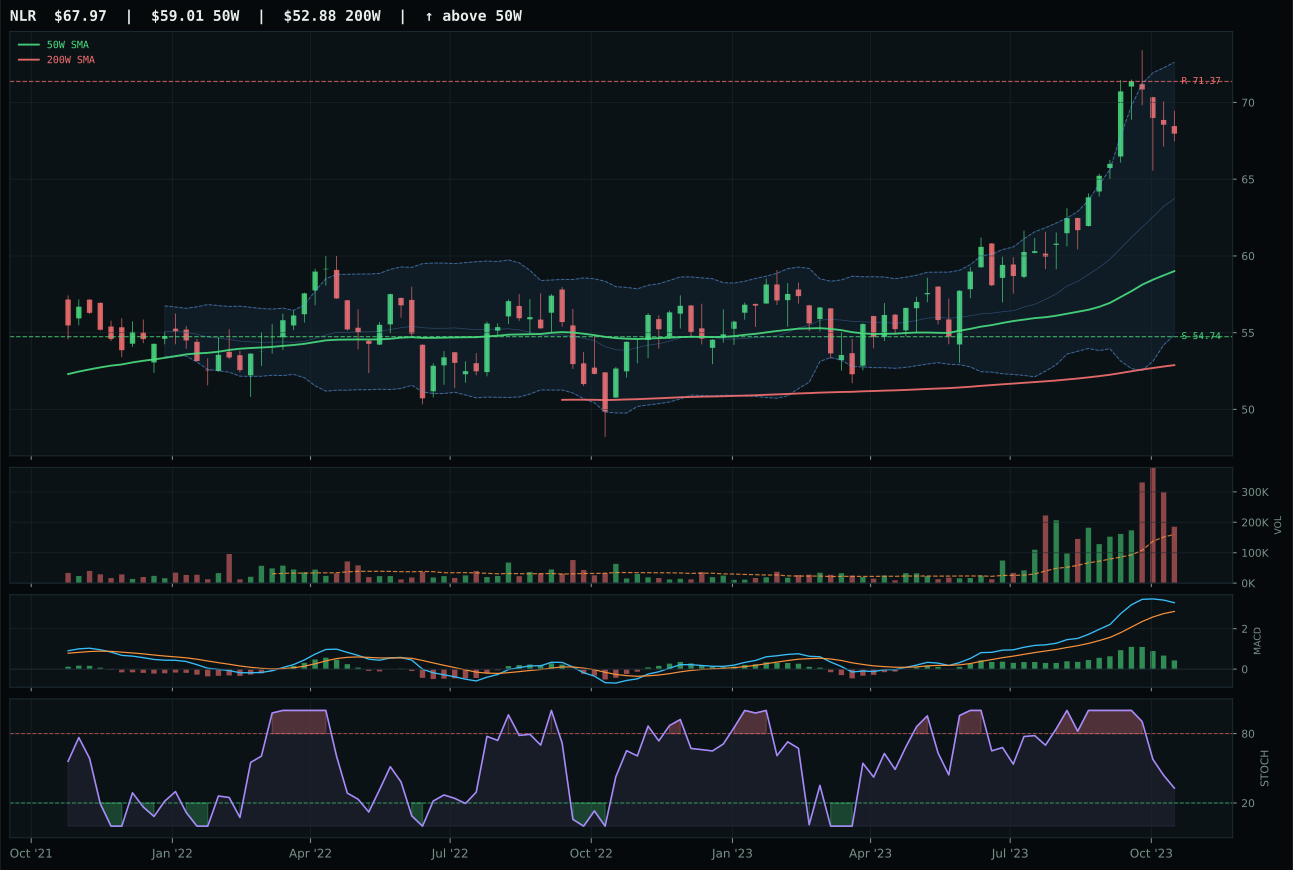
NLR has a vertical extension profile with 19.6% 13-week relative strength versus SPY.
A failed hold above support would weaken the setup.
Actionable but governed by invalidation levels.
URNM dominates the category with extreme relative strength: 39.2% RS versus SPY, 13.9% RS versus category median, and a 32.3% 13-week return that dwarfs its peers. The setup is vertical extension—price sits 27.1% above the 50-week moving average, in the upper Fibonacci zone, which normally signals exhaustion risk. Yet the technical structure is impeccable: trend is perfect at 100.0/100, momentum confirmation is flawless at 100.0/100, volume-price confirmation is 94.9/100, and persistence is 100.0/100. MACD is bullish but flattening (a warning sign), and stochastic RSI is falling/neutral (momentum divergence), but volume is accumulation/confirmation at 2.20x average, indicating that fresh institutional capital is arriving despite the extended price. URA's 25.3% RS versus SPY is strong but trails URNM's 39.2% materially; the gap signals that URNM is capturing superior inflows. This is not a mean-reversion candidate; it is a genuine scarcity beta capturing energy transition tailwinds.
Nuclear Energy is allocated 10% as a top-2 overweight, matching traditional energy's tier despite a lower category score of 71.2. The allocation reflects energy scarcity at +9, real asset sponsorship at +7, and late-cycle reflation at +7, creating a 61.0/100 macro fit—respectable but not exceptional. What elevates nuclear to top-2 is URNM's pristine technical execution: the 85.7/100 technical evidence score is the cleanest in the portfolio, with perfect momentum, volume-price confirmation, and persistence scores. The vertical extension (27.1% above the 50-week) is a real risk—timing score is depressed at 48.0/100 precisely because of entry risk. Every new buyer is late, and risk/reward is inverted with only 6.6% upside to resistance but 45.9% downside to support. The allocation to nuclear over other categories is purely technical momentum sponsorship, not macro conviction. If URNM rolls over and closes below 44.50 on distribution volume, the allocation should be rotated immediately; the extended price leaves no room for error. For now, 10% reflects that institutional participation is strong enough to justify following the momentum despite poor entry timing.
Precious Metals — GLD
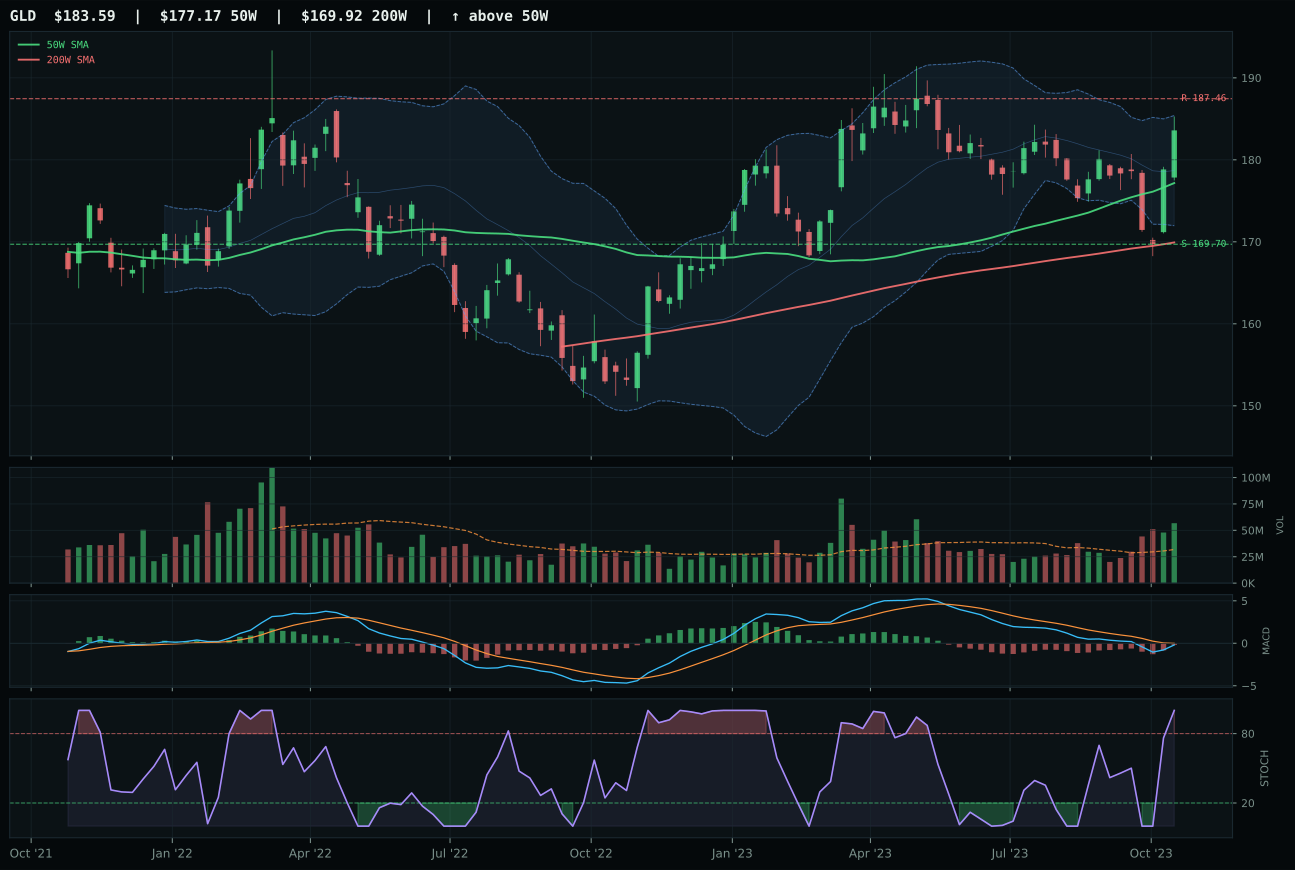
GLD has a neutral structure profile with 7.6% 13-week relative strength versus SPY.
A failed hold above support would weaken the setup.
Actionable but governed by invalidation levels.
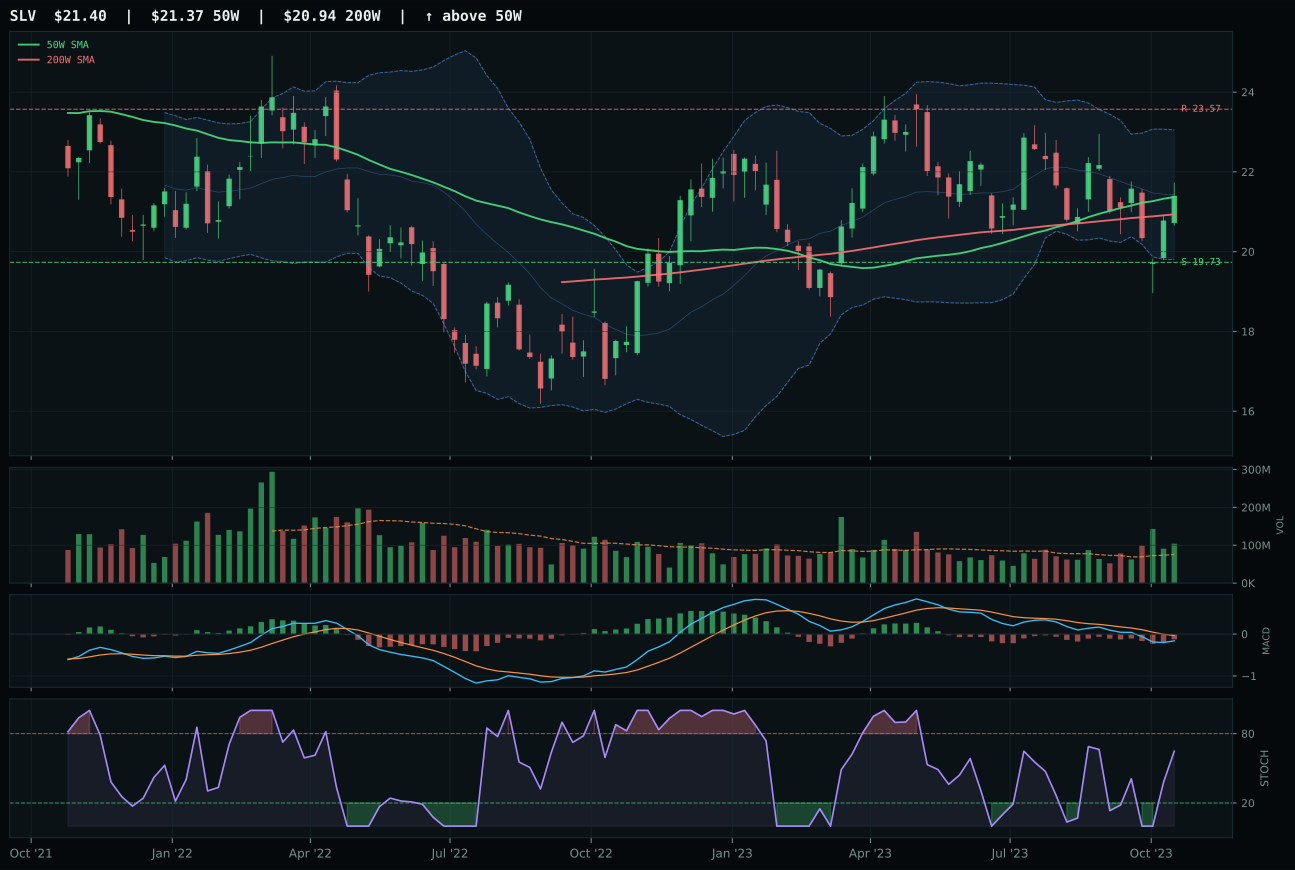
SLV has a compression near 50W profile with 1.7% 13-week relative strength versus SPY.
A failed hold above support would weaken the setup.
Actionable but governed by invalidation levels.
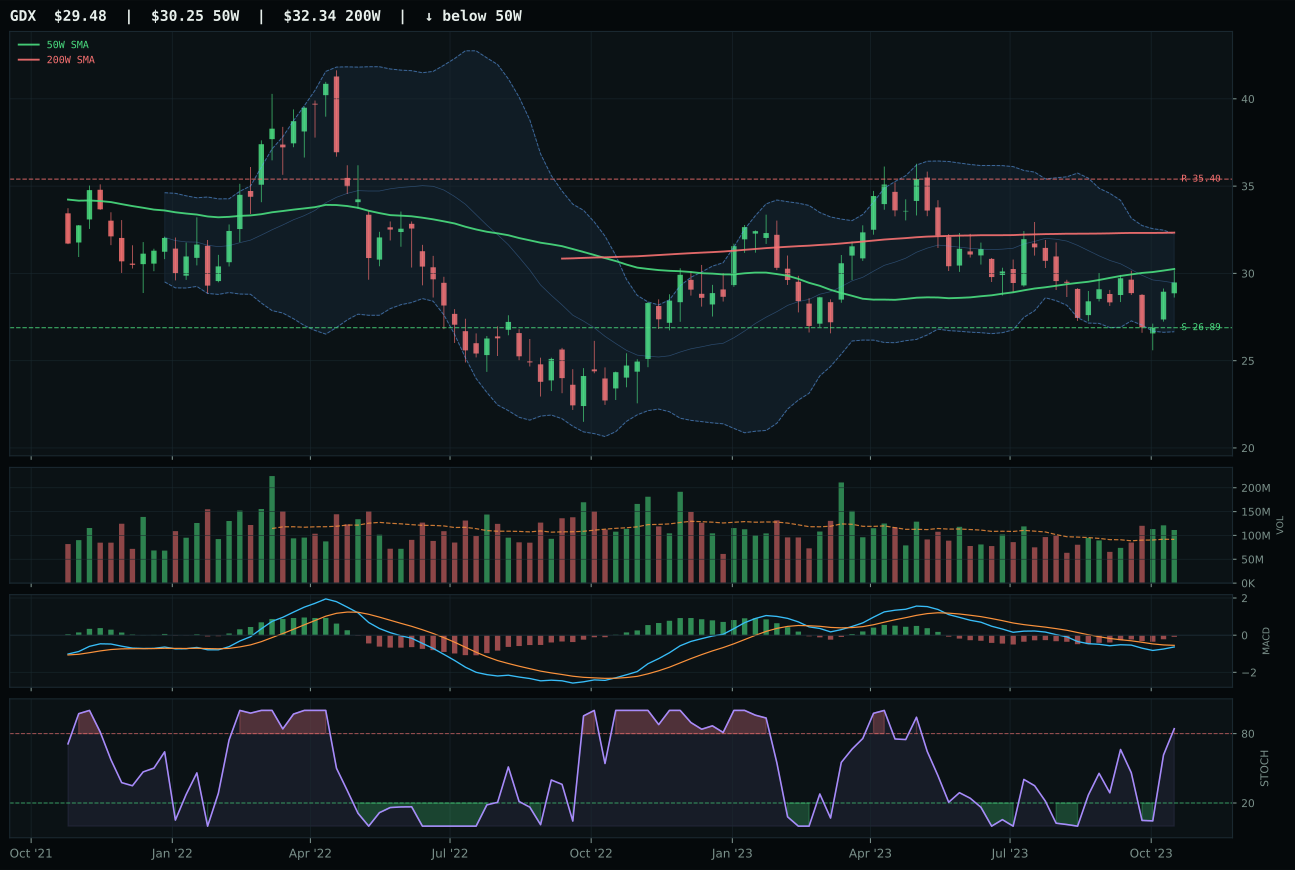
GDX has a compression near 50W profile with 0.5% 13-week relative strength versus SPY.
Extension and support failure are the main tactical risks.
Tracked, but not top-2 eligible because: structurally broken.
GLD captures the category on the strength of perfect trend (100.0/100), dominant momentum confirmation (87.6/100), and pristine volume-price confirmation (90.1/100)—a technical trinity that separates it cleanly from SLV. The gold setup is textbook: price is above both the 50-week and 200-week moving averages, sits 3.6% above the 50-week line (tight and extended but not stretched), and MACD is bearish but improving with stochastic RSI at overbought momentum 1.00. Volume is accumulation/confirmation at 1.78x average, telling the story of institutional inflows behind the move. The 13-week return of 0.8% masks a 4W return of 2.8%, indicating fresh momentum building. Relative strength versus SPY is 7.6%—gold is outperforming equities materially, a signal that risk-off and monetary hedge bids are active. SLV's weakness stems from weaker structure cleanliness (73.4 vs 79.8) and inferior volume confirmation, hamstrung by its dual monetary-industrial identity during a deflationary scare.
Precious Metals earned 5% as a tier-2 position, a natural fit for a portfolio under defensive rotation pressure. The category score of 44.7 is anchored by exceptional macro alignment: monetary hedge bid is active at +14, defensive rotation is active at +7, and dollar pressure is active (+3), creating a 74.0/100 macro fit. This is the highest macro support among the tier-2 categories, signaling that capital flight into precious metals is macro-driven, not technical opportunism. GLD's technical evidence of 94.4/100 is among the cleanest in the portfolio—trend is strong, volume is accumulating, and momentum is positive. The risk is entry price: at 3.6% above the 50-week moving average and overbought on the stochastic, new buyers are entering late. To earn a top-2 slot, gold would need to break 187.46 and sustain above that resistance level on fresh volume, proving that the institutional bid is strong enough to push through the near-term overhead. For now, 5% allocation is appropriate weight to a defensive beta that macro is actively favoring.
Defense & Aerospace — XAR
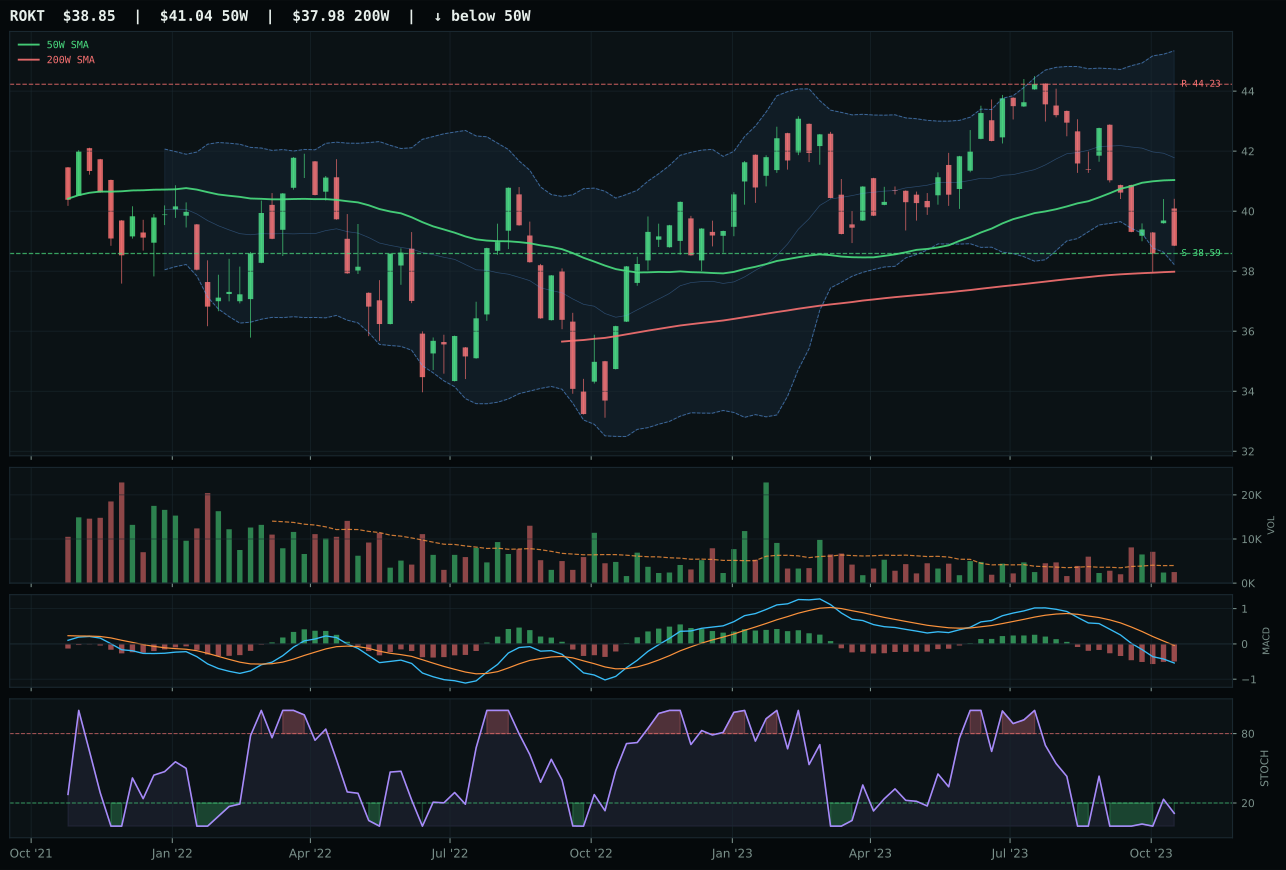
ROKT has a pullback into support profile with -5.3% 13-week relative strength versus SPY.
A failed hold above support would weaken the setup.
Tracked, but not top-2 eligible because: .
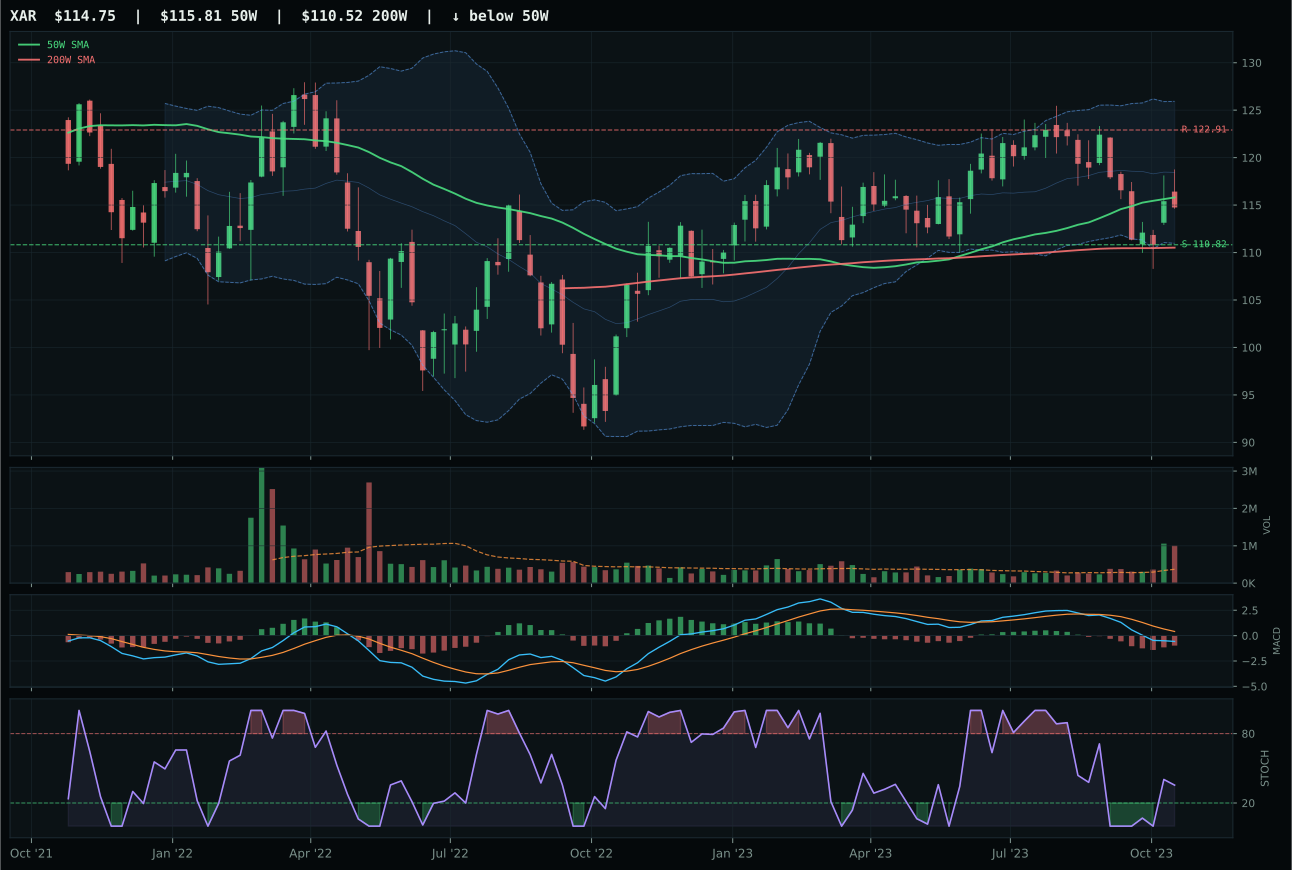
XAR has a pullback into support profile with 0.6% 13-week relative strength versus SPY.
A failed hold above support would weaken the setup.
Actionable but governed by invalidation levels.
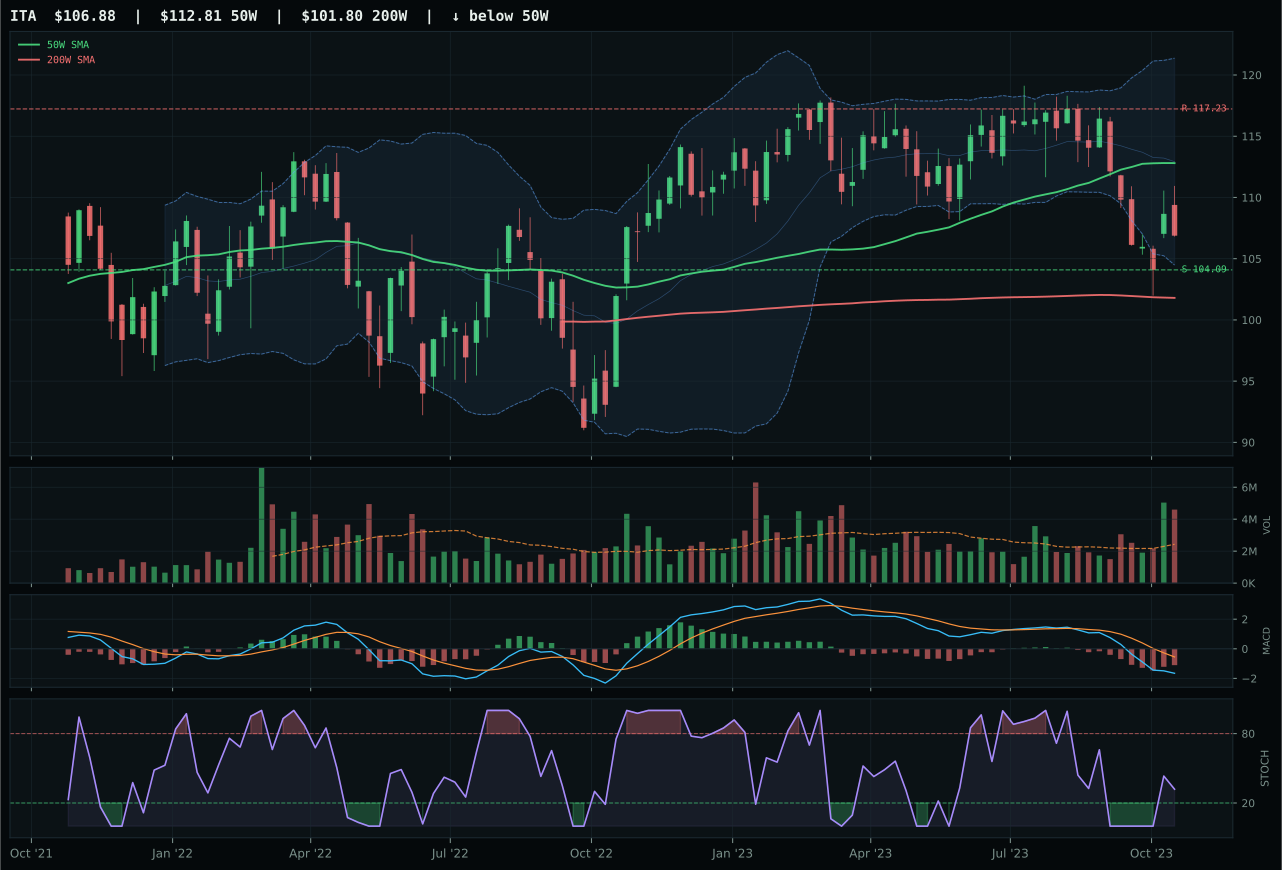
ITA has a pullback into support profile with -1.3% 13-week relative strength versus SPY.
A failed hold above support would weaken the setup.
Actionable but governed by invalidation levels.
XAR dominates its peer set by a decisive 54.4 points, a gap so wide it signals near-complete peer breakdown. The win stems from clean structure (64.2), perfect timing (100.0/100) from price sitting -0.9% below the 50-week line at the middle Fibonacci retracement zone, and superior category-relative strength of 1.9% against ROKT's -4.0%. XAR's MACD is bearish but improving and stochastic RSI is rising mid-zone at 0.35, not yet oversold, which creates the foundation for a higher-probability reversal than what ROKT offers. The 2.70x volume is distribution pressure, but it is clean distribution—not panic—backed by a 3.1% four-week return. Risk/reward is skewed favorably at 78.7/100: downside to support is only 3.5%, while resistance sits 6.6% higher. ROKT, by contrast, is caught in thin volume participation and deep value territory without the technical confirmation to support it.
Defense & Aerospace earned 5% as a tier-2 holding, placing it among the mid-tier categories. The 32.5 category score is anchored by strong macro tailwinds: defensive rotation is active at +8, late-cycle reflation supports the category at +6, and broad market bear provides an additional +6. This macro fit of 74.0/100 is one of the highest in the portfolio, making the category a natural home for capital when growth and technology falter. XAR's technical evidence of 39.8/100 is solid without being spectacular—it is the macro backdrop that elevates the category. The setup is a pullback into support with improving MACD, a textbook mean-reversion candidate in a defensive regime. To earn top-2 status, the category would need XAR to break above resistance at 122.91 with volume confirmation, proving that the pullback was accumulation rather than temporary repair. For now, 5% allocation reflects appropriate weight to a defensive beta that is working with the macro trend.
Utilities & Infrastructure — XLU
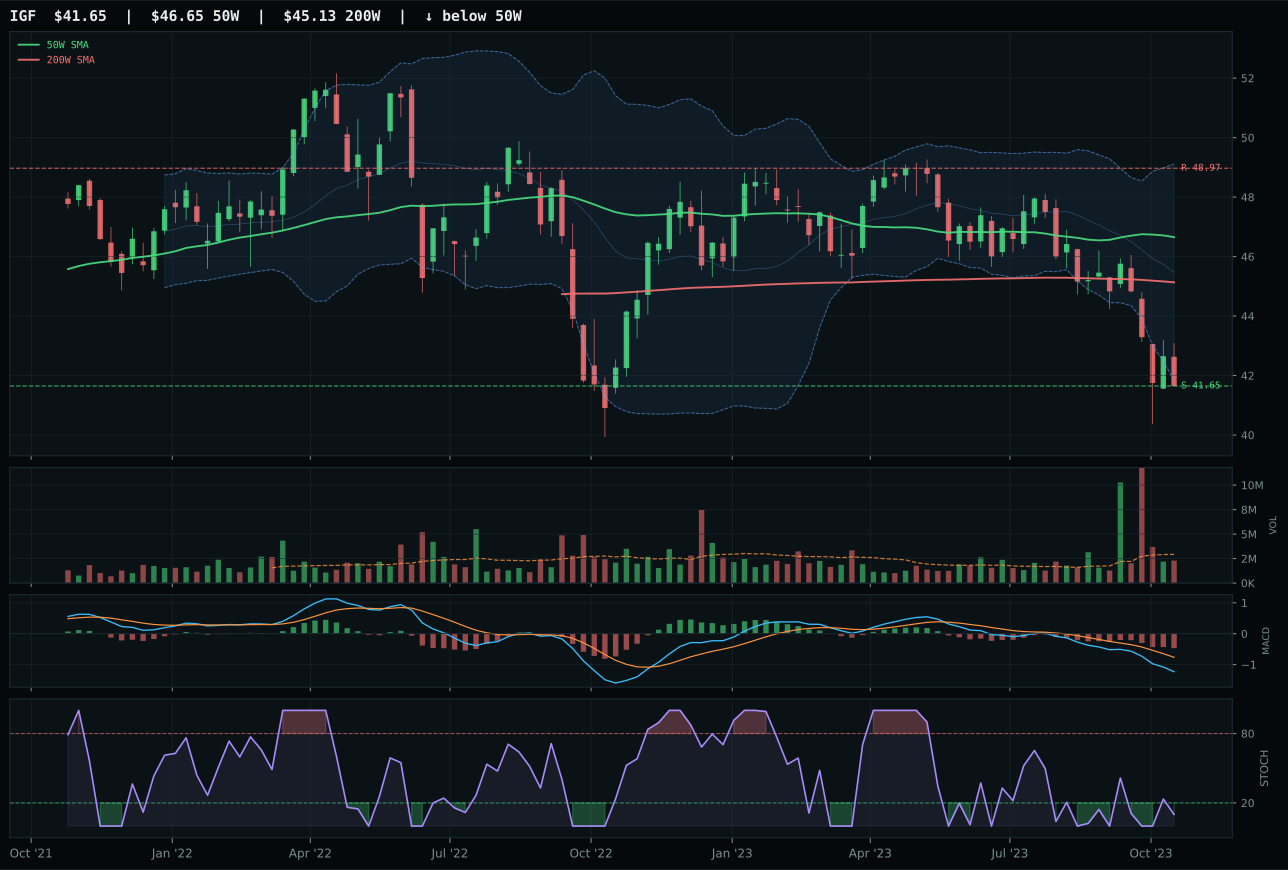
IGF has a pullback into support profile with -6.3% 13-week relative strength versus SPY.
A failed hold above support would weaken the setup.
Actionable but governed by invalidation levels.
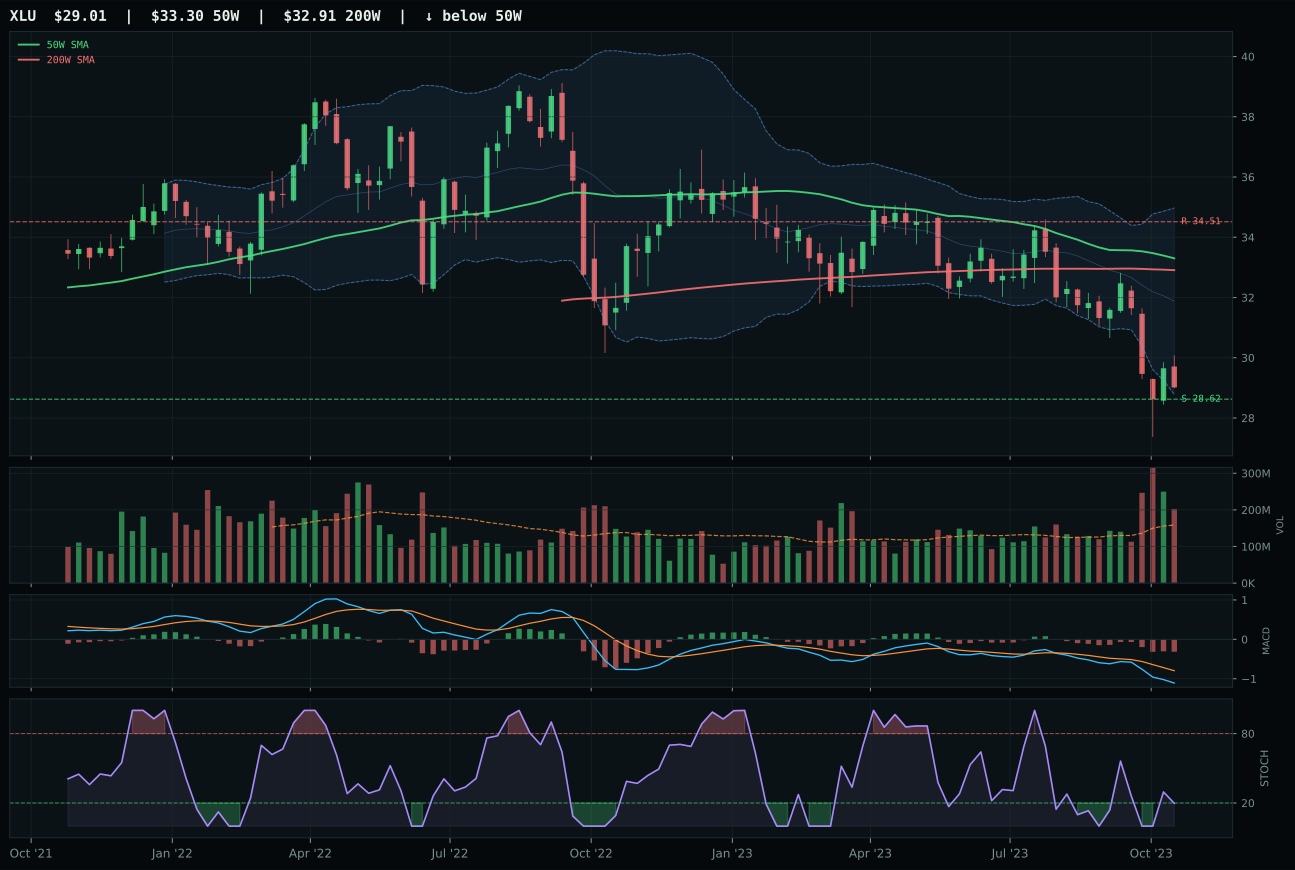
XLU has a pullback into support profile with -8.4% 13-week relative strength versus SPY.
A failed hold above support would weaken the setup.
Actionable but governed by invalidation levels.
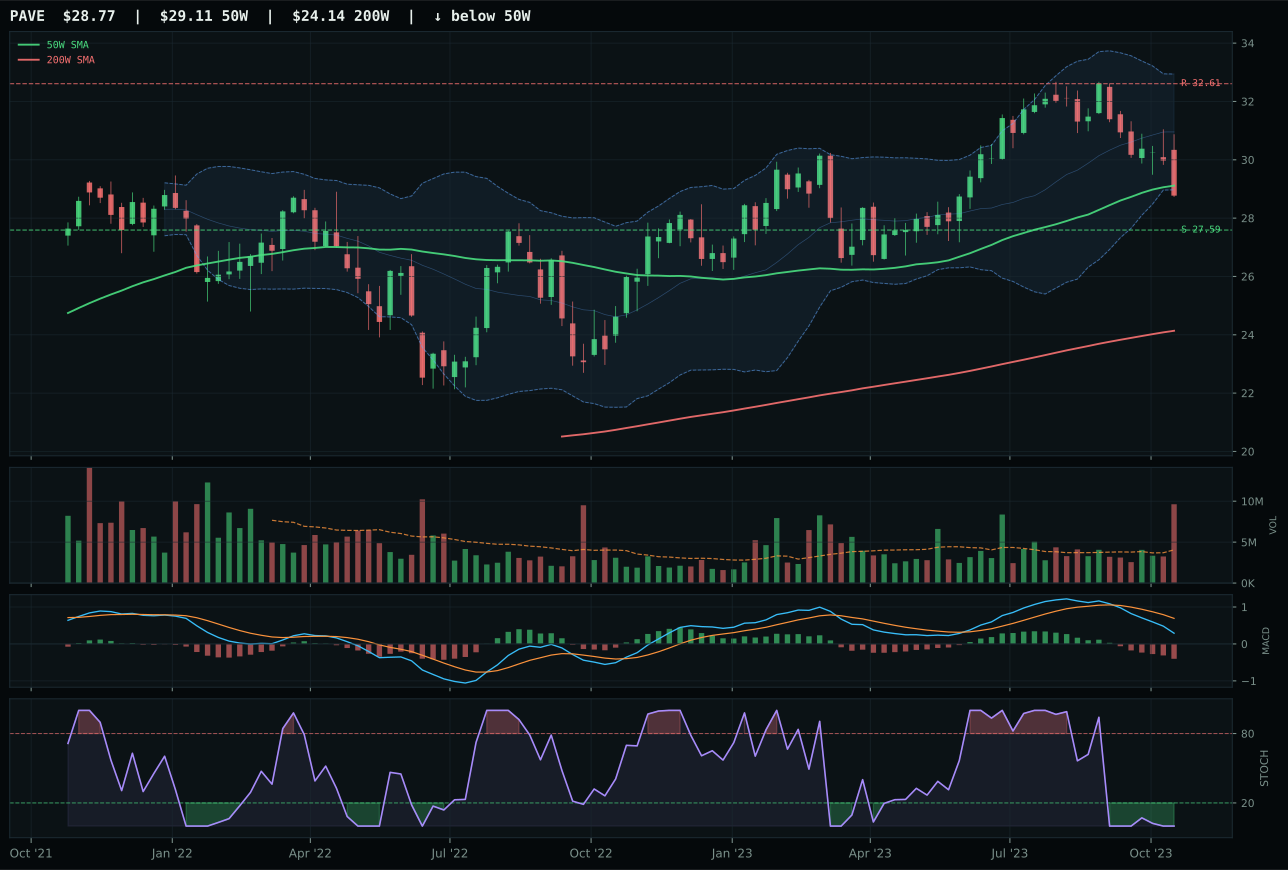
PAVE has a pullback into support profile with -2.9% 13-week relative strength versus SPY.
A failed hold above support would weaken the setup.
Actionable but governed by invalidation levels.
XLU wins its damaged peer set on the basis of superior risk/reward (90.0 vs 78.6 for IGF) and perfect timing (74.0 for both, but stochastic RSI at oversold turn-up provides the edge). The technical picture is dire: XLU is -12.9% below the 50-week moving average, price sits near the 52-week low in the deep repair zone (Fib 0.786), and momentum confirmation is zero with a -15.2% 13W return. MACD is bearish/weakening, and RS versus SPY is -8.4%, indicating sustained under-performance. Yet structure integrity is present: support at 28.62 is clean, compression of 77.0 is solid, and stochastic RSI at 0.20 shows the first signs of oversold turn-up. The above-average participation at 1.28x volume suggests defensive rotation into a known safer asset despite the technical damage. Risk/reward is skewed favorably at 90.0: upside to resistance is capped at -15.9%, but downside to support is just 1.4%. This is a mean-reversion candidate built on exhaustion, not momentum.
Utilities & Infrastructure is allocated 5% as tier-2, a natural home for defensive capital in a late-cycle reflation regime where rate-sensitive income yields remain attractive. The category-level macro fit is 67.0/100, supported by defensive rotation (+12), broad market bear (+4), and the transition/mixed macro descriptor (+4). These macro factors are real, but the technical evidence is weak: XLU's 0.0/100 technical score and 0.0/100 momentum confirmation indicate the position is sizing the mean reversion, not following momentum. Volume-price confirmation is nearly zero at 1.8/100, and persistence is just 17.4/100, signaling that any bounce lacks institutional sponsorship. The 5% allocation is appropriate for a defensive beta that macro favors but technicals have destroyed. To earn a higher allocation, XLU would need to hold support, MACD to inflect bullish, and stochastic RSI to cross above 0.30 with volume confirmation, proving that the selloff was exhaustion and not a structural break in the utility thesis. Until that occurs, this is a tactical position sized for mean reversion within a market defined by defensive rotation pressure.
Industrial Metals — COPX
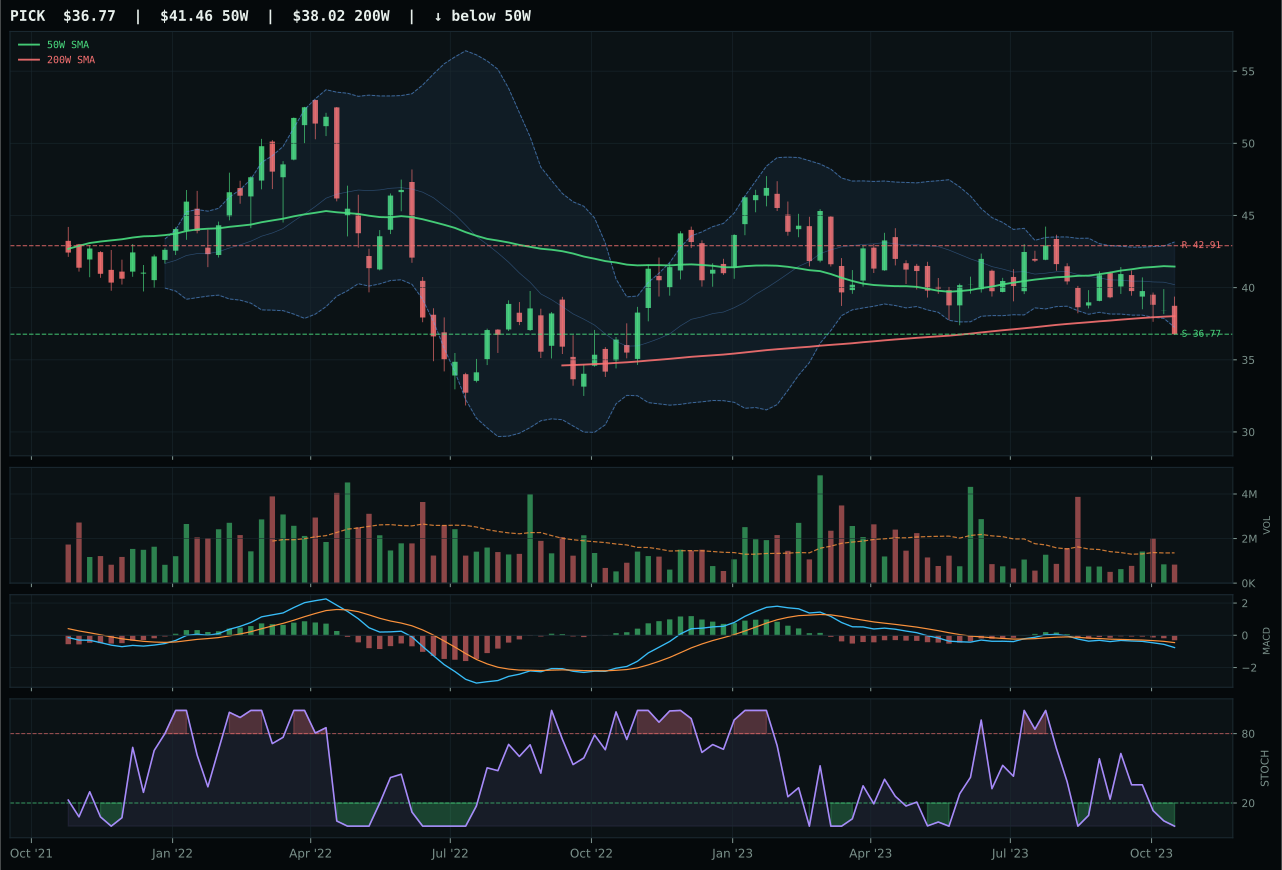
PICK has a pullback into support profile with -5.3% 13-week relative strength versus SPY.
A failed hold above support would weaken the setup.
Actionable but governed by invalidation levels.
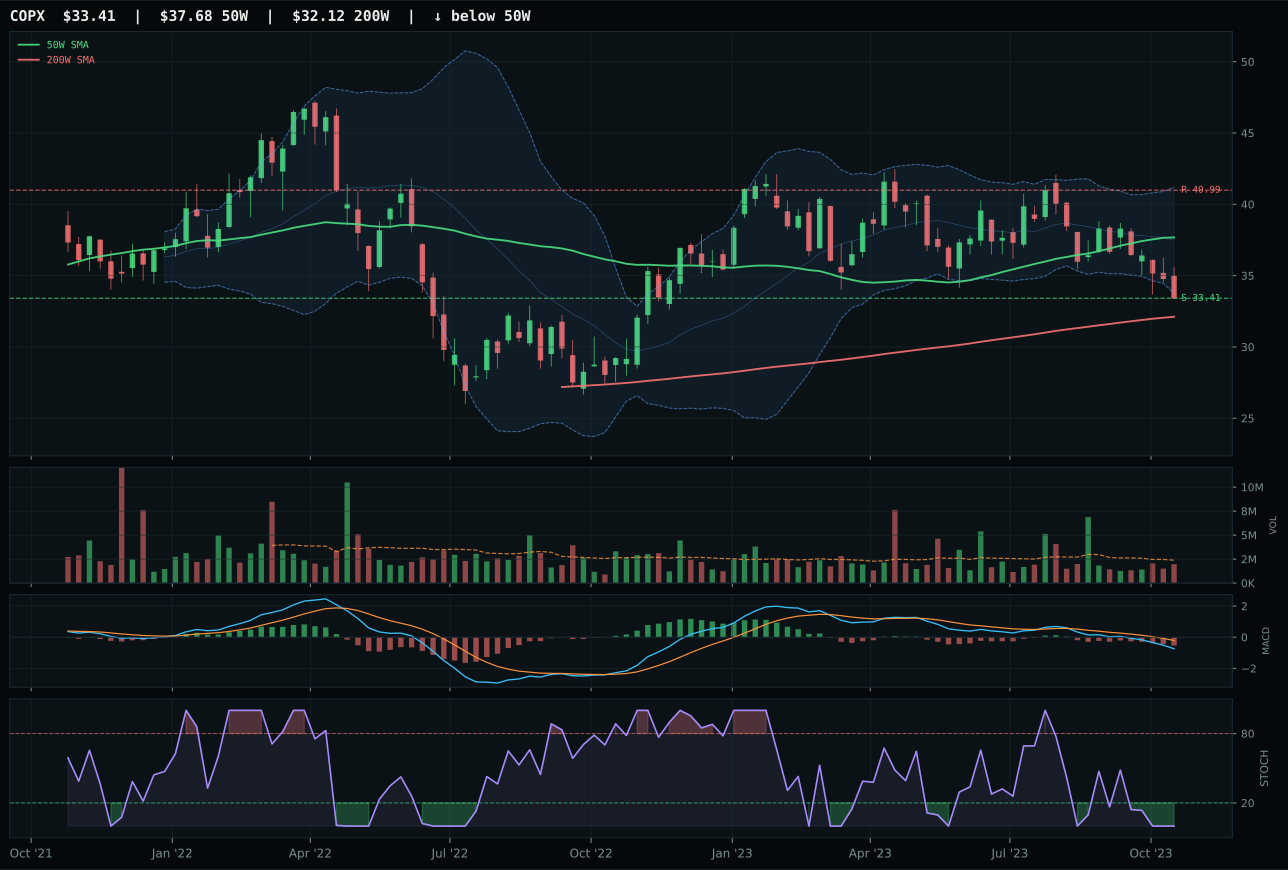
COPX has a pullback into support profile with -7.4% 13-week relative strength versus SPY.
A failed hold above support would weaken the setup.
Actionable but governed by invalidation levels.
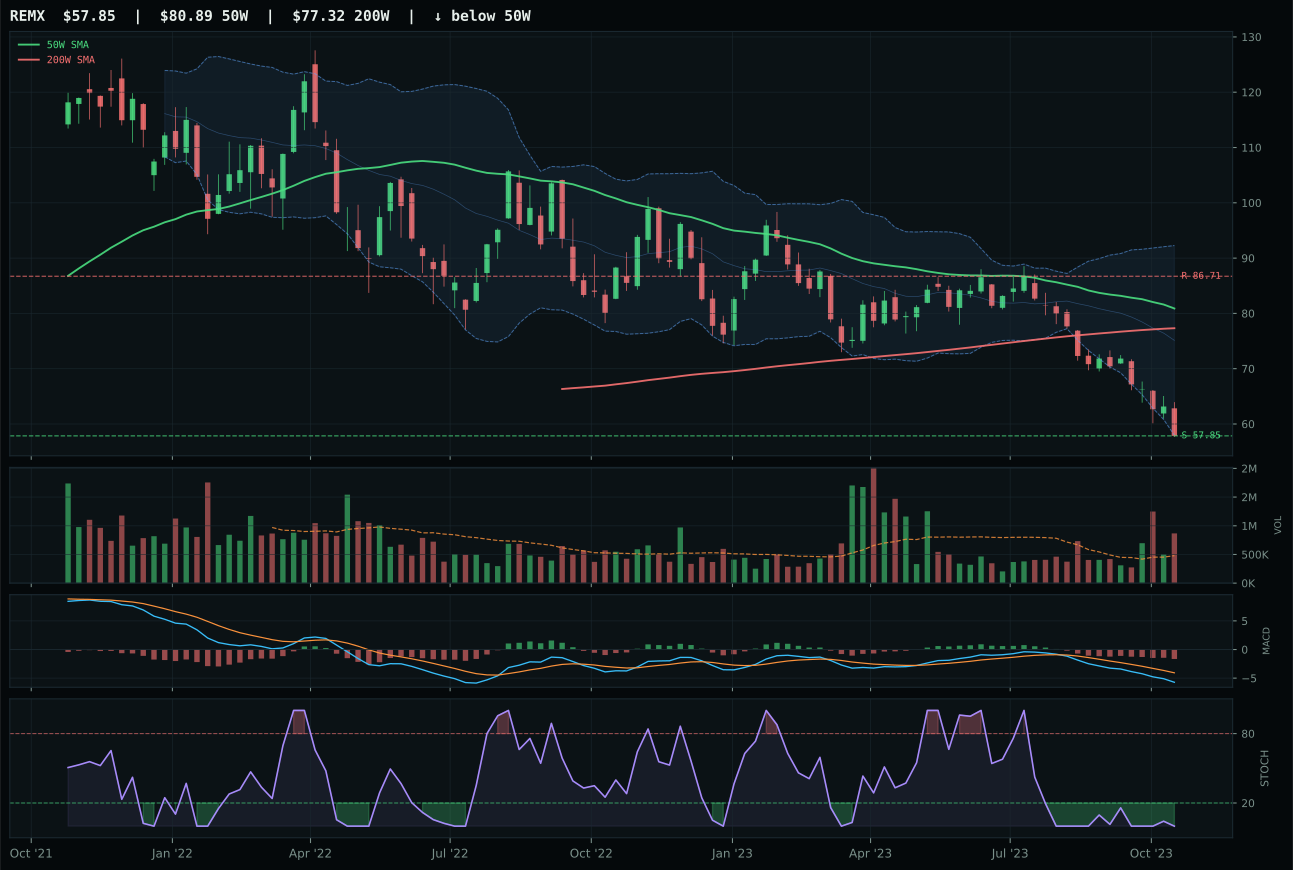
REMX has a pullback into support profile with -23.2% 13-week relative strength versus SPY.
A failed hold above support would weaken the setup.
Actionable but governed by invalidation levels.
COPX wins a severely damaged category on the basis of superior risk/reward (94.6 vs 77.2 for PICK) and timing precision (67.0 vs 60.0). The setup is brutal: COPX is -11.3% below the 50-week moving average in the deep Fibonacci retracement zone (0.618), sitting -14.3% over 13 weeks and -7.4% relative to SPY. Momentum confirmation is zero. Yet structure integrity remains: support at 33.41 is defined, price is still above the 200-week line, and the risk/reward skew is extreme—upside to resistance is capped at -18.5%, but downside to support is just 0.0%, meaning the entire downside has been exhausted. MACD is bearish/weakening but has not collapsed, and the bounce in the last week (4W return -8.3%) shows no panic acceleration. PICK's thin participation and weaker timing score relegated it to second place despite acceptable structure. This is a category where the best risk/reward setup wins, not the best momentum.
Industrial Metals earned 5% allocation as tier-2, supported by strong late-cycle tailwinds: Late-Cycle Reflation helps at +10, commodity breadth positive is active at +10, and real asset sponsorship is active (+6). The category-level macro fit of 54.0/100 is solid, but liquidity stress (-8) and credit stress (-7) are active headwinds. COPX's technical evidence of 27.0/100 is weak—momentum confirmation is zero, persistence is collapsing at 21.7/100, and volume is neutral at 0.83x average. What justifies the 5% allocation is the extreme asymmetry: price is at support with nothing below it, risk is defined, and macro is supportive of real assets. The tier-2 rank reflects this reality—COPX is a position sized for mean reversion, not momentum. To advance to top-2, industrial metals would need volume to pivot from neutral to accumulation, MACD to inflect bullish, and a break above 40.99 on fresh participation. Until then, this is a limited position in a defensive, asymmetric setup.
Technology — XLK
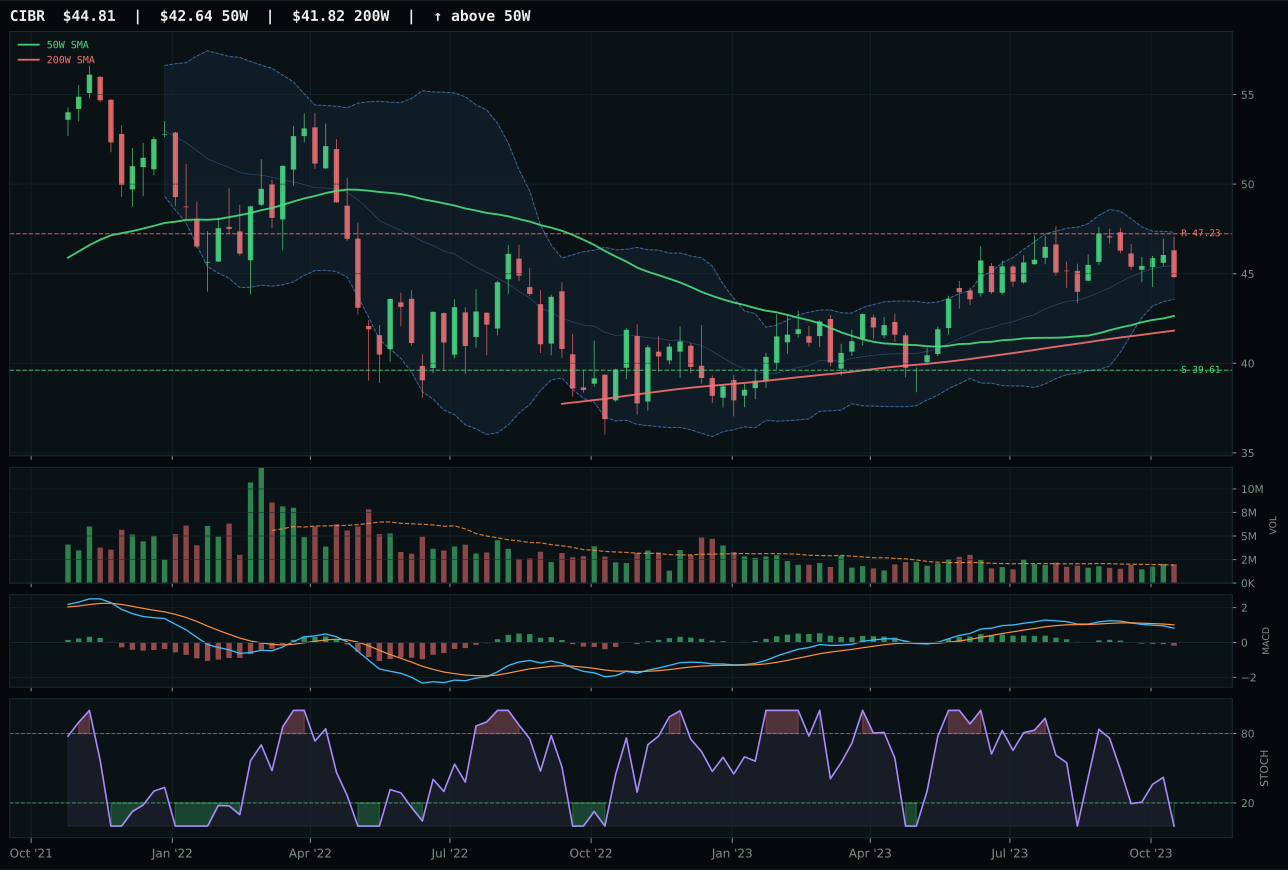
CIBR has a neutral structure profile with 4.7% 13-week relative strength versus SPY.
A failed hold above support would weaken the setup.
Actionable but governed by invalidation levels.
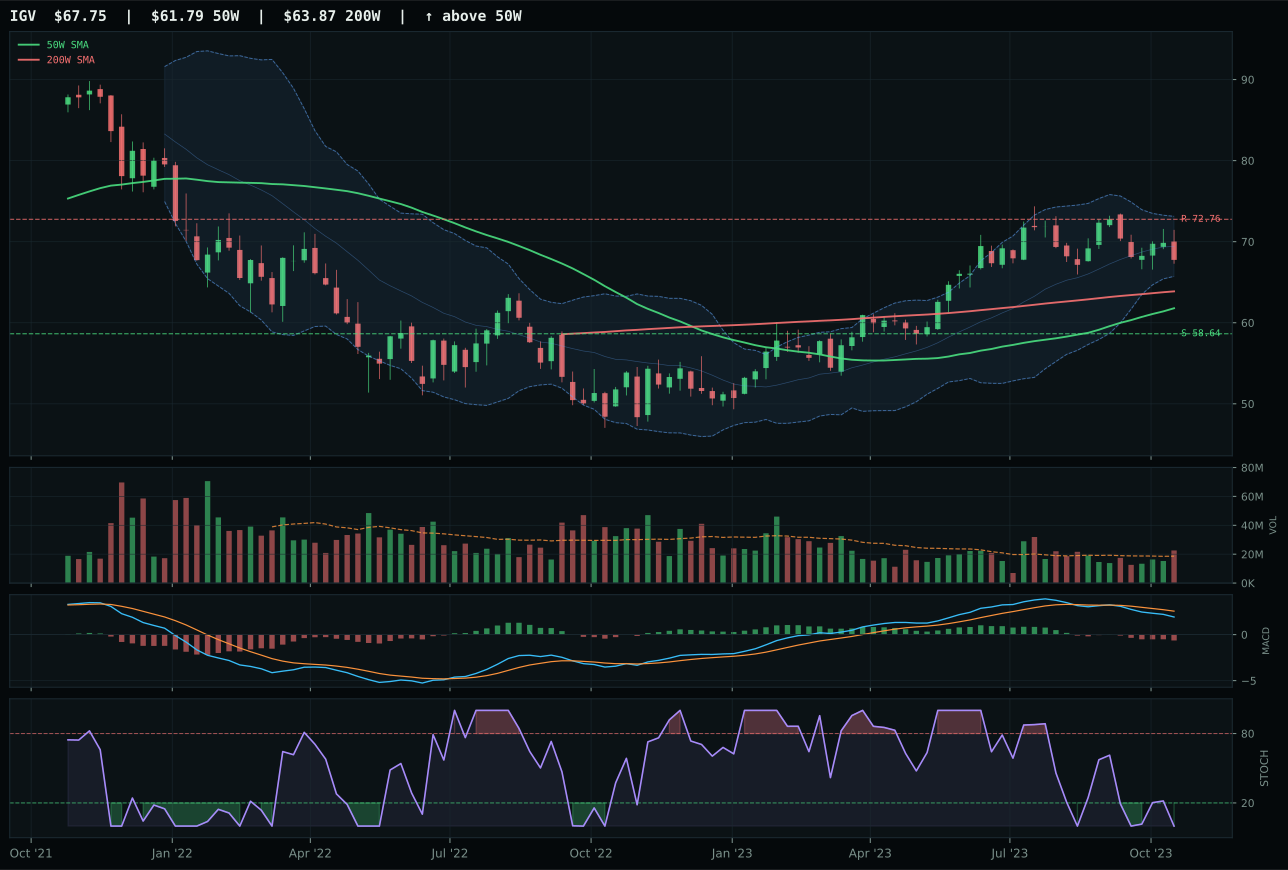
IGV has a neutral structure profile with 1.2% 13-week relative strength versus SPY.
A failed hold above support would weaken the setup.
Actionable but governed by invalidation levels.
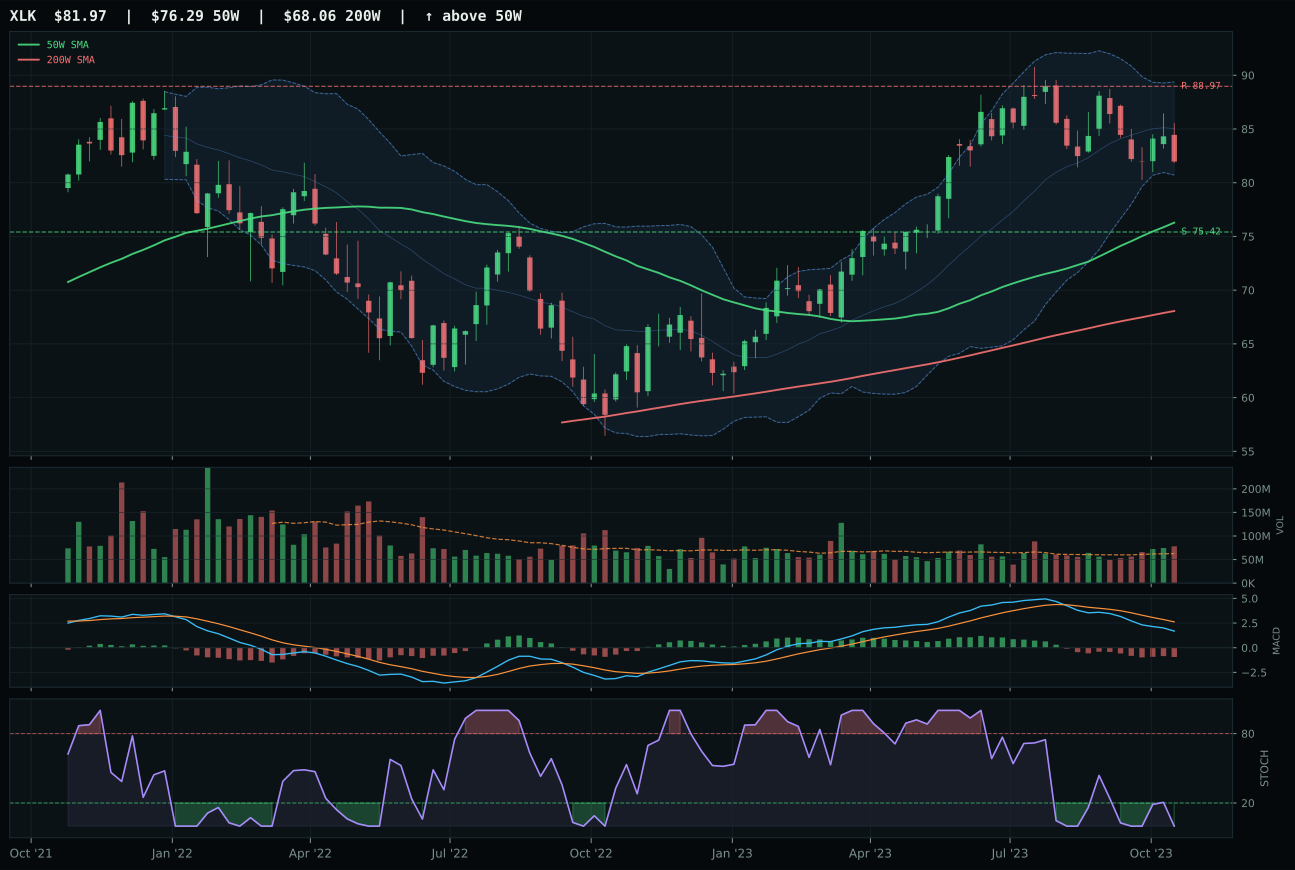
XLK has a neutral structure profile with -0.1% 13-week relative strength versus SPY.
A failed hold above support would weaken the setup.
Actionable but governed by invalidation levels.
XLK wins the category on relative strength within its peer set and volume sponsorship over CIBR, despite trailing both on momentum confirmation. The technical advantage stems from above-average participation at 1.25x average and a neutral setup that sits 7.4% above the 50-week moving average—price is present but not extended, reducing entry friction. CIBR's neutral volume and weaker risk/reward profile (52.0 vs 61.3) placed it at a disadvantage in an environment where breadth and accumulation matter. Both names face identical headwinds: MACD is bearish/weakening and stochastic RSI is oversold across the category, signaling that any near-term strength is a retracement into an overhead-heavy structure rather than a new uptrend. The 13-week return of -6.9% for XLK versus -2.1% for CIBR tells the deeper story—XLK has shed more downside, moving further into the repair zone, which paradoxically increases its appeal when support holds.
Technology earned 5% allocation as a tier-2 position, placing it fourth among all eligible categories. The category's 27.5 final score reflects genuine structural stress: both liquidity stress and credit stress are active, dragging the macro fit down to 28.0/100 despite solid technical evidence in the representative ETF. Late-Cycle Reflation as the macro regime supports this setup only weakly; defensive money would be rotating to utilities or precious metals instead. XLK's above-average volume participation and neutral structure offer a defined risk/reward, but the entry is late relative to the move and momentum confirmation is collapsing at 31.2/100. To earn a top-2 slot, the category would need MACD to inflect bullish and the 50-week slope to steepen, signaling that institutional accumulation is resetting the trend rather than bouncing into resistance. For now, the 5% allocation reflects a modest hedge against tech panic rather than conviction in a new leg higher.
Emerging Markets — INDA
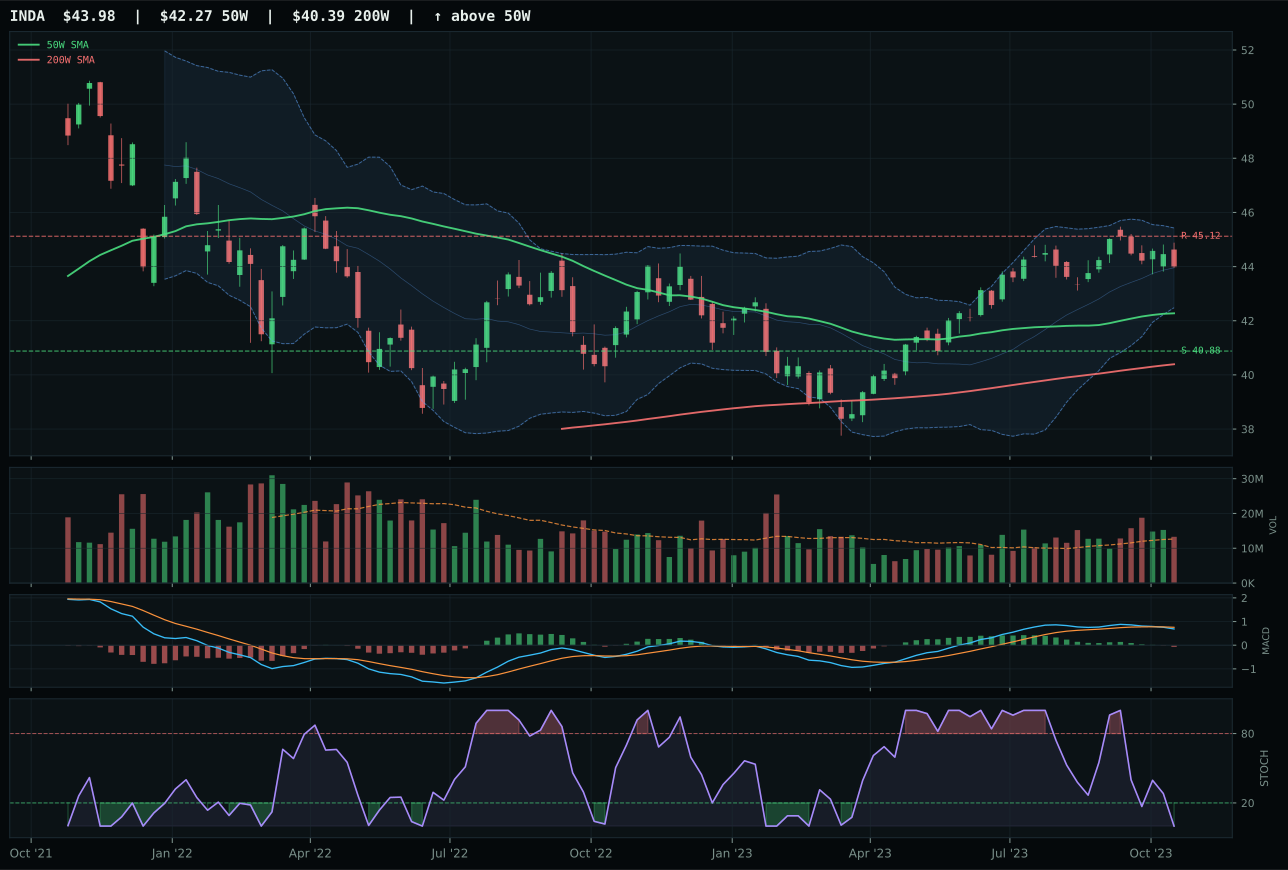
INDA has a neutral structure profile with 6.0% 13-week relative strength versus SPY.
A failed hold above support would weaken the setup.
Actionable but governed by invalidation levels.
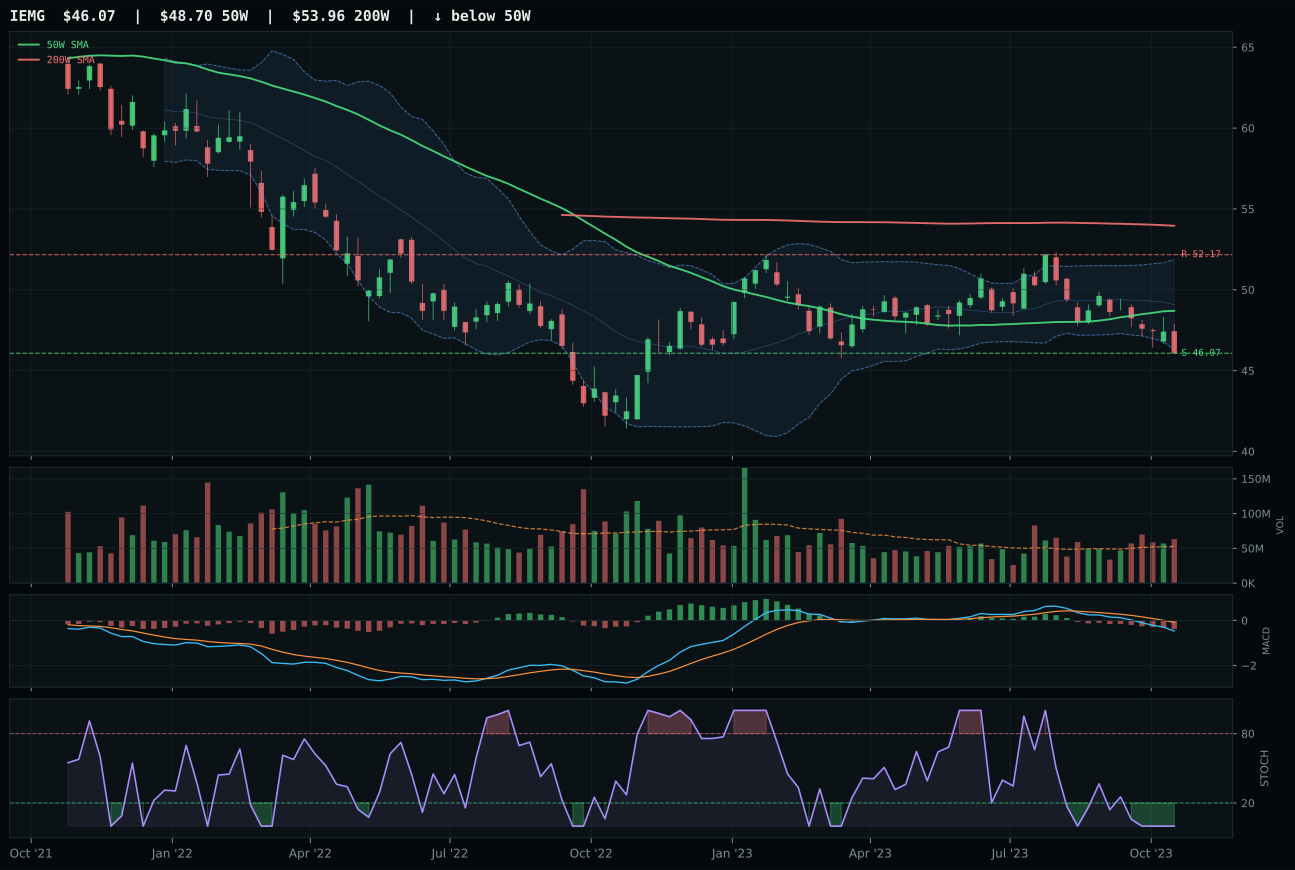
IEMG has a pullback into support profile with -1.5% 13-week relative strength versus SPY.
Extension and support failure are the main tactical risks.
Tracked, but not top-2 eligible because: structurally broken.
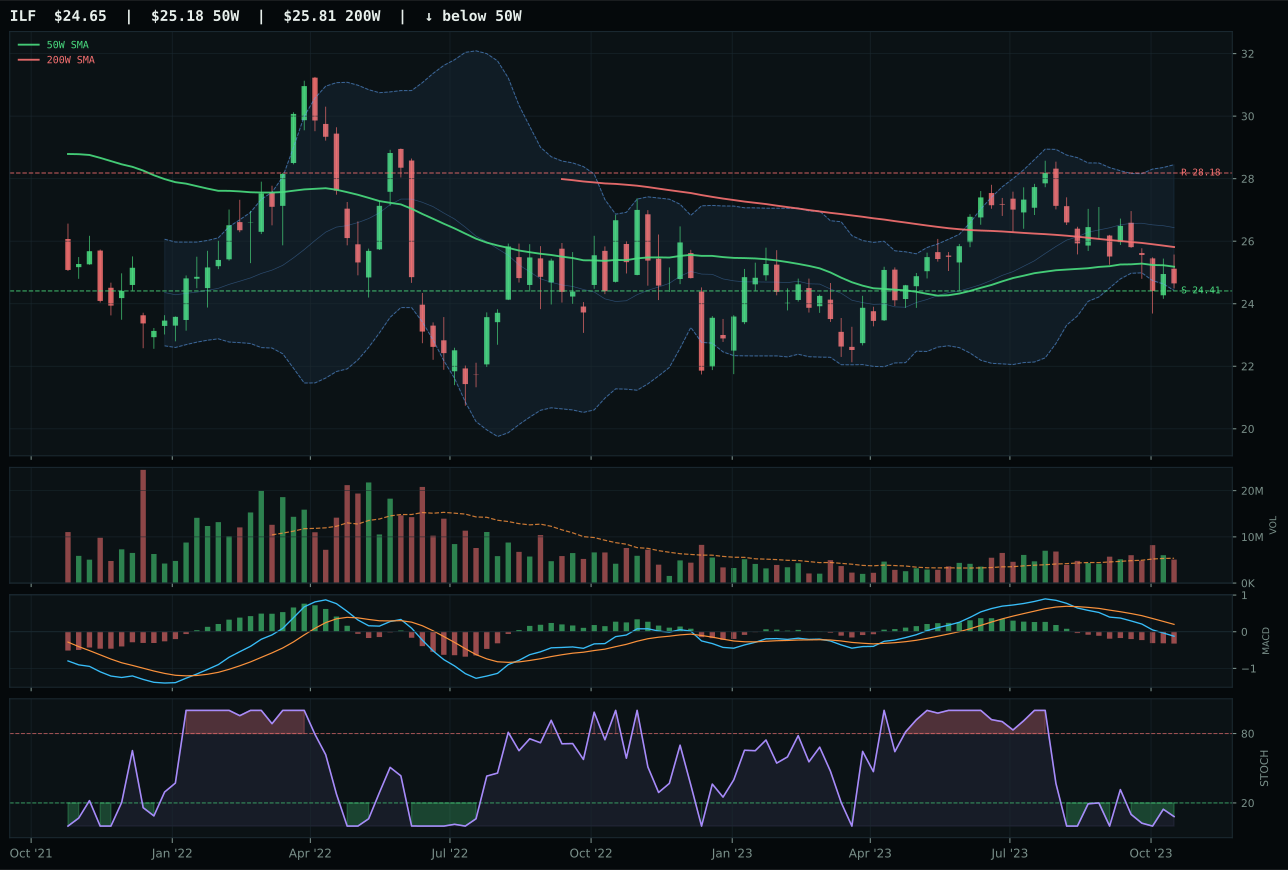
ILF has a pullback into support profile with -4.3% 13-week relative strength versus SPY.
Extension and support failure are the main tactical risks.
Tracked, but not top-2 eligible because: structurally broken.
INDA wins with clean structure (71.6 vs 37.9 for IEMG), superior timing (85.0 vs 80.0), and strong category-relative strength at 7.5% versus IEMG's flat 0.0%. The setup is neutral structure with price 4.0% above the 50-week moving average—tight, clean, and not extended. MACD is bearish/weakening and stochastic RSI is oversold, but the compression of 91.5 is exceptional, indicating price is coiling tightly near the moving average before the next move. India's 6.0% RS versus SPY over 13 weeks shows relative outperformance, a signal that emerging markets money is rotating to quality-growth exposure within the EM space rather than broad emerging indices. IEMG's setup is a pullback into support, but structure is broken at 37.9/100, MACD is bearish/weakening with weak crossovers, and volume is above-average participation into weakness—a red flag for exhaustion. The four-week return of -1.1% for INDA versus -8.4% for IEMG tells the story: India is holding support while broad EM is being liquidated.
Emerging Markets is allocated 5% as tier-2, despite the category-level score of 0.0—a designation that signals a floor allocation due to portfolio structure rather than conviction. The macro fit is 7.0/100, crushed by active headwinds: dollar pressure at -14, credit stress at -10, liquidity stress at -10, and broad market bear at -9. These four forces combine to create a near-total headwind environment for risk assets in EM. INDA's technical evidence of 54.3/100 is respectable but insufficient to overcome the macro regime. The 13-week return of -0.9% and neutral volume at 1.05x average indicate that the position is holding, not advancing. To earn a higher allocation, INDA would need to break above 45.12 and sustain that level while SPY stabilizes and the dollar pressure descriptor reverses. Until liquidity conditions improve or broad market momentum resets, this is a defensive hedge position within a hostile macro environment. The 5% allocation reflects a portfolio rule requiring minimum exposure to growth geographies, not tactical conviction in emerging market valuations or technicals.
Agriculture & Livestock — MOO
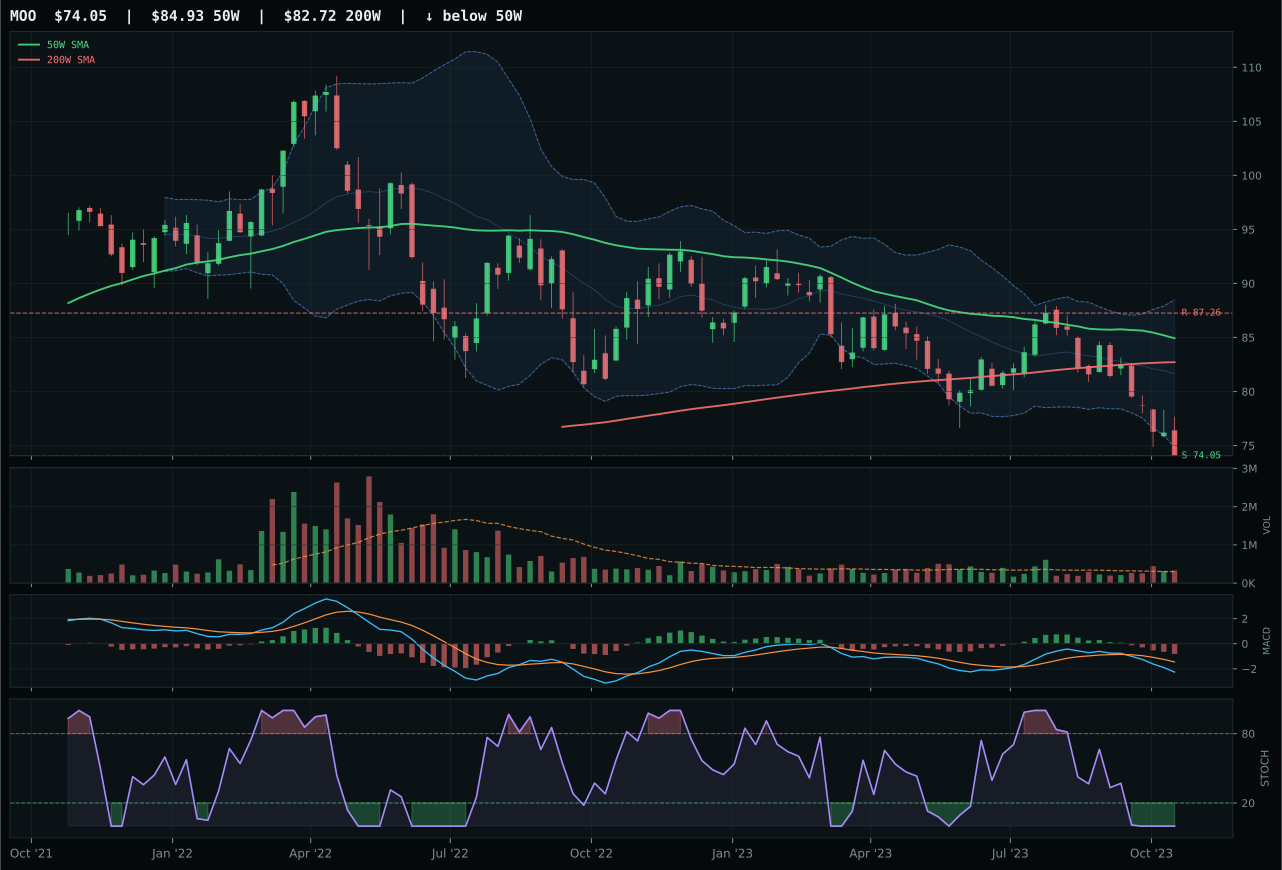
MOO has a pullback into support profile with -7.3% 13-week relative strength versus SPY.
A failed hold above support would weaken the setup.
Actionable but governed by invalidation levels.
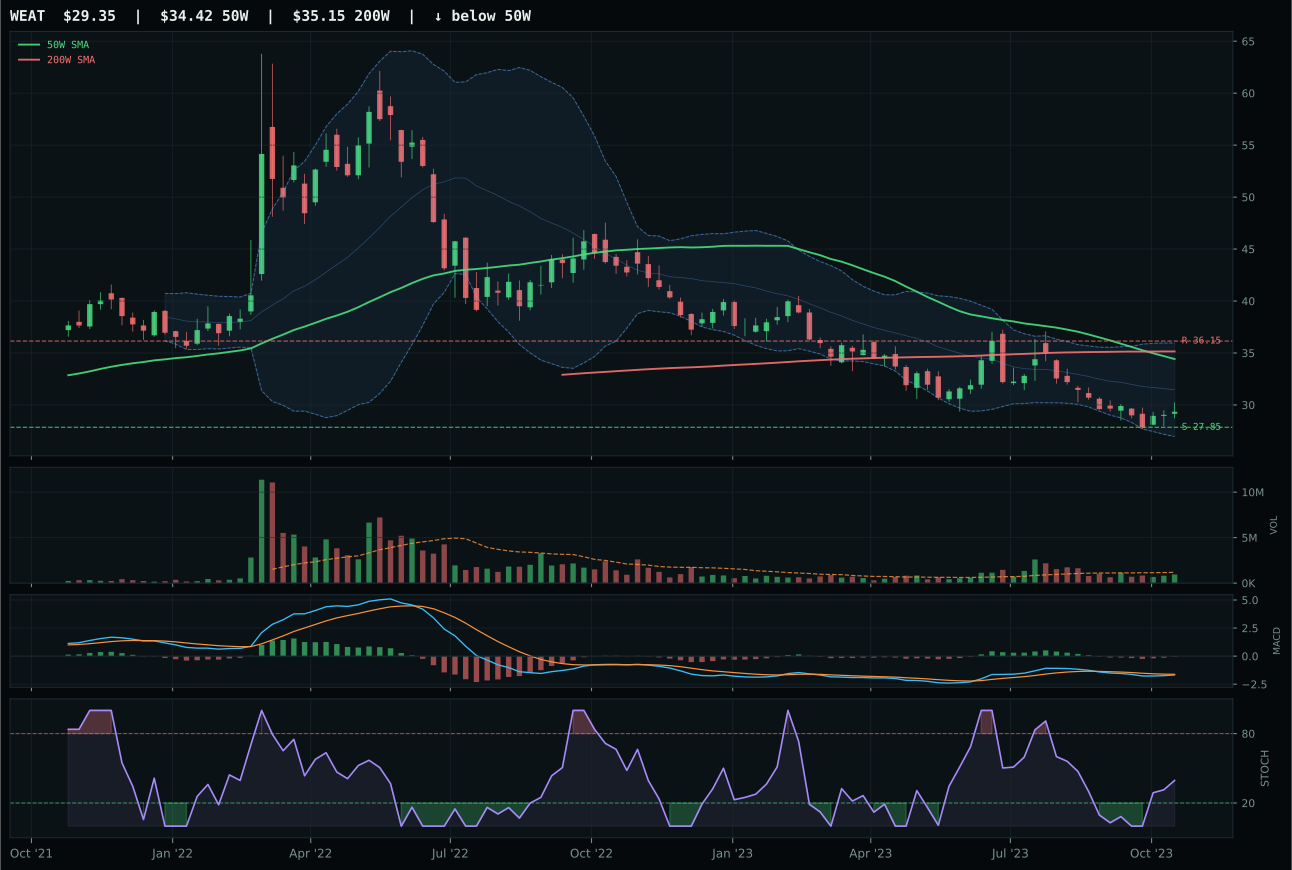
WEAT has a neutral structure profile with -7.8% 13-week relative strength versus SPY.
Extension and support failure are the main tactical risks.
Tracked, but not top-2 eligible because: structurally broken.
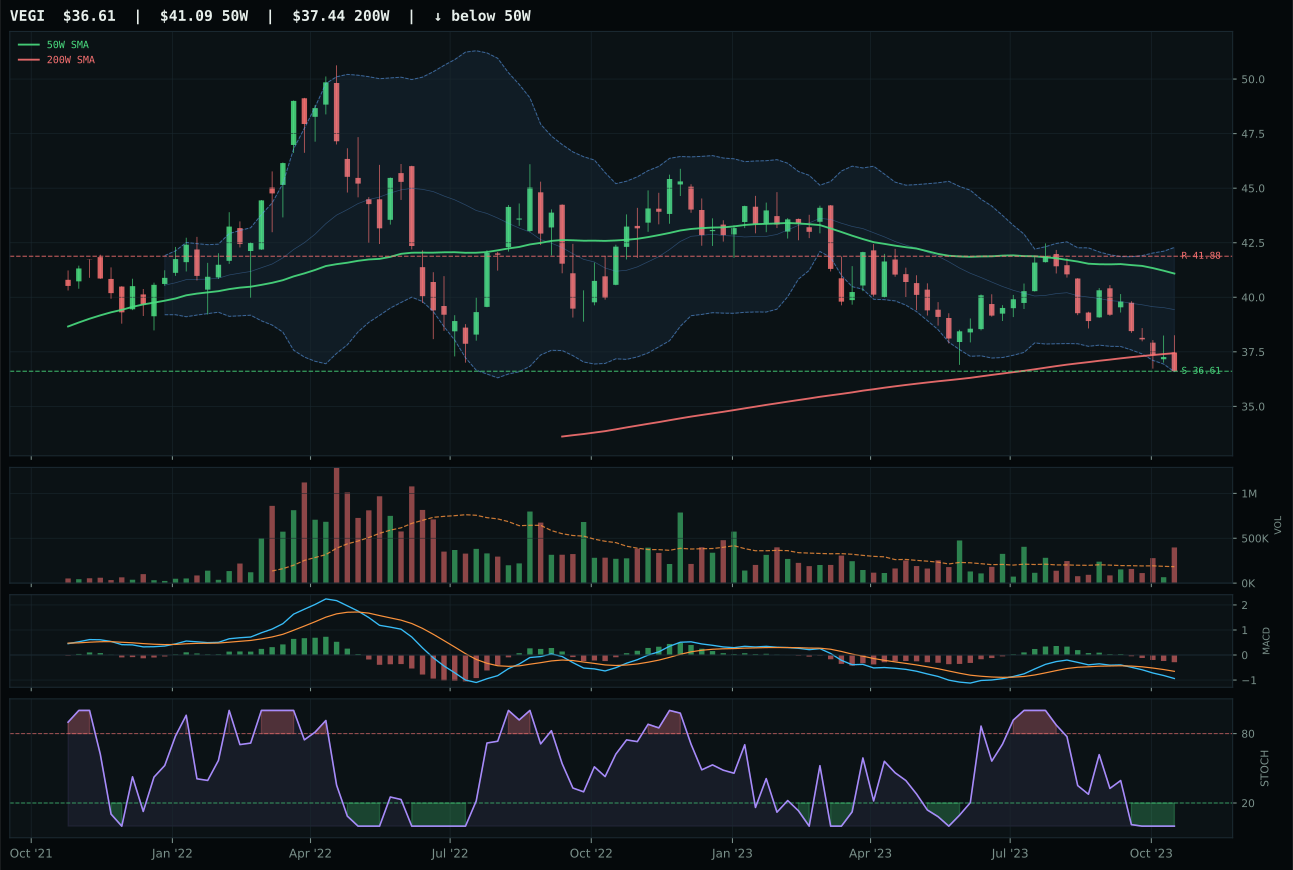
VEGI has a pullback into support profile with -5.1% 13-week relative strength versus SPY.
A failed hold above support would weaken the setup.
Tracked, but not top-2 eligible because: .
MOO wins despite a punishing technical setup, edging WEAT on structure integrity (64.8 vs 36.8) and volume confirmation (above-average participation vs neutral). This is a category built on wreckage: MOO is -12.8% below the 50-week line, price sits near the 52-week low at the 0.786 Fibonacci level, and momentum confirmation is nearly zero at 2.5/100. The 13-week return is -14.1%, and relative strength versus SPY is -7.3%, indicating sustained under-performance. Yet structure holds: support at 74.05 is defined, compression is clean at 82.0, and MACD is at least bearish/weakening rather than diverging. MOO's above-average participation suggests some institutional accumulation into depressed levels, not panic selling. WEAT suffered a structural break that placed it outside contention entirely; IGV's neutral structure cannot compensate for momentum collapse and poor breadth.
Agriculture & Livestock is excluded at 0% allocation, ranked 9th or 10th, despite favorable macro tailwinds that boosted the category-level macro fit to 67.0/100. Late-Cycle Reflation helps this exposure (+8), real asset sponsorship is active (+8), and commodity breadth positive is active (+5). What kills the category is technical deterioration: the 19.6 final score reflects severe trend deterioration with MOO at 26.1/100 trend strength and category-relative momentum at just 2.5/100. The macro support is real, but it cannot offset the damage from a multi-week washout. To earn a 5% allocation, the category would need price to hold support at 74.05, volume to shift from distribution to genuine accumulation, and MACD to inflect bullish. A break above 80.00 on fresh volume would signal the low is in and institutional buying has begun. Until that occurs, macro tailwinds remain theoretical—the technical setup is too broken to justify capital.
AI — SMH
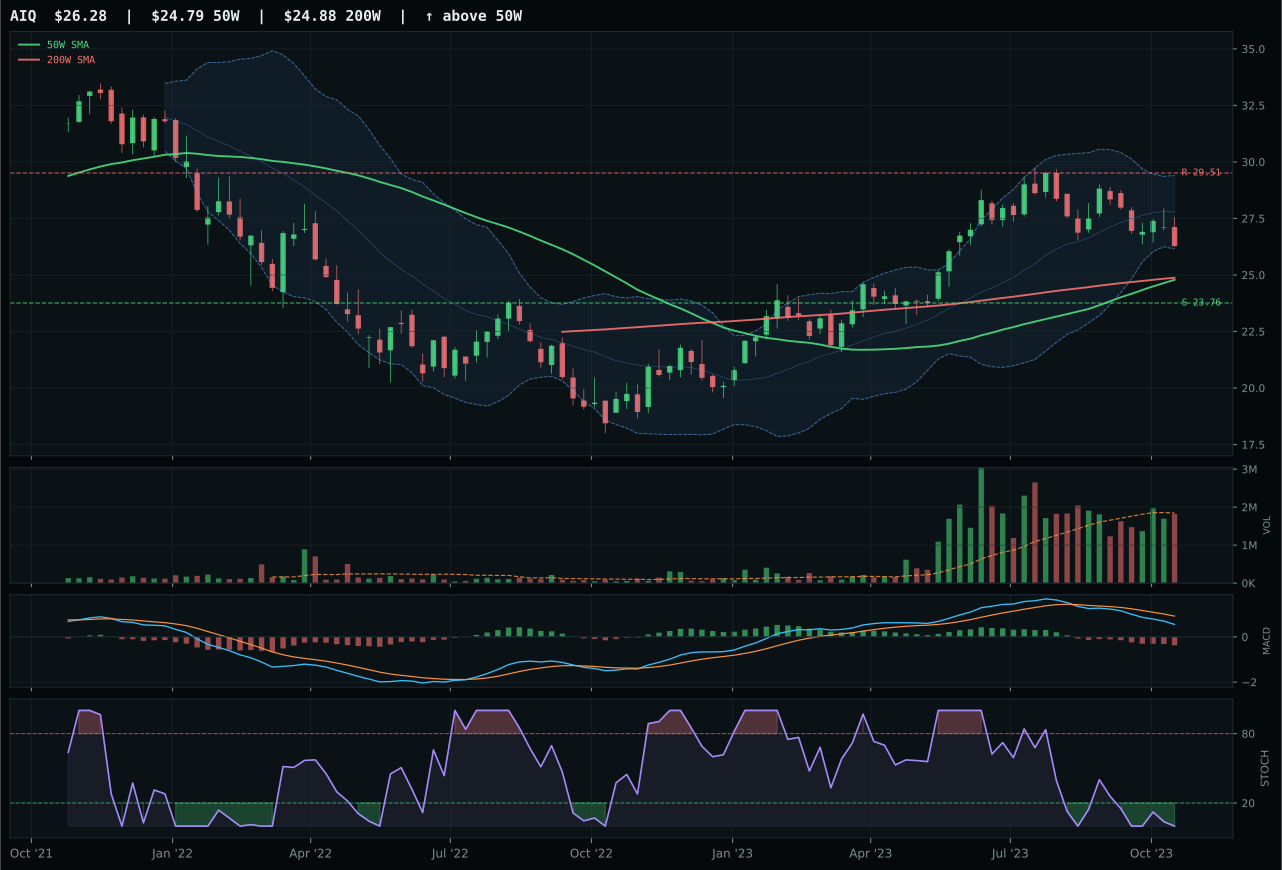
AIQ has a neutral structure profile with -1.3% 13-week relative strength versus SPY.
A failed hold above support would weaken the setup.
Actionable but governed by invalidation levels.
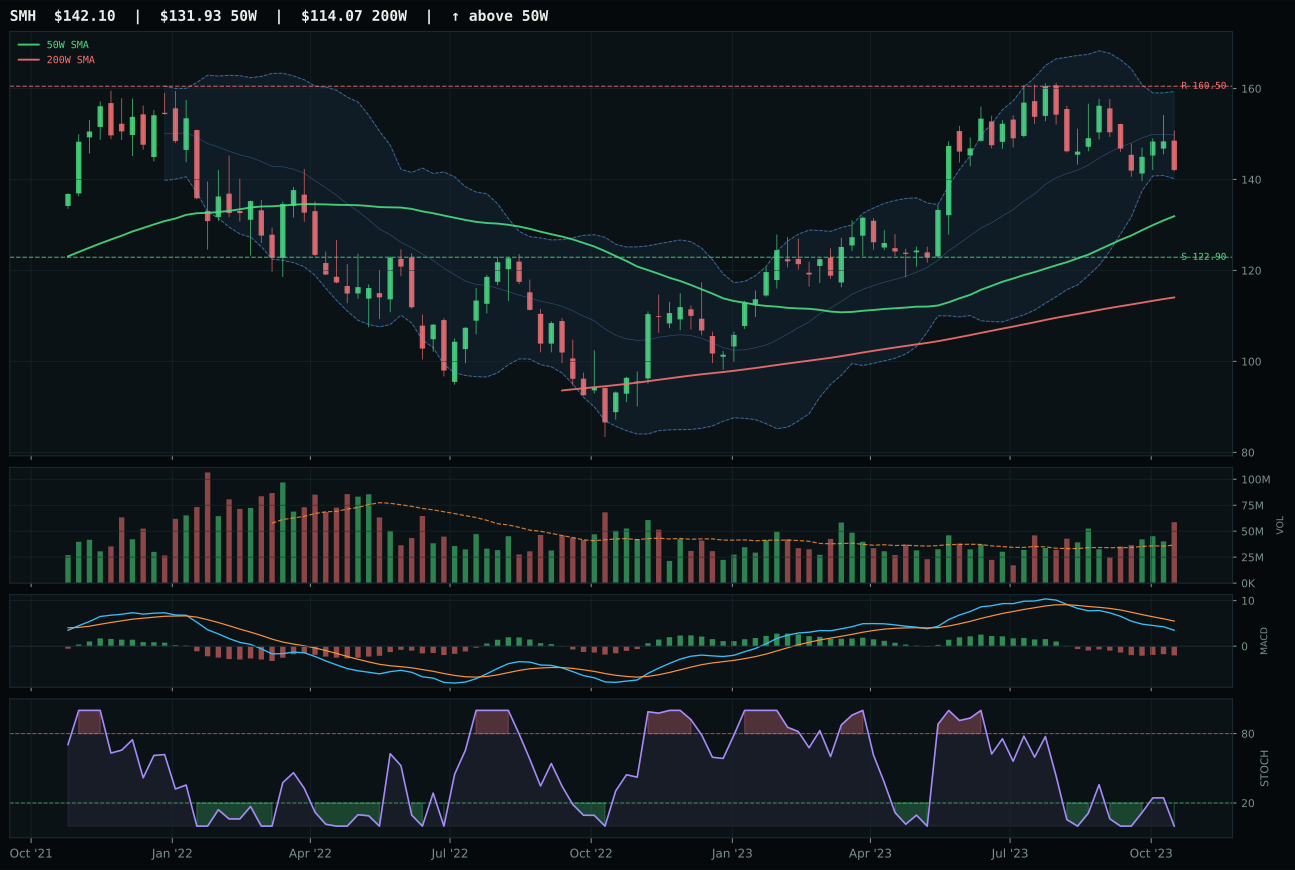
SMH has a neutral structure profile with -0.7% 13-week relative strength versus SPY.
A failed hold above support would weaken the setup.
Actionable but governed by invalidation levels.
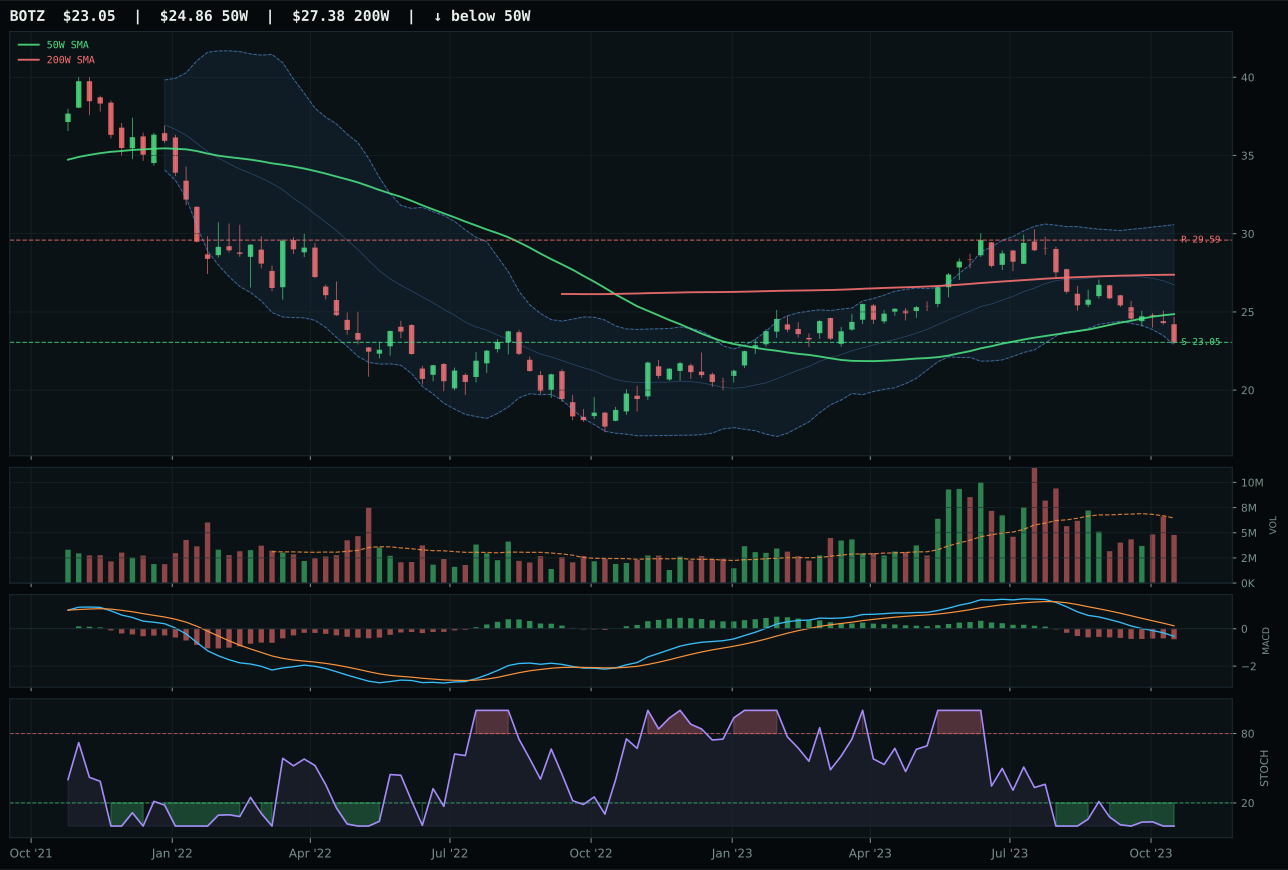
BOTZ has a pullback into support profile with -13.5% 13-week relative strength versus SPY.
Extension and support failure are the main tactical risks.
Tracked, but not top-2 eligible because: structurally broken.
SMH wins by the narrowest technical margin—a 2.4-point gap over AIQ—driven by fractionally superior structure cleanliness (64.4 vs 63.8) and category-relative strength of 0.6% versus AIQ's flat 0.0%. Both are buying at the back of a 13-week decline and fighting distribution pressure: SMH sits at 1.60x average volume, indicating smart money unloading into any uptick. The setup is identical across both—neutral structure with price above both moving averages but MACD bearish/weakening and stochastic RSI oversold. What separates them is thin margin: SMH's slight technical edge in cleanliness provides a fraction more chart confidence, but it is a distinction without durability. Price in both remains 7%+ from the 50-week line with no evidence of fresh accumulation, only rotation out of weakness.
AI is excluded entirely this week at 0% allocation, ranking 9th or 10th, reflecting the category's catastrophic 6.5 final score and 18.0/100 macro fit. Liquidity stress is active at -12 and credit stress at -8, creating a hostile environment for high-beta, speculative compute exposure. The macro regime of Late-Cycle Reflation plus active broad market bear and dollar pressure combine to starve AI of the risk appetite it requires. SMH's technical score of 11.3/100 is damning—momentum confirmation at 16.9/100, volume-price confirmation at 23.6/100, and persistence at 26.9/100 all signal that any upside is noise, not sponsorship. For AI to re-enter the portfolio, the category would need MACD to inflect bullish across the board, stochastic RSI to rise past 0.50, and most critically, volume participation to shift from distribution to accumulation. Until liquidity conditions ease or equity risk appetite resets, this category remains on the sidelines.